Article

Estimation of Ocean Thermal Energy Conversion Resources in the East of Malaysia

1
Razak Faculty of Technology and Informatics & UTM Ocean Thermal Energy Centre, Universiti Teknologi Malaysia, Kuala Lumpur 54100, Malaysia
2
Institute of Ocean Energy, Saga University, Saga, Saga City 840-8502, Japan
3
Department of Earth Sciences and Environment, Faculty of Science and Technology, Universiti Kebangsaan Malaysia, Bangi 43600, Selangor, Malaysia
*
Author to whom correspondence should be addressed.
J. Mar. Sci. Eng. 2021, 9(1), 22; https://doi.org/10.3390/jmse9010022
Submission received: 2 November 2020 / Revised: 14 December 2020 / Accepted: 15 December 2020 / Published: 28 December 2020
(This article belongs to the Section Ocean Engineering)

Abstract

:
The Malaysian Government has set a target of achieving 20% penetration of Renewable Energy (RE) in the energy mix spectrum by 2025. In order to get closer to the target, Ocean Thermal Energy Conversion (OTEC) aligned with solar PV, biogas and biomass energy sources must be evaluated and comprehended. Hybrid OTEC systems consisting of energy and water production are currently under research and validation. Therefore, for the construction of a commercial OTEC plant, 1 MW or 2.5 MW, the choice of a strategic location or potential site is vital. In this paper, oceanographic data such as seawater temperature, depth, salinity and dissolved oxygen obtained from the Japan Oceanographic Data Center (JODC) for Semporna, Tawau, Kudat, Pulau Layang-Layang and Pulau Kalumpang in Sabah, Malaysia, are reported. The RE available from the Exclusive Economic Zone (EEZ) on the coast of Sabah was estimated based on the JODC data obtained. There were no remarkable differences in temperatures between the five sites, which were reported as approximately 27 °C at the surface and 7 °C at depths below 600 m. The surface salinities below 100 m at those sites were slightly lower than the deeper waters, where the salinity increased up to approximately 34.5 PSU. Dissolved oxygen data from the Pulau Kalumpang site showed a slight increment to approximately 4.7 mL/L at depth intervals below 50 m, before declining steadily to approximately 1.7 mL/L along with the depth. The temperature-salinity profiles of the Malaysian sites were congruent with those of Palau, Kumejima and Okinawa, but not with that of Fiji, where the salinity profile showed a distinct variation at the relative depth (below 200 m). Estimates of RE using two different methods were used to prove the potential of OTEC in Malaysia.

1. Introduction

Malaysia is situated in Southeast Asia and mainly consists of Peninsular Malaysia, Sabah and Sarawak. The largest ocean around Malaysia is the South China Sea. Malaysia’s climate is equatorial in nature, being hot and humid throughout the year. The average rainfall is 250 cm a year [1], and it rains heavily, particularly in November and December. The total land area of Malaysia is 329,847 km2 [2], while the total population is about 35 million. The majority of land is used for palm oil and rubber plantations [3]. The total area of Malaysia’s Exclusive Economic Zone (EEZ) is 334,671 km2 [4], as shown in Figure 1.
In 2019, the total electricity production in Malaysia was reported to be 161 × 109 kWh, 43% of which was generated by coal, 39% by Liquid Natural Gas (LNG), 17% from hydropower and the rest, 0.6%, from Renewable Energy (RE) sources such as biomass, solar PV and wind [5]. This total electrical energy is large enough to cover the current demands of industrialization for Malaysia. As the majority of electricity comes from fossil fuels, Malaysians are concerned about the ramifications of this source of energy, especially its carbon footprint, which contributes to global warming. The key terms of the problem are clearly “sustainable energy” and “climate change”, which are definitely similarly applicable and of interest to all countries in the world. Under these circumstances, Malaysia and other ASEAN countries are seriously studying the possible implementation of a RE mixture, or rather hybrid RE, to combat these issues. Nevertheless, Malaysia has a huge capacity for Ocean Thermal Energy Conversion (OTEC), one which is profound and comparable with those of other tropical and subtropical countries such as Fiji [6], the Philippines [7] and Nauru Island [8]. Many researchers have discussed the huge OTEC resources globally [9] and in other local areas such as the Atlantic Ocean [10], Western Indian Ocean [11], Aguni Basin in Japan [12] and Florida in the USA [13]. This paper investigates the potential of OTEC in Malaysia, especially at the present time when environmental sustainability is vital for mankind [14].
An OTEC plant is able to provide stable energy, and the deep effluent seawater also has significant utility as a resource for a variety of industries [15]; deep seawater has huge potential for fertilizing the ocean [16], while seawater air conditioning can be used to reduce energy consumption [17] and to recover rare metals such as lithium [18]. OTEC technology can directly tackle the UN’s Sustainable Development Goals (SDGs), e.g., goal 6, Clean Water and Sanitation; goal 7, Affordable and Clean Energy; and goal 17, Partnerships for the Goals. Avery and Wu [19] summarized the history of research on OTEC and the types of OTEC heat engine used to convert ocean thermal resources into electricity. An OTEC potential energy calculation method has been proposed using the specific seawater based on the reversible heat engine [20]. Recently, multitemperature level heat engines were developed using a nonazeotropic mixture as the working fluid and staging cycles [21]. However, when using surface seawater, biofouling in the heat exchanger is unavoidable. Therefore, a hybrid OTEC, which indirectly uses surface seawater in the heat exchanger after changing it into a vapor, has been proposed to produce electricity and fresh water through distillation [22].
The investment cost of an on-land hybrid OTEC plant, which is the proposed type for multipurpose use, would be significantly affected by the climate, submarine topography and social infrastructure at the projected site [22]. Therefore, it is necessary to carry out a feasibility study by conducting a thorough desktop study of the available data from the Japan Oceanographic Data Center (JODC) [23] before embarking on an actual oceanographic survey. There are many institutions around the world [8] that have been working on the conceptual design of OTEC plants with high performance and suitability for proposed sites. In this paper, the specific features of the Malaysian sea were analyzed based on the data provided by JODC in order to study the potential of chosen study sites for OTEC plant construction and to estimate the resources required to establish OTEC systems in East Malaysia, including detailed calculations of renewable energy [24] obtained for an OTEC plant in the Malaysian sea area.

2. Methodology

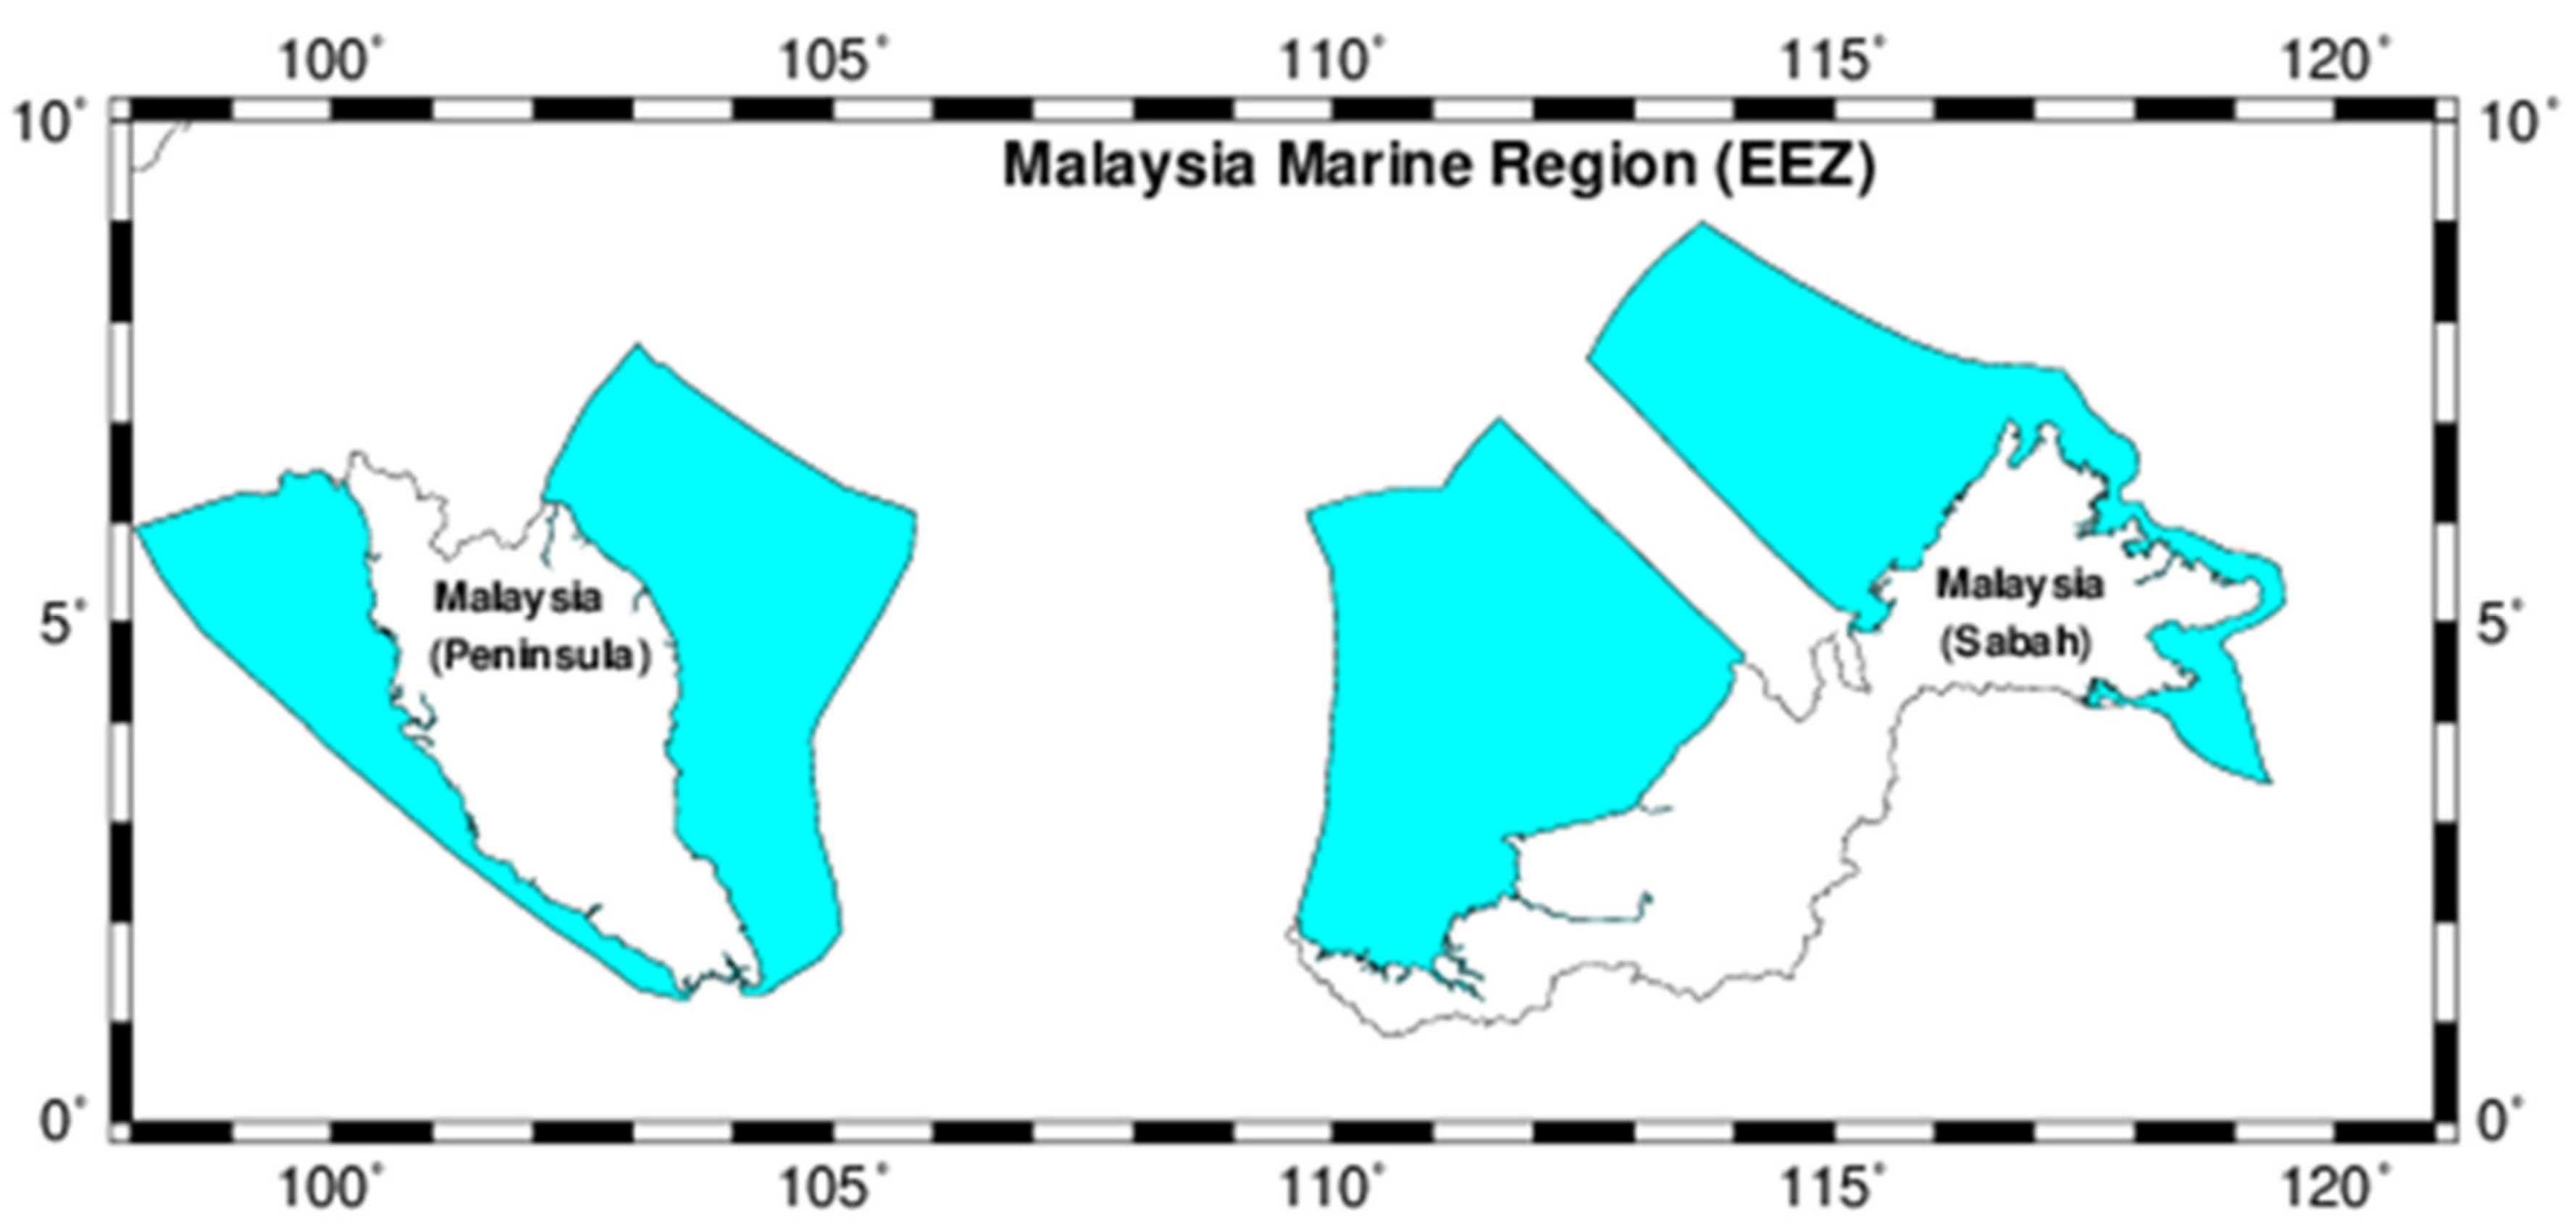
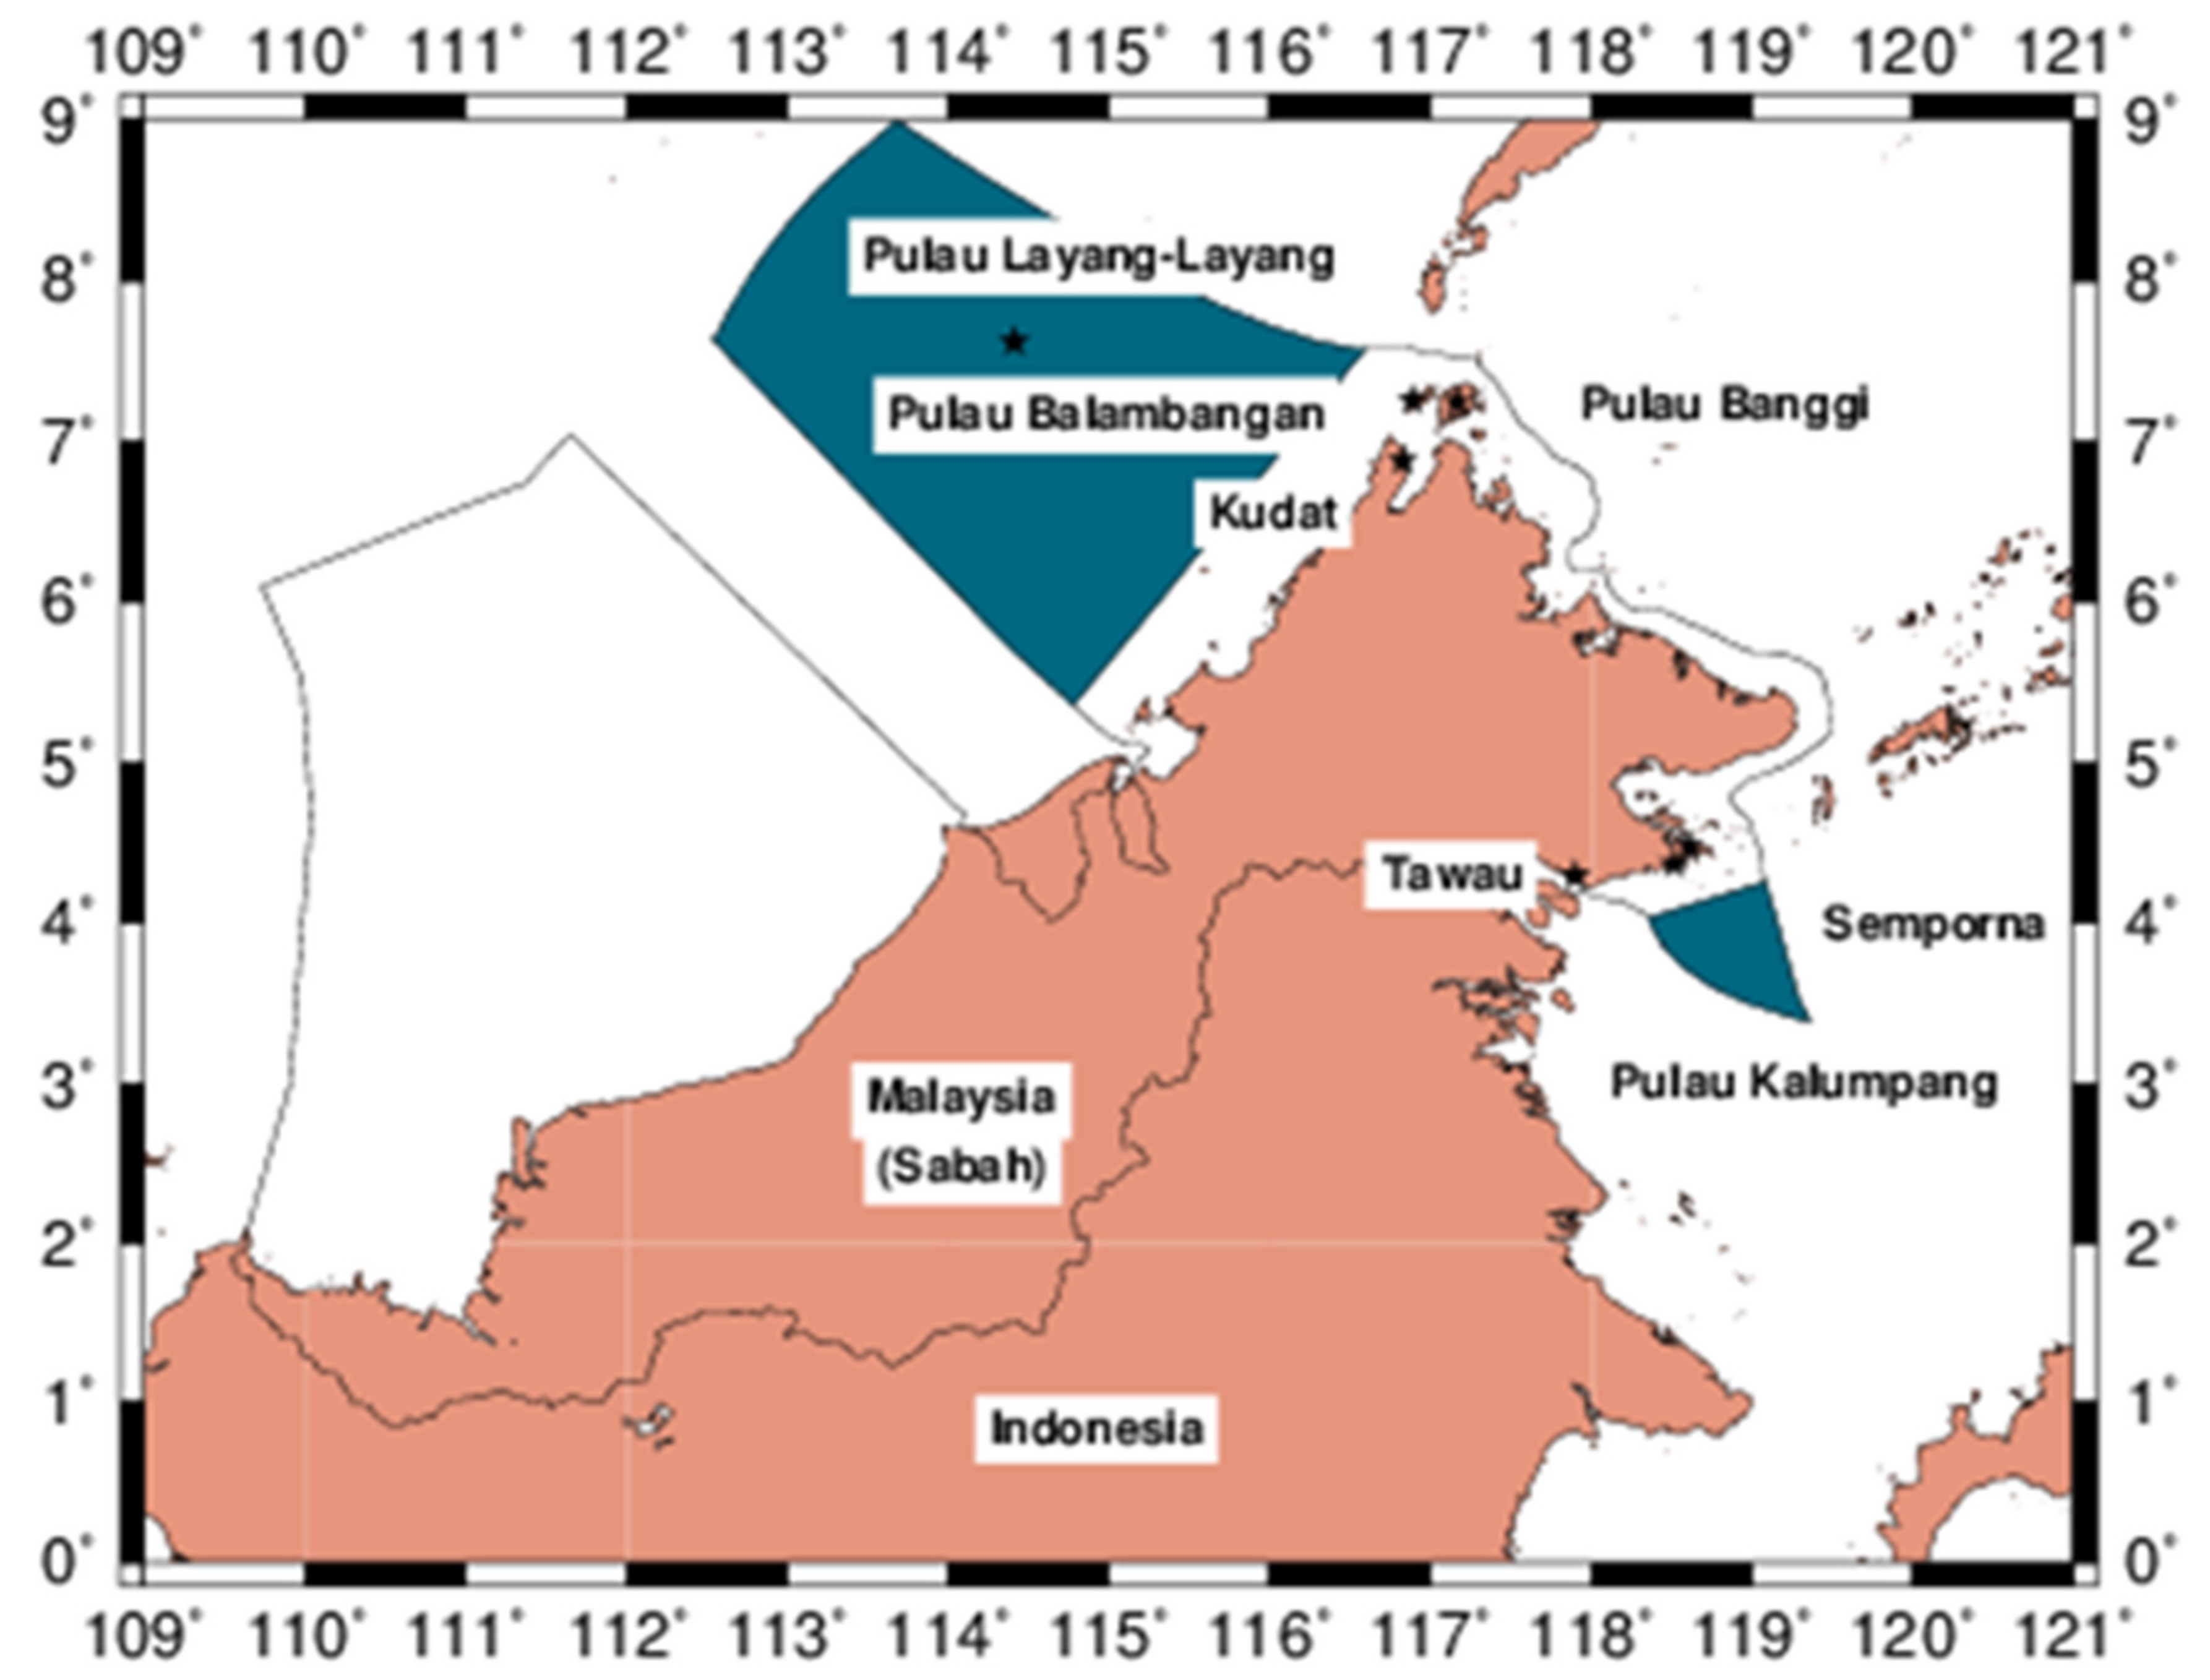
2.1. Sites of Investigation

The northwest and southeast of Sabah, Malaysia, were determined to be suitable areas for installation of an on-land or off-shore OTEC plant and therefore a research study was conducted in these areas, as shown in Figure 2; namely Tawau, Sipadan, Pulau Kalumpang, Pulau Layang-layang and Pulau Banggi. The total potential area for OTEC was approximately 92,301 km2 (Figure 2). The survey of oceanic conditions included surveying for the necessary deep ocean water of 5–7 °C required for OTEC plants at the given places. JODC data confirmed that the depths of the dark blue highlighted areas were more than 1000 m.

2.2. Method of Investigation

In this study, reference data from Fiji, Palau, Okinawa and Kumejima were used. Some of the measuring research data was obtained from the training vessel “Koyo Maru” owned by the National Fisheries University, Yamaguchi, Japan, who provided full cooperation in supplying all required data and maps for Sabah, Malaysia. Other data were obtained from JODC.
Salinity, water temperature, seawater depth and dissolved oxygen (DO) were measured using a reliable conductivity, temperature and depth (CTD) sensor (Neil Brown Instrument system, Inc. from USA, Mark IIIB CTD Profiler CTD-O2) with the following specifications; as shown in (Table 1).
The conductivity meter had an electrode cell sensor, the temperature sensor was a thermistor type (200 Ω at 20.0 °C) and the pressure sensor was a strain gauge type (350 Ω). Salinity was obtained by comparing the electric conductivity of a KCl standard solution at 15 °C at 1 atm against the conductivity ratio after having adjusted water pressure and temperature. Water temperature rises when pressure is applied to it; therefore, potential water temperature was used. Depth was calculated from the equations of water pressure and depth. In order to establish the amount of dissolved oxygen, the oxygen saturation rate was calculated by adjusting water pressure and water temperature through the use of an electric current provided by an oxygen sensor, and then the oxygen saturation rate was multiplied by the oxygen volume in the seawater. The coefficient needed for the calculation of oxygen saturation rate was decided in comparison to the titration oxygen value of the Winkler method.

3. Results and Discussion

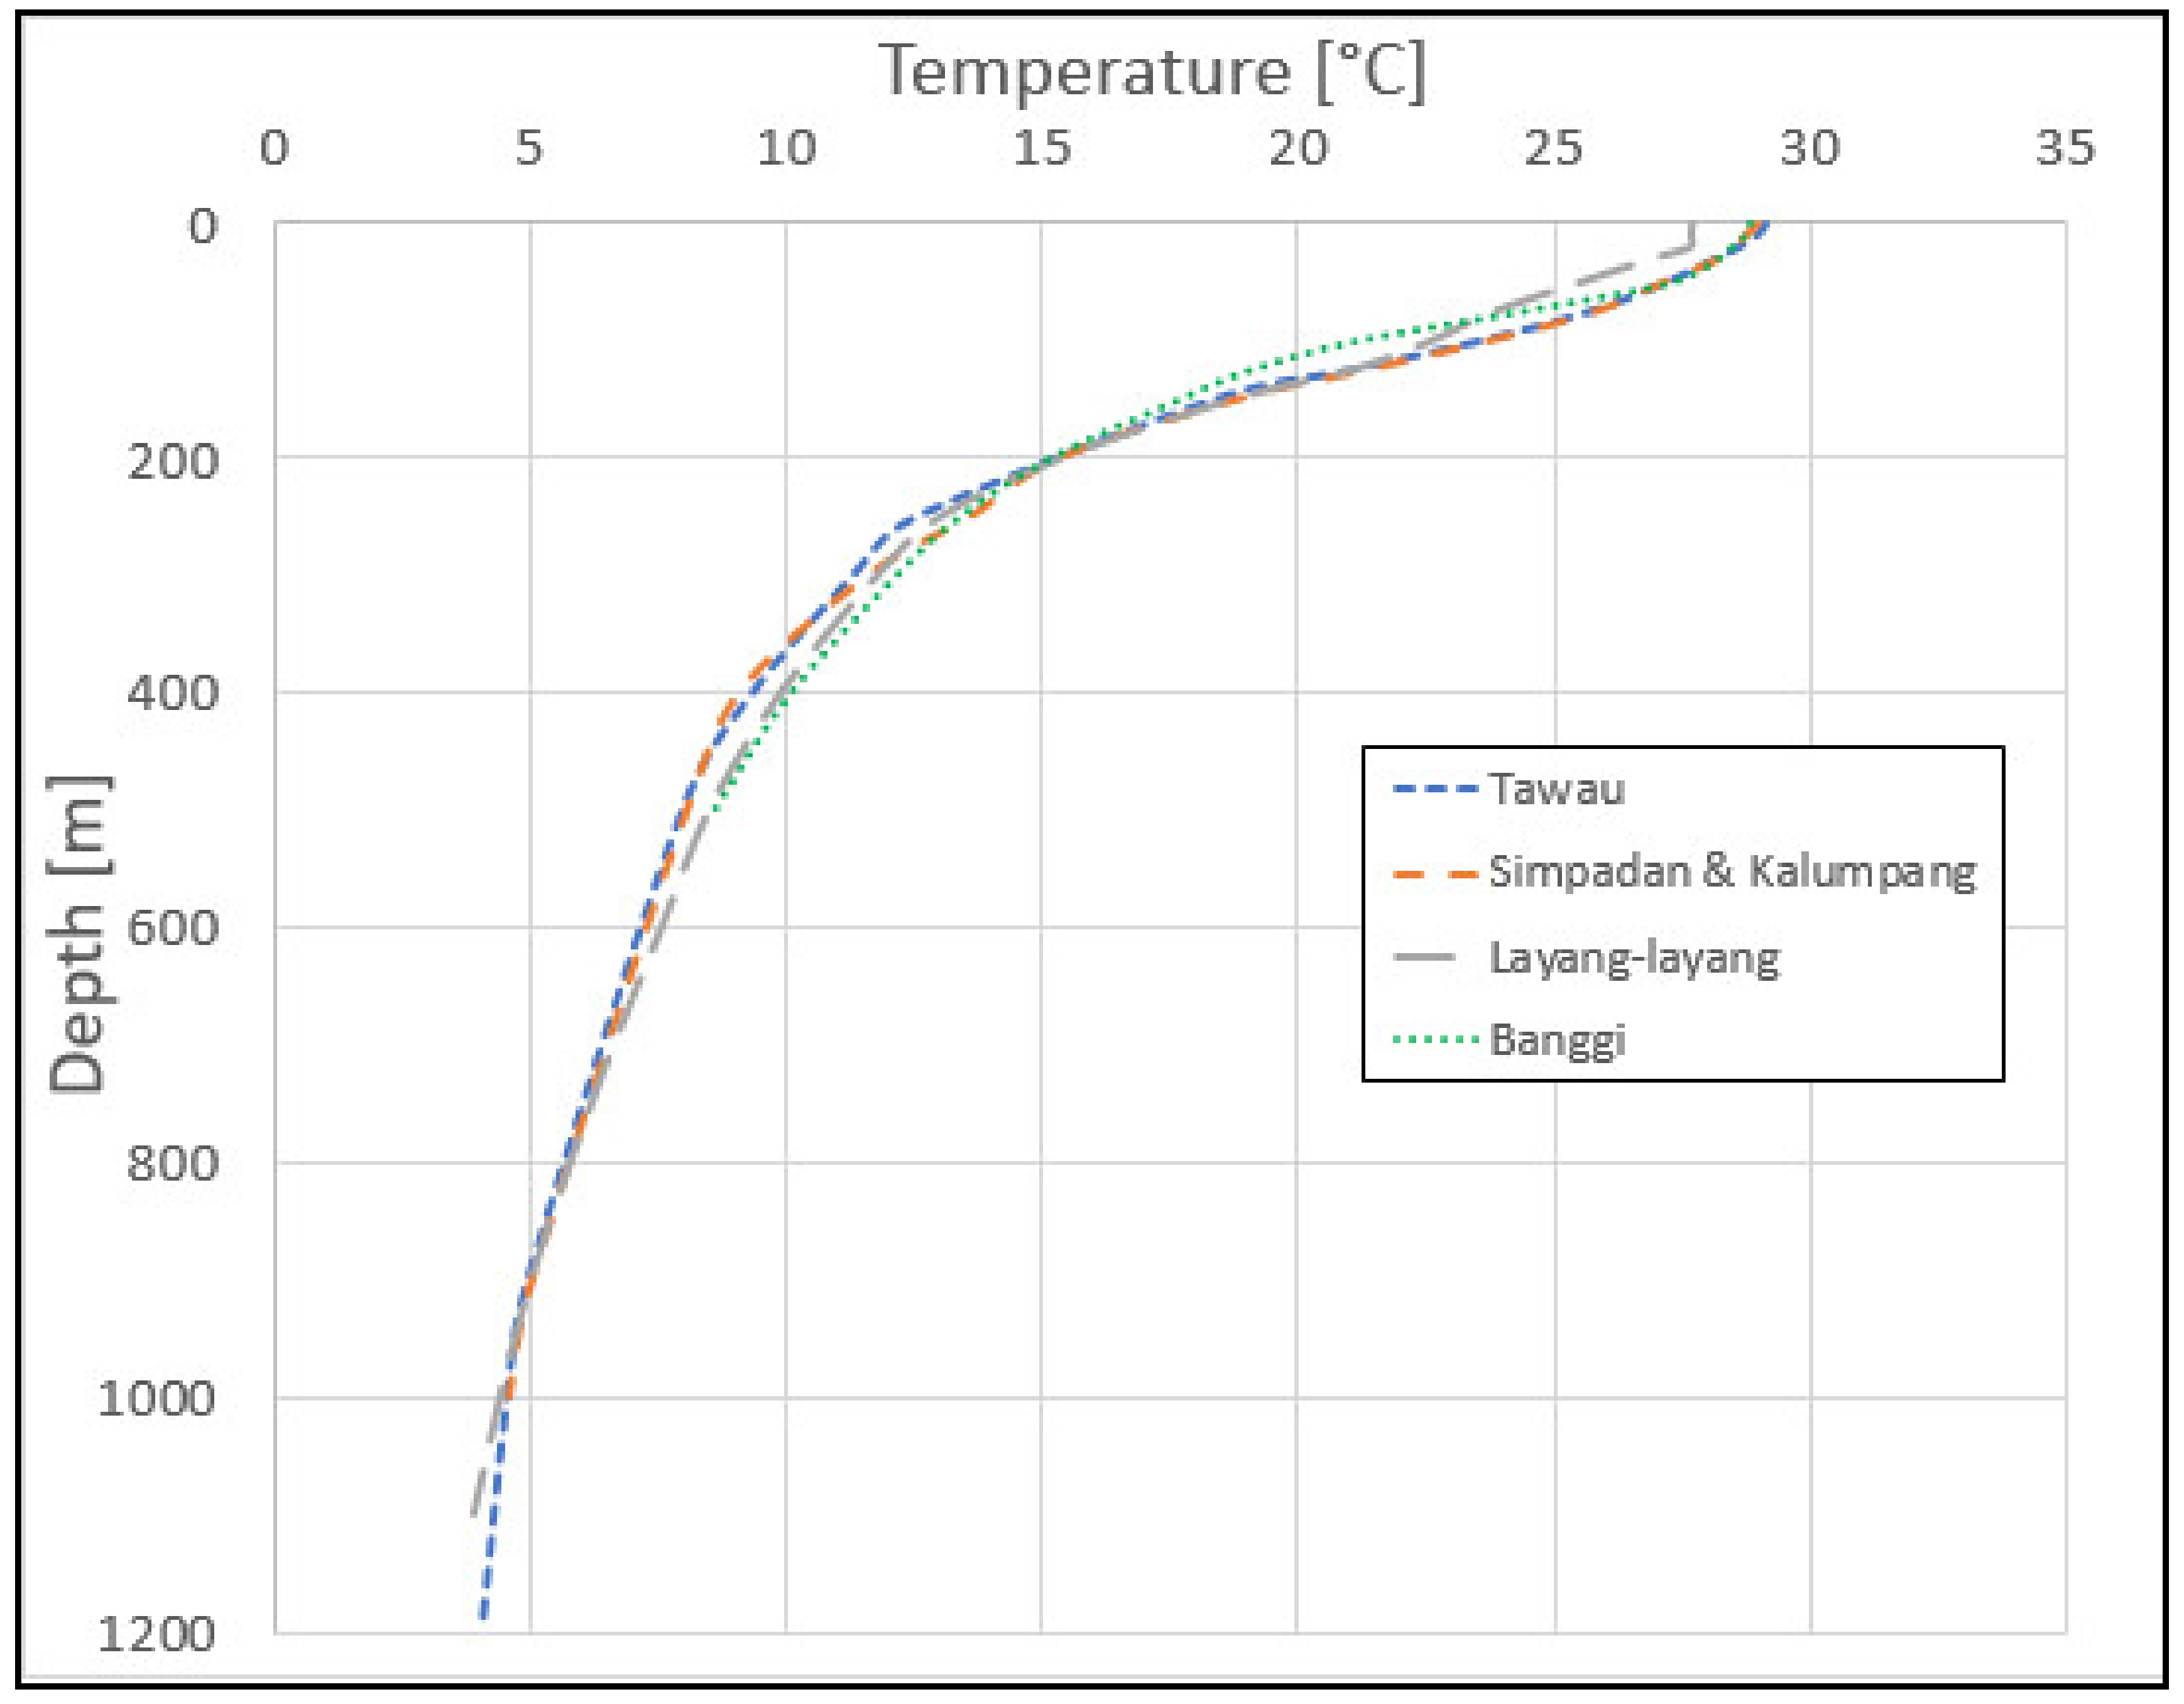
3.1. Temperature Profile

As shown in Figure 3, which features the vertical temperature profile, according to JODC data, the temperature did not vary much from one site to the next. However, a closer comparison of the sites confirms that there was a slight temperature change ranging between 0.1 °C and 1 °C at each measured depth, and this tendency increased in the shallower area compared to that at 700 m depth. The temperature dropped quite sharply from 27.5–28.5 °C at the surface down to 7.0–7.3 °C at 600 m depth and we observed no distinctive layer where surface water was mixed with water from 600 m depth, while a remarkable change of temperature from the surface was noticeable. Deeper than 600 m, seawater temperature showed a gradual drop down to 4.6–4.8 °C between the points of 1050 m and 1150 m depth. Thus, the temperature difference greater than 20 °C required to operate a viable hybrid OTEC in Sabah, Malaysia, was confirmed.
Seawater temperature plays a particularly important role in the design of OTEC plants. Especially for a hybrid OTEC plant, a temperature difference greater than 15–20 °C between surface seawater and deep seawater must be assured for economic viability. Therefore, the cold seawater pipes used to take in 7 °C cold seawater must be long enough to reach a depth of at least 600 m. In cases where the OTEC plant requires 5 °C cold seawater, the cold seawater pipe needs to be long enough to go down to 900 m depth (as shown in Figure 3).

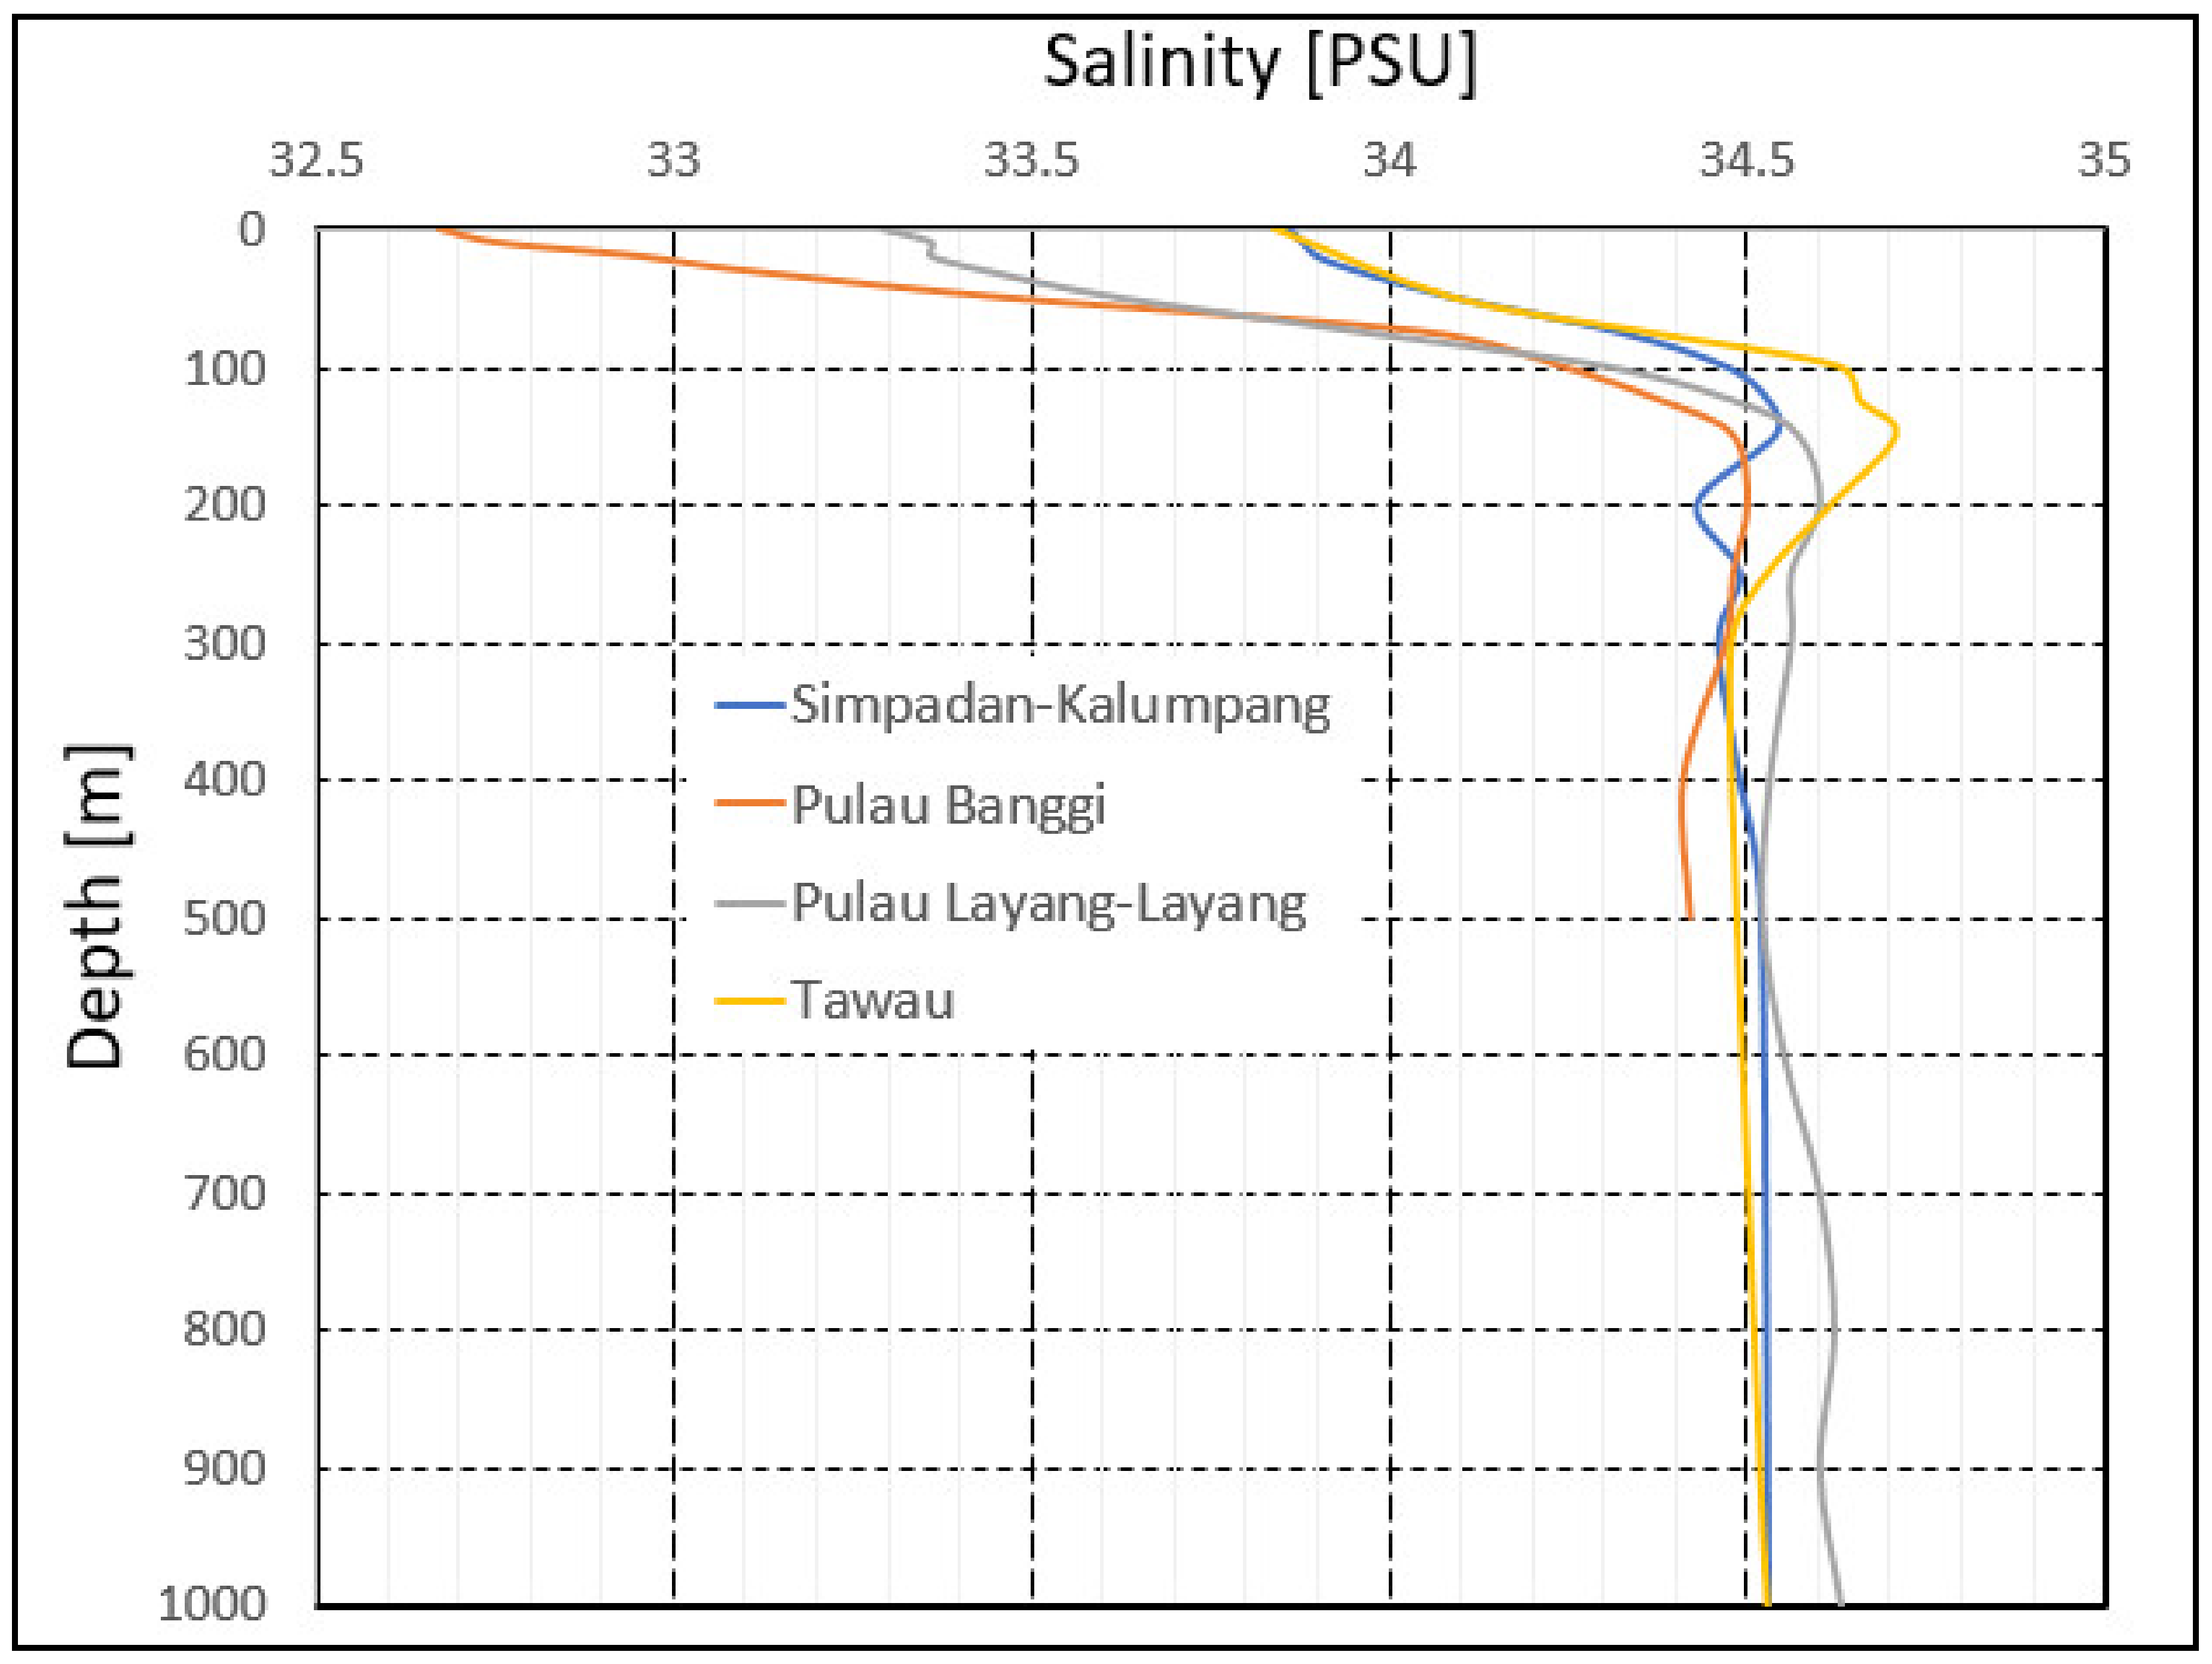
3.2. Salinity Profile

In areas with water depth less than 400 m, where the seawater temperature drops sharply, the salinity also changes quite substantially as compared to that in areas with water depth greater than 600 m, as shown in Figure 4. Furthermore, the salinity of surface (between 0–100 m) seawater was found to be relatively low, between 33.0–34.3 PSU, showing fairly large variation between the sites. This could be mainly because of the drastic current flow, especially near the surface seawater. It increased as the depth increases up to 34.5–34.7 PSU at 100–200 m depth. It then decreased with increasing depth, and at 400 m depth, it was approximately 34.4–34.6 PSU. Salinity in water deeper than 600 m showed a slight increase as the depth increased.
Salinity is a key parameter to estimate transport properties, which directly affect heat transfer, another most critical issue for designing a hybrid OTEC plant. Nevertheless, the variation of salinity in the surface layer also shows the possibility of the contamination of rainwater in those sites. The contamination is able to cause biofouling, which may deteriorate the total efficiency of hybrid OTEC systems [22].

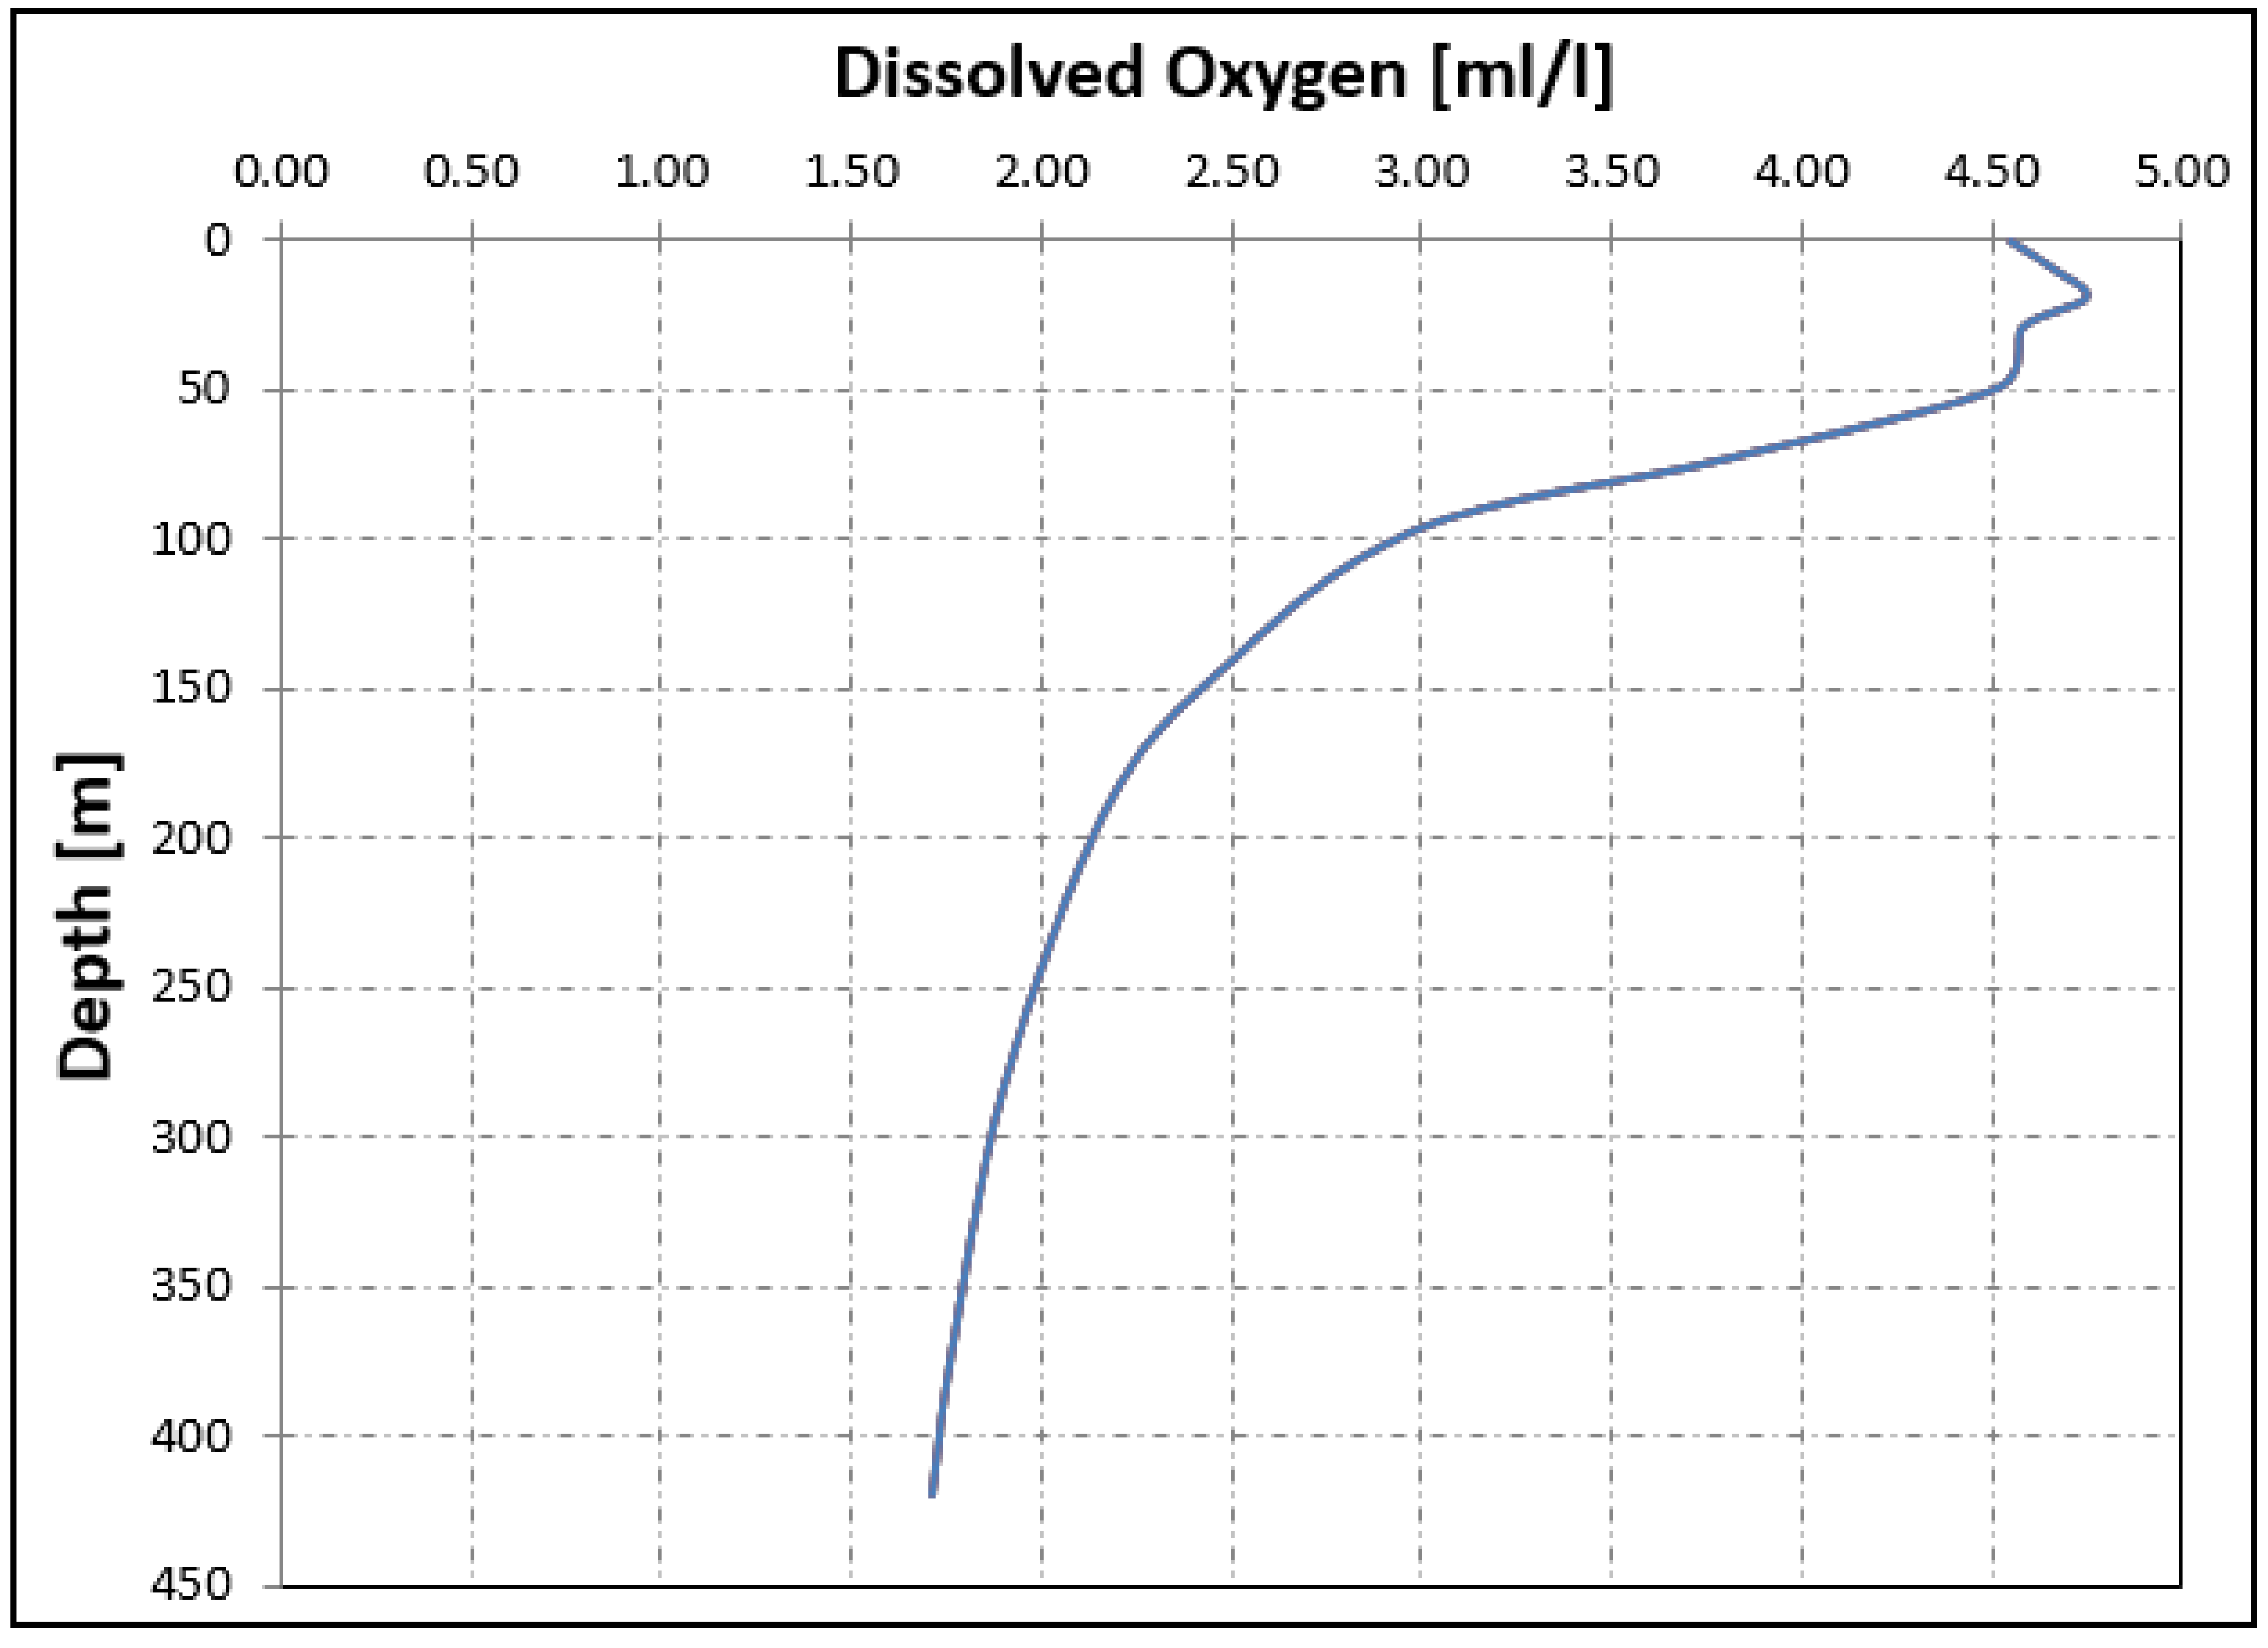
3.3. Dissolved Oxygen Profile

Figure 5 depicts the vertical profile of dissolved oxygen from JODC data of Pulau Kalumpang, Sabah, one of the potential sites for a hybrid OTEC plant. Similar to the cases of temperature and salinity, a fairly large variation of the dissolved oxygen in shallower (0–25 m) waters was observed. As shown in Figure 5, it was 4.5–4.7 mL/L at the surface, and then its value increased as the water got deeper, becoming 4.6–4.7 mL/L at 25 m depth. It then decreased further to 3.0–3.1 mL/L at 100 m depth. Then, it decreased to 1.7 mL/L in further depths. These data were provided by JODC.
Density of dissolved oxygen is a key parameter for deciding on the power requirement of the vacuum pump used in the desalination process, in which seawater is to be fed into the evaporation chamber for instant flash vaporing and the vapor thus produced will be condensed to produce fresh water or drinking water in some countries [25]. A vacuum pump is needed in the operation of this process. Furthermore, dissolved oxygen is also quite an important resource for the promotion of aquaculture industries, such as seaweeds, fish and shrimps [26].

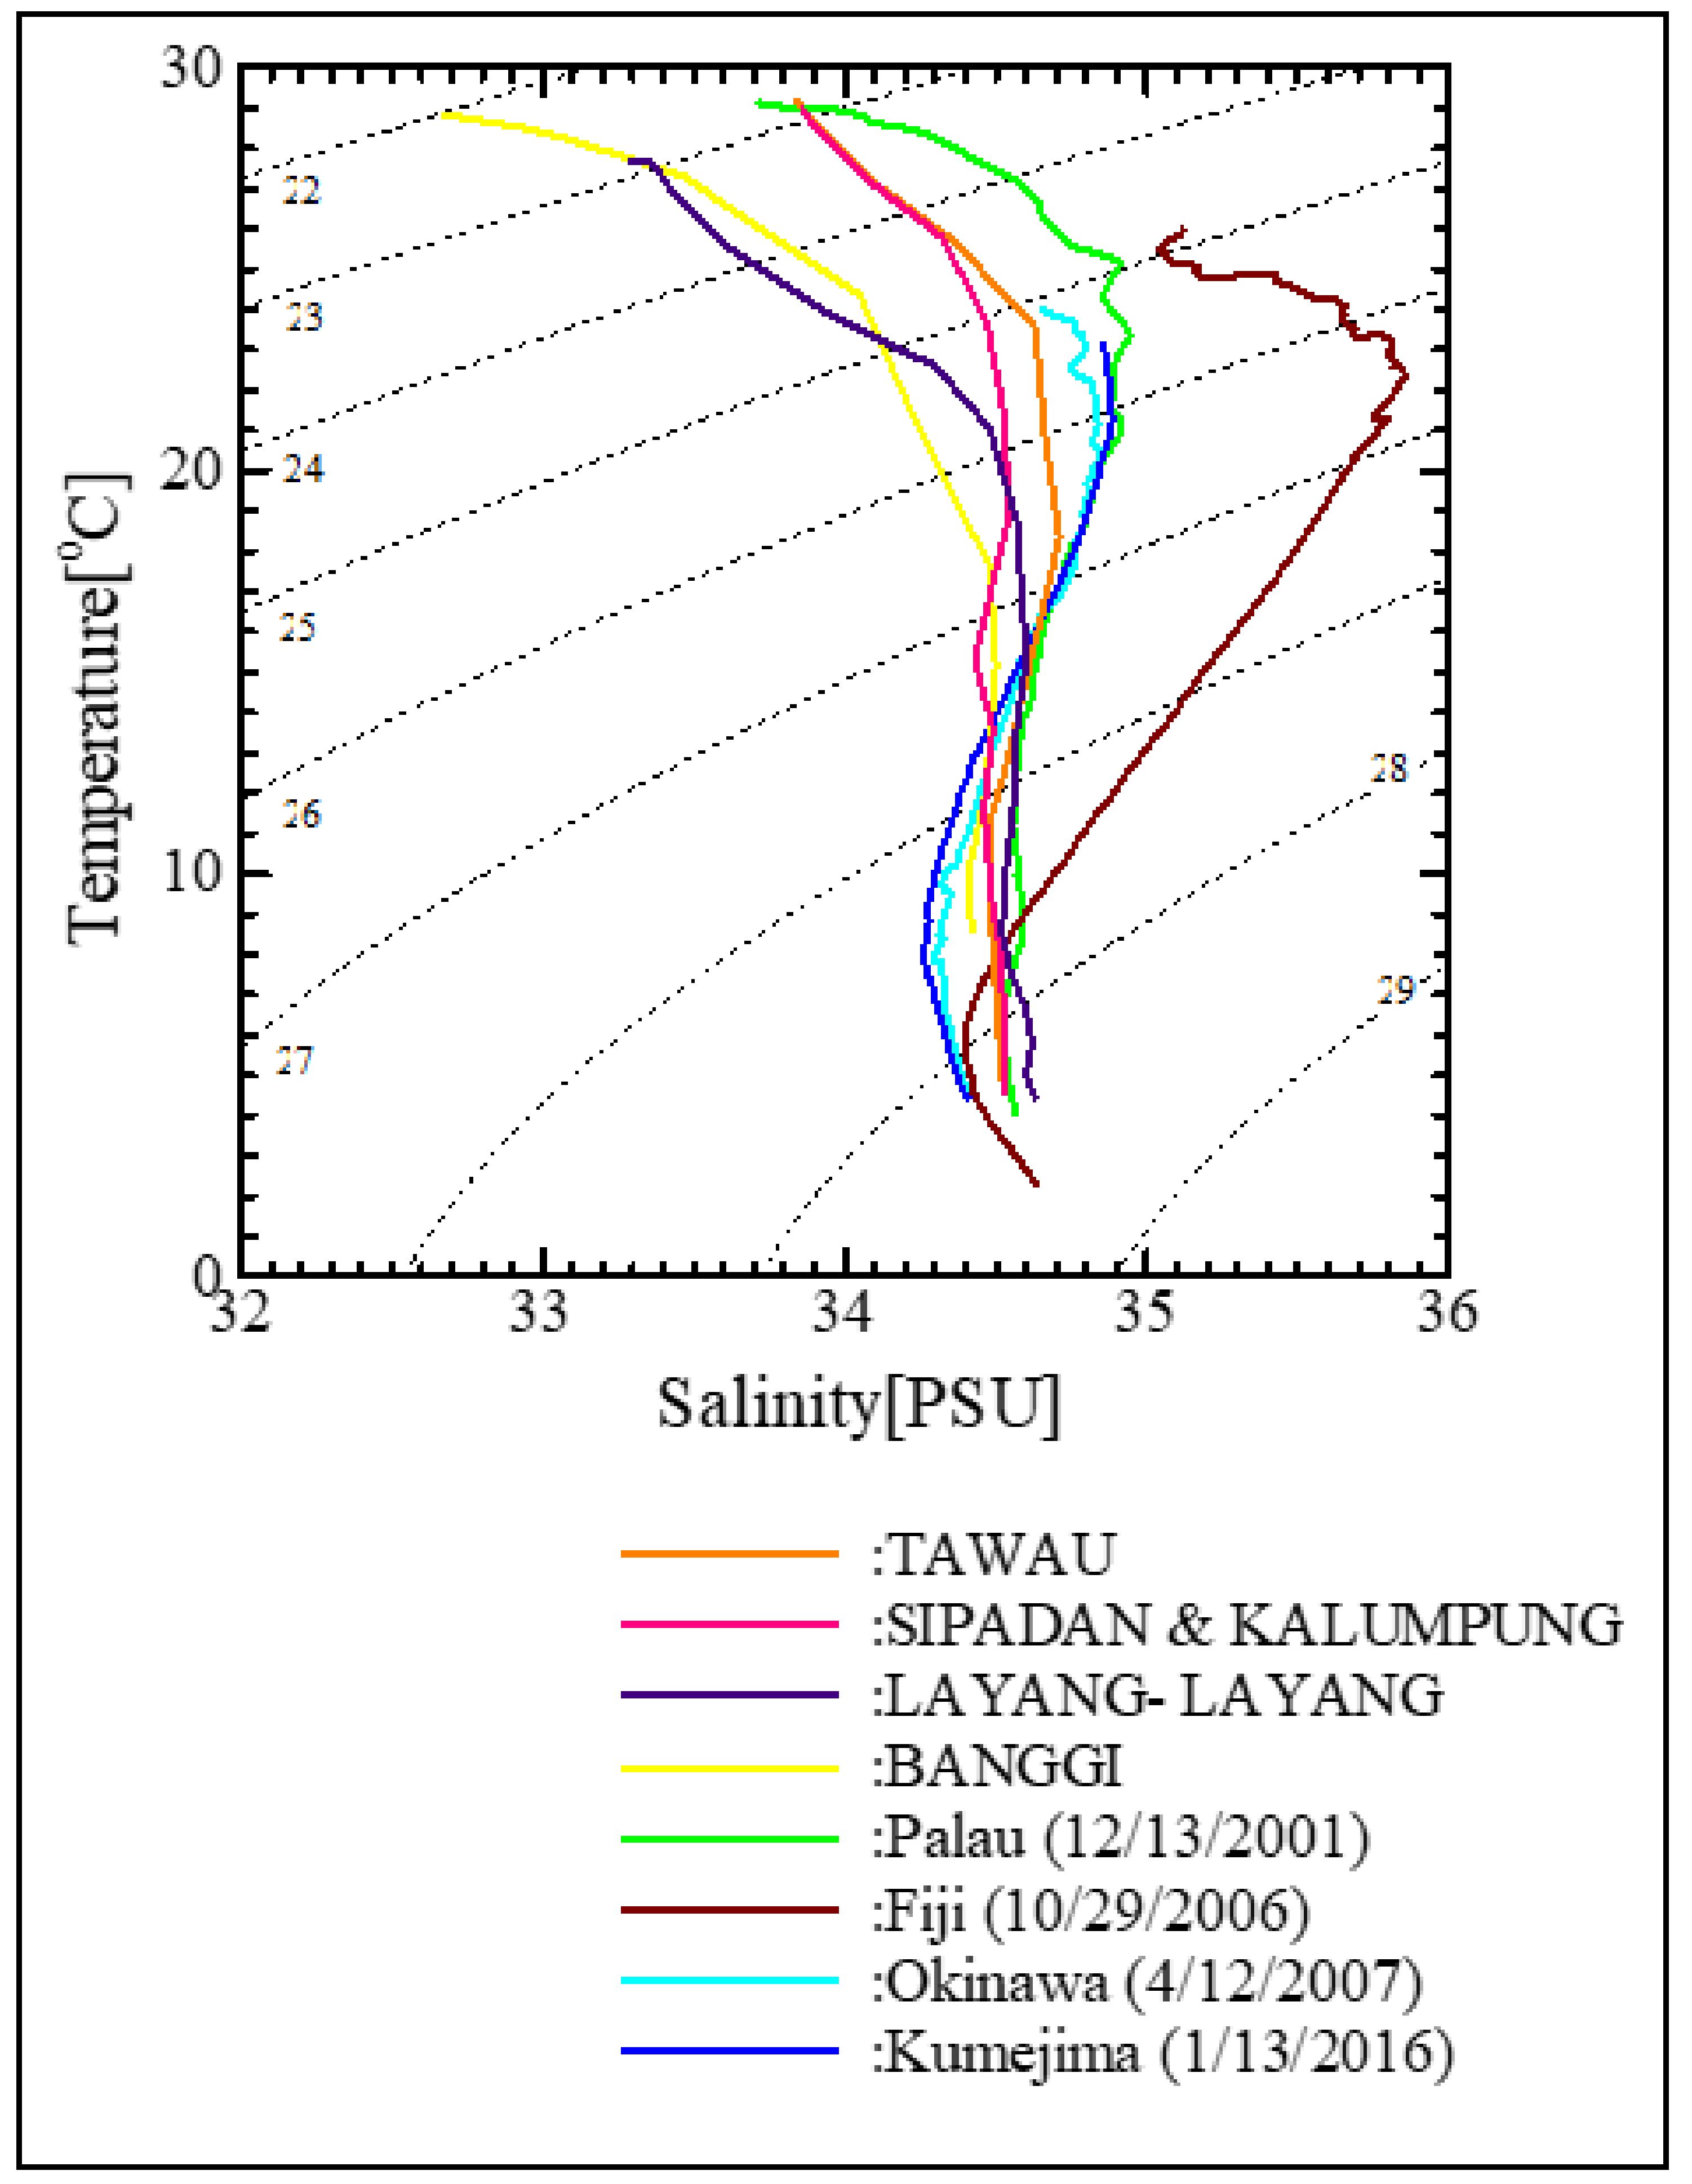
3.4. Water Mass (T-S Profile)

According to the temperature-salinity (T-S) profile in Figure 6, the salinity values for Tawau, Sipadan, Pulau Kalumpang, Pulau Layang-layang and Pulau Banggi below seawater temperature of 5.0 °C were approximately 34.4–34.8 mL/L, while higher salinity of up to 34.1–35.8 mL/L was noticeable in the waters with temperatures above 5 °C and up to approximately 24.0 °C (or in the depths between 800 m and 100 m). The T–S profile in waters above 24 °C up to the surface shows an arc-like pattern, as depicted in Figure 6. This is probably due to the heavy rainfall each year, which should make coastal waters relatively low in salinity. The yearly average salinity in water deeper than 250 m is described by a similar arc-like pattern, which would indicate the characteristics and similarity of water mass between regions.
The T-S profile confirms the characteristics and suitability of water mass in each region for ocean thermal resources. Thus, Figure 6 also includes the T–S profile obtained from waters in Fiji, the Republic of Palau [27], Kumejima and Okinawa for a comparison study. The results confirm that all the T-S profiles of Malaysian sites were similar in character with the Palau, Okinawa and Kumejima sites. However, in the areas between the surface and 200 m depth in Fijian waters, the salinity arc became greater than for the Malaysian and Japanese cases. Further, in the 16–18 °C seawater, the salinity of the Malaysian sites was similar to those in the waters of the northern part of South China Sea territories, such as Palau, Okinawa and Kumejima. The patterns observed in the Malaysian waters were comparable with that of Palau, Okinawa and Kumejima, but the virtual profile of salinity differed.

3.5. Approximation of OTEC Potential Power Production Capacity

There are no firmly established estimates of the global basis of the availability of ocean energy for OTEC plants in the Malaysian EEZ. In the meantime, the Malaysian total volume of electricity is about 161 × 109 kWh [5], 0.6% of which is RE and is about 94.2 × 10⁷ kWh. In this approximation and from the depth-temperature profile, the 7 °C cold seawater required for the OTEC plant is found at depths of about 600 m. The distribution area of 7 °C cold seawater (AF) within the Malaysian EEZ (AEF) of 3.35 × 10¹¹ m2 shares about 28% of the total, i.e., 9.23 × 10¹⁰ m2. Average temperature of the surface seawater was about 27 °C, as shown in Figure 3. This enables the assumption that the temperature of surface seawater is 27.0 °C for this approximation. Based on the data and this assumption, the estimate of renewable energy production by an OTEC plant in Malaysian waters are as follows. There are two methods of calculations for this estimate.
The first one is to follow Equation (1) used by Takano [28] for the estimation of OTEC energy. This was applied to the case study of Malaysia (EF).
EF = cp × m × ΔT = 4.2 × 9.2301 × 1010 × 600 × 1.03 × 103 × (27.0 − 7.0) = 4.792 × 10¹⁸ (kJ)
where cp: specific heat of seawater at constant pressure (4.2 kJ/kgK); m: mass of seawater (volume × density, i.e., 9.2301 × 1010 × 600 × 1.03 × 103 = 5.704 × 10¹⁶ kg); and ΔT: temperature difference, where the mass of seawater (m) is the multiplication of three factors, i.e., the usable area for an OTEC plant in Malaysia (AF = 9.2301 × 10¹⁰ m2), the average depth of deep seawater (600 m) and seawater density (1.03 × 10³ kg/m3). Temperature difference (ΔT) is the difference between the average temperature of surface seawater (27.0 °C) and deep seawater at the depth of 600 m (7 °C).
For continuous utilization of this energy, the energy itself must be presented in a volume of renewable nature. This figure was obtained by dividing OTEC energy by the factor of a period of time of seawater circulation, also known as the thermohaline circulation cycle. Applying the 1000 years of circulation time of the ocean conveyor belt, as suggested by Takano [28], the equation (EFR) follows:
EFR = EF/thermohaline circulation cycle (1000 years)
Therefore, it will be for the case of Malaysia as follows:
EFR = 4.792 × 10¹⁸ / 3.00 × 1010 = 1.597 × 10⁸ kW
where the 1000 years of circulation time of the thermohaline cycle leads to the next equation:
(1000 × 365 + 250) × 24 × 60 × 60 ≒ 3 × 10¹⁰ s
If this total renewable energy (EFR) were converted into the net OTEC renewable energy by applying a Rankine cycle of the OTEC system, the heat efficiency of which is rated at 2.5% (a rather underestimated value), it comes to 3.99 × 10⁶ kW of renewable energy (EFO), as shown below:
EFO = EFR × (2.5 / 100) = 1.597 × 108 × 0.025 = 3.99 × 10⁶ kW
This means the government target for RE power generation by 2025, which is 3.14 × 10⁶ kW, can be achieved only by having a hybrid OTEC plant.
The second approach to estimate RE is based on Equation (6), which uses the heat flux of the solar energy going into the sea from the sea surface, which then acts as a thermal energy store; i.e., Direct Energy Conversion [29].
q = c π     h k · T   Δ T T
where q: heat flux of solar energy (note that the output of q will be in W), c: solar speed constant (1.35 × 10³ W/m2), h: quantity of heat per mole for the evaporation process (40,308.4 J/mol), k: gas constant, T: average temperature of surface seawater (27.0 °C), T′: absolute temperature of surface seawater (300.15 K) and ΔT: temperature difference (if only 1.0 °C).
Considering ΔT to be only 1.0 °C, we can acquire q = 257.3 W.
Renewable energy (EFR) is the multiplication of (q), which represents the heat flux of solar energy going into the sea from the atmosphere, and AF is the OTEC potential sea area with 600 m or greater depth in Malaysia. The majority of solar energy is being absorbed near the sea surface and its thermal diffusion into the deep sea is quite small, since energy conversion with the atmosphere takes place through such phenomena as evaporation, radiation and heat convection. It is also being consumed for the transport of the ocean current. Therefore, if it was assumed to use only 2% of the total EF from the solar energy and named as EFR, the next equation from Direct Energy Conversion [29] would be:
EFR = 0.02 × q × AF = 0.02 × q × 10−3 × 9.2301 × 1010 = 4.75 × 10⁸ kW
Energy conversion of this renewable energy (EFR) 4.75 × 10⁸ kW by a Rankine cycle of an OTEC plant with 2.5% rated heat efficiency (η) leads to the OTEC renewable energy (EFO) of 1.188 × 10⁷ kW. This means that a hybrid OTEC plant should be able to produce about four times more than the current government target for RE power generation by 2025.
EFO = EFR × 0.025 = 4.750 × 108 × 0.025 = 1.188 × 10⁷ kW

4. Conclusions

This study analyzed the oceanographic observation data from JODC in the Malaysian sea area, specifically near Sabah, to study the optimal design of a hybrid OTEC plant, which not only generates power but also provides fresh water utilizing deep seawater. The two methods used to review and estimate the renewable energy potential of waters near Sabah have allowed the following conclusions to be drawn:
(1)
With regards to seawater temperature, the Japan Oceanographic Data Center (JODC) of Semporna, Tawau, Kudat, Pulau Layang-Layang and Pulau Kalumpang of Sabah showed no remarkable difference between the sites. On average, the surface seawater temperature was 27 °C. Deep seawater temperature at 600 m depth was approximately 7.0 °C.
(2)
Seawater salinity in waters shallower than 600 m had greater variability than that in waters deeper than 600 m, between 33.5 and 34.7 PSU.
(3)
The dissolved oxygen profile at Pulau Kalumpang showed a similarity to the case of seawater temperature and salinity. In the area shallower than 300 m, it had greater variability than at further depths.
(4)
The T-S profile in water deeper than 200 m showed the same pattern, while at shallower depths, different characteristics of the water mass were described. In waters shallower than 200 m, the arc of the pattern became fairly large, while in water deeper than 200 m, it showed about the same tendency as those recorded in the northern part of South China Sea territories, such as Palau, Okinawa and Kumejima.
(5)
The renewable energy to be generated by an OTEC system within the Malaysian EEZ, based on two calculation methods—one using the heat quantity of the temperature difference of seawaters and the other using the heat flux of solar energy—should be an amount similar to and four times greater than, respectively, the current government target for RE power generation by 2025.
Possible future works would include, but not be limited to, OTEC optimization for a 2.5 or 10 MW commercial plant. Another future extension with these results could be to develop an economically viable Malaysian OTEC model.

Author Contributions

S.T.T.: conceptualization, writing—original draft preparation; T.Y.: methodology, data curation; T.N.: visualization, investigation; Y.I. (1st), A.B.J. (2nd): supervision; S.S.: writing—reviewing and editing. All authors have read and agreed to the published version of the manuscript.

Funding

This research was funded by the Japan Science and Technology Agency (JST), grant number JPMJSA1803; and the Ministry of Education, Malaysia, Vote number R.K130000.7856.4L894. The APC was funded by Saga University.

Acknowledgments

The authors gratefully acknowledge the Science and Technology Research Partnership for Sustainable Development (SATREPS) funded by the Japan Science and Technology Agency (JST, JPMJSA1803) and the Japan International Cooperation Agency (JICA), and the Ministry of Education (MoE) of Malaysia for the Long-Term Research Grant Scheme (LRGS) grant, Vote number R.K130000.7856.4L894. The authors offer their sincere appreciation to Tetsuya Nishida and team from the National Fisheries University, Japan, for their efforts in validation and support for the bathymetry and maps of Sabah, Malaysia.

Conflicts of Interest

The authors declare no conflict of interest.

Abbreviations

RERenewable Energy
OTECOcean Thermal Energy Conversion
PVPhotovoltaics
MWMegawatt
JODCJapan Oceanographic Data Center
EEZExclusive Economic Zone
°CDegrees Celsius
MMeter
Approx.Approximately
PSUPractical Salinity Unit
mL/LMilliliters per liter
T-STemperature-Salinity
cmCentimeter
kmKilometer
kWhKilowatt-hour
LNGLiquid Natural Gas
SDGsSustainable Development Goals
DODissolved Oxygen
CTDConductivity, Temperature and Depth
KClPotassium Chloride
mmhoMilli-mho
dbDecibel

References

  1. Hock, S.S. The Population of Peninsular Malaysia; Institute of Southeast Asian Studies: Singapore, 2007; ISBN 978-981-230-427-8. [Google Scholar]
  2. The Land (West Malaysia). Encyclopedia Britannica. 2020. Available online: https://www.britannica.com/place/Malaysia/Plant-and-animal-life. (accessed on 30 April 2020).
  3. Department of Statistics Malaysia. 2016. Available online: https://www.dosm.gov.my. (accessed on 30 July 2008).
  4. Malaysia Maritime Claims 2019—Geography. Available online: http://www.indexmundi.com/ (accessed on 29 January 2020).
  5. ASEAN Centre for Energy. 2019. Available online: https://aeds.aseanenergy.org/country/malaysia/ (accessed on 25 April 2020).
  6. Nakaoka, T.; Nishida, T.; Ichinose, J.; Nagatomo, K.; Mizatani, S.; Tatsumi, S.; Matsushita, M.; Pickering, T.; Ikegami, Y.; Uehara, H. Oceanographic observations and an estimate of the renewable energy for ocean thermal energy conversion in the coast of the Fiji Island. Deep Ocean Water Res. 2003, 4, 57–66. [Google Scholar]
  7. Uehara, H.; Dilao, C.O.; Nakaoka, T. Conceptual Design of Ocean Thermal Energy Conversion (OTEC) Power Plants in the Philippines. J. Sol. Energy 1988, 41, 431–441. [Google Scholar] [CrossRef]
  8. Wolff, A.W.; Hubert, E.W.; Wolff, M.P. OTEC World Thermal Resource. In Proceedings of the Ocean Conference, Washington, DC, USA, June 19–22 1979; pp. 13.5.1–13.5.7. [Google Scholar]
  9. Rajagopalan, K.; Nihous, G.C. Estimates of Ocean Thermal Energy Conversion (OTEC) resources using an ocean general circulation model. Renew. Energy 2013, 50, 532–540. [Google Scholar] [CrossRef]
  10. Nihous, G.C. An estimation of Atlantic Ocean thermal energy conversion (OTEC) resources. Ocean Eng. 2007, 34, 2210–2221. [Google Scholar] [CrossRef]
  11. Hammar, L.; Ehnberg, J.; Mavume, A.; Cuamba, B.C.; Molander, S. Renewable ocean energy in the Western Indian Ocean. Renew. Sust. Energ. Rev. 2012, 16, 4938–4950. [Google Scholar] [CrossRef]
  12. Liu, T.; Hirose, N.; Yamada, H.; Ikegami, Y. Estimation of ocean thermal energy potential in the Aguni Basin. Appl. Ocean Res. 2020, 101, 102185. [Google Scholar] [CrossRef]
  13. VanZwieten, J.H.; Rauchenstein, L.T.; Lee, L. An assessment of Florida’s ocean thermal energy conversion. Renew. Sust. Energ. Rev. 2017, 75, 683–691. [Google Scholar] [CrossRef] [Green Version]
  14. Zahraee, S.M.; Golroudbary, S.R.; Shiwakoti, N.; Kraslawski, A.; Stasinopoulos, P. An investigation of the environmental sustainability of palm biomass supply chains via dynamic simulation modeling: A case of Malaysia. J. Clean. Prod. 2019, 237, 117740. [Google Scholar] [CrossRef]
  15. Benjamin, M.; Okamura, S.; Nakamura, Y.; Yasunaga, T.; Ikegami, Y. Status of the “Kumejima Model” for advanced deep seawater utilization. In Proceedings of the 2016 Techno-Ocean, Kobe, Japan, 6–8 October 2016. [Google Scholar]
  16. Takahashi, M.M. Ocean fertilization using deep ocean water (DOW). Deep Ocean Water Res. 2003, 4, 73–87. [Google Scholar]
  17. Hernandez-Romero, I.M.; Fuentes-Cortes, L.F.; Mukherjee, R.; El-Halwagi, M.M.; Serna-Gonzalez, M.; Napoles-Rivera, F. Multi-scenario model for optimal design of seawater air-conditioning systems under demand uncertainty. J. Clean. Prod. 2019, 238, 117863. [Google Scholar] [CrossRef]
  18. Yoshizuka, K.; Holba, M.; Yasunaga, T.; Ikegami, Y. Performance evaluation of benchmark plant for selective lithium recovery from seawater. J. Ion Exch. 2007, 18, 450–453. [Google Scholar] [CrossRef]
  19. Avery, W.; Wu, C. Renewable Energy from The Ocean—A Guide to OTEC; Oxford University Press, Inc.: New York, NY, USA, 1994; ISBN 0195071999. [Google Scholar]
  20. Yasunaga, T.; Ikegami, Y. Finite-time thermodynamic model for evaluating heat engines in ocean thermal energy conversion. Entropy 2020, 22, 211. [Google Scholar] [CrossRef] [PubMed] [Green Version]
  21. Ikegami, Y.; Yasunaga, T.; Morisaki, T. Ocean thermal energy conversion using double-stage Rankine cycle. J. Sci. Mar. Eng. 2018, 6, 21. [Google Scholar] [CrossRef] [Green Version]
  22. Uehara, H.; Miyara, A.; Nakaoga, T.; Nishida, T. A Study on an Ocean Thermal Energy Conversion Plant Using Integrated Hybrid cycle in the Oki-no-Erabu Island. In Proceedings of the Second International Offshore and Polar Engineering Conference, San Francisco, CA, USA, 14–19 June 1992; pp. 599–606. [Google Scholar]
  23. Japan Oceanographic Data Center. 2020. Available online: https://www.jodc.go.jp/jodcweb/ (accessed on 20 April 2020).
  24. Quek, T.Y.A.; Alvin Ee, W.L.; Chen, W.; Ng, T.S.A. Environmental impacts of transitioning to renewable electricity for Singapore and the surrounding region: A life cycle assessment. J. Clean. Prod. 2019, 214, 1–11. [Google Scholar] [CrossRef]
  25. Magesh, R. OTEC Technology—A World of Clean Energy and Water. In Proceedings of the World Congress on Engineering; Ao, S.I., Gelman, L., Hukins, D.W.L., Korsunsky, A.M., Eds.; WCE: London, UK, 2010; ISBN 978-988-18210-7-2. [Google Scholar]
  26. Yoza, B.A.; Nihous, G.C.; Takahashi, P.K.; Golmen, L.G.; War, J.C.; Otsuka, K.; Masutani, S.M. Deep ocean water resources in the 21st century. Mar. Technol. Soc. J. 2010, 44, 80–87. [Google Scholar] [CrossRef]
  27. Ikegami, Y.; Urata, K.; Fukumiya, K.; Noda, N.; Decherong, G. Oceanographic Observation in the Palau waters for utilization of cold deep seawater. In Proceedings of the 6th Conference at Kumejima session of Japan Association of Deep Ocean Water Applications, Seoul, Korea, 19–24 June 2002. [Google Scholar]
  28. Takano, K. Volume of Energy of Deep Seawater. Japan Assoc. Deep Ocean Water Appl. News 2002, 6, 8–10. (In Japanese) [Google Scholar]
  29. Direct Energy Conversion. Energy Resources Engineering; OHM: Tokyo, Japan, 1991; pp. 178–181. (In Japanese) [Google Scholar]
Figure 1. Areas highlighted in light blue are the overall Malaysian Marine Region—Exclusive Economic Zone (EEZ). This map shows 98 degrees to 121 degrees east in longitude and the equator to 10 degrees north in latitude.
Jmse 09 00022 g001
Figure 2. Map of Sabah and Sarawak with latitude and longitude position. The solid line represents the EEZ of Malaysia, the dark blue highlighted areas are location with seawater depths greater than 1000 m, and potential sites for Ocean Thermal Energy Conversion (OTEC) are marked with a star. This map shows 109 degrees to 121 degrees east in longitude and the equator to 9 degrees north in latitude.
Jmse 09 00022 g002
Figure 3. Deep seawater temperature and depth profiles of Tawau, Simpadan, Pulau Kalumpang, Pulau Layang-layang and Pulau Banggi; data obtained from the online Japan Oceanographic Data Center (JODC).
Jmse 09 00022 g003
Figure 4. Deep seawater salinity (in PSU) and depth profile of Tawau, Sipadan, Pulau Kalumpang, Pulau Layang-layang and Pulau Banggi; data obtained from the online Japan Oceanographic Data Center (JODC).
Jmse 09 00022 g004
Figure 5. Deep seawater dissolved oxygen (ml/l) and depth profile of Pulau Kalumpang; data obtained from the online Japan Oceanographic Data Center (JODC).
Jmse 09 00022 g005
Figure 6. Deep seawater temperature–salinity profiles of Tawau, Sipadan, Pulau Kalumpang, Pulau Layang-layang and Pulau Banggi were compared with those of Palau, Fiji, Okinawa and Kumejima (contour (dotted line) represents the density (σ t) (kg/m3)). These data were obtained from the online Japan Oceanographic Data Center (JODC).
Jmse 09 00022 g006
Table 1. Specifications of the conductivity, temperature and depth (CTD) instrument used in this study.
ParameterRangeAccuracy
Conductivity1–65 mmho±0.005 mmho
Temperature−32–+32 °C±0.005 °C
Pressure0–320 db±0.5 db
0–650 db±1.0 db
0–1600 db±1.6 db
0–3200 db±3.2 db
0–6500 db±6.5 db
Publisher’s Note: MDPI stays neutral with regard to jurisdictional claims in published maps and institutional affiliations.

