Article

Meshless Model for Wave-Induced Oscillatory Seabed Response around a Submerged Breakwater Due to Regular and Irregular Wave Loading

by
Dong-Sheng Jeng
1,2,†,
Xiaoxiao Wang
2,† and
Chia-Cheng Tsai
3,4,*,†
1
College of Civil Engineering, Qingdao University of Technology, Qingdao 266033, China
2
School of Engineering and Built Environment, Griffith University Gold Coast Campus, Queensland 4222, Australia
3
Department of Marine Environmental Engineering, National Kaohsiung University of Science and Technology, Kaohsiung 811213, Taiwan
4
Department of Marine Environment and Engineering, National Sun Yat-Sen University, Kaohsiung 804201, Taiwan
*
Author to whom correspondence should be addressed.
These authors contributed equally to this work.
J. Mar. Sci. Eng. 2021, 9(1), 15; https://doi.org/10.3390/jmse9010015
Submission received: 13 November 2020 / Revised: 21 December 2020 / Accepted: 21 December 2020 / Published: 24 December 2020
(This article belongs to the Special Issue Structure-Seabed Interactions in Marine Environments)

Abstract

:
The evaluation of wave-induced seabed stability around a submerged breakwater is particularly important for coastal engineers involved in design of the foundation of breakwaters. Unlike previous studies, a mesh-free model is developed to investigate the dynamic soil response around a submerged breakwater in this study. Both regular and irregular wave loadings are considered. The present model was validated against the previous experimental data and theoretical models for both regular and irregular waves. Parametric study shows the regular wave-induced liquefaction depth increases as wave period and wave height increase. The seabed is more likely to be liquefied with a low degree of saturation and soil permeability. A similar trend of the effects of wave and seabed characteristics on the irregular wave-induced soil response is found in the numerical examples.

1. Introduction

Climate change is a a global issue that has significant impacts on coastal zones. This scientific issue does not only challenge the ocean environments but also its associated engineering design for coastal structures. For example, the coastal zones have been facing the extremely storm surge statistics in specific regions due to climate changes. Numerouos recent reports for the impact of climate changes on different scientific issues and engineering problems have been available in the literature [1,2,3,4,5,6].
Shoreline protection is one of main concerns in the field of coastal management. Two methodologies have been commonly used for shoreline protection. One is the so-called soft option, including beach nourishment or restoration, headline-control, and sand bypassing design [7,8,9,10]. The other shoreline protection method is the so-called hard option, including breakwaters and seawalls [11,12,13,14]. Recently, submerged breakwaters have been commonly used as one of defense structures in a coastal region because it can partially eliminate the wave energy and impacts of water waves to coastline. For the design of breakwaters, the possible interactions between the wave, storm surges, wind setup, sea current, and tide can produce significant nonlinear effects. This complicated problem has been studied in the past [4,15,16,17,18]. In addition, the possible foundation failure around a breakwater due to environmental loads is one of key factors that must be considered in the design of the structures. In addition to erosion, scouring, and construction deficiency, the wave-induced seabed liquefaction in the vicinity of a breakwater has been recognized as one of reasons causing foundation failures [19,20].
There are numerous investigations for the wave-induced seabed response around a breakwater available in the literature. Among these, Tsai et al. [21] proposed an analytical solution for the wave-induced soil response around caisson-type breakwater, based on the boundary-layer approximation [22]. Mase et al. [23] proposed a finite element model (FEM) to investigate the wave-induced pore-water pressures and effective stresses around a composited breakwater with a simplified formulation for the dynamic wave pressures along the rubble mound and the seabed surface. Mostafa et al. [24] investigated the non-linear wave-induced soil response around a composite breakwater through their combined boundary element and finite element (BEM-FEM) methods. Later, with concept of repeatability, the wave-induced soil response around a caisson-type breakwater in a sandy seabed was examined by FEM [25]. Recently, Jeng et al. [26] proposed an integrated model (VoF-FEM) for the wave-induced soil response and associated soil liquefaction in the vicinity of a composited breakwater.
Most previous investigations for the wave-seabed interactions in the vicinity of a breakwater adopted the conventional numerical methods, such as FEM. Recently, an alternative approach, the mesh-free scheme, has been adopted for various scientific and engineering problems because it has the advantages of without meshes and constructing interpolation basis function directly on the node set naturally deal with the problem, large deformation, high-order continuous interpolation, and adaptive solution. The most common mesh-free methods are the method of fundamental solution (MFS), the global RBF collocation method (GRBFCM), the local RBF collocation method (LRBFCM), the element-free Galerkin method (EFG method), and the radial point interpolation meshless method (radial PIM).
Regarding the application of mesh-free method in the problem of wave-seabed interactions, Karim et al. [27] presented a two-dimensional model using the EFG method to investigate transient response of saturated porous elastic soil under cyclic loading system. Meanwhile, the radial PIM was applied to solve problems of Biot’s consolidation [28] and wave-induced seabed response [29]. Recently, the authors developed a meshless model by employing the LRBFCM to investigate the wave/current-induced seabed response around offshore pipeline [30] and submarine tunnel [31]. To date, the mesh-free method has not been applied to the case with a breakwater. In this paper, we further applied our previous mesh-free model to investigate the wave-induced soil response around a submerged breakwater under regular and irregular wave loading.
This paper is organized as follows. Firstly, the theoretical model, including wave sub-model (IHFOAM model) [32] and seabed sub-model (mesh-free model), will be outlined. Secondly, regular wave-induced soil response and seabed liquefaction around a submerged breakwater and parametric study will be presented. Finally, irregular wave-induced soil response in the vicinity of a submerged breakwater will be further discussed.

2. Theoretical Model

In this study, the proposed numerical model consists of two sub-models, wave and seabed models, which will be outlined in the following sections.

2.1. Wave Model

The conventional 2-D and 3-D modeling of long and narrow structures (e.g., submerged breakwaters) enhances the computational cost. Therefore, simplified approaches are widely implemented into mathematical models by developing a set of specific links to reproduce the presence of long and narrow structures, such as submerged barriers, sills, and levees. Numerous recent studies on the effect of a step on waves characteristics have been reported in the literature [13,14,33].
In this study, CFD wave model (IHFOAM) [32] was adopted to simulate wave propagating over a submerged breakwater. IHFOAM is a solver within OpenFOAM for two incompressible, isothermal immiscible fluids. In the model, the two-phase fluids model of air and water is established to simulate the wave propagation and the wave pressure of the whole fluid domain.
The Reynolds-averaged Navier–Stokes (RANS) equations are generally used to govern the flow motion under the assumption of an incompressible fluid:
· u = 0 ,
ρ u t + · ρ u u = p * g · r ρ + · μ e f f u ,
α t + · α u + · α ( 1 α ) u c = 0 ,
in which u is the velocity vector; ρ is the density of fluid; p * ( = p ρ g · r ) is the pressure in excess of the hydro-static, in which p is total pressure, g is the gravity acceleration, and r is the Cartesian position vector; μ e f f is effective dynamic viscosity, comprised of molecular viscosity and the turbulent viscosity given by RANS turbulence models. In (3), u c is a compression velocity at the interface between the fluids, in the normal direction to the free surface. The indicator function ( α ) in (3) is defined as the quantity of water per unit of volume at each cell and is expressed as:
α = 1 , water 0 , air 0 < α 1 < 1 , free surface .
Using the volume fraction ( α ), one can represent the spatial variation in any fluid property, such as density and viscosity, and consider the mixture properties:
Ψ = α Ψ w + ( 1 α ) Ψ a ,
in which Ψ w and Ψ a is any kind of fluid property (e.g., density and viscosity) of water and air, respectively.
Several boundary conditions are adopted in the wave model. The second-order Stokes wave theory is adopted to generate the progressive waves for the inlet condition. Meanwhile, an active wave absorption theory is employed to present the re-reflection of incoming waves at the outlet [34]. A pressure outlet condition is used for the atmospheric boundary at the upper boundary of the wave model. The surface before and behind the wave model and the bottom of fluid domain are defined as slip boundary conditions. The wave-breakwater interface is assumed to be a rigid wall, which is defined as no-slip condition. More detailed information for the IHFOAM can be found in Reference [32].

2.2. Seabed Model

Based on the poro-elastic theory [35], the pore fluid is compressible and obeys Darcy’s law, but the acceleration due to the movement of the pore fluid and the soil is ignored. For a two-dimensional problem, the governing equations for the seabed model are given as
k s 2 p s γ w n s β s p s t = γ w t u s x + w s z ,
G s 2 u s + G s ( 1 2 μ s ) x u s x + w s z = p s x ,
G s 2 w s + G s ( 1 2 μ s ) z u s x + w s z = p s z ,
in which p s is the wave-induced pore pressure; u s and w s are the soil displacements in the x- and z- directions, respectively; γ w is the unit weight of the pore water; n s is the soil porosity; G s is the shear modulus of soil. In (6), β s is the compressibility of the pore fluid, which is defined by [36]:
β s = 1 K w + 1 S r γ w d ,
where K w (=1.95 × 10 9 N/m 2 [37]) is the true bulk modulus of elasticity of water, and d is the water depth.
The stress-strain relationship is given as
σ x = 2 G s u s x + μ s 1 2 μ s u s x + w s z ,
σ z = 2 G s w s z + μ s 1 2 μ s u s x + w s z ,
τ x z = G s u s z + w s x = τ z x .
To solve the pore pressures and soil displacements in the above governing equations, the following boundary conditions are employed.
p s ( x , t ) = p w ( x , t ) , σ z = τ x z = 0 . at z = 0 ,
u s = w s = p s z = 0 , at z = h ,
u s | x = 0 , L s = w s | x = 0 , L s = p s x | x = 0 , L s = 0 .
At the seabed surface, (13), p w is obtained from the wave model outlined in Section 2.1, and effective normal stress and shear stress are vanished. At the bottom of the seabed, (14), no porous flow come through the rigid boundary, and then soil displacements and vertical flow gradients vanish. (15) represents the lateral boundary conditions, and there is zero soil displacement and no flow through the boundaries.

2.3. Mesh-Free Model for a Porous Seabed

Numerous investigations for the wave-induced porous seabed response have been carried out by using conventional numerical methods, such as FDM, BEM, and FEM. Despite the powerful features of these numerical methods, the existence of meshes leads to a relatively long computational process, and singularity of meshes usually occurs for cases with large deformation.
In this study, a typical meshless method, named LRBFCM, was adopted to solve the two-dimensional seabed problems. The LRBFCM has been applied in lots of fields, such as the solution of diffusion problems [38], Darcy flow in porous media [39], water wave scattering [40], and macro-segregation phenomena [41].
Considering the square computational domain, the domain and its boundary are discretized into N nodes, and Φ ( y j ) is going to be solved. Therefore, a linear-equations system of the following form is required to be developed:
A 3 N × 3 N Φ 3 N × 1 = B 3 N × 1 ,
where
Φ 3 N × 1 = u s ( y 1 ) u s ( y 2 ) u s ( y N ) w s ( y 1 ) w s ( y 2 ) w s ( y N ) p ( y 1 ) p ( y 2 ) p ( y N )
is the sought solution, B 3 N × 1 is a column vector contributed from the wave model, and and A 3 N × 3 N is a sparse system matrix. The structure of A 3 N × 3 N is the same as that used in the FDM and FEM.
In Equation (16), the sought solution ( u s , w s , and p) is approximated around y j by the RBFs as following expression for constructing a linear equation for every node y n :
Φ ( x ) m = 1 K α m χ ( r m ) ,
where Φ refers to either u s , w s , or p in the governing equations, r m = x x m is the Euclidean distance from x to x m , and α m refers to the corresponding undetermined coefficient. The group of x m refers to the locations of the K nearest neighbor nodes around the prescribed center x 1 = y n . In this study, the KD-tree algorithm is applied to find the K nearest neighbor nodes efficiently [42]. Moreover, the multiquadric RBF is expressed as
χ ( r m ) = r m 2 + c 2 ,
with the shape parameter (c) [43]. In order to avoid unnecessary ill-conditioning, a localization process [38,44,45] is introduced here. Firstly, the collocation of Equation (18) on x n gives
Φ ( x n ) = m = 1 K α m χ ( x m x n ) ,
or in matrix-vector form as
Φ K × 1 = χ K × K α K × 1 ,
where
Φ K × 1 = Φ ( x 1 ) Φ ( x 2 ) Φ ( x K ) ,
χ K × K = χ ( x 1 x 1 ) χ ( x 1 x 2 ) χ ( x 1 x K ) χ ( x 2 x 1 ) χ ( x 2 x 2 ) χ ( x 2 x K ) χ ( x K x 1 ) χ ( x K x 2 ) χ ( x K x K ) ,
and
α K × 1 = α 1 α 2 α K .
Equation (21) can be inverted as
α K × 1 = χ K × K 1 Φ K × 1 .
Next, L Φ ( x ) is considered to replace Φ ( x ) defined in Equation (18), where L is a linear differential operator of both the governing equation and the boundary condition. The collocation of L Φ ( x ) on x 1 = y n gives
L Φ ( y n ) = m = 1 K α m L χ ( r m ) x = x 1 ,
or in matrix-vector form as
L Φ ( y n ) = L χ 1 × K α K × 1 .
In Equation (27), the existence of L χ ( r m ) is due to the influence of operator L on the RBF χ ( r m ) . Then, Equations (25) and (27) are combined as
L Φ ( y n ) = C 1 × K ϕ K × 1 ,
with
C 1 × K = L χ 1 × K χ K × K 1 ,
and
L χ 1 × K = L χ ( r 1 ) x = x 1 L χ ( r 2 ) x = x 1 L χ ( r K ) x = x 1 .
From Equations (28)–(30), it is easy to find that the row vector C 1 × K can be obtained if all of the values of L, χ and x j are known.
In order to complete the LRBFCM, the meaning of L χ ( r m ) needs to be explained. Without any loss of generality, the expressions of x 1 = y n = ( 0 , 0 ) and r m = x m = r may be assumed, and, with the following differential operator,
D D r = d r d r ,
we have
D χ D r ( r ) = 1 ( r 2 + c 2 ) 1 / 2 ,
D 2 χ D r 2 ( r ) = 1 ( r 2 + c 2 ) 3 / 2 .
Here, y n is considered in the computational domain. If the time harmonic assumption e i ω t is considered, Equations (6)–(8) can be expressed in tensor form as
k s 2 p s + i ω γ w n s β s p s + i ω γ w v j , j = 0 ,
G s v i , j j + G s ( 1 2 μ s ) v j , j i p s , i = 0 ,
where v 1 = u s , v 2 = w s , and the tensor indices i and j vary from 1 to 2. Equations (34) and (35) can be rewritten, respectively, as
L 33 p + L 3 j v j = 0 ,
L i 3 p + L i j v j = 0 ,
with
L 33 = k s 2 + i ω γ w n s β s ,
L 3 j = i ω γ w x j ,
L i 3 = x i ,
L i j = δ i j G s 2 + G s ( 1 2 μ s ) 2 x i x j .
Thus,
L 33 χ = k s d r d r ( r d d r ) r 2 + c 2 + i ω γ w n s β s r 2 + c 2 = k s r 2 + 2 c 2 r 2 + c 2 3 + i ω γ w n s β s r 2 + c 2 ,
L 3 j χ = i ω γ w x j D χ D r ,
L i 3 χ = x i D χ D r ,
L i j χ = δ i j G s r 2 + 2 c 2 r 2 + c 2 3 + G s ( 1 2 μ s ) ( δ i j D χ D r + x i x j D 2 χ D r 2 ) .
In Equations (38)–(45), we have defined x 1 = x and x 2 = z .
The linear equations, Equations (42)–(45), can be obtained by the collocations of the governing equations or boundary conditions for all y n dependent on their location. These equations can be assembled into the system matrix, shown as Equation (16), and then the resulted sparse system is solved by using the direct solver of SuperLU [46] in this study. Until here, the procedure of the LRBFCM for the time harmonic model in Equations (34) and (35) is finished. If the time dependent model in Equations (6)–(8) is considered, the Crank–Nicolson method [47] can be applied. The resulted equations can be similarly discretized by the LRBFCM and thus neglected here.
The mesh convergence of the present model was presented in the authors’ previous publication [30]. Therefore, this will not repeat in this paper.

3. Regular Wave-Induced Soil Response around a Submerged Breakwater

3.1. Validation of the Present Model with Regular Wave Loading

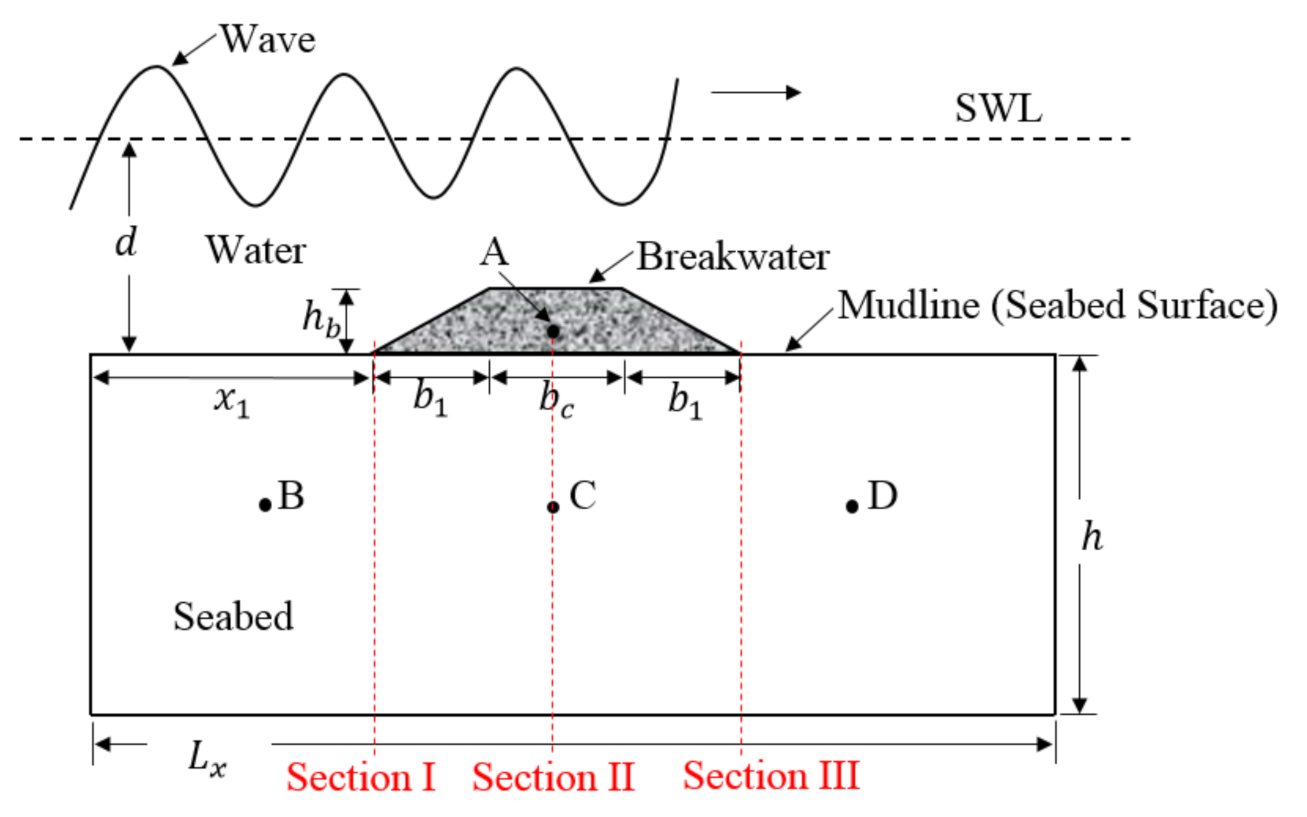
Mizutani and Mostafa [48] conducted a series of experiments using a two-dimensional wave tank to examine the wave morphology change surrounding the submerged breakwater and the excess pore water pressure in the sandy foundation below the breakwater. To validate the present seabed model in dealing with the computational domain including a submerged breakwater, a comparison between present numerical results and the experimental data obtained by Mizutani and Mostafa [48] is presented in this section. The set-up of Mizutani and Mostafa [48]’s experiments is shown in Figure 1, and the input data for their experiments are tabulated in Table 1.
The side slopes of the breakwater are 2:1 (horizontal:vertical). The length of the computational domain is determined as 10.8 m. According to Ye and Jeng [49], it is long enough to ensure that the effect of lateral boundary conditions on the soil area around the breakwater is vanished. As shown in Figure 1, four wave gauages are installed at points a, b, c and d to monitor the wave profile, while four pore pressure transducers are installed at point A, B, C, and D to record the wave-induced pore pressure. The wave gauage at Point a is to measure the incident wave height, at point b and c are to determine the wave profile at edge of top of the submerged breakwater, and Point d is to check the wave reflection form the end of the wave flume. Point A is located inside the breakwater on the line of 9.9 cm above the seabed surface, which is used to record the pore water pressure in the middle of the submerged breakwater. Transducers B, C, and D are embedded in the soil on the section of 9 cm below the seabed surface. C is utilized to record the pore water pressure inside the soil foundation under the middle of the breakwater. Moreover, B and D are setup for recording the pore water pressure inside the foundation onshore and offshore of the breakwater, respectively. The second-order Stokes wave theory was adopted to simulate the wave generation and propagation process.
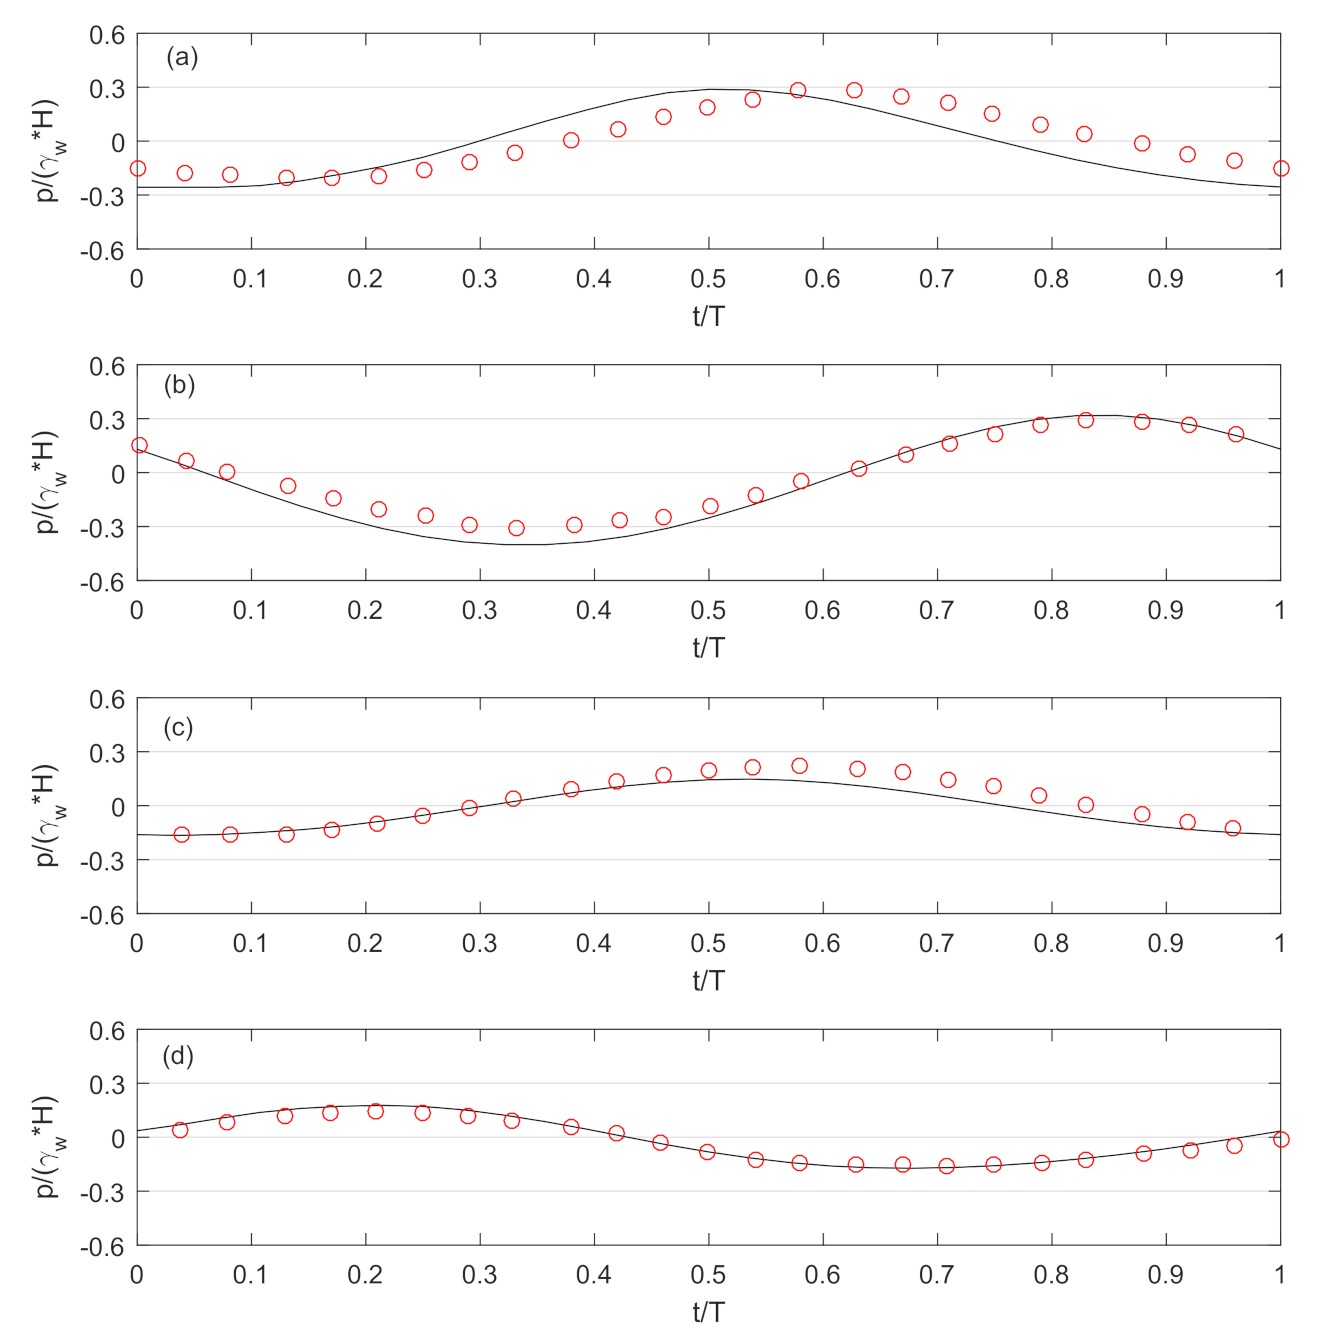
The comparison with respect to the wave-induced transient dynamic pore pressure in one period between the present numerical results and the laboratory data is shown in Figure 2. The computed pore water pressure by the present model is generally in a good agreement with that measured. It demonstrates the capacity of the present model for the prediction of regular wave-induced pore-water pressures in a sandy seabed.
It is noted that the laboratory experiment in Mizutani and Mostafa [48] is a small scale experiment in the wave flume. It is a common practice for coastal engineering researchers to use small-scale tests for the validation of the numerical model because it is can be better controlled in the laboratory environment. The common methodology for coastal engineering researchers is to validate the theoretical model against the laboratory tests and then conduct parametric study for large scale engineering problems.
In the following subsections, we apply the present model to investigate the dynamic soil response around a submerged breakwater under regular wave loading. A submarine breakwater, of which the height and width are set as 3 m and 30 m, is built on a sandy seabed, as shown in Figure 3. The wave and seabed properties used in these examples are listed in Table 2. The breakwater considered in this study is assumed to be impermeable, as shown in Figure 3, and the breakwater is located in the center of the whole computational domain.

3.2. Consolidation Process of Seabed under a Submerged Breakwater

In natural environments, the soil foundation generally has experienced the consolidation process under the hydro-static pressures and the self-weight of the breakwater in the geological history. After a submarine breakwater is constructed, the marine sediments in the vicinity of the breakwater will be compressed owing to the self-weight of the structure. The seabed region will then reach a new equilibrium status. This consolidation process will change the initial stresses within the seabed, which is one of key parameters for the prediction of the wave-induced soil liquefaction. The criterion of the wave-induced liquefaction with a structure can be expressed as [50],
( p w p ) | σ 0 | .
As shown in the above criterion, the mean initial stress ( σ 0 ) will directly affect the prediction of liquefaction.
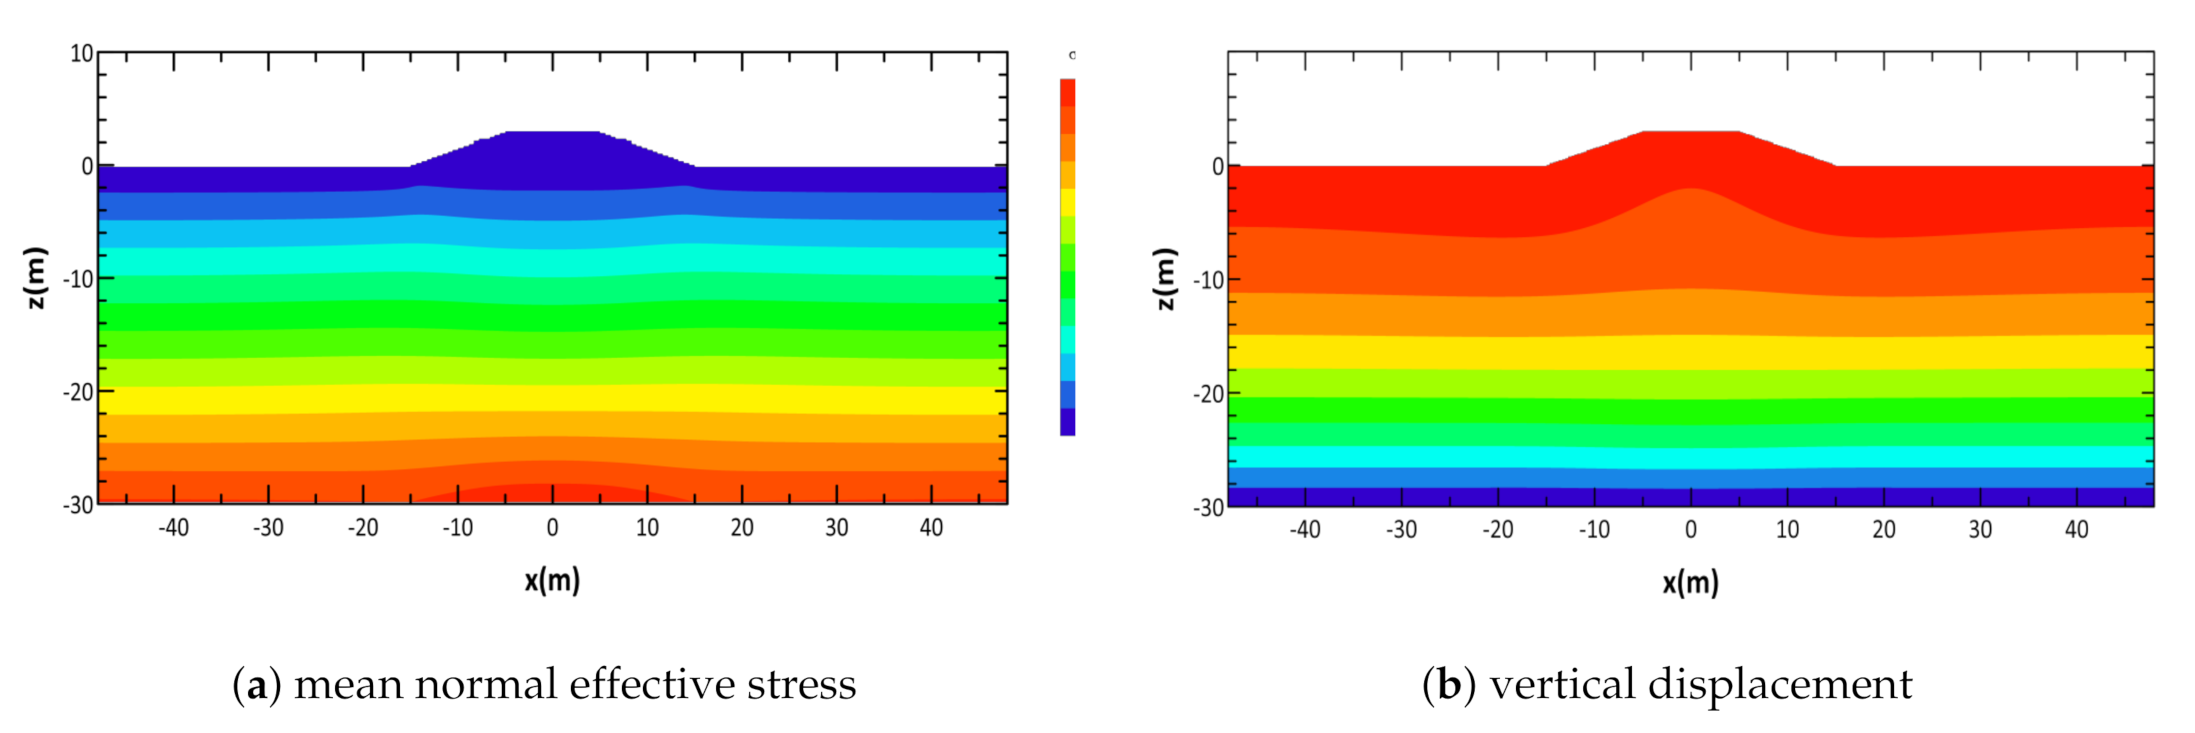
Figure 4 illustrates the mean effective normal stress and vertical soil displacement in the soil foundation after consolidation. It can be observed from Figure 4a that the distribution of the normal effective stress is layered in the the region far from the breakwater, which is resulted from the body force of soil sediments. However, in the region near the breakwater, contours of stress have been changed due to the weight of the structure. Compared with the deeper soil region, the value of the effective stress in the region near the seabed surface is lower, which indicates the sandy soil at the seabed surface can be more easier liquefied, as a result of the excess pore pressure more likely exceeding the reduced effective overburden pressure. As shown in Figure 4b, the seabed foundation beneath the breakwater moves downward clearly, due to the effect of self-weight of the breakwater. In the region far away from the structure, the magnitude of the vertical soil displacement is relatively small, which demonstrates that the influence of the breakwater in this region normally vanish. The symmetry feature can be seen from the distribution of both the mean normal effective stress and the vertical soil displacement around the center of the breakwater.

3.3. Dynamic Analysis of Wave-Breakwater-Seabed Interactions

The dynamic wave pressures on the seabed surface will cause subsequent pore-water pressures, stresses, and displacements in marine sediments. Herein, a numerical example for the water wave-driven transient pore water pressure, dynamic stresses, and soil displacements in a porous seabed is presented. The trend of cyclic soil response over time can be found in Figure 5, Figure 6 and Figure 7, respectively. As listed in Table 2, the breakwater is considered as an elastic material with a relatively large shear modulus G b = 1 × 10 9 N/m 2 . The corresponding Young’s Modulus is 2.48 × 10 9 N/m 2 , which leads to the structure being nearly close to be rigid.
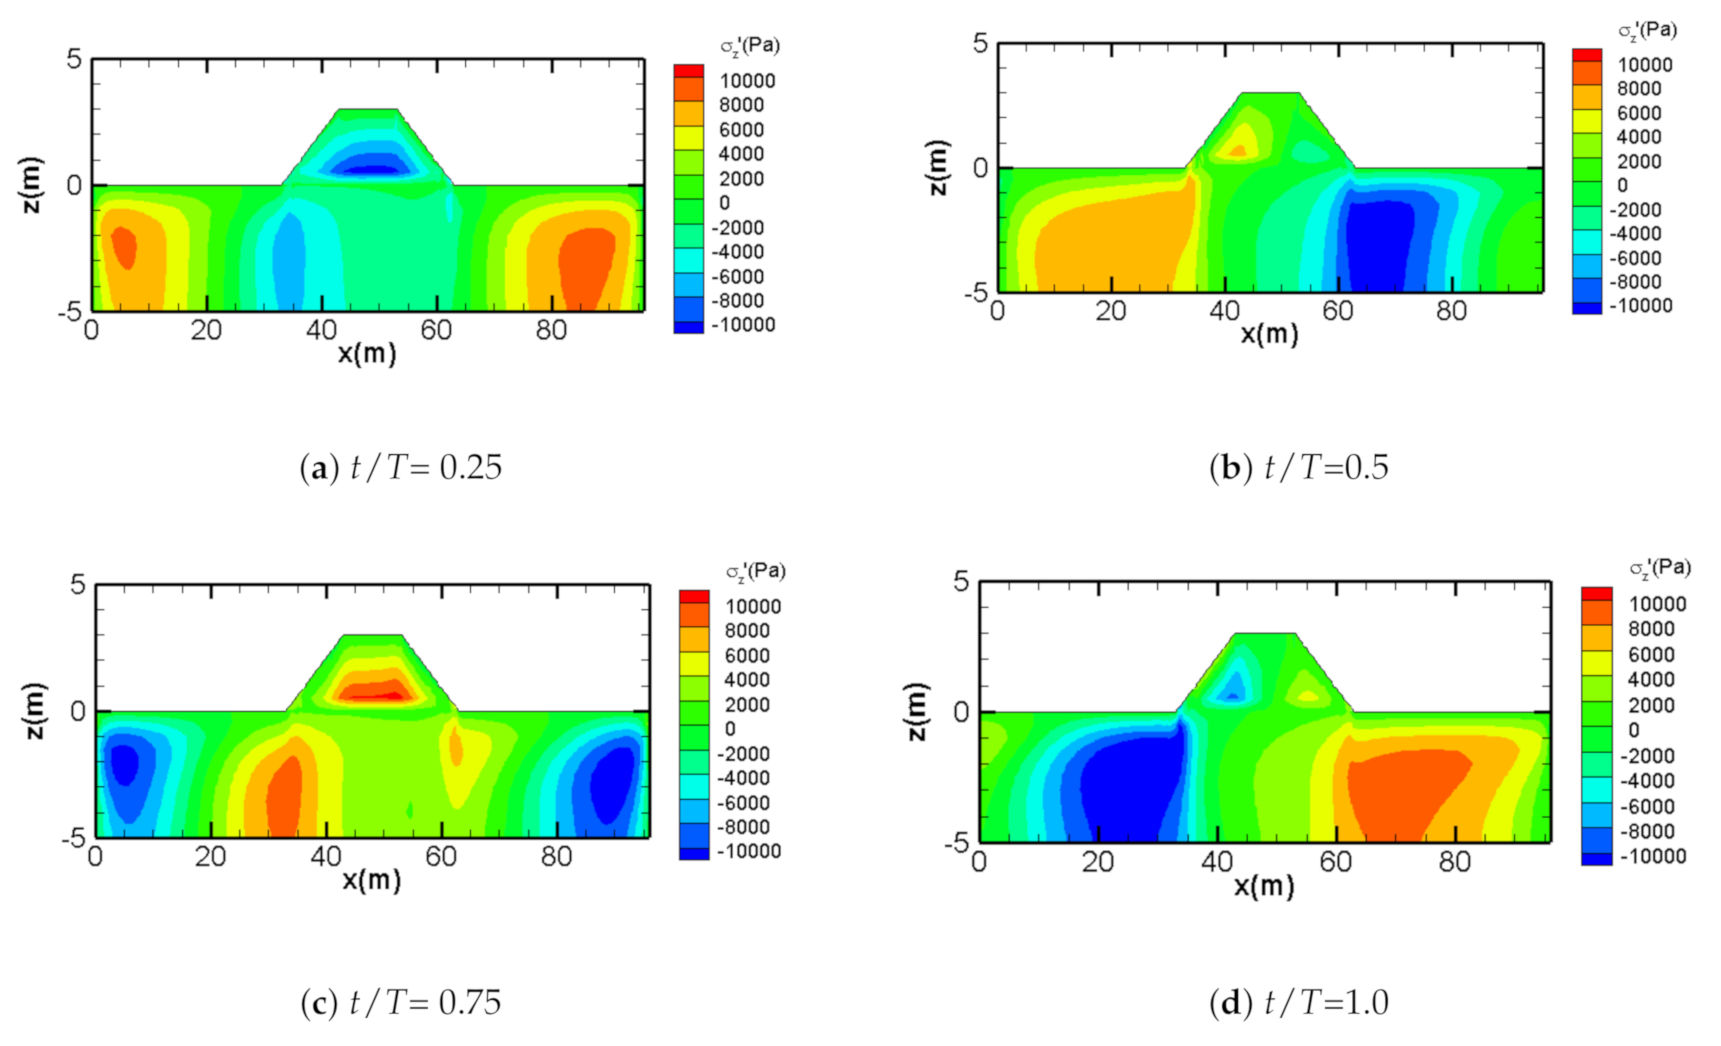
Figure 5 illustrates the distribution of pore water pressure in the computational domain at four different time phases, t / T = 0.25, t / T = 0.5, t / T = 0.75, and t / T = 1. The breakwater head experienced the wave crest at t / T = 0.25 and the wave trough at t / T = 0.75, separately. From Figure 5a and Figure 6a, it can be observed that the wave-induced pore pressure is positive under wave crest, with the associated dynamic vertical effective stress ( σ z ) being compressed. In contrast, from Figure 5c and Figure 6c, it can be found that the pore water pressure on breakwater head is negative under wave trough, and the associated σ z is tensile. It implies that the soil region is most likely to be liquefied under wave troughs rather than wave crests.
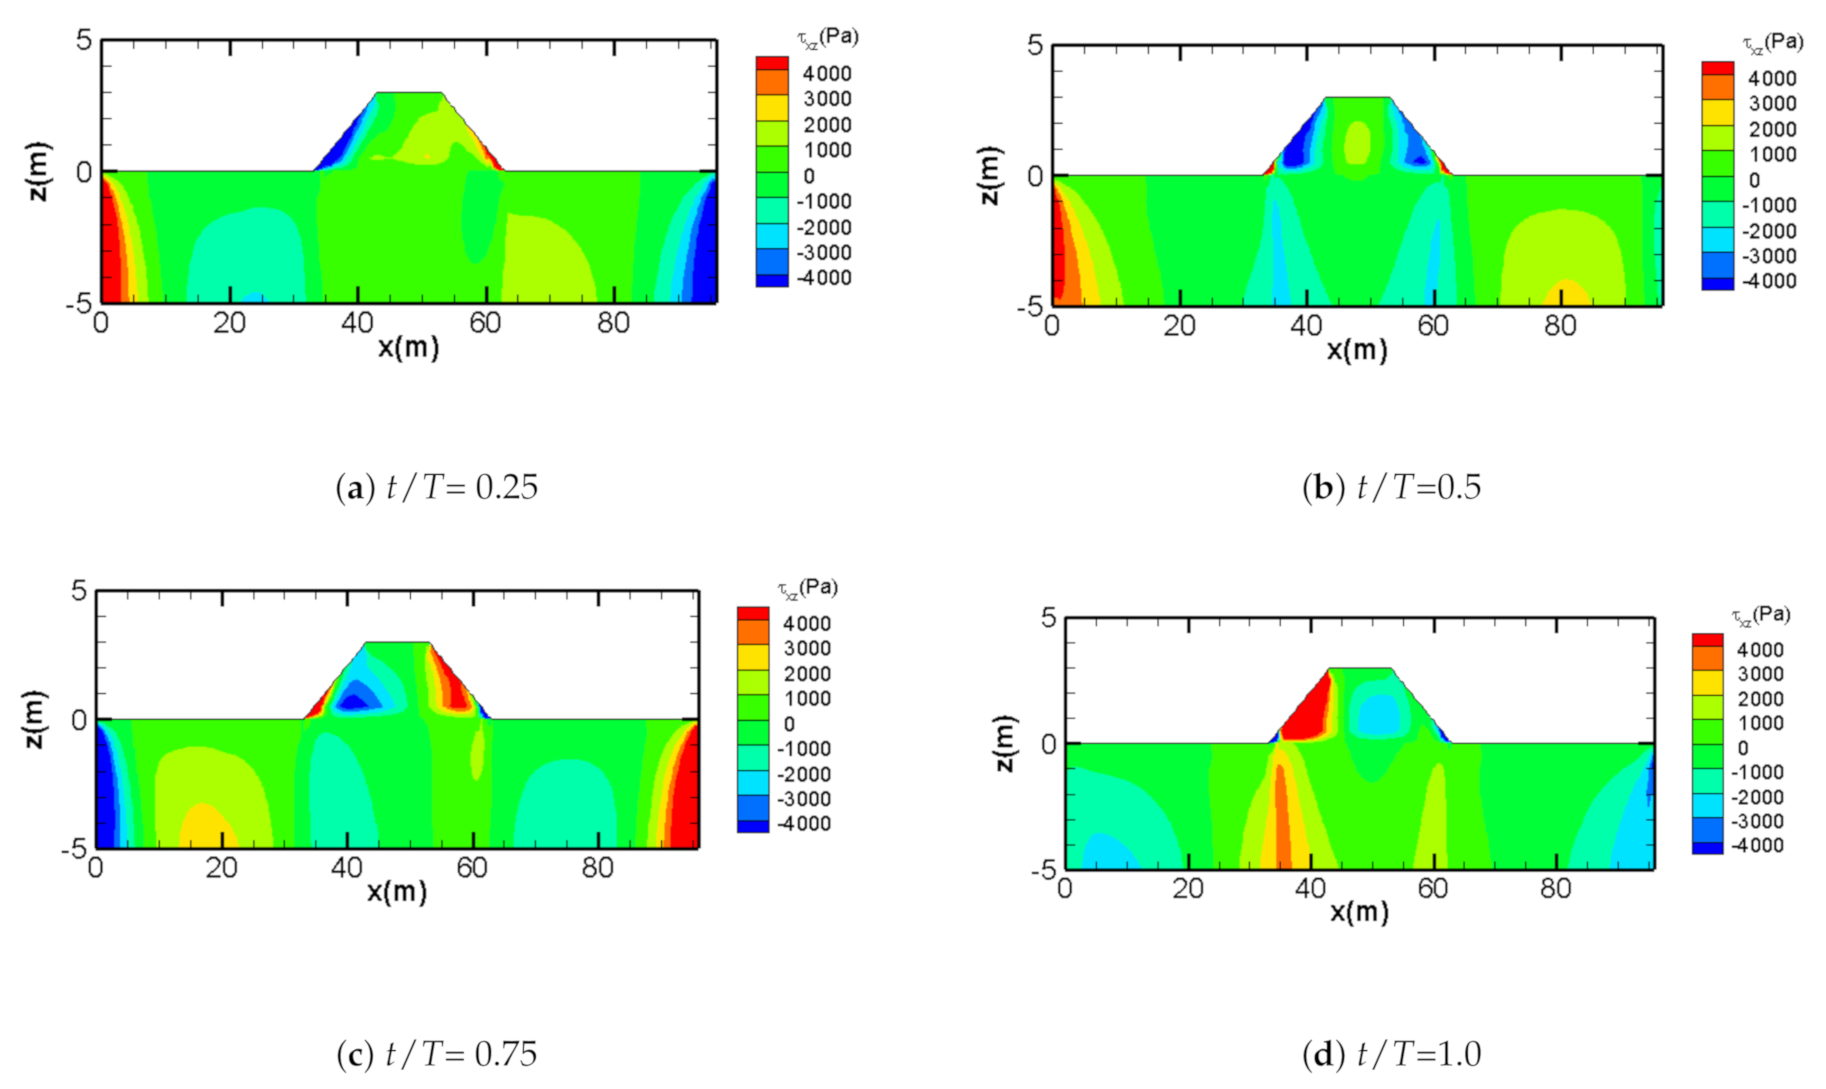
By comparing Figure 5 and Figure 7, it can be noticed that the wave-induced pore pressure is mainly concentrated in the region near seabed surface, while shear stress is more concentrated in deeper zone rather than shallow zone. The stress concentration beneath the submerged breakwater can be observed, no matter for dynamic effective stress or shear stress. This is attributed to the significant various stiffness at the interface between the soil foundation and the structure.
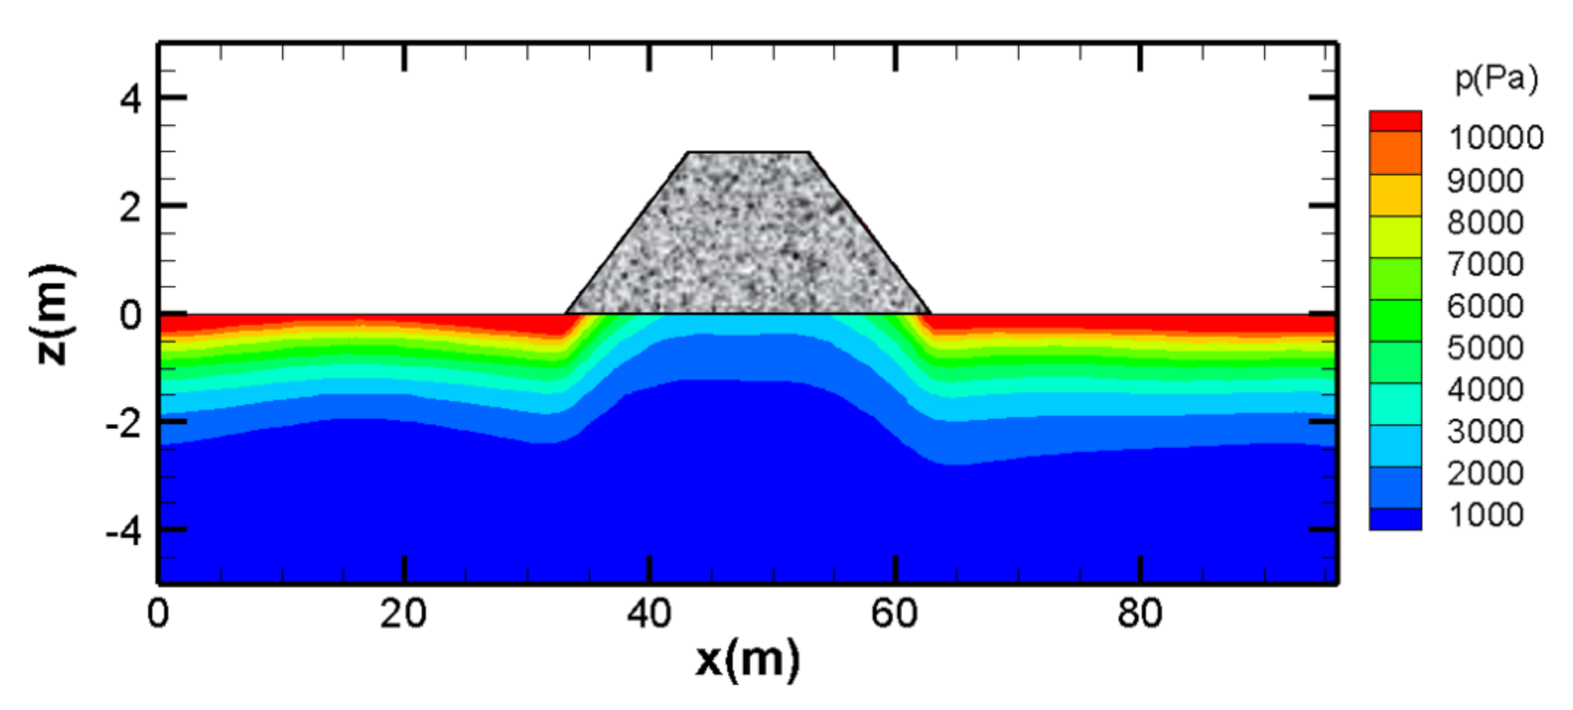
Distribution of maximum pore water pressures in the computational domain over soil depth is plotted in Figure 8. As shown in the figure, the distribution of the maximum pore pressure is generally layered with depth apart from the soil region under the breakwater, which reflects the impact of the submarine structure. The value of the wave driven maximum pore pressure is getting smaller as the soil depth deepens. Thus, the seabed surface is more easier to liquefy than the deep soil zone.

3.4. Effects of Wave Characteristics

The water wave-driven soil response in a sandy seabed around a marine structure can be affected significantly by wave characteristics [51,52,53,54]. Based on the proposed numerical seabed model, two key parameters are examined in this section: wave period (T) and wave height (H). Apart from the liquefaction depth in the vicinity of the breakwater, the distribution of the pore pressure over time on four representative points with different wave properties are compared in this section. Four points are selected in the vicinity of the breakwater, referring to Figure 3. Among these points, location A is inside the structure on the line of 1.5 m above the base of the breakwater. Points B, C, and D, of which the interval is 25 m, are embedded on the line of 1.5 m below the seabed surface. Varied wave period (T) and wave height (H) are analyzed with a fixed water depth (d = 11 m). Regarding the analysis for the wave-induced oscillatory soil liquefaction with varied wave characteristics, the seabed parameters are determined as: Poisson’s ration ( μ ) = 0.33; soil porosity (n) = 0.3; soil permeability (K) = 0.001 m/s; degree of saturation ( S r ) = 0.9.
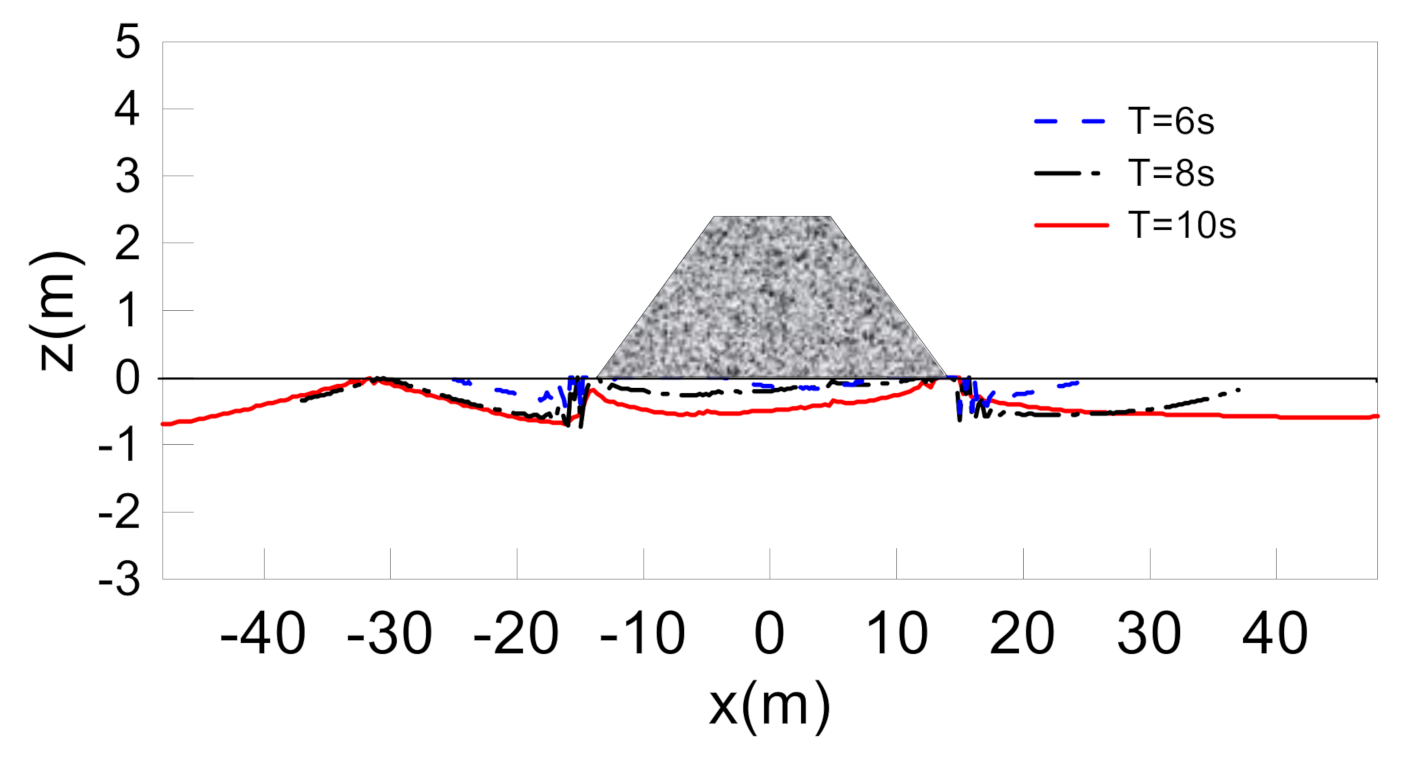
To investigate the effect of wave period (T) on the distributions of the wave driven pore pressures around the breakwater, other water properties are kept still constant, i.e., wave height (H) = 3 m. Three typical wave periods are selected here: 6 s, 8 s, and 10 s. In general, longer wave period can lead to a larger wave length and, subsequently, larger value of oscillatory pore water pressure in marine sediments. Figure 9 demonstrates the development of the liquefaction potential for the cases with varied wave period. It can be found that the liquefaction depth is deeper when the wave period is longer. The distribution of pore water pressure over time in one wave cycle at the four specified points, with respect to different wave periods, is depicted in Figure 10, from which it can be observed that the magnitude of pore pressure is getting larger with longer wave periods. It is interesting to note that significant phase lag occurs for locations B and D.
Wave height is another wave parameter affecting the wave force and energy acting on the breakwater and the seabed surface, subsequently affecting the wave-induced pore pressure and effective stresses in marine sediments. Three representative values of wave height (H) are chosen here: 2 m, 2.5 m, and 3 m. The wave period is determined as 10 s for this example. It should be noted that the wave height will vary in the process of the non-linear wave propagation. Therefore, the wave height mentioned here refers to the original incident wave height.
Figure 11 shows the distributions of the liquefaction depth in the vicinity of the submarine breakwater for various wave height. Two liquefied zones can be seen on both sides of the structure, where the shear strains are most significant. The liquefaction depth for the case with H3 m is deeper compared with that for cases with H = 2 m and H = 2.5 m, which denote that, the smaller the wave loading, the less likely to be liquefied for the soil foundation.
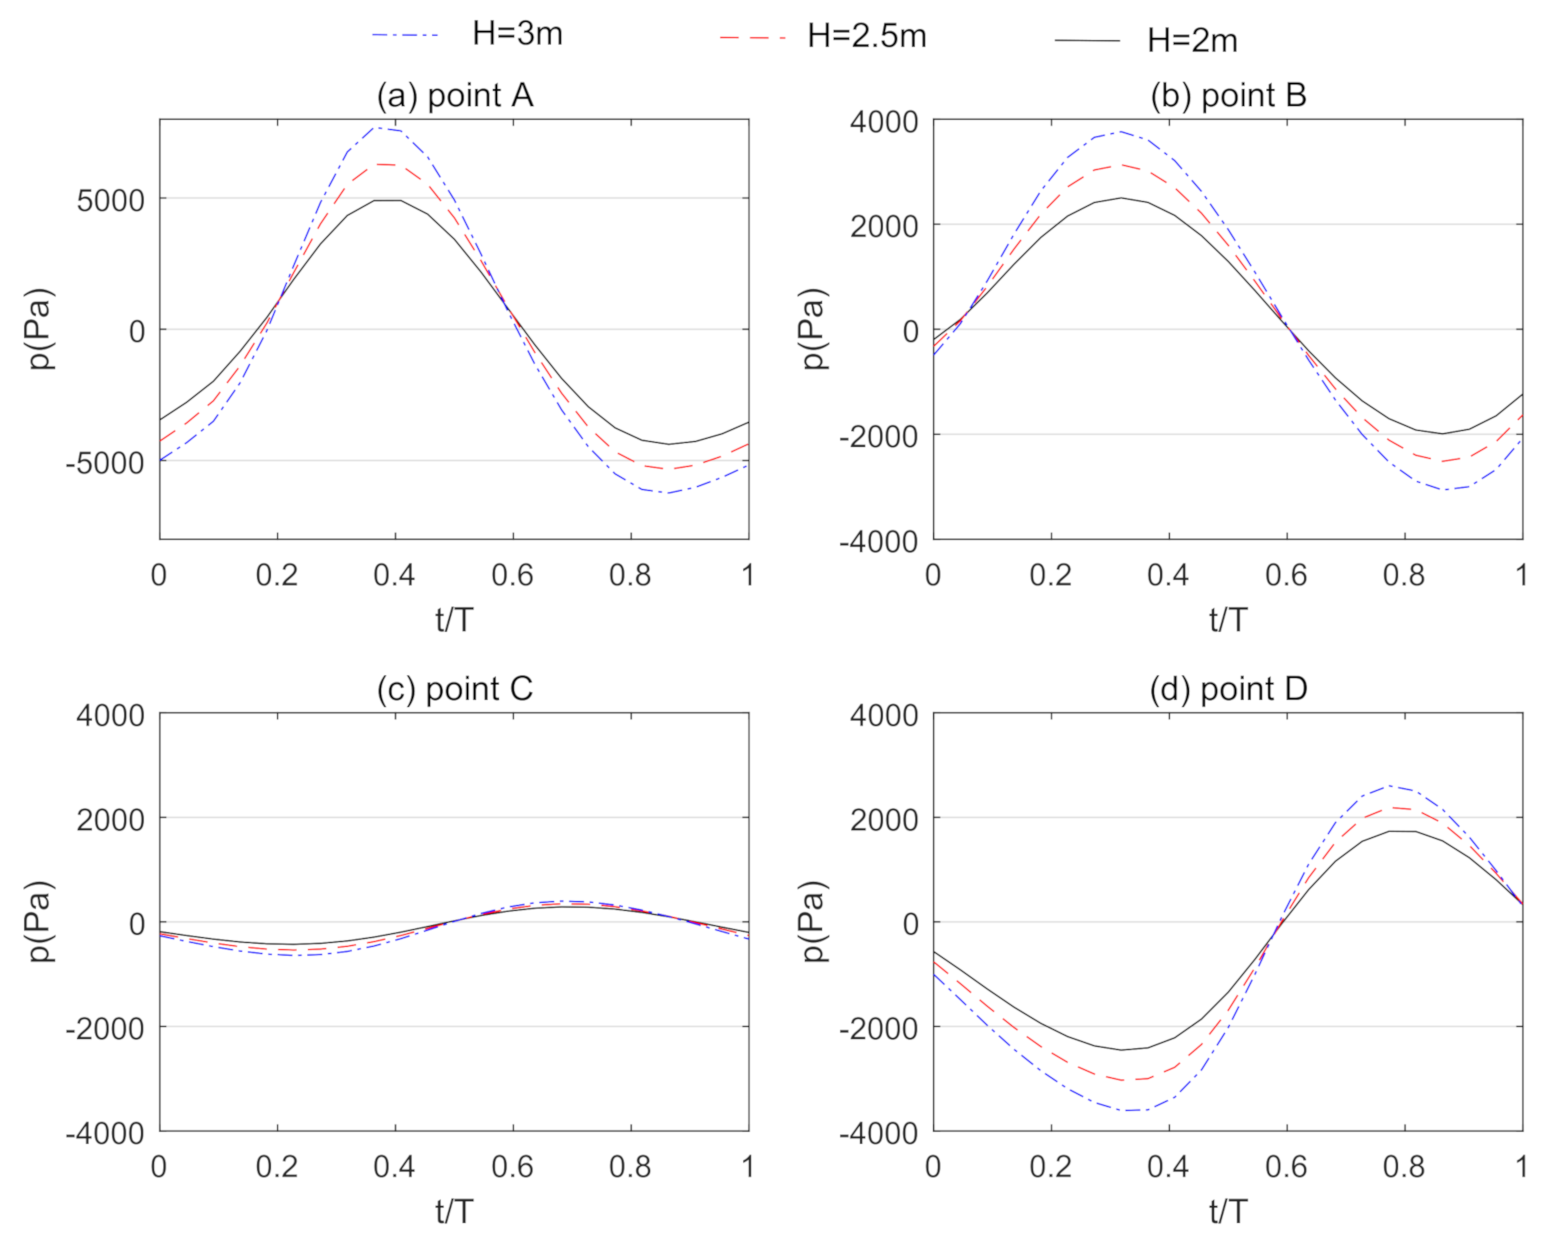
The distribution of the wave-induced pore pressure on marine sediments over time is illustrated in Figure 12. As shown in the figure, the pore pressures at these four specified points are periodic with time. The magnitude is getting larger when the wave height is larger. The value of the wave-induced pore pressure at point C is relatively small compared with that at locations B and D, which results from the position of B being directly below the breakwater.
Note that the wave parameters used in the above example are not near breaking wave conditions. This is to reduce the computational domain and time. For the extreme wave conditions, the present model can be applied but requires significant computation cost. Since the objective of this paper is the development of mesh-free method and its application, we only used non-breaking wave conditions as examples.

3.5. Effects of Soil Characteristics

This section further investigates the influence of soil properties on the wave-induced pore pressure and the liquefaction potential around the submarine breakwater. In the following examples, with height H = 3 m, period T = 10 s, and water depth d = 11 m are used. Among soil characteristics, two key parameters are selected here: soil permeability (K) and degree of saturation ( S r ). Similar to the examination with respect to wave properties, the liquefaction potential in the vicinity of the breakwater and the distribution of the wave-induced pore pressure over time at specified locations for cases with various soil characteristics are presented in this section. Referring to the following comparisons, the submarine breakwater properties are selected as: Possion’s ratio ( μ b ) = 0.24; porosity ( n b ) = 0.3; permeability ( K b ) = 0.01 m/s; shear modulus ( G b ) = 10 9 N/m 2 ; degree of saturation = 0.9.
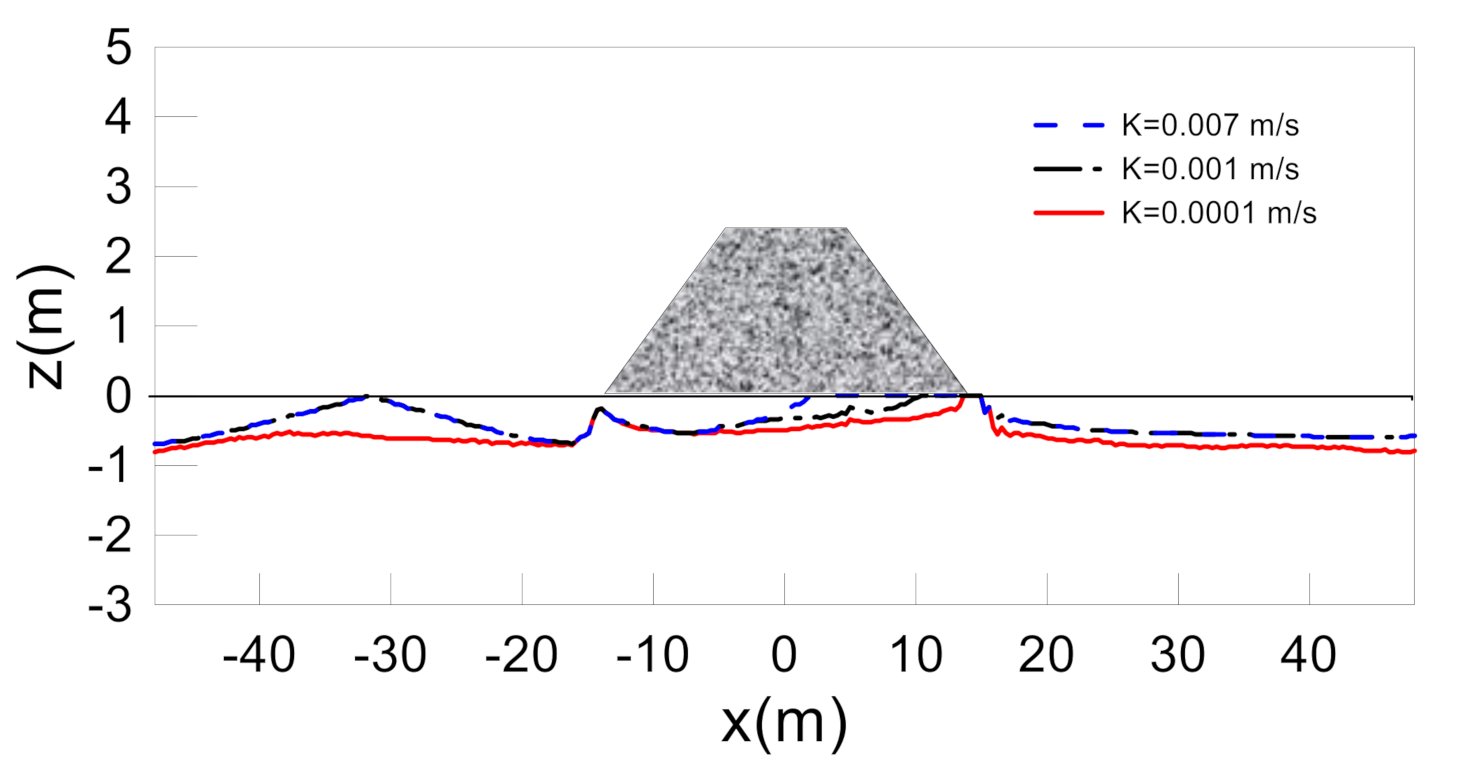
The soil permeability is an important soil parameter to measure the ability of soil to drain. The larger the soil permeability, the better the drainage capacity of the soil. Figure 13 shows the oscillatory soil liquefaction potential around the breakwater for cases with variable soil permeability. Three typical values are chosen for this comparison: 0.0001 m/s, 0.001 m/s, and 0.007 m/s. The degree of saturation is determined as 0.97 in this example. As illustrated in Figure 13, compared with the case with permeability K = 0.007 m/s, the liquefaction zone is relatively deep for the case with permeability K = 0.0001 m/s. This phenomenon indicates that the soil around the breakwater is more likely to be liquefied for the case with low permeability. It can also be observed that the liquefaction area in front of the submarine breakwater is larger than that behind the breakwater, which is attributed to the increment of wave energy in front of the breakwater induced by wave reflection and wave energy dissipation behind the breakwater due to the wave-structure interaction.
The distribution of the wave-induced pore pressure s in the breakwater and marine sediments with respect to different soil permeability (K) is presented in Figure 14. Compared with the magnitude of the pore pressure at locations B, C, and D, that at location A has no significant difference for cases with various soil permeability. This is resulted from point A locating inside the breakwater not in the soil region. Due to point C embedded below the structure, the magnitude of the wave-induced pore pressure at C is relatively small compared to that at points B and D. It can be found that the wave-driven pore water pressure in soil increases with increasing soil permeability.
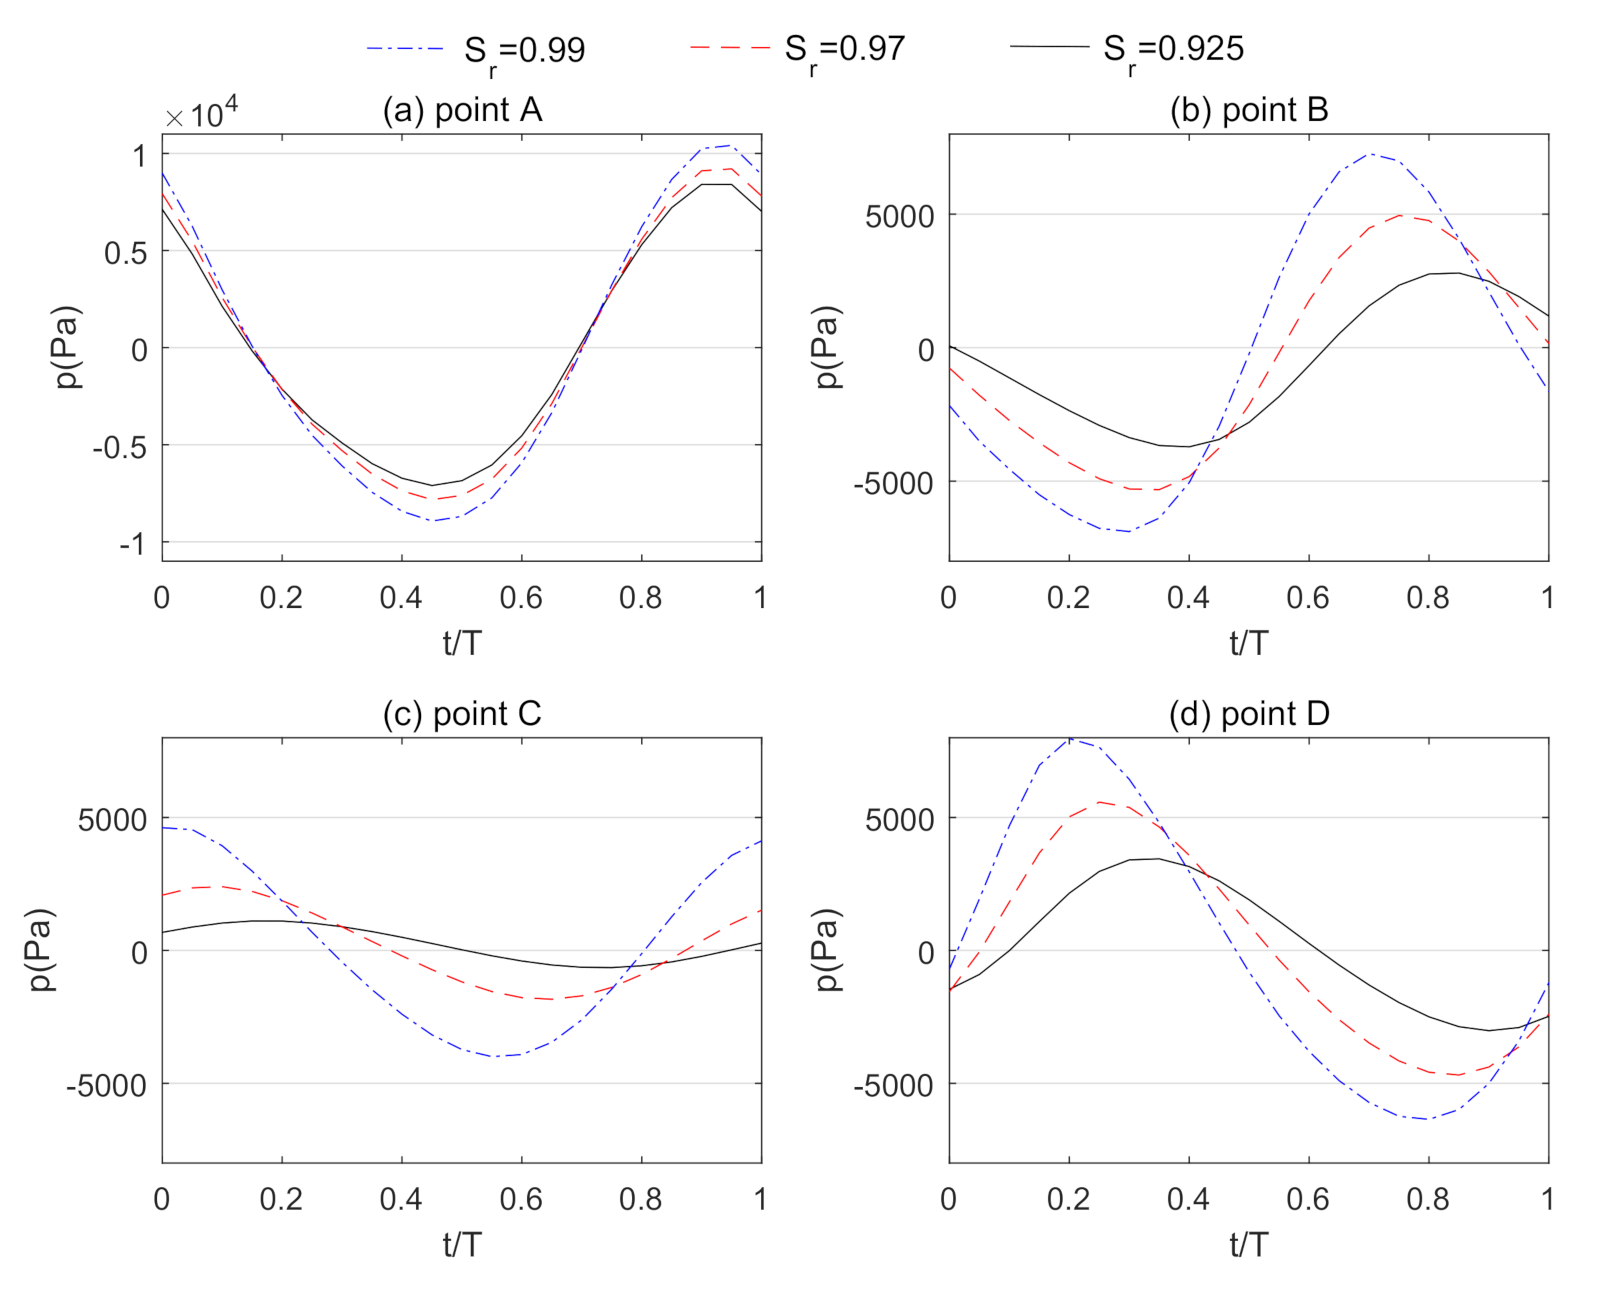
It has been reported in the literature [20] that the degree of saturation can also significantly affect the wave-driven soil response around a breakwater. The soil permeability is determined as 0.001 m/s in this example. Three values of degree of saturation are compared here: 0.925, 0.97, and 0.99. From Figure 15, it can be found that the liquefaction potential in the vicinity of the breakwater develops larger for the case with lower degree of saturation. When degree of saturation is setup as 0.99, there is no liquefaction zone behind the structure, indicating the influence of the breakwater on the wave field. Figure 16 illustrates the effect of soil degree of saturation on the wave-induced pore water pressure. The comparison between the three cases with varied soil degree of saturation at point A implies that the change on soil parameter can affect the wave-induced response inside the breakwater slightly. It can be observed that large soil degree of saturation can result in large pore water pressure.

4. Irregular Wave-Induced Soil Response around a Submerged Breakwater

In natural marine environments, irregular waves are normally observed, rather than regular waves. However, the issue of irregular waves for the wave-seabed-structure interactions (WSSI) has not been addressed in detail yet. Thus, it is still essential to investigate the mechanism of WSSI around a breakwater under irregular wave loading. In this section, the analysis of the random wave-induced soil response in the vicinity of the submerged breakwater is presented. The input data for the following numerical examples are given in Table 3.

4.1. Irregular Wave Model: JONSWAP Spectrum and B-M Spectrum

In addition to the regular waves, irregular wave loading was simulated in the present study. Two spectra, JONSWAP spectrum and B-M spectrum, are considered in this section. Numerous wave spectra have been reported in the literature with their advantages and limitations [55]. The objective of this section is to demonstrate the possible application of the present mesh-free model. Therefore, the JONSWAP and B-M spectra are selected as the first approximation. For different specific sites, different spectrum is required.
Based on the irregular wave theory [55], the water surface elevation can be interpreted as
η ( x , t ) = i = 1 a i cos ( k i x 2 π f ˜ i t + ϵ i ) i = 1 M a i cos ( k i x 2 π f ˜ i t + ϵ i ) ,
where M is a sufficiently large number; a i denotes the amplitude of the i-th wave component; f ˜ i is the i-th representative frequency, and ϵ i is a random initial phase angle distributed in the range of (0, 2 π ). Based on the dispersion equation, the wave number of the i-th wave component k i can be obtained by substituting the relevant significant frequency f ˜ i and water depth d to
( 2 π f ˜ i ) 2 = g k i tanh k i d .
The amplitude of the i-th component a i is determined from a given function related to the frequency spectrum S ( f ) , which is
a i = 2 S ( f ˜ i ) Δ f i , f ˜ i = f i + f i 1 2 , Δ f i = f i f i 1 .
This study uses two commonly frequency spectrum, B-M spectrum and JONSWAP spectrum, to further examine the WSSI under random wave loading. These two standard frequency spectral density functions are summarized here [55]:
  • B-M spectrum:
    S ( f ) = 0.257 H 1 / 3 2 T 1 / 3 4 f 5 exp [ 1.03 ( T 1 / 3 f ) 4 ] ,
    with H 1 / 3 and T 1 / 3 being the highest one-third wave height and the relevant wave period, significantly, which are recognized as significant wave height and wave period, respectively.
  • JONSWAP spectrum:
    S ( f ) = β J H 1 / 3 2 T P 4 f 5 exp [ 1.25 ( T P f ) 4 ] γ exp [ ( T P f 1 ) 2 / 2 σ 2 ] ,
    with
    β J = 0.0624 0.230 + 0.0336 γ 0.185 ( 1.9 + γ ) 1 × [ 1.094 0.01915 ln γ ] ,
    T P = T 1 / 3 [ 1 0.132 ( γ + 0.2 ) 0.559 ] ,
    σ = σ a : f f P σ b : f f P ,
    γ = 1 7 ( mean of 3.3 ) , σ a = 0.07 , σ b = 0.09 ,
    where T P means the peak period correlate with the frequency f P at the spectrum peak ( f P = 1 / T P ). The JONSWAP spectrum is characterized by the peak enhancement factor γ , which controls the sharpness of the spectral peak [56]. In the present study, the mean value of γ = 3.3 is used.
It is worthwhile to examine the difference of the dynamic soil behavior under random waves and corresponding regular waves. Thus, how to define the appropriate regular wave properties including the corresponding random wave characteristics is significant for a sufficient comparison. The representative wave height H r and wave period T r have been commonly used for the comparison with the irregular wave results, in which H r can be determined as the equivalent sinusoidal wave height of the corresponding random waves as
H r = H 1 / 3 2 ,
and T r denotes the mean zero-upcrossing period of a irregular wave record, which can be interpreted from the frequency spectra S ( f ) defined by Goda [55]:
T r = T ¯ = m 0 / m 2 ,
m n = 0 f n S ( f ) d f , n = 0 , 2 ,
in which m n represents the n-th spectral moment. By applying the above formulas, for B-M spectrum with H 1 / 3 = 5 m and T 1 / 3 = 11 s, the corresponding representative wave height and wave period are H r = 3.5 s and T r = 8.2 s, respectively; for JONSWAP spectrum with H 1 / 3 = 3 m and T 1 / 3 = 10 s, the corresponding representative wave height and wave period are H r = 2.1 m and T r = 7.7 s, respectively. Note that the parameter values used in the examples are class ones within the classic range given in Goda [55]. For different sites, appropriate parameter values will be required through the field observations.

4.2. Comparison with the Previous Solution with Irregular Wave Loading

To evaluate model performance, there are several static indexes that have been proposed in the literature, for example, Kling-Gupta efficiency in Reference [57,58,59,60,61,62,63]. These indexes have been commonly used for flooding or hydrological processes, rather than coastal engineering. In this study, since there is no experimental data for irregular wave-induced soil response available for the validation of the present model, we can only compare the results obtained from the present model with the existing semi-analytical solution for irregular wave-induced soil response [56]. The applications of other statistic indexes to evaluate the performance of the present model can be carried out in a future study.
Liu and Jeng [56]’s was the first attempt considering the irregular wave loading in the problem of wave-seabed interaction, in which they adopted the analytical solution for the regular wave-induced soil response [64] with irregular wave theory. Later, Xu and Dong [65] further investigated the random wave-induced seabed liquefaction. In this study, we generated the irregular wave loading by given spectrum in IHFOAM [32]. Before applying the irregular wave loading defined in previous context to investigate the random wave-induced soil response, the essential step is to assure the efficiency of the present numerical results. A validation was conducted to compare the calculated wave frequency spectrum by using Equations (50) and (51) with the predicted frequency spectrum which is obtained from the simulated wave profile by adopting the auto-correlation method.
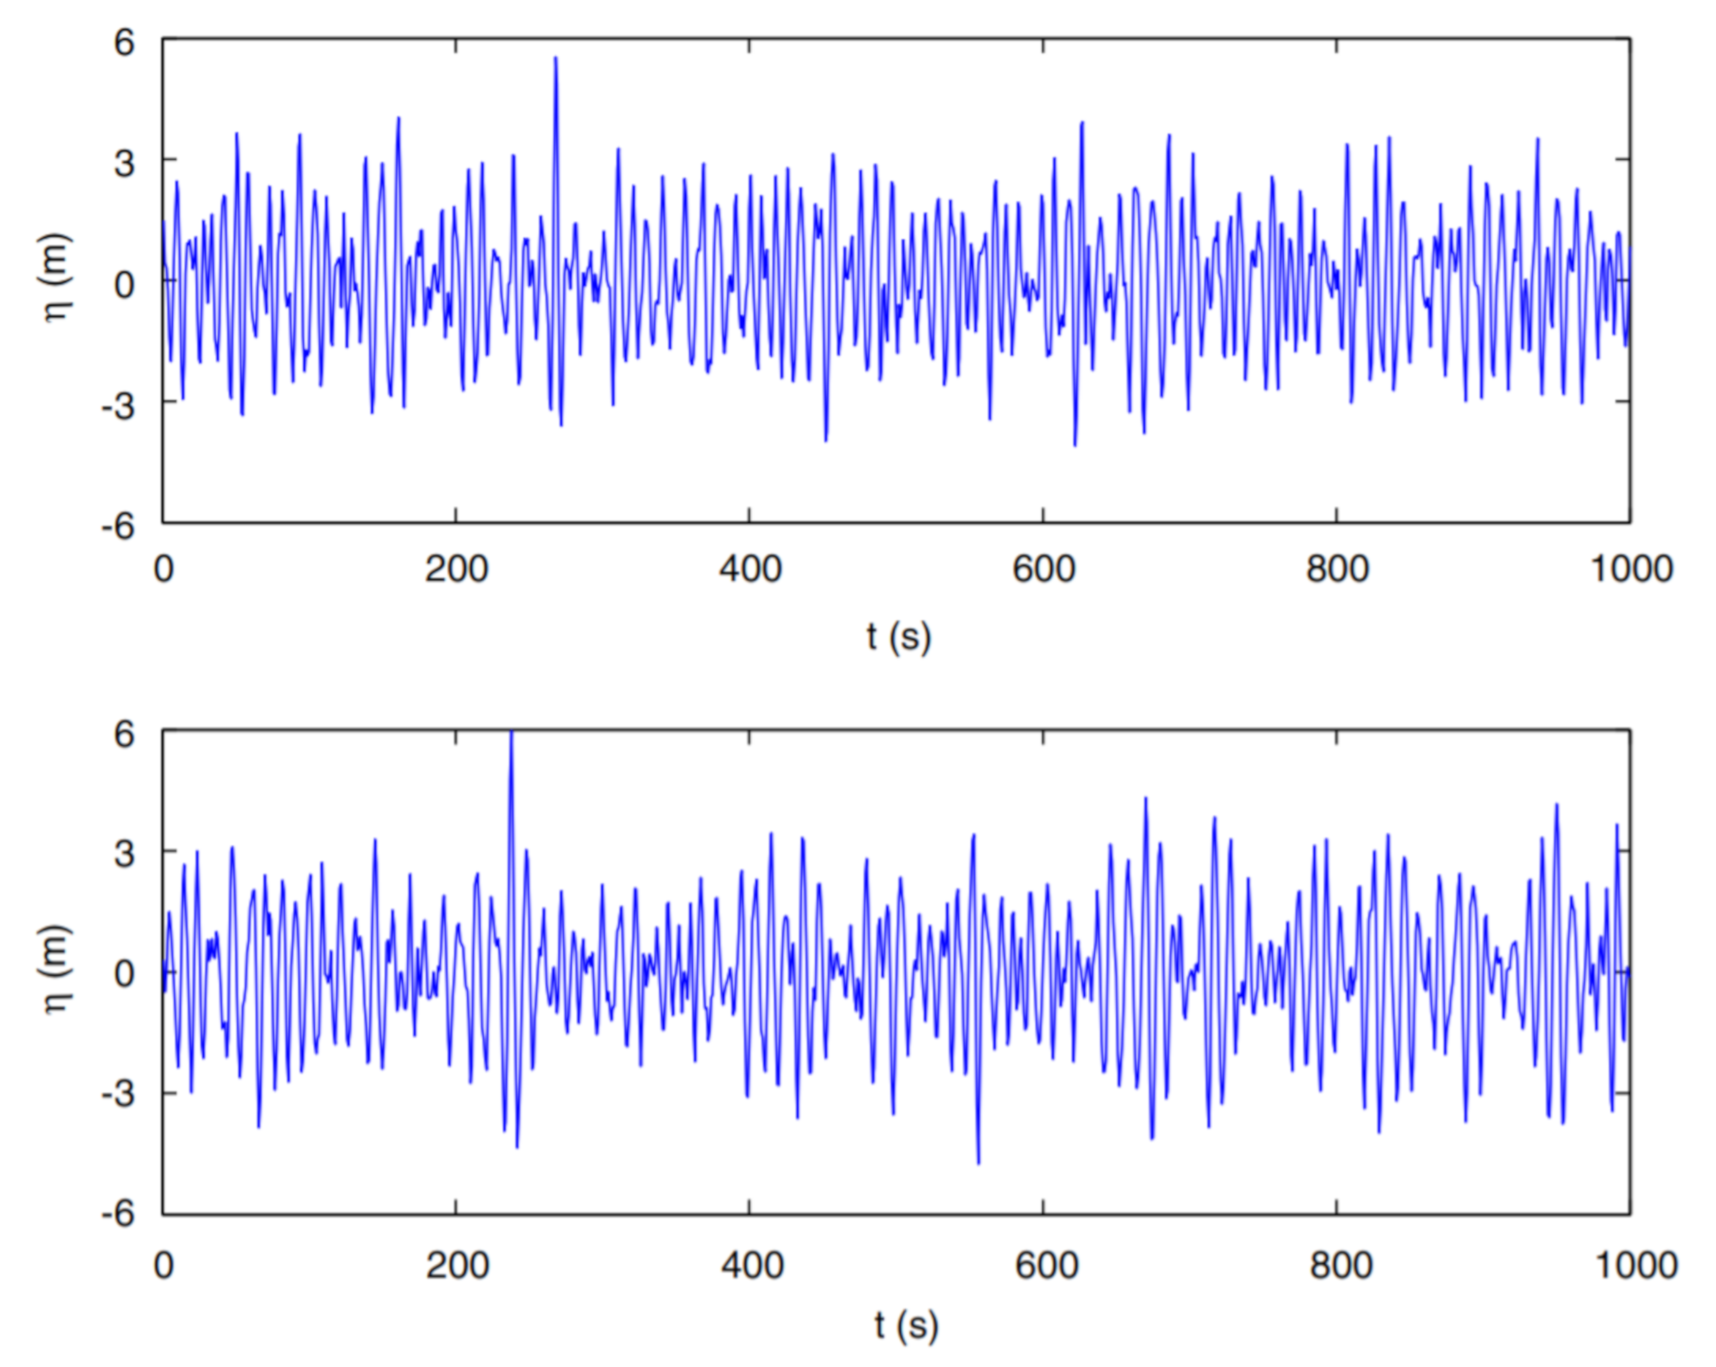
The time history of the water elevation η at the fixed node x = 0 is depicted in Figure 17 [56]. The upper panel represents the water elevation for B-M spectrum, while the lower panel is for JONSWAP spectrum. The irregularity of water surface induced by the characteristics of random waves can be clearly seen from this figure. In this comparison, the water depth is determined as 25 m, and the significant wave height H 1 / 3 and wave period T 1 / 3 are presumed to be 6 m and 10 s, respectively. Figure 17 shows the simulated random wave profile for both B-M spectrum and JONSWAP spectrum. The whole range of wave frequency is estimated to be distributed in (0, 0.5 Hz). The simulated random wave system is assumed to consist of 101 linear wave components. For these two spectrum, the peak frequency f P is almost equal to the significant frequency ( f 1 / 3 = 1 / T 1 / 3 = 0.1 Hz), where the wave energy concentrates. It is noted that for a JONSWAP spectrum with peak enhancement factor γ = 3.3 , the peak spectra value is approximately 2.2 times of that for B-M spectrum, which indicates more wave energy concentrating and corresponding larger wave pressures for the JONSWAP spectrum. Note that the above discussions are based on the parameter values used in the spectra, rather than a specific site. Further applied to the realistic condition, the parameter values for the spectrum can be obtained from the field observations in the specific site.
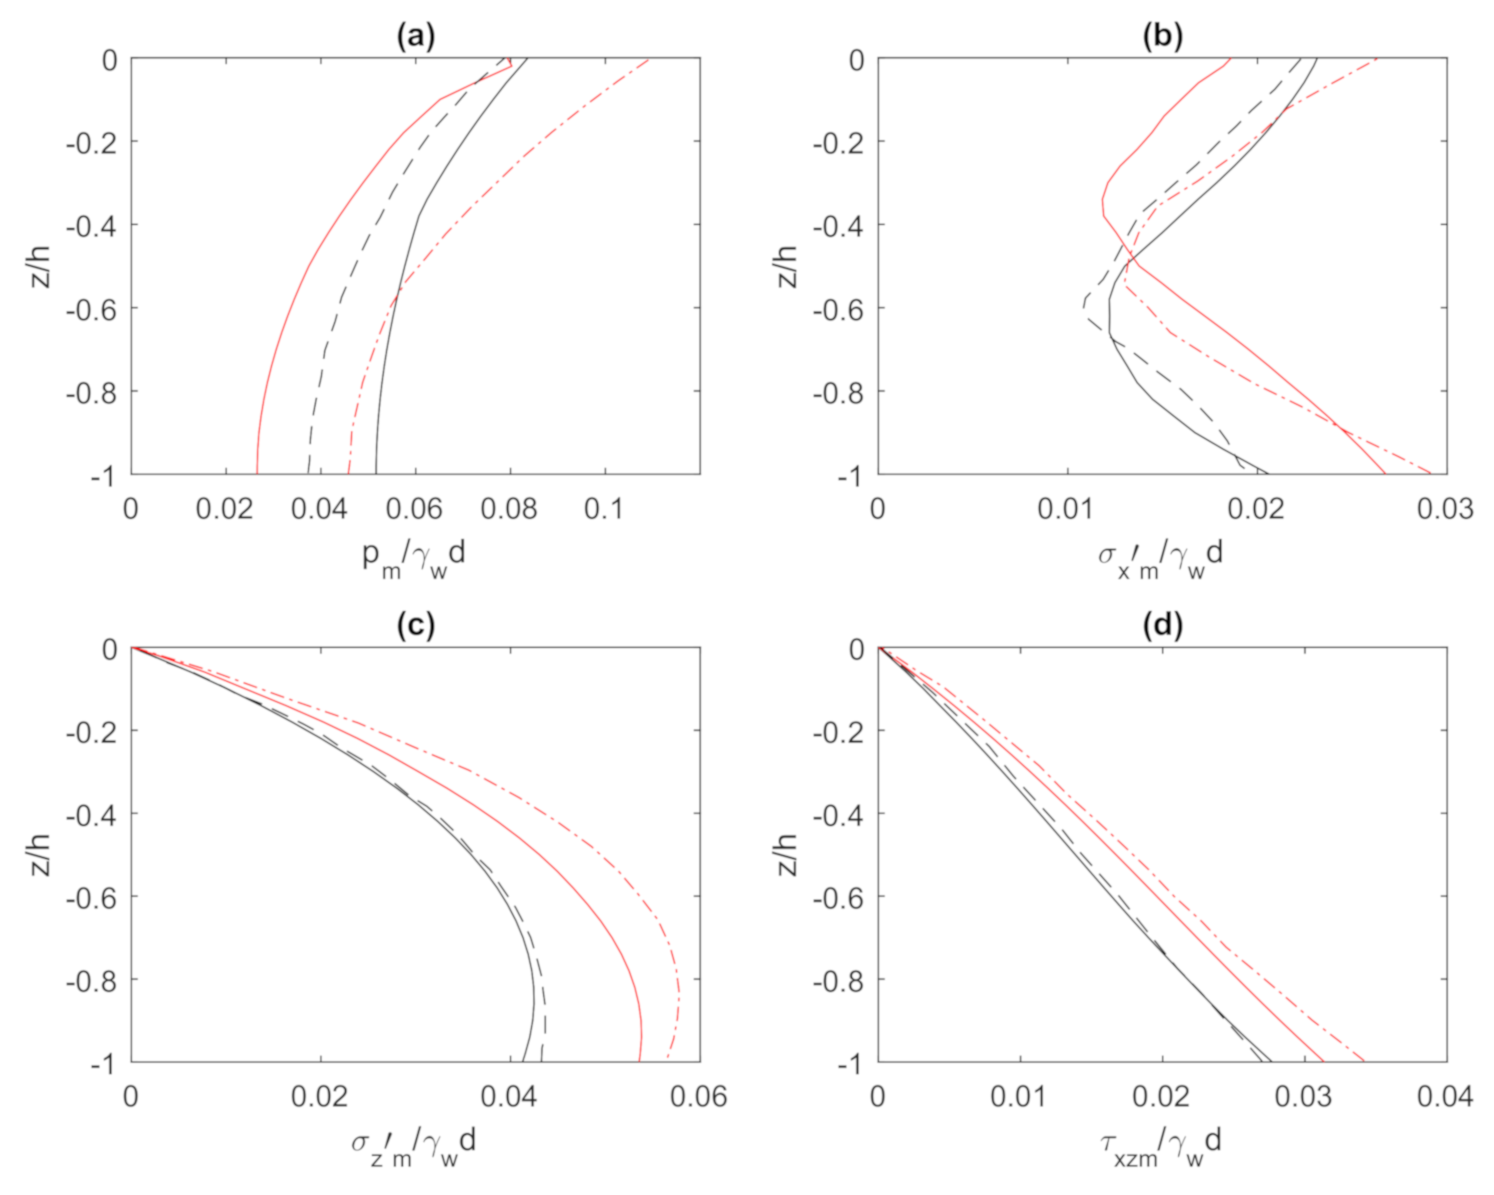
Figure 18 shows the comparison between the present results and the semi-analytical solution [56] for the maximum pore water pressure, effective normal stresses, and shear stress under random waves including B-M and JONSWAP spectrum. Black lines denote the soil behaviors under B-M random wave loading, and red lines represent the soil response under JONSWAP wave loading. It can be observed that the distribution tendencies under these two random waves are the same. The soil response under the JONSWAP wave loading is generally greater than that under B-M wave loading, which is consistent with the conclusion obtained from Figure 17. Although some differences can be seen from Figure 18, the comparisons of effective stresses and shear stress present a good consistent tendency for both the B-M and JONSWAP spectrum. There are some reasons that can explain the cause of the difference between the semi-analytical solution and the present model. First, the wave generation of Liu and Jeng [56] was based on linear wave theory, while the present model was based on the second-order Stokes wave theory. Second, the seabed model used in Liu and Jeng [56] was based on linear superposition of the results of analytical solution for regular waves, while the present model directly solved the boundary value problem without the superposition of linear components. These could be the main causes of the differences in the comparison presented in Figure 18. Further validation of the present model against experimental data can be done when the data are available in the future.

4.3. Soil Response around a Submerged Breakwater with Irregular Wave Loading

As an example, the JONSWAP spectrum is adopted for the irregular wave-induced soil response around the breakwater. In this case, the significant wave height H 1 / 3 and wave period T 1 / 3 are considered as 3 m and 10 s, respectively, and the water depth is 11 m.
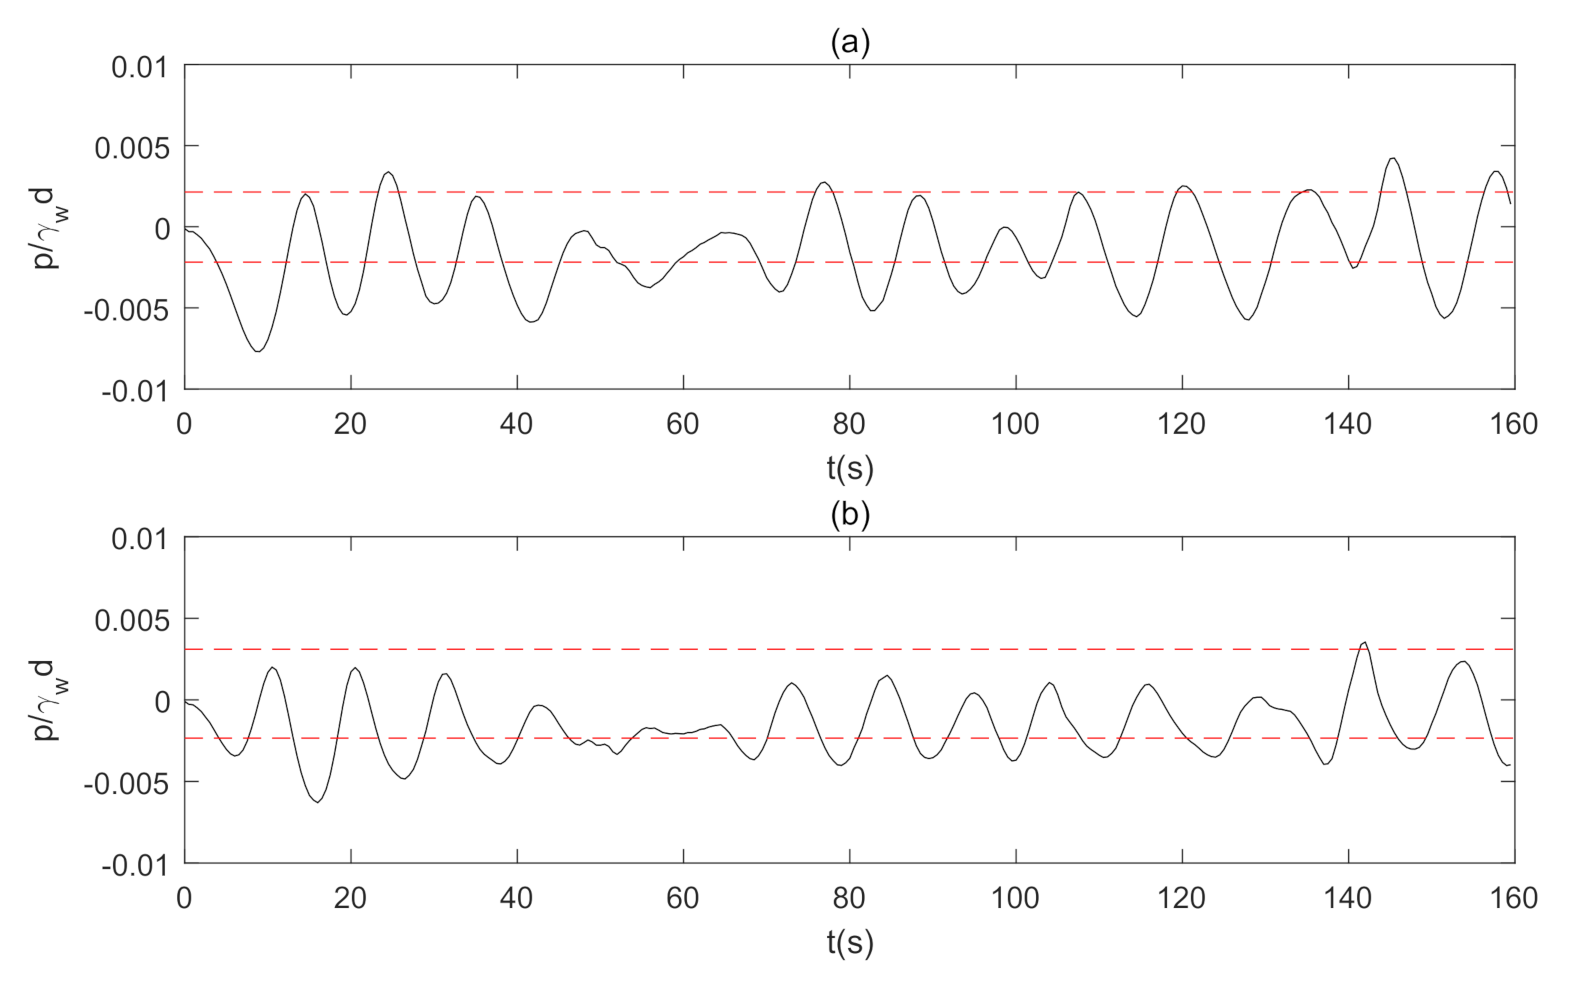
Figure 19 illustrates the distribution of time versus varying normalized pore pressure at two levels by using JONSWAP spectrum. (a) refers to z = 0.5 h , and (b) refers to z = h . Solid lines denote the irregular wave-induced pore water pressure, and the horizontal dashed lines represent the pore pressure range under the corresponding representative regular wave loading. For the marine sediments beneath the breakwater, the degree of saturation S r and permeability k s are 0.98 and 0.007 m/s, respectively. In this comparison, the significant wave height and wave period are H 1 / 3 = 3 m and T 1 / 3 = 10 s, respectively. By employing the definition of representative regular wave, (56) and (Section 4.1), the corresponding wave height and wave period are determined as H r = 2.1 m and T r = 7.7 s, respectively. From this figure, the irregularity of the pore water pressure distribution induced by the wave randomness is clearly observed. Comparing the magnitude of the normalized pore pressure at z = 0.5 h and z = h , it can be observed that the pore pressure is decreasing when the soil depth is become deep.
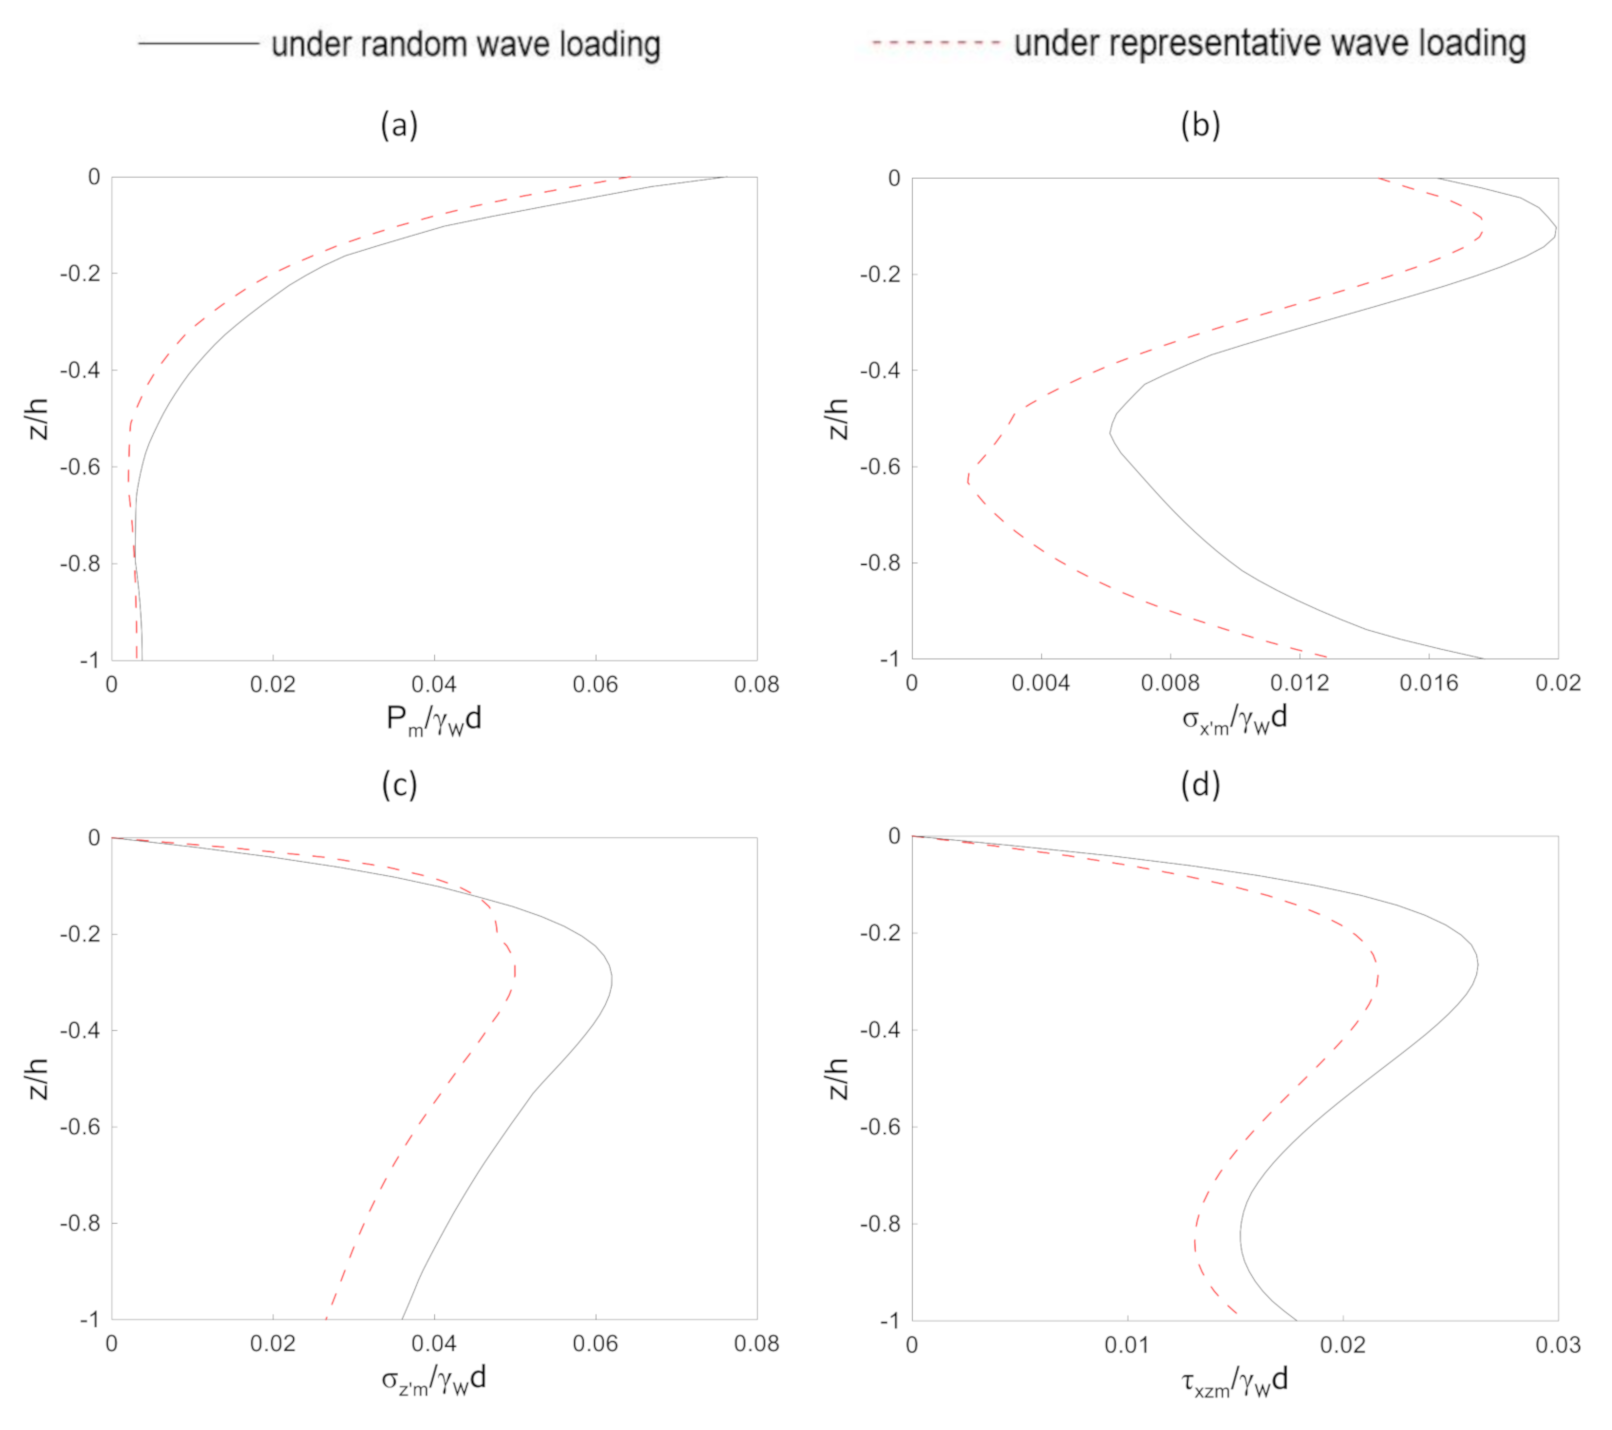
It is essential to examine the vertical distribution of the maximum soil response for engineering practice. Taking the wave and soil properties mentioned in Figure 19 into account, the numerical results, such as pore water pressure, effective normal stresses, and shear stresses, under the random wave loading, are illustrated in Figure 20. The solid line and dashed line denote the soil response under random wave loading and the corresponding representative wave loading, respectively. It can be seen that the distribution trend of the soil response is same for these two waves; for example, the vertical effective normal stress σ z m increases and then attenuates with the increase of soil depth. However, owing to the characteristics of random waves, the maximum random wave-driven soil response is larger than the soil response under the corresponding representative regular wave loading from a whole. It can be seen that the horizontal effective normal stress and shear stress increases and attenuates and then increases with the increase of soil depth, which is caused by the seabed thickness being considered as limited and the bottom of the seabed being impermeable.

4.4. Parametric Study

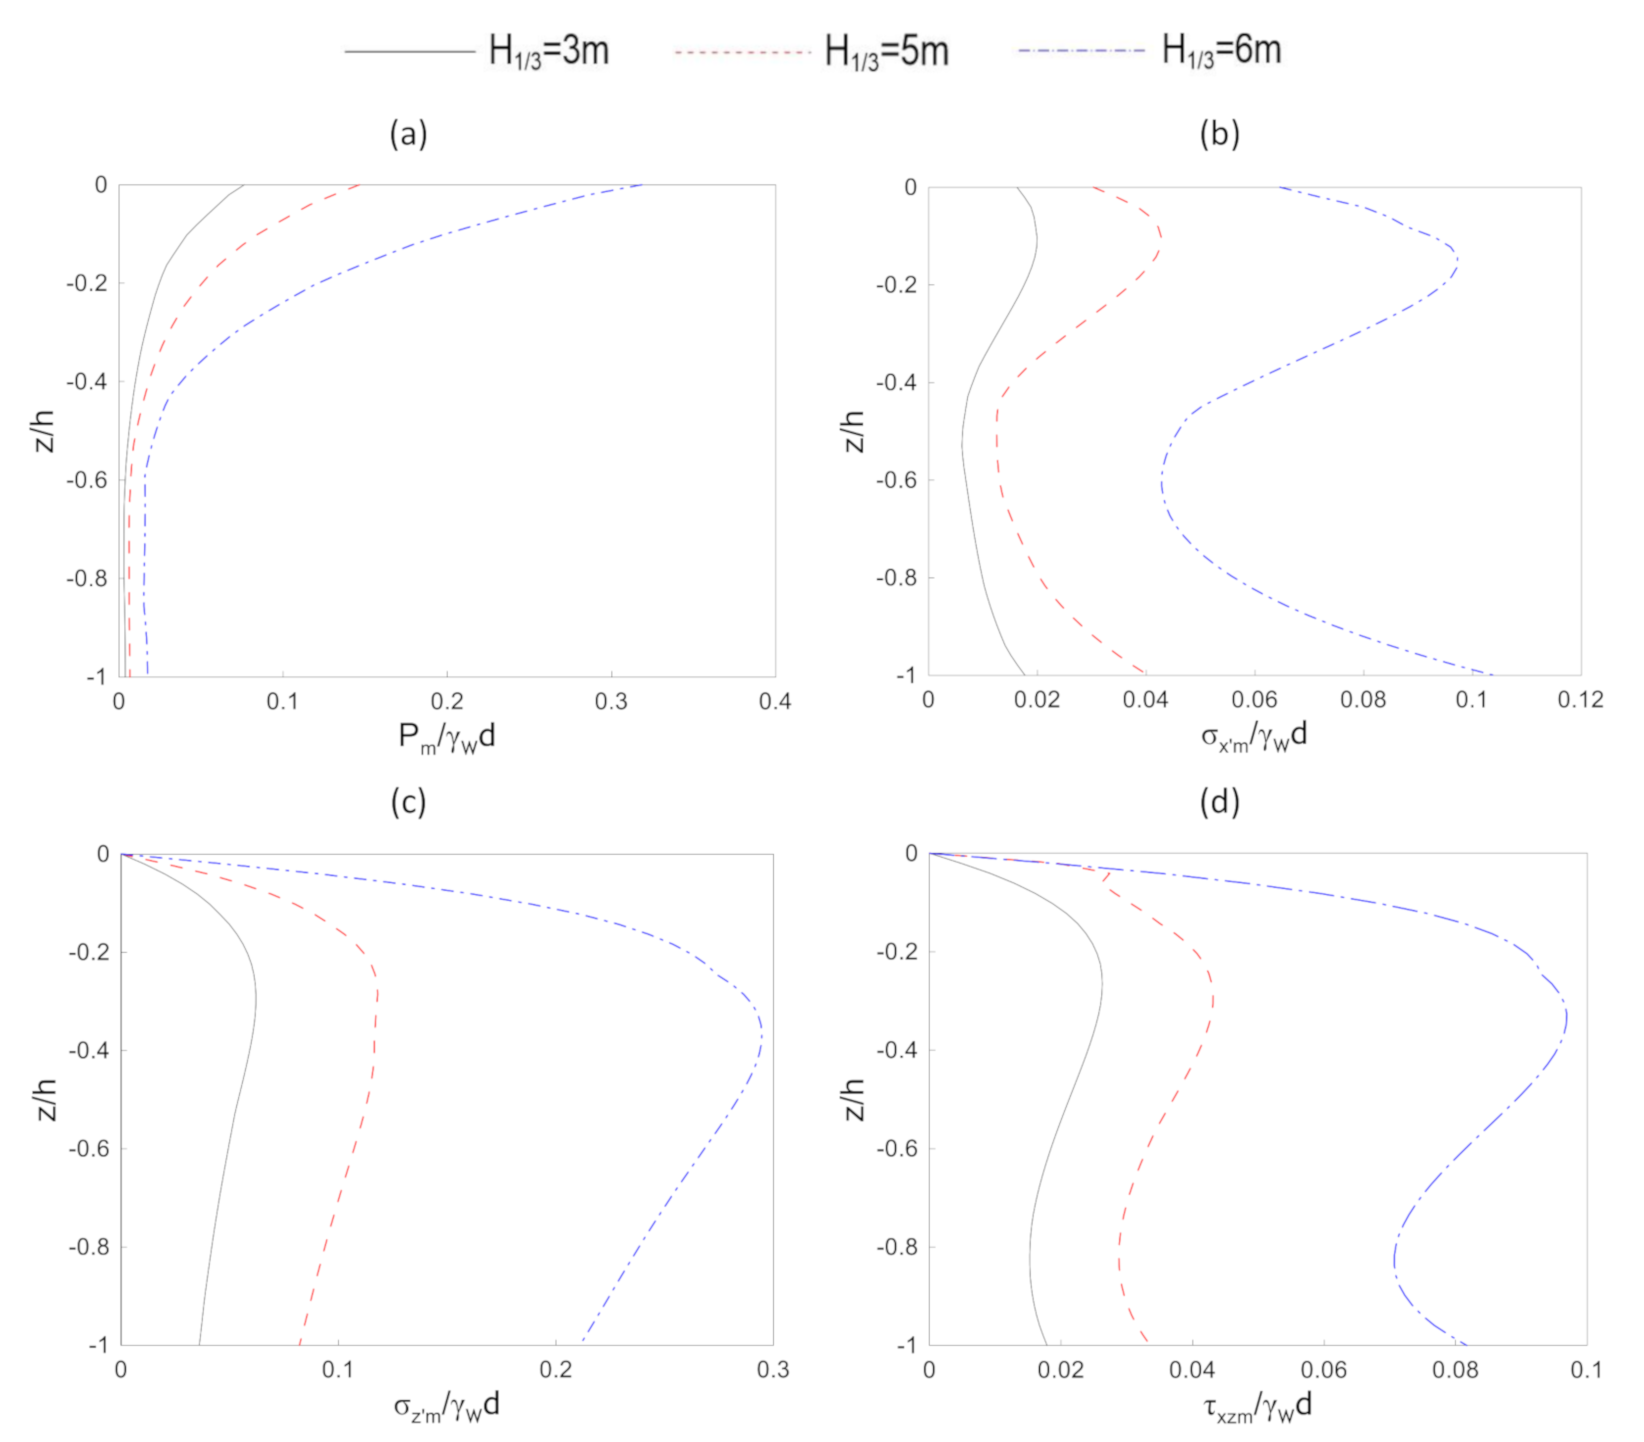
In this section, we further examine how wave properties affect the irregular wave-induced soil response around the breakwater. Figure 21 illustrates the variation caused by significant wave height H 1 / 3 on the vertical distribution of irregular wave-driven pore water pressure and stresses. Three significant wave height H 1 / 3 are examined here: 3 m, 5 m, and 6 m. The significant wave period T 1 / 3 is determined as 10 s. Under the premise of keeping the significant wave period as a constant, increasing the significant wave height will increase the random wave energy considerably. It can be concluded that the random wave-induced maximum pore water pressure, both horizontal and vertical, effective normal stresses, and shear stress increase as the significant wave height increases.
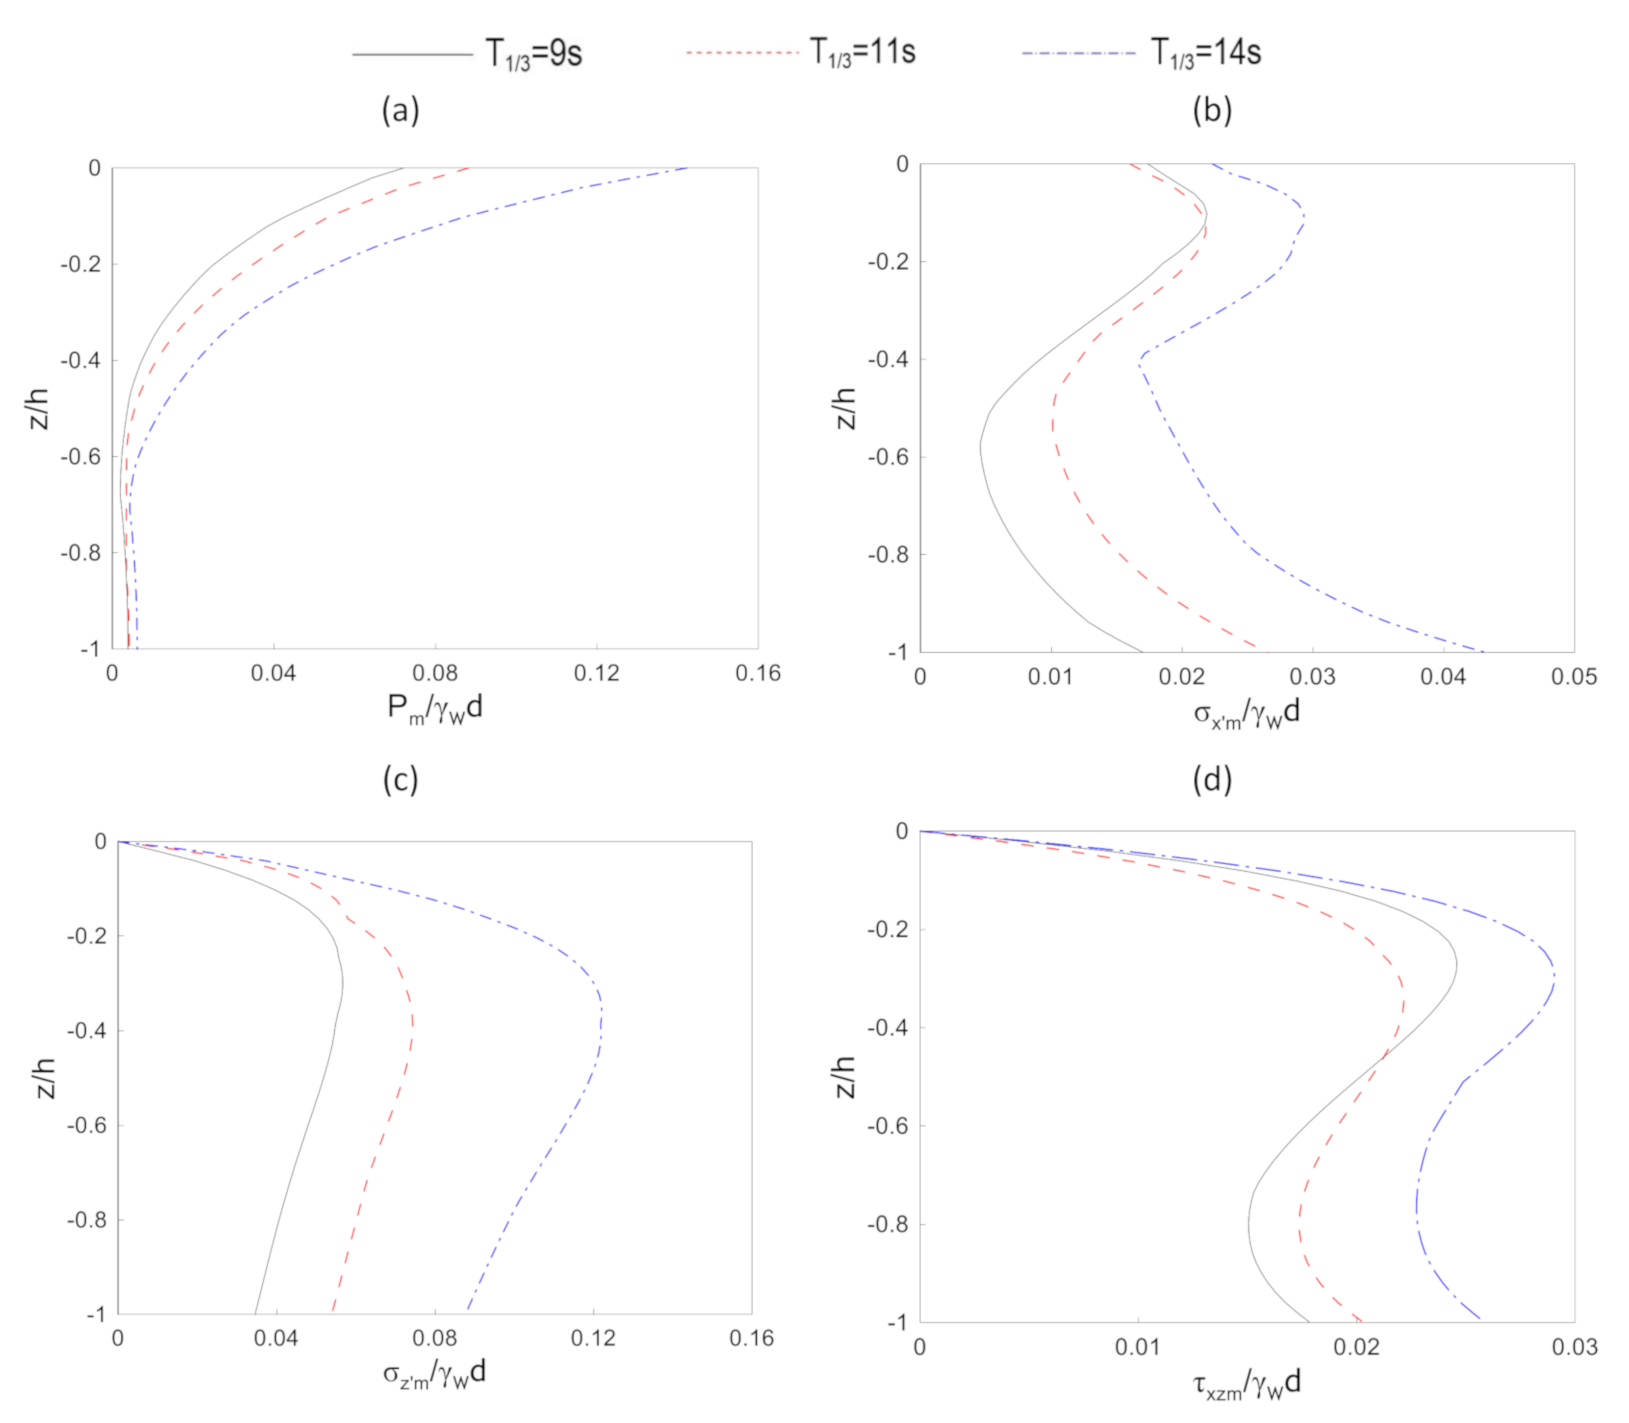
The effect of another dominant wave parameter T 1 / 3 on the WSSI under random waves is presented in Figure 22. Three random waves are utilized for this comparison with three significant wave periods T 1 / 3 , 9 s, 11 s, and 14 s, respectively. With a constant significant wave height H 1 / 3 = 3 m, a large significant wave period results in large corresponding wave length and subsequent soil response. As demonstrated in Figure 22, the random wave-induced pore water pressure, effective normal stresses, and shear stress decrease with the decrease of a significant wave period.
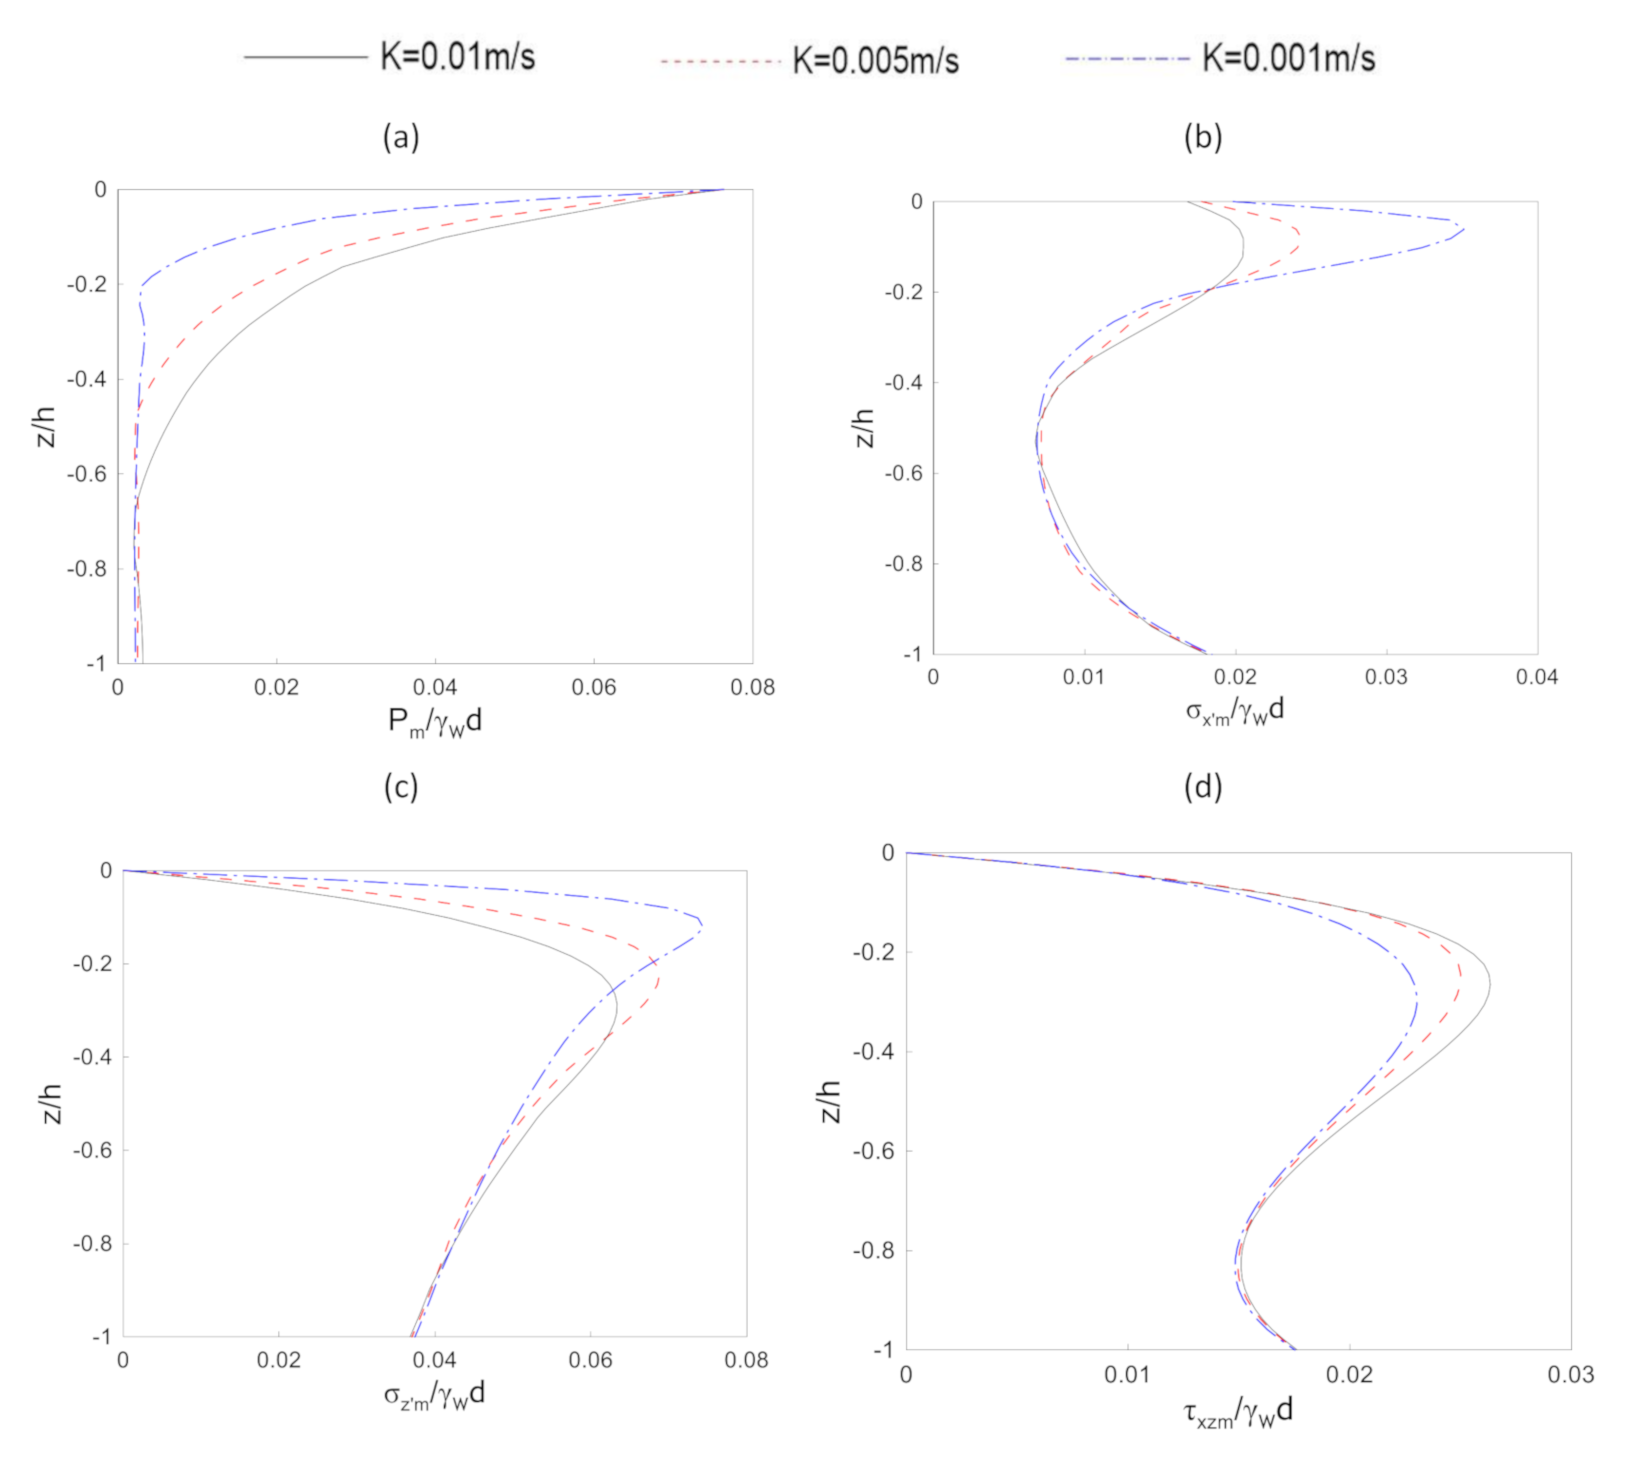
In addition to wave parameters, permeability (K) and degree of saturation ( S r ), on the irregular wave-driven maximum soil response, by using the present LRBFCM seabed model. The numerical simulation is performed under the same wave and soil characteristics adopted in Figure 19, unless specified. Figure 23 demonstrates the effect of soil permeability on the vertical distribution of the random wave-induced maximum pore water pressure, as well as maximum effective normal stresses and shear stress. In principle, the drainage ability of soil can be reflected in the examination of soil permeability. Three typical soil permeability are considered here: 0.01 m/s, 0.005 m/s, and 0.001 m/s. The degree of saturation S r is considered as 0.97 for the comparison referring to soil permeability. As depicted in Figure 23, with an increase of soil permeability, the random wave-driven maximum pore water pressure and shear stress increase, while the maximum horizontal and vertical normal stresses decrease. It can be clearly seen that the effect of soil permeability is significant in the region near the seabed surface, while the effect can be eligible in the region in the vicinity of the seabed bottom. Furthermore, Figure 23a indicates that the distribution of the maximum pore water pressure under irregular wave loading is more gentle for the situation with large soil permeability.
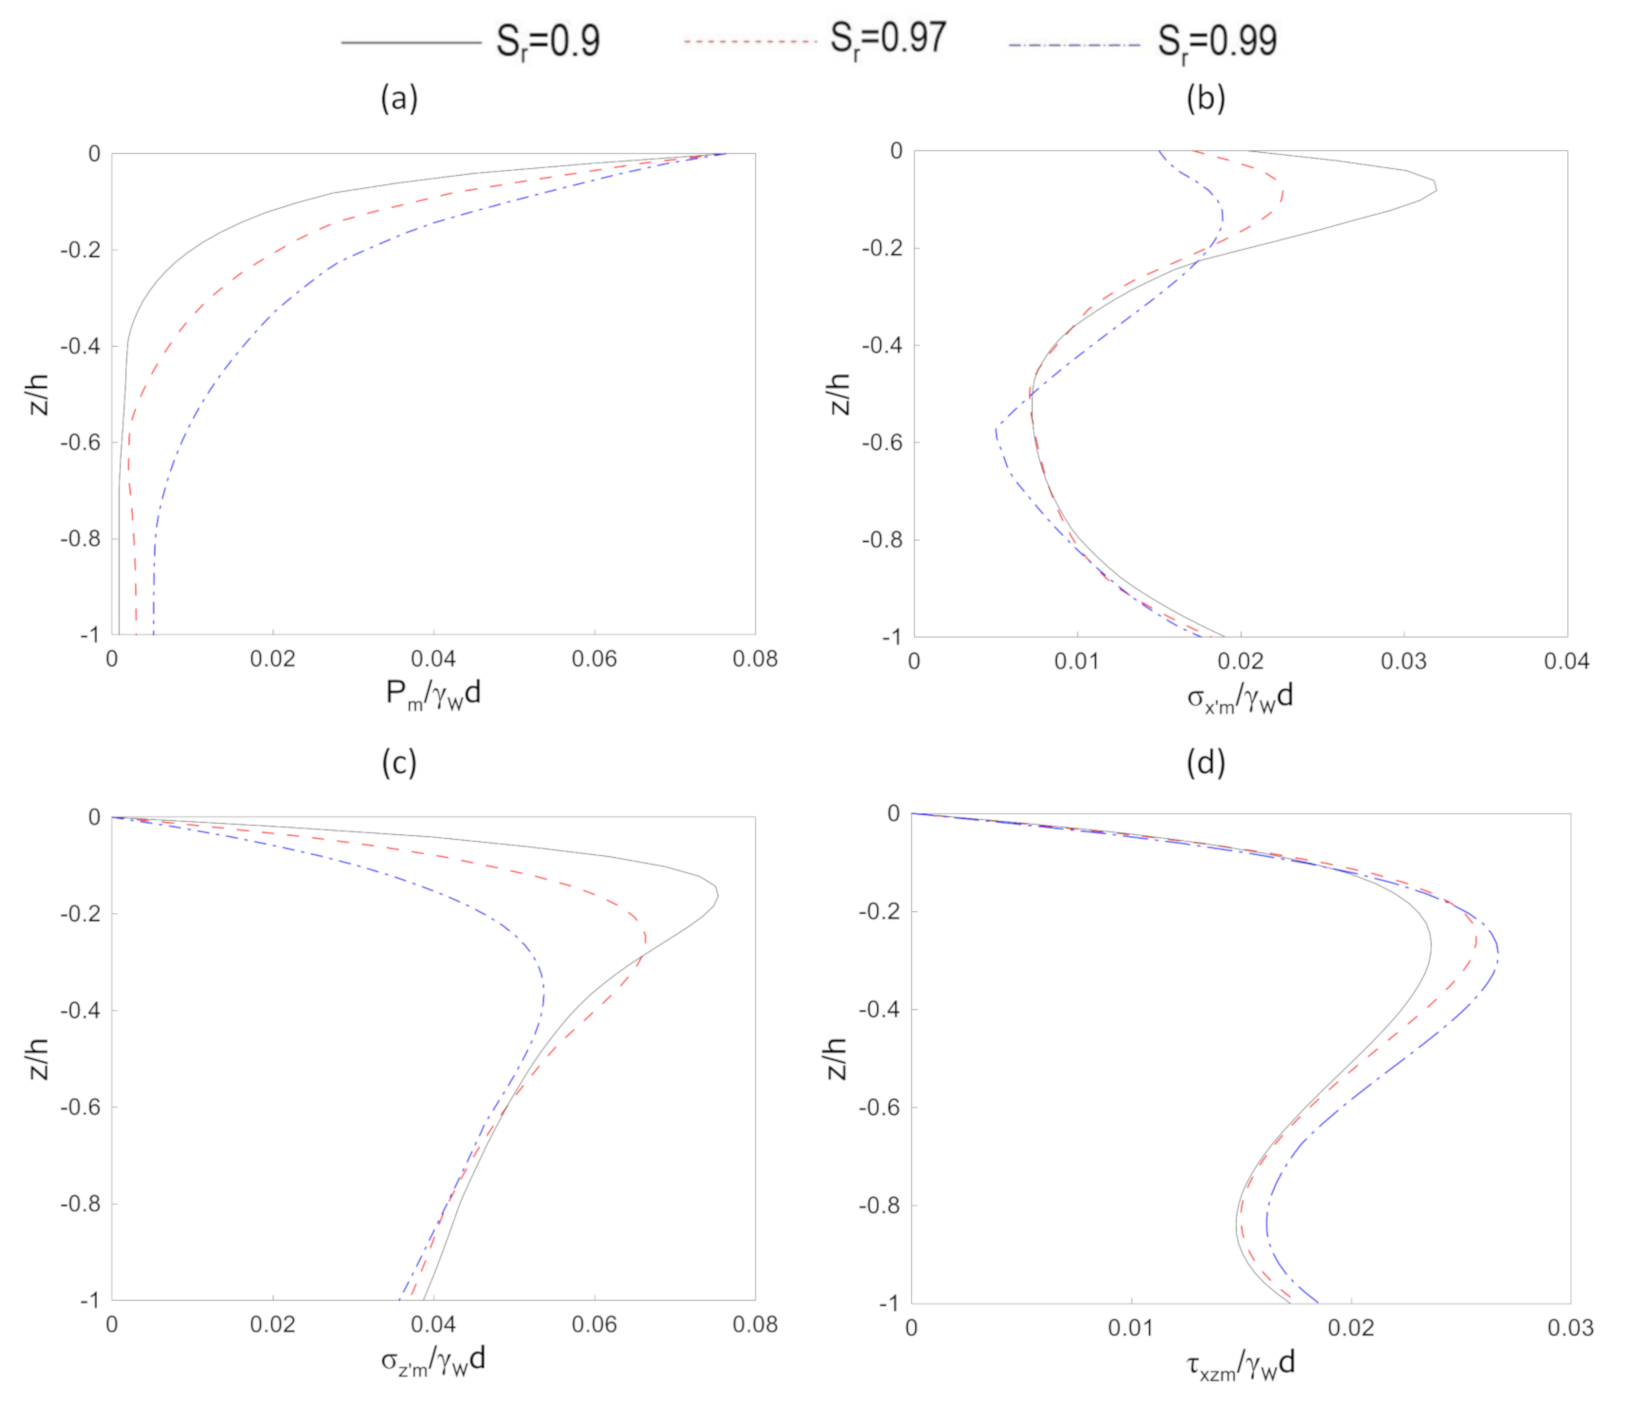
Similar to soil permeability, the degree of saturation is also considered as an important parameter for studying the WSSI under irregular wave loading. The influence of degree of saturation on the random wave-induced maximum pore water pressure, effective normal stresses, and shear stress is illustrated in Figure 24. Three different values of degree of saturation are utilized: 0.9, 0.97, and 0.99. The soil permeability is determined as 0.007 m/s here. It is found that, in the process of increasing degree of saturation, pore pressure and shear stress increase, while opposite trends are observed for the vertical distribution of horizontal and vertical effective normal stresses. In Figure 23 and Figure 24, the wave conditions are H 1 / 3 = 3 m and T 1 / 3 = 10 s.

5. Conclusions

In this paper, a mesh-free model for the wave-induced soil response and associated liquefaction in the vicinity of a submerged breakwater is proposed. In the present model, both regular and irregular wave loadings are considered. The proposed model was compared with the previous small-scale experimental data [48] for regular wave loading, while it compared with the semi-analytical solution for irregular wave loading. Although the comparison had similar trends with previous works, some differences between the previous work and the present model are observed.
Based on numerical simulation for the regular wave-induced soil response around a submerged breakwater, it is concluded that the liquefaction depth increases as wave period and wave height increases. The seabed is more likely to be liquefied with a low degree of saturation and soil permeability.
The proposed model was further adopted to conduct a parametric study for irregular wave-induced soil response around the a breakwater. In this parametric analysis, H 1 / 3 and T 1 / 3 were considered for the wave parameters. In general, the influence of wave and seabed characteristics on the the irregular wave-induced soil response have similar trends as that with regular waves. However, the influence of each parameter is more significant for irregular wave loading with the parameter values used in the numerical simulation.
This study could be the first attempt for the application of mesh-free method in the problem of wave-induced seabed response around a breakwater. There are some limitations of the proposed model, such as: (1) only oscillatory soil response is considered in this study; and (2) only 2-D conditions are considered. Further development of the mesh-free model can be extended to 3-D and including residual soil response in the future.

Author Contributions

D.-S.J.: Conceptualization, Methodology, Writing—Original draft preparation, Supervision; X.W.: Methodology, Validation, Visualization, Investigation, Writing—Review and Edition; C.-C.T.: Methodology, Visualization, Investigation, Writing—Review and Edition, Supervision. All authors have read and agreed to the published version of the manuscript.

Funding

This research received no external funding.

Institutional Review Board Statement

Not applicable.

Informed Consent Statement

Not applicable.

Data Availability Statement

The data presented in this study are available on request from the corresponding author.

Acknowledgments

The authors gratefully acknowledge the support of the Griffith University eResearch Service team and the use of the High Performance Computing Cluster “Gowonda” to complete this research.

Conflicts of Interest

The authors declare no conflict of interest.

References

  1. Woth, K.; Weisse, R.; von Storch, H. Climate change and North Sea storm surge extremes: An ensemble study of storm surge extremes expected in a changed climate projected by four different regional climate models. Ocean Dyn. 2006, 56, 3–15. [Google Scholar] [CrossRef]
  2. Arnell, N.W.; Gosling, S.N. The impacts of climate change on river flood risk at the global scale. Clim. Chang. 2016, 134, 387–401. [Google Scholar] [CrossRef] [Green Version]
  3. Mel, R.; Sterl, A.; Lionello, P. High resolution climate projection of storm surge at the Venetian coast. Nat. Hazards Earth Syst. Sci. 2013, 13, 1135–1142. [Google Scholar] [CrossRef] [Green Version]
  4. Mel, R.; Lionello, P. Storm Surge Ensemble Prediction for the City of Venice. Weather Forecast. 2014, 29, 1044–1057. [Google Scholar] [CrossRef]
  5. Temmerman, S.; Meire, P.; Bouma, T.J.; Herman, P.M.J.; Ysebaert, T.; Vriend, H.J.D. Ecosystem-based coastal defence in the face of global change. Nature 2013, 504, 79–83. [Google Scholar] [CrossRef]
  6. Resio, D.; Irish, J.; Cialone, M. A surge response function approach to coastal hazard assessment-Part 1: Basic concepts. Nat. Hazards 2009, 51, 163–182. [Google Scholar] [CrossRef]
  7. Dean, R. Beach Nourishment: Theory and Practice; World Scientific: Singapore, 2002. [Google Scholar]
  8. Silvester, R.; Hsu, J.R.C. Coastal Stabilization; PTR Prentice-Hall Inc.: Upper Saddle River, NJ, USA, 1993. [Google Scholar]
  9. Maiolo, M.; Mel, R.A.; Sinopoli, S. A Stepwise Approach to Beach Restoration at Calabaia Beach. Water 2020, 12, 2677. [Google Scholar] [CrossRef]
  10. Coelho, C.; Narra, P.; Marinho, B.; Lima, M. Coastal Management Software to Support the Decision-Makers to Mitigate Coastal Erosion. J. Mar. Sci. Eng. 2020, 8, 37. [Google Scholar] [CrossRef] [Green Version]
  11. Silvester, R. Coastal Engineering; Elsevier Scientific Publishing Company: Amsterdam, The Netherlands, 1972. [Google Scholar]
  12. Kamphuis, J.W. Introduction to Coastal Engineering and Management; World Scientific: Singapore, 2000. [Google Scholar]
  13. Martins, G.M.; Amaral, A.F.; Wallenstein, F.M.; Neto, A.I. Influence of a breakwater on nearby rocky intertidal community structure. Mar. Environ. Res. 2009, 67, 237–245. [Google Scholar] [CrossRef] [Green Version]
  14. Maiolo, M.; Mel, R.A.; Sinopoli, S. A Simplified Method for an Evaluation of the Effect of Submerged Breakwaters on Wave Damping: The Case Study of Calabaia Beach. J. Mar. Sci. Eng. 2020, 8, 510. [Google Scholar] [CrossRef]
  15. Heaps, N.S. Storm surges 1967-1982. Geophys. J. Int. 1983, 74, 331–376. [Google Scholar] [CrossRef] [Green Version]
  16. Vousdoukas, M.I.; Almeida, L.P.; Ferreira, O. Beach erosion and recovery during consecutive storms at a steep-sloping, meso-tidal beach. Earth Surf. Process. Landf. 2012, 37, 583–593. [Google Scholar] [CrossRef]
  17. Vousdouka, M.I. Observations of wave run-up and groundwater seepage line motions on a reflective-tointermediate, meso-tidal beach. Mar. Geol. 2014, 350, 52–70. [Google Scholar] [CrossRef]
  18. Ji, T.; Li, G. Contemporary monitoring of storm surge activity. Prog. Phys. Geogr. Earth Environ. 2019, 44, 299–314. [Google Scholar] [CrossRef]
  19. Sumer, B.M. Liquefaction around Mainre Structures; World Scientific: Singapore, 2014. [Google Scholar]
  20. Jeng, D.S. Mechanics of Wave-Seabed-Structure Interactions: Modelling, Processes and Applications; Cambridge University Press: Cambridge, UK, 2018. [Google Scholar]
  21. Tsai, Y.T.; McDougal, W.G.; Sollitt, C.K. Response of finite depth seabed to waves and caisson motion. J. Waterw. Port Coast. Ocean Eng. ASCE 1990, 116, 1–20. [Google Scholar] [CrossRef]
  22. Mei, C.C.; Foda, M.A. Wave-induced response in a fluid-filled poro-elastic solid with a free surface-a boundary layer theory. Geophys. J. R. Astron. Soc. 1981, 66, 597–631. [Google Scholar] [CrossRef]
  23. Mase, H.; Sakai, T.; Sakamoto, M. Wave-induced porewater pressure and effective stresses around breakwater. Ocean Eng. 1994, 21, 361–379. [Google Scholar] [CrossRef]
  24. Mostafa, A.M.; Mizutani, N.; Iwata, K. Nonlinear wave, composite breakwater and seabed dynamic interaction. J. Waterw. Port Coastal Ocean Eng. ASCE 1999, 125, 88–97. [Google Scholar] [CrossRef]
  25. Jeng, D.S.; Cha, D.H.; Lin, Y.S.; Hu, P.S. Analysis on pore pressure in an anisotropic seabed in the vicinity of a caisson. Appl. Ocean Res. 2000, 22, 317–329. [Google Scholar] [CrossRef]
  26. Jeng, D.S.; Ye, J.H.; Zhang, J.S.; Liu, P.L.F. An integrated model for the wave-induced seabed response around marine structures: Model verifications and applications. Coast. Eng. 2013, 72, 1–19. [Google Scholar] [CrossRef]
  27. Karim, M.R.; Nogami, T.; Wang, J.G. Analysis of transient response of saturated porous elastic soil under cyclic loading using element-free Galerkin method. Int. J. Solids Struct. 2002, 39, 6011–6033. [Google Scholar] [CrossRef] [Green Version]
  28. Wang, J.; Liu, G.; Lin, P. Numerical analysis of biot’s consolidation process by radial point interpolation method. Int. J. Solids Struct. 2002, 39, 1557–1573. [Google Scholar] [CrossRef]
  29. Wang, J.G.; Zhang, B.; Nogami, T. Wave-induced seabed response analysis by radial point interpolation meshless method. Ocean Eng. 2004, 31, 21–42. [Google Scholar] [CrossRef]
  30. Wang, X.X.; Jeng, D.S.; Tsai, C.C. Meshfree model for wave-seabed interactions around offshore pipelines. J. Mar. Sci. Eng. 2019, 7, 87. [Google Scholar] [CrossRef] [Green Version]
  31. Han, S.; Jeng, D.S.; Tsai, C.C. Response of a porous seabed around an immersed tunnel under wave loading: Meshfree model. J. Mar. Sci. Eng. 1988, 7, 369. [Google Scholar] [CrossRef] [Green Version]
  32. Higuera, P.; Lara, J.L.; Losada, I.J. Realistic wave generation and active wave absorption for Navier-Stokes models: Application to OpenFOAM. Coast. Eng. 2013, 71, 102–118. [Google Scholar] [CrossRef]
  33. Mel, R.; Viero, D.P.; Carniello, L.; D’Alpaos, L. Optimal floodgate operation for river flood management: The case study of Padova (Italy). J. Hydrol. Reg. Stud. 2020, 30, 100702. [Google Scholar] [CrossRef]
  34. Higuera, P. Enhancing active wave absorption in RANS models. Appl. Ocean Res. 2020, 94, 102000. [Google Scholar] [CrossRef]
  35. Biot, M.A. General theory of three-dimensional consolidation. J. Appl. Phys. 1941, 26, 155–164. [Google Scholar] [CrossRef]
  36. Verruijt, A. Flow Through Porous Media; Chapter Elastic Storage of Aquifers; Academic Press: London, UK, 1969; pp. 331–376. [Google Scholar]
  37. Yamamoto, T.; Koning, H.; Sellmeijer, H.; Hijum, E.V. On the response of a poro-elastic bed to water waves. J. Fluid Mech. 1978, 87, 193–206. [Google Scholar] [CrossRef]
  38. Šarler, B.; Vertnik, R. Meshfree explicit local radial basis function collocation method for diffusion problems. Comput. Math. Appl. 2006, 51, 1269–1282. [Google Scholar] [CrossRef] [Green Version]
  39. Kosec, G.; Sarler, B. Local RBF collocation method for Darcy flow. Comput. Model. Eng. Sci. 2008, 25, 197–208. [Google Scholar]
  40. Tsai, C.C.; Lin, Z.H.; Hsu, T.W. Using a local radial basis function collocation method to approximate radiation boundary conditions. Ocean Eng. 2015, 105, 231–241. [Google Scholar] [CrossRef]
  41. Kosec, G.; Založnik, M.; Šarler, B.; Combeau, H. A meshless approach towards solution of macrosegregation phenomena. Comput. Mater. Contin. 2011, 22, 169–195. [Google Scholar]
  42. Bentley, J.L. Multidimensional binary search trees used for associative searchings. Commun. ACM 19752, 18, 509–517. [Google Scholar] [CrossRef]
  43. Hardy, R.L. Multiquadric equations of topography and other irregular surfaces. J. Geophys. Res. 1971, 76, 1905–1915. [Google Scholar] [CrossRef]
  44. Lee, C.K.; Liu, X.; Fan, S.C. Local multiquadric approximation for solving boundary value problems. Comput. Mech. 2003, 30, 396–409. [Google Scholar] [CrossRef]
  45. Liu, X.; Liu, G.; Tai, K.; Lam, K. Radial point interpolation collocation method (rpicm) for partial differential equations. Comput. Math. Appl. 2005, 50, 1425–1442. [Google Scholar] [CrossRef] [Green Version]
  46. Li, X.S. An overview of SuperLU: Algorithms, implementation, and user interface. ACM Trans. Math. Softw. (TOMS) 2005, 31, 302–325. [Google Scholar] [CrossRef]
  47. Crank, J.; Nicolson, P. A practical method for numerical evaluation of solutions of partial differential equations of the heat-conduction type. Math. Proc. Camb. Philos. Soc. 1947, 431, 50–67. [Google Scholar] [CrossRef]
  48. Mizutani, N.; Mostafa, A.M. Nonlinear wave-induced seabed instability around coastal structures. Coast. Eng. J. 1998, 40, 131–160. [Google Scholar] [CrossRef]
  49. Ye, J.; Jeng, D.S. Response of seabed to natural loading-waves and currents. J. Eng. Mech. ASCE 2012, 138, 601–613. [Google Scholar] [CrossRef]
  50. Jeng, D.S.; Zhao, H.Y. Two-dimensional model for pore pressure accumulations in marine sediments. J. Waterw. Port, Coast. Ocean Eng. ASCE 2015, 141, 04014042. [Google Scholar] [CrossRef] [Green Version]
  51. Jeng, D.S.; Lin, Y.S. Non-linear wave-induced response of porous seabed: A finite element analysis. Int. J. Numer. Anal. Methods Geomech. 1997, 21, 15–42. [Google Scholar] [CrossRef]
  52. Luan, M.; Qu, P.; Jeng, D.S.; Guo, Y.; Yang, Q. Dynamic response of a porous seabed-pipeline interaction under wave loading: Soil-pipe contact effects and inertial effects. Comput. Geotech. 2008, 35, 173–186. [Google Scholar] [CrossRef]
  53. Zhao, H.; Jeng, D.S.; Guo, Z.; Zhang, J.S. Two-dimensional model for pore pressure accumulations in the vicinity of a buried pipeline. J. Offshore Mech. Arct. Eng. ASME 2014, 136, 042001. [Google Scholar] [CrossRef]
  54. Lin, Z.; Guo, Y.K.; Jeng, D.S.; Liao, C.C.; Rey, N. An integrated numerical model for wave–soil–pipeline interaction. Coast. Eng. 2016, 108, 25–35. [Google Scholar] [CrossRef] [Green Version]
  55. Goda, Y. Random Seas and Design of Marine Structures; World Scientific Press: Singapore, 2000. [Google Scholar]
  56. Liu, H.; Jeng, D.S. A semi-analytical solution for random wave-induced soil response in marine sediments. Ocean Eng. 2007, 34, 1211–1224. [Google Scholar] [CrossRef]
  57. Knoben, W.J.M.; Freer, J.E.; Ross, A.W. Inherent benchmark or not? Comparing NashSutcliffe and Kling-Gupta efficiency scores. Hydrol. Earth Syst. Sci. 2019, 23, 4323–4331. [Google Scholar] [CrossRef] [Green Version]
  58. Schaefli, B.; Gupta, H.V. Do Nash values have value. Hydrol. Process. 2007, 21, 2075–2080. [Google Scholar] [CrossRef] [Green Version]
  59. Pool, S.; Vis, M.; Seibert, J. Evaluating model performance: Towards a non-parametric variant of the KlingGupta efficiency. Hydrol. Sci. J. 2018, 63, 1941–1953. [Google Scholar] [CrossRef]
  60. Mizukami, N.; Rakovec, O.; Newman, A.J.; Clark, M.P.; Wood, A.W.; Gupta, H.V.; Kumar, R. Evaluating model performance: Towards a non-parametric variant of the KlingGupta efficiency. Hydrol. Earth Syst. Sci. 2019, 23, 2601–2614. [Google Scholar] [CrossRef] [Green Version]
  61. Gupta, H.V.; Kling, N.; Yilmaz, K.K.; Martinez, G.F. Decomposition of the mean squared error and NSE performance criteria: Implications for improving hydrological modelling. J. Hydrol. 2009, 377, 80–91. [Google Scholar] [CrossRef] [Green Version]
  62. Gupta, H.V.; Wagener, T.; Liu, Y. Reconciling theory with observations? Elements of a diagnostic approach to model evaluation. Hydrol. Process. 2008, 22, 3802–3813. [Google Scholar] [CrossRef]
  63. Mathevet, T.; Gupta, H.; Perrin, C.; Andreassian, V.; Moine, N.L. Assessing the performance and robustness of two conceptual rainfall-runoff models on a worldwide sample of watersheds. J. Hydrol. 2020, 585, 124698. [Google Scholar] [CrossRef]
  64. Hsu, J.R.C.; Jeng, D.S. Wave-induced soil response in an unsaturated anisotropic seabed of finite thickness. Int. J. Numer. Anal. Methods Geomech. 1994, 18, 785–807. [Google Scholar] [CrossRef]
  65. Xu, H.X.; Dong, P. A probabilistic analysis of random wave-induced liquefaction. Ocean Eng. 2011, 38, 860–867. [Google Scholar] [CrossRef]
Figure 1. Experiment set-up of Mizutani and Mostafa [48]’s tests.
Jmse 09 00015 g001
Figure 2. Comparisons of the wave-induced pore pressure with experimental data [48]. (a) point A; (b) point B; (c) point C; (d) point D (line: the present model, red circle: experimental data [48]).
Jmse 09 00015 g002
Figure 3. Schematic configuration of computational domain with a breakwater.
Jmse 09 00015 g003
Figure 4. Distributions of the mean normal effective stress and vertical displacement in a porous seabed after consolidation.
Jmse 09 00015 g004
Figure 5. Distribution of the wave-induced pore pressure in the vicinity of the breakwater.
Jmse 09 00015 g005
Figure 6. Distribution of the wave-induced vertical effective stress in the vicinity of the breakwater.
Jmse 09 00015 g006
Figure 7. Distribution of the wave-induced shear stress in the vicinity of the breakwater.
Jmse 09 00015 g007
Figure 8. Distribution of the maximum pore pressure in the computational domain for T = 10 s.
Jmse 09 00015 g008
Figure 9. Development of liquefaction potential around the breakwater with various wave periods.
Jmse 09 00015 g009
Figure 10. Distribution of the pore pressure over time in one wave cycle on four points with various wave periods.
Jmse 09 00015 g010
Figure 11. Development of the liquefaction depth around the breakwater with various wave heights.
Jmse 09 00015 g011
Figure 12. Distribution of the pore pressure over time in one wave cycle on four points with various wave height.
Jmse 09 00015 g012
Figure 13. Development of liquefaction potential around the breakwater with varied soil permeability.
Jmse 09 00015 g013
Figure 14. Distribution of the pore pressure over time in one period on four points with varied soil permeability.
Jmse 09 00015 g014
Figure 15. Development of liquefaction potential around the breakwater with various degrees of saturation.
Jmse 09 00015 g015
Figure 16. Distributions of the pore pressure over time in one period on four points with various degrees of saturation ( S r ).
Jmse 09 00015 g016
Figure 17. Time history of simulated random wave profiles using B-M Spectrum (upper panel) and JONSWAP Spectrum (lower panel).
Jmse 09 00015 g017
Figure 18. Comparison of the vertical distribution of the maximum soil response under random waves between the present local RBF collocation method (LRBFCM) model. (a) pore-water pressures ( p m / γ w d ); (b) horizontal effective normal stress ( σ x m / γ w d ); (c) vertical effective normal stress ( σ z m / γ w d ); and (d) shear stress ( τ x z m / γ w d ). Notation: black solid line: B-M spectrum; red solid line: JONSWAP spectrum) and Liu and Jeng [56]’s results (black dashed line: B-M spectrum; red dashed dot line: JONSWAP spectrum).
Jmse 09 00015 g018
Figure 19. Time-varying normalized pore pressure distribution at two levels by using JONSWAP spectrum. (a) z = 0.5 h and (b) z = h .
Jmse 09 00015 g019
Figure 20. Distribution of the maximum soil response under the random wave and representative regular wave loading. (a) Pore pressure p m , (b) horizontal effective normal stress σ x m , (c) vertical effective normal stress, and σ z m (d) shear stress τ x z m .
Jmse 09 00015 g020
Figure 21. Distribution of the maximum soil response under the random wave with various wave heights. (a) pore-water pressures ( p m / γ w d ); (b) horizontal effective normal stress ( σ x m / γ w d ); (c) vertical effective normal stress ( σ z m / γ w d ); and (d) shear stress ( τ x z m / γ w d ).
Jmse 09 00015 g021
Figure 22. Distribution of the maximum soil response under the random wave with various wave periods. (a) pore-water pressures ( p m / γ w d ); (b) horizontal effective normal stress ( σ x m / γ w d ); (c) vertical effective normal stress ( σ z m / γ w d ); and (d) shear stress ( τ x z m / γ w d ).
Jmse 09 00015 g022
Figure 23. Distribution of the maximum soil response under the random wave with various soil permeabilities. (a) pore-water pressures ( p m / γ w d ); (b) horizontal effective normal stress ( σ x m / γ w d ); (c) vertical effective normal stress ( σ z m / γ w d ); and (d) shear stress ( τ x z m / γ w d ).
Jmse 09 00015 g023
Figure 24. Distribution of the maximum soil response under the random wave with various degree of saturation. (a) pore-water pressures ( p m / γ w d ); (b) horizontal effective normal stress ( σ x m / γ w d ); (c) vertical effective normal stress ( σ z m / γ w d ); and (d) shear stress ( τ x z m / γ w d ).
Jmse 09 00015 g024
Table 1. Input data for model validation with Reference [48].
Wave Characteristics
Water depth d 0.3 m
Wave height H 0.03 m
Wave period T 1.4 s
Soil characteristics
Thickness of seabed h 0.19 m
Poisson’s ratio μ s 0.33
Soil porosity n s 0.3
Soil permeability k s 0.0022 m/s
Degree of saturation S r 0.99
Shear modulus G s 5 × 10 8 N/m 2
Breakwater parameters
Breakwater height h b 0.21 m
Crown Length b c 1.05 m
Slope length b 1 0.42 m
Poisson’s ration μ b 0.33
Porosity n b 0.26
Permeability K b 0.0018 m/s
Shear modulus G b 1 × 10 9 N/m 2
Table 2. Input data for numerical examples with regular wave loading.
Wave Conditions
Water depth ( d )11 m
Wave height ( H )2 m, 2.5 m, 3 m
Wave period ( T )6 s, 8 s, 10 s
Soil characteristics
Thickness of seabed ( h )30 m
Poisson’s ratio ( μ s )0.33
Soil porosity ( n s )0.3
Soil permeability ( k s or K)0.0001 m/s, 0.001 m/s, 0.002 m/s, 0.007 m/s
Degree of saturation ( S r )0.925, 0.97, 0.99
Shear modulus ( G s ) 5 × 10 7 N/m 2
Breakwater conditions
Breakwater height ( h b )3 m
Crown Length ( b c )10 m
Slope length ( b 1 )10 m
Poisson’s ration ( μ b )0.24
Porosity ( n b )0.3
Permeability ( K b )0.01 m/s
Degree of saturation0.975
Shear modulus ( G b ) 10 9 N/m 2
Table 3. Input data for the irregular wave-induced soil response around the breakwater.
Wave Conditions
Water depth d11 m
Significant wave height H 1 / 3 3 m, 5 m, 6 m
Significant wave period T 1 / 3 9 s, 11 s, 14 s
Soil characteristics
Thickness of seabed h30 m
Poisson’s ratio μ 0.33
Soil porosity n0.3
Soil permeability k s or K0.001 m/s, 0.005 m/s, 0.007 m/s, 0.01 m/s
Degree of saturation S r 0.9, 0.97, 0.98, 0.99
Shear modulus G 5 × 10 7 N/m 2
Breakwater conditions
Breakwater height h b 3 m
Crown Length b c 10 m
Slope length b 1 10 m
Poisson’s ration μ b 0.24
Porosity n b 0.3
Permeability K b 0.01 m/s
Shear modulus G b 10 9 N/m 2
Publisher’s Note: MDPI stays neutral with regard to jurisdictional claims in published maps and institutional affiliations.