Article

Preliminary Results on the Dynamics of a Pile-Moored Fish Cage with Elastic Net in Currents and Waves

Dipartimento di Ingegneria Civile, Edile e dell’Architettura, Università Politecnica delle Marche, 60131 Ancona, Italy
*
Author to whom correspondence should be addressed.
J. Mar. Sci. Eng. 2021, 9(1), 14; https://doi.org/10.3390/jmse9010014
Submission received: 20 November 2020 / Revised: 8 December 2020 / Accepted: 21 December 2020 / Published: 24 December 2020

Abstract

:
Over the last decades, the aquaculture sector increased significantly and constantly, moving fish-farm plants further from the coast, and exposing them to increasingly high forces due to currents and waves. The performances of cages in currents and waves have been widely studied in literature, by means of laboratory experiments and numerical models, but virtually all the research is focused on the global performances of the system, i.e., on the maximum displacement, the volume reduction or the mooring tension. In this work we propose a numerical model, derived from the net-truss model of Kristiansen and Faltinsen (2012), to study the dynamics of fish farm cages in current and waves. In this model the net is modeled with straight trusses connecting nodes, where the mass of the net is concentrated at the nodes. The deformation of the net is evaluated solving the equation of motion of the nodes, subjected to gravity, buoyancy, lift, and drag forces. With respect to the original model, the elasticity of the net is included. In this work the real size of the net is used for the computation mesh grid, this allowing the numerical model to reproduce the exact dynamics of the cage. The numerical model is used to simulate a cage with fixed rings, based on the concept of mooring the cage to the foundation of no longer functioning offshore structures. The deformations of the system subjected to currents and waves are studied.

1. Introduction

The aquaculture sector has been characterized by a significant increase in production and revenue over the last decades. The latest report of the Food and Agriculture Organization of the United Nations on fish consumption [1] showed that fish-farming provides more than 40% of the fish production in 2015. Further, while fish capture amount remained constant in the period 2008–2015, fish farming was characterized by a constant rise. This trend required fish-farm plants to be larger and located in offshore sites, where they are exposed to stronger actions [2].
The performances of fish-farm cages have been analyzed both experimentally and numerically, with a large focus on the determination of the hydrodinamic coefficients of the net, forced by currents or waves. For example, [3] evaluated experimentally the drag and lift forces onto a net in uniform flow, while [4] provided empirical values for the normal drag coefficients of copper nets. On the other hand, numerical models (validated experimentally) have been applied to the study and design of real fish cages, including floating top rings, mooring elements, or coupling multiple cages.
Among the different numerical models used in literature to simulate the dynamics of fish-farm net in currents and waves, the most used are the lumped-mass method, the net-truss model, the spring-mass model and finite elements models. The large number of models and applications testifies the capability of these models to reproduce the nets behaviours, subjected to different loads. The lumped-mass method, proposed by [5], modeled the effects of drag, inertia, weight, buoyancy, and net elasticity. The model was validated and applied to several fish farm configurations with different environmental forcing [6,7,8,9,10,11,12,13,14,15]. The net-truss model, originally presented by [16], simulated the net with straight trusses connecting nodes. The model was improved and applied by [17,18], who introduced the screen model for the viscous forces and applied the method for the study of an aquaculture net cage with floaters in currents and waves. The net-truss model is at the basis of the super-elements model [3,19,20,21,22], where net mesh is grouped into super-elements, composed by consistent and diagonal trusses, characterized by lumped-masses and nonlinear springs. The spring-mass model, proposed by [23,24], approximated the net mesh to virtual mathematical mesh with size larger than the real one. Finite elements methods (FEM) were also used, exploiting the implementation in commercial software, such as Ansys Aqwa [25] and Abaqus [26,27].
In most of these models the computational cost is reduced by lumping the properties of the large number of cage nodes into a small number of panels. This approximation does not affect the efficiency of the methods in terms of mooring tension and volume reduction [22]. However, the coarser mesh reduces the capability of these models to represent the actual deformation of the cages. For example, [28] compared three different approximated numerical models, finding them good for the design process, but overpredicting the loads acting on the structures for high solidity ratio. In the present paper we use a deformable net-truss model, based on the model proposed by [17], to study the dynamics of a specific, but emblematic, fish cage as forced by both sea currents and waves. In particular, the net elements are not grouped into a coarser mesh; therefore, the computational resolution corresponds exactly to the real-life net grid. Hence, in contrast to other recent applications of net models, the application here proposed simulates accurately the dynamics of each point of the net. The cage considered for the simulations is a cylindrical cage fixed to a top ring and a bottom ring, which are moored to a central pillar (see the sketch of Figure 1). This structural concept derives from the idea of exploiting the foundation of dismissed offshore structures as structural elements of the cage.
The geometry of the cage is characterized by the cage radius R = 1 m, the cage height H = 1 m, and the cage is located at water depths between 2 m and 4 m from the free surface. The net mesh is squared, with twine length being l0 = 0.02 m and the twine diameter (or thickness) dtwine = 0.0015 m. Hence, the solidity ratio can be calculated, following [18], Sn = 2(dtwine/l0) − (dtwine/l0)2 ~ 0.144. The material of the net is assumed to be elastic and isotropic, with Young modulus E = 81 × 106 N/m2.
The dynamics of the net is simulated with two loading conditions: a steady current with velocity U = 0.5 m/s, and a monochromatic wave with height Hw = 1 m and length Lw = 25 m in deep water (time averaged water depth hw = 20 m). These are taken as representative of typical working conditions at sea.

2. Methods

The numerical model used in this work to reproduce in detail the deformation of the net is inspired by the net-truss model proposed by [18], where the net is represented by nodes connected by straight trusses. Each ij-node, representing a net knot, is described by the vector xij, collecting its spatial coordinates. Trusses represent the net twines and the ijhk-truss, linking nodes ij and hk, is described by its length lijhk and by its direction vector sijhk. The displacements of the nodes were solved by means of the time-discretized motion equation. Time is discretized in steps of size Δt. Hence, the position of the ij-node at the time step n + 1 is evaluated from the position of the ij-node at the time step n using the velocity of the ij-node at the time step n + 1:
x   i j n + 1 = x   i j n + u   i j n + 1 Δ t
where the velocity of the ij-node at the time step n + 1 is evaluated from the velocity of the ij-node at time step n using the acceleration of the ij-node at the time step n:
u   i j n + 1 = u   i j n + a   i j n Δ t
The acceleration is evaluated using the dynamic equilibrium principle:
M i j a   i j n = f i n t   i j n + f e x t   i j n
where Mij is the mass of the net concentrated at ij-node, while f i n t   i j n and f e x t i j n are the internal and external contributions to the force acting on the node ij at time step n.
The concentrated mass of each node Mij is calculated by the product of the twines volume by the polyamide density ρPA6 = 1140 kg/m3, equally divided between the two contact nodes. The obtained mass was multiplied by a coefficient equal to 1.5, to include the added mass effect (see e.g., [8,24]).
Differently from the model of [18], in our model the kinematic constraint of the constant truss length is not imposed. Hence, the internal force contribution is evaluated using a linear elastic relation between the deformation and tension of the trusses.
The internal forces on a node are given by the force contributions of all the trusses insisting on the node. Since the net is squared, the internal forces is given by the tensile contribution of four twines σ i j h k n , multiplied by the cross sectional area of the truss A t w i n e , which is constant because the twine diameter variation is assumed negligible during the deformation:
f i n t   i j n = A t w i n e ( σ i j i j + 1 n + σ i j i + 1 j n + σ i j i j 1 n + σ i j i 1 j n )
The internal tensions act in the direction of the corresponding truss and vanish when the trusses are compressed:
σ i j h k n = { E ε i j h k n s i j h k n if ε i j h k n > 0 0 if ε i j h k n < 0
where E is the material Young modulus and ε i j h k n is the elongation of the ijhk-truss at time step n, defined as
ε i j h k n = l i j h k n l i j h k 0 l i j h k 0
The external forces f e x t   i j n on the ij-node at time step n are composed by gravity, buoyancy and viscous forces and can be expressed as
f e x t   i j n = M i j ( 1 ρ P A 6 ρ w ) g + f V   i j n
The first term includes gravity and buoyancy, where g is the gravitational acceleration vector and ρw is the water density. The second term f V   i j n represents the viscous force, due to the interaction of the net with the fluid. It has been evaluated using the screen model proposed by [17].
Since both the internal and external forces can be calculated from the coordinates and velocity of the nodes at time step n, the acceleration at such time step n can be evaluated directly from Equation (3). This set of equations, together with the boundary conditions of zero displacement (i.e., zero acceleration) given at the nodes of the top and bottom rings, is a set of algebraic equations that can be solved in terms of the acceleration. The evaluated acceleration can be substituted into Equations (2) and (1), to update the velocity and the position of the nodes at time step n + 1.

Validation

The numerical model here proposed has been validated by simulating the experimental test reported in Section 3.2 of [29]. A square panel of flexible net with size 0.30 × 0.30 m, fixed at the free surface and weighted at the bottom with two steel bars, was subjected to a water current with four different velocities U = 0.058, 0.113, 0.170, and 0.226 m/s, using the method above reported. The net was characterized by trusses with length l0 = 0.02 m and diameter dtwine = 0.0026 m, composed by polyethylene (with density ρPE = 880 kg/m3 and Young modulus EPE = 6 × 10⁻⁸ N/m2). The four experiments have been simulated with the proposed numerical model, using the net material characteristics reported above and a time step size of Δt = 0.0025 in the two test with the lowest velocities and Δt = 0.001 in the two test with the highest velocities. The grid used for the simulation is exactly the geometry of the net, characterized by a squared net with initial truss length l0 = 0.02 m. The two support steel bars, at the net top edge and the other mounted on the bottom of the net as a sinker system, were 0.3 m long, 6 mm in diameter, and with mass of 73 g. The two bars are implemented in the numerical simulations introducing the additional weight and the additional drag force, with drag coefficient of CD = 2, applied proportionally to the nodes where the two bars are attached.
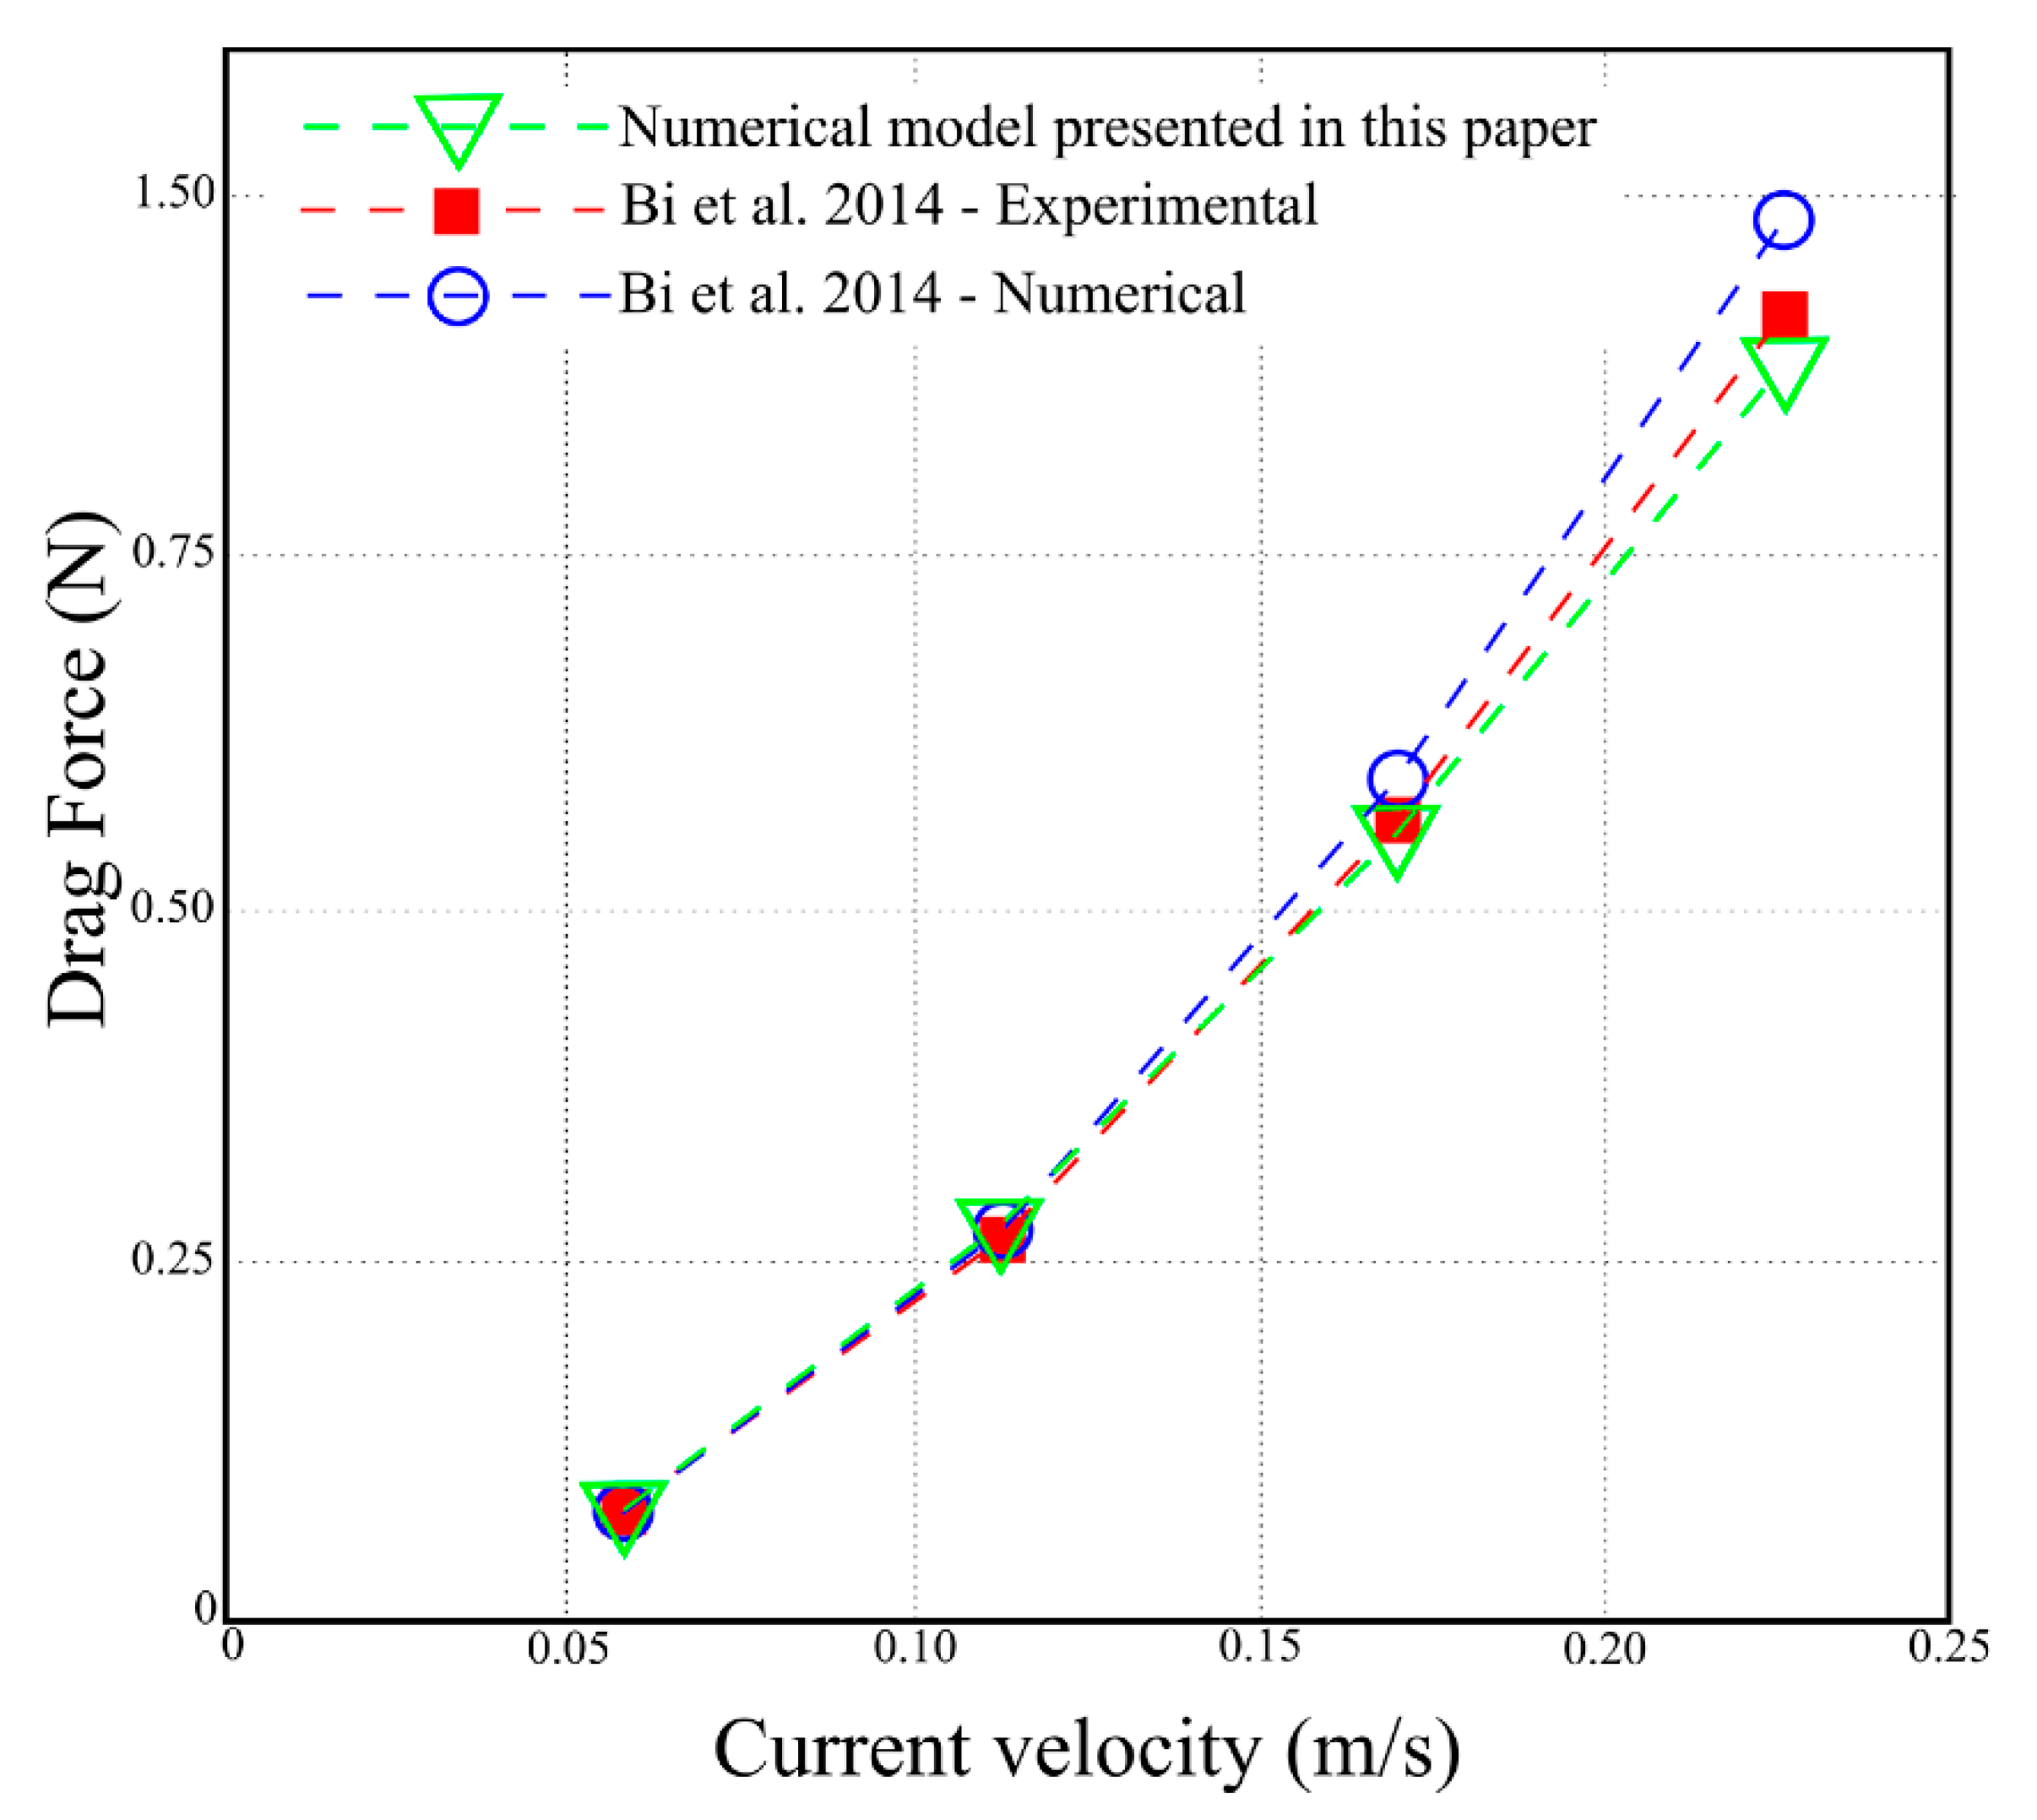
In Figure 2 the drag evaluated with numerical simulations is compared with the corresponding experimental results of [29]. Here, also the results of the numerical model proposed by the same benchmark reference is reported. The results obtained with the proposed model highlight the capability of the code to reproduce the drag force measured in the experiments with good accuracy. In particular, the simulation characterized by the highest current velocity show a better accuracy than the simulation proposed by [29].

3. Results

The model has been applied to two cases: one with forcing due to a steady sea current only, and one with forcing due to a linear wave only. The initial condition was the undeformed condition, with zero motion. The total time of simulation has been set to 4 s for the simulation with the sea current and to 32 s for the simulation with the waves. The total run time has been discretized in time steps of size Δt = 0.00005 s.
The results are reported in dimensionless form. The displacement δ   i j n = x   i j n x   i j 0 is made dimensionless using the height of the cage H for the vertical displacement and the undisturbed radius of the cage R for the horizontal displacement:
δ   i j n δ   i j n * = { δ   i j n R for   horizontal   components δ   i j n H for   vertical   components
For the simulation forced by a sea current, the time scale is taken equal to R / g , while for the simulation forced by the waves, the time scale is the wave period T:
t t * = { t R / g for   the   sea   current   test t T for   the   wave   test
In the following, results are reported for four significant points at the mid-height nodes of the cage upstream (point F at z = 0.5 m and θ = 0° in Figure 1), downstream (point B at z = 0.5 m and θ = 180° in Figure 1) and at the two lateral sides (points L and R at z = 0.5 m and θ = 90° and θ = 270°, respectively, in Figure 1).

3.1. Cage Dynamics in Steady Sea Currents

The simulation for the steady current case starts from an undeformed configuration. Hence, the first phase of the simulation reproduces the transient. This is evident from the time evolution of the displacement of the four significant nodes, reported in Figure 3. After t* = 0.5, the steady condition is attained. The displacement in the flow direction (top panel in Figure 3) is obviously the largest one, with a maximum displacement of about δ x * ~ 0.05 in the back point and about δ x * ~ 0.04 in the frontal and lateral points. Further, displacement of the lateral points is evident in the cross-flow direction (middle panel in Figure 3). The magnitude of this displacement is of about | δ y * | ~ 0.005 and it is positive (i.e., toward the right direction) for the point on the left side L, and negative (i.e., toward the left direction) for the point on the right side R. Finally, the displacement in the vertical direction (bottom panel in Figure 3) is negligible at the four check points.

3.2. Cage Dynamics in Sea Waves

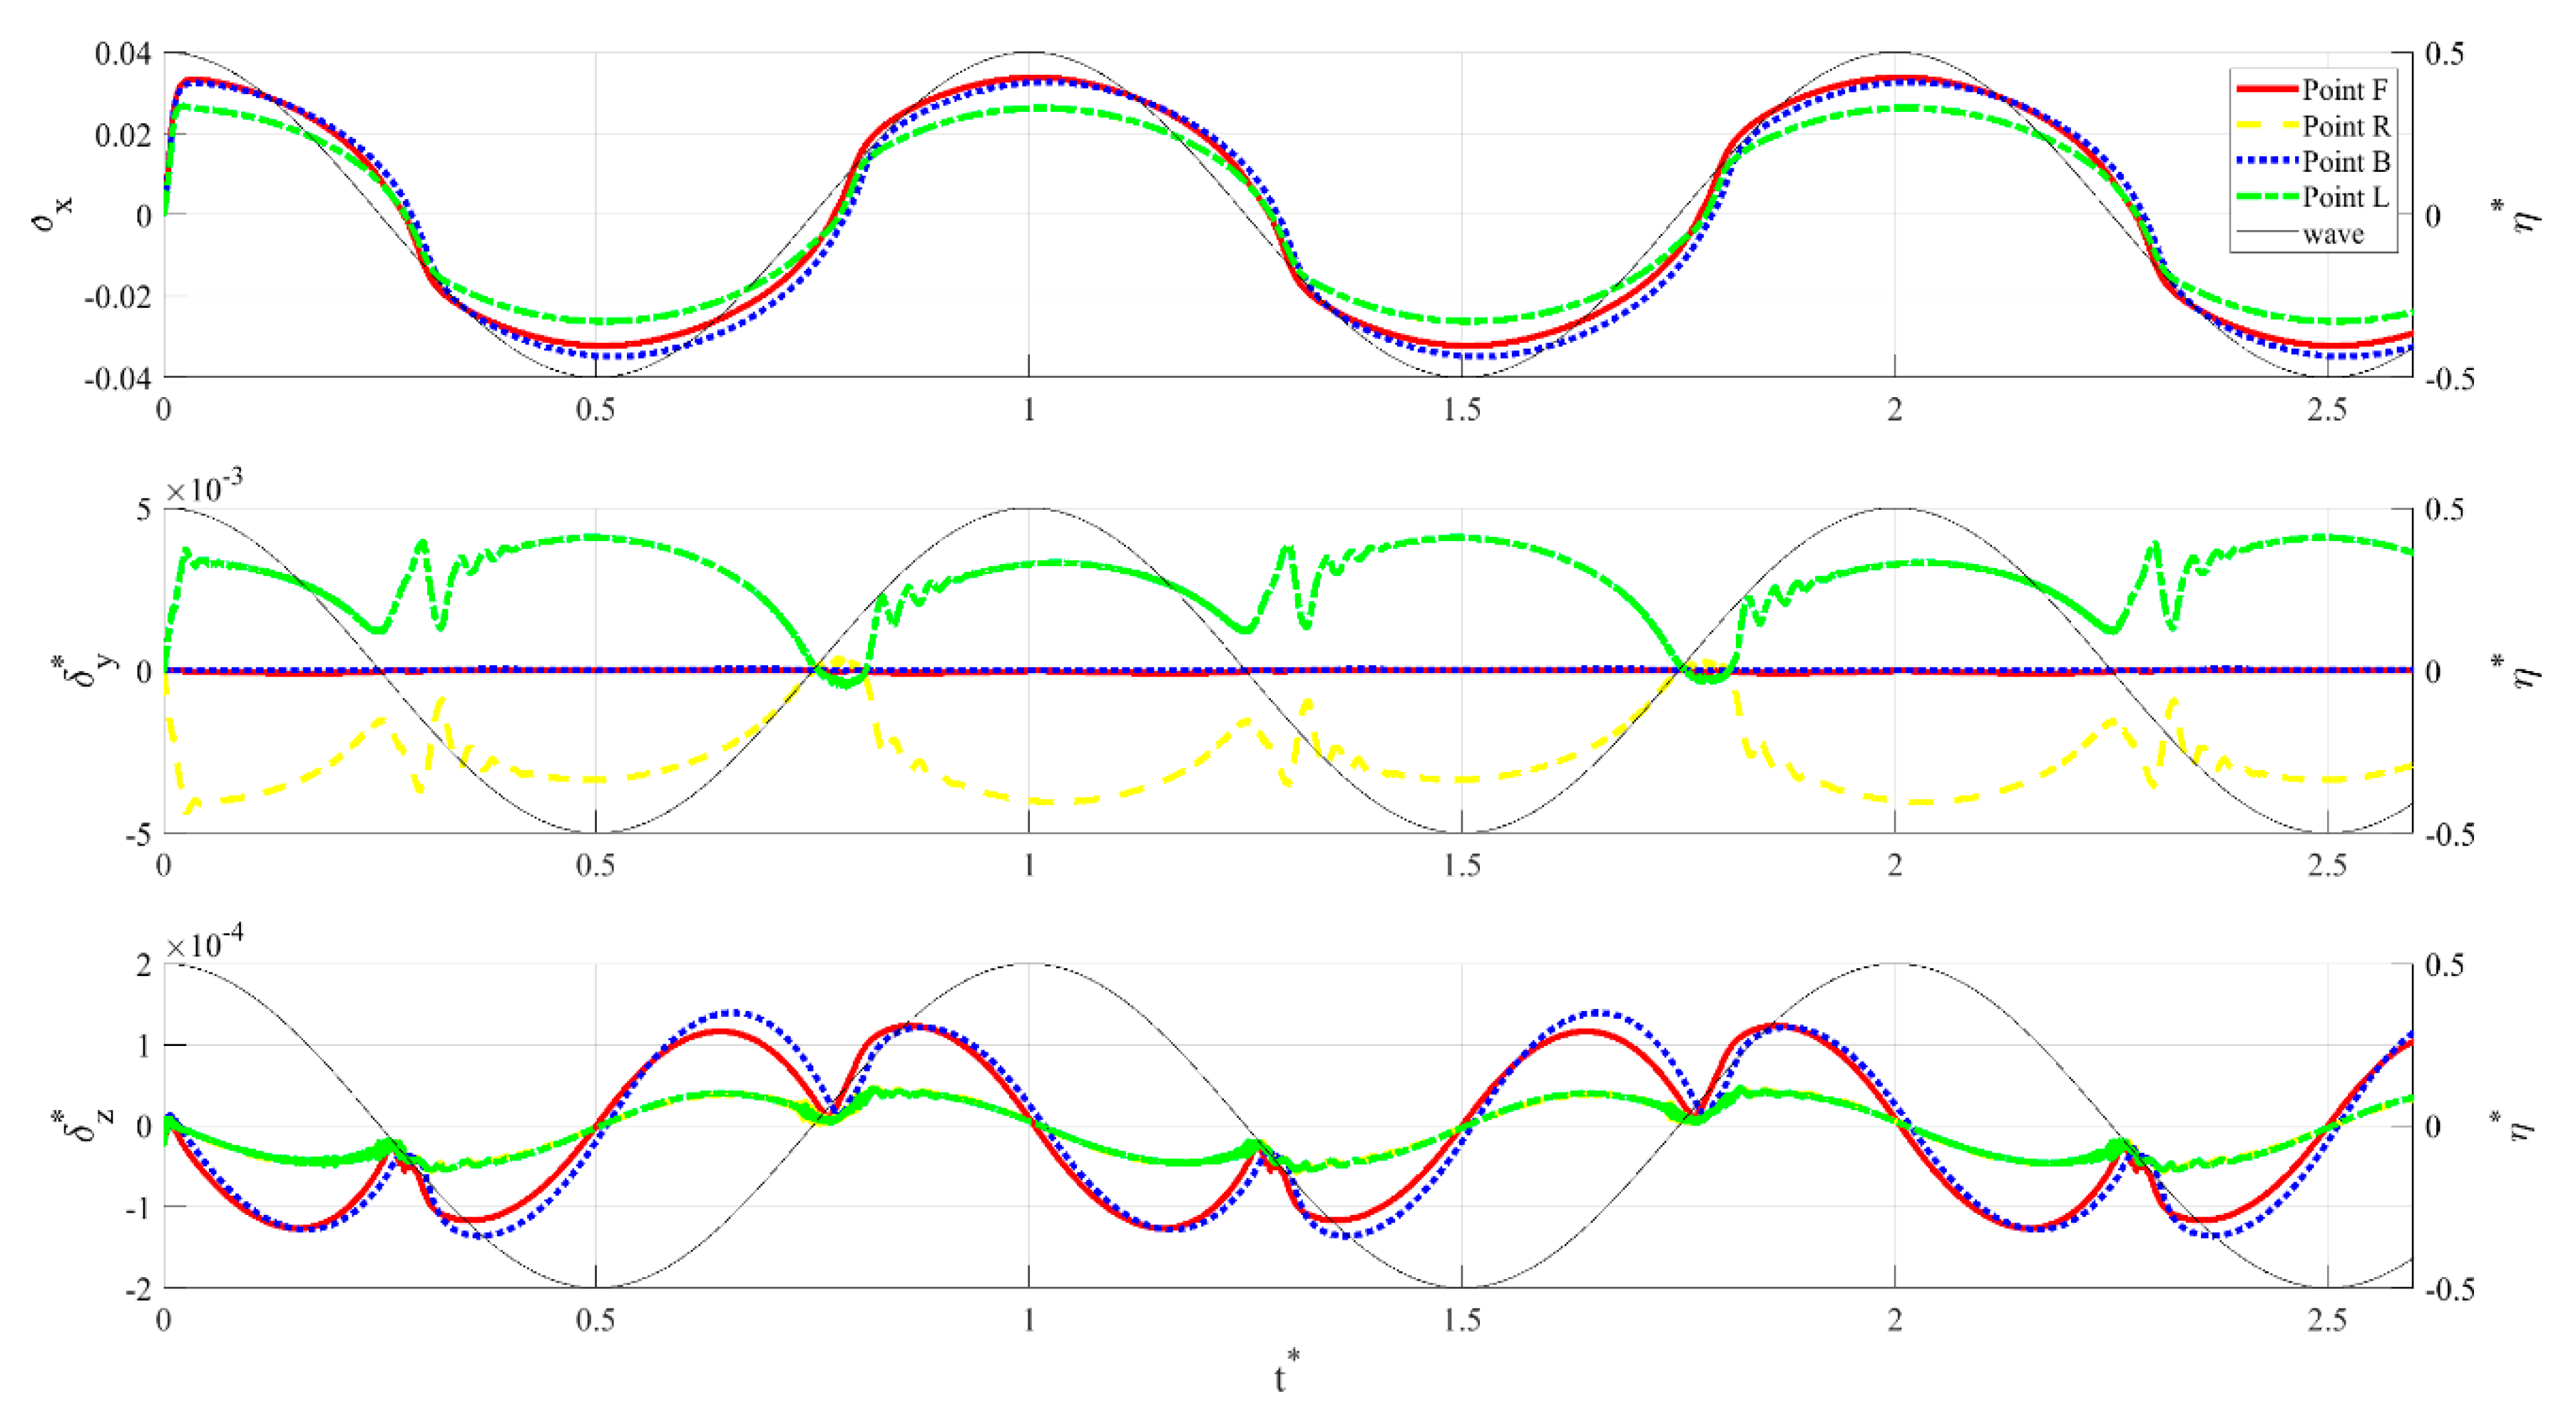
Additionally, the simulation with waves starts from an undeformed configuration and displays an initial transient phase, after which the time evolution of the displacement is quasi-steady. The simulation reproduces two periods (see the time evolution of the displacement in the three directions of the significant nodes reported in Figure 4). The maximum and minimum displacements in each direction of the reference points in the first reproduced period after the transient phase, i.e., 0.25 ≤ t* ≤ 1.25, with the corresponding time, are reported in Table 1.
The displacement in the wave direction (top panel in Figure 4) is very similar to the wave profile evolution, even if some sharp-cornered inflection points appears after every zero-upcrossing and zero-downcrossing point. The amplitude of the displacements of the frontal and back points (about δ x *   ~ 0.035) is larger than the amplitude of the displacements of the lateral points (about δ x * ~ 0.025). Instead, the displacement in the cross-flow direction (middle panel in Figure 4) is characterized by a more complicated behaviour. It is smaller than 10−3 at the frontal and back points, while the displacement of the lateral points are complex specular functions, toward the right direction for the left point L and toward the left direction for the right point R. These displacements resemble positive wave functions, whose amplitude reaches a maximum displacement of about δ y * ~ 0.004 and occurs when the forcing wave is in its crest and trough conditions. Further, higher frequency oscillations of the crossflow displacement of the lateral point occur during the zero-downcrossing and zero-upcrossing of the forcing wave. Finally, the displacement in the vertical direction (bottom panel in Figure 4) shows a complex evolution, characterized by a quasi-steady evolution, significantly different from the wave oscillation. Oscillations of frontal and back points show larger amplitudes than those of the lateral points, but the values are always smaller than 10−3 at the four check points.
Comparison of the sea wave forcing signal with the displacement of the reference points in the wave direction, reported in Figure 4, reveals a difference in phase, the cage displacement been delayed to the sea wave forcing. Such delay is evaluated as the difference between the zero upcrossing/downcrossing time of the sea wave η(t) and the zero upcrossing/downcrossing time of the reference point displacement. Delays are reported, for each zero upcrossing/downcrossing and each reference point in Table 2. The delay ranges between t* = 0.025 and t* = 0.032 for the frontal and lateral reference points, while is higher for the back point, where it ranges between t* = 0.037 and t* = 0.039.

4. Discussion and Conclusions

The proposed numerical solver is based on a model currently available in the literature, but the application is characterized by an accurate representation of the net. In fact, the net grid is an exact reproduction of the physical mesh (without any grouping procedure), and the net elastic response is included in the model using a tension-deformation relation. In this manner, the proposed numerical model is suitable for simulating accurately the behaviors of a fish-farm cage. It can provide the displacement, the deformation, and the tension of each truss of the net. In this manner it is possible to evaluate important design parameters, such as the maximum displacement and specific evolution of the net displacement. The numerical model is used to reproduce the dynamics of a pile-moored fish cage with a simple cylindrical shape. The variation in space of displacement are accurately reproduced in both the forcing conditions of current and linear wave (typical forcing for marine deep waters). The capability of the numerical model in representing complex behaviors is evident from the analysis of the results of the simulation where the cage is forced by the wave. In fact, the model can track in time the displacement of each node. For example, the complex oscillations in time of the displacements of the reference points were accurately described and reported in Figure 4.
As expected, the maximum displacements of the net occur at the location where the net is perpendicular to the flow, i.e., at the frontal and back points. In particular, the maximum displacements due to wave forcing occur in the wave direction during the crest stage and in the opposite direction during the trough stage. Further, in both configurations, with sea current forcing and wave forcing the displacement in the cross-flow direction of the lateral points (where the net is parallel to the flow) is always toward the center of the net.

Conclusions and Outlooks

  • We used an accurate numerical model to describe carefully the reaction of a cylindrical pile-moored fish cage in sea currents and waves, representative for a possible application in the overall re-use strategy of an offshore platform foundation.
  • We investigated the response of a fish farm new with respect to those treated so far in the sector, represented by a net cage fixed at the top and at the bottom, to two rigid rings).
  • Simulations show expected major displacements of the frontal and back points of the net in the sea current and wave direction (at crest and trough stages), while unexpected displacements of the lateral points have been found in the crossflow direction, toward the center of the net.
  • Beyond evaluating the significant parameters of the net displacement, the numerical model can also provide an accurate description of the distribution of deformation and tension in space and a more detailed description of the complex changes in shape of the net.
  • In the future, a grouping method will be implemented in the numerical model, for the study of realistic pile-moored fish cage forced by realistic sea states.

Author Contributions

Conceptualization, M.B. and G.Z.; methodology, G.Z. and N.N.; software, G.Z. and N.N.; validation, G.Z.; formal analysis, M.B., G.Z. and N.N.; investigation, G.Z. and N.N.; resources, M.B.; data curation, G.Z.; writing—original draft preparation, G.Z.; writing—review and editing, M.B. and N.N.; supervision, M.B.; funding acquisition, M.B. All authors have read and agreed to the published version of the manuscript.

Funding

This study was carried out in the framework of the project PLaCE (PON Ricerca e Innovazione 2014–2020, project code: ARS01_00891), co-funded by the European Union.

Institutional Review Board Statement

Not applicable.

Informed Consent Statement

Not applicable.

Data Availability Statement

The data presented in this study are available on request from the corresponding author.

Conflicts of Interest

The authors declare no conflict of interest.

References

  1. FAO. FAO Yearbook of Fishery and Aquaculture Statistics 2015; FAO: Rome, Italy, 2017. [Google Scholar]
  2. Klebert, P.; Lader, P.; Gansel, L.C.; Oppedal, F. Hydrodynamic interactions on net panel and aquaculture fish cages: A review. Ocean Eng. 2013, 58, 260–274. [Google Scholar] [CrossRef]
  3. Lader, P.; Fredheim, A. Dynamic properties of a flexible net sheet in waves and current—A numerical approach. Aquac. Eng. 2006, 35, 228–238. [Google Scholar] [CrossRef]
  4. Tsukrov, I.; Drach, A.; Decew, J.; Swift, M.; Celikkol, B. Characterization of geometry and normal drag coefficients of copper nets. Ocean Eng. 2011, 38, 1979–1988. [Google Scholar] [CrossRef]
  5. Tsukrov, I.; Eroshkin, O.; Fredriksson, D.; Swift, M.; Celikkol, B. Finite element modeling of net panels using a consistent net element. Ocean Eng. 2003, 30, 251–270. [Google Scholar] [CrossRef]
  6. Li, Y.-C.; Zhao, Y.; Gui, F.-K.; Teng, B. Numerical simulation of the hydrodynamic behaviour of submerged plane nets in current. Ocean Eng. 2006, 33, 2352–2368. [Google Scholar] [CrossRef]
  7. Zhao, Y.-P.; Li, Y.-C.; Dong, G.-H.; Gui, F.-K.; Teng, B. Numerical simulation of the e_ects of structure size ratio and mesh type on three-dimensional deformation of the fishing-net gravity cage in current. Aquac. Eng. 2007, 36, 285–301. [Google Scholar] [CrossRef]
  8. Dong, G.-H.; Xu, T.-J.; Zhao, Y.-P.; Li, Y.-C.; Gui, F.-K. Numerical simulation of hydrodynamic behavior of gravity cage in irregular waves. Aquac. Eng. 2010, 42, 90–101. [Google Scholar] [CrossRef]
  9. Xu, T.-J.; Dong, G.-H.; Zhao, Y.-P.; Li, Y.-C.; Gui, F.-K. Analysis of hydrodynamic behaviors of gravity net cage in irregular waves. Ocean Eng. 2011, 38, 1545–1554. [Google Scholar] [CrossRef]
  10. Chen, C.-P.; Zhao, Y.; Li, Y.-C.; Dong, G.-H.; Zheng, Y.-N. Numerical analysis of hydrodynamic behaviors of two net cages with grid mooring system under wave action. China Ocean Eng. 2012, 26, 59–76. [Google Scholar] [CrossRef]
  11. Zhao, Y.-P.; Gui, F.-K.; Xu, T.-J.; Chen, X.-F.; Cui, Y. Numerical analysis of dynamic behavior of a box-shaped net cage in pure waves and current. Appl. Ocean Res. 2013, 39, 158–167. [Google Scholar] [CrossRef]
  12. Xu, T.-J.; Zhao, Y.-P.; Dong, G.-H.; Li, Y.-C.; Gui, F.-K. Analysis of hydrodynamic behaviors of multiple net cages in combined wave–current flow. J. Fluids Struct. 2013, 39, 222–236. [Google Scholar] [CrossRef]
  13. Cui, Y.; Guan, C.-T.; Wan, R.; Huang, B.; Li, J. Numerical simulation of a flatfish cage system in waves and currents. Aquac. Eng. 2013, 56, 26–33. [Google Scholar] [CrossRef]
  14. Huang, X.-H.; Guo, G.-X.; Tao, Q.-Y.; Hu, Y.; Liu, H.-Y.; Wang, S.-M.; Hao, S.-H. Dynamic deformation of the floating collar of a net cage under the combined e_ect of waves and current. Aquac. Eng. 2018, 83, 47–56. [Google Scholar] [CrossRef]
  15. Huang, X.; Liu, H.; Tao, Q.; Hu, Y.; Wang, S.; Yuan, T. Numerical analysis of the dynamic response of a single-point mooring fish cage in waves and currents. Aquac. Stud. 2019, 19, 25–35. [Google Scholar] [CrossRef]
  16. Le Bris, F.; Marichal, D. Numerical and experimental study of submerged supple nets: Applications to fish farms. J. Mar. Sci. Technol. 1998, 3, 161–170. [Google Scholar] [CrossRef]
  17. Kristiansen, T.; Faltinsen, O.M. Modelling of current loads on aquaculture net cages. J. Fluids Struct. 2012, 34, 218–235. [Google Scholar] [CrossRef]
  18. Kristiansen, T.; Faltinsen, O.M. Experimental and numerical study of an aquaculture net cage with floater in waves and current. J. Fluids Struct. 2015, 54, 1–26. [Google Scholar] [CrossRef] [Green Version]
  19. Lader, P.; Fredheim, A. Modeling of net structures exposed to 3d waves and current. In Proceedings of the Open Ocean Aquaculture IV Symposium., Saint Andrews, NB, Canada, 17–20 June 2001. [Google Scholar]
  20. Lader, P.; Fredheim, A.; Lien, E. Dynamic behavior of 3d nets exposed to waves and current. In Proceedings of the 20th International Conference on Offshore Mechanics and Arctic Engineering, Rio de Janeiro, Brazil, 3–8 June 2001. [Google Scholar]
  21. Lader, P.F.; Enerhaug, B.; Fredheim, A.; Johnsen, S.G.; Krokstad, J.R. Hydroelastic Modelling of Net Structures Exposed to Waves and Current. Available online: https://www.sintef.no/globalassets/upload/fiskeri_og_havbruk/havbruksteknologi/intellistruct/lader2003_hydmodnet_nmc.pdf (accessed on 23 December 2020).
  22. Klebert, P.; Patursson, Ø.; Endresen, P.C.; Rundtop, P.; Birkevold, J.; Rasmussen, H.W. Three-dimensional deformation of a large circular flexible sea cage in high currents: Field experiment and modeling. Ocean Eng. 2015, 104, 511–520. [Google Scholar] [CrossRef]
  23. Lee, C.-W.; Kim, Y.-B.; Lee, G.-H.; Choe, M.-Y.; Lee, M.-K.; Koo, K.-Y. Dynamic simulation of a fish cage system subjected to currents and waves. Ocean Eng. 2008, 35, 1521–1532. [Google Scholar] [CrossRef]
  24. Lee, C.W.; Lee, J.; Park, S. Dynamic behavior and deformation analysis of the fish cage system using mass-spring model. China Ocean Eng. 2015, 29, 311–324. [Google Scholar] [CrossRef]
  25. Decew, J.; Tsukrov, I.; Risso, A.; Swift, M.; Celikkol, B. Modeling of dynamic behavior of a single-point moored submersible fish cage under currents. Aquac. Eng. 2010, 43, 38–45. [Google Scholar] [CrossRef]
  26. Li, L.; Fu, S.; Xu, Y. Nonlinear hydroelastic analysis of an aquaculture fish cage in irregular waves. Mar. Struct. 2013, 34, 56–73. [Google Scholar] [CrossRef]
  27. Li, L.; Fu, S.; Xu, Y.; Wang, J.; Yang, J. Dynamic responses of floating fish cage in waves and current. Ocean Eng. 2013, 72, 297–303. [Google Scholar] [CrossRef]
  28. Føre, H.M.; Endresen, P.C.; Aarsæther, K.G.; Jensen, J.H.; Føre, M.; Kristiansen, D.; Fredheim, A.; Lader, P.; Reite, K.-J. Structural Analysis of Aquaculture Nets: Comparison and Validation of Different Numerical Modeling Approaches. J. Offshore Mech. Arct. Eng. 2015, 137, 041201. [Google Scholar] [CrossRef]
  29. Bi, C.-W.; Zhao, Y.-P.; Dong, G.-H.; Xu, T.-J.; Gui, F.-K. Numerical simulation of the interaction between flow and flexible nets. J. Fluids Struct. 2014, 45, 180–201. [Google Scholar] [CrossRef]
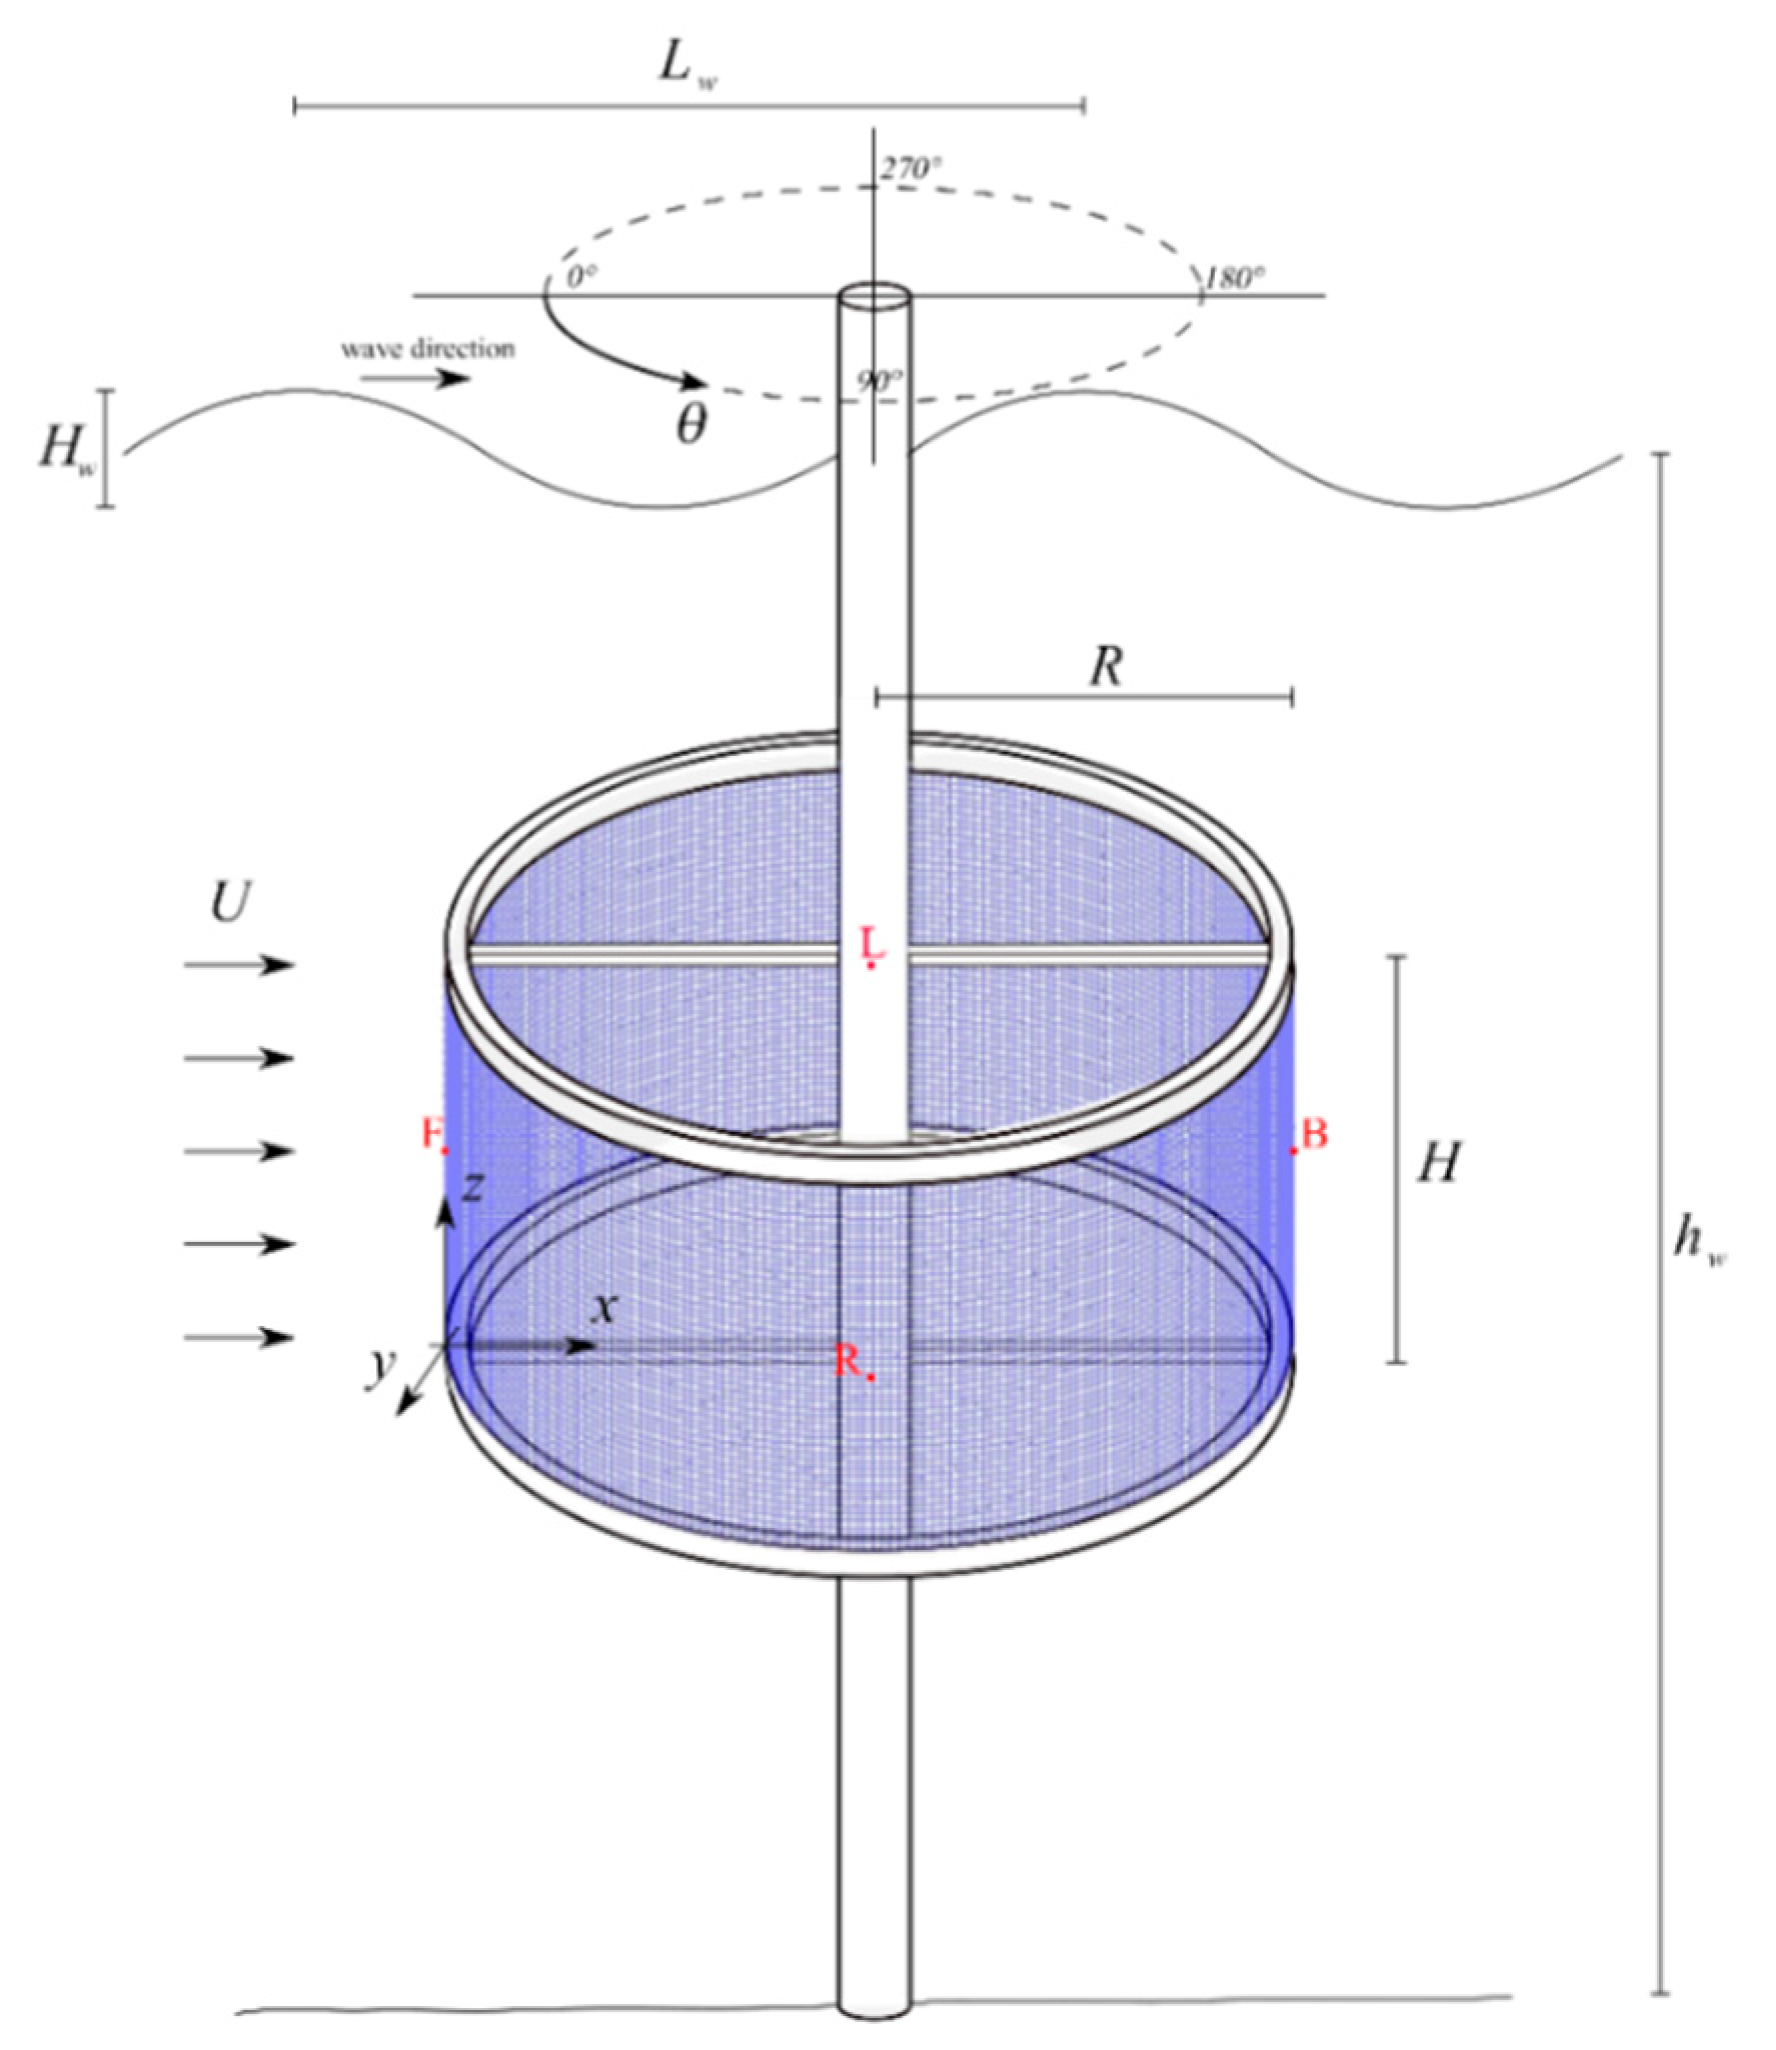
Figure 1. Sketch of a cylindrical cage fixed to two rings moored to a central pillar. Red points are reference locations for the analyses.
Jmse 09 00014 g001
Figure 2. Comparison of the drag forces measured experimentally (red dashed line and red squares) and evaluated numerically (blue lines and blue circles) by [29], and the drag forces evaluated numerically with the proposed method (green line and triangles). Modified figure from [29].
Jmse 09 00014 g002
Figure 3. Displacements at the four reference mid-height nodes (points F, B, R, and L in Figure 1) in the flow direction (top panel), cross-flow direction (middle panel) and vertical direction (bottom panel), for the steady current test.
Jmse 09 00014 g003
Figure 4. Displacements of the four significant mid-height nodes in the wave direction (top panel), cross-flow direction (middle panel) and vertical direction (bottom panel), for the linear wave test. The black dashed line represents the water elevation above the front of the cage η* = η/H.
Jmse 09 00014 g004
Table 1. Maximum and minimum displacements in each direction of the reference points, with the corresponding time, in the first simulated period after the transient phase (0.25 ≤ t* ≤ 1.25).
δ x   m a x * t* δ y   m a x * (m 10−3)t* δ z   m a x * (m 10−3)t*
F0.0341.002.7080.44123.3400.86
B0.0331.0147.2980.67139.6400.65
L0.0261.014085.9000.4945.5340.81
R0.0261.01370.1900.7747.0860.82
δ x   m i n * t* δ y   m i n * (m 10−3)t* δ z   m i n * (m 10−3)t*
F−0.0320.503−0.0840.164−0.1261.147
B−0.0350.516−0.0120.782−0.1360.363
L−0.0260.505−0.4880.783−0.0550.323
R−0.0260.505−4.0431.027−0.0560.308
Table 2. Timing of zero down crossing (0-DC) and zero up crossing (0-UC) of the wave and of the cage displacement and delay.
1st 0-DC1st 0-UC2nd 0-DC2nd 0-UC3rd 0-DC
t*(η = 0)0.2500.7501.2501.7502.250
t*( δ x *   = 0) in F0.2780.7751.2781.7752.278
delay for F0.0280.0250.0280.0250.028
t*( δ x *   = 0) in B0.2870.7891.2871.7892.287
delay for B0.0370.0390.0370.0390.037
t*( δ x *   = 0) in L0.2790.7811.2791.7822.279
delay for L0.0290.0310.0290.0320.029
t*( δ x * = 0) in R0.2790.7811.2791.7822.279
delay for R0.0290.0310.0290.0320.029
Publisher’s Note: MDPI stays neutral with regard to jurisdictional claims in published maps and institutional affiliations.