Abstract
The effect of capillary water caused by heavy rainfall and groundwater level fluctuations can induce the erosion and collapse of island reef coral sand foundations. Here, the effects of water content (ω) on the shear strength parameters of coral gravelly sand are analyzed at the macro and micro scales by laboratory consolidated-drained triaxial compression and nuclear magnetic resonance tests. Furthermore, particle breakage characteristics of coral gravelly sand under the static load are discussed. With increasing ω, (1) the internal friction angle increases slightly (<1°) then decreases; (2) the apparent cohesion is more sensitive to the change in the ω; (3) with an increase from 5.4% to 21.3%, the bound water content remains almost unchanged; (4) the capillary water content is the main factor impacting the apparent cohesion; (5) the increase in free water content is the internal cause of the decreasing internal friction angle of coral gravelly sand with ω > 11.1%; and (6) the particle breakage increases, and there is an approximately linear relationship between the median particle diameter (d50) and relative breakage index (Br). The established physical model can reflect the influence of water content and plastic work and describe the evolution law of particle breakage.
Highlights
- Triaxial shear tests and NMR tests on coral gravelly sand with different water content were performed.
- Effects of water content on strength parameters of coral gravelly sand were assessed quantitatively.
- Underlying mechanisms of water content on strength parameters of coral gravelly sand were demonstrated.
- The relationship among the relative breakage index, plastic work and water content was established.
1. Introduction
Coral sand, also known as calcareous sand, shell sand, or carbonate sand, is a special geotechnical medium with calcium carbonate, magnesium carbonate, and other carbonates as the main mineral components, which are usually formed by biological debris after the death of marine organisms such as coral reefs, shells, seaweeds, etc., through physical, chemical, and biochemical actions. Coral sand mainly appears on the continental shelf and coastline between 30° N–30° S, and they are also found in the South China Sea [1]. Coral gravelly sand is defined as coral sand having 25%–50% of its total mass comprising particles greater than 2 mm in size. Large-scale hydraulic reclamation construction started in the South China Sea at the end of 2013, for which the only available material is the coral sand deposited in the island reef tray and lagoon. Because of the characteristics of the hydraulic reclamation and the intermittent foundation treatment [2], the coral gravelly sand is distributed in the middle of the stratum and is the main supporting layer in the foundation. Therefore, it is crucial to determine the strength parameters of the coral gravelly sand (c, φ) for island reef infrastructure design and construction. Terzaghi’s soil mechanics theory and the Mohr–Coulomb strength theory solved the problem of saturated soil strength in the early twentieth century [3]. However, the coral sand in the island reef is mostly unsaturated. Owing to the lack of scientific understanding of the strength characteristics of unsaturated coral gravelly sand, to ensure engineering safety, engineers often use the saturated shear strength for checking calculations in the design of island reef buildings. The related research results [4,5,6] show that the mechanical properties of coral sand in unsaturated and saturated states are quite different, and buildings designed based on the saturated shear strength will inevitably cause huge economic losses. Therefore, studying the mechanical properties of unsaturated coral gravelly sand is of great significance to the development of soil mechanics and resource conservation.
There have been many previous studies on the variation in the strength parameters of unsaturated soils with ω. Most scholars [7,8] believe that the strength parameters of unsaturated soils decrease with increasing ω. However, no consensus has yet been reached on the decreasing trend. For example, Miao et al. [9] believed that the logarithm of the strength parameter of unsaturated expansive soil (lgc, lgφ) decreased linearly with increasing ω, and the decrease of cohesion (c) was more obvious. Ling and Yin [10] and Shen et al. [11] reported that within a certain range of ω, the strength parameter of unsaturated soil decreased linearly with the increasing ω. Bian and Wang [12] studied the relationship between the strength parameters and ω of silty clay, and found that both cohesion and internal friction angle decreased with increasing ω, there was a linear relationship between the internal friction angle and ω, and the relationship between the cohesion and ω could be approximated by a quadric equation. Some scholars believed that strength parameters of unsaturated soil did not change monotonically with increasing ω. For example, Kong and Tan [13] studied the relationship between the strength parameters of compacted expansive soil and ω and believed that the cohesion of compacted expansive soil also decreased with increasing ω, but when the ω was greater than the plastic limit, the cohesion reached a stable value. Xiong et al. [14] conducted multiple sets of unconsolidated and undrained triaxial shear tests on unsaturated silty clay and found that the relationship between the internal friction angle and ω could be approximated by a W-shaped curve, while the cohesion showed a “mountain peak effect” with increasing ω, which peaked when the ω was 18.16%. Cokca et al. [15] conducted a series of direct shear tests on unsaturated compacted clay, and concluded that the internal friction angle decreased with increasing ω and the cohesion peaked near the optimal ω. Lin et al. [16] studied the influence of ω on the strength parameters of silty sand, sandy silt, and silty clay, respectively, and pointed out that the cohesion of the three kinds of soils reached the maximum when the saturation was 40%–60%, and the internal friction angle continued to decrease with increasing saturation. Huang et al. [17] studied the change in the strength parameters of remolded silty sand with ω through laboratory direct shear tests. The results showed that the cohesion of silty sand first increased and then decreased with increasing ω, and the internal friction angle first decreased and then increased with increasing ω. Chen et al. [18] and Wang et al. [19] studied the relationship between the strength parameters and ω of unsaturated sand, and believed that the cohesion of unsaturated silt first increased then decreased with the increasing ω, and the internal friction angle continued to decrease with increasing ω. This shows that different unsaturated soils have significant differences in their strength parameters depending on the ω. Additionally, most of these research results are based on terrigenous soil. Owing to the special marine organisms in coral sand, it is significantly different from terrigenous soils; it has extremely irregular particle shapes and high porosity and fragility, and is often accompanied by cementation [20], which are significantly different from terrigenous soils. Therefore, whether the above research results are applicable to coral sand remains to be discussed.
Since the first discovery of coral sand and reef limestone layers by geotechnical engineers in the Persian Gulf in the early 1960s [21], studies on the mechanical properties of coral sand have been conducted for almost 60 years. In 1988, the first international calcareous soil mechanics conference held in Perth, Australia, triggered a great upsurge in research on the mechanical properties of coral sand. At present, researchers have mainly studied coral fine-grained soil [2,20,22,23,24], medium-coarse sand [25,26,27,28,29,30,31], and coarse-grained soil [32,33]. There are relatively few studies on the mechanical properties of coral gravelly sand [34,35], and these research results are mostly limited to the effects of density, gradation, stress state, etc. on the mechanical properties of coral gravelly sand. There are few studies on the effects of ω on the mechanic characteristics of coral gravelly sand and its microscopic mechanisms. According to the particle size analysis of a core sample of the borehole in the upper fill of the hydraulic island reef in the South China Sea, it was found that coral gravelly sand was widely distributed in the hydraulic foundation of the island reef. Under the influence of factors such as rainfall, seawater tides, drainage, evaporation and other factors, the ω of coral gravelly sand often changes, and there is no conclusive research data to prove whether the related engineering mechanical properties will change. Considering this, a series of laboratory consolidated-drained triaxial compression tests were conducted on the coral gravelly sand, to comparatively study its mechanical properties under different water contents and reveal the variation in the strength parameters of coral gravelly sand with different water contents from a macro perspective. Besides, nuclear magnetic resonance (NMR) tests were carried out on coral gravelly sand with different water contents to study the changes in the pore water content in different occurrence forms with the ω of the sample, revealing the influence mechanism of ω on the macroscopic mechanical properties of coral gravelly sand from a microscopic perspective. Moreover, based on the particle breakage characteristics of coral sand under low stress, the particle breakage degree of coral gravelly sand with different water contents during the triaxial shearing process was quantitatively analyzed. The results of this study could lay the theoretical foundation for subsequent research on the effect of the drying–wetting cycle on the strength characteristics and particle breakage of coral gravelly sand.
2. Materials and Methods
2.1. Experiment Material
The samples were uncemented loose coral sand taken from a hydraulic fill island reef in the South China Sea. The particles were light white with edges and corners. The parent rock was relatively brittle, and the single-particle strength was low. According to the relevant provisions of the Chinese National Standard of Soil Test Method (SL237-2019) [36], the physical properties of the coral sand, such as the particle size distribution, specific gravity, and maximum and minimum dry densities, were tested before the triaxial shear experiment. The test results are shown in Figure 1 and Table 1.
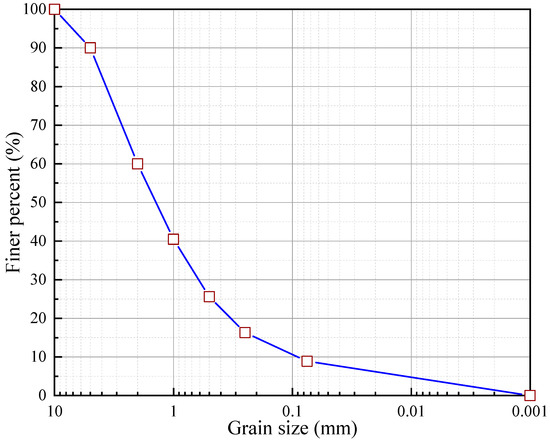
Figure 1.
Gradation curve of the coral sand.

Table 1.
Physical parameters of the coral sand tested.
As shown in Figure 1 and Table 1, (1) the mass of the particles greater than 2 mm in size is about 40% of the total mass of the sample, which proves that the coral sand tested is coral gravelly sand. (2) The gradation curve in Figure 1 has a gentle slope, and the coral sand have a continuous particle size distribution and a relatively wide particle size distribution range, indicating that the coral gravelly sand tested has a good gradation. As shown in Table 1, the non-uniformity coefficient (Cu) of the sand is greater than 5.0 and the curvature coefficient (Cc) is between 1 to 3, which also confirm the conclusion of good gradation of coral gravelly sand. (3) The specific gravity of coral gravelly sand is 2.73, greater than that of terrigenous quartz sand (2.65); this is due to the difference in the mineral composition of the two sands. The main mineral component of coral gravelly sand is CaCO3, while that of terrigenous quartz sand is SiO2; the density of CaCO3 is larger than that of SiO2, which makes the specific gravity of coral gravelly sand greater than that of terrigenous quartz sand. (4) The maximum and minimum void ratios of the coral gravelly sand tested are greater than those of terrigenous quartz sand with the same particle gradation (emax = 0.85; emin = 0.61). In terms of dry density, the maximum and minimum dry densities of the coral gravelly sand are generally smaller than those of terrigenous quartz sand (ρdmax = 1.65 g/cm3; ρdmin = 1.43 g/cm3). The special marine biogenesis of coral gravelly sand results in a large amount of internal pores and irregular particle shape; the irregular particle shape causes relatively large intergranular pores during the accumulation process, which further increases the porosity of coral gravelly sand. This is also the main reason why the specific gravity of coral gravelly sand is larger while the maximum and minimum dry densities are smaller than those of terrigenous quartz sand with the same particle gradation.
2.2. Experiment Scheme
To study the impact of ω on the shear characteristics of coral gravelly sand, and to discuss the evolution of the particle breakage of coral gravelly sand with different water contents during the shearing process, a simple variable method was used to design the experimental scheme and the triaxial shear tests were carried out on the coral gravelly sand under different water contents. On the basis of strictly controlling the particle gradation of the sample, a screening test was carried out on the coral gravelly sand to reveal the variation in its particle breakage characteristics under different water contents and stress conditions. Owing to the coarse particles of coral gravelly sand and fast drainage speed, the stress state during the consolidation drainage shear process is most similar to the actual stress environment [1]. Therefore, a series of consolidated-drained triaxial compression tests on the coral gravelly sand with different water contents were carried out to analyze the variation in the shear characteristics with ω.
An in-situ survey of the hydraulic fill island reef in the South China Sea found that the compactness of coral gravelly sand after foundation treatment generally has a relative density of about 70%. Therefore, the relative density of the coral gravelly sand samples in the triaxial shear tests was set at 70%. The coral sand reclamation layer in the island reef is relatively thin, and the buildings on the island reef have a relatively low height, which results in a small base additional stress on the coral sand, generally within 200 kPa. Additionally, for the highest construction on the island reef (such as the maritime lighthouse, airport signal tower, etc.), the base additional stress does not exceed 400 kPa [37]. Thus, 50, 100, 200, and 400 kPa were taken as the confining pressures of coral gravelly sand in the triaxial shear tests, with a view to fit the actual stress state of coral sand. As the proportion of fine particles with a particle size of <0.075 mm (≤8.9%) in the coral gravelly sand is small, the sample has a poor water-holding capacity. In addition, it was also found in the test that the sample bleeds seriously when the ω exceeded 24%. Therefore, a ω of 24% was taken as the upper limit, and triaxial shear tests were carried out on coral gravelly sand with water contents of 6%, 12%, 18%, and 24%. The sample size was ∅61.8 × 120 mm (diameter × height). The triaxial shear rate was set to 0.6 mm/min, and the test was terminated when the axial strain reached 20%. A detailed test scheme is shown in Table 2.
Table 2.
Triaxial shear test scheme.
To reveal the impact of ω on the shear strength parameters of coral gravelly sand from a microscopic perspective, a series of NMR (nuclear magnetic resonance) tests were carried out on coral gravelly sand samples to reveal the variation in the pore water content in different occurrence forms with the ω. The physical parameters of the coral gravelly sand samples used in the NMR test are the same as those of the coral gravelly sand in the triaxial shear test, that is, at a relative density of 70%, coral gravelly sand with water contents of 6%, 12%, 18%, 24% were selected for NMR tests. The sample size is ∅45 × 20 mm (diameter × height). The specific experiment scheme is shown in Table 3.
Table 3.
Nuclear magnetic resonance experiment scheme.
2.3. Experiment Apparatus and Operations
In this study, the TKA-Advanced full-automatic stress path triaxial testing apparatus developed by Nanjing Tektronix Co., Ltd., Nanjing, China was employed. The whole test device is composed of five parts: The data acquisition system, pressure chamber, strain control system, back pressure control system, and confining pressure control system (see Figure 2). The shear rate of the triaxial shear apparatus ranges from 0.0001 to 1.2 mm/min, and variable speed loading can be achieved. The axial load sensor has a measuring range of 15 kN and an accuracy of +0.15% FS. The confining pressure and back pressure control system has a stress control range of 0–3 MPa and an accuracy of 1.0 kPa. The size of the sample that that can fit into the pressure chamber is ∅61.8 × 120 mm (diameter × height).
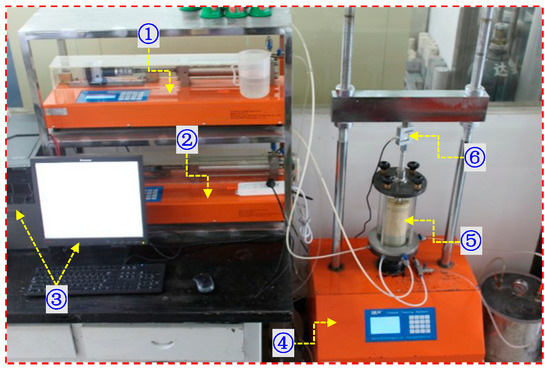
Figure 2.
TKA-Advanced full-automatic stress path triaxial testing apparatus. ①—Back pressure control system; ②—confining pressure control system; ③—data acquisition system; ④—strain control system; ⑤—pressure chamber; ⑥—axial load sensor.
The entire triaxial shear test can be divided into four steps: sample preparation, loading, testing, and particle breakage measurement.
(1) In the sample preparation process, the coral gravelly sand sample was dried to a constant weight under environment conditions at a constant temperature of 105 °C. After the sample was cooled to normal temperature (about 25 °C), a screening test was conducted on the sample to separate coral gravelly sand samples of different particle sizes (see Figure 3) into sealed bags. During the screening test, to avoid errors in screening the particle size due to clogging of the sieve pores with fine particles, it is suggested to not use too many soil samples for each screening test; the screening time should be maintained at longer than 15 min [38]; and a brush can be used to clean the sieve holes before starting the next set of screening tests. After obtaining coral sand grains of different particle sizes, the total mass of the tested sample was calculated according to the relative density and the size of the sample tested in the pressure chamber, and then the sample to be tested was configured according to the coral sand mass ratio of each particle size in the gradation curve and stored in sealed bags. The quantity of the fresh water to be added into the sample was calculated according to the design value of the ω in Table 2. The water was mixed with the coral gravelly sand before being sealed and stored for 24 h to ensure that the water was evenly distributed in the sample.
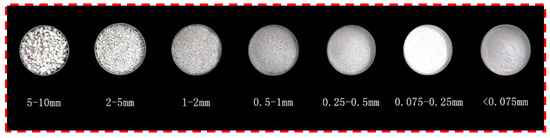
Figure 3.
Fractions of coral sand.
(2) During the loading process, the raindrop method was used to load the sample into the rubber membrane in three layers. In the specific operation, a metal spoon was used to evenly spread the sample into the rubber membrane; and a steel ruler was used to check whether the compactness of the sample met the design requirements after each layer was installed. If the design value of the compactness of the tested sample was large, a compacting hammer would be adopted to gently press the surface of the sample until it reached the compactness set in Table 2. After filling each layer, the surface of the sample tested was shaved before filling the next layer of sample, and the operation was repeated until the sample height reached the design value.
(3) During the test, the triaxial consolidation test was carried out on the sample under the designed confining pressure. Due to the large intergranular void of coral gravel sand, the fast loading method was used and the consolidation time was set at 1.0 h. Then, the triaxial shear test was carried out at a shear rate of 0.6 mm/min while maintaining the same confining pressure, and the test was terminated when the axial strain reached 20%.
(4) After the test, the coral gravelly sand sample was washed into a tray with clean water. After drying the sample and cooling it to a normal temperature, a screening test was carried out to identify the amount of particle breakage. It is worth noting that coral sand is a special geotechnical medium where particle breakage occurs under low stress. To obtain the amount of particle breakage of coral gravelly sand in triaxial shearing under different water contents and stress conditions, it is necessary to avoid particle breakage caused by improper operation during the test.
The principle of the NMR test is that, when the sample is placed in a fixed magnetic field of a certain strength, it takes a certain time (i.e., the lateral relaxation time) for the hydrogen nuclei in the sample to return to an equilibrium state due to the interference of the radio frequency (RF) field, and that the relaxation times for hydrogen nuclei in different physical or chemical states are different. For a given sample, the strength and location of the signal are related to the content and distribution of pore water in the sample. Therefore, the content of pore water with different occurrence forms in the sample can be quantitatively measured by NMR technology. The nuclear magnetic resonance test device deployed was the PQ001 Mini NMR Analyzer, jointly developed by the Wuhan Institute of Rock and Soil Mechanics, Chinese Academy of Sciences, and Suzhou Newman Analytical Instrument Co., Ltd., Suzhou, China, (see Figure 4). This analyzer comprises five parts: The permanent magnet, sample tube, RF system, temperature control system, and data acquisition and analysis system [39]. The magnetic field strength of the permanent magnet is 0.52 T. To ensure the uniformity and stability of the magnetic field, the temperature of the magnet is maintained at 32 ± 0.01 °C. The sample tube is a container for the sample to be tested, and its effective test range is ∅60 × 60 mm (diameter × height).
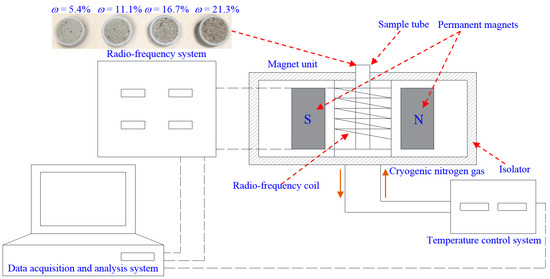
Figure 4.
Schematic diagram of the PQ001 mini nuclear magnetic resonance analyzer and the sample tested.
Cutting ring was used to prepare soil samples for the NMR test. To avoid the interference of the metal cutting ring on the NMR signal, the cutting ring used was made of PTFE material with a diameter of 45 mm and a height of 20 mm. It is worth noting that, owing to the poor water-holding capacity of the coral gravelly sand, part of the pore water will overflow from the sample under the pressure during the process of making sample by the sample pressing method; this phenomenon will be particularly obvious when the sample has a high ω. Therefore, the actual ω of the sample needs to be tested before the NMR test. The actual water contents of the coral gravelly sand samples prepared for the NMR test were 5.4%, 11.1%, 16.7%, and 21.3% (see Figure 4). The four kinds of coral gravelly sand samples with different water contents were placed in the test area of the sample tube to obtain the RF signals in the magnetic field. Through the processing and analysis of the nuclear magnetic signals, the content of pore water in different occurrence forms can be obtained.
3. Analysis of Strength Parameters
Consolidated-drained triaxial compression tests were carried out on coral gravelly sand with a relative density of 70% and different water contents under confining pressures of 50, 100, 200, and 400 kPa to obtain the peak and end shear strengths under different test conditions. Then, the shear strength parameters (c, φ) of the coral gravelly sand were determined according to the Mohr–Coulomb theory. The results are shown in Table 4. It is worth noting that the values of the shear strength parameters (c, φ) are valid only for the confining pressure range tested (i.e., 50–400 kPa).
Table 4.
The shear strength parameters of coral gravelly sand under different stress states.
From Table 4, the following can be observed and inferred: (1) Under the same test conditions, the internal friction angle of coral gravelly sand in the peak state was smaller than that in the end state, but the cohesion was greater than that in the end state. Under the effective confining pressure of less than 400 kPa, the shear strength envelope of coral gravelly sand with different water contents in the peak and end states are shown in Figure 5; the peak shear strength of coral gravelly sand under low stress was greater than that in the end state, and the peak shear strength under high stress was lower than that in the end shear strength.
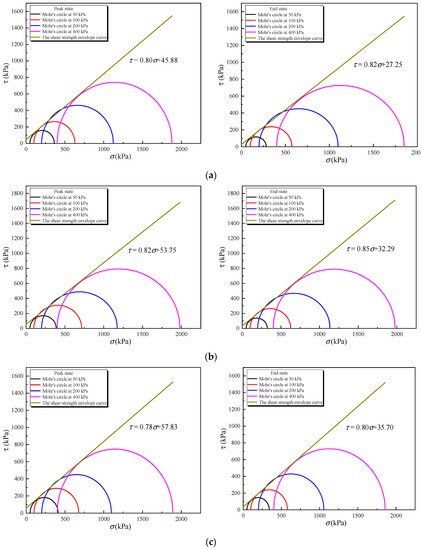
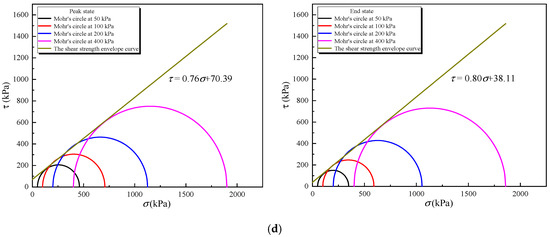
Figure 5.
The shear strength envelope curves of coral gravelly sand under different stress states and water contents: (a) ω = 6%, (b) ω = 12%, (c) ω = 18%, (d) ω = 24%.
This can be explained by the method for determining shear strength in the peak state and the end state, and the variation trend of the deviatoric stress–axial strain curve of coral gravelly sand under different stress conditions (see Figure 6). According to the relevant provisions in the Chinese National Standard of Soil Test Method (SL237-2019) [36], when the deviatoric stress–axial strain curve obtained by the triaxial shear test has a peak value, the deviatoric stress at the peak is taken as the peak strength; if the deviatoric stress–axial strain curve has no peak value, the deviatoric stress at 15% of the axial strain is taken as its peak strength. Regardless of whether the deviatoric stress–axial strain curve had a peak value or not, the corresponding deviatoric stress when the test was terminated was taken as the shear strength in the end state. A relevant study [1] showed that coral sand has similar dilatancy and contraction properties to terrigenous quartz sand during triaxial shearing. In a low-stress environment, the sample underwent dilatation during shearing, and the corresponding deviatoric stress–axial strain curve was a strain-softening type curve. The curve had a peak stress greater than the deviatoric stress at the end of the test. While in a high stress environment, the sample underwent contraction during shearing, and the corresponding deviatoric stress–axial strain curve was a strain-hardening type curve. During the entire shearing process, the deviatoric stress continued to increase with the increasing axial strain, and there was no peak stress in the curve; the deviatoric stress at 15% of the axial strain was taken as the shear strength at its peak state, and therefore was smaller than the shear strength at the end state. With increasing confining pressure, the coral sand transitioned from dilatancy to contraction during the shear process, and the corresponding deviatoric stress–axial strain curve changed from the strain-softening type to the strain-hardening type, which was the main reason for the internal friction angle of coral sand in the end stage being larger than that in the peak state; however, the cohesion was smaller than that in the peak state.
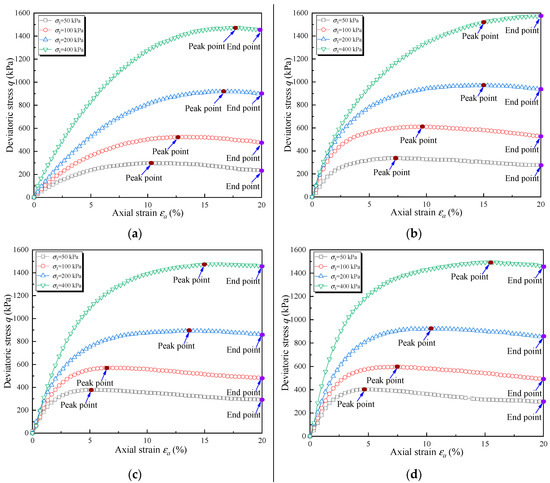
Figure 6.
Deviatoric stress-axial strain curves of coral gravelly sand under different confining pressures and water contents: (a) ω = 6%, (b) ω = 12%, (c) ω = 18%, (d) ω = 24%.
(2) In the peak state, as the ω increased, the value of the internal friction angle of coral gravelly sand ranged from 37.3° to 39.4°, and the cohesion was between 45.9 and 70.4 kPa; the difference between the maximum value and the minimum value of the internal friction angle was only 5.3% of the maximum value, and the difference between the maximum and minimum cohesion accounted for 34.8% of the maximum value. Similarly, in the end state, as the ω increased, the values of the internal friction angle and cohesion of coral gravelly sand were 38.5–40.4° and 27.3–38.1 kPa, respectively; the difference between the maximum value and the minimum value of the internal friction angle was only 4.7% of the maximum value, while the difference between the maximum and minimum cohesion values accounted for 28.3% of the maximum value. It can be seen that the impact of ω on the cohesion of coral gravelly sand was greater than the internal friction angle. Classical soil mechanics believes that sand-like non-cohesive soil does not have cohesion, but when there is water in the sand, the internal pores will shrink due to the negative pressure of capillary water, which creates cohesion for the sand. But this cohesion gradually disappears with the gradual increase of ω as the capillary water gradually turns into free water, so it is also called “fake cohesion” or “apparent cohesion”. The change of the ω in the sand has a significant effect on the content and distribution of capillary water in the sand, so the ω has a greater influence on the apparent cohesion of coral gravelly sand in the triaxial shear test.
(3) In the peak state and the end state, the internal friction angle of coral gravelly sand increased slightly with increasing ω (≤1°) and then decreased, reaching its peak at ω = 12%, while the cohesion continues to increase with increasing ω. To explain this test phenomenon, the author carried out laboratory compaction tests on coral gravelly sand with different water contents according to the relevant provisions of the Chinese National Standard of Soil Test Method (SL237-2019) [36] and the measured compaction curve is shown in Figure 7. Unlike that of fine-grained soil, the compaction curve of coral gravelly sand is a concave parabola, which means, the dry density is the largest in both the dry state and nearly saturated state; when the ω of coral gravel sand is in the intermediate state, the dry density under the same compaction is the smallest. The statistical parameter δ is defined as the ratio of the dry density of the sample to its maximum dry density at the corresponding ω to characterize the compactness of the sample under different water contents; its calculation is as follows:
where is the dry density of the sample and the maximum dry density of the sample when the water content is ω. Although the relative density of coral gravelly sand with different water contents in this paper was 70% (that is, the dry density was 1.40 g/cm3), the maximum dry density of coral gravelly sand under different water contents is different; therefore, there were differences between the δ values of coral gravelly sand with different water contents, and the δ value reached the maximum when the ω was 12%. Therefore, among the different water contents of coral gravelly sand (6%, 12%, 18% and 24%), the highest compactness at the same relative density was observed when the ω was 12%, and the sliding friction and occlusion friction between particles were more severe and the internal friction angle peaked. Overall; however, the ω had little impact on the internal friction angle. On the other hand, it is known from the above analysis that the apparent cohesion of coral gravelly sand with different water contents is closely related to the capillary water content inside. The apparent cohesion of the coral gravelly sand with a relative density of 70% in this paper continued to increase as the ω increased from 6% to 24%, indicating that the capillary water content in the coral gravelly sand sample continuously increased with increasing ω but did not reach saturation.
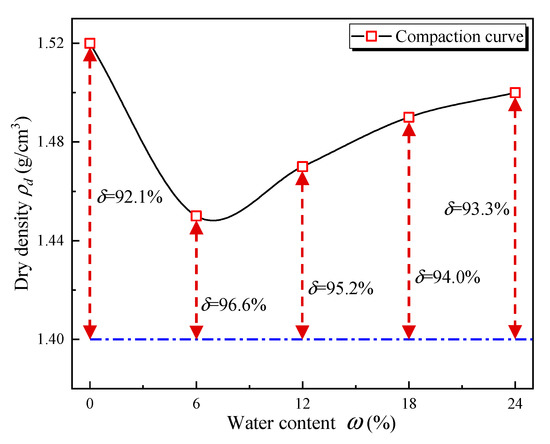
Figure 7.
Compaction curve of coral gravelly sand.
4. Microstructure Analysis
The macroscopic mechanical properties of a soil are comprehensively determined by its particle composition, pore structure, and pore water distribution. Under constant compactness, the change in ω of coral gravelly sand will change the proportion of pore water in different occurrence states, which will further affect the mechanical properties of the coral gravelly sand. To explain the results of the above triaxial shear tests from a micro perspective, a series of NMR tests were carried out on coral gravelly sand samples with 70% relative density and water contents of 5.4%, 11.1%, 16.7%, and 21.3%, respectively. Through the analysis of the test results, the pore distribution characteristics of the sample can be quantitatively described, and the variation in the pore water content in different occurrence states with the sample water content can be determined.
Figure 8 shows the T2 distribution curves of the coral gravel sand (that is, the transverse relaxation time) with different water contents. Transverse relaxation time in abscissa is the time required for the attenuation of the transverse magnetization by 63%, and the value is positively correlated with the pore radius; that is, the larger T2 is, the larger the corresponding pore radius will be. The ordinate represents the nuclear magnetic signal corresponding to a different pore radius, whose value is proportional to the pore water content. It can be seen from Figure 8 that the T2 distribution curves of coral gravelly sand samples with different water contents are all 2–3 peak structures, showing a certain change law. For the convenience of analysis, the pores corresponding to the first, second, and third peaks in the T2 distribution curve are defined as small, medium, and large pores, respectively. Each peak area reflects the water content in pores of different radius; the total area of T2 distribution curve characterizes the total amount of pore water within samples; and the proportion of each peak area relative to the total area of T2 distribution curve reflects the ratio of the water content in pores of different radius to the total water content in sample.
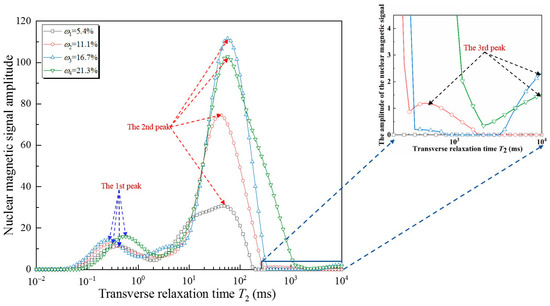
Figure 8.
T2 distribution curves of coral gravelly sand with different water contents.
In the classical soil mechanics, according to the compactness of pore water and soil particles, pore water can be divided into three types: bound water, capillary water, and free water. Bound water, also known as adsorbed water or irreducible water, refers to the pore water that is mechanically adsorbed between the soil particles, exists in the form of neutral water molecules, and does not participate in the formation of the crystal lattice. Capillary water refers to the pore water stored in the capillary pores under the action of capillary suction when the water content exceeding the molecular water holding capacity of the soil particles, which is not subject to gravity. Free water refers to the pore water that is free among soil particles. The water content of the sample is the sum of the pore water contents of the three different forms. The bound water, capillary water and free water are distributed in small, medium and large pores. Thus, pore water content in different occurrence forms can be decided using Equation (2).
where i = 1, 2, 3, corresponds to the three peak of T2 distribution curve; ω is the water content of sample; Si is the peak area of the ith number; S is the summary of each peak area of T2 distribution curve; refers to the pore water content in different pore radius corresponding to the the ith peak. From previous analysis, , , and are the amount of bound water, capillary water, and free water, respectively.
The pore water content in three different occurrence states of coral gravelly sand with different water contents was obtained, as shown in Figure 9. Figure 8 and Figure 9 show that (1) the pore water contents of the three different occurrence forms in the same sample were different, among which the capillary water content was the highest, followed by bound water and free water. When the sample water content (≤5.4%) was low, pore water mainly occurred in the micropores and mesopores among the particles in the form of bound water and capillary water, respectively, and the free water content was 0 (see Figure 10a). When the ω of the sample was increased from 5.4% to 11.1%, the free water content increased slightly (see Figure 10b). A small amount of free water intensifies the relative motion between particles, so the internal friction angle increased slightly within 1.2°. When the ω of the sample was relatively high (>11.1%), the increase in the free water content reduces the sliding friction and occluding friction in the relative motion between particles, so the internal friction angle presents a decreasing trend. When the ω of the sample increased from 11.1% to 21.3%, the free water content in the sample showed a limited increased. Therefore, the internal friction angle of the sample decreased with increasing ω, but the total variation range was less than 3°. (2) When the ω of the sample increased from 5.4% to 21.3% in turn, the pore water content of three different occurrence forms presented an increasing trend with increasing sample water content. However, there were significant differences in the growth rate: the growth rate of the capillary water content was the highest, followed by those of bound water and free water. (I) When the sample does not reach the saturation state, water prefers to exist in the micropores and mesopores in the form of bound water and capillary water. Only when the bound water and capillary water are almost saturated, the free water content in the macropore increases rapidly with increasing sample water content. On the other hand, the intergranular pores of coral gravel sand are larger than those of other coral sand classifications (see Figure 10). Therefore, it is difficult for free water to be preserved in the sample under the action of gravity; the sample has a poor water-holding capacity, which is one of the main reasons for the lowest free water content and growth rate. (II) Bound water is water adsorbed on the surface of coral sand particles under the action of an electric field (see Figure 10). Because coral sands with different water contents have the same compactness, there is little difference in the skeleton structure for adsorption by the bound water. With the increasing ω, the bound water content increased slightly, but the overall change was not great. It was observed that the bound water has little influence on the shear characteristics of coral gravel sand with different water contents. (III) Part of the pore water existed in the form of capillary water under the action of capillary suction. With the increasing ω in the sample, the capillarity water content increased successively, which also indicates that when the ω of the coral gravel sand increased from 5.4% to 21.3%, the capillarity water content does not reach its saturation, and thus does not begin to change from capillarity water to free water. The apparent cohesion is derived from the capillary suction inside the sample and thus also increases with increasing sample water content.
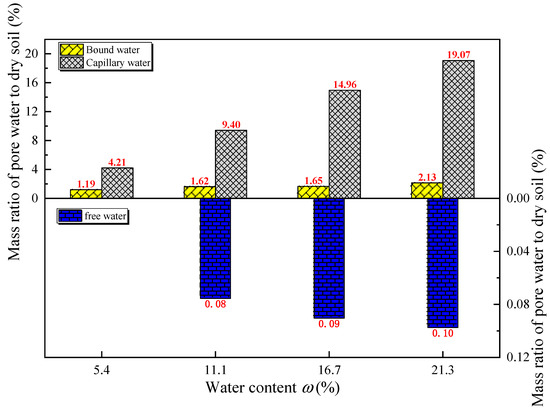
Figure 9.
Variation in the mass ratio of pore water in different occurrence forms to dry soil mass with the water content of the sample.
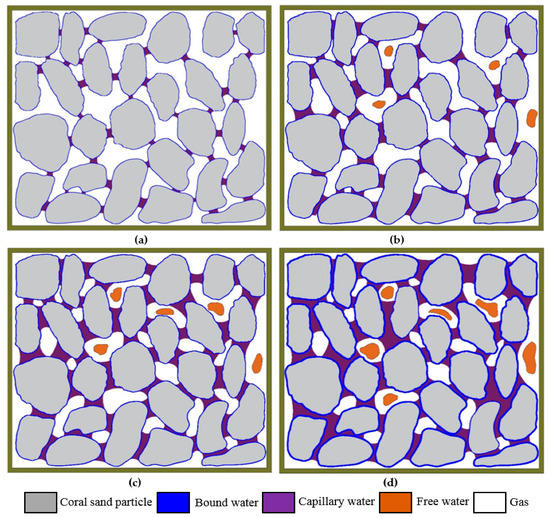
Figure 10.
Schematic diagram of pore water in different occurrence forms under different water contents: (a) ω = 5.4%, (b) ω = 11.1%, (c) ω = 16.7%, (d) ω = 21.3%.
5. Analysis of Particle Breakage
5.1. Relation between Particle Breakage and Water Content
To reveal the variation in the particle breakage of coral gravelly sand with ω during triaxial shearing, a series of triaxial shear tests was initially carried out on coral gravelly sand with different water contents under different confining pressures, and the particle gradation was measured before and after the test. Then, the median particle diameter (d50) and the relative breakage index (Br) proposed by Hardin [40] were used to evaluate the particle breakage of coral gravelly sand under different test conditions. It is worth noting that although several sets of triaxial shear tests were carried out on coral gravelly sand under the control ω and confining pressure conditions, as this paper aims to study the effect of ω on the particle breakage of coral gravelly sand, based on the statistical analysis of the triaxial shear test data under different water contents and confining pressure, the box plots were used to present the variation in the particle breakage of coral gravelly sand with changing ω (see Figure 11).
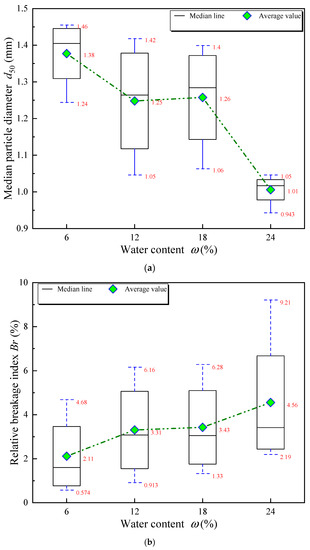
Figure 11.
Particle breakage amount versus water content of coral gravelly sand: (a) Median particle diameter versus water content; and (b) relative breakage index versus water content.
The box plots in Figure 11a describe the relationship between the median particle diameter (d50) of coral gravelly sand with different water contents (ω). The mean and median lines in the figure are statistical values of the median particle diameter (d50) of the coral gravelly sand samples with the same ω after the triaxial shear test under four different confining pressures. Figure 11a shows that the mean and median particle diameter (d50) of the coral gravelly sand sample decreased with increasing ω, which means that under the same stress condition, the sample with a high ω will produce more fine particles after the triaxial shear test, and the amount of particle breakage will be greater, which is consistent with the test results in Figure 11b. Figure 11b depicts the change in the relative breakage index (Br) of coral gravelly sand with different water contents (ω). It can be seen from Figure 11b that with the increasing ω, the relative breakage index (Br) of coral gravelly sand and the amount of particle breakage gradually increased due to the lubricating role of water during the relative movement of the particles. The larger the ω, the more likely the coral sand particles are to roll and move relative to each other, and the increased breakage and grinding during the relative motion increase the particle breakage.
It can also be seen in Figure 11 that the median particle diameter (d50) and relative breakage index (Br) show opposite variation trends with increasing ω. To explore the relationship between the median particle diameter (d50) and the relative breakage index (Br) of coral gravelly sand, the median particle diameter (d50) and relative particle breakage index (Br) of coral gravelly sand under different test conditions were statistically analyzed (as shown in Figure 12). It can be seen from Figure 12 that the median particle diameter (d50) decreased almost linearly with increasing relative breakage index, (Br) except for individual discrete points, and there was a significant negative correlation between the median particle diameter (d50) and relative breakage index (Br). The greater the particle breakage in the sample, the greater the relative breakage index, the higher the fine particle content in the sample, and the smaller the corresponding particle size when the cumulative particle mass content reaches 50%.
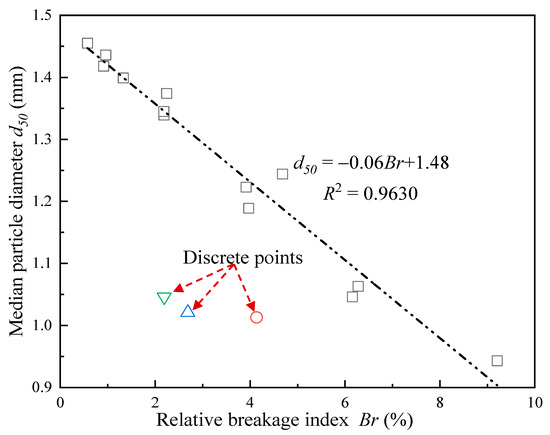
Figure 12.
The relationship between median particle diameter and relative breakage index.
5.2. Relationship between Particle Breakage and Plastic Work
Several related studies [41,42,43,44,45,46,47,48,49,50] have shown that particle breakage is an energy dissipation process. Therefore, this paper analyzes the variation in the particle breakage of coral gravelly sand under different water contents from the perspective of energy. Plastic work is defined as the irrecoverable energy absorbed by the specimen during the entire triaxial test [42]; it can be expressed using Equation (3) during the triaxial shear condition:
where is the plastic work, is the elastic shear strain, is the elastomer strain, and and are the deviatoric stress and mean effective stress of the specimen during the triaxial shear test, respectively. Since plastic deformation is the main deformation form of coral sand during the triaxial test [51], the energy associated with its elastic deformation is ignored when calculating the plastic work of coral gravelly sand with Equation (3). The results are shown in Table 5.
Table 5.
Each component of plastic work in triaxial shear test under different test conditions.
From Table 5, (1) it is known that the elastic deformation is ignored in the determination of plastic work. The plastic work is summary of portion originated from deviatoric stress () and the portion originated from mean effective stress (). The plastic work is mainly contributed by the portion induced by deviatoric stress q. (2) The plastic work Wp originated from deviatoric stress q is positive because both of quantities are positive. On the other hand, the coral sand samples maybe display dilation and compression behavior during shearing. When the sample compresses ( is positive), the plastic work by mean effective stress () is positive (see Figure 13a). When the sample dilates ( is negative), the plastic work by mean effective stress () is negative (see Figure 13b). The magnitude of the plastic work by mean effective stress () ultimately depends on the contribution of dilation and contraction degree of samples. Under low confining pressure, the degree of dilation of coral gravel sand is greater than that of contraction; therefore, the plastic work by mean effective stress () is negative. On the contrary, the degree of contraction of coral gravel sand is greater than that of dilation under high confining pressure, and the plastic work by mean effective stress () is positive.
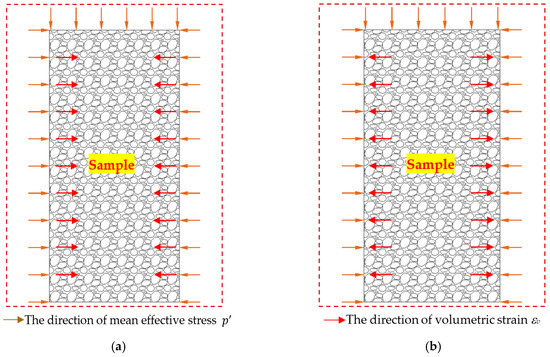
Figure 13.
Schematic diagram of the directions of mean effective stress and volumetric strain under different deformation patterns: (a) Contraction, (b) dilatancy.
Figure 14 shows the relationship between the relative breakage index (Br) of coral gravelly sand particles with different water contents and the plastic work (Wp). It can be seen from Figure 14 that the relative breakage index of coral gravelly sand with different water contents gradually increased with the increasing plastic work, and the power function in Equation (4) can be used to express the increasing trend of relative breakage index with the increased plastic work. Lee and Coop [52] and Chen et al. [53] studied the relationship between the relative breakage index and plastic work of terrigenous quartz sand and granite soil with different water contents, respectively, and also reached similar conclusions. α and β in Equation (4) are the coefficients related to the physical properties of the sample (i.e., mineral composition, particle size, gradation, strength and shape, density, water content, etc.) and stress condition, respectively; α represents the impact of other factors on the relative breakage index of the coral gravelly sand when the plastic work is 1.0 and takes a positive value; β reflects the increasing rate of the relative particle breakage index as the plastic work increases, and also takes a positive value.
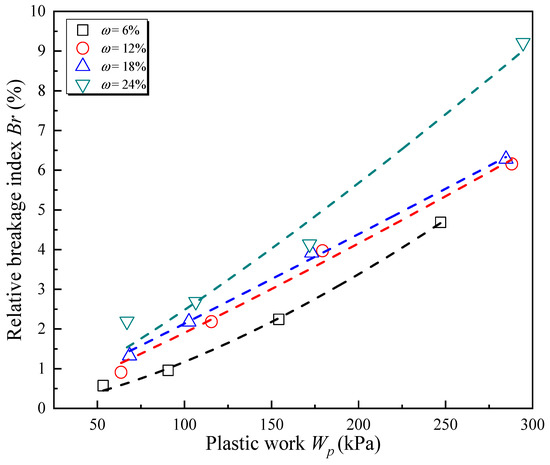
Figure 14.
Relationship between relative breakage index and plastic work under different water contents.
Since the test conditions of the coral gravelly sand samples used in this paper are the same except for the ω, it can be considered that the difference in ω leads to the difference in the relative breakage index–plastic power function curve of the coral gravelly sand with different water contents in Figure 14. To explore the effect of ω on the growth trend of the relative breakage index of coral gravelly sand with increasing plastic work, the relative breakage index–plastic work curves of coral gravelly sand with four different water contents were fitted and the equation and parameters are shown in Table 6. It can be seen from Table 6 that (1) α increased gradually with increasing ω as a very small amount of particle breakage occurs under the influence of other factors (such as hydration) even when there were no external forces at work on the coral sand; and the larger the ω, the larger the amount of particles breakage caused by factors other than plastic work. (2) The β value gradually decreased as the ω increased, indicating that when the plastic work is constant, the amount of particle breakage caused by the plastic work decreases with increasing ω; and the results in Figure 11 show that the amount of particle breakage increased with increasing ω, indicating that when the ω of sample is high, other factors except for plastic work are the dominant factors that cause the particle breakage of coral sand. This is in accordance with the foregoing conclusions drawn from the changing law of α with the ω. (3) The relationship between the parameters α and β and the ω can be expressed by Equations (5) and (6), and there was a high correlation between them.
Table 6.
Relative breakage index–plastic work fitting formula and parameters.
By substituting Equations (5) and (6) into Equation (4), a model for calculating the relative breakage index of coral gravelly sand that can reflect the influence of ω and plastic work and can describe the evolution law of particle breakage. The model is as shown in Equation (7) below:
The relative breakage index of the coral gravelly sand are calculated by Equation (7) established in this paper and compared with the measured relative breakage index value obtained by the experiment. The applicability of Equation (7) in the calculation of the relative breakage index of coral gravelly sand was evaluated by comparing the calculated and measured values, as shown in Table 7. It can be seen from Table 7 that the calculated value obtained using Equation (7) is relatively close to the actual value, and the ratio of the calculated value to the measured value is between 0.72 and 1.10, which means that the calculated value obtained by Equation (7) has a high accuracy and will provide a good reference for the prediction of the relative breakage index of coral gravelly sand in actual projects with high practicality. In addition, the particle gradation, shape, density, loading condition, etc. of coral gravelly sand also affect the relative breakage index. Relevant research on the mathematical basis of the equation for calculating the relative breakage index needs to be carried out from the variation in the relative breakage index with various parameters and the correlation of mathematics; this will provide a theoretical basis for establishing an empirical formula that is generally applicable to the evaluation of the relative breakage indices of various types of coral gravelly sand.
Table 7.
Comparison between the calculated value and measured value of Br.
6. Conclusions
The main conclusions of this paper are as follows:
- (1)
- Coral gravelly sand with a relative density of 70% and different water contents undergo contraction during the triaxial shear process under confining pressures of 200 and 400 kPa, and the deviatoric stress at 15% of the axial strain is taken as its peak stress, which is the main reason for the peak friction angle being smaller than the friction angle in the end state.
- (2)
- The water content (ω) has less impact on the internal friction angle of coral gravelly sand. As the ω increases, the internal friction angle increases slightly (<1°) and then decreases with the increasing ω, and (the overall change is within 3°). The apparent cohesion is more sensitive to changes in the ω, which increases almost linearly with increasing ω. Therefore, when designing and constructing projects involving coral gravelly sand, the impact of rainfall and seawater tides on the project should be considered.
- (3)
- When the water content (ω) of the sample is small, the pore water mostly exists in the form of bound water and capillary water, and the free water content is relatively small. As the ω of the sample increases, the capillary water content is the highest and grows the fastest among the three pore water types, followed by bound water and free water.
- (4)
- The increase in free water content is the internal cause of the internal friction angle of coral gravelly sand with the water content (ω) greater than 11.1% continuously decreasing with increasing ω. The capillary water content is the main factor impacting the apparent cohesion of coral gravelly sand, and there is a positive correlation between the two.
- (5)
- As the water content (ω) increases, the median particle diameter (d50) gradually decreases, and the relative breakage index (Br) increases with increasing ω. The median particle diameter (d50) is negatively correlated with the relative breakage index (Br) and the linear relationship between the two is obvious except for individual discrete points.
- (6)
- There is a power function relationship between the relative breakage index of the coral gravelly sand and the plastic work. Through statistical analysis of the test data, a calculation model was established to allow for reasonable predictions of the relative breakage index of the coral sand based on the water content (ω) and stress process.
Author Contributions
Conceptualization, Y.W. and X.W.; methodology, X.W.; validation, X.W.; formal analysis, X.W. and J.-H.S.; investigation, J.-H.S.; resources, X.W.; data curation, X.W.; writing—original draft preparation, J.C.; writing—review and editing, C.-Q.Z.; visualization, X.-Z.W.; supervision, C.-Q.Z.; project administration, Y.W.; funding acquisition, Y.W. All authors have read and agreed to the published version of the manuscript.
Funding
This research was funded by the Consultative Project by Chinese Academy of Engineering(2019-XZ-18), the National Natural Science Foundation of China (Nos. 41877271, 51908153), the Strategic Priority Research Program of the Chinese Academy of Sciences (XDA13010301), and Guangzhou City Technology and Science Program (201904010278).
Conflicts of Interest
All the authors have read and approved this version of the article, and due care has been taken to ensure the integrity of the work. All the authors have no conflict of interest to declare.
References
- Wang, X.; Zhu, C.Q.; Wang, X.Z.; Qin, Y. Study of dilatancy behaviors of calcareous soils in a triaxial test. Mar. Georesour. Geotechnol. 2019, 37, 1057–1070. [Google Scholar] [CrossRef]
- Wang, X.Z.; Wang, X.; Hu, M.J.; Zhu, C.Q.; Meng, Q.S.; Wang, R. Study on permeability characteristics of interlayer of calcareous silt in artificial island. Rock Soil Mech. 2017, 38, 3127–3135. [Google Scholar]
- Terzaghi, K. Theoretical Soil Mechanics; John Wiley & Sons, Inc.: New York, NY, USA, 1943. [Google Scholar]
- Li, J.G. Experimental Research on Dynamic Behavior of Saturated Calcareous Sand Under Wave Loading. Ph.D. Thesis, Institute of Rock & Soil Mechanics, Chinese Academy of Sciences, Beijing, China, 2005. [Google Scholar]
- Yu, H.Z. Experimental Research on Dynamic Behavior of Saturated Calcareous Sand Under Complex Stress Conditions. Ph.D. Thesis, Huazhong University of Science and Technology, Wuhan, China, 2006. [Google Scholar]
- Xu, X.Y.; Wang, R.; Hu, M.J.; Meng, Q.S. Experimental study of dynamic characteristics of saturated calcareous soil explosion compaction. Rock Soil Mech. 2012, 33, 402–406. [Google Scholar]
- Lambe, T.W. The engineering behavior of compacted clay. J. Soil Mech. Found. Div. 1958, 184, 46–55. [Google Scholar]
- Mitchell, J.K. Fundamentals of Soil Behavior; John Wiley & Sons, Inc.: New York, NY, USA, 1976. [Google Scholar]
- Miao, L.C.; Zhong, X.C.; Yin, Z.Z. The relationship between strength and water content of expansive soil. Rock Soil Mech. 1999, 20, 71–75. [Google Scholar]
- Lin, H.; Yin, Z.Z. Variation of unsaturated soil strength with water contents. Chin. J. Rock Mech. Eng. 2005, 26, 1499–1503. [Google Scholar]
- Shen, C.N.; Fang, X.W.; Wang, H.W.; Sun, G.S.; Guo, J.F. Research on effects of suction, water content and dry density on shear strength of remolded unsaturated soils. Rock Soil Mech. 2009, 30, 1347–1351. [Google Scholar]
- Bian, J.M.; Wang, B.T. Research on influence of water contents on the shear strength behavior of unsaturated soil. Chin. J. Undergr. Space Eng. 2011, 7, 17–21. [Google Scholar]
- Braja, M.D. Principles of Geotechnical Engineering; Brooks Cole/Thompson Learning: Pacific Grove, CA, USA, 2002. [Google Scholar]
- Xiong, C.R.; Liu, B.C.; Zhang, J.S.; Liu, D.W. Study on relation of shear strength parameters with saturation of remolded unsaturated cohesive soil. Rock Soil Mech. 2003, 24, 195–198. [Google Scholar]
- Cokca, E.; Erol, O.; Armangil, F. Effects of compaction moisture content on the shear strength of an unsaturated clay. Geotech. Geol. Eng. 2004, 22, 285–297. [Google Scholar] [CrossRef]
- Lin, H.Z.; Li, G.X.; Yu, Y.Z.; Lv, H. Influence of matric suction on shear strength behavior of unsaturated soils. Rock Soil Mech. 2007, 28, 1931–1936. [Google Scholar]
- Huang, K.; Wan, J.W.; Chen, G.; Zeng, Y. Testing study of relationship between water content and shear strength of unsaturated soils. Rock Soil Mech. 2012, 33, 2600–2604. [Google Scholar]
- Chen, G.F.; Shi, B.F.; Huang, Z.H.; Zhang, J.J.; Shi, M. Study on the influence of moisture content to shear strength tests for unsaturated soils. J. Eng. Geol. 2012, 20, 127–131. [Google Scholar]
- Wang, H.D.; Gao, C.D.; Liu, F.C. Experimental study of the influence of water content on the mechanical characteristics of unsaturated sandy soil. J. Hunan Univ. Nat. Sci. 2015, 42, 90–96. [Google Scholar]
- Wang, X.; Cui, J.; Wu, Y.; Zhu, C.Q.; Wang, X.Z. Mechanical properties of calcareous silts in a hydraulic fill island-reef. Mar. Georesour. Geotechnol. 2020. [Google Scholar] [CrossRef]
- Alba, J.L.; Audibert, J.M. Pile design in calcareous and carbonaceous granular materials: An historic overview. In Proceedings of the Second International Conference on Engineering for Calcareous Sediments, Balkema, Rotterdam, 21–24 February 1999; Volume 1, pp. 29–44. [Google Scholar]
- Demars, K.R.; Nacci, V.A.; Kelly, W.E.; Wang, M.C. Carbonate content: An index property for ocean sediments. In Proceedings of the 8th Annual Offshore Technology Conference, Houston, TX, USA, 3–6 May 1976; pp. 97–106. [Google Scholar]
- Li, G.; Zhang, J.L.; Yang, Q.; Jiang, M.J. Centrifugal test and numerical assessment for settlement of a large-scale artificial island constructed on deep marine clays. Eur. J. Environ. Civ. Eng. 2017, 21, 172–192. [Google Scholar] [CrossRef]
- Yang, Q.; Ren, Y.B.; Niu, J.L.; Cheng, K.; Hu, Y.X.; Wang, Y. Characteristics of soft marine clay under cyclic loading: A review. Bull. Eng. Geol. Environ. 2018, 77, 1017–1046. [Google Scholar] [CrossRef]
- Shaqour, F.M. Cone penetration resistance of calcareous sand. Bull. Eng. Geol. Environ. 2007, 66, 59–70. [Google Scholar] [CrossRef]
- Hassanlourad, M.; Salehzadeh, H.; Shahnazari, H. Dilation and particle breakage effects on the shear strength of calcareous sands based on energy aspects. Int. J. Civ. Eng. 2008, 6, 108–119. [Google Scholar]
- Hassanlourad, M.; Salehzadeh, H.; Shahnazari, H. Drained shear strength of carbonate sands based on energy approach. Int. J. Geotech. Eng. 2014, 8, 1–9. [Google Scholar] [CrossRef]
- Xiao, Y.; Liu, H.L.; Chen, Q.S.; Ma, Q.F.; Xiang, Y.Z.; Zheng, Y.R. Particle breakage and deformation of carbonate sands with wide range of densities during compression loading process. Acta Geotech. 2017, 12, 1177–1184. [Google Scholar] [CrossRef]
- Shen, Y.; Zhu, Y.H.; Liu, H.L.; Li, A.; Ge, H.Y. Macro-meso effects of gradation and particle morphology on the compressibility characteristics of calcareous sand. Bull. Eng. Geol. Environ. 2018, 77, 1047–1055. [Google Scholar] [CrossRef]
- Wu, Q.; Ding, X.M.; Zhang, Y.L.; Chen, Z.X. Comparative study on seismic response of pile group foundation in coral sand and Fujian sand. J. Mar. Sci. Eng. 2020, 8, 189. [Google Scholar] [CrossRef]
- He, S.H.; Zhang, Q.F.; Ding, Z.; Xia, T.D.; Gan, X.L. Experimental and estimation studies of resilient modulus of marine coral sand under cyclic loading. J. Mar. Sci. Eng. 2020, 8, 287. [Google Scholar] [CrossRef]
- Wang, Y.; Zhou, L.X.; Wu, Y.; Yang, Q. New simple correlation formula for the drag coefficient of calcareous sand particles of highly irregular shape. Powder Technol. 2018, 326, 379–392. [Google Scholar] [CrossRef]
- Wang, G.; Ye, Q.G.; Zha, J.J. Experimental study on mechanical behavior and particle crushing of coral sand-gravel fill. Chin. J. Geotech. Eng. 2017, 40, 802–810. [Google Scholar]
- Wang, X.Z.; Wang, X.; Chen, J.W.; Wang, R.; Hu, M.J.; Meng, Q.S. Experimental study on permeability characteristics of calcareous soil. Bull. Eng. Geol. Environ. 2017, 77, 1753–1762. [Google Scholar] [CrossRef]
- Shang, G.W.; Sun, L.Q.; Li, S.; Liu, X.L.; Chen, W.W. Experimental study of the shear strength of carbonate gravel. Bull. Eng. Geol. Environ. 2020, 79, 2381–2394. [Google Scholar] [CrossRef]
- Chinese Ministry of Water Resources. Standard for Soil Test Method (GB/T 50123-2019); China Planning Press: Beijing, China, 2019.
- Wang, X.; Wang, X.Z.; Zhu, C.Q.; Meng, Q.S. Shear tests of interfaces between calcareous sand and steel. Mar. Georesour. Geotechnol. 2019, 37, 1095–1104. [Google Scholar] [CrossRef]
- Zhang, J.M.; Wang, R.; Shi, X.F.; Li, J.G.; Chen, H.Y. Compression and crushing behavior of calcareous sand under confined compression. Rock Soil Mech. 2005, 24, 3327–3331. [Google Scholar]
- Tian, H.H.; Wei, C.F. A NMR-based testing and analysis of adsorbed water content. Sci. Sin. Technol. 2014, 44, 295–305. [Google Scholar]
- Hardin, B.O. Crushing of soil particles. J. Geotech. Eng. 1985, 110, 1177–1192. [Google Scholar] [CrossRef]
- Miura, N.; O-hara, S. Particle crushing of a decomposed granite soil under shear stresses. Soils Found. 1979, 19, 1–14. [Google Scholar] [CrossRef]
- Lade, P.V.; Yamamuro, J.A.; Bopp, P.A. Significance of particle crushing in granular materials. J. Geotech. Eng. 1996, 122, 309–316. [Google Scholar] [CrossRef]
- Wu, Y.; Hyodo, M.; Aramaki, N. Undrained cyclic shear characteristics and crushing behaviour of silica sand. Geomech. Eng. 2018, 14, 1–8. [Google Scholar]
- Wu, Y.; Li, N.; Hyodo, M.; Gu, M.X.; Cui, J.; Spencer, B.F. Modeling the mechanical response of gas hydrate reservoirs in triaxial stress space. Int. J. Hydrogen Energy 2019, 44, 26698–26710. [Google Scholar] [CrossRef]
- Wu, Y.; Yamamoto, H.; Cui, J.; Cheng, H. Influence of load mode on particle crushing characteristics of silica sand at high stresses. Int. J. Geomech. 2020, 20, 04019194. [Google Scholar] [CrossRef]
- Winter, M.J.; Hyodo, M.; Wu, Y.; Yoshimoto, N.; Hasan, M.B.; Matsui, K. Influences of particle characteristic and compaction degree on the shear response of clinker ash. Eng. Geol. 2017, 230, 32–45. [Google Scholar] [CrossRef]
- Wu, Y.; Hyodo, M.; Cui, J. On the critical state characteristics of methane hydrate-bearing sediments. Mar. Petrol. Geol. 2020, 116, 104342. [Google Scholar] [CrossRef]
- Hyodo, M.; Wu, Y.; Aramaki, N.; Nakata, Y. Undrained monotonic and cyclic shear response and particle crushing of silica sand at low and high pressures. Can. Geotech. J. 2017, 54, 207–218. [Google Scholar] [CrossRef]
- Hyodo, M.; Wu, Y.; Nakashima, K.; Kajiyama, S.; Nakata, Y. Influence of fines content on the mechanical behavior of methane hydrate-bearing sediments. J. Geophys. Res. Solid Earth 2017, 122, 7511–7524. [Google Scholar] [CrossRef]
- Kajiyama, S.; Wu, Y.; Hyodo, M.; Nakata, Y.; Nakashima, K.; Yoshimoto, N. Experimental investigation on the mechanical properties of methane hydrate-bearing sand formed with rounded particles. J. Nat. Gas Sci. Eng. 2017, 45, 96–107. [Google Scholar] [CrossRef]
- Wang, X.Z.; Jiao, Y.Y.; Wang, R.; Hu, M.J.; Meng, Q.S.; Tan, F.Y. Engineering characteristics of the calcareous sand in Nansha Islands, South China Sea. Eng. Geol. 2011, 120, 40–47. [Google Scholar] [CrossRef]
- Lee, I.K.; Coop, M.R. The intrinsic behaviour of a decomposed granite soil. Géotechnique 1995, 45, 117–130. [Google Scholar] [CrossRef]
- Chen, W.B.; Liu, K.; Yin, Z.Y.; Yin, J.H. Crushing and flooding effects on one-dimensional time-dependent behaviors of a granular soil. Int. J. Geomech. 2020, 20, 04019156. [Google Scholar] [CrossRef]


© 2020 by the authors. Licensee MDPI, Basel, Switzerland. This article is an open access article distributed under the terms and conditions of the Creative Commons Attribution (CC BY) license (http://creativecommons.org/licenses/by/4.0/).