Article

Research on Wind Speed Inversion Method for X-Band Networked SAR Satellite

1
College of Oceanography and Space Informatics, China University of Petroleum, Qingdao 266580, China
2
College of Control Science and Engineering, China University of Petroleum, Qingdao 266580, China
*
Authors to whom correspondence should be addressed.
J. Mar. Sci. Eng. 2020, 8(9), 626; https://doi.org/10.3390/jmse8090626
Submission received: 8 July 2020 / Revised: 12 August 2020 / Accepted: 17 August 2020 / Published: 19 August 2020

Abstract

:
Synthetic aperture radar (SAR) can extract sea surface wind speed information. To extract wind speed information through the geophysical model function (GMF), the corresponding wind direction information must be input. This article introduces some concepts about networked SAR satellites. The networked satellites enable multiple SARs to observe the same sea surface at different incidence angles at the same time. Aiming at the X-band networked SAR data with different incident angles, the cost function is established by using the GMF. By minimizing the cost function, accurate wind speed information can be extracted without inputting wind direction information. When the noise is small, the wind direction information is introduced, and the accuracy of the extracted wind speed will be improved. When the noise is less than 1 dB and the incident angle is greater than 30°, the root-mean-square error (RMSE) of the wind speed extracted by this method is basically less than 2 m/s.

1. Introduction

The sea surface wind field is the main source of power for upper ocean movement, and is closely related to most physical processes in the ocean. In ocean dynamics, the sea surface wind field is not only the direct driving force for the formation of sea waves, but also an important source of power for regional and global ocean circulations. Accordingly, fast and accurate access to sea surface wind information will aid more scientific judgment and forecasting of marine environments, and even global climate change.
Current methods for acquiring sea surface wind field information include shore-based observation stations, ships, buoys, scatterometers, and synthetic aperture radars. Among them, the observation range of shore-based observation stations, ships, and buoys is limited, and has a single-point distribution. Moreover, due to high maintenance costs, very few sensors are deployed in some sea areas, and thus, large-scale observations cannot be realized. With the development of satellite remote sensing technology, the scatterometer was initially applied to the field of ocean wind fields, which can acquire large-scale sea surface wind field data in a short time [1]. It is a relatively mature wind field information observation method, but the spatial resolution is low, and the accuracy of near-shore wind field inversion is poor [2]. With the development of synthetic aperture radar (SAR) technology, spaceborne synthetic aperture radar can achieve all-weather, all-day observation. It has a high spatial resolution (up to several meters to tens of meters), which compensates for the deficiency of scatterometers. Synthetic aperture radar is the main means to realize large-scale observations of sea surface wind fields, at present and in the future [3].
SAR is an active microwave imaging radar. SAR transmits electromagnetic wave signals to the sea surface and receives echo signals. The echo signal is processed to an SAR image. When the electromagnetic wave irradiates the target feature, the object will spread the electromagnetic wave energy in all directions in a spherical shape. This phenomenon is called scattering. Objects that scatter electromagnetic waves are scatterers. Scattering opposite to the incident direction of electromagnetic waves is called backscatter. The intensity of the backscattered energy is described by the radar cross section (RCS), usually expressed by σ.
SAR improves the range direction resolution by compressing radio pulses, and uses the Doppler shift of the transmitted and received scattered signals to increase the azimuth direction resolution, thereby achieving high spatial resolution imaging. In addition, the working band of SAR is in the microwave band. Signals in this band have higher wavelengths than visible and infrared light, and can penetrate clouds. Therefore, the synthetic aperture radar imaging has the characteristic of not being affected by light conditions, cloud, and rain. SAR’s all-weather, high spatial resolution ocean observation advantages are particularly suitable for large-area target information imaging. Spaceborne SAR can realize a wide range of observations on the Earth’s surface, and the observation range is affected by the satellite’s orbit and SAR working mode; but the time resolution of spaceborne SAR is low. Affected by the satellite flight speed and the rotation of the Earth, at present, the time resolution of spaceborne SAR can be less than 12 h.
Three main methods are available for extracting wind information from synthetic aperture radar images. The first method estimates the wind speed from the azimuth cut-off degree in the SAR spectrum according to the relationship among the wind speed, azimuth cutoff, and wave height [4]. The dependency of the azimuth cut-off on the square root of the significant wave height is approximately linear, while the dependency on the wind speed is approximately linear only if the sea state is fully developed [5]. Corcione used the azimuth cutoff (λc)-to-wind speed linear model to invert wind speeds [4]. The root-mean-square error (RMSE) of the extracted wind speed is 1.8–2 m/s. The second approach uses an optimal inversion method to estimate vector winds, combining the SAR data and background numerical weather prediction model data [6]. The third method is based on the empirical relationship between the wind vector and SAR information, also known as geophysical model function (GMF), such as the C-band model (CMOD) [7] and the X-band model (XMOD) [8].
SAR wind speed inversion based on GMFs is a mature and widely used method. Among them, XMOD1 and XMOD2 are applicable to co-polarized X-band SAR data [8,9,10,11]. CMOD4, CMOD-IFR2, CMOD5, and CMOD5.N are suitable for C-band co-polarized SAR data [7,12,13,14]. The GMF was first applied to scatterometers [7]. The scatterometer uses different azimuth angles to make multiple observations of the same sea surface. According to the maximum likelihood estimation technique, a GMF-based objective function was established to obtain all the possible combinations of the wind speed and wind direction, and the possible results were filtered to find the optimal solution [15]. However, since the observation azimuth of SAR is fixed, it is impossible to conduct multiple observations on the same sea surface unit within a short interval; therefore, SAR wind speed inversion cannot be carried out in the same way as the application of GMFs to scatterometers. If the wind direction is taken as initialization information, the incident angle and relative wind direction information of the GMF can be determined. Thus, the wind speed can be determined to complete the inversion of the sea surface wind speed [16].
At present, there are at least three ways to obtain the wind direction: (1) obtain the sea surface wind direction by using linear streak information contained in an SAR image [17,18,19]; (2) obtain the sea surface wind direction using a numerical prediction model [20,21]; and (3) obtain the sea surface wind direction by spatiotemporally matching SAR data with wind direction information from a scatterometer [21].
A large number of early observations and studies have shown that the axial direction of the atmospheric boundary layer vortex is basically coincident with the direction of the sea surface wind vector, which appears as a wind streak with linear characteristics in an SAR image [22]. The wind direction of the sea surface wind field can be obtained by applying a two-dimensional Fourier transform to the image, but there is an uncertainty of 180° in the wind direction. According to numerous reports, SAR images with wind streak information account for only approximately 60% of all SAR images acquired over the sea surface [23]. Hence, this method suffers from substantial limitations in the inversion of the sea surface wind field, especially in operational applications.
Monaldo used wind direction information from the Navy Operational Global Atmospheric Prediction System (NOGAPS) and the SeaWinds scatterometer as the initial wind directions to conduct SAR wind speed inversions [21]. By comparison, the RMSE of the former wind speed inversion result, compared with the SeaWinds wind speed, is 1.78 m/s, while the latter is 1.36 m/s. When using wind direction data from numerical prediction models or scatterometers to invert wind speed, a resampler is needed to match wind direction data with SAR image pixels in time and space. Finally, wind speed is inverted according to a GMF. The problem with this approach is that wind direction data have a low spatial resolution; consequently, it is necessary to interpolate the wind direction to each pixel of the SAR image. However, many small-scale wind direction changes are ignored in this process, affecting the wind speed inversion accuracy. Moreover, the acquisition times of the wind direction data may be different from those of the SAR images; the greater the difference is, the worse the inversion result.
In SAR wind speed inversion, wind direction data should be input when a GMF is directly used. As a result, the wind speed inversion accuracy is affected by the accuracy of the wind direction. Scatterometers make several effective observations of the same sea surface unit at different azimuth angles. Therefore, the maximum likelihood estimation technique can be used to estimate the wind speed and wind direction simultaneously. Employing this principle, He et al. divided Environmental Satellite (ENVISAT) Advanced SAR (ASAR) images into 25 × 25 km units, and the difference in the incident angles between adjacent units was over 1° [24]. Under the condition that other relevant parameters are known, the cost function is established based on the differences in the incident angle between adjacent elements. The wind speed is inverted through a series of solution processes. However, this approach requires sea conditions with a uniform distribution of wind field and a relatively slow change, and external wind direction data are needed to determine the unique solution. When this method is applied to spaceborne SAR data, it is necessary to ensure that the incident angles of adjacent sub-images are different. Therefore, the range of adjacent sub-images is relatively large, and the resolution of the wind speed inversion is low (25 × 25 km).
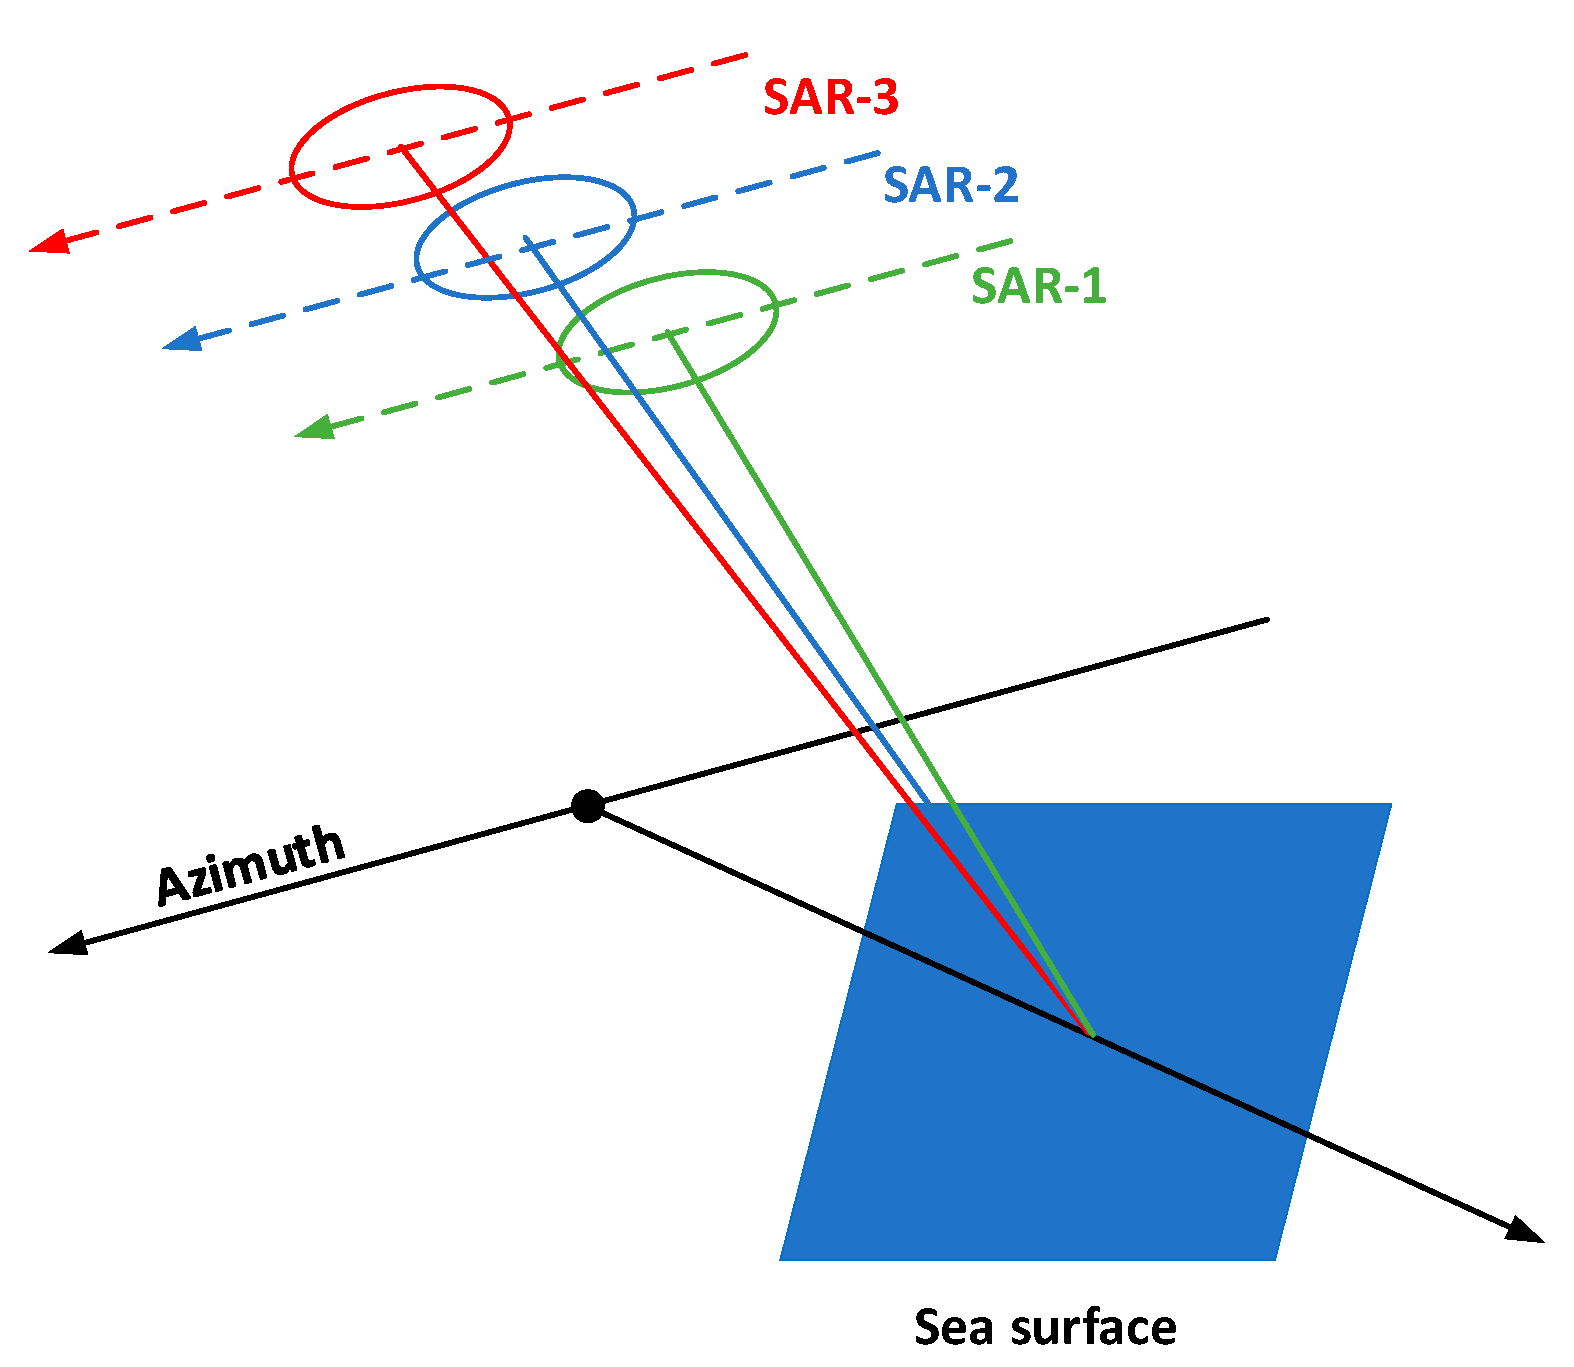
With the ongoing development of satellite technology, networked satellites will become a practical satellite working mode. Multiple spaceborne SARs are used to observe the sea surface and obtain SAR data of the same sea area under different incident angles, which can ensure the consistency of the sea surface wind field between different SAR data. Therefore, when applying the wind speed inversion method of multi-incident angle to the data of a networked SAR satellite, the resolution of the SAR wind speed inversion is not limited by the differences in the incident angles.
In view of the current problems in wind speed inversion, this paper proposes a working mode of satellite networking. In this mode of operation, three satellite-borne SARs observe the same sea surface at different incidence angles. Since this working mode of networking satellites has not been implemented, the actual networking SAR data cannot be obtained. Therefore, this paper obtains the networked X-band SAR data through simulation. Aiming at the data of three SARs observing the same sea surface at different incident angles, this paper uses XMOD to establish a cost function. By minimizing the cost function, high-resolution wind speed information is extracted without inputting wind direction information. Under the condition of less noise of SAR data, inputting wind direction information can further improve the accuracy of wind speed information.

2. Materials

The experimental data is networked SAR satellite data. The current networked SAR satellite system cannot realize that multiple SARs simultaneously observe the same sea surface at different incident angles. Therefore, it is impossible to obtain actual data of networked SAR satellites that meet the experimental requirements through on-orbit spaceborne SAR. Geophysical model functions are empirical functions that fit real SAR data with sea surface information. It is assumed that the relationship between the backscatter coefficient in the geophysical model function and the input parameter is the same as in the real world. In response to this situation, this paper uses geophysical model functions to simulate SAR data to generate data for networked SAR satellites under different conditions. These simulated data can then be used as the basis for subsequent studies.

2.1. Geophysical Model Functions

GMF is a common method for inversion of sea surface wind speed from SAR data. This model is an empirical model based on a large number of radar backscatter coefficients and statistical data of buoy data or numerical prediction models. GMF describes the relationship between radar incidence angle, sea surface wind speed, relative wind direction, and backscatter coefficient. At present, the GMF applied to X-band SAR data mainly includes XMOD1 and XMOD2. For the SAR data provided by TerraSAR-X and COSMO/SKYMED, XMOD1 and XMOD2 have two forms respectively. XMOD1, developed by Nirchio, is a model obtained by fitting the relationship between Cosmo-SkyMed SAR data and wind data obtained from the SeaWinds instrument on QuikSCAT [7]. The model was developed and tested for wind speeds in the range of 2 to 8 m/s. The XMOD2 model was obtained by Nirchio optimizing XMOD1 [8], and is suitable for Cosmo/SkyMed X band data. It raises the upper limit of wind speed that can be extracted to 25 m/s. The XMOD1, developed by Yongzheng Ren, was tuned based on TerraSAR-X data and co-located wind fields derived from the European Centre for Medium-Range Weather Forecasts (ECMWF) ERA-40 re-analysis data [9]. It is a linear geophysical model function developed for 6–14 m/s SAR data. Then, Xiaoming Li optimized XMOD1 to obtain XMOD2 [10]. This model is a non-linear geophysical model suitable for co-polarized SAR data with an incident angle of 20–45°, and a wind speed of 2–20 m/s.
Because the performance of XMOD2 is better than XMOD1, this paper chooses XMOD2 for the research of this paper. The XMOD2 used for TerraSAR-X data is similar in form to CMOD5, so this model is used in subsequent studies. The functional form of XMOD2 is as follows:
σ 0 = B 0 ( 1 + B 1 cos ϕ + B 2 cos 2 ϕ ) 1.6
where σ 0 is the backscatter coefficient, ϕ is the relative wind direction angle (the angle between the wind direction and the SAR viewing direction), and B 0 , B 1 , and B 2 are functions of the wind speed u and the incident angle θ . The transfer functions in B 0 and B 2 are the same as those used in CMOD5. The B 0 term is defined as:
B 0 = 10 a 0 + a 1 u f ( a 2 u , s 0 ) γ
in which a 0 , a 1 , a 2 , s 0 , and γ are functions of the incident angle. The B 1 in XMOD2 is defined in (3), which is not the same as that in CMOD5.
B 1 = ( c 14 + c 15 x + c 16 x 2 ) + ( c 17 + c 18 x + c 19 x 2 ) u + ( c 20 + c 21 x + c 22 x 2 ) u 2
where x is related to the incidence angle. The specific function form of B 2 is shown as:
B 2 = ( d 1 + d 2 v 2 ) e x p ( v 2 )
in which   d 1 and d 2 are functions of the incident angle, and v 2 is related to incident angle and wind speed.

2.2. Simulation of X-Band SAR Observations

In order to theoretically analyze the effectiveness of the method, this paper takes different wind speed, relative wind direction, and incidence angle as input, and uses XMOD2 geophysical model function to simulate the backscatter coefficient of networked spaceborne SAR.
The networked SAR system consists of three spaceborne SARs. The three SARs were in different orbits at the same altitude. The data from the three SARs observing the same sea surface at different angles of incidence are simulated through the coordinated observation of networked satellites. A schematic diagram of the three SAR observations of the same sea area is shown in Figure 1.
When simulating the backscatter coefficient of the spaceborne SAR of the network, the input angle of incidence is 20–50°, and the input wind speed is 1–30 m/s. The specific information of the experimental data is shown in Table 1 and Table 2.

3. Methods

A cost function was established using the XMOD2. When establishing the cost function, multiple sets of SAR data with different incident angles were used. The more data there are, the more accurate the inversion results. In this study, SAR data from three satellites were simulated, and the cost function established is the same as that in (5).
J cos t ( θ , Φ , u ) = ( σ 1 m ( θ 1 , Φ 1 , u ) σ 1 0 ( θ 1 , Φ 1 , u ) ) 2 + ( σ 2 m ( θ 2 , Φ 2 , u ) σ 2 0 ( θ 2 , Φ 2 , u ) ) 2 + ( σ 3 m ( θ 3 , Φ 3 , u ) ) σ 3 0 ( θ 3 , Φ 3 , u ) ) 2   ,
In the above equations, σ 1 m , σ 2 m , and σ 3 m are the backscatter coefficients calculated by the wind speed inversion model, while σ 1 0 , σ 2 0 , and σ 3 0 are the backscatter coefficients obtained by the radiation calibration of SAR images.
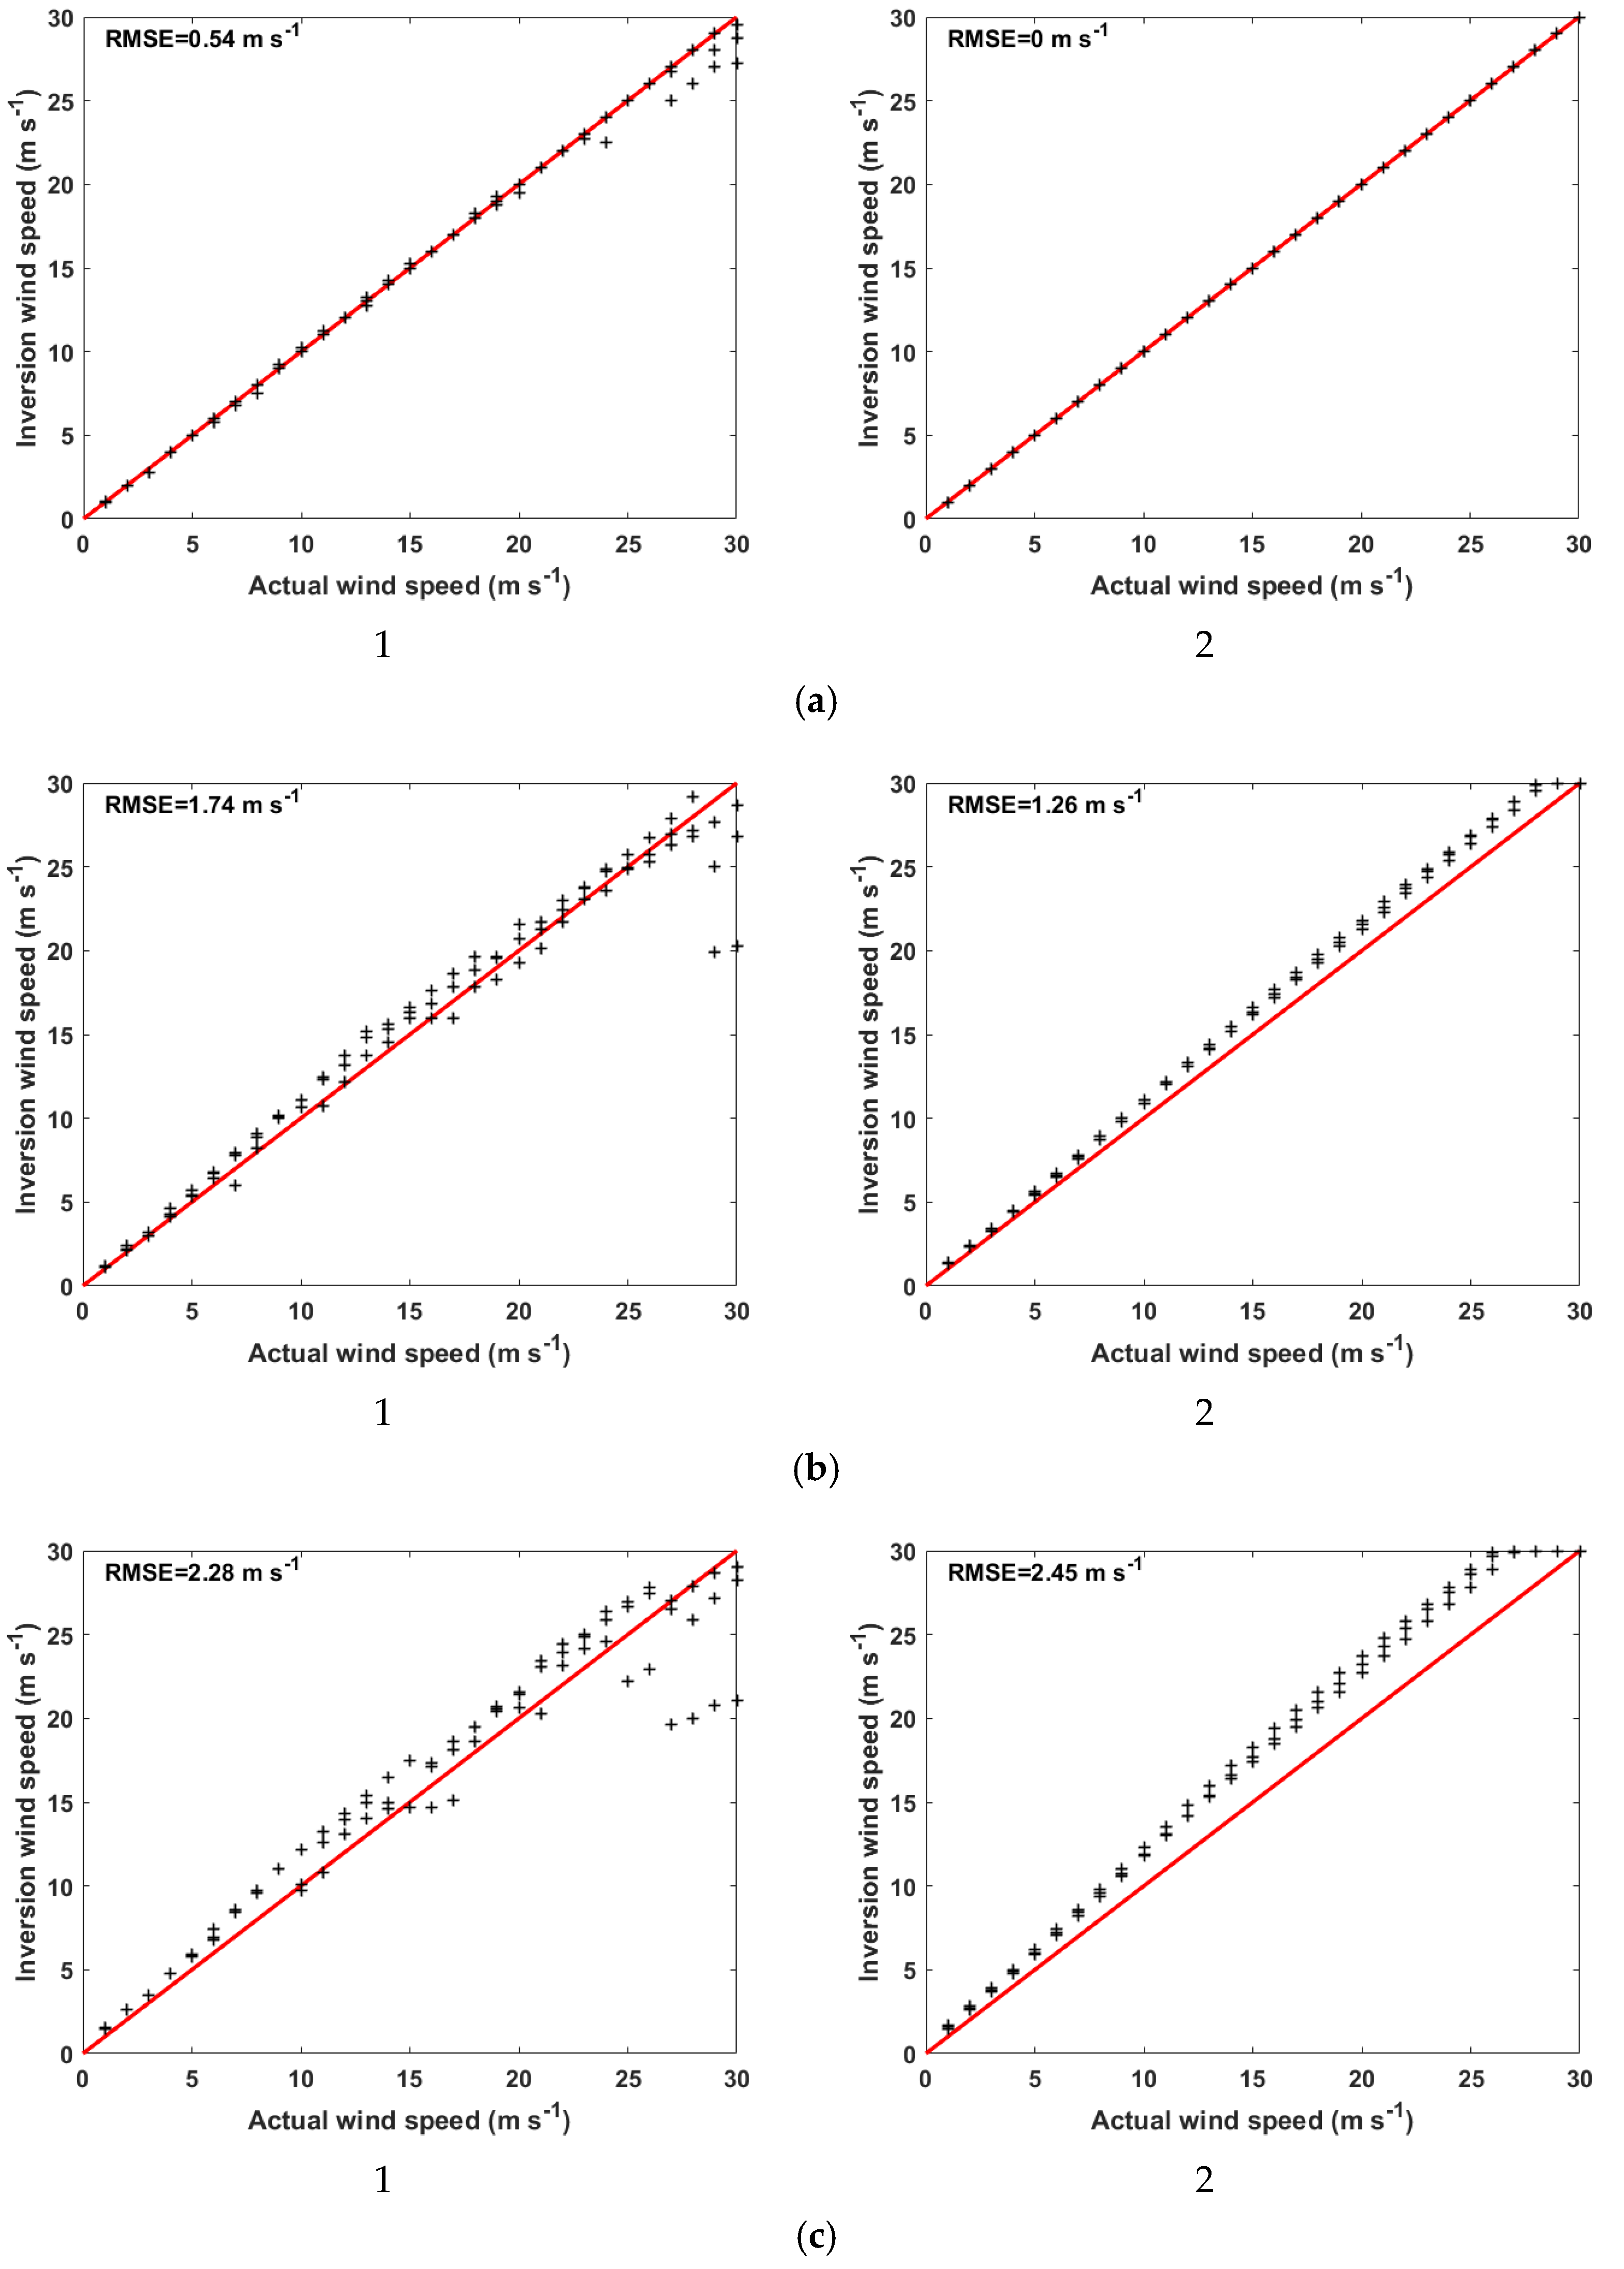
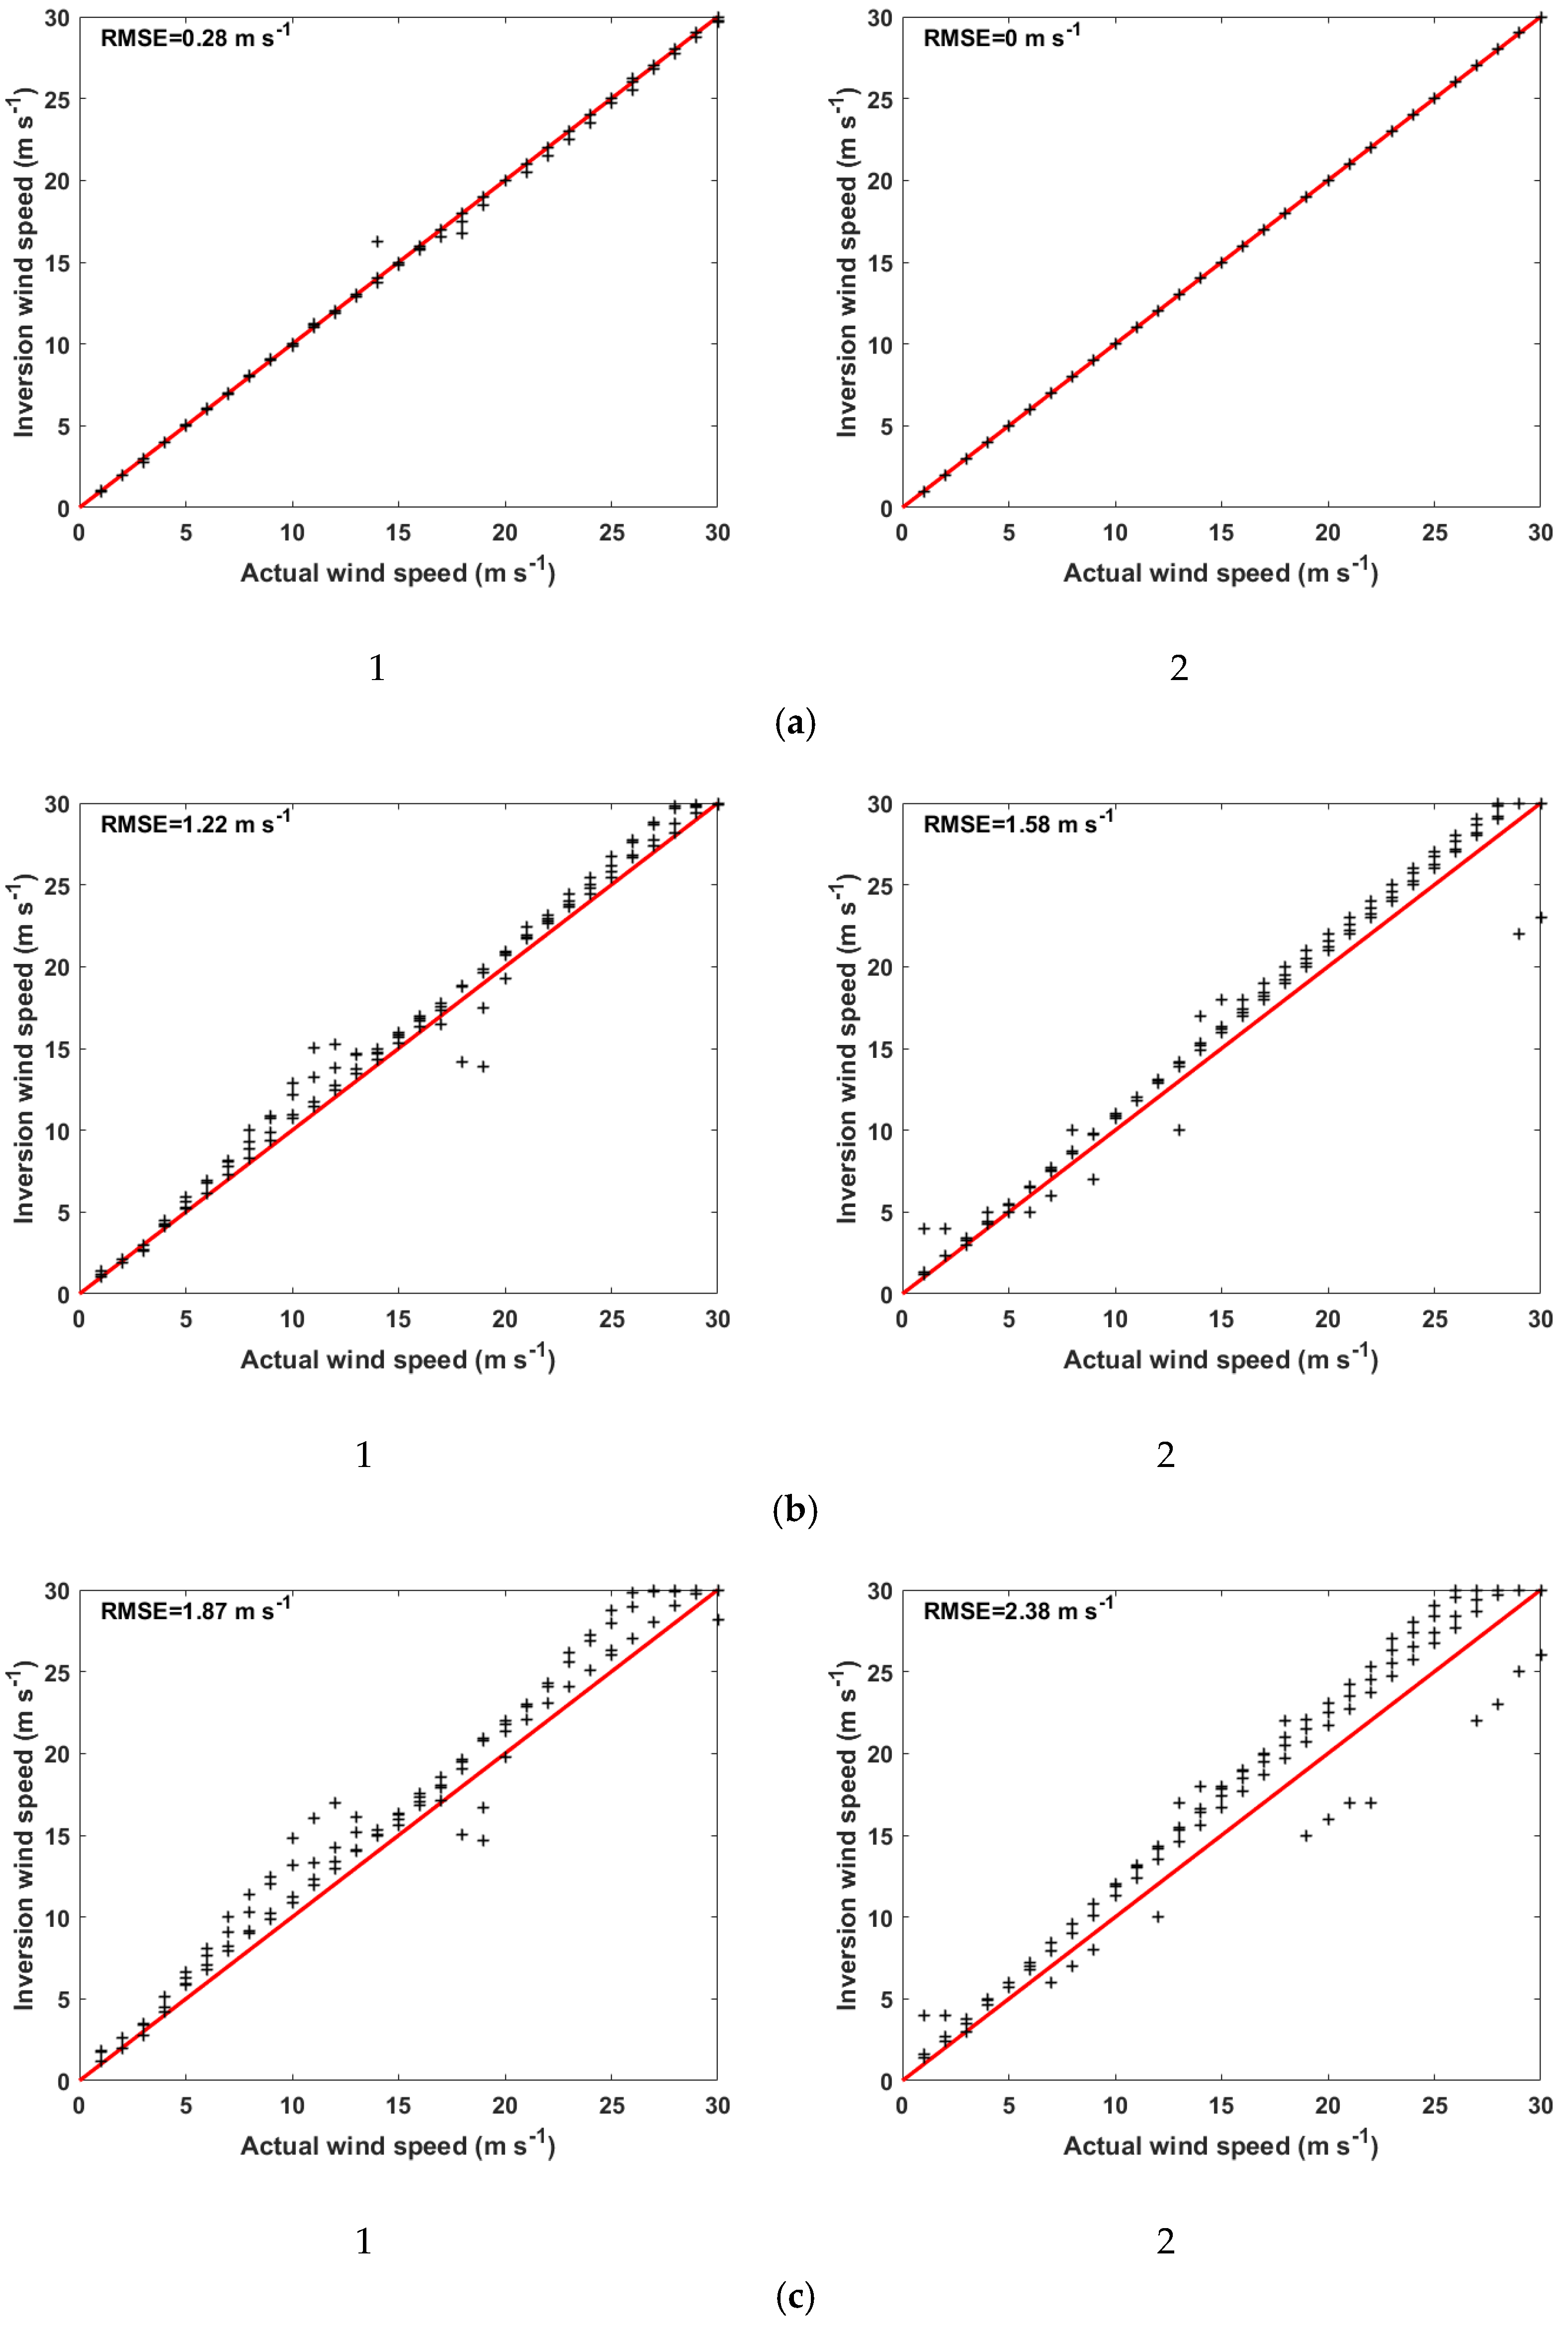
After obtaining the cost function, there are two ways to obtain a unique result. The first way is to find the minimum value of the cost function, and the corresponding wind speed is the inverted wind speed. In order to minimize the cost function, the partial derivatives of the cost function with respect to wind speed and relative wind direction are respectively obtained, as shown in (6). Since the wind speed inversion model is a relatively complex function, (5) and (6) are also complex functions. To reduce the computational burden, this paper chose a double-precision search method to obtain the minimum value of the target cost function to obtain the fuzzy solutions of the sea surface wind speed and wind direction. The search process was divided into two main steps: a rough search and a fine search. In the process of rough search, the wind speed of 0–30 m/s was substituted into (6) with the interval of 1 m/s and the wind direction of 0–360° with the interval of 10° to obtain the value of partial derivative. In the calculation results, some adjacent results were of different signs, indicating that there was a point with 0 partial derivative between adjacent two groups of data, namely, the extreme value point. Then, a fine search was conducted within the range where the extreme point existed, that is, the wind speed was set at an interval of 0.1 m/s, and the wind direction was set at an interval of 1° and substituted into (6). The value closest to 0 in the results of each group was saved, and the corresponding wind speed and wind direction were substituted into (5) to calculate the cost function. The wind speed corresponding to the minimum value of the cost function is the wind speed inversion result. This method does not rely on wind direction data, and can obtain wind speed.
ә J cos t ( θ , Φ , u ) ә u =   i = 1 3 2 ( σ i m σ i 0 ) ә σ i m ә u , ә J cos t ( θ , Φ , u ) ә cos ( Φ ) =   i = 1 3 2 ( σ i m σ i 0 ) ә σ i m ә cos ( Φ )
In the second way, accurate wind direction data was used as a reference to screen the final results. According to the extreme value of the cost function, an appropriate screening threshold was set, and the wind vector corresponding to the screening result was the preliminary result. Finally, the wind direction data were used to eliminate the fuzzy solution to obtain a unique solution. The advantage of this method is that when the difference between the actual SAR backscatter coefficient and the backscatter coefficient calculated by XMOD2 is small, the extracted wind speed is more accurate.

4. Results

4.1. Accuracy of Wind Speed Inversion

In order to analyze the applicability of the method to X-band networked SAR data under different conditions, this paper divides the experimental data into two groups. One set of experimental data has a fixed incident angle and different relative wind direction angles; one set of experimental data has a fixed relative wind direction angle and different incident angles. Next, the experimental results of the two sets of data are analyzed separately.

4.1.1. Experimental Results of SAR Data with Different Incident Angles

The first set of experiments determined the relative wind direction angle to be 240°. When simulating SAR data, a fixed value of noise is added to the backscatter coefficient of a single pixel. The purpose of adding noise is to understand the effect of noise on wind speed accuracy. Under the conditions of noise of 0 dB, 0.5 dB, and 1 dB, respectively, multiple sets of wind speed inversion experiments were conducted by changing the incidence angles of the three networked SARs. The experimental results are shown in Table 3.
In the table, RMSE1 is the root-mean-square error of the comparison between the wind speed extracted without introducing wind direction information and the actual wind speed. RMSE2 is the root-mean-square error of the comparison between the wind speed extracted with the wind direction information and the actual wind speed. The definition of root mean square error is shown in (7).
RMSE =   ( Y i X i ) 2 n
It can be seen from the table that as the noise increases, the wind speed accuracy begins to deteriorate. When the incident angle is 30–50°, the accuracy of wind speed inversion is relatively high. As the angle of incidence increases, the absolute value of the backscatter coefficient in dB units begins to increase. The proportion of noise in the backscatter coefficient is reduced, so the effect of noise on wind speed accuracy is reduced. Under different noise conditions, the comparison between the inversion wind speed and the actual wind speed is shown in Figure 2.
It can be seen from the figure that as the noise increases, the accuracy of the wind speed results screened by the two methods will decrease. When the noise is small, the introduction of wind direction information can further improve the accuracy of the extracted wind speed. With the increase of noise, the wind speed extraction accuracy of the second method is gradually smaller than that of the first method. When the noise is greater than 1 dB, the introduction of wind direction information will reduce the accuracy of wind speed extraction.

4.1.2. Experimental Results of SAR Data with Different Relative Wind Directions

The second set of experiments determined that the incidence angles of the three SARs were 25°, 35°, and 45°. In the case of noises of 0 dB, 0.5 dB, and 1 dB, respectively, multiple sets of wind speed inversion experiments were conducted by changing the relative wind direction of the three network SARs. The experimental results are shown in Table 4.
It can be seen from the table that when the noise is less than 1 dB, the method in this paper can extract relatively accurate wind speed information from the networked SAR satellite data of different relative wind directions. The comparison between the inversion wind speed and the actual wind speed is shown in Figure 3.
It can be seen from the figure that, as with Figure 2, when the noise is greater than 0 dB, most of the wind speeds extracted by this method are higher than the actual wind speed. This phenomenon is caused by the positive correlation between the SAR backscatter coefficient and wind speed. The addition of noise increases the backscatter coefficient of SAR, which makes the wind speed result higher than the actual wind speed.

5. Discussion

The SAR data is simulated according to the imaging principle of the SAR system, which can make the information of the SAR data more complete. However, in the process of generating simulated data, it is impossible to consider all the mechanisms and factors that affect SAR data. There are some differences between simulated SAR data and actual SAR data. Therefore, this article used XMOD2 to simulate the networked SAR satellite data under different conditions. The SAR backscatter coefficient simulated by XMOD2 was closer to the actual SAR backscatter coefficient. In order to understand the effect of noise on wind speed accuracy, noise was introduced into the simulation data. The experiment was to study a single pixel. When adding noise to the simulation data, a fixed noise was added to the backscatter coefficient of a single pixel.
The wind speed inversion method based on the difference of the incident angle has been successfully applied to a single spaceborne SAR data. However, this approach has two disadvantages. The first point is that the method has high requirements for SAR data, and it is necessary to ensure that changes in sea conditions on the sea surface are small. The second point is to ensure that the angle of incidence is different, so the resolution of wind speed inversion is low (25 × 25 km). This paper applied this method to X-band networked SAR satellite data. The observation of the same sea surface by multiple satellites at the same time can ensure that the wind field information of each point in the SAR data is basically consistent, which lifts the limitation of the method on sea conditions. Because each satellite operates at a different angle of incidence, the resolution of the wind speed inversion is also unlimited.
The study found that in the wind speed inversion process of networked SAR satellite simulation data, relatively accurate wind speed information can be obtained without referring to wind direction information, as shown in the experimental results of the first screening method. In the case of low noise, the introduction of external wind direction information improves the accuracy of wind speed, as shown by the experimental results of the second screening method, but with the increase of noise, the introduction of wind direction information will reduce the accuracy of wind speed extraction.
The experiments in this paper used simulated X-band networking SAR satellite data, so the method has good applicability. However, when the method is applied to X-band actual SAR satellite data, the accuracy of wind speed extraction is related to the applicability of GMF to SAR data.

6. Conclusions

The time resolution of a single spaceborne SAR to detect the sea surface is low. The wind speed information extracted from the SAR data through the geophysical model function depends on the wind direction information. The networked satellite can improve the time resolution of the SAR observation sea surface, and obtain various types of SAR data. Aiming at the problems in the co-polarization SAR wind speed retrieval, this paper designed a networked SAR satellite working mode. Based on the networked SAR satellite data provided by this model, wind speed information can be extracted without relying on wind direction information.
The data in this experiment was obtained by three SARs simultaneously observing the same sea surface at different incident angles. Since the current networked satellites do not operate in this mode, this paper studies the simulation data of a single pixel of the SAR image. The X-band networked SAR data under different conditions were simulated by the geophysical model function. The cost function was established based on the networked SAR data. The final wind speed information was determined by minimizing the cost function. If there is little noise in the backscatter coefficient, the accuracy of wind speed can be improved by introducing accurate wind direction information. However, with the increase of noise, the introduced wind direction information will gradually reduce the accuracy of wind speed results.
Experimental results show that the proposed method is suitable for wind speed extraction of X-band networked SAR data. This method can extract the wind speed information of networked SAR data in pixels without relying on the wind direction information. This research can provide a certain reference for future networked SAR satellite working mode and wind speed inversion.

Author Contributions

Conceptualization: Y.W. and Y.D.; methodology: Y.W.; software: X.S.; validation: X.S., X.Z., and Y.W.; formal analysis: L.L.; investigation: X.Q.; resources: Y.W.; data curation: Y.W.; writing—original draft preparation: X.S.; writing—review and editing: Y.W. and X.Z.; visualization: X.S.; supervision: Y.D.; project administration: Y.W.; funding acquisition: Y.W. All authors have read and agreed to the published version of the manuscript.

Funding

This research was funded by the National Key R&D Program of China, grant number No. 2017YFC1405600.

Conflicts of Interest

The authors declare no conflict of interest.

References

  1. Liu, W.T. Progress in scatterometer application. J. Oceanogr. 2002, 58, 121–136. [Google Scholar] [CrossRef]
  2. Bentamy, A.; Queffeulou, P.; Quilfen, Y.; Katsaros, K. Ocean surface wind fields estimated from satellite active and passive microwave instruments. IEEE Trans. Geosci. Remote Sens. 1999, 37, 2469–2486. [Google Scholar] [CrossRef]
  3. Lin, H.; Xu, Q.; Zheng, Q. An overview on SAR measurements of sea surface wind. Prog. Nat. Sci. 2008, 18, 913–919. [Google Scholar] [CrossRef]
  4. Corcione, V.; Grieco, G.; Portabella, M.; Nunziata, F.; Migliaccio, M. A novel azimuth cutoff implementation to retrieve sea surface wind speed from SAR imagery. IEEE Trans. Geosci. Remote.Sens. 2018, 57, 3331–3340. [Google Scholar] [CrossRef]
  5. Grieco, G.; Lin, W.; Migliaccio, M.; Nirchio, F.; Portabella, M. Dependency of the Sentinel-1 azimuth wavelength cut-off on significant wave height and wind speed. Int. J. Remote Sens. 2016, 37, 5086–5104. [Google Scholar] [CrossRef]
  6. Portabella, M.; Stoffelen, A.; Johannessen, J.A. Toward an optimal inversion method for synthetic aperture radar wind retrieval. J. Geophys. Res. Space Phys. 2002, 107, 1–13. [Google Scholar] [CrossRef]
  7. Stoffelen, A.; Anderson, D. Scatterometer data interpretation: Estimation and validation of the transfer function CMOD4. J. Geophys. Res. Space Phys. 1997, 102, 5767–5780. [Google Scholar] [CrossRef]
  8. Nirchio, F.; Venafra, S. Preliminary model for wind estimation from Cosmo/SkyMed X band SAR data. In Proceedings of the 2010 IEEE International Geoscience and Remote Sensing Symposium, Honolulu, HI, USA, 25–30 July 2010; pp. 3462–3465. [Google Scholar]
  9. Nirchio, F. XMOD2—An improved geophysical model function to retrieve sea surface wind fields from Cosmo-SkyMed X-band data. Eur. J. Remote Sens. 2013, 46, 583–595. [Google Scholar] [CrossRef]
  10. Ren, Y.; Lehner, S.; Brusch, S.; Li, X.; He, M. An algorithm for the retrieval of sea surface wind fields using X-band TerraSAR-X data. Int. J. Remote Sens. 2012, 33, 7310–7336. [Google Scholar] [CrossRef] [Green Version]
  11. Li, X.-M.; Lehner, S. Algorithm for sea surface wind retrieval from TerraSAR-X and TanDEM-X data. IEEE Trans. Geosci. Remote Sens. 2013, 52, 2928–2939. [Google Scholar] [CrossRef] [Green Version]
  12. Quilfen, Y.; Chapron, B.; Elfouhaily, T.; Katsaros, K.; Tournadre, J. Observation of tropical cyclones by high-resolution scatterometry. J. Geophys. Res. Space Phys. 1998, 103, 7767–7786. [Google Scholar] [CrossRef]
  13. Hersbach, H.; Stoffelen, A.; De Haan, S. An improved C-band scatterometer ocean geophysical model function: CMOD5. J. Geophys. Res. Space Phys. 2007, 112, 1–18. [Google Scholar] [CrossRef]
  14. Hersbach, H. Comparison of C-band scatterometer CMOD5.N equivalent neutral winds with ECMWF. J. Atmos. Ocean. Technol. 2010, 27, 721–736. [Google Scholar] [CrossRef]
  15. Portabella, M. Wind Field Retrieval from Satellite Radar Systems. Ph.D. Thesis, University of Barcelona, Barcelona, Spanish, 2002. [Google Scholar]
  16. Horstmann, J.; Koch, W.; Lehner, S.; Tonboe, R. Wind retrieval over the ocean using synthetic aperture radar with C-band HH polarization. IEEE Trans. Geosci. Remote Sens. 2000, 38, 2122–2131. [Google Scholar] [CrossRef]
  17. Vachon, P.; Dobson, F. Validation of wind vector retrieval from ERS-1 SAR images over the ocean. Glob. Atmos. Ocean Syst. 1996, 5, 177–187. [Google Scholar]
  18. Wackerman, C.; Rufenach, C.; Shuchman, R.; Johannessen, J.; Davidson, K. Wind vector retrieval using ERS-1 synthetic aperture radar imagery. IEEE Trans. Geosci. Remote Sens. 1996, 34, 1343–1352. [Google Scholar] [CrossRef]
  19. Lehner, S.; Horstmann, J.; Koch, W. Mesoscale wind measurements using recalibrated ERS SAR images. J. Geophys. Res. Ocean. 1998, 103, 7847–7856. [Google Scholar] [CrossRef]
  20. Monaldo, F. The Alaska SAR demonstration and near-real-time synthetic aperture radar winds. Johns Hopkins APL Tech. Dig. 2000, 21, 75–79. [Google Scholar]
  21. Monaldo, F.; Thompson, D.; Pichel, W.G.; Clemente-Colón, P. A systematic comparison of QuikSCAT and SAR ocean surface wind speeds. IEEE Trans. Geosci. Remote Sens. 2004, 42, 283–291. [Google Scholar] [CrossRef]
  22. Gerling, T.W. Structure of the surface wind field from the Seasat SAR. J. Geophys. Res. Space Phys. 1986, 91, 2308. [Google Scholar] [CrossRef]
  23. Horstmann, J.; Lehner, S.; Kock, W.; Tonboe, R. Computation of wind vectors over the ocean using spaceborne synthetic aperture radar. Johns Hopkins APL Tech. Dig. 2000, 21, 100–107. [Google Scholar]
  24. He, Y.; Perrie, W.; Zou, Q.; Vachon, P. A new wind vector algorithm for C-band SAR. IEEE Trans. Geosci. Remote Sens. 2005, 43, 1453–1458. [Google Scholar] [CrossRef]
Figure 1. Simulation of networked synthetic aperture radar (SAR) satellite observations of the same sea area.
Jmse 08 00626 g001
Figure 2. The comparison diagram of the inversion wind speed and the actual wind speed (a: 0 dB noise; b: 0.5 dB noise; c: 1 dB noise; 1: no wind direction input; 2: wind direction input).
Jmse 08 00626 g002
Figure 3. The comparison diagram of the inversion wind speed and the actual wind speed (a: 0 dB noise; b: 0.5 dB noise; c: 1 dB noise; 1: no wind direction input; 2: wind direction input).
Jmse 08 00626 g003
Table 1. Experimental data set (constant relative wind direction).
Data Set NumberRelative Wind DirectionIncidenceWind Speed
1240°23°; 33°; 43°1–30 m/s
2240°26°; 36°; 46°1–30 m/s
3240°29°; 39°; 49°1–30 m/s
Table 2. Experimental data set (constant incident angle).
Data Set NumberRelative Wind DirectionIncidenceWind Speed
445°25°; 35°; 45°1–30 m/s
590°25°; 35°; 45°1–30 m/s
6180°25°; 35°; 45°1–30 m/s
7240°25°; 35°; 45°1–30 m/s
Table 3. Experimental results (constant relative wind direction).
NoiseIncidenceActual Wind SpeedRMSE1RMSE2
0 dB23°; 26°; 29°1–30 m/s0.86 m/s0.00 m/s
0 dB33°; 36°; 39°1–30 m/s0.20 m/s0.00 m/s
0 dB43°; 46°; 49°1–30 m/s0.32 m/s0.00 m/s
0.5 dB23°; 26°; 29°1–30 m/s2.56 m/s2.61 m/s
0.5 dB33°; 36°; 39°1–30 m/s0.80 m/s0.82 m/s
0.5 dB43°; 46°; 49°1–30 m/s1.38 m/s0.98 m/s
1 dB23°; 26°; 29°1–30 m/s3.24 m/s3.29 m/s
1 dB33°; 36°; 39°1–30 m/s1.52 m/s2.01 m/s
1 dB43°; 46°; 49°1–30 m/s1.67 m/s1.39 m/s
Table 4. Experimental results (constant incident angle).
NoiseRelative Wind DirectionActual Wind SpeedRMSE1RMSE2
0 dB45°1–30 m/s0.50 m/s0.00 m/s
0 dB90°1–30 m/s0.23 m/s0.00 m/s
0 dB180°1–30 m/s0.06 m/s0.00 m/s
0 dB240°1–30 m/s0.31 m/s0.00 m/s
0.5 dB45°1–30 m/s1.58 m/s2.52 m/s
0.5 dB90°1–30 m/s0.89 m/s1.25 m/s
0.5 dB180°1–30 m/s1.16 m/s1.08 m/s
0.5 dB240°1–30 m/s1.15 m/s1.07 m/s
1 dB45°1–30 m/s2.63 m/s2.78 m/s
1 dB90°1–30 m/s1.24 m/s2.41 m/s
1 dB180°1–30 m/s1.42 m/s2.12 m/s
1 dB240°1–30 m/s2.05 m/s2.12 m/s

