Article

Influence of Structure and Liquid Limit on the Secondary Compressibility of Soft Soils

1
College of Construction Engineering, Jilin University, Changchun, Jilin 130026, China
2
School of Highway, Chang’an University, Xi’an 710064, China
*
Author to whom correspondence should be addressed.
J. Mar. Sci. Eng. 2020, 8(9), 627; https://doi.org/10.3390/jmse8090627
Submission received: 29 July 2020 / Revised: 13 August 2020 / Accepted: 14 August 2020 / Published: 19 August 2020
(This article belongs to the Section Ocean Engineering)

Abstract

:
The macroscopic mechanical properties of natural sedimentary soft soils, which are usually linked to their microstructure, are different from those of remolded soils. The interaction between soil structure and mechanical behavior is a manifestation of structural mechanics effects. It is essential to understand the effects of secondary compressibility to predict long-term foundation deformations. The effects of soil composition on secondary compression deformation are little studied, and the soil structure is rarely involved in the compression process. The sedimentary environment creates the initial composition and structure of soft soil, and it also basically determines its grain size and mineral composition, while different depths give soft soil different overburden pressures, and the soil composition and depth directly affect its yield stress during compression. So, natural sedimentary soft soils sampled at different depths and from different sedimentary environments (such as marine-neritic facies, sea shore facies and limnetic facies) were selected to study the influence of structure on the secondary compression coefficient Cα during pressure change and the relationship between soil composition and Cα. One-dimensional compression and consolidation creep tests were carried out on undisturbed and remolded samples. The undisturbed samples were obtained by the thin-wall samplers in rotary wash borings, and the quality of the samples met the test standard. Based on the concept of the void index Iv and the intrinsic compression line (ICL) proposed by Burland, the role of structure in the compression process was studied, and the influence of soil composition and structure on secondary compression characteristics was summarized. The Cα/Cc values are 0.031, 0.034, 0.030, and 0.036 for Shanghai, Tianjin, Suzhou, and Ningbo soft soils, respectively, within the range of inorganic clays and silts (0.04 ± 0.01) given by Mesri. According to the compression index Cc obtained by compression test, Cα/Cc can be used to estimate Cα. The yield stress of normal consolidated soil is near pre-consolidation pressure, while that of structural soft soil is greater than its pre-consolidation pressure. Natural sedimentary soft soils show over-consolidation characteristics due to the action of the structure; the soil structure resists the external load and hinders secondary compression. When the soil structure is almost destroyed, the pressure reaches the structure full yield stress P′. The tests of structural soft soils show that Cα changes with pressure before the structure completely yields, first increasing and reaching peak Cαmax near P′; the value of P′ is approximately 1.6–3.0 σ’k, where σ’k refers to the structure yield stress of soil obtained by the Casagrande method. After the structure disappeared, Cα gradually decreased and then stabilized, which is considered to be independent of the load. The Cαmax is positively correlated with the liquid limit, indicating that the peak value that can be reached by the Cα is related to the maximum content of bound water in soft soil, thus the soil composition has a significant influence on secondary compressibility, which contributes to the prediction of long-term foundation deformation.

1. Introduction

Soft soils are widely distributed all over the world and are found in coastal areas and round rivers and lakes. For example, there are deep soft soils in North America, Northern Europe and Southeast Asia [1,2,3]. Soft soil has the engineering properties of low shear strength, high compressibility and low permeability, and its compressibility is the key parameter determining the deformation law of a foundation. Soil compressibility is reflected in two aspects: as the excess pore water pressure dissipates, the effective stress increases, and the compressive deformation is the primary consolidation deformation of the soil. After the excess pore water pressure is completely dissipated and the effective stress becomes basically stable, the bound water film on the surface of the soil particles creep and the rearrangement of the soil structure leads to the secondary compression deformation of the soil [4].
Many secondary safety problems and engineering hazards are caused by secondary compression deformation. The Italian Leaning Tower of Pisa is caused by excessive uneven settlement due to secondary compression deformation of its foundation. Built in 1904, the Mexico City’s Art Palace is located on 25-m-thick soft soil. The ultrahigh compressibility of this soft soil is rare, with natural moisture content between 150% and 600%, and the highest void ratio is 12. Since its establishment, its settlement has been as much as 4 m [1]. Therefore, the study of secondary compression deformation is very important in engineering construction. With the improvement in the requirements for postconstruction settlement of soft soil foundations in actual engineering, the role of secondary compression and its influencing factors have attracted wide attention.
As a multiphase medium, soft soil’s properties are closely related to the soil composition and structural characteristics. Currently, research on the secondary compression deformation law of soil is mainly focused on the influence of pore moisture content, load, loading history and loading time on secondary compression [5,6,7,8,9,10]. There have been some studies on the effects of different soil compositions on the secondary compression characteristics. Mesri summarized the relationship between the secondary compression coefficient Cα and the compression index Cc of 22 geotechnical materials [11,12,13]. The primary minerals are often the main components of the silt fraction, mainly including quartz and feldspar, which are resistant to weathering. The secondary minerals are mainly composed of clay minerals, including illite, kaolinite, chlorite, and illite–smectite mixed layers. The illite–smectite mixed layers and illite are relatively hydrophilic, and the bound water content is high, which has a great influence on the creep properties of soft soil. The mineral composition and content have important influences on the physical and mechanical properties [14,15,16]. To study the influence of mineral composition and content on the one-dimensional compressibility of soft soil, soil samples mixed with some secondary minerals and silt have been examined, such as in research on the compressibility of different proportions of kaolin, illite and silty sand mixtures, as well as on the influence of several mineral component content on the compression characteristics; furthermore, the compressibility of kaolin and montmorillonite were compared [17,18,19]. However, most research is based on the compressibility of remolded soil. The understanding of the influence of the composition of undisturbed soil on the secondary compression characteristics is not sufficiently comprehensive.
The prediction method for the secondary compression coefficient Cα proposed by Mesri is the most famous for the empirical relationship between ratio of the Cα and the compression index Cc [11,12,13]. The slope of the curve in the secondary compression stage of the one-dimensional compression curve is Cα, and this secondary compression coefficient can be determined according to the compression index Cc of the soil [13]. In 1967, Bjerrum proposed the isochronous e–lgp curve, which is used to calculate the secondary compression deformation of remolded soil [20]. These studies, based on remolded soils, suggest that the secondary compression coefficient of the soil does not change with time. Regarding the relationship between the secondary compression coefficient Cα and pressure, Bjerrum and Newland believed that it is independent of consolidation pressure [20,21]. Horn and Lambe considered that the secondary compression coefficient is independent of the incremental ratio of the load but depends on the final consolidation pressure [22].
Another view is that the secondary compression coefficient Cα is related to pressure. It was found through experiments that as the pressure increases, the value of Cα increases from small to large and then decreases [23]. For example, it was found by studying Hangzhou undisturbed clay that when the pressure was less than a certain value, the secondary compression coefficient increased with the pressure, and when the pressure was greater than this certain value, the secondary compression coefficient did not change with the pressure, but this certain value was not well defined [24]. According to the research of Lei et al., on undisturbed marine soft soil in Tianjin, the secondary compression coefficient Cα is related to pressure, and they pointed out that the boundary point of the pressure is the pre-consolidation pressure [25]. The secondary compression is related to the pressure when the soil is in the over-consolidated state and it is independent of the pressure during normal consolidation [26].
The above viewpoints and conclusions are reasonable and applicable under specific conditions, with more extensive research on secondary compression, the viewpoint that Cα varies with the consolidation pressure has been widely accepted, but there is no uniform and powerful conclusion on the load boundary points of Cα related to the pressure. The effect of soil structure on secondary compression and the relationship between structure and pressure are still worth studying.
Naturally deposited soft soils are affected by the structure during and after the deposition process. It has been well documented that such deposits behave differently under disturbed or remolded conditions [27,28,29,30]. This behavior difference results from structural resistance. The influence of the soil structure mainly refers to cementation, thixotropy, hardening, time effect eluviation and the rate of sedimentation [31,32]. Hattab et al. thought that the presence of soil structure could lead to an overestimation of the pre-consolidation pressure [33]. It was emphasized that the soil structure is the core of the development of geotechnical engineering in the 21st century [34]. For normal consolidated soil, the maximum load experienced historically is the self-weight stress, and so the yield stress of normal consolidated soil is near the pre-consolidation pressure. However, it was found that for some natural sedimentary soft soils, the yield stress is significantly greater than the self-weight stress, showing over-consolidation characteristics [35]. This is due to the effect of soil structure on mechanical properties. The soils with this performance are called structural soft soils [36]. The pre-consolidation pressure obtained by the Casagrande method is called the “structure yield stress” of the structural soil. The “over-consolidation ratio” is the “structure stress ratio” [37].
Yang et al. described the compression behavior of structural soils based on comparisons in a series of experiments on undisturbed and remolded soils [38]. The mechanical properties of naturally deposited structural soils are often different from those of remolded soil; the soil structure almost disappears when the pressure exceeds a certain value, the properties of the soils are similar to those of remolded soils at this time, and Cα is similar to that of remolded soil, but the change in Cα is worth discussing when the pressure is less than this value and the relationship between this value and the soil sample is not explained [39,40]. Mesri noted that structural failure of natural soft soil mainly occurred in the pressure range of 0.7 to 2.0 σ’k, which means that the soil structure was almost completely destroyed when the pressure was 2.0 σ’k [41]. However, the change in Cα is worth discussing when the soil structure is not completely yielded.
The Cα of structural soft soil is closely related to the stress level and time [11,12]. Marine sedimentary structural soil is different from the normal over-consolidated soil; the soil structure resists the external load and hinders secondary compression [42,43,44]. A secondary compression deformation calculation model considering the effects of the soil structure was established [45].
In the present study, natural sedimentary soft soils from Shanghai, Tianjin Suzhou and Ningbo were selected and one-dimensional compression and creep tests were carried out on undisturbed and remolded samples. The undisturbed samples were well obtained from thin-wall tube samples, meeting the test requirements, and based on their initial void ratio and the initial moisture content, the remolded samples were prepared by using sieved dry soil and distilled water to disrupt the structure of the soil (such as the influence of cementation, thixotropy, hardening, time effect and eluviation). The influence of soil composition, especially its structure, on the compressibility and secondary compression characteristics of naturally deposited soft soil was explored.
The objectives of present study were to investigate the one-dimensional compressibility, especially secondary compression behavior, and the soil structure effects of four clays obtained from Shanghai, Tianjin, Suzhou and Ningbo in China and compare the measured results with those of other natural soft soils worldwide. These four cities are relatively developed and densely populated, and the study of long-term foundation deformations is very important there. The soft soils in the four sites were selected from different sedimentary environments and depths, giving them different structural strength and yield stress. The different sorting degrees during the deposition process made the grain composition of the soft soils at these four sites different. The influence of structure and water–physical properties, such as liquid limit, on the secondary compressibility of soft soils was studied. The specific properties are described below.

2. Soft Soils and Methods

2.1. Geological Setting and Sampling

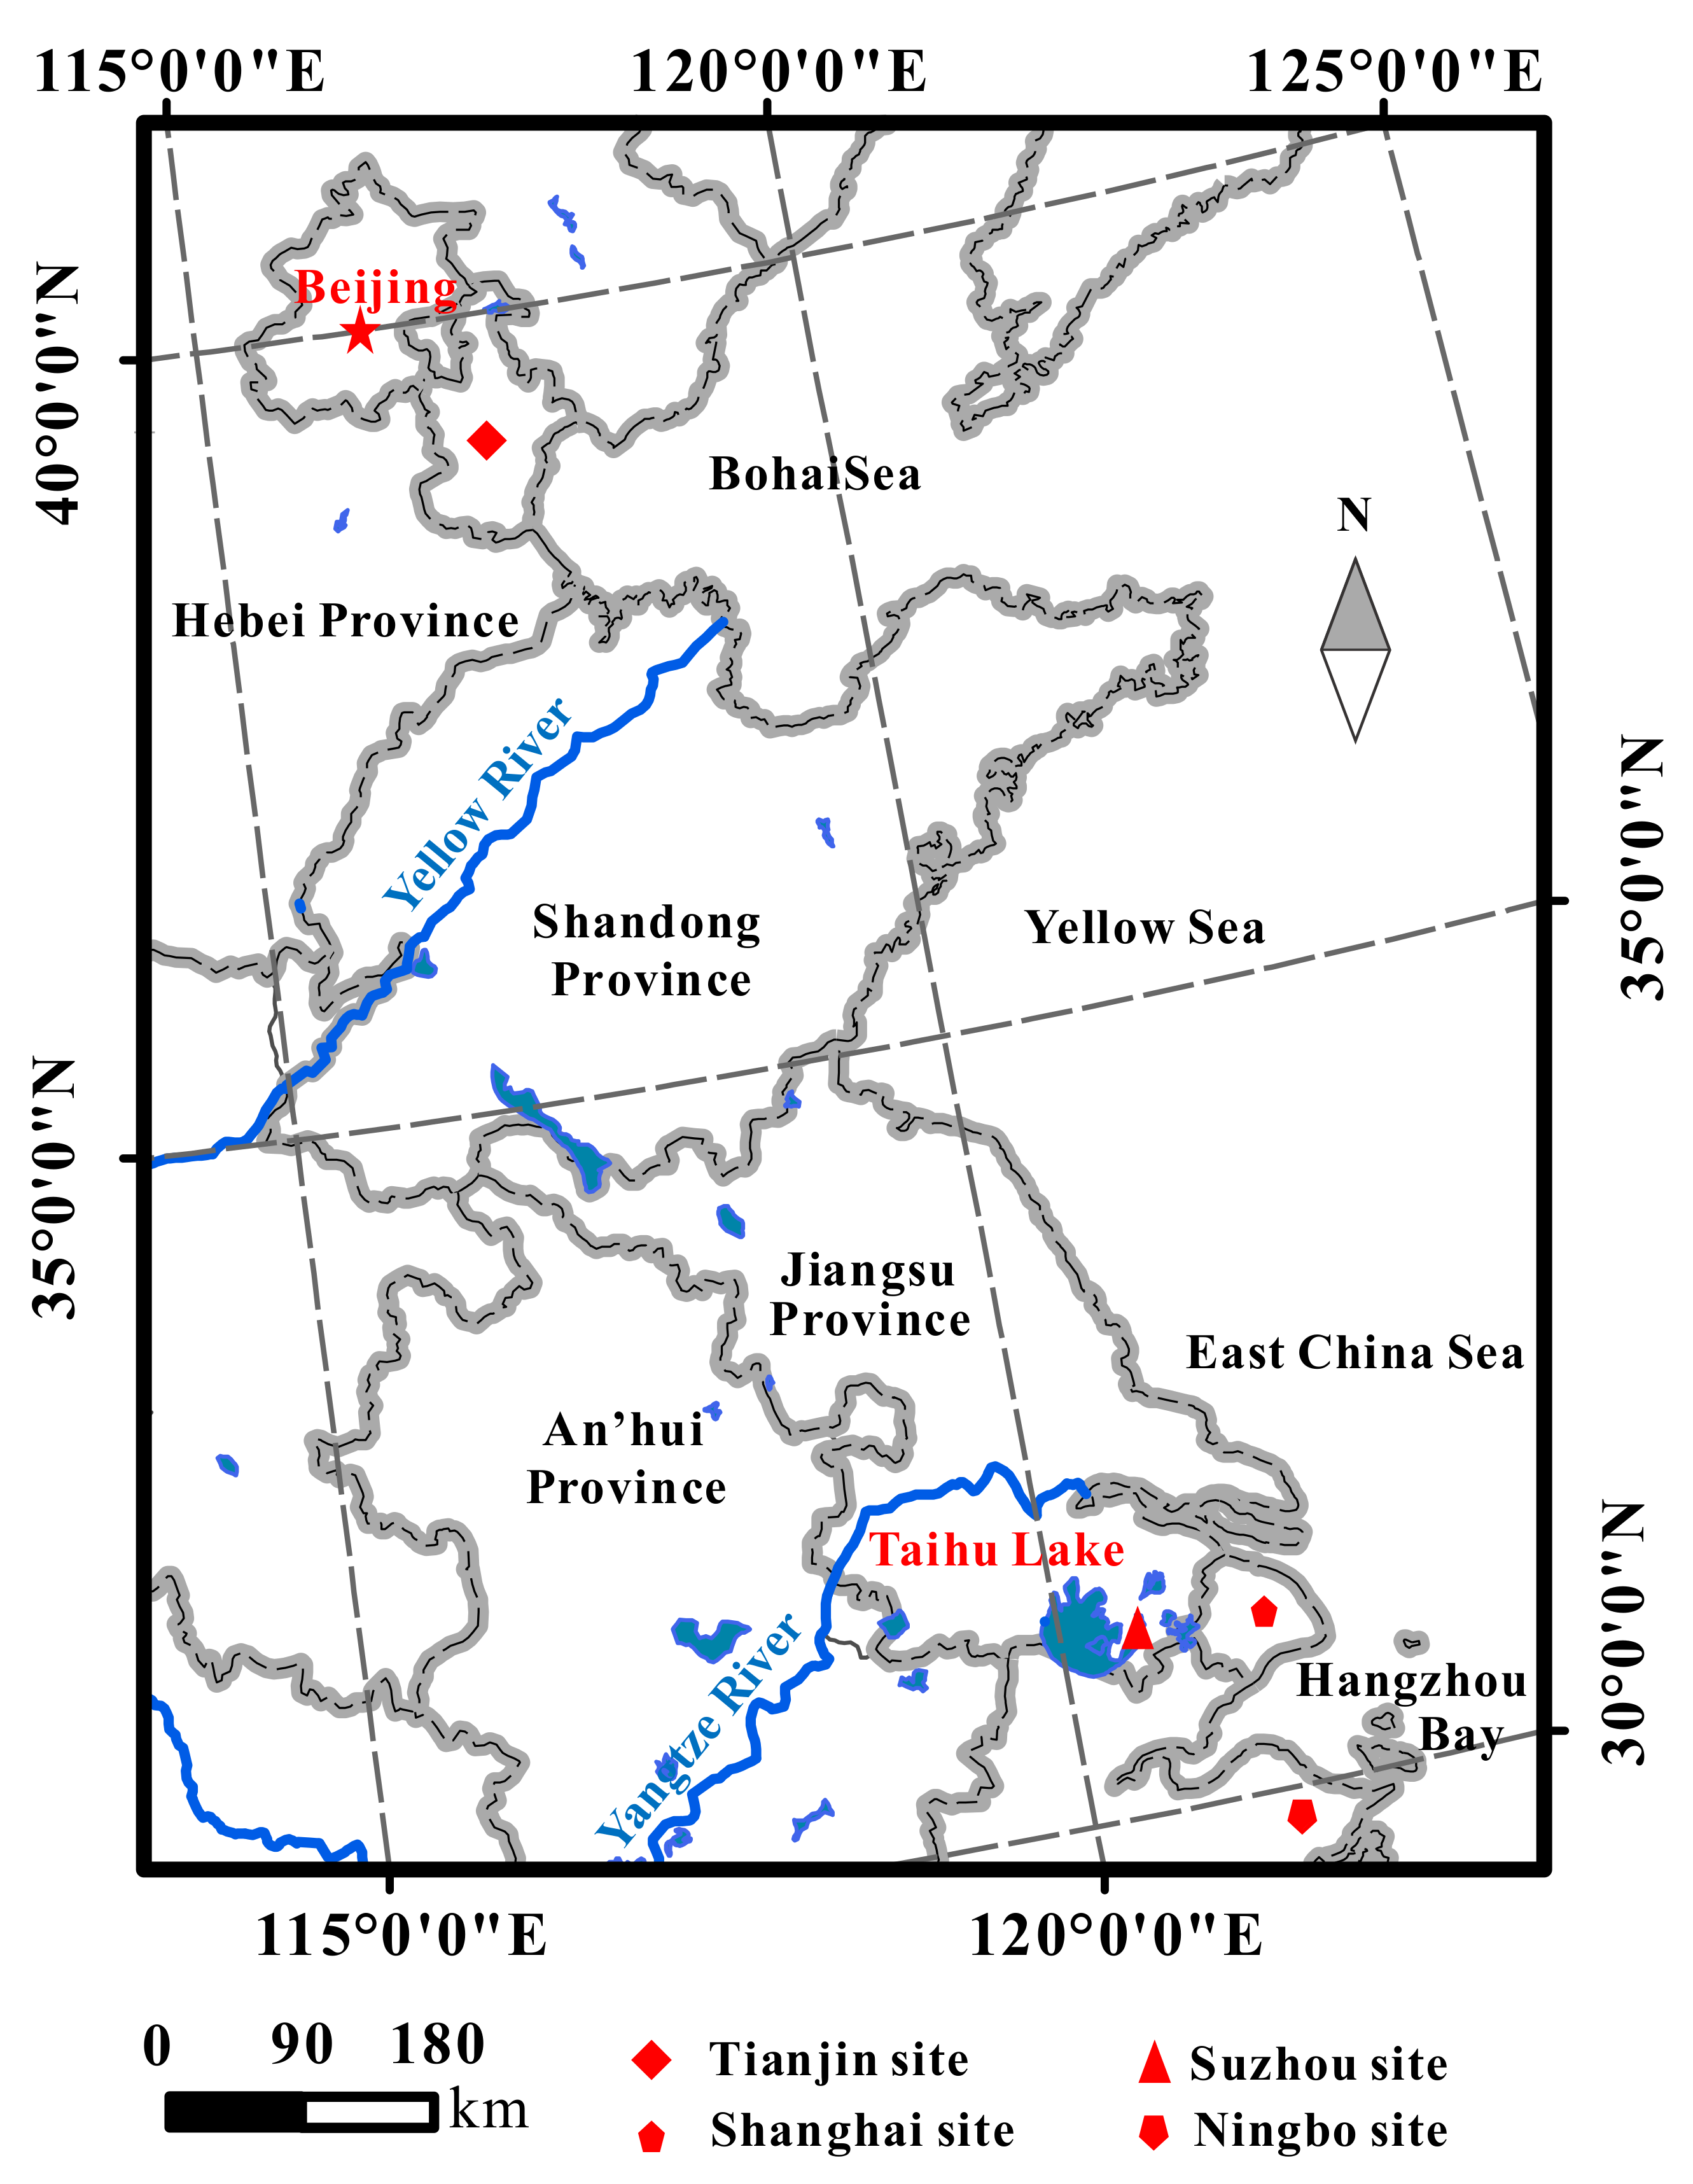
The investigation in the present study was carried out on undisturbed samples retrieved from areas of Tianjin, Shanghai, Suzhou and Ningbo, as shown in Figure 1. Table 1, Table 2, Table 3 and Table 4 give the general geological conditions and sedimentary history of the four natural soft soils.
Shanghai is situated on the Yangtze River delta in eastern China, and the geology mainly consists of alluvial and marine sediments formed during the Quaternary period over the past 3 million years. The soft soil has low permeability, high sensitivity and remarkable creep properties. The Shanghai (SH) soft soil sample is from a gray muddy silty clay layer.
Most of Tianjin is a plain landform, and the southeast is bordered by Bohai Bay. The geological genesis of Tianjin (TJ) soil can be attributed to the Quaternary Holocene coastal sediment, which has the characteristics of a low bearing capacity, high compressibility and low permeability. The sample, consisting of gray silty clay, was taken from the Tianjin Airport Economic Zone.
Suzhou is located in the Taihu Lake Basin, close to the East China Sea. The soft soil is mainly composed of fluvial or limnetic sediments, with silty clay as the main part of the layer. It has the characteristics of low bearing capacity, high compressibility and a wide distribution of limnetic sediments. In present study, Suzhou (SZ) soft soil, from a gray yellow silty clay layer, was taken from the Suzhou Science and Technology City.
Ningbo is a plain landform bordering the East China Sea. The geological genesis of Ningbo soil can be attributed to the marine sediment of the middle or late Holocene, which has the characteristics of high water content, high void ratio and poor permeability. The Ningbo (NB) soft soil sample was taken from a gray yellow muddy silty clay layer.
The undisturbed samples were obtained by thin-wall samplers from the gray muddy silty clay layer, gray silty clay layer, gray yellow silty clay layer and gray yellow muddy silty clay of the SH, TJ, SZ and NB sites, respectively, in rotary wash borings, and each soil type was sampled at least 0.5 m thick. All the samples were immediately sealed on site to prevent the loss of water, packed into a sturdy wooden box, and transported to the laboratory. All care was taken to avoid disturbing the soil during sampling and transporting. According to laboratory tests, the disturbance index ID of the four samples was within the scope of mild disturbance (0.15–0.30) [41]. The soft soils from the four sampling sites belong to grade I (ID ≤ 0.3), and soil of grade I can be used for all projects according to GB 50021-2001 [46].

2.2. Properties of the Soft Soils

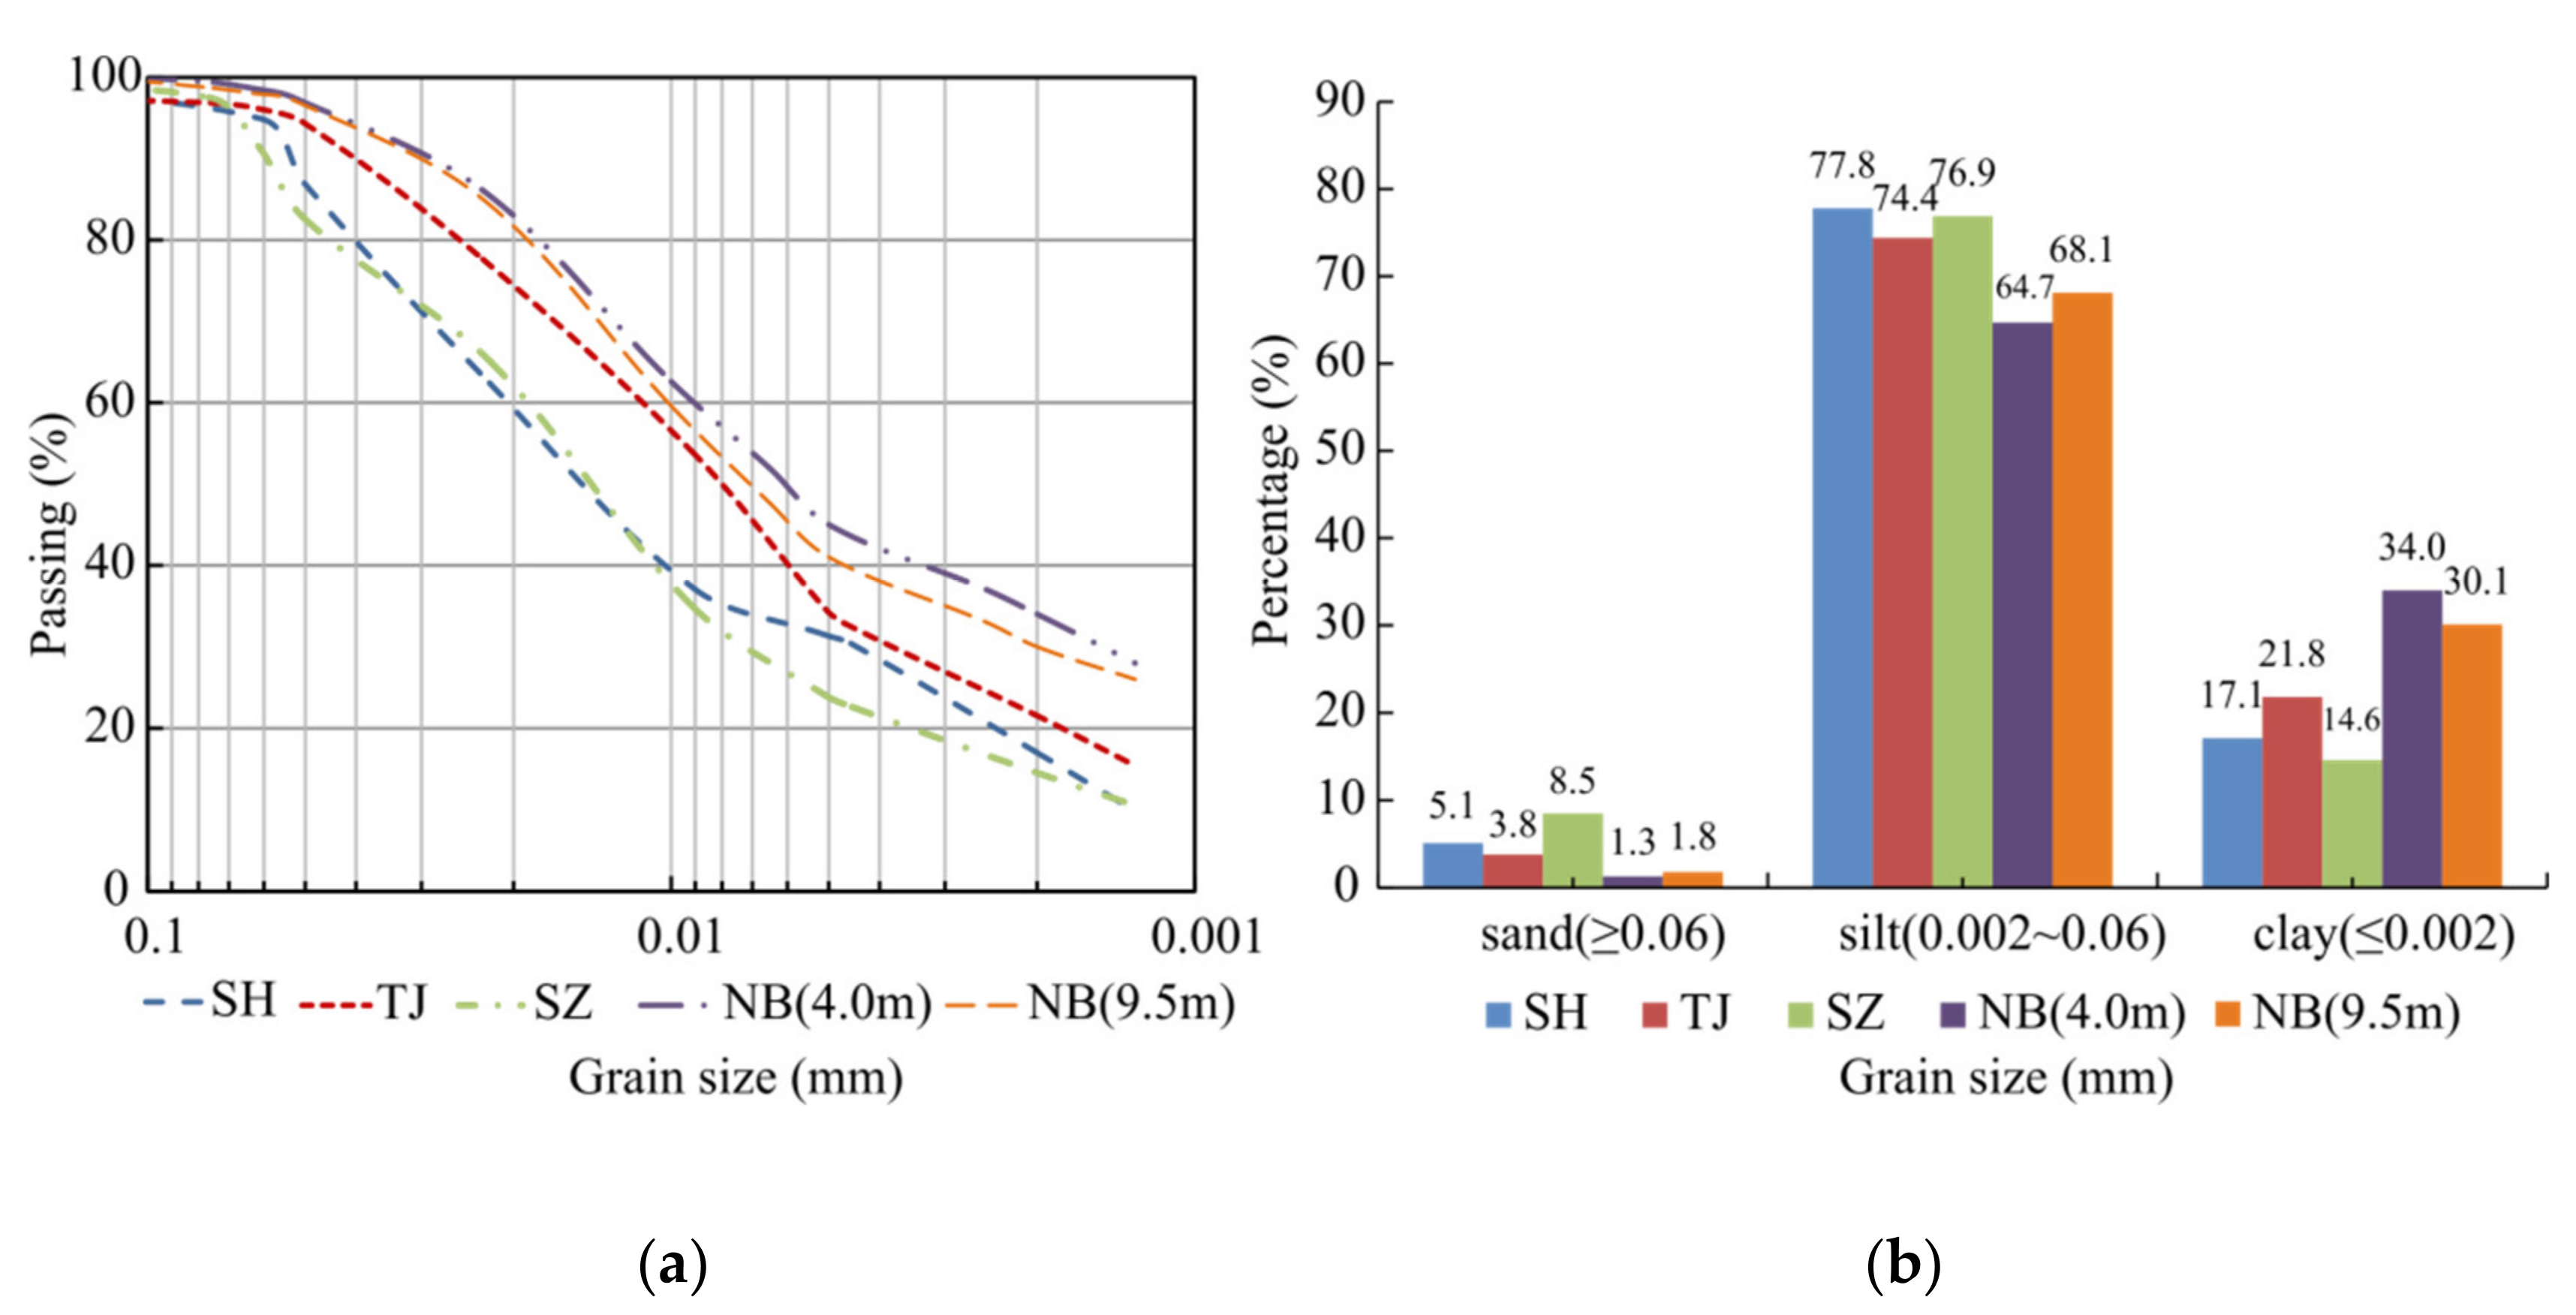
Figure 2a shows the grain size distribution curves of the SH, TJ, SZ and NB soft soils. Figure 2b shows the percentage of fractions in the four sites. The clay fraction content (<0.002 mm) of the NB is the highest, exceeding 30.0%, while those of TJ, SH and SZ are 21.8%, 17.1% and 14.6%, respectively.
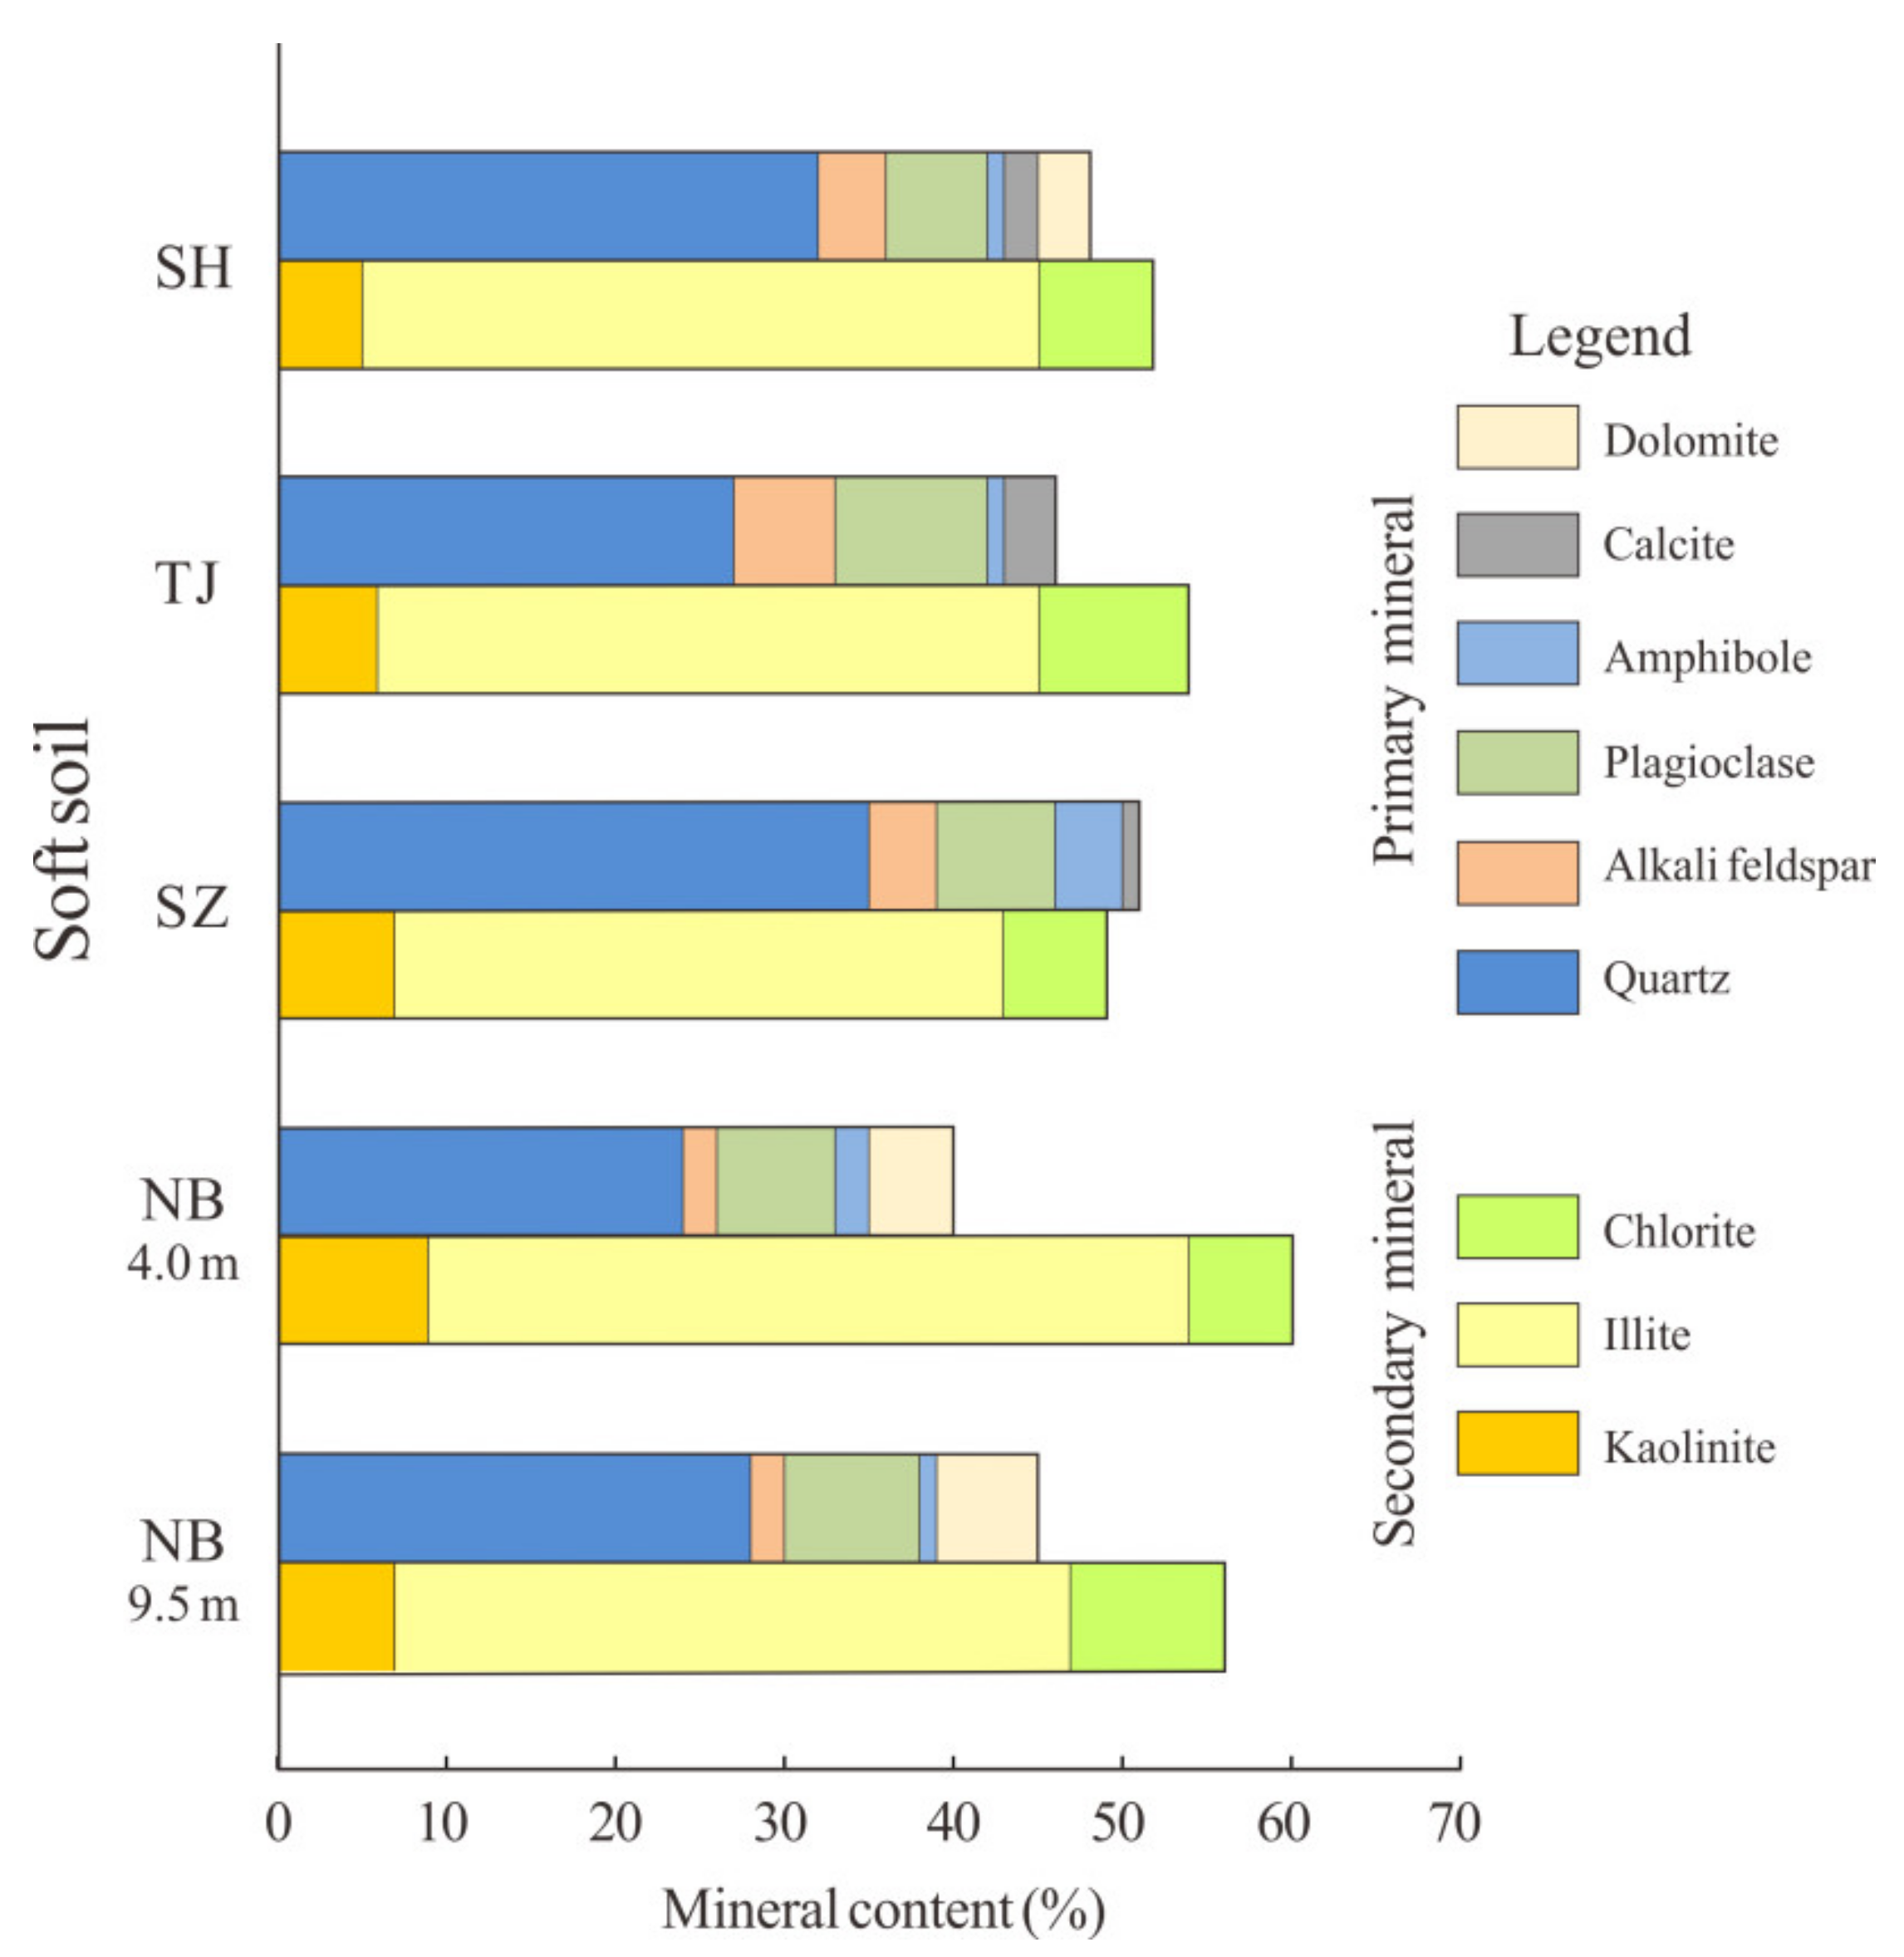
The mineral content according to the results of the X-ray diffraction (XRD) analysis is shown in Figure 3. In general, the types of minerals in the soft soils in the four sites are similar. The primary mineral is quartz, which reflects the higher content of silt and fine sand fraction in the grain composition of the samples. The secondary minerals are mainly illite, kaolinite and chlorite. The secondary mineral content of the TJ, SH and SZ is 54%, 52% and 49%, respectively. The secondary mineral content of NB is higher than that of the other three sites; at a depth of 4.0 m it is up to 60%, and at a depth of 9.5 m is 56%, indicating that the weathering degree of the NB is the highest in four sites.
The physical properties of the SH, TJ, SZ and NB samples tested in the laboratory are presented in Table 5, and there are two samples at different depths in NB site. All of the soft soils are saturated. We measured the liquid limit (wL) by the fall cone method and obtained the different fall cone depths by configuring soil samples with different moisture contents. The wL of the soil sample was determined by using the water contents and the fall cone depths in logarithmic coordinates, and parallel samples were adopted to ensure the accuracy of the results. The liquid limits (wL) of the NB samples are 39.2% and 42.7%, which are higher than the other three soils. The plasticity indexes (PI) of the NB samples are 18.3% and 21.1%, which are higher than the other three natural soils. The natural moisture content of the NB, TJ and SH samples is higher than their wL, while that of the SZ sample is close to its wL, and the w0/wL of SZ is 0.93. Table 5 shows that the NB sample from 4.0 to 4.5 m has the largest initial void ratio.
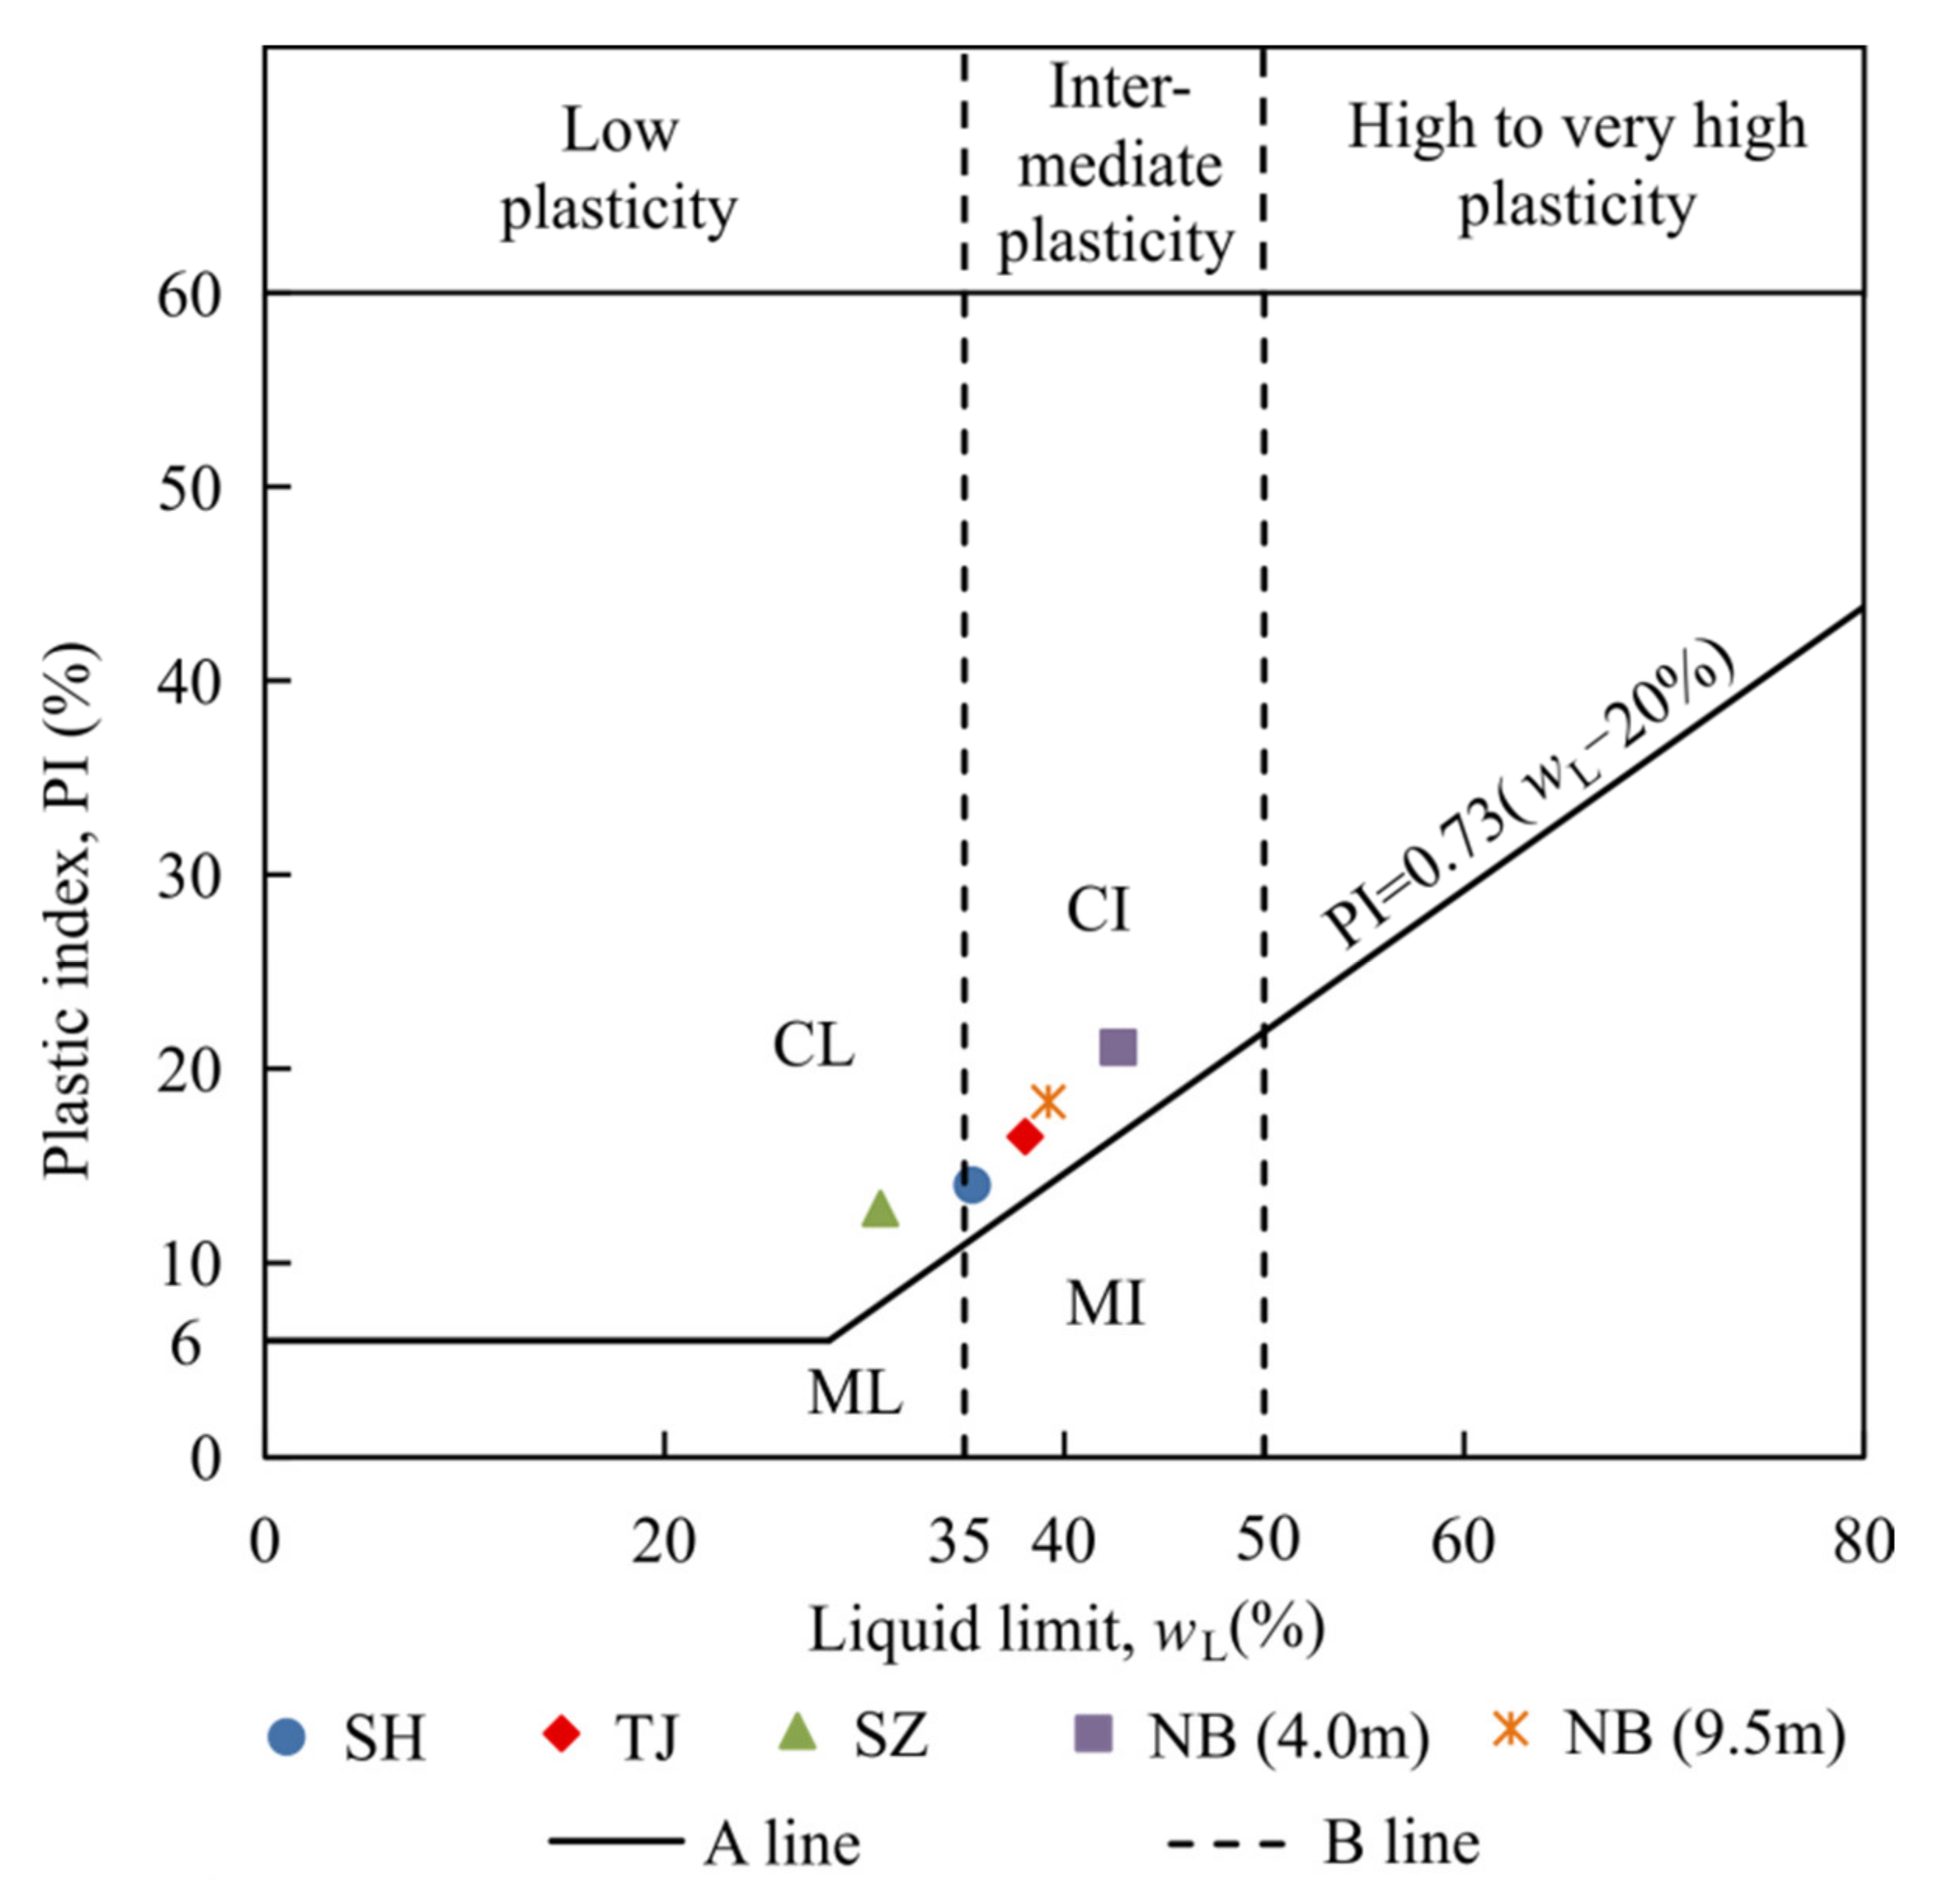
Figure 4 shows the plasticity chart for the four soil samples on the basis of the Atterberg limits. All data are above the A-line, which is a boundary between clay and silt. According to BS 5930, the five natural soils are categorized as clays with low to intermediate plasticity [47].

2.3. Methods

Five natural soil samples were selected from different sedimentary environments or depths; the depths of the soil samples were approximately 5, 7 and 10 m from the sites of SH, TJ and SZ, respectively, and 4 and 9 m from NB. The effects on the secondary compressibility of soft soil were explored by using different clay contents, water contents and depths.
To determine the influence of soil structure on compressibility, a one-dimensional compression test was carried out on the undisturbed and remolded soil samples from the four sites. The remolded samples were prepared according to the void ratios and initial moisture contents of the undisturbed samples. To obtain the secondary compression characteristics, a one-dimensional consolidation creep test was performed on the undisturbed samples. We used a wire saw to cut off part of the soil on the surface from the thin-wall tube samples. To reduce the lateral friction between the stainless ring and the soil specimen, the inner side of the stainless ring was coated with silicone grease, then the stainless ring placed flat on the soil and gently pressed down; then we used a wire saw to cut off the soil outside the stainless ring, then continued to press down gently, repeating the operation until the stainless ring was filled with soil to obtain the undisturbed sample. We collected the cut soil, dried it to a constant weight at 105 °C, then crushed it and passed it through the sieve 10 (2 mm); depending on the initial void ratio and initial moisture content of the undisturbed sample, the required dry soil and distilled water were properly mixed by using a geotechnical blade, then the wet soil was sealed. After placing the wet soil aside for 24 h, we filled the stainless ring with a geotechnical blade according to the calculated mass of the wet soil to obtain the remolded sample. Great care was taken to control the speed during sample preparation to prevent water loss. All the tests were carried out in a temperature-controlled room (23 ± 1 °C) to minimize the effect of temperature on the consolidation tests.
The conventional consolidation instrument was used to test the undisturbed and remolded soil samples for the four sites under the condition of two-side drainage, and the samples were always in a saturated state. The diameter and height of the specimens were 61.8 and 20 mm, respectively. The consolidation rings containing the samples were placed in the consolidation cell with filter paper and porous stone on both ends of the samples.
Using a step-loading method and a load increment ratio of 1, a total of fifteen soil samples were tested in two series. Series 1, including five undisturbed samples and five corresponding remolded samples, underwent one-dimensional compression tests. Series 2, including five undisturbed samples, underwent one-dimensional consolidation creep tests. Details of the tests are summarized in Table 6. The estimated in situ vertical stresses “σv’” were shown in Table 6. The smallest σv’ of undisturbed soil was about 50 kPa, which is relatively small. In order to better reflect the compression process, reduce the load variation of the prior stage and better determine the structure yield stress of soil sample, we chose a small initial stress to be 12.5 kPa. We used a step-loading method and a load increment ratio of 1, for a total of 8 loading stages for all undisturbed soil samples. In one-dimensional compression test, all the remolded soil samples were unloaded and reloaded after 400 kPa and each stage of load was maintained for 24 h. At present, there is no definitive deformation standard for creep test; it is generally considered that the creep has reached stability when the deformation is less than 0.01 mm within 10,000 s [48,49]. According to the test situation of one-dimensional consolidation creep tests, and to avoid losing moisture during the long test time, we determined the deformation standard as follows: when the deformation of a sample was less than 0.01 mm within one day (which is longer than 10,000 s), the next stage load was applied, and the sample was loaded for three days at each stress level to meet this deformation standard, so the time of duration of load is three days for each stage in one-dimensional consolidation creep tests, which is consistent with Quigley’s deformation standard [50].

3. Results

3.1. Compression Curves

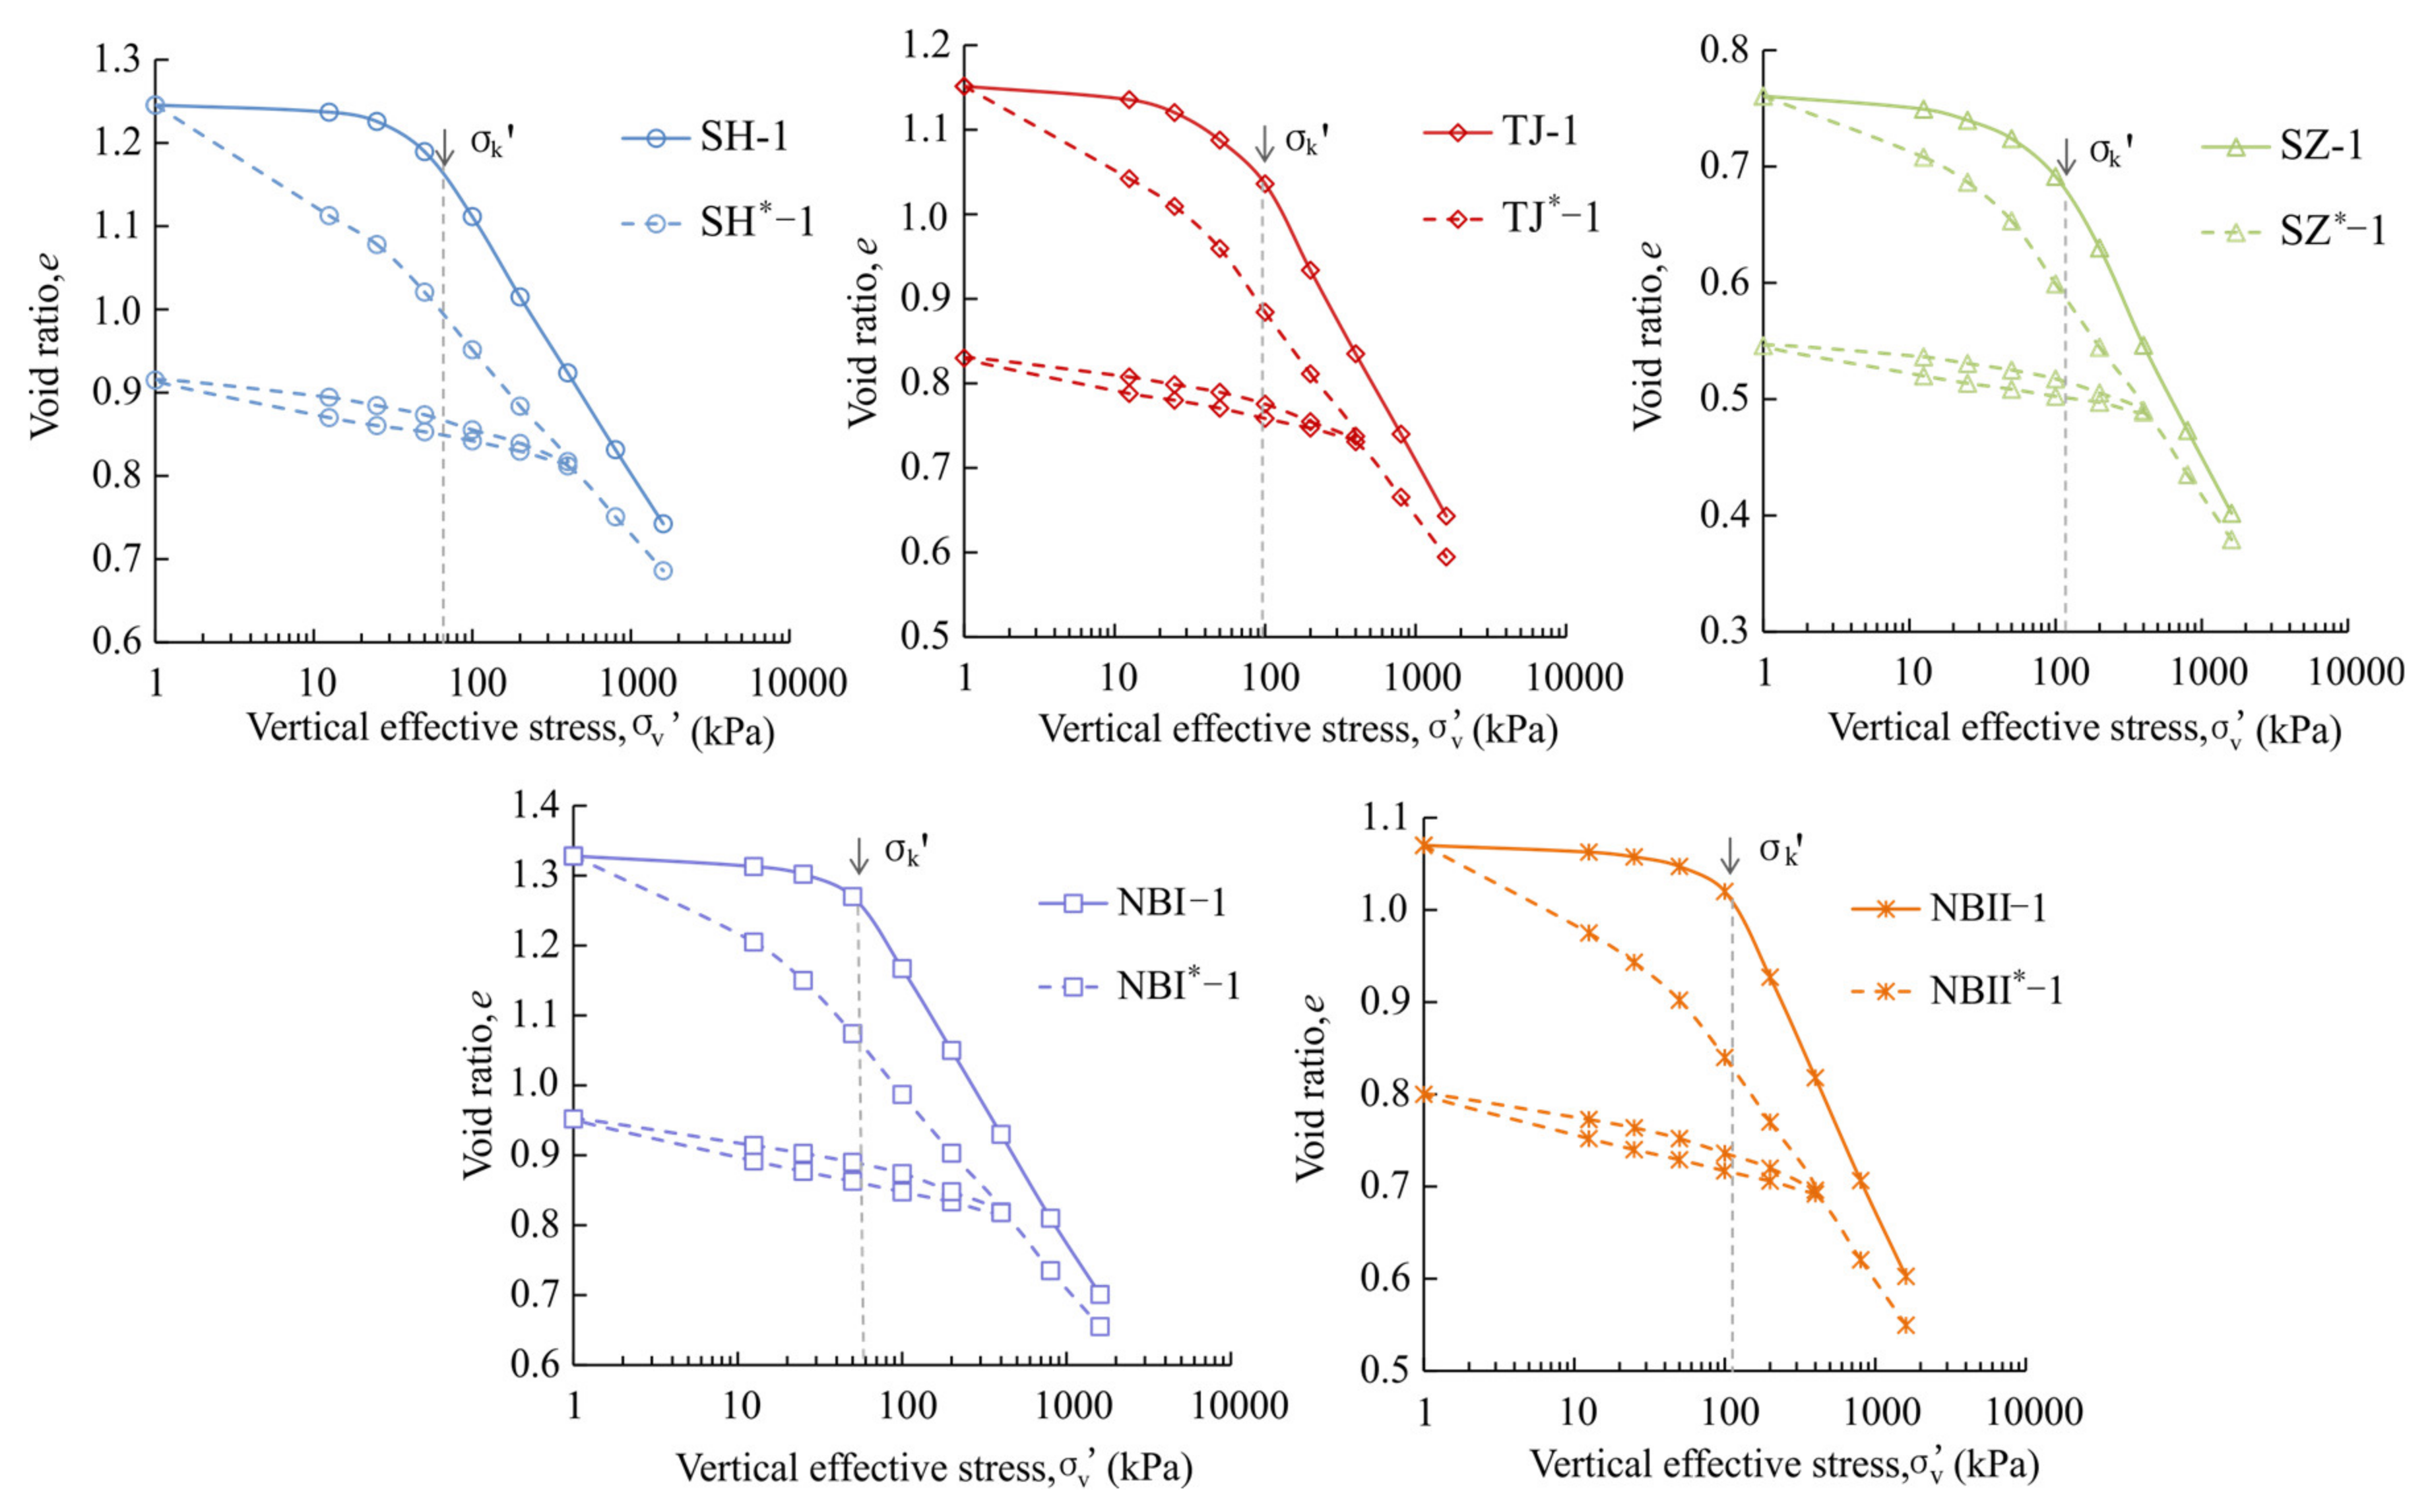
Figure 5 shows the ev’ curves from one-dimensional compression tests for the undisturbed and the remolded samples. It can be seen that the compression curves of the undisturbed samples had significant inflection points compared with those of the remolded samples, indicating that the soft soil used in the test had structural properties. For the naturally deposited structural soil, the pre-consolidation pressure of the soil was obtained according to the Casagrande method, called the structure yield stress σ’k [37]. The σ’k for samples of the SH, TJ, SZ, NBI-1 and NBII-1 are approximately 66, 95, 120, 59 and 115 kPa, respectively. Given that the estimated in situ vertical stresses σv’ are 55, 85, 109, 48 and 94 kPa, the structure stress ratio σ’kv’ of samples SH, TJ, SZ, NBI-1 and NBII-1 are 1.20, 1.12, 1.10, 1.23 and 1.22, respectively.
During the initial loading increments period, the changes in the void ratios were smaller for the undisturbed samples; however, the void ratios of the remolded samples changed considerably. When the pressure increased beyond σ’k, the curves of undisturbed samples began to steepen, and the undisturbed and remolded sample curves of each type of soil tended to merge, indicating that the initial soil structure began to break down. When the pressure exceeded 200 kPa, the compression curves were almost straight, the collapse of the structure caused the compressibility to increase sharply and the compression index Cc was obtained.
Due to the structure of the naturally deposited soft soils, when the effective stress was less than the structure yield stress σ’k, the compressibility of the undisturbed samples was less than that of the remolded samples. At this time, the destruction of the large pores and the discharge of free water were greater. When the effective stress exceeded σ’k, the structural failure began to develop. In addition to the slippage between the grains, there was an accompanying collapse of the structure, and the compressibility was larger than that of the remolded samples with a lower void ratio at the same pressure level.
Finally, Figure 5 shows that the curves of each undisturbed and corresponding remolded sample were very close at the pressure level of 1600 kPa, indicating that the soil structure of the undisturbed sample was greatly damaged, which was similar to that of the remolded sample. The deformation under high pressure was mainly due to the slippage between grains. A summary of the compression index Cc of the soil samples from the different sites is given in Table 7. It can be seen that the NB soil has higher Cc.
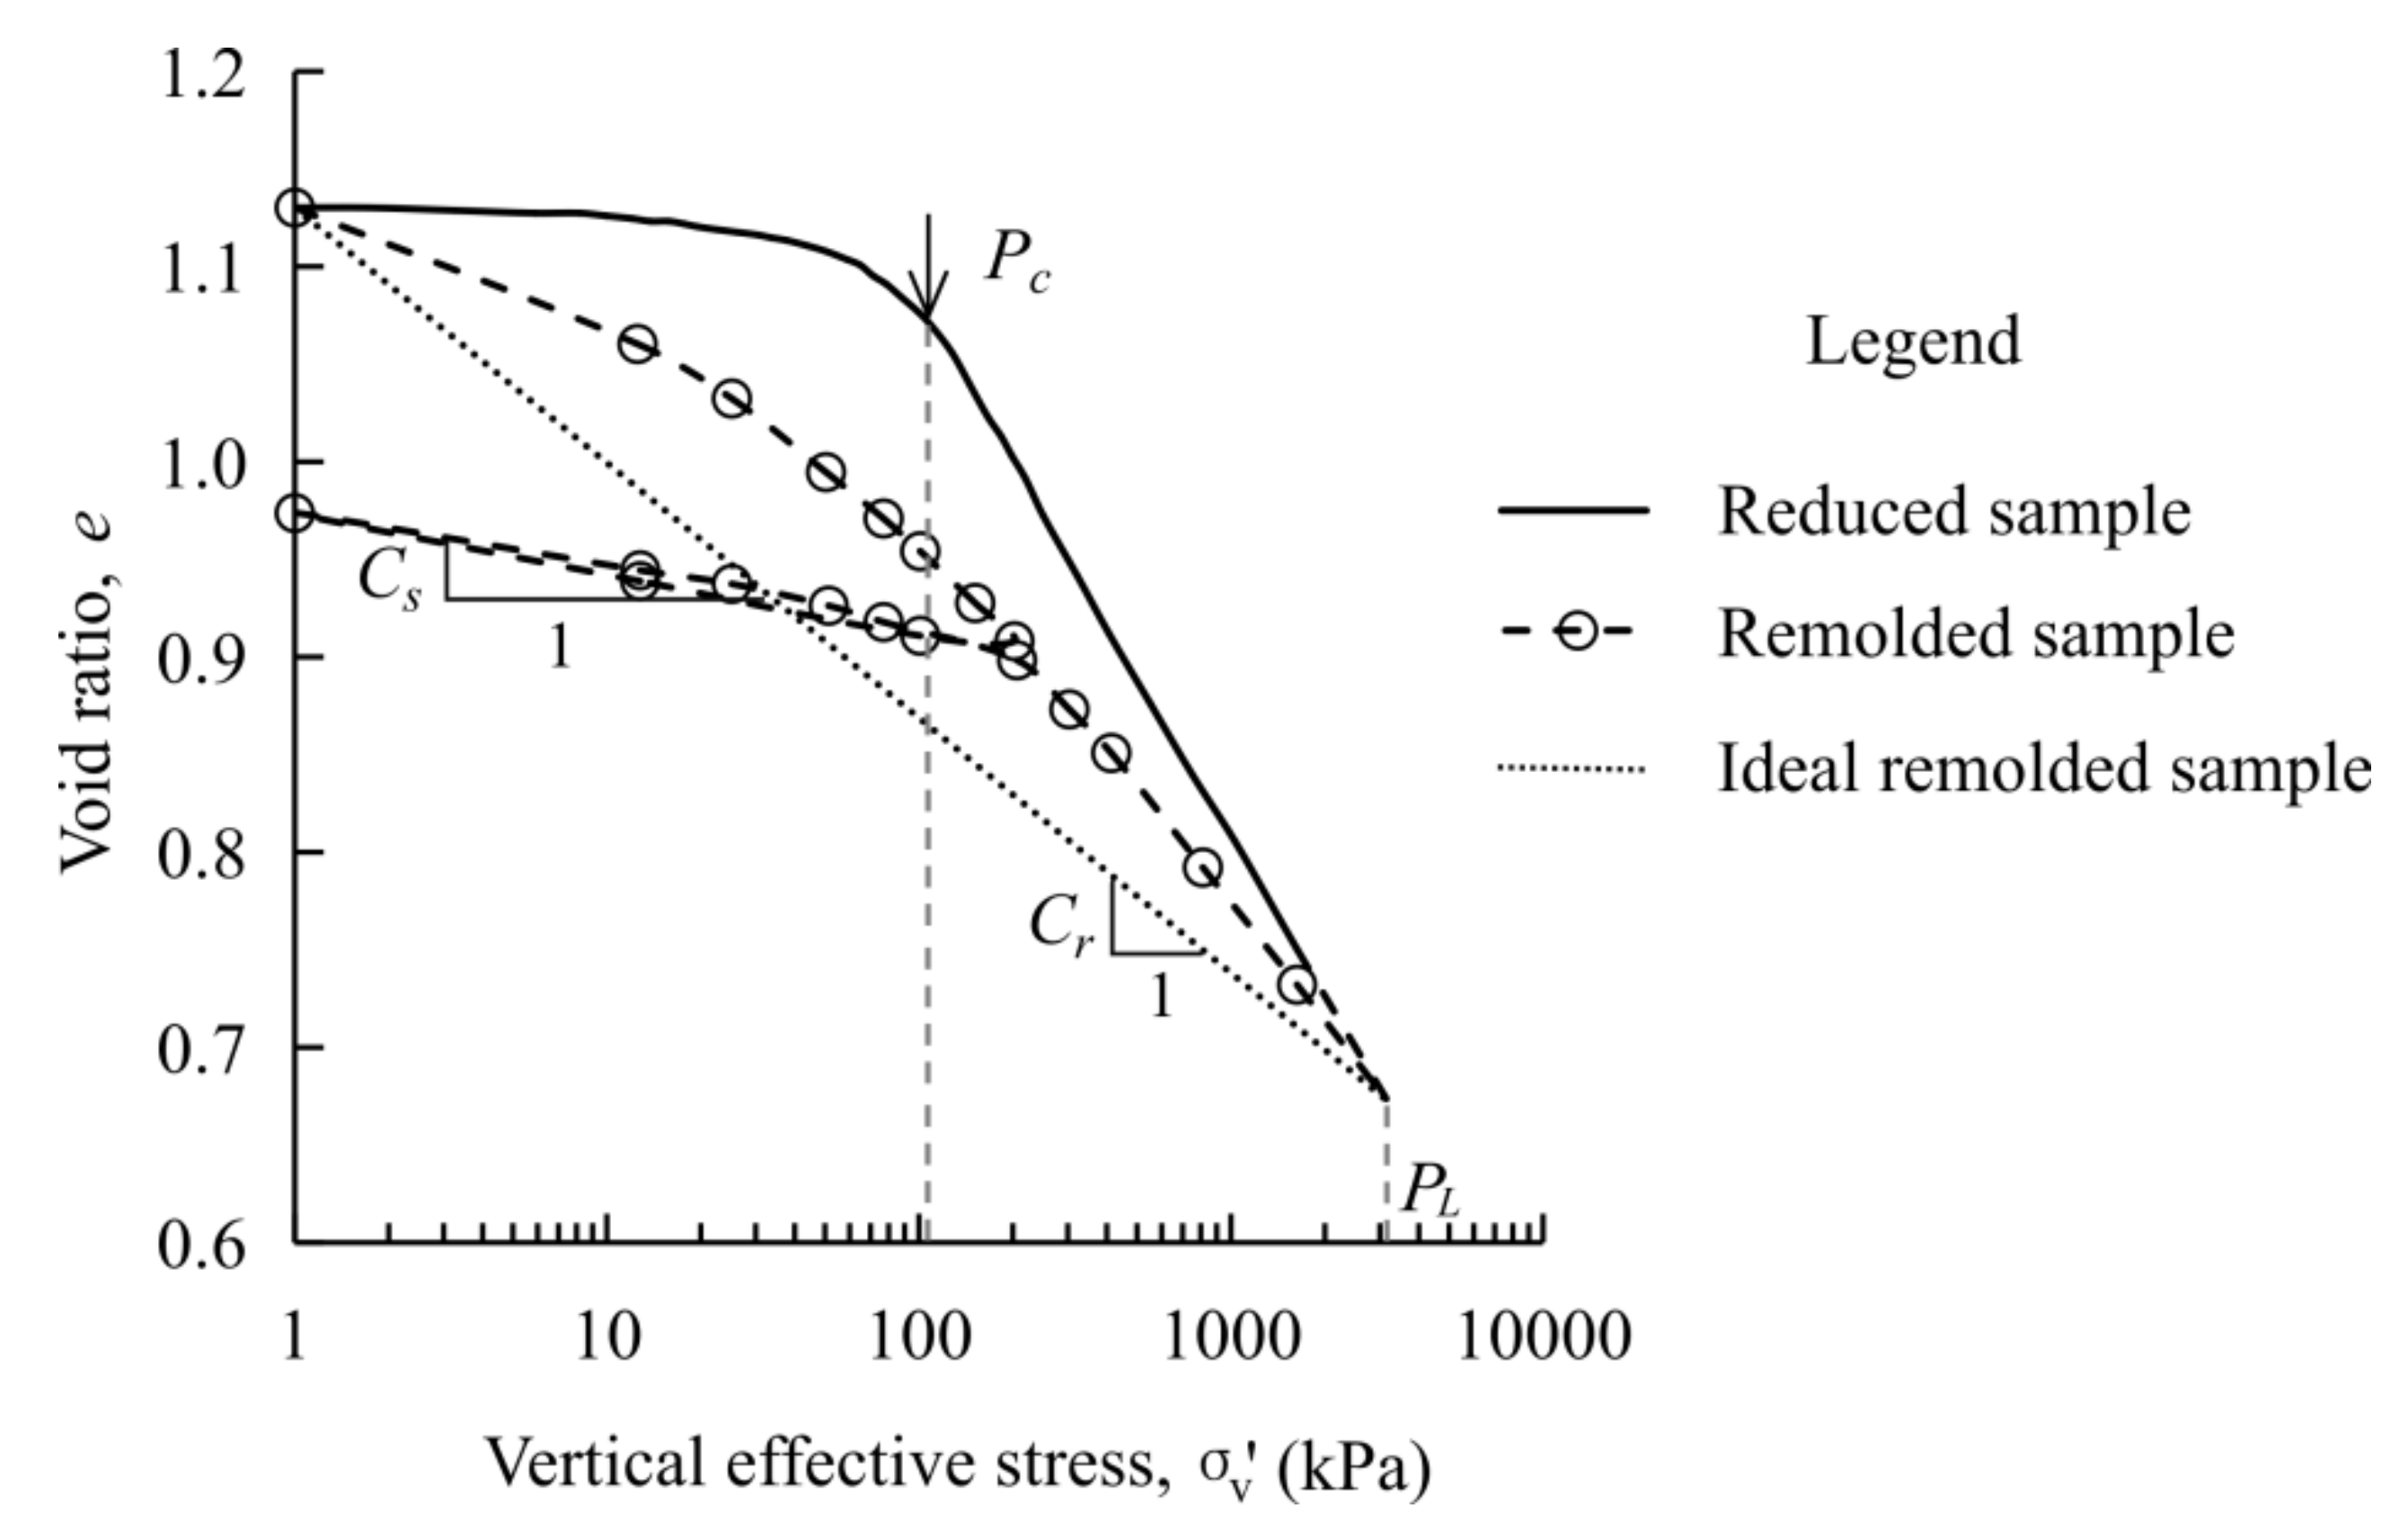
The soil structural strength q is the difference between the structure yield stress σ’k and the pre-consolidation pressure, which intuitively represents the size of the soil structure. However, it is difficult to determine the pre-consolidation pressure of structural soil. Based on the research of Casagrande and Schmertmann et al., Li and Zou used the rebound and recompression of remolded soil to establish a reduced compression curve based on the disturbance soil model, and obtained the pre-consolidation pressure of structural soil [51,52,53].
The model of the reduced compression curve is as follows:
e = e 1 C r ( lg P L ) 1 A ( lg P ) A , A = 1 + lg ( C s C r ) lg lg σ k lg P L
where e1 is the corresponding void ratio at a pressure of 1 kPa, which can be replaced by the initial void ratio e0; Cr is the compression index of the ideal remolded sample, that is, the slope of the ideal remolded sample compression line; Cs is the rebound index of the remolded sample, that is, the slope of the connection line of the rebound hysteresis loop of the remolded sample; σk is the structure yield stress of the original sample; PL is the pressure value corresponding to the intersection point of the compression curve of the remolded and undisturbed sample; and A is the reduction coefficient, which reflects the characteristics of the reduced compression curve.
Figure 6 shows the reduced compression curve [51]. The structural strength q of the sample was determined by this method, and the pre-consolidation pressure results and mechanical parameters are summarized in Table 7. It can be seen that the pre-consolidation pressure and the in situ vertical stress “σv’” of each soil sample are very similar, indicating that the five natural soil samples are normally consolidated soft soil. It shows that the structural strength q of SH and NB is greater than 10 kPa, which is higher than that of the other two samples.

3.2. Creep Curves

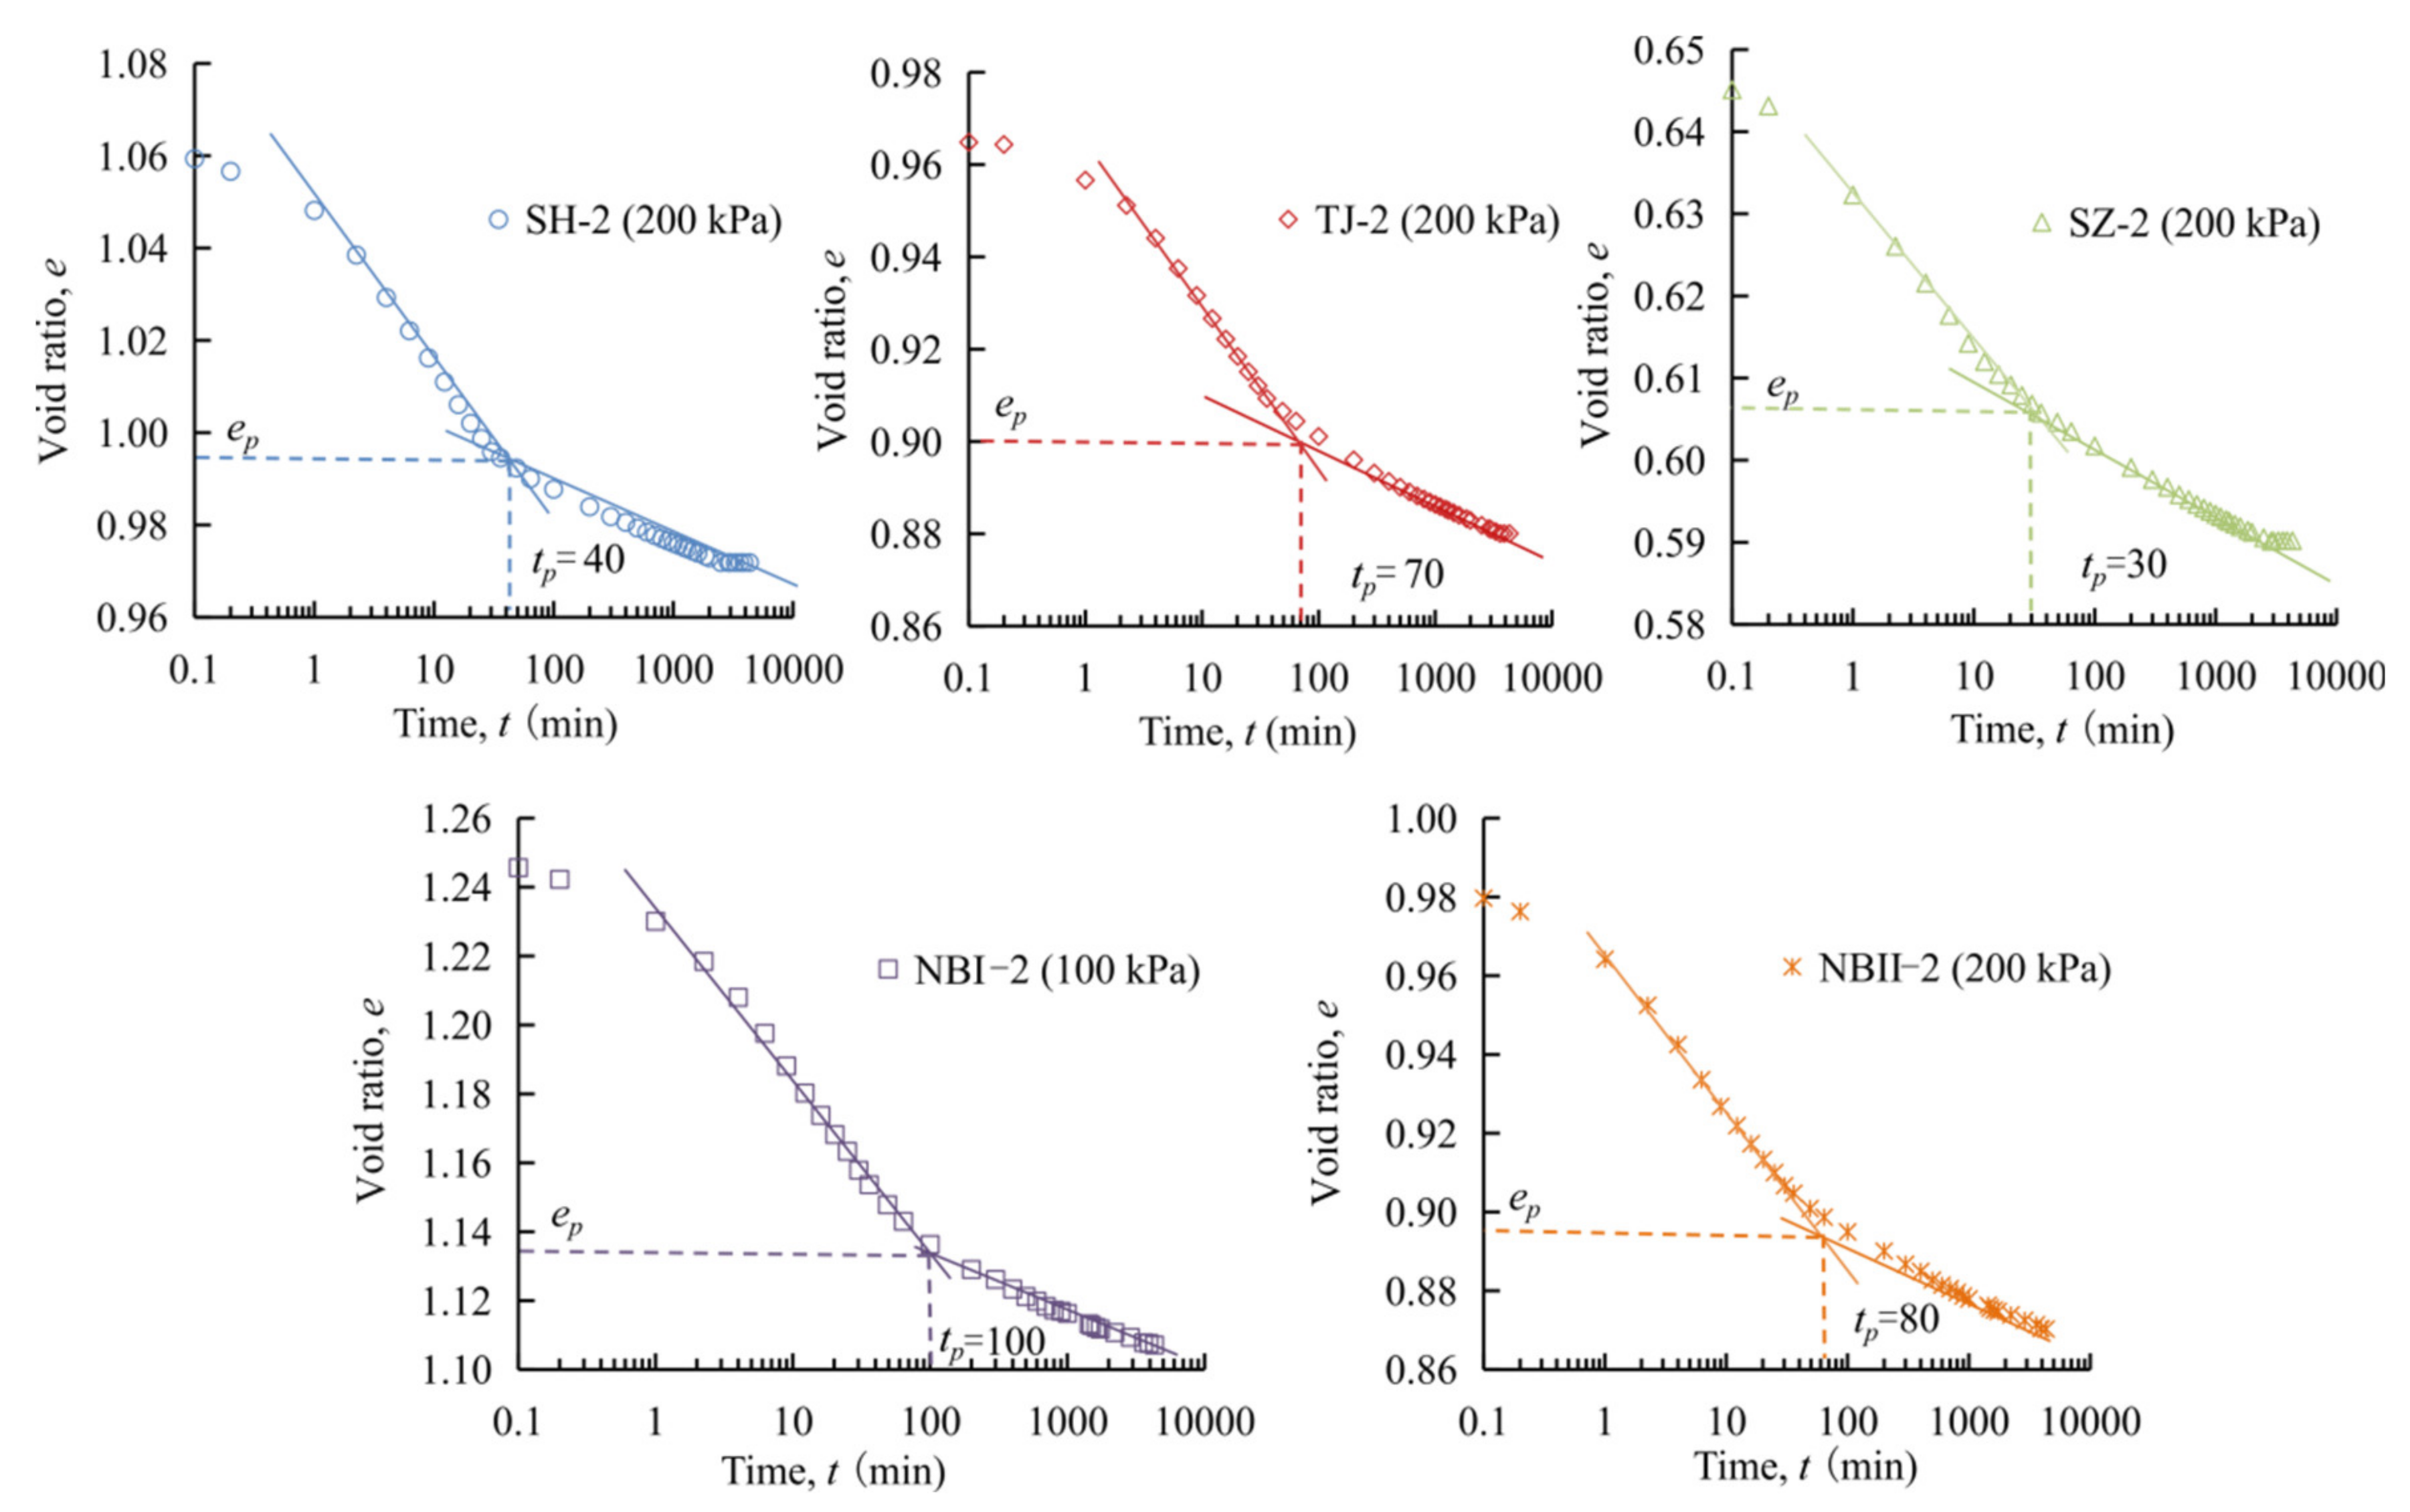
Figure 7 shows the e-lgt curve under various loadings on the basis of the one-dimensional creep test. When the pressure is small, the e-lgt curve was very smooth, with no obvious boundary between primary consolidation and secondary compression. When the pressure increased beyond σ’k, the curves presented a typical inverse S-shape, with a relatively obvious boundary between primary consolidation and secondary compression and a significant increase in creep deformation. At this time, the soil structure began to break down, and the secondary compression effect was visible, the curve showed a typical creep process. At higher loading levels, the primary consolidation effect decreased gradually. When the pressure was up to 1600 kPa, such as in the SZ creep curve, the boundary of primary consolidation and secondary compression was not so obvious.
The inverse S-shape consists of a parabola in the front, a skew line in the middle, and a gentle straight line at the end. According to the Casagrande method, the intersection point of the skew line in the middle and the gentle line at the end is the boundary point of the primary consolidation and the secondary compression [37]. When the pressure exceeds σ’k, soil structure is destroyed, primary consolidation and secondary compression increase and peak at a certain pressure, then with the increase of pressure, the primary consolidation effect decreases gradually. Compared with primary consolidation, secondary compression is smaller. Figure 8 shows the e-lgt curves under the pressure corresponding to the maximum secondary compression coefficient. At this time, the primary consolidation effect does not decrease, the slope of primary consolidation fitted line is high, the boundary of primary consolidation and secondary compression is obvious. The abscissa tp of the boundary point of the primary consolidation and secondary compression is the time when the primary consolidation finishes. The NBI has the maximum tp for about 100 min, which means its primary consolidation time is longer, corresponding to finer particles, and the clay fraction content is as high as 34.0%. The slope of the curve in the secondary compression stage is Cα. The calculation formula of Cα in this paper is as follows:
C α = Δ e lg ( t / t p ) ,
where tp and t are the completion time of the primary consolidation and a certain time after that, respectively, and Δe is the change in the void ratio of the soil sample at the corresponding time tp and t [54].

4. Discussion

4.1. Variation of Iv with Pressure

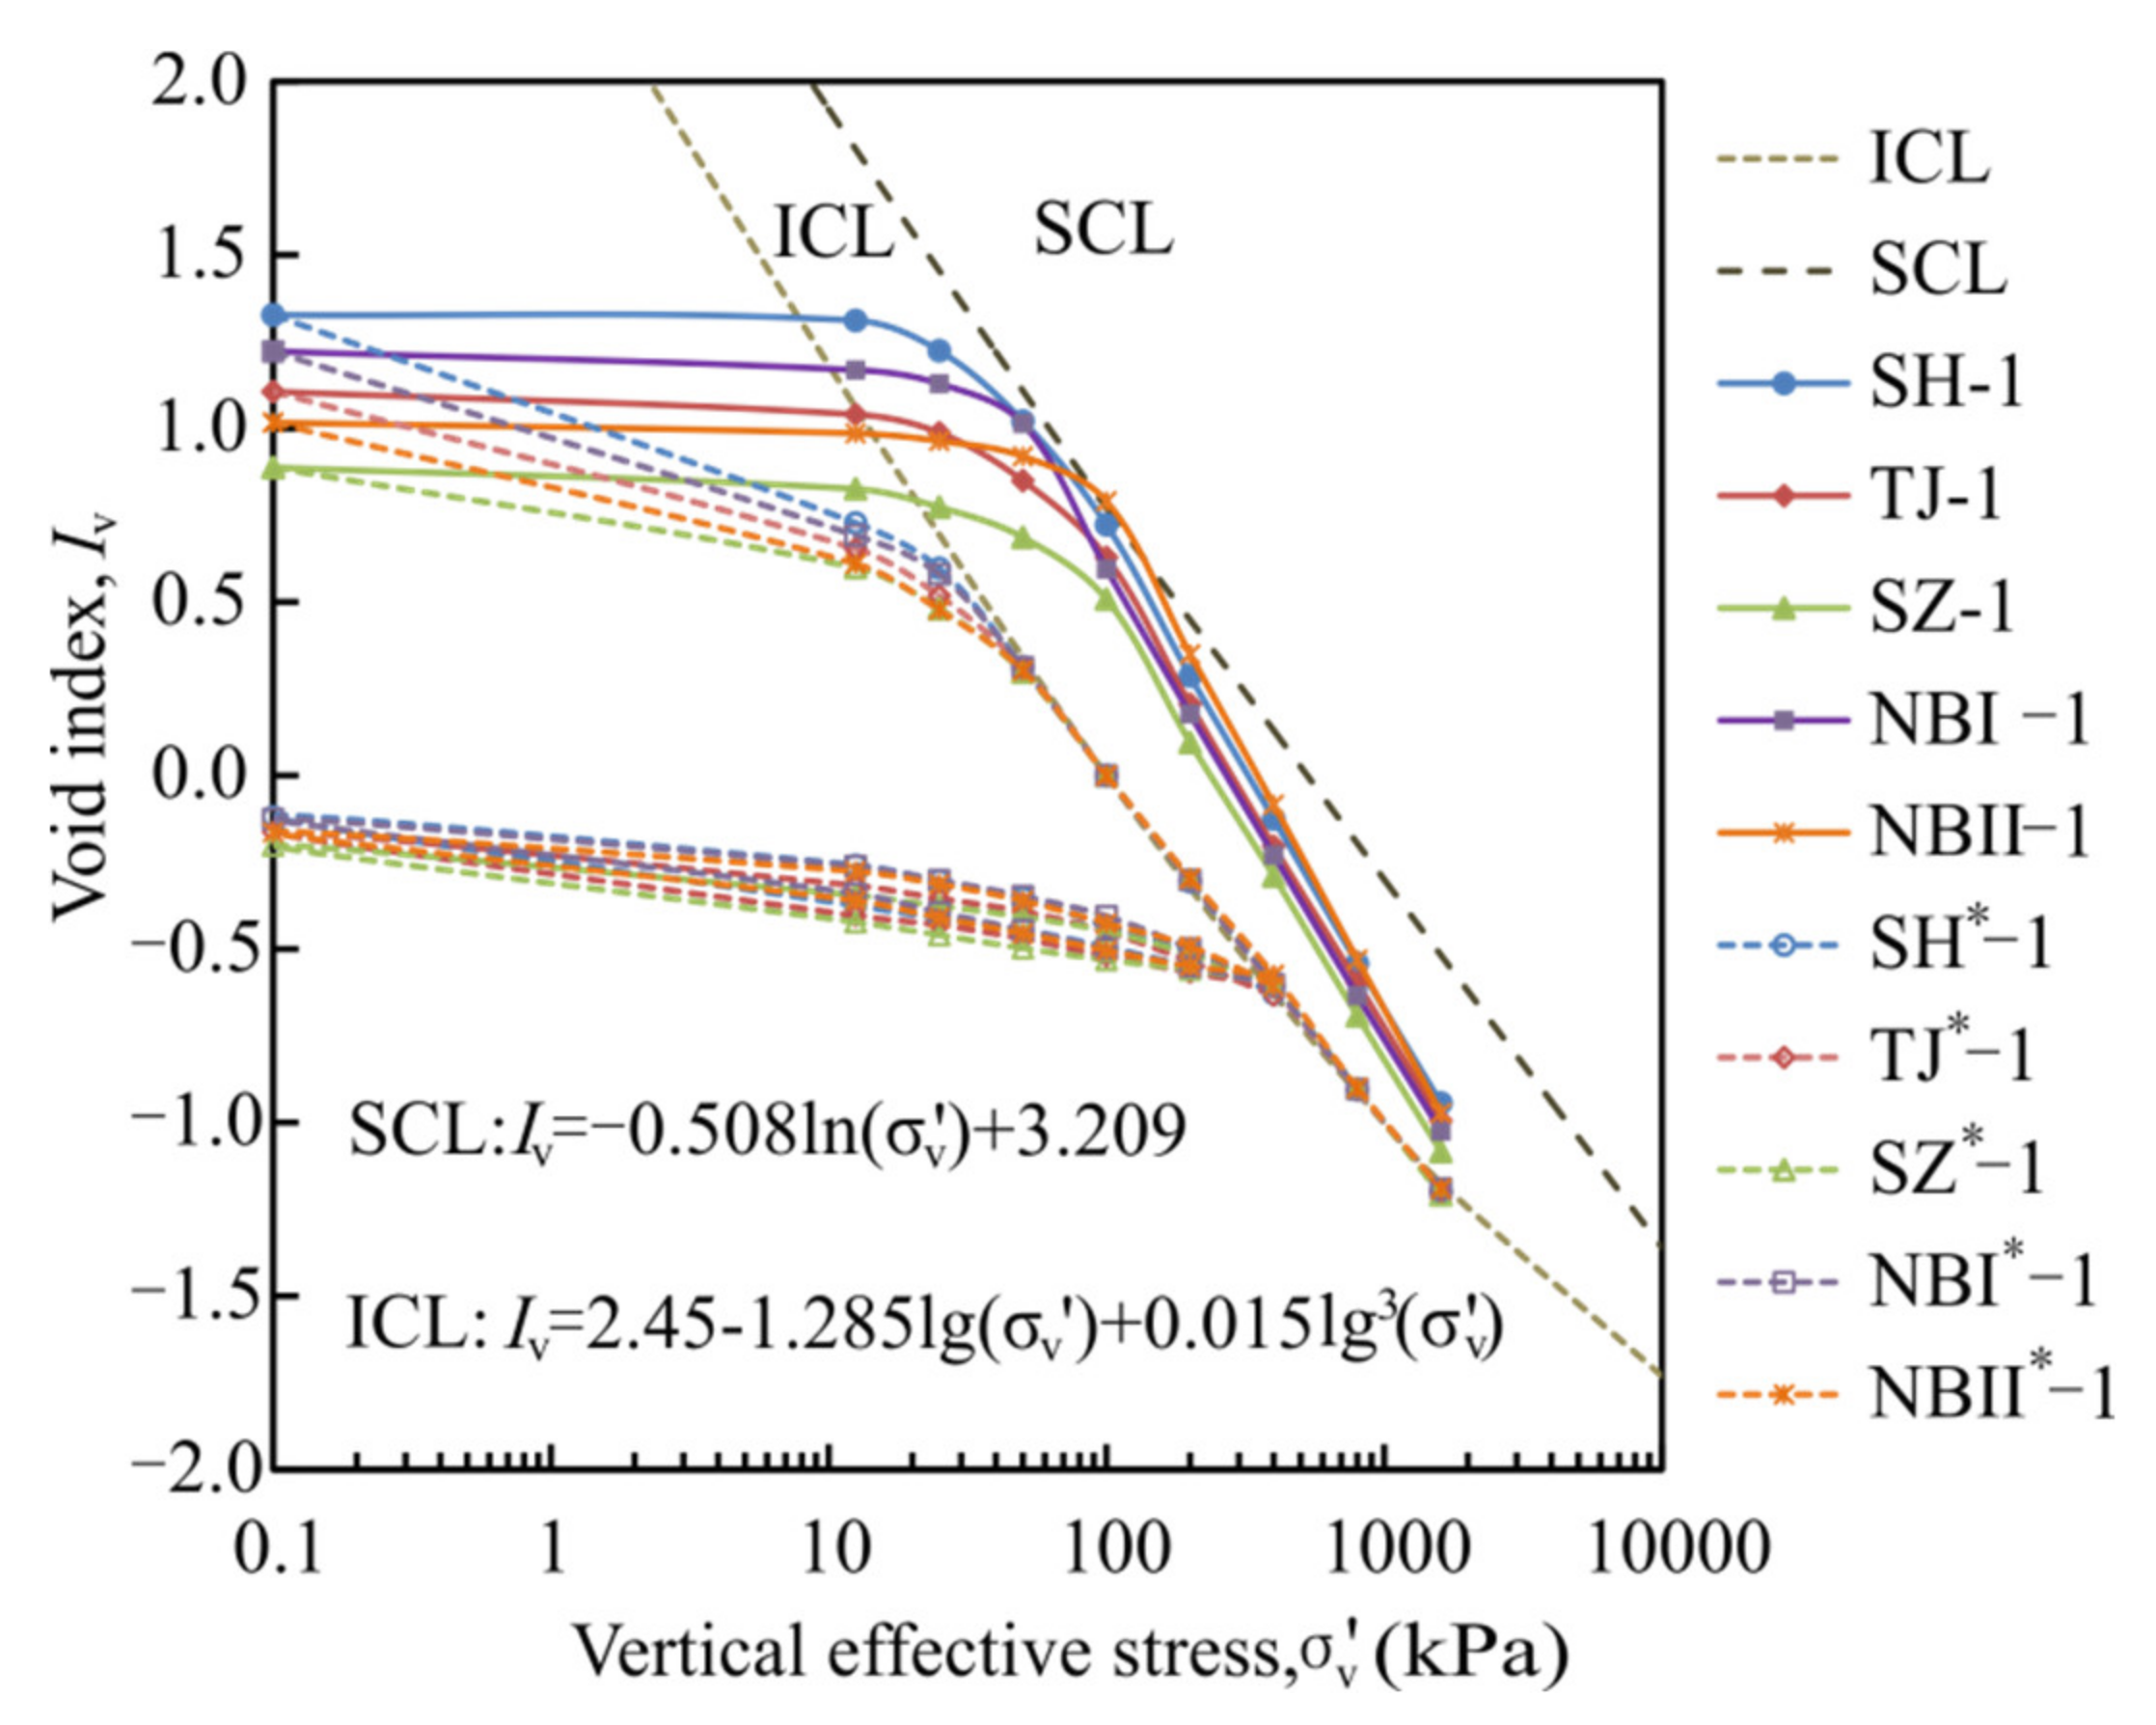
Burland normalized the compression curve of remolded soil with an initial moisture content of 1.0–1.5 times the liquid limit by using the void index Iv and proposed the intrinsic compression line (ICL):
I v = 2.45 1.285 x + 0.015 x 3 ,
where x = lgP, P is the vertical effective stress (kPa), and Iv is the void index,
I v = e e 100 * e 100 * e 1000 * ,
where e is the void ratio, e 100 * and e 1000 * are the void ratios of remolded soils with an initial moisture content of 1.0–1.5 times the liquid limit corresponding to the applied stress of 100 kPa and 1000 kPa, respectively, in the one-dimensional compression test [39].
I v 0 = e 0 e 100 * e 100 * e 1000 * ,
where e0 is the initial void ratio of natural deposited undisturbed soil.
Burland summarized the test data on void ratios and overburden pressures of a variety of naturally deposited undisturbed soils from various countries, and the relationship between the void index Iv0 and overlying pressure was obtained. The natural sedimentation state of soil is mostly consistent with the sedimentation compression line (SCL), which is above the ICL. In the long-term depositional process of natural sedimentary soil, the secondary compression deformation cannot develop infinitely at the unique rate of Cα. In nature, the secondary compression deformation of most soil bodies will stop, and its sedimentary state will be consistent with the SCL.
In the one-dimensional compression tests, the remolded samples were prepared by using sieved dry soil and distilled water to disrupt the structure of the soil (such as the influences of cementation, thixotropy, hardening, time effect and eluviation), to keep other factors consistent, the moisture contents of the remolded samples were determined according to the natural moisture contents of undisturbed soils. The moisture contents of the TJ*-1, SH*-1, NBI*-1 and NBII*-1 were 1.0 to 1.3 times the liquid limit, and only the moisture content of SZ*-1 was 0.93 times the liquid limit, which basically met the conditions of 1.0–1.5 times the liquid limit. To investigate the influence of the structure of the three natural soils, the results of one-dimensional compression tests are interpreted in terms of the void index Iv proposed by Burland.
Figure 9 shows the void index Iv with the variation in the vertical effective stress σv’ of the three samples. It can be seen that compressibility is nonlinear. Compression curves measured from the undisturbed and remolded samples are shown against the ICL and the SCL. The compression curves from the one-dimensional compression tests on the remolded samples agreed well with those predicted by Burland’s equation. Therefore, we can use the ICL to analyze the compression curves.
It is observed that the compression curves of all the undisturbed samples passed through the ICL at relatively low pressure and continued to stay above the ICL. The curves then approached the SCL when the vertical effective stress reaches σ’k. The compression curve of the SH-1 touched the SCL when the vertical effective stress was around 66 kPa, the σ’k of the SH sample. The compression curves of the TJ-1 and SZ-1 were close to the SCL when the vertical effective stresses were close to 95 and 109 kPa, which were σ’k of the TJ sample and SZ sample. The compression curves of the NBI-1 and NBII-1 were close to the SCL when the vertical effective stresses were close to 59 and 115 kPa. When the vertical effective stress exceeded σ’k, the curves of the undisturbed samples gradually moved away from the SCL and bent toward the ICL.
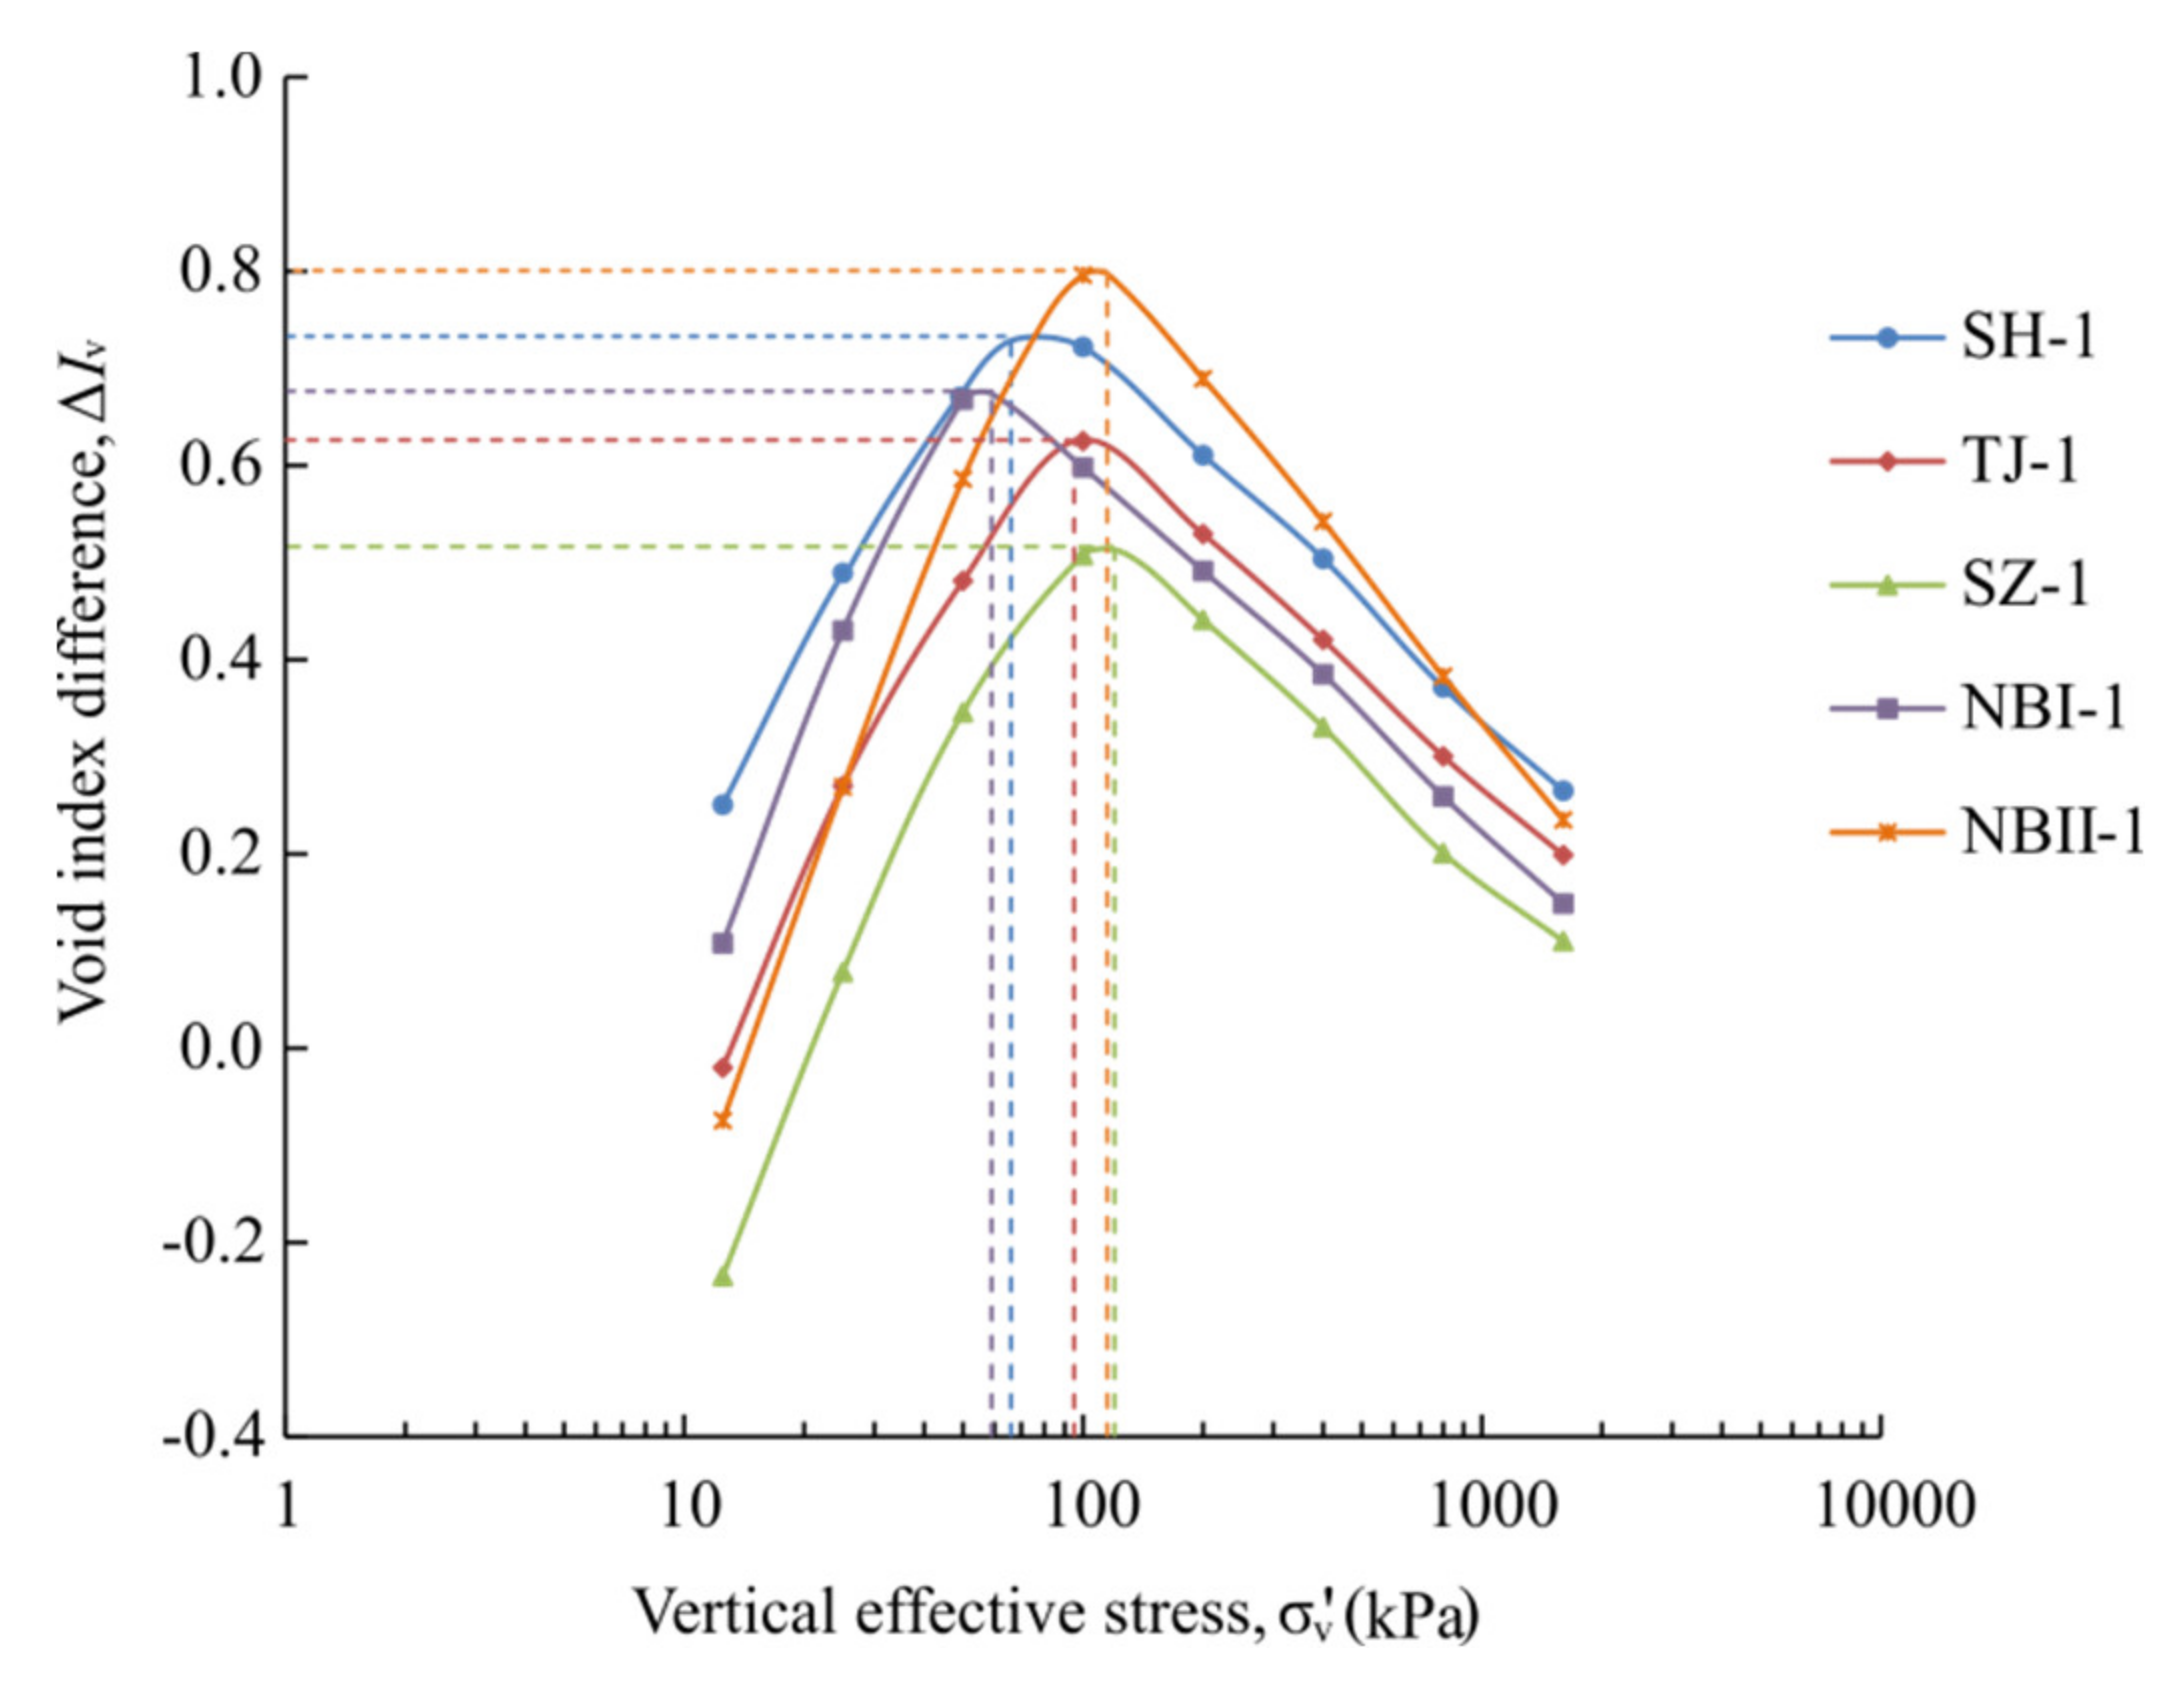
There is a void index difference (ΔIv) between the compression curve of natural sedimentary soil and the ICL. Figure 10 shows the ΔIv at varied vertical effective stress σv’. When the vertical effective stress was near σ’k, the ∆Iv reached a peak, and then, the Iv gradually decreased with increasing pressure. The ΔIv reached a peak when the vertical effective stress was near σ’k, indicating that when the vertical pressure was less than σ’k, the soil structure of the natural sedimentary soil resisted the external pressure. At this time, the soil particle skeleton was stable, the soil structure is almost unbroken, and almost no secondary compression deformation occurred. When the vertical effective stress exceeded σ’k, the soil structure was destroyed, the Iv decreased rapidly and the ΔIv decreased with pressure. The peak value of ΔIv represents the structural strength of the soil, the peak value ΔIv of NBII is relatively large, which is the largest among the five soft soils, consistent with the structural strength q calculated above.

4.2. Cα/Cc of the Soft Soils

After comparing and summarizing the test data of 22 kinds of soils, Mesri noted that for one kind of undisturbed soil, Cα/Cc is basically a constant, and the value is between 0.025 and 0.1. Table 8 shows the values of Cα/Cc for different soils [12], for example, the Cα/Cc value of fibrous and amorphous peats is 0.06 ± 0.01. According to Mesri’s research, the Cα/Cc values of Middleton, James Bay and San Francisco peats are 0.052, 0.059 and 0.060, respectively, all within the range of fibrous and amorphous peats [12,13]. The soil with greater compressibility corresponds to greater Cα/Cc.
The method for determining Cα is implicit in the Cα/Cc of Mesri:
C α C c = Δ e Δ lg t Δ e Δ lg σ v = Δ lg σ v Δ lg t ,
This ratio implicitly contains the influence of the soil over-consolidation degree, the soil structure and its failure on the Cα; this ratio has greatly facilitated engineering design.
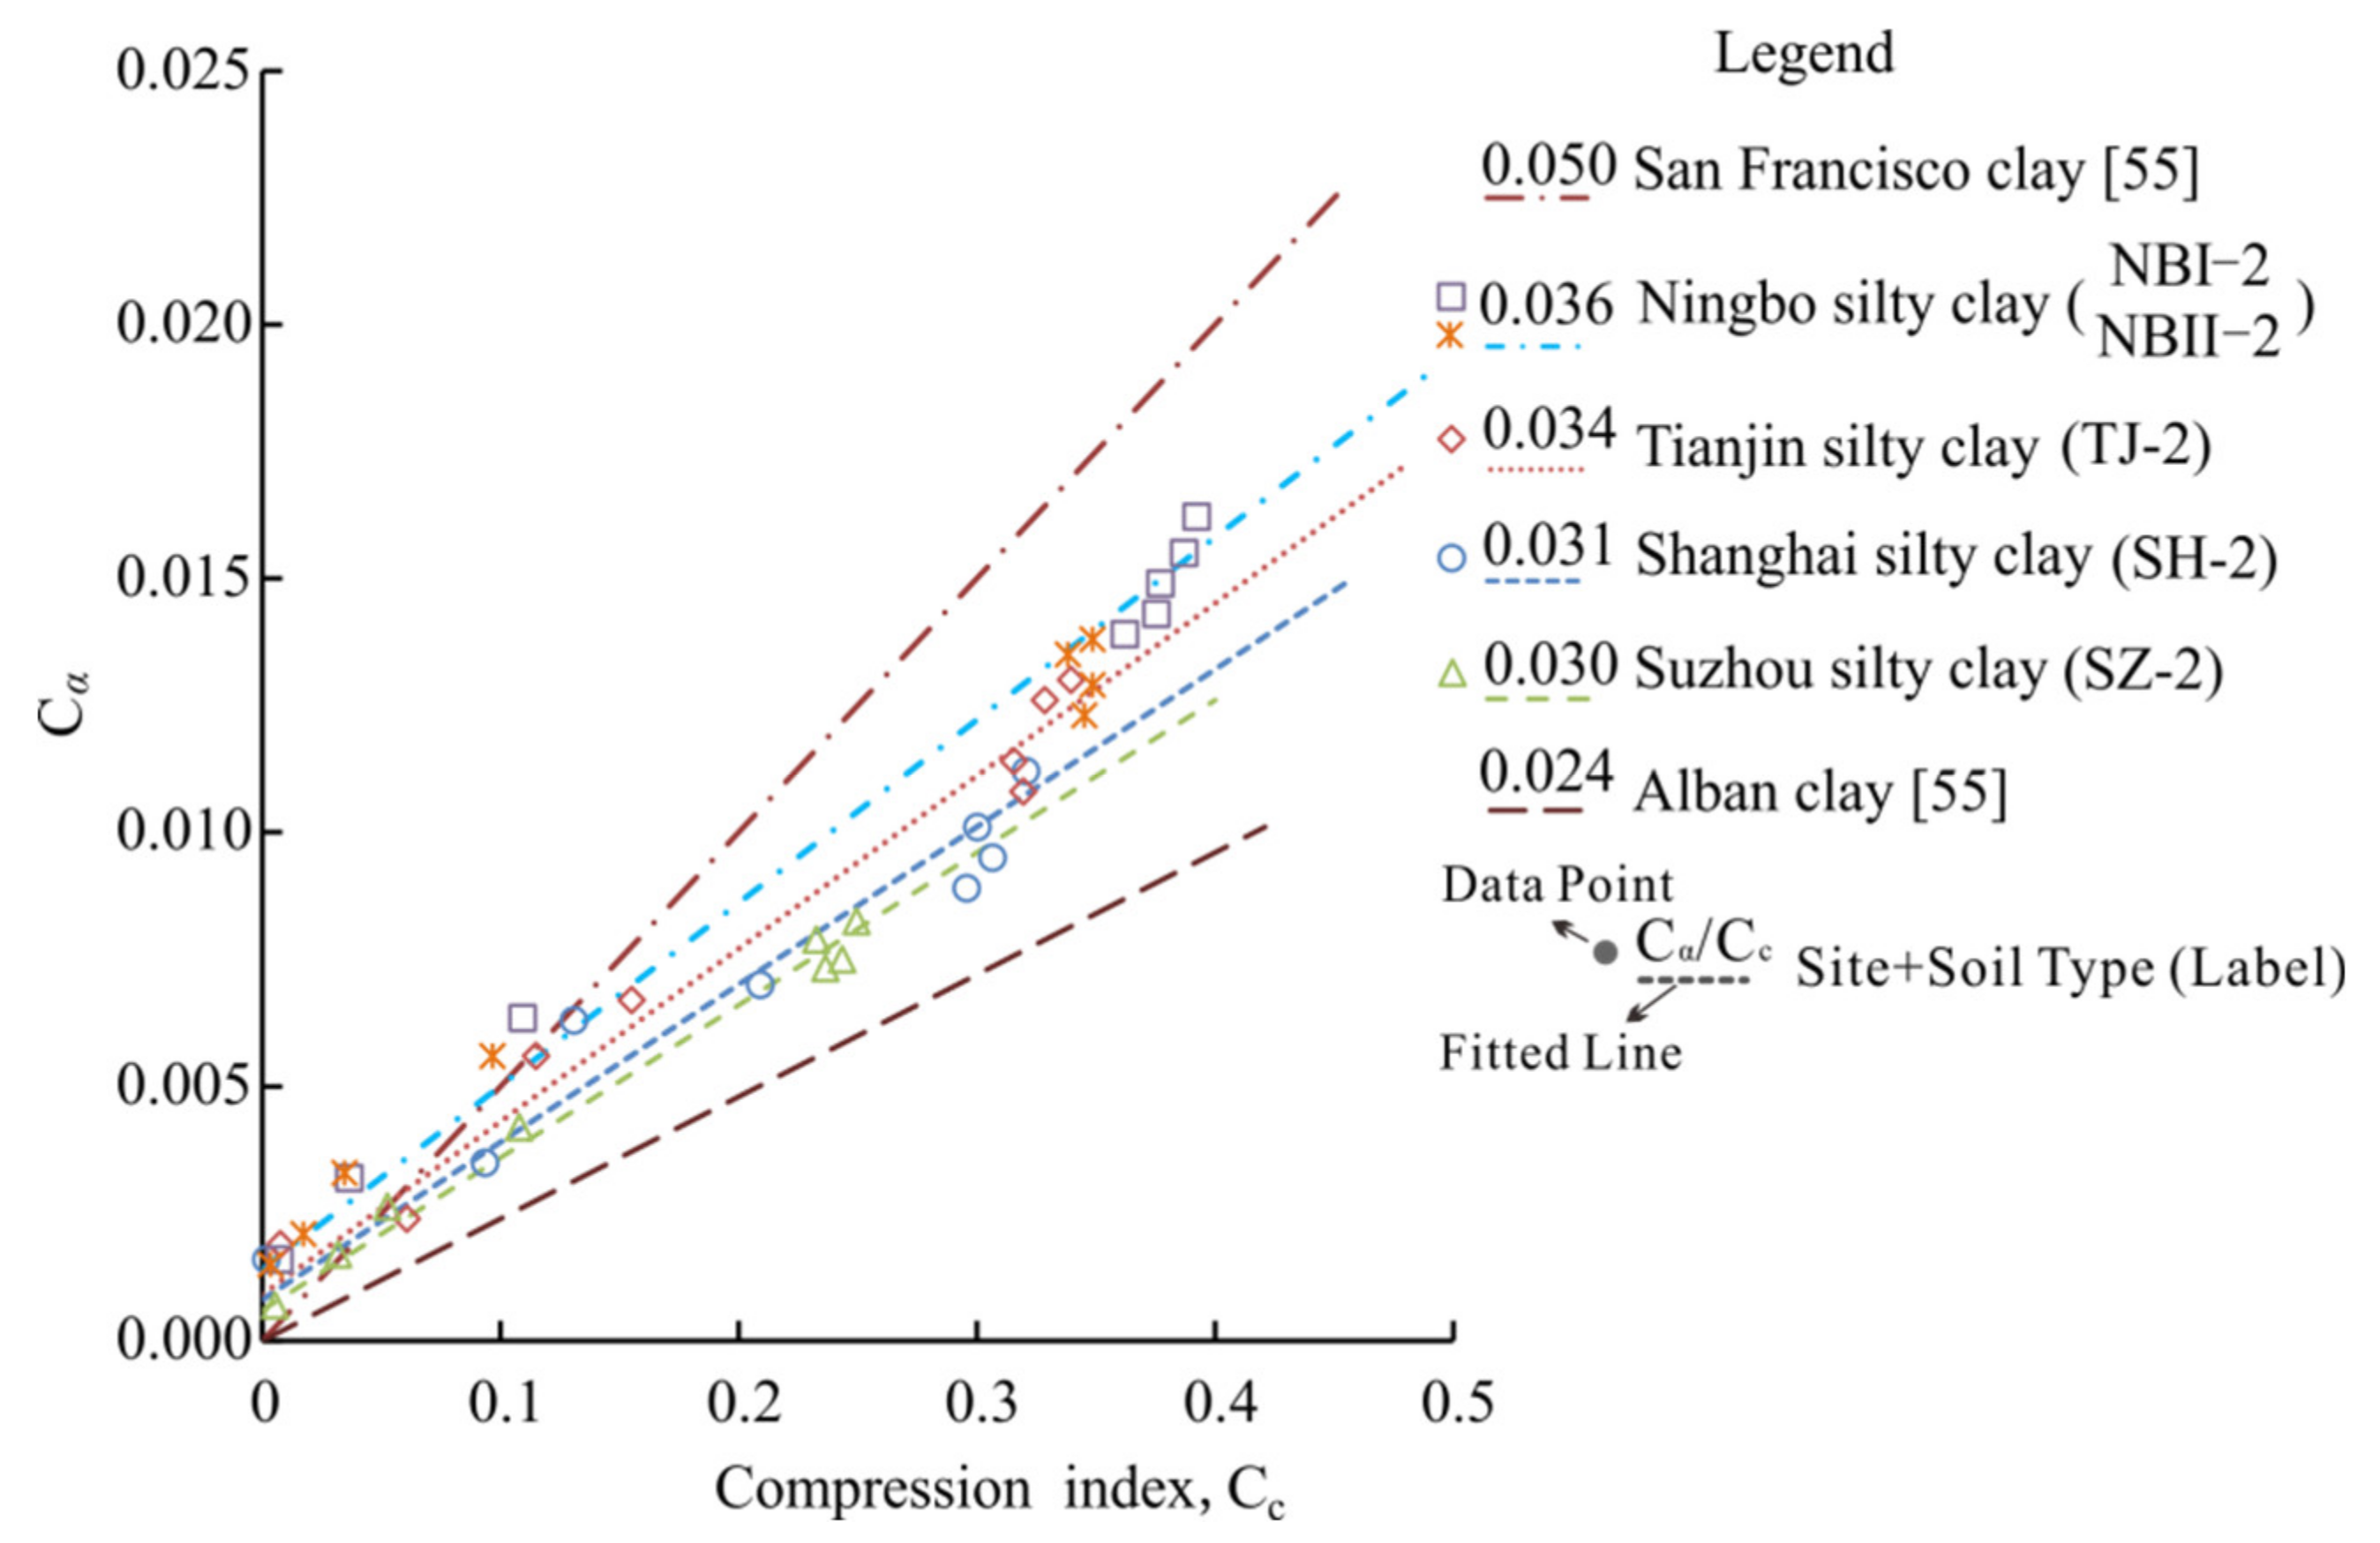
Based on the experimental data, the Cα and the compression index Cc of the soft soils in the four sites were obtained. The unique linear relationships between the Cα and Cc of the soft soils were demonstrated, and the secondary compression coefficients of other typical natural clays were compared and analyzed [55]. Figure 11 shows that the Cα/Cc values are 0.036, 0.031, 0.034 and 0.030 for the NB, SH, TJ and SZ, respectively, corresponding to the slope of each fitted line, within the range of inorganic clays and silts given by Mesri. Among the soft soils in the four sites, the Cα/Cc value of the NB was the highest, corresponding to its maximum compression index.

4.3. Variations of Cα with Time

In fact, the results of one-dimensional consolidation creep tests showed that the relationship of the void ratio to the logarithm of time is not a straight line and that Cα generally decreases with time [56,57]. Figure 12 shows variations of Cα with time under varied vertical effective stress for the natural clays of the four sites. It can be seen that when the pressure is less than σ’kv’/σ’k < 1), the value of Cα is low and decreases at the initial stage of secondary compression, and then is nearly unchanged over time under some pressure, such as sample NBII-2: when σv’/σ’k is 0.22 and 0.43, the Cα is low and nearly unchanged over time. When the pressure is near σ’k, the soil structure begins to break (as shown in Figure 9 and Figure 10). At this time, the change of Cα is significant, such as in sample SH-2, when σv’/σ’k is 0.76 and 1.52, respectively, Cα is much larger than when σv’/σ’k is 0.38, and it becomes the highest Cα curve of SH-2 when σv’/σ’k is 3.03. After the soil structure is seriously damaged, the damage process slows down and the Cα gradually decreases in stage of secondary compression, and then Cα is nearly unchanged over time under certain pressure.
In general, at low stress levels, the soil structure is hardly damaged, so Cα is low and remains almost unchanged over time. When the pressure is greater than σ’k, Cα decreases noticeably with time. Furthermore, the value of Cα is significantly larger when the pressure is greater than σ’kv’/σ’k > 1), and the Cc increases accordingly at this time as shown in Figure 5. The value of Cα has to do with the structure of the soil. This is consistent with Μesri’s conclusions [41]. As the vertical effective stress increases, the soil structure gradually breaks down and Cα gradually increases. After the serious destruction of the soil structure, the destruction process slows, and the value of Cα decreases at higher pressures.

4.4. Relation between Cα and Pressure

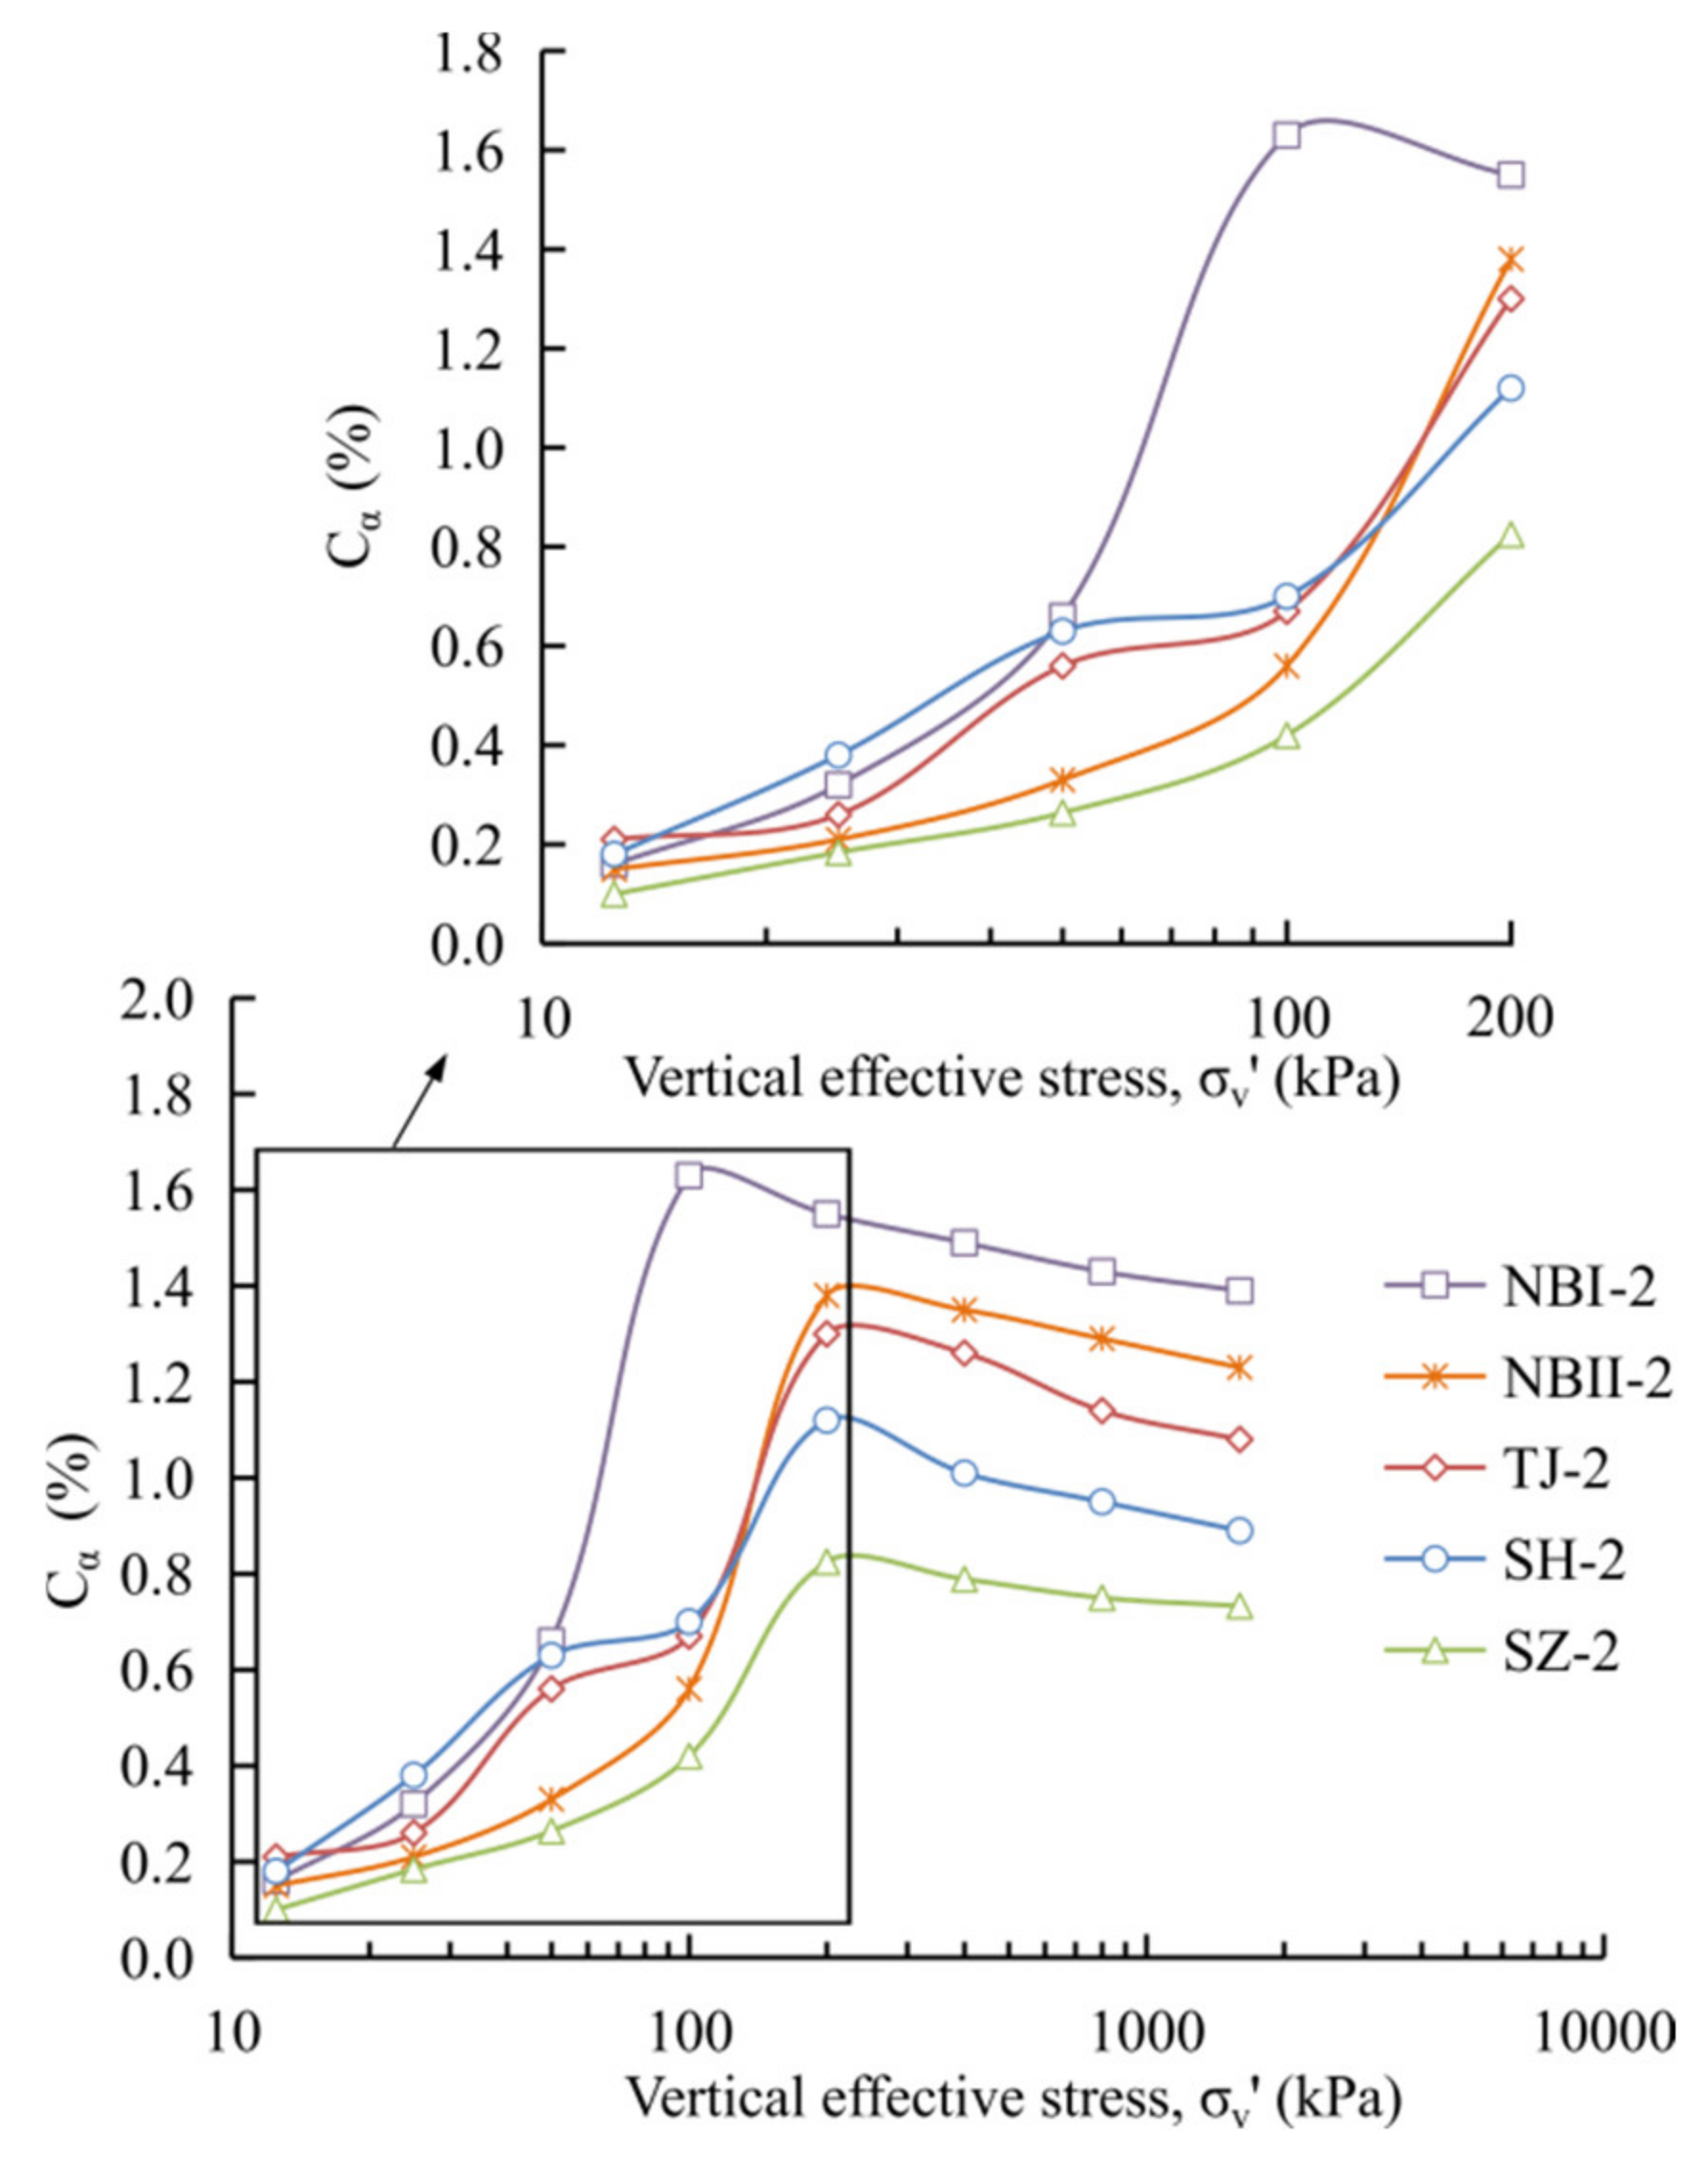
Figure 13 shows variations in the measured Cα with the vertical effective stress of the five soft soils. On the whole, for each soil sample, the Cα first increased and reached a peak value then decreased with the vertical effective stress and tended to be stable. When the pressure was 12.5 kPa, the Cα of the SZ-2 was smaller compared to the other four soil samples. With the increase of pressure, the Cα of the NBI-2, SH-2 and TJ-2 increased faster, when the pressure reached 50 kPa, their Cα was significantly higher than that of SZ-2 and NBII-2. When the pressure increased to 100 kPa, the Cα of NBI-2 reached its peak, the Cα of the NBII-2 increased significantly at this time, and it exceeded the Cα of TJ-2 and SH-2 when the pressure was between 100 and 200 kPa. When the pressure was 200 kPa, the Cα of NBII-2, TJ-2, SH-2 and SZ-2 reached the peak. Finally, the Cα of each soil sample decreased with the vertical effective stress after reaching its peak and tended to be stable.
The σ’k of NBI and SH is 59 and 66 kPa. Furthermore, the σ’k of TJ, NBII and SZ is 95, 115 and 120 kPa, respectively. With the vertical effective stress as low as 12.5 and 25 kPa, the Cα of the five soils was small and increased slowly with pressure. The soil sample is in the pre-yield stage at this time.
When the pressure was 50 kPa, which was close to the σ’k of NBI and SH, the Cα of NBI-2 and SH-2 increased rapidly. As shown in Table 7, NBII had the largest structural strength among the five soil samples, so the Cα of TJ-2 increased faster than that of NBII-2.
When the pressure reached 100 kPa, the Cα continued to increase, and the Cα of NBI-2 reached its peak. With the increase of pressure, the structure was in a significant destruction stage at this time and the growth of Cα was visible, especially for NBII-2. When the pressure reached 200 kPa, the Cα of SH-2, TJ-2, SZ-2 and NBII-2 reached the peak. Figure 13 shows that the Cαmax of the five soft soils appeared around 100 and 200 kPa, and the Cα then decreased and tended to stabilize, called residual Cα. The residual Cα value under high pressure is 79%–89% of the Cαmax. Table 9 provides a summary of the secondary compression coefficient peak Cαmax and the residual secondary compression coefficient Cαr.
The test results showed that Cα varies with pressure [23]. According to the one-dimensional compression test, the mechanical properties of the natural sedimentary structural soft soils were different from those of the remolded soils. The soil structure also had a significant influence on the secondary compressibility; when the pressure on the soil sample was less than σ’k, the soil structure resisted external pressure and was not destroyed. This stage was characterized by the destruction of large pores and the discharge of free water, and free water discharge was easier. After the primary consolidation was completed, the grain cementation hindered the sliding, and the degree of creep was small, and so the Cα was small at this time. When the pressure was greater than σ’k, the soil structure began to fail, the collapse of the structure and the slippage between the grains readjusted the grain arrangement, the damage to the grain cementation increased the creep, and the Cα rapidly increased. As the pressure increased, the soil structure became increasingly weaker, and the Cα reached a peak. At this time, the structure was almost completely destroyed, and the compressibility of the undisturbed and remolded sample was similar. Then, it developed to a new stable condition under pressure, and the Cα decreased with pressure and then gradually stabilized. According to the conclusion of Zhang et al., the Cα of undisturbed sample under high stress was similar to that of remolded sample and did not change with pressure under high stress [43].
The structural failure of the natural soft soil mainly occurred in the pressure range of 0.7 to 2.0 σ’k, and it can be seen that the soil structure was almost completely destroyed when the pressure was 2.0 σ’k [41]. As shown in Figure 14, the research of Li et al. on the Shanghai soft soil at depths of 8.5 and 15.5 m, showed that the Cα changed with pressure and reached a peak after the structure yielded. The peak value appeared near 2.4 to 2.5 σ’k, and with increasing pressure, the Cα gradually approached the value of the remolded soil [44]. Figure 13 shows that the maximum structure yield stresses of SH, TJ, SZ and NB were 3.0, 2.1, 1.7 and 1.7 σ’k, respectively, close to the results of Μesri [41]. When the soil structure was almost completely destroyed, the corresponding stress P′ was called the structure full yield stress [26,42]. Many studies obtained this result. Table 10 shows a summary of σ’k and P′ from different sites [1,23,25,44,50,58,59,60,61]. It can be seen that the P′ of soft soil was greater than its corresponding σ’k. Combined with the study of the empirical range given by Μesri and the test results, the P′ was approximately 1.6 to 3.0 σ’k, and Cαmax appears near P′ [41].
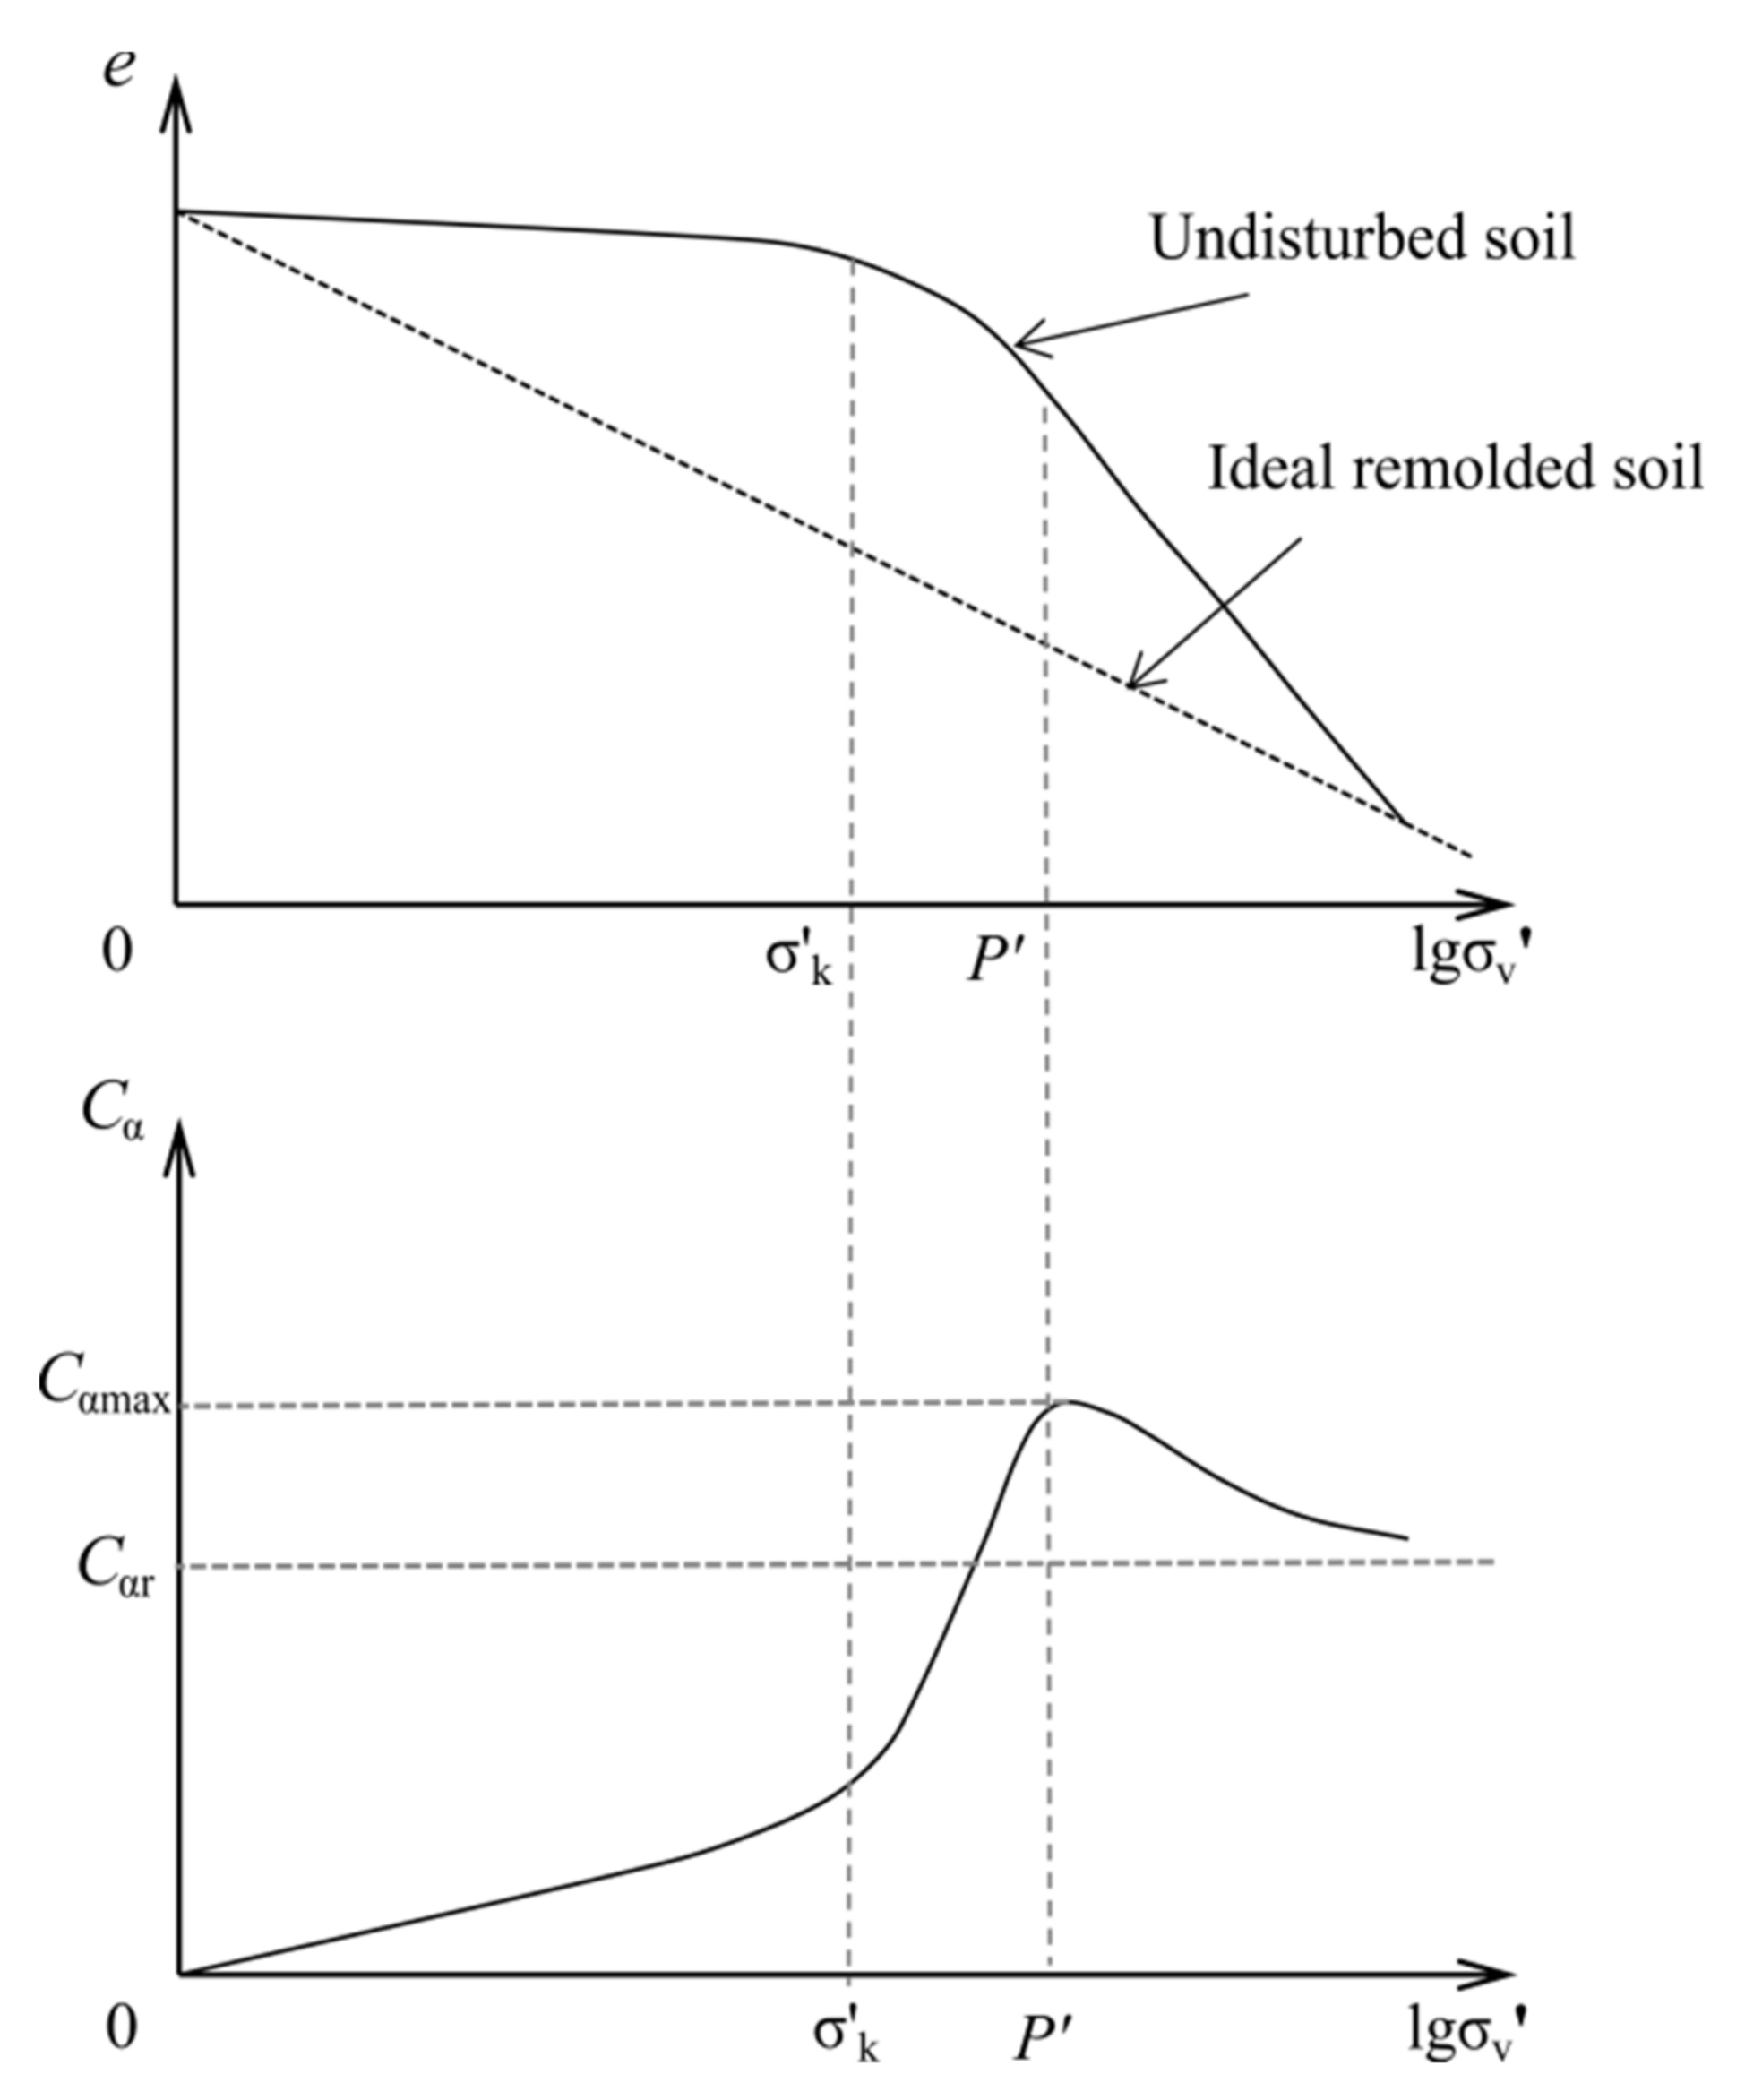
As shown in Figure 15, when the vertical effective stress is smaller than σ’k, it is called the pre-yield stage, and the Cα is small and slowly increases. When the vertical effective pressure exceeds σ’k, the soil structure is destroyed, and the Cα increases rapidly with the pressure, and reaches the peak Cαmax when the vertical effective pressure reaches P′, which is the yield stage, and P′ is approximately 1.6 to 3.0 times σ’k. When the vertical effective pressure exceeds P′ after severe structural damage, the Cα decreases and tends towards a stable value Cαr, at which point the Cα is considered to be independent of the load.

4.5. Relationship between Cαmax and Liquid Limit

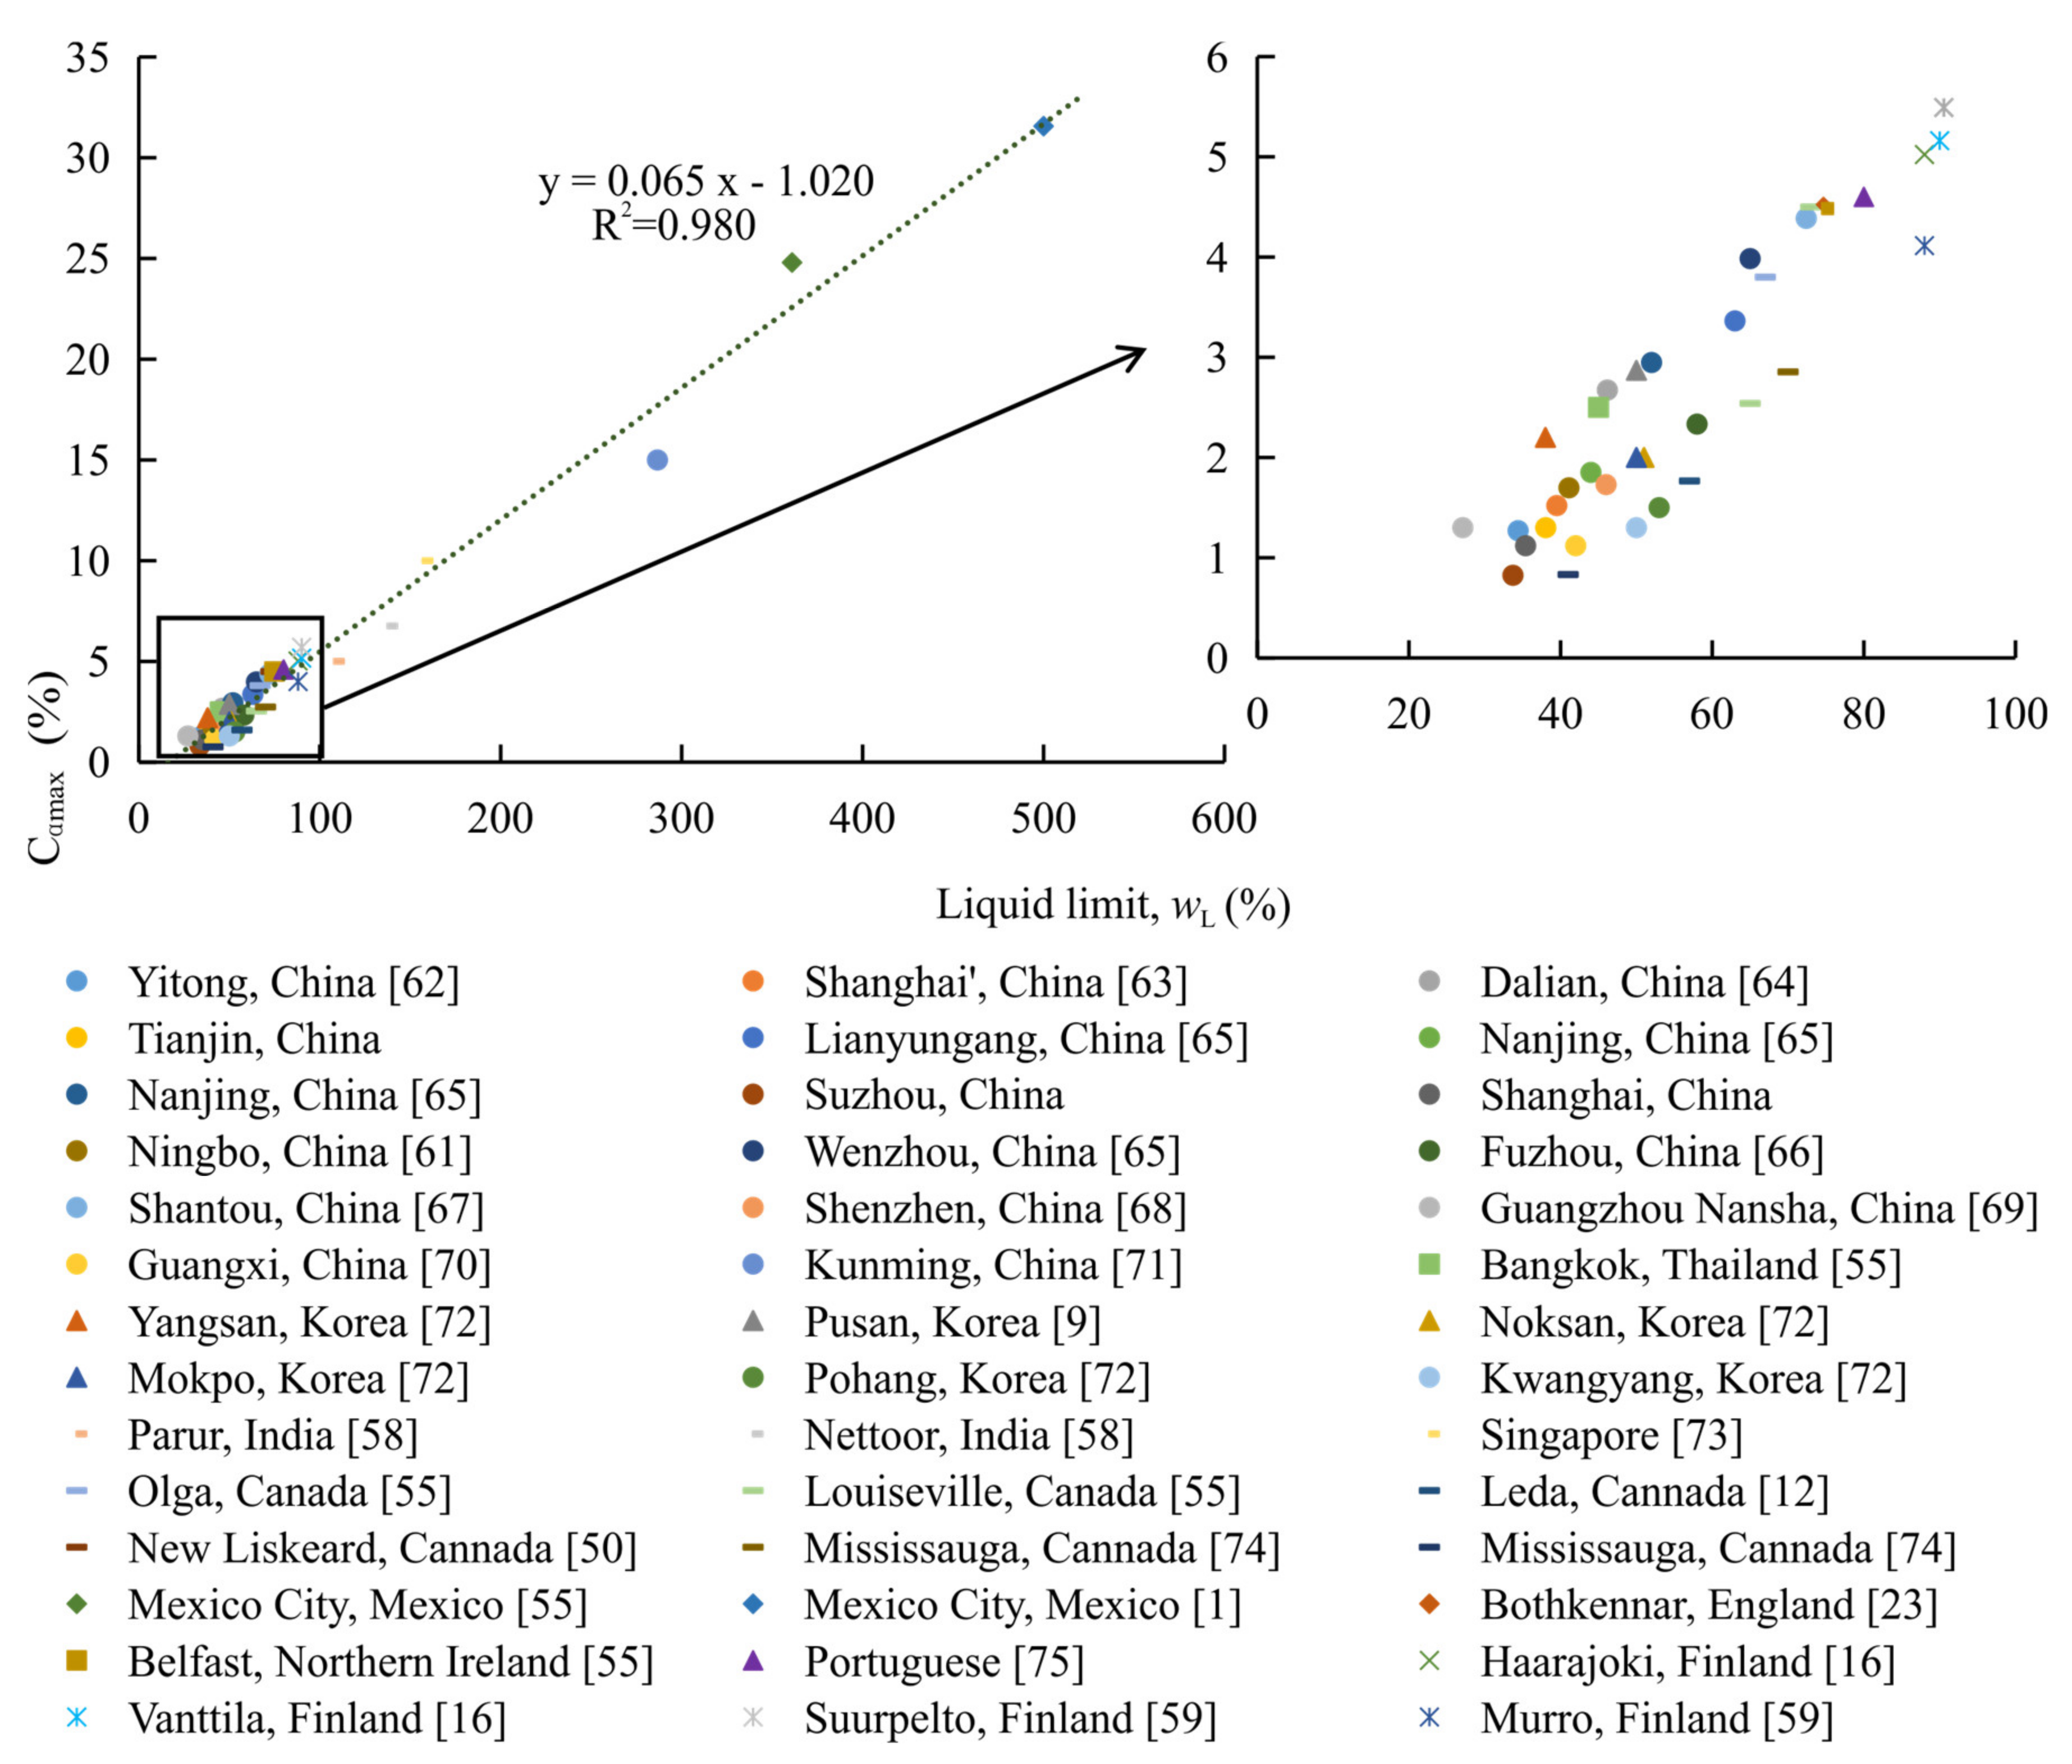
It is known from one-dimensional consolidation creep tests that the Cαmax for the soils in the four sites is in the vicinity of P′, but the value of Cα is not related to the value of σ’k. Cao found that the Cα of saturated clay changed linearly with increasing natural moisture content [6]. Although the natural moisture content of the SH was higher than that of TJ, the TJ had a higher Cα value than SH. According to the soil composition test of the five soft soils, the NB sample had higher clay and secondary mineral content, showing larger Cα. According to the test results, there is a good correspondence between Cαmax and wL. The wL can be determined by the fall cone method using parallel samples. On this basis, natural clay test data from around the world, especially those from the coastal areas of Southeast Asia, were collected, and it was found that Cαmax had a good linear relationship with the wL, as shown in Figure 16 [1,9,12,16,23,50,55,58,59,61,62,63,64,65,66,67,68,69,70,71,72,73,74,75].
The liquid limit wL is an important property of soil itself, indicating the maximum bound water content except free water that can be adsorbed by the clay. Xiao found that bound water is an important factor affecting the creep of soft soil [76]. Therefore, the bound water content adsorbed by soil has a significant influence on Cα. When the pressure is low, due to the large number of pores in the soil, the consolidation process of free water discharge with the least force of the grains is easy and fast, and the primary consolidation process is dominant. The creep degree is very low under this pressure state, and the Cα is small. In the primary consolidation process, free water and bound water are converted into free water, and the creep is mainly controlled by the bound water [77]. With increasing pressure and time, the primary consolidation effect becomes increasingly weak, the secondary compression increases and the value of Cα gradually increases. When the pressure reaches σ’k, the damage of the soil structure is serious, the number of large pores is reduced, the small pores increase, the bound water content in the pores increases relatively, the degree of creep increases and the Cα value increases rapidly. The cohesion of the bound water is stronger than that of the free water and it has definite viscosity. The combination of the bound water strengthens the connection of the grains. With the gradual increase in pressure, the lower the combined water content, the greater the viscosity between the grains, and so the Cα of the soft soil reaches a peak at the maximum bound water content. Therefore, the liquid limit wL can be used to predict the Cαmax of soft soil. The soil with definite grain and mineral composition has a definite liquid limit, which reflects the influence of the soil composition on the secondary compression characteristics of soft soil.

5. Conclusions

According to the study of five kinds of natural sedimentary structural soils, which are from the SH site, TJ site, SZ site and NB site, it was found that the soil composition and structural characteristics of soft soil are important factors affecting soil compressibility.
  • The Cα/Cc values are 0.031, 0.034, 0.030 and 0.036 for the Shanghai, Tianjin, Suzhou and Ningbo soft soils, respectively, within the range of inorganic clays and silts given by Mesri. The Cα/Cc value of the Ningbo soft soil is the highest, which corresponds to its maximum compression index Cc. According to the compression index Cc obtained by compression test, Cα/Cc can be used to estimate the Cα.
  • According to the discussion of Iv and ΔIv with pressure, the role of structure in the compression process is studied, when the pressure is greater than the structure yield stress σ’k, the soil structure begins to break, and the ability of the natural sedimentary soft soil to resist the pressure is gradually weakened.
  • In the secondary compression process, the Cα varies with time. When σv’ is less than σ’k, it is in the pre-yield stage, the Cα is small and does not change much over time. The value of Cα is significantly larger when σv’ is greater than σ’k. The Cα decreases noticeably with time, finally tending to be stable, which fully reflects the progressive destruction process of the soil structure.
  • For natural sedimentary structural soil, soil structure has a significant influence on the variation pattern of the Cα. The soil structure resists the external pressure and hinders secondary compression, and structural damage is gradual. When the load is less than σ’k, the structure is basically not destroyed, Cα is small; when the load exceeds σ’k, the structure is gradually broken, and it completely yields at 1.6 to 3.0 times σ’k, at this time the pressure is called the structure full yield stress P′. After the structure begins to break, the Cα gradually increases, and reaches the peak Cαmax near P′; and there is an excellent correlation between Cαmax and the liquid limit wL. The Cαmax is positively correlated with the bound water content of soft soil and reflects the influence of soil composition on the secondary compression characteristics of soft soil.

Author Contributions

N.J. contributed to the data analysis and manuscript writing. C.W. proposed the main structure of this study. Q.W. and S.L. provided useful advice and revised the manuscript. All authors have read and agreed to the published version of the manuscript.

Funding

This research was funded by the National Natural Science Foundation of China (No. 41572257) and (No. 41972267).

Acknowledgments

We are grateful to Jilin University for providing us with the experimental platform and anonymous reviewers for their valuable feedback on the manuscript.

Conflicts of Interest

The authors declare no conflict of interest.

References

  1. Mesri, G.; Roskhsar, A.; Bohor, B.F. Composition and Compressibity of Typical Samples Mexico City Clay. Geotechnique 1975, 25, 527–554. [Google Scholar] [CrossRef]
  2. Tanaka, H.; Locat, J.; Shibuya, S.; Soon, T.T.; Shiwakoti, D.R. Characterization of Singapore, Bangkok, and Ariake clays. Can. Geotech. J. 2001, 38, 378–400. [Google Scholar] [CrossRef]
  3. CABR. Specification for Geotechnical Investigation in Soft Clay Area; China Building Industry Press: Beijing, China, 1992. [Google Scholar]
  4. Zhao, C.G.; Bai, B.; Wang, Y.X. Foundamentals of Soil Mechanics; Tsinghua University Press: Beijing, China; Beijing Jiaotong University Press: Beijing, China, 2004. [Google Scholar]
  5. Miao, L.C.; Kavazanjian, E. Secondary Compression Features of Jiangsu Soft Marine Clay. Mar. Georesour. Geotechnol. 2007, 25, 129–144. [Google Scholar] [CrossRef]
  6. Cao, Y.P. Relationship of Coefficients of Secondary Consolidation with Moisture Content of Saturated Cohesive Soil. China Harb. Eng. 2007, 149, 21–23. [Google Scholar]
  7. Xu, G.Z.; Yin, J. Compression Behavior of Secondary Clay Minerals at High Initial Water Contents. Mar. Georesour. Geotechnol. 2015, 34, 721–728. [Google Scholar] [CrossRef]
  8. Park, J.H.; Koumoto, T. New Compression Index Equation. J. Geotech. Geoenviron. Eng. 2004, 130, 223–226. [Google Scholar] [CrossRef]
  9. Suneel, M.; Park, L.K.; Im, J.C. Compressibility Characteristics of Korean Marine Clay. Mar. Georesour. Geotechnol. 2008, 26, 111–127. [Google Scholar] [CrossRef]
  10. Alonso, E.E.; Navarro, V. Microstructural model for delayed deformation of clay: Loading history effects. Can. Geotech. J. 2005, 42, 381–392. [Google Scholar] [CrossRef] [Green Version]
  11. Mesri, G.; Stark, T.D.; Ajlouni, M.A.; Chen, C.S. Secondary compression of peat with or without surcharging. J. Geotech. Eng. Div. ASCE 1997, 123, 411–421. [Google Scholar] [CrossRef]
  12. Mesri, G.; Godlewski, P.M. Time and stress compressibility interrelationship. J. Geotech. Eng. Div. ASCE 1977, 103, 417–430. [Google Scholar]
  13. Mesri, G. Primary Compression and Secondary Compression. In Proceedings of the Symposium on Soil Behavior and Soft Ground Construction Honoring Charles C. “Chuck” Ladd, Cambridge, MA, USA, 5–6 October 2001; Volume 119, pp. 122–166. [Google Scholar]
  14. Yin, Z.Y.; Chang, C.S. Non-uniqueness of critical state line in compression and extension conditions. Int. J. Numer. Anal. Methods Geomech. 2009, 33, 1315–1338. [Google Scholar] [CrossRef]
  15. Karstunen, M.; Yin, Z.Y. Modelling time-dependent behaviour of Murro test embankment. Géotechnique 2010, 60, 735–749. [Google Scholar] [CrossRef]
  16. Yin, Z.Y.; Karstunen, M.; Chang, C.S.; Koskinen, M.; Lojander, M. Modeling Time-Dependent Behavior of Soft Sensitive Clay. J. Geotech. Geoenviron. Eng. 2011, 137, 1103–1113. [Google Scholar] [CrossRef]
  17. Di Maio, C.; Santoli, L.; Schiavone, P. Volume change behaviour of clays: The influence of mineral composition, pore fluid composition and stress state. Mech. Mater. 2004, 36, 435–451. [Google Scholar] [CrossRef]
  18. Voltolini, M.; Wenk, H.R.; Mondol, N.H.; Bjørlykke, K.; Jahren, J. Anisotropy of experimentally compressed kaolinite-illite-quartz mixtures. Geophysics 2009, 74, D13–D23. [Google Scholar] [CrossRef] [Green Version]
  19. Horpibulsuk, S.; Yangsukkaseam, N.; Chinkulkijniwat, A.; Du, Y.J. Compressibility and permeability of Bangkok clay compared with kaolinite and bentonite. Appl. Clay Sci. 2011, 52, 150–159. [Google Scholar] [CrossRef]
  20. Bjerrum, L. Engineering geology of Norwegian normally consolidated marine clays as related to the settlements of buildings. Géotechnique 1967, 17, 83–118. [Google Scholar] [CrossRef] [Green Version]
  21. Newland, P.L.; Allely, B.H. A study of the consolidation characteristics of a clay. Géotechnique 1960, 10, 62–74. [Google Scholar] [CrossRef]
  22. Horn, H.M.; Lambe, I.W. Settlement of buildings on the MIT campus. J. Soil Mech. Found. Div. 1964, 90, 181–196. [Google Scholar]
  23. Nash, D.F.T.; Davison, L.R.; Sills, G.C. One-dimensional consolidation testing for soft clay from Bothkennar. Géotechnique 1992, 42, 241–256. [Google Scholar] [CrossRef]
  24. Liu, S.M.; Zeng, G.X. Secondary Consolidation Deformation Characteristics of Soft Clay. J. Zhejiang Univ. (Nat. Sci.) 1990, 24, 840–848. [Google Scholar]
  25. Lei, H.Y. Study on secondary consolidation deformation characteristics of soft soil in Tianjin. J. Eng. Geol. 2002, 10, 385–390. [Google Scholar]
  26. Yin, Z.Z.; Zhang, H.B.; Zhu, J.G. Secondary consolidation of soft soils. Chin. J. Geotech. Eng. 2003, 25, 521–526. [Google Scholar]
  27. Mitchell, J.K. Practical problems from surprising soil Behavior. J. Geotech. Eng. 1986, 112, 255–289. [Google Scholar] [CrossRef]
  28. Chandler, R.J. Clay sediments in depositional basin: The geotechnical cycle. Q. J. Eng. Geol. Hydrol. 2000, 33, 7–39. [Google Scholar] [CrossRef]
  29. Hong, Z.; Liu, H.; Chang, N. Critical state sedimentation line of soft marine clays. China Ocean Eng. 2003, 17, 631–640. [Google Scholar]
  30. Schmertmann, J.H. The mechanical aging of soils. J. Geotech. Eng. 1991, 117, 1288–1330. [Google Scholar] [CrossRef]
  31. Leroueil, S.; Vaughan, P.R. The general and congruent effects of structure in natural soils and weak rocks. Géotechnique 1990, 40, 281–284. [Google Scholar] [CrossRef]
  32. Leroueil, S.; Roy, M.; La Rochelle, P.; Brucy, F.; Tavenas, F. Behavior of Destructured Natural Clays. J. Geotech. Eng. Div. ASCE 1979, 105, 759–778. [Google Scholar]
  33. Hattab, M.; Hammad, T.; Fleureau, J.M.; Hicher, P.Y. Behaviour of a sensitive marine sediment: Microstructural investigation. Geotechnique 2013, 63, 71–84. [Google Scholar] [CrossRef] [Green Version]
  34. Shen, Z.J. The Mathematical Model of Soil Structure-The Core Problem of Soil Mechanics in the 21st Century. Chin. J. Geotech. Eng. 1996, 18, 95–97. [Google Scholar]
  35. Perisic, G.A.; Ovalle, C.; Barrios, A. Compressibility and creep of a diatomaceous soil. Eng. Geol. 2019, 258, 105145. [Google Scholar] [CrossRef]
  36. Hong, Z.S.; Tateishi, Y.; Jie, H. Experimental Study of Macro and Micro behavior of Natural Diatomite. J. Geotech. Geoenviron. 2006, 132, 603–610. [Google Scholar] [CrossRef]
  37. Shen, Z.J. Engineering properties of soft soils and design of soft ground. Chin. J. Geotech. Eng. 1998, 20, 100–111. [Google Scholar]
  38. Yang, C.; John, P.C.; Sheng, D.C. Description of compression behaviour of structured soils and its application. Can. Geotech. J. 2014, 51, 921–933. [Google Scholar] [CrossRef]
  39. Burland, J.B. On the compressibility and shear strength of natural clays. Géotechnique 1990, 40, 329–378. [Google Scholar] [CrossRef]
  40. Hong, Z.S.; Onitsuka, K. A method of correcting yield stress and compression index of Ariake clays for sample disturbance. Soils Found. 1998, 38, 211–222. [Google Scholar] [CrossRef] [Green Version]
  41. Mesri, G.; Choi, Y.K. Discussion of “Time effects on the stress-strain behaviours of natural soft clays”. Géotechnique 1984, 34, 439–442. [Google Scholar]
  42. Shao, G.H.; Liu, S.Y. Research on secondary consolidation of structural marine clays. Rock Soil Mech. 2008, 29, 2057–2062. [Google Scholar]
  43. Zhang, X.W.; Wang, C.M. Effect of soft clay structure on secondary consolidation coefficient. Rock Soil Mech. 2012, 33, 476–483. [Google Scholar]
  44. Li, Q.; Ng, C.W.W.; Liu, G.B. Low secondary compressibility and shear strength of Shanghai Clay. J. Cent. South Univ. 2012, 19, 2323–2332. [Google Scholar] [CrossRef]
  45. Zeng, L.L.; Hong, Z.S.; Liu, S.Y. A method for predicting deformation caused by secondary consolidation for naturally sedimentary structural clays. Rock Soil Mech. 2011, 32, 3136–3142. [Google Scholar]
  46. Ministry of Construction. Code for Investigation of Geotechnical Engineering; GB 50021-2001; China Building Industry Press: Beijing, China, 2002.
  47. British Standard Institution. The Code of Practice for Site Investigations; BS 5930; British Standard Institution: London, UK, 1999. [Google Scholar]
  48. Sun, J. Rheology and Engineering Application of Geomaterials; Beijing Building Industry Press: Beijing, China, 1999. [Google Scholar]
  49. Deng, Z.B. Research and Application of Soft Clay Creep Test and Constitutive Model Identification Method. Ph.D. Thesis, Central South University, Hunan, China, 2007. [Google Scholar]
  50. Quigley, R.M.; Ogunbadejo, T.A. Clay Layer Fabric and oedometer consolidation of a soft varved Clay. Can. Geotech. J. 1972, 9, 165–175. [Google Scholar] [CrossRef]
  51. Schmertmann, J.M. The undisturbed consolidation behavior of clay. Trans. ASCE 1955, 120, 1201–1211. [Google Scholar]
  52. Li, T.; Qian, Y.S. Evaluation of soil sample disturbance and determination of pre-consolidation pressure. J. Geotech. Eng. 1987, 5, 21–30. [Google Scholar]
  53. Zou, Y.Q.; Wang, Y.B.; Shao, M.X. A stepwise approximation of the preconsolidation pressure. J. Geotech. Eng. 1994, 160, 54–61. [Google Scholar]
  54. Crawford, C.B. Interpretation of the consolidation test. J. Soil Mech. Found. Div. 1964, 90, 87–102. [Google Scholar]
  55. Bell, A.L.; Graham, J.; Crooks, J.H.A. Time effects on the stress–strain behaviour of natural soft clays. Géotechnique 1983, 33, 327–340. [Google Scholar]
  56. Berre, T.; Iversen, K. Oedometer tests with different specimen heights on a clay exhibiting large secondary compression. Géotechnique 1972, 22, 53–70. [Google Scholar] [CrossRef]
  57. Leroueil, S.; Kabbaj, M.; Tavenas, F.; Bouchard, R. Stress–strain–strain rate relation for the compressibility of sensitive natural clays. Géotechnique 1985, 35, 159–180. [Google Scholar]
  58. Jose, B.T.; Sridharan, A.; Abraham, B.M. A study of geotechnical properties of Cochin Marine Clays. Mar. Geotech. 1988, 7, 189–209. [Google Scholar] [CrossRef]
  59. Stapelfeldt, T.; Lojander, M.; Vepaslainen, P. Determination of horizontal permeability of soft clay. In Proceedings of the 17th International Conference on Soil Mechanics and Foundation Engineering, Madrid, Spain, 3 January 2007; pp. 1385–1389. [Google Scholar]
  60. Al-Shamrani, M.A. Application of the Cα/Cc concept to secondary compression of sabkha soils. Can. Geotech. J. 1998, 35, 15–26. [Google Scholar] [CrossRef]
  61. Feng, Z.G.; Zhu, J.G. Experimental study on secondary consolidation behavior of soft soils. J. Hydraul. Eng. 2009, 40, 583–588. [Google Scholar]
  62. Wang, C.M.; Zhang, S.Y.; Li, S. Characteristics of Secondary Consolidation of Yitong Soft Soil. J. Jilin Univ. (Earth Sci.) 2018, 48, 799–804. [Google Scholar]
  63. Xu, S.; Chen, Y.L.; Zhao, C.X. One-dimensional consolidation tests of creep deformation and secondary consolidation characteristics of soft soils in shanghai area. J. Eng. Geol. 2008, 16, 495–501. [Google Scholar]
  64. Jiang, M.J.; Liu, J.D.; Yin, Z.Y. Consolidation and creep behaviors of two typical marine clays in China. China Ocean Eng. 2014, 28, 629–644. [Google Scholar] [CrossRef]
  65. Zeng, L.L. Deformation Mechanism and Structural Compression Model of Natural Sedimentary Soft Clay. Ph.D. Thesis, Southeast University, Jiangsu, China, 2010. [Google Scholar]
  66. Chen, Z.; Kong, Q. Experimental study on secondary consolidation properties of Fuzhou soft soils. J. Cent. South Univ. 2014, 45, 3602–3607. [Google Scholar]
  67. Yu, X.J.; Yin, Z.Z.; Dong, W.J. Influence of load on secondary consolidation deformation of soft soils. Chin. J. Geotech. Eng. 2007, 29, 913–916. [Google Scholar]
  68. Zhang, H.M.; Zhang, D.K. Secondary Consolidation Deformation Characteristics of Soft Soil in Shenzhen. In Proceedings of the 7th Conference of Soil Mechanics and Basic Engineering of China Civil Engineering Society, Xi’an, China, 25–29 October 1994; pp. 97–100. [Google Scholar]
  69. Zhou, Q.J.; Chen, X.P. Experimental study on creep characteristics of soft soils. Chin. J. Geotech. Eng. 2006, 28, 626–630. [Google Scholar]
  70. Shi, X.C.; Wang, R.; Hu, Y.Y. Research on deformation characteristics of marine silt. J. Yangtz River Sci. Res. I. 2003, 20, 17–18. [Google Scholar]
  71. Gui, Y.; Yu, Z.H.; Liu, H.M.; Cao, J. Secondary consolidation properties and mechanism of plateau lacustrine peaty soil. Chin. J. Geotech. Eng. 2015, 37, 1390–1398. [Google Scholar]
  72. Suneel, M.; Konni, G.R.; Chul, I.J. Secondary Compression Index Equation for Soft Clays. Geotech. Geol. Eng. 2017, 17, 358. [Google Scholar] [CrossRef]
  73. Tan, J.L.; Leong, E.C.; Rahardjo, H. Compressibility characteristics of peaty soils. In Proceedings of the Third International Conference on Soft Soil Engineering, Hong Kong, China, 6–8 December 2001; pp. 689–694. [Google Scholar]
  74. Iyer, B. Discussion of “Cα/Cc Concept and K0 during Secondary Compression” by G. Mesri and A. Castro. J. Geotech. Eng. 1989, 115, 263–264. [Google Scholar] [CrossRef]
  75. Coelho, P.A.L.F.; Lemos, L.J.L. Compressibility characteristics of a Portuguese soft deposit. In Proceedings of the Third International Conference on Soft Soil Engineering, Hong Kong, China, 6–8 December 2001; pp. 663–668. [Google Scholar]
  76. Xiao, S.F.; Fang, H.G.; Wang, Q. Creep behavior of combined water and consolidation in soft soils. J. Eng. Geol. 2014, 4, 1464–1469. [Google Scholar]
  77. Zhang, X.W.; Wang, C.M.; Li, J.X. Experimental study of coupling behaviors of consolidation-creep of soft clay and its mechanism. Rock Soil Mech. 2011, 32, 3584–3590. [Google Scholar]
Figure 1. Sampling location of the soft soils.
Jmse 08 00627 g001
Figure 2. Grain composition of soft soils: (a) grain size distribution curves; (b) percentage of mineral fractions.
Jmse 08 00627 g002
Figure 3. Mineral content of soft soils.
Jmse 08 00627 g003
Figure 4. Plasticity chart.
Jmse 08 00627 g004
Figure 5. Compression curves for undisturbed and remolded samples.
Jmse 08 00627 g005
Figure 6. The reduced compression curve after [51].
Jmse 08 00627 g006
Figure 7. e-lgt curves of the one-dimensional consolidation creep test.
Jmse 08 00627 g007
Figure 8. The e-lgt curves of five samples.
Jmse 08 00627 g008
Figure 9. Void index Iv versus varied vertical effective stress σv’. ICL: intrinsic compression line; SCL: sedimentation compression line.
Jmse 08 00627 g009
Figure 10. Void ratio difference ΔIv versus varied vertical effective stress σv’.
Jmse 08 00627 g010
Figure 11. Comparison of Cα/Cc with other typical natural soils.
Jmse 08 00627 g011
Figure 12. Variations of secondary compression coefficient Cα with time.
Jmse 08 00627 g012
Figure 13. Secondary compression coefficient Cα at varied vertical effective stress σv’.
Jmse 08 00627 g013
Figure 14. Cα at varied vertical effective stress σv’ of Shanghai soft soil after [44].
Jmse 08 00627 g014
Figure 15. Variation of secondary compression coefficients with vertical effective stress.
Jmse 08 00627 g015
Figure 16. Relationship between Cαmax and wL.
Jmse 08 00627 g016
Table 1. Geological conditions for Shanghai.
ChronologyLithologic CharacteristicsCore Depth (m)Sedimentary Environment
HoloceneBrown yellow silty clay0–3Marine–estuarine facies
Gray muddy clay3–5
1 Gray muddy silty clay5–25Marine–neritic facies
Clay and sand interlayer
Late PleistoceneDark green clay25–35Fluvial facies
Yellow silty clay35–40Marine facies
1 Sampling layers of the Shanghai soft soils. Coordinates are 31°8′5″ N, 121°36′26″ E.
Table 2. Geological conditions for Tianjin.
ChronologyLithologic CharacteristicsCore Depth (m)Sedimentary Environment
HoloceneBrown yellow silty clay0–3Fluvial facies
Gray muddy silty clay3–5Sea shore facies
2 Gray silty clay5–15
Gray yellow silty clay15–17Terrestrial facies
Brown yellow clay17–20Fluvial facies
Brown yellow silty clay20–25
Late PleistoceneBrown yellow silty clay25–30Fluvial facies
2 Sampling layers of the Tianjin soft soils. Coordinates are 39°1′11″ N, 117°11′42″ E.
Table 3. Geological conditions for Suzhou.
ChronologyLithologic CharacteristicsCore Depth (m)Sedimentary Environment
HoloceneBrown yellow silty clay0–5Limnetic facies
3 Gray yellow silty clay5–12
Gray yellow silt12–16Fluvial facies
Gray silty clay16–20
Late PleistoceneBrown yellow clay20–27Marine–neritic facies
Green gray silty clay27–42Fluvial facies
3 Sampling layers of the Suzhou soft soils. Coordinates are 31°6′21″ N, 120°35′43″ E.
Table 4. Geological conditions for Ningbo.
ChronologyLithologic CharacteristicsCore Depth (m)Sedimentary Environment
HoloceneGray yellow clay0–3Limnetic facies
4 Gray yellow muddy silty clay3–12Marine facies
Gray yellow silt12–14Marine–neritic facies
Gray silty clay14–22
Late PleistoceneGreen gray clay22–28Marine facies
Gray silty clay28–43
4 Sampling layers of the Ningbo soft soils. Coordinates are 29°40′24″ N, 121°25′40″ E.
Table 5. Physical properties of soft soils.
Location SiteDepth (m)Specific Gravity, Gse0w0 (%)wL (%)PI (%)Classification (BS 5930) [47]
SH5.0–5.52.651.2547.035.414.0CI
TJ7.5–8.02.661.1543.138.016.5CI
SZ10.5–11.02.660.7628.530.812.8CL
NB4.0–4.52.701.3349.342.721.1CI
9.5–10.02.671.0740.139.218.3CI
e0: Initial void ratio. w0: Initial moisture content.
Table 6. Test program.
Test ProcedureTest No.Core Depth (m)σv’ (kPa)Vertical Loading Procedure (kPa)Time of Duration (Day)
1. One-dimensional compression testSH-15.25512.5–25–50–100–200–400–800–16001
TJ-17.685
SZ-110.6109
NBI-14.248
NBII-19.694
SH*-15.25512.5–25–50–100–200–400–200–100–50–25–12.5–0–12.5–25–50–100–200–400–800–16001
TJ*-17.685
SZ*-110.6109
NBI*-14.248
NBII*-19.694
2. One-dimensional consolidation-creep testSH-25.35612.5–25–50–100–200–400–800–16003
TJ-27.785
SZ-210.7110
NBI-24.349
NBII-29.795
Table 7. Parameters of one-dimensional compression tests.
Test SampleStructure Yield Stress, σ’k (kPa)CcCsCrPL (kPa)Pre-Consolidation Pressure, Pc (kPa)Structural Strength, q (kPa)
SH660.3060.030.1741005511
TJ950.3260.020.123350869
SZ1200.240 0.030.1833001137
NBI590.3750.040.2231004910
NBII1150.3450.030.1730009520
Table 8. Values of Cα/Cc for different soils.
MaterialCα/Cc
Granular soils including rockfill0.02 ± 0.01
Shale and mudstone0.03 ± 0.01
Inorganic clays and silts0.04 ± 0.01
Organic clays and silts0.05 ± 0.01
Fibrous and amorphous peats0.06 ± 0.01
Table 9. A summary of Cαmax and Cαr.
Test SampleCαmax (%)Cαr (%)Cαr/Cαmax (%)
SH-21.120.8979
TJ-21.301.0883
SZ-20.8250.7389
NBI-21.631.3985
NBII-21.381.2389
Table 10. A summary of σ’k and P′ from different sites.
SiteDepth (m)σ’k (kPa)P′ (kPa)P′/σ’k
Nettoor, India [58]1.5351002.9
2.0501002.0
New Liskeard, Canada [50]14.52504001.6
30.04108002.0
Bothkennar, England [23]5.2431002.3
Mexico City, Mexico [1]15.01804002.2
Murro, Finland [59]7.044801.8
Saudi Arabia [60]4.51002002.0
Ningbo, China [61]8.5802002.5
10.51102001.8
Shanghai, China [44]8.5852002.4
15.51604002.5
Tianjin, China [25]6.0601001.7