Article

Evaluation of the Lifecycle Environmental Benefits of Full Battery Powered Ships: Comparative Analysis of Marine Diesel and Electricity

1
Department of Naval Architecture, Ocean and Marine Engineering, University of Strathclyde, 100 Montrose Street, Glasgow G4 0LZ, UK
2
Korea Institute of Maritime and Fisheries Technology, Korea Maritime and Ocean University, 727 Taejong -ro, Busan 49112, Korea
3
Faculty of Marine Science and Technology, Harbin Institute of Technology, Weihai 264209, China
*
Author to whom correspondence should be addressed.
J. Mar. Sci. Eng. 2020, 8(8), 580; https://doi.org/10.3390/jmse8080580
Submission received: 22 June 2020 / Revised: 28 July 2020 / Accepted: 29 July 2020 / Published: 2 August 2020
(This article belongs to the Special Issue Marine Alternative Fuels and Environmental Protection)

Abstract

:
The paper aims to investigate the holistic environmental benefits of using a battery system on a roll on/roll off (ro-ro) passenger ship which was originally fitted with a diesel engine engaged in Korean coastal service. The process of this research has multiple layers. First, the operating profiles of the case ship were collected, such as speed, output, operation time and the configuration of the diesel propulsion system. Second, the full battery propulsion system, in place of the diesel system, was modelled and simulated on a power simulation software (PSIM) platform to verify the adequacy of the proposed battery propulsion system. Then, the life cycle assessment method was applied to comprehensively compare the environmental footprint of the diesel-mechanical and fully battery-powered vessels. A focus was placed on the life cycle of the energy sources consumed by the case ship in consideration of the South Korea’s current energy importation and production status. Three life cycle stages were considered in the analysis: ‘production’, ‘transport’ and ‘use’. With the aid of Sphera GaBi Software Version 2019 and its extensive data library, the environmental impacts at the energy production and transport stages were evaluated, while the same impacts at the use stage were determined based on actual laboratory measurements. The environmental performance of the two scenarios in four impact categories was discussed: global warming potential (GWP), acidification potential (AP), eutrophication potential (EP) and photochemical ozone creation potential (POCP). Results of the comparative analysis are presented based on estimates of the overall reduction in the environmental impact potential, thereby demonstrating the overall benefits of using a battery driven propulsion, with a decrease of the GWP by 35.7%, the AP by 77.6%, the EP by 87.8% and the POCP by 77.2%. A series of sensitivity analyses, however, has delivered the important message that the integration of batteries with marine transportation means may not always be the best solution. The types of energy sources used for electricity generation will be a key factor in determining whether the battery technology can ultimately contribute to cleaner shipping or not. By casting doubts on the benefits of battery propulsion, this paper is believed to offer a meaningful insight into developing a proper road map for electrifying ship propulsion toward zero emission of shipping.

1. Introduction

In the marine industry, switching from conventional oil products to alternative fuels is more important than ever, since environmental concerns are growing larger and the International Maritime Organization as well as local governments are enforcing stricter regulations. Electrical propulsion with battery systems have been recognized as one of the most credible options to address this issue and achieve decarbonization in the marine industry. Charging the battery from the coastal power grid may achieve zero emissions during sailing [1,2,3,4].
Thanks to the remarkable technological advances in battery systems, the number of battery-powered ships is rapidly increasing worldwide. As of March 2019, more than 150 hybrid ships (including full battery ships) are using battery systems as their primary and/or secondary power sources [3].
Voluminous research has proven the excellence of battery application across different industries. Skjong et al. [5] conducted an investigation on diesel-electric ships by proposing and comparing different configurations. Although an optimal setup for the selected case study was successfully proposed, there was a lack of discussion on the environmental benefits. Similar research can be found in Mo and Guidi [6] who introduced an analytical method for estimating the fuel saving potential of hybrid ships, but still the environmental impact was not estimated in details.
In terms of environmental benefits arising from marine battery applications, most research and publications have emphasized zero emissions at the vessel operation stage. Meanwhile, several attempts have been made to extend the scope of environmental assessments to the life cycle of hybrid ships. Jeong et al. [7,8] have contributed to methodologically improving the lifecycle assessment (LCA) process to promote the use of LCA in the marine industry. As a demonstration work, a comparative analysis between hybrid systems and conventional diesel-mechanical and diesel-electrical propulsion systems was conducted. Ling-Chin and Roskilly [9] investigated the impact of a newly built hybrid power system on a roll-on/roll-off (ro-ro) cargo ship from a sustainability perspective. These studies were focused on comparing the life cycle performance of battery systems and diesel engines, taking into account system manufacturing, operation and maintenance onboard and disposal. The excellence of hybrid ships has been demonstrated through these studies, and the results are the very same as those of LCA studies for battery applications in the automotive sector [10,11,12,13,14,15].
On the other hand, those past LCA studies reveal that if the electricity power is supplied from the shore to onboard via a plug-in connection, the use of batteries requires additional activity to generate the electricity from shore power plants, which can potentially increase emissions during the power generation phase. This aspect has led to this research being born; it is necessary to investigate the sensitivity of different electricity production methods on the holistic environmental impact pertinent to battery ships.
Recently, the Korea Ministry of Maritime Affairs and Fisheries announced that it would establish the 2030 Eco-Friendly Vessel Conversion Plan to replace 140 government-owned vessels with eco-friendly ones. Current investigations have shown that battery powered ships are highly likely to be adopted for the plan. In order to preemptively respond to strengthening domestic and international environmental regulations and to reduce fine particulate mattter in ships and ports, this research was motivated to evaluate the environmental benefits of using batteries as ship power over diesel ships, taking into account the electricity grid and supply in the South Korea [16].
Finally, this study was performed in a way to explain whether battery ships are ultimately better in marine environmental protection at all or there are some factors we should consider before applying this technology without a doubt.

2. Approach

To respond to the question risen in the previous section, a case study based on integration of a LCA process with laboratory experiments was proposed. The study approach, outlined in Figure 1, largely consists of two parts: scenario analysis and LCA. Details will be discussed in the sub-sections to follow.

2.1. Scenario Analysis

The scenario analysis was proposed to establish the scope and boundary of the comparative analysis between the battery and diesel systems, while understanding the specifications of the case ship as well as its operating practices.
A four-stroke diesel engine (STX engine 5L23/30H) identical to the engine fitted on the case ship was set up at laboratory so that the engine emissions could be measured during test runs in accordance with the actual ship’s operating profile. In addition, the battery system was modelled virtually, and its validity was demonstrated through PSIM simulation. It needs to be mentioned that the intent of the simulation was to present an insight into proper guidelines for modelling battery systems for the 140 Korean vessels rather than for use as input for the LCA; since the battery produces no emissions, the simulation was not directly used in the LCA.

2.1.1. Selection of Case Ship

One of the most common vessel types serving in Korea was selected as the case ship. Roll on/roll off and passenger (RoPax) ships account for 61% of Korean domestic ships. They represent 102 out of 167 ships according to 2017 coastal shipping statistics [17]. Table 1 shows the case ship and its specifications.
Figure 2 shows the ship’s regular service route voyage profile. It departs from Incheon Hari Port and enters Seogum Port via Mibeop port. Each voyage takes 72 min. on average, and it does four voyages each day. The ship is assumed to be engaged in service for over 30 years. The engine power and operating time determined by actual on-board measurement are presented in Figure 3.

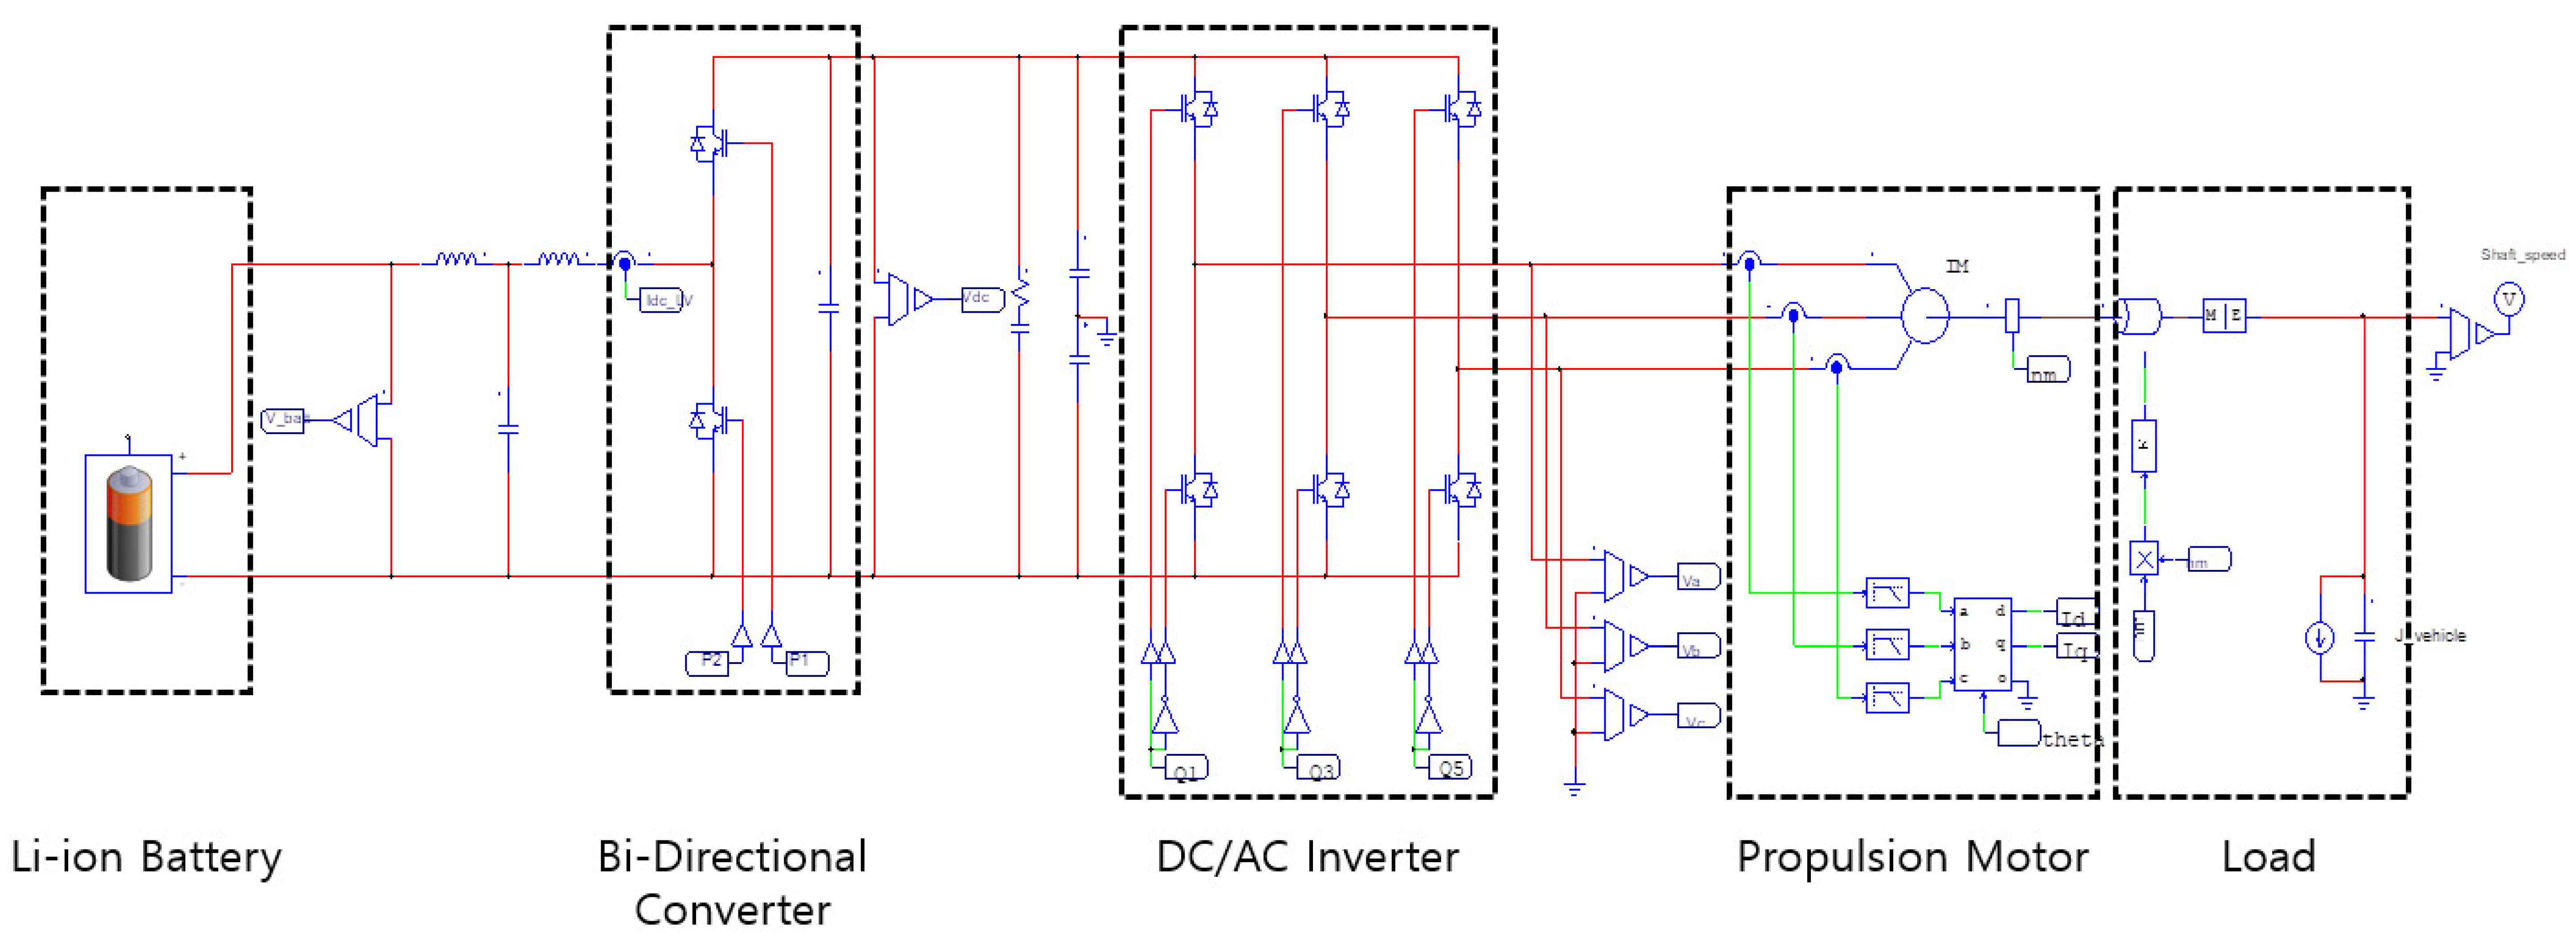
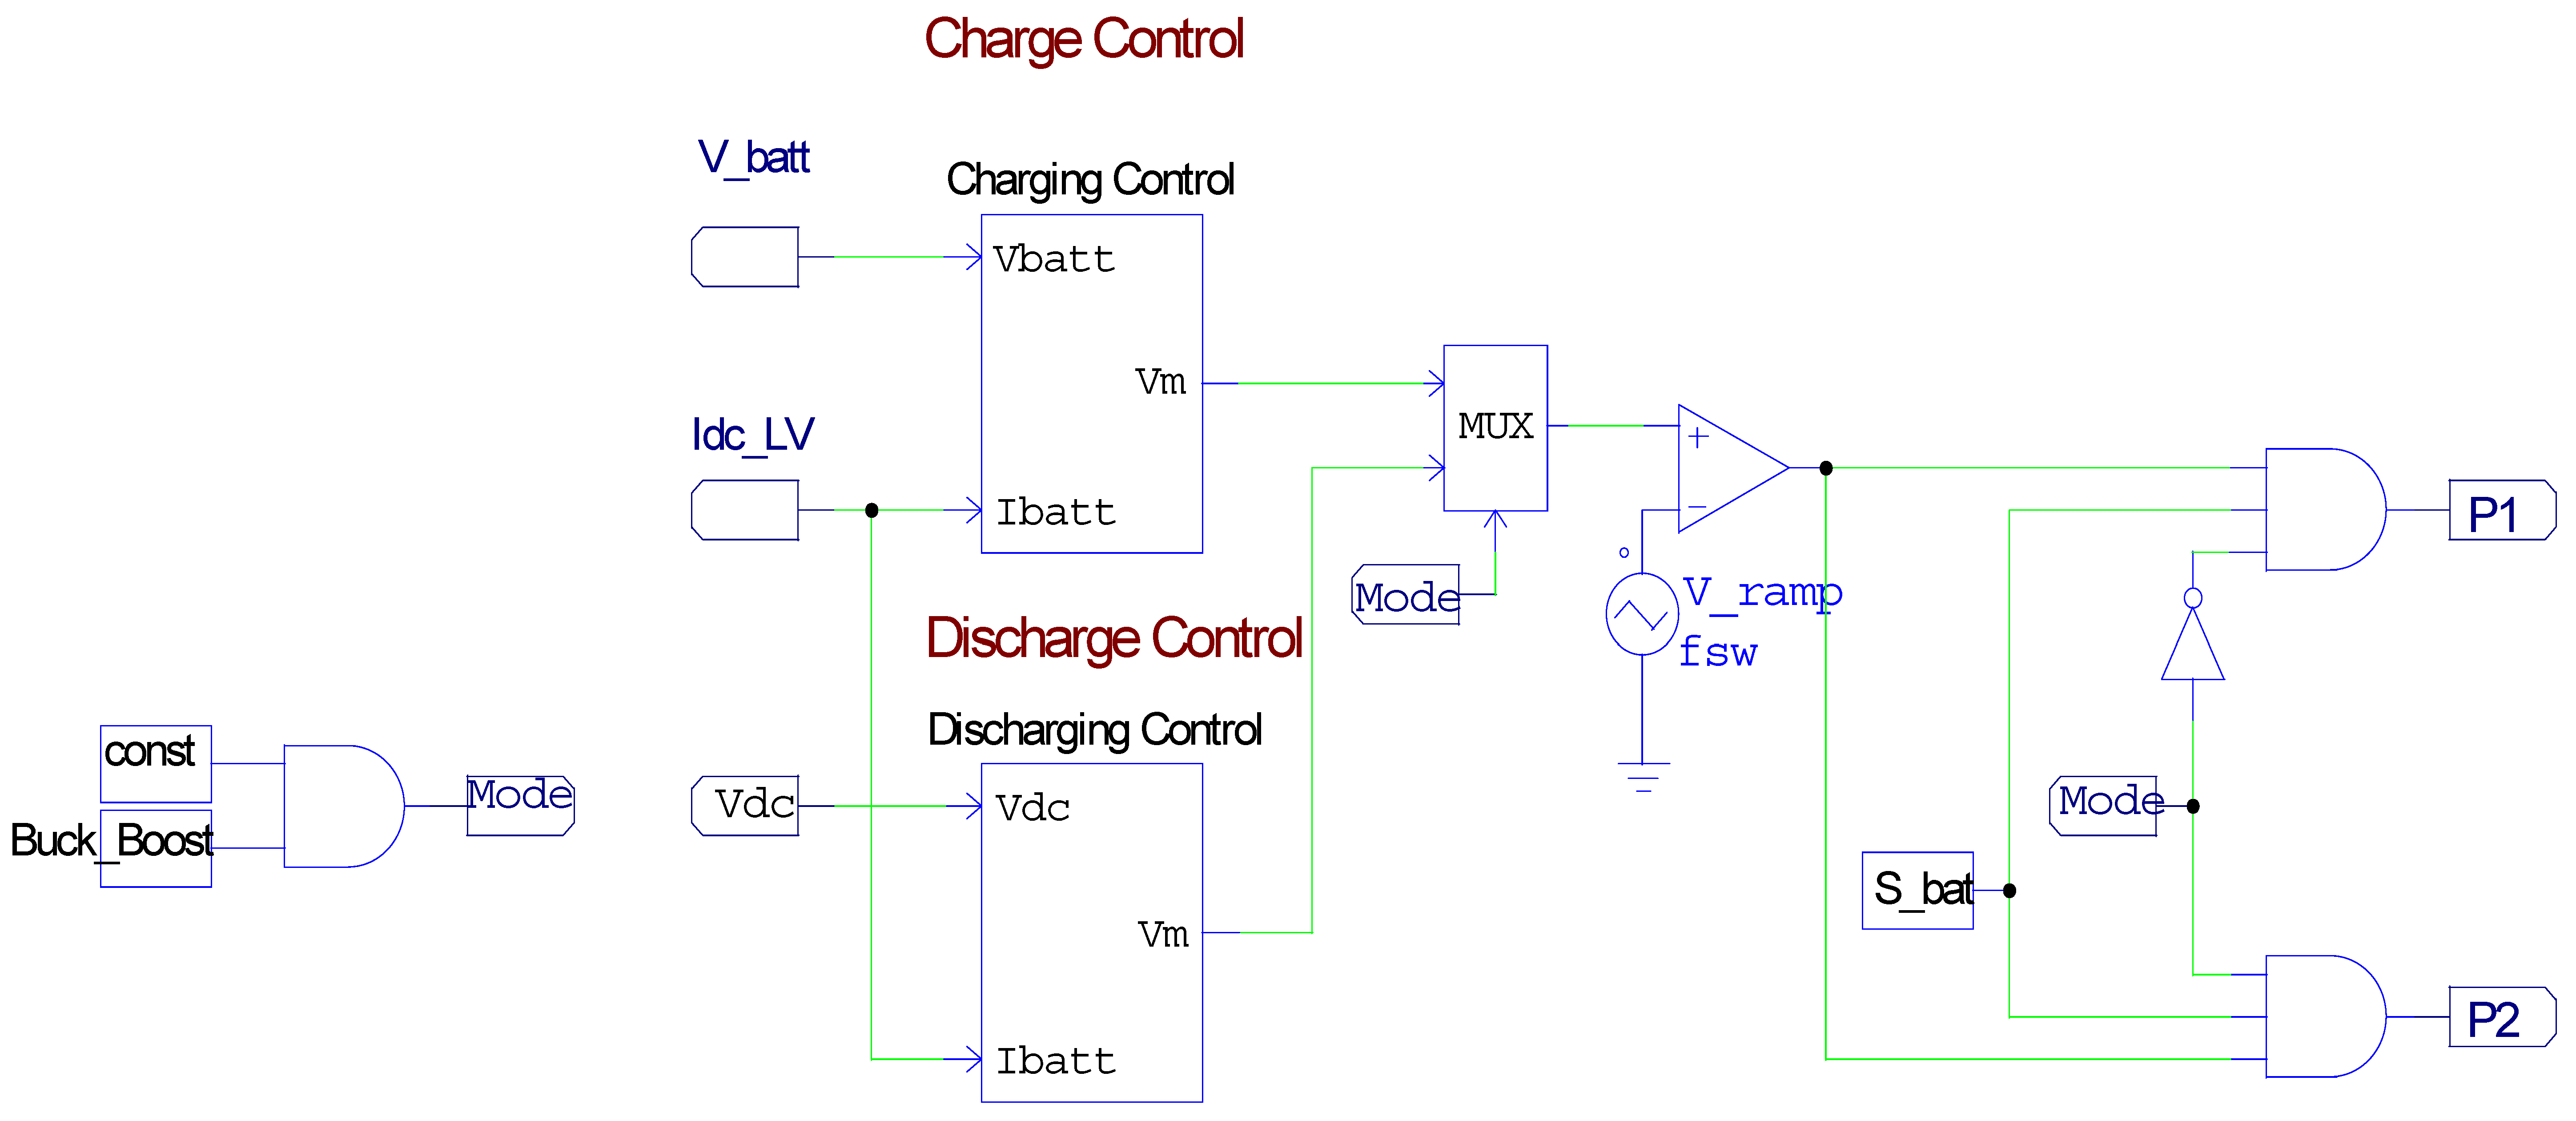
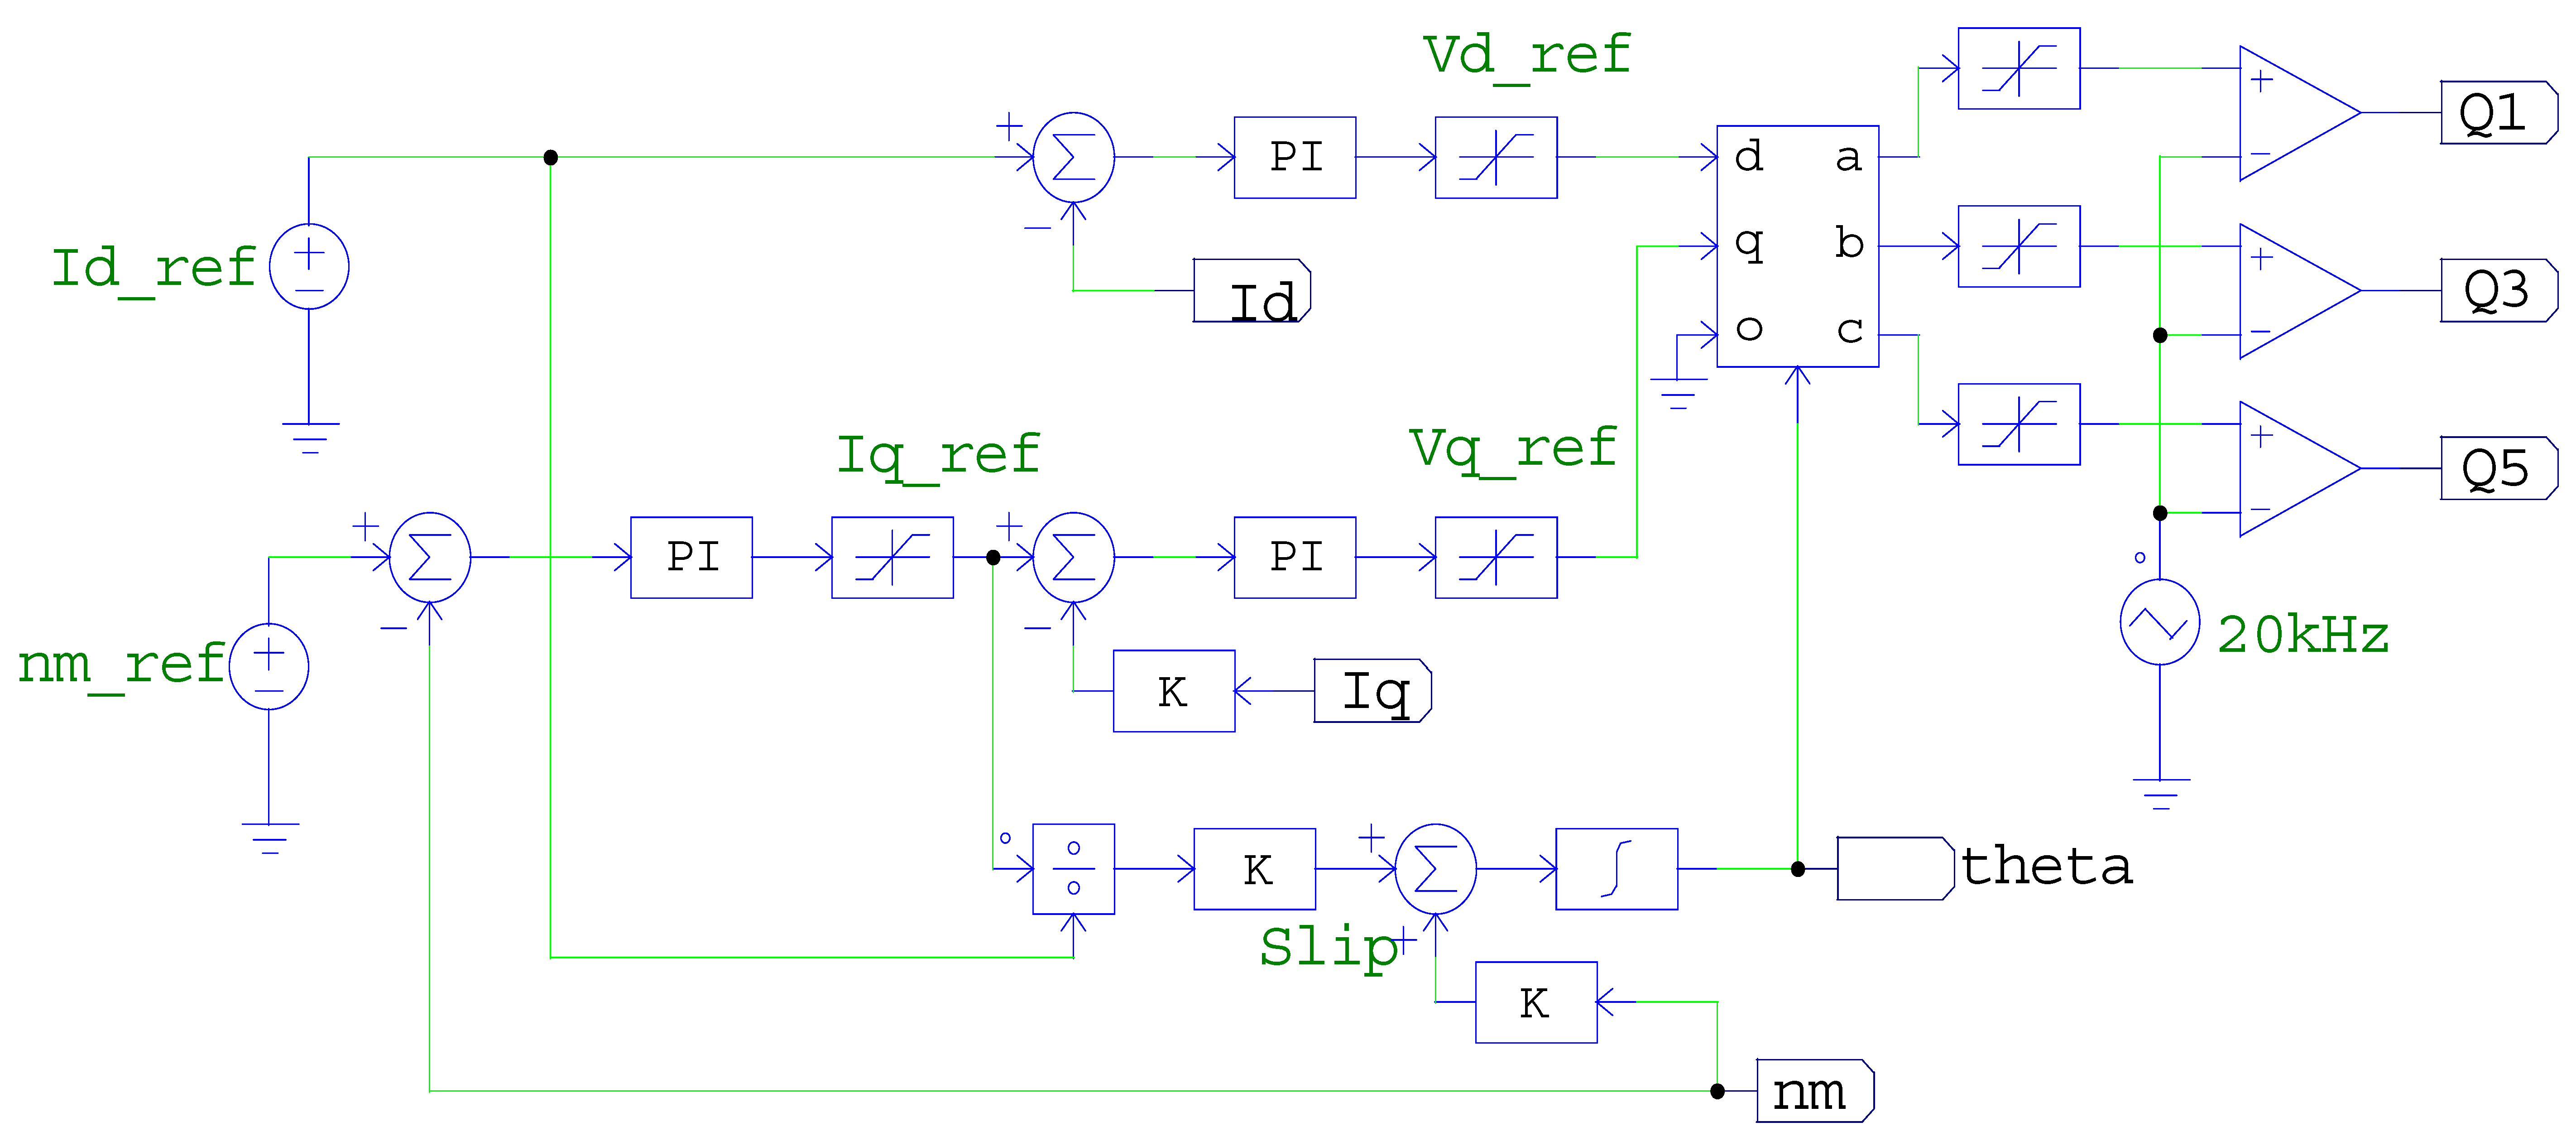
2.1.2. Modelling of Propulsion System

In order to compare with the original diesel vessel, the systematic modeling of the battery propulsion system was carried out for optimal power module selection by taking into account ship characteristics such as route, sailing destination, marina charging station and electricity supply.
Given that the case ship is originally equipped with diesel mechanical propulsion systems, a schematic diagram of the mechanical propulsion system is shown in Figure 4.
The primary flow of the fuel oil occurs from the fuel tank to the diesel engine via the fuel supply system. The cooling systems and lubricate oil systems are supportively engaged with the engine to cool down the engine jacket and lubricate the engine cylinders.
The alternative propulsion system was conceptualized with battery systems as shown in Figure 5. The battery propulsion system is composed of lithium-ion batteries, power converters, and propulsion motors [18]. The electrical energy stored in the batteries is supplied to an electric propulsion system for obtaining propulsion power via the motor. To reach the full potential in mitigating emissions, the electricity is proposed to be charged from the shore connection when ship is at berth rather than using onboard generators [19].
In diesel ships, the main engine takes full responsibility for producing and transmitting mechanical power to the thrust. In general, it does not contribute to generating electricity. Instead, the electrical load (generally for auxiliary systems and hotel facilities) is covered by independently-arranged diesel generator sets. In contrast, electric ships are designed to produce electrical power that can cover both propulsion and electrical loads.
The electrical load for marine vessels is far smaller than the propulsion load required. For example, a short route ship (the case ship) has a maximum propulsion load is 500 kW but the electrical load for running small motors, lighting systems, etc. is less than 30 kW (based on the electrical load data offered by the ship owner). In this context, this paper has disregarded the energy consumption associated with the electrical load for the simple reason that the electrical load is far dwarfed by the propulsion load (at least 10 times), which does not make any meaningful difference.
In terms of estimating the optimal battery capacity, both propulsion and electrical loads are used as input for Equation (1):
W b a t t e r y = n = 0 n W n
where Wbattery: capacity required for the battery system and Wn: each output at given time n from 1…n.
The ship operating time between the charging interval was also taken into account. As a result, the optimal battery capacity was estimated at 415 kWh. To estimate the proper battery capacity, the depth of discharge, which determines the number of battery cycles, was considered; the excessive use of the battery would reduce the battery lifetime. Table 2 shows the association between the frequency of the use and the depth of discharge. The use of batteries at a shallow discharge depth has the advantage of ensuring a longer life but has the disadvantage that a large capacity is required. In this study, the battery electric propulsion system was assumed to use up to 50% of the battery. Therefore, the total battery capacity for the ship was estimated at 830 kWh which would require 41,500 battery units (each has 0.02 kWh) with a total weight of 5.2 tons and a volume of 2.3 m3 [20].
It is worth mentioning that these discharge depths and times vary depending on the battery testing environment and supplier. Given that the allowable depth of discharge is used to determine the capacity of batteries for the case ship, this old reference [21] leads the analysis to take a conservative stance in estimating the battery capacity (indeed, if a recent reference were used, a smaller battery system would be determined). That means batteries need to be replaced over a certain period, which may cause extra cost. Although this fact is a disadvantage for full battery ships, such an estimation does not have any impact on LCA analysis as it only cares about the electricity consumption not battery size (as long as the case ship has a sufficient time for full battery charging between voyages). In other words, the depth and times of battery charge are more related to the economic aspect rather than the environmental perspective.
The electricity discharged from the batteries is transmitted to the propulsion system which mainly has electric motors that run propellers. For the system modelling of the case ship, the most common type of the induction motor for marine propulsion was selected.
The motor specifications are given in Table 3. The proposed battery system has been simulated using the PSIM program which is specifically designed for modelling and simulating power electronics, motor drives, and power conversion systems. With fast simulation speed and a friendly user interface, PSIM is recognized as a powerful simulation environment [22]. In case of using PSIM program, as long as the input parameters related to inverter, motor, and other elements are correct, the simulation results based on the numerical computations will be always the very same as the actual performance. As a result, current studies tend to ignore the validation process because the key matter is the reliability of the parameters not the models; our analysis fully relies on the manufacturers’ information [23,24,25,26]. Regarding the validation, one of good example can be found in Zhang and Chow [26] who have compared the results between the PSIM and actual tests for power managements of a hybrid electric propulsion system for a ship.
Again, the simulation was performed in a way of presenting a proper concept of battery powered ships as offering an insight into proper battery applications for marine vessels. However, the simulation results were not fed to the LCA, thereby the simulation details are given in the Appendix A.
In general, electrical propulsion has a slightly higher energy loss due to electricity conversion and transmission. The PSIM model has considered the dominant electric losses that occur in the DC/DC converter and DC/AC inverter based on the ‘Thermal Analysis Module’. In addition, the core and winding loss generated from the inductor component of the propulsion motor were also reflected using the same module.

2.2. Life Cycle Assessment

The second part of the proposed approach was designed to evaluate the holistic environmental impact of the battery powered ship in comparison with a conventional diesel mechanical one. Like most past LCA publications, the basic process of the LCA in this research was compliant with the ISO Standards guidelines [27] which suggest four main steps: goal and scope; lifecycle inventory analysis (LCI); lifecycle impact assessment (LCIA); interpretation.

2.2.1. Goal and Scope

Considering the primary goal of this LCA research, it adopted the life cycle of energy pathways consisting of the production, the transport and the use stages (see Figure 6).
The scope of analysis was not extended to battery or diesel engine products for the reason that a series of previous LCA studies have proven that the environmental impacts relative to manufacturing, installing and recycling of marine products to be negligibly small [7,28,29].

2.2.2. LCI

Figure 7 shows the overview of the LCA process for this study. Once the activities at each life stage are identified in the Goal and Scope step, the type and quantity of emissions associated with each activity is estimated by tracking all flows of the energies in the LCI step. This kind of analysis is considered to involve dozens of individual unit processes associated with the supply chain, ranging from energy production to onboard use.
The process modelling and LCI have been conducted on the GaBi LCA Software 2019 platform which offers a tremendously extensive LCA data library with which this research could estimate more than a hundred different types of emissions from energy production, ship transportation, and electricity production (for example, GaBi 2019 provides proven emission data measured in more than 30 countries). Key information on the software such as the ideas, scopes, interface and real-world applications as well as its stunning database can be found on its website [30].
GaBi models have encapsulated all relevant energy flow and emissions associated with various sub-activities into modules which can be conveniently used for research purpose and scope. On the other hand, the emission associated with the onboard use was estimated with experimental data:
(a) Production stage
The analytical process at the production stage involves estimating the emissions associated with energy production according to locations and technologies. The energy consumed on board was classified into two types: low sulfur fuel oil (LSFO0.5, blend) for the diesel mechanical propulsion system and the electricity for the battery system.
LSFO0.5, blend is a blend of 50:50 residual and distillate marine fuels with an average sulphur content of 0.5% produced from a crude oil. The fuel production was modelled from the production of the crude oil in Saudi Arabia (the largest oil exporter to South Korea) to transport and refining into LSFO0.5 in South Korea. In fact, the case ship is engaged in the domestic service so that it is not subject to international regulations so neither the SOx exhaust aftertreatment nor the use of low sulphur fuel is required. Nevertheless, this case vessel is voluntarily using LSFO0.5 that complies with the international regulations for SOx emission control (the same fuel used for the experiment). Therefore, it can be said that the both diesel and battery concepts are in accordance with the same level of maritime regulations.
Electricity generation in South Korea mainly comes from conventional thermal power, which accounts for 65% of the production and 30% from nuclear power [31]. Figure 8 shows the energy sources for South Korea’s electricity grid.
Emission estimates from electricity production process were referenced from the GaBi data library, which provides a data source for the entire product system. The following key information was considered in the analysis:
  • The data set covers all relevant process steps and technologies along the supply chain. The inventory is partly based on primary industry data, partly on secondary literature data.
  • The following life cycle phases are considered in each power plant model: construction, use, and end of life.
  • Major emissions (e.g., sulfur dioxide, nitrogen oxides, etc.) from power plants are based on operational data measured in national statistics.
  • All other emissions from power plants are based on literature data and/or calculated through energy carrier configurations combined with (data based) combustion models.
  • Infrastructure data as well as the inventory of exploration, production and processing is referred from the literature.
  • The model includes the infrastructure of the power plant as well as the end-of-life of the auxiliary buildings, e.g., cooling tower. The model is structured considering the main phases of the fuel cycle.
  • The efficiency standards of the power plants and their national share are modelled.
  • The photovoltaic model is based on the global average market mix of photovoltaic technologies installed: mono-silicon 42%, multi-silicon 47%, cadmium-telluride (cdte) 7% and copper-indium-gallium-diselenide 4%.
  • The onshore wind model is based on a 300 MW wind park, operating 100 wind turbines with 3.00 MW each. The rotor diameter is 90 m.
  • Losses in the cables and transformer station are included and calculated to approximately 5%.
Figure 9 illustrates the life cycle of electricity generation along with emission flows. It can be found that the emissions are combined into a holistic level from several life stages which are further engaged with various encapsulated sub-activities.
As a result, some key emission factors for electricity generation were determined, as shown in Table 4.
(b) Transport stage
This stage was proposed to evaluate the environmental impacts contributed by energy transport and logistics from production countries (specified in Figure 6) to South Korea via waterborne transportation means. The cargo ships were assumed to use diesel propulsion consuming marine diesel oil. In order to estimate emissions from the energy transport via those cargo ships, two key factors were identified: the transport distance and the cargo quantities to be delivered. In fact, the longer distance and the higher energy quantities require the more ship operations.
Like production stage, the waterway transport model in the Gabi database was applied to estimate the emission levels. The fuel consumption (kg/h) was basically calculated linearly according to the cargo load from 0% (empty) to 100% (full load) (kg diesel/kg load), while taking into account the key operation factors such as average speed of the ship (km/h), distance (km) and maximum payload (dwt). Once fuel consumption was estimated, the emission levels were determined by means of the fuel-emission factors provided by the database.
For battery ship case, a single voyage trip for raw energy import was estimated at 22,902 km (Saudi Arabia), 23,224 km (Qatar), 35,300 km (USA) and 8433 km (Australia). According to the energy portion and heat values for each energy, the energy to be transported were quantified as 42 tons for oil, 260 tons for natural gas, 814 tons for coal, 0.005 tons for uranium. The raw energy sources were assumed to be supplied to refineries and/or power plants for the electricity generation. The electricity produced at each power plant was assumed to converge into the South Korea’ electricity grid, thereby the case ship could be electrically charged at port.
On the other hand, for the diesel propulsion, 4286 tons of crude oil from Saudi Arabia was assumed to be transported. The refined oil would be supplied directly to the case ship during bunkering.
The electricity transmission at high voltages reduces the percentage of energy lost to resistance, which depends on the specific conductor, the current flowing and the length of the transmission line.
For example, a report of American Electric Power explains that a 160 km span at 765 kV carrying 1000 MW of power can have losses of 1.1% to 0.5% [32].
Considering the case study, all types of power plants are located within the 100 km radius (mostly within 50 km) to the ports of Incheon where the case ship is operated. Given this, it was verified that LCA could disregard the energy losses associated with power delivery to the port.
On the other hand, the electric loss is proportional to the increase in the environmental impacts of the battery ship (a linear relationship). Again, 10% electric loss claims 10% additional electricity to cover the required power, thereby 10% more emissions to be produced. Therefore, even if the electricity transmission was disregarded, this research could still offer an intuition about the relationship between energy loss and emission.
When berthing the ship, the transmitted power is proposed to be supplied from the national electricity grid to the ship via the port electricity supplying hub as shown in Figure 10.
(c) Use stage
The use stage describes a way of estimating the emissions associated with the on-board use. For the past maritime LCA research, engine emissions were calculated based on the emission factors provided by the IMO [7,8,28,29,33,34]. It was noticed that such an analytical calculation would probably lead to high discrepancies between the actual and calculated emissions [14,35]. The actual measurements at a test laboratory were an effort to improve the reliability of analysis that was diminished in the previous research as they were overly laden with the analytical calculations based on the IMO emission factors.
The test bed was designed in Vessel Exhaust Gas Test Research (VEGTR) located in Sacheon City, South Korea, which is operated by Korea Marine Equipment Research Institute (KOMERI). The same capacity of engine as the target vessel were tested and the fuel consumption and emissions of the diesel engine mounted on the test bed were measured at each operation section as shown in Figure 11. A dynamometer was installed to set-up and monitor the equal load as the actual operation profile, and two sets of flowmeters were fitted to the inlet and the outlet of the engine fuel piping system. The difference between the inlet flow and the outlet flow represents actual fuel consumption in the engine. Engine simulations were conducted in accordance with the National Certified Test (KOLAS) guidelines which is in the same line with ISO/IEC 17025:2017.
The concentration of emissions in the engine exhaust gas was measured in accordance with IMO’s “NOx Technical Code 2008” which provides a standardized guideline for marine engine emission measurements. The fuel consumption was measured five times in each section, and averaged.
CO2 emission accounts for more than 99% of the whole exhaust gas from diesel engines that burn LSFO0.5, whereas all other emissions, such as CO, N2O, PM CH4, NOx, NMVOC, SO2, take up for less than 1%. If excluding CO2, NOx emission has another 99% of all types of emissions (IMO, 2014). Hence, the measurement was implemented on two major gases – CO2 and NOx. In addition, the exhaust gas emissions, CO2 and NOx from various loads were investigated through the measuring equipment specified in Figure 1(2).
The emissions were measured at the exhaust gas piping line of the engine (no emission aftertreatment is applied). As a device that measures the concentration of exhaust gas emitted from a ship, a portable analyzer (DX-4000, GASMET, Vantaa, Finland) convenient for on-site measurement was used: the analyzer can identify over 350 types of gases, and up to 50 types gases can be analyzed simultaneously. It adopts Fourier Transform Infrared Spectroscopy (FT-IR) sampling method where the exhaust gas is directly exposed to the infrared (IR) beam of the analyzer. As this beam pass through the exhaust gas, the transmitted emission types are measured. The exhaust gases were measured 50 times for 10 seconds, and the average value was adopted.
Table 5 shows the results of measuring fuel consumption at given loads. For section of engine output 100 kW at 55 rpm, the average fuel consumption was estimated at 30.74 kg/h and the fuel consumption per unit output was at 307.4 g/kWh. For the section of Hari Port Jmse 08 00580 i002 
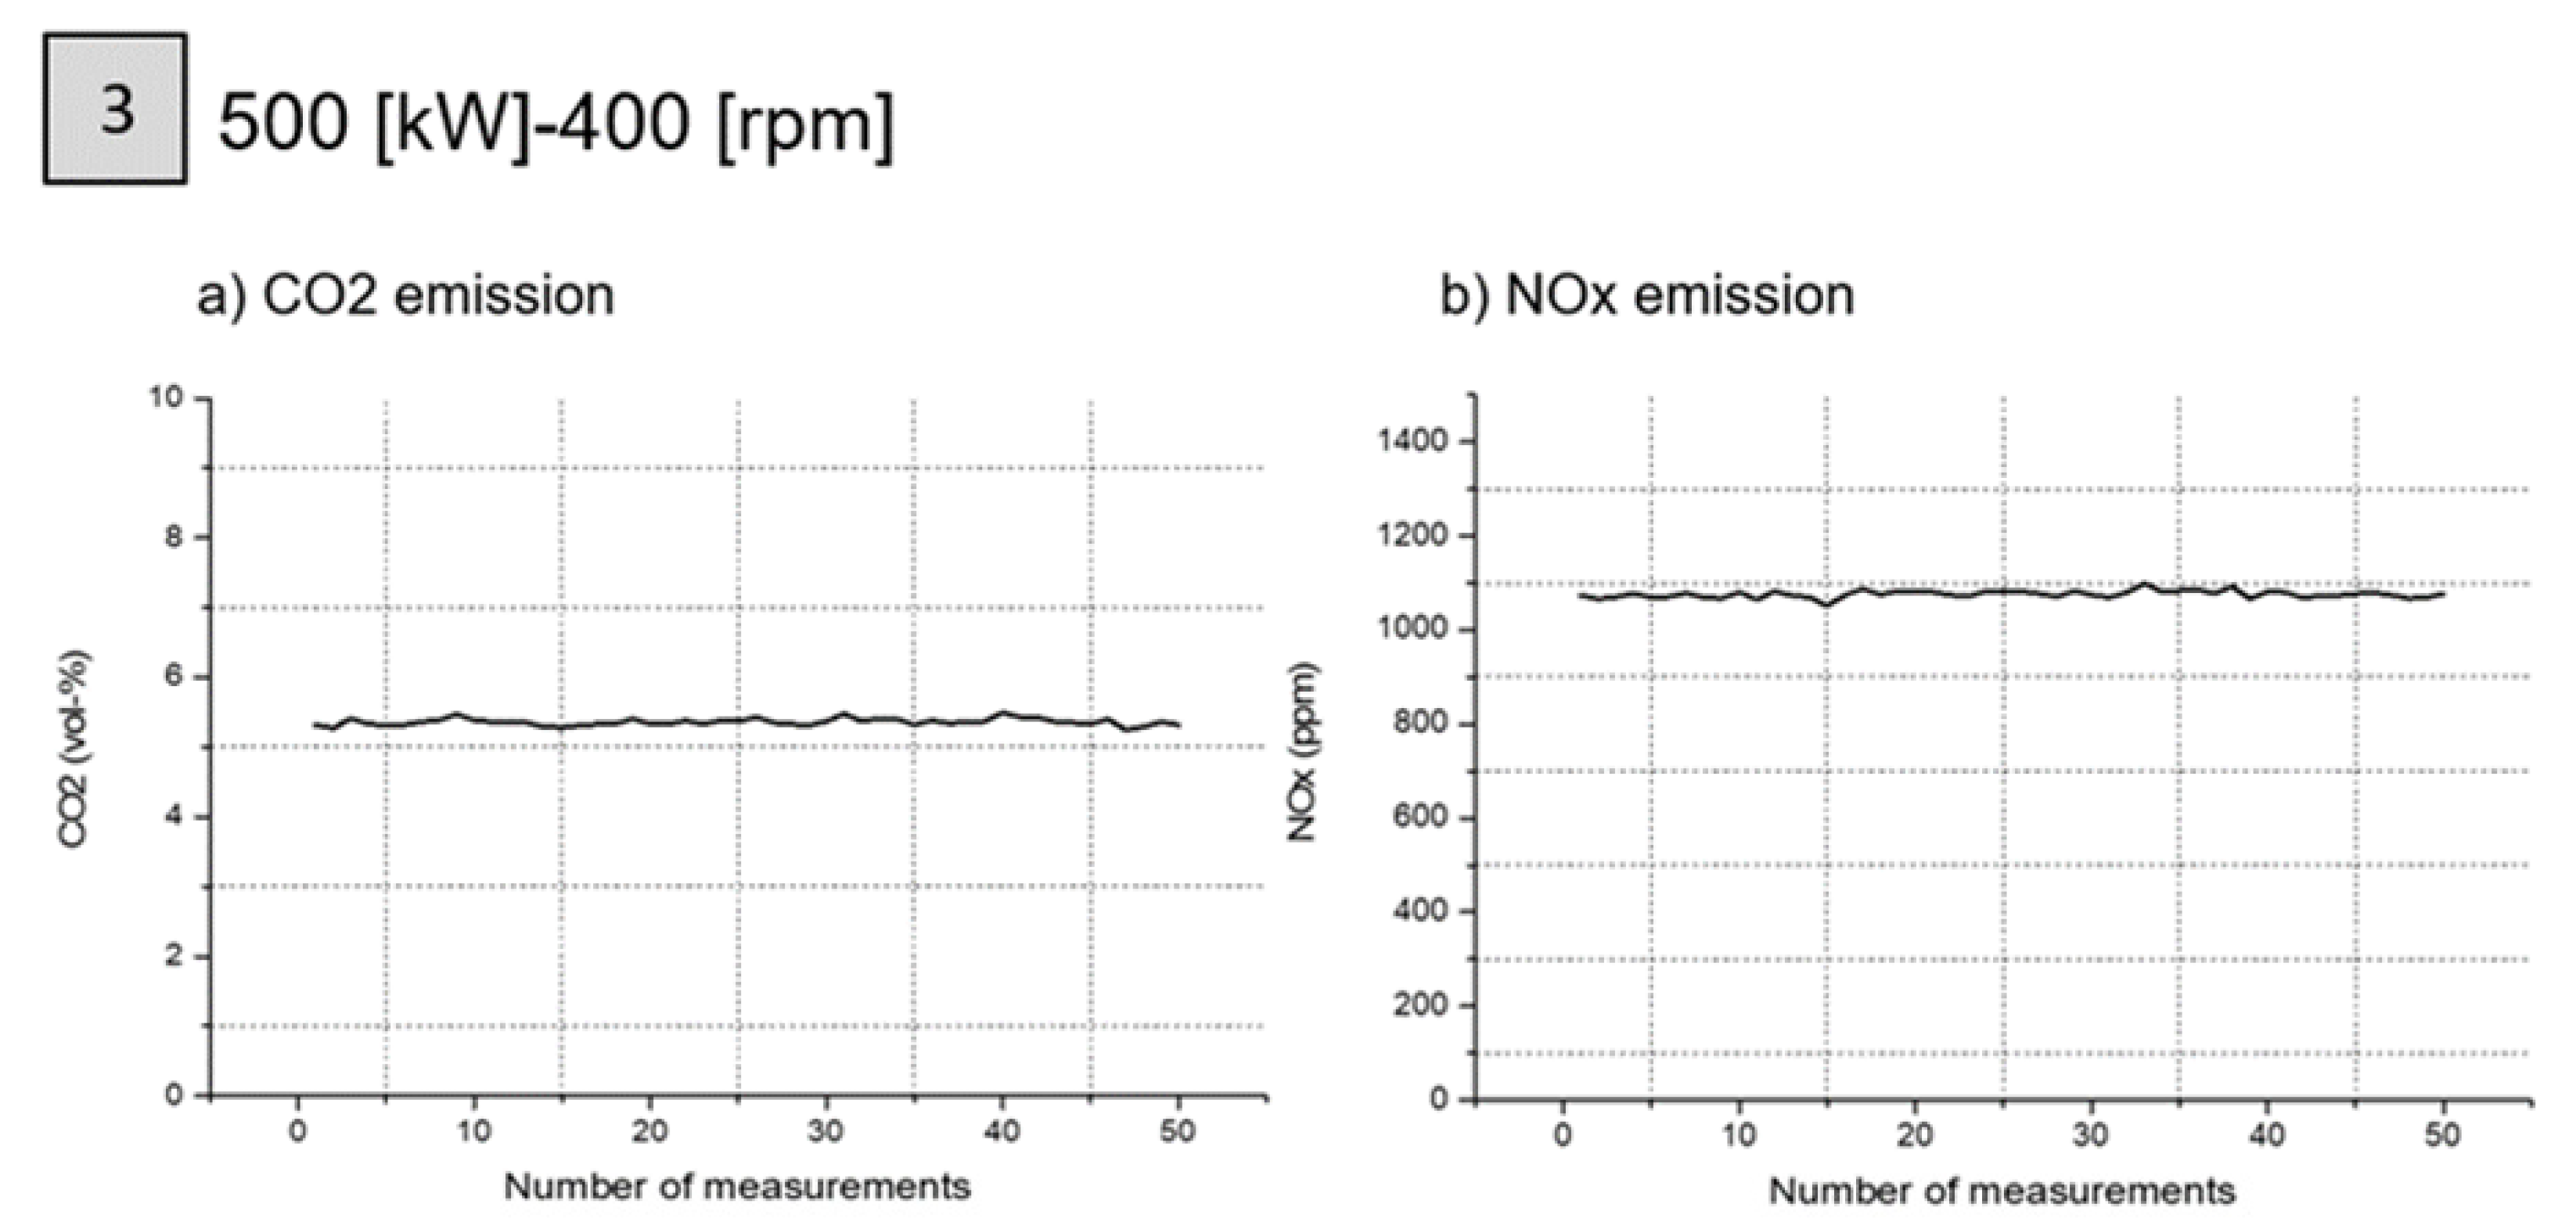
Mibeop port (engine output 200 kW at 100 rpm), the average fuel consumption was estimated at 51.39 kg/h and the fuel consumption per unit output was at 257.0 g/kWh. Lastly, for the constant speed section (engine output 500 kW at 400 rpm), the average fuel consumption was measured at 113.97 kg/h and the fuel consumption per unit output was determined at 227.9 g/kWh.
Meanwhile, Figure 12 presents the average value of CO2 and NOx according to various engine loads. Figure 12(1) shows that the emissions in harbor operation was 3.93 vol-% for CO2 and 420.09 ppm for NOx. Figure 12(2) indicates the average CO2 for 5.11 vol-%, and NOx for 622.22 ppm in 200 kW operation at 100 rpm. In Figure 12(3), CO2 was 5.3 vol-% and NOx was 1063.85 ppm when the engine is in full load of 500 kW at 400 rpm.
Table 6 compares the fuel consumption and the emissions during daily operation. No emissions was assumed to be produced when batteries were operated. This table reveals an interesting observation that there are some deviations between the actual emission measurements and analytical calculation applied with IMO emission factors: CO2 factor is 3.21 kg/1 kg fuel and NOx factor is 0.087 kg/1 kg fuel [36]. In general, it was found that the analytical calculation tends to exaggerate emission levels. In particular, this trend is detected more in NOx emissions: some results are 9.7 times higher if calculated. Since the purpose of analytic calculation was to determine the deviation levels with actual measurements, the emission levels obtained from the actual measurement were used in the course of the LCI.

3. Results (LCIA and Interpretation)

In the LCIA, the estimated types of emissions and their quantities as a result of LCI fall into several environmental impact potentials. In the marine industry, considering the major ship emission types, four impact categories are generally proposed: Global warming potential (GWP), Acidification potential (AP), Eutrophication potential (EP) and Photochemical ozone creation potential (POCP). For this categorization process, the CML 2001 method, the most commonly adopted in the maritime LCA, was applied for impact assessment [37,38,39].
Finally, the LCA results in comparison between the diesel and battery ships are discussed, which represents the last step of LCA, known as ‘interpretation’ in the following section.

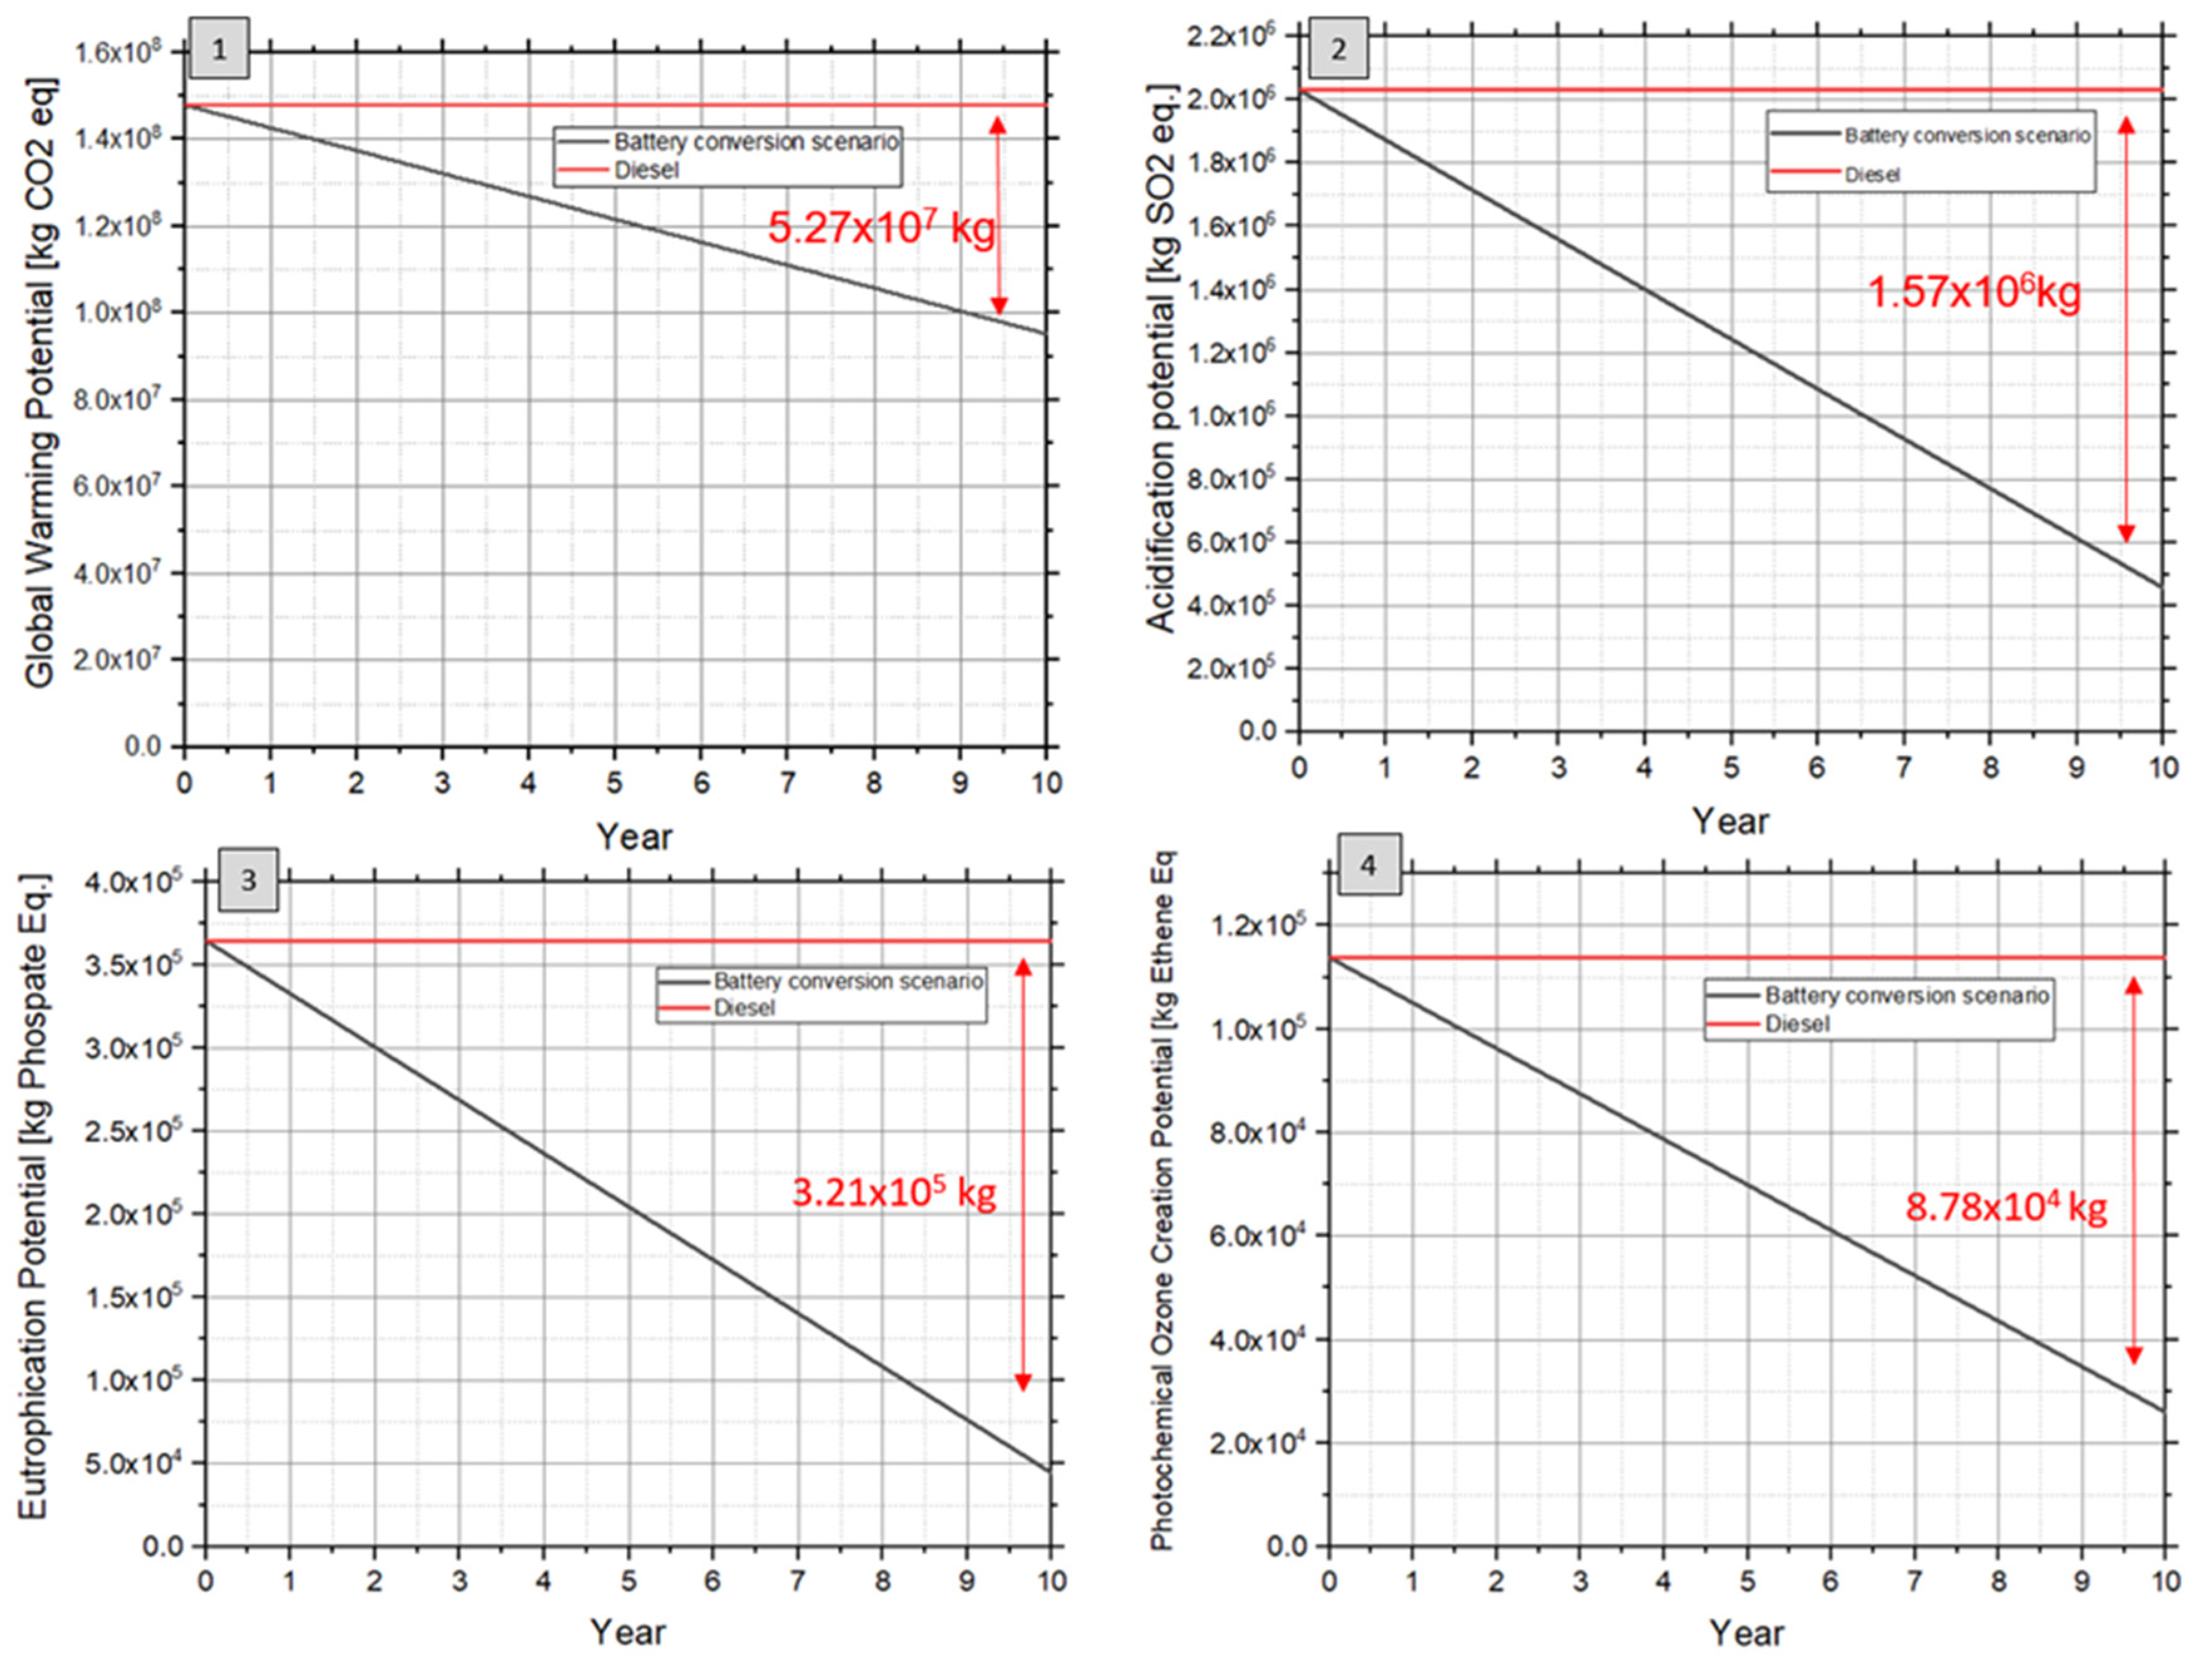
3.1. Diesel vs. Electricity

LCIA results of the two opens were compared in Figure 13. Analysis results have ostensibly proven the initial hypothesis that the use of battery system would be superior to all environmental footprints over the diesel option that reveals about 1.6 × 10⁷ kg CO2 equivalent (GWP), 2.17 × 10⁵ kg SO2 equivalent (AP), 3.8 × 10⁴ kg phosphate equivalent (EP), 1.2 × 10⁴ kg ethene equivalent over the ship’s life (POCP).
On the other hand, if we closely look at details, there are a few things to note. According to the LCA results, using batteries instead of diesel engines was revealed to reduce 35.7% of the GWP, not 100%. It was because the environmental impacts associated with the energy production and transport contribute substantially to the total impacts: it was estimated that 1.05 × 10⁷ kg CO2 equivalent was produced during 30 years of operating time.
For the other three potentials with batteries, better results were observed with the decrease of the AP by 77.6%, the EP by 87.8% and the POCP by 77.2%. For quantitative presentation, battery operation has been shown to contribute to the production of approximately 5.00 × 10⁴ kg SO2 equivalent, about 5.0 × 10³ kg phosphate equivalent and about 2.8 × 10³ kg ethene equivalent over the ship life.
Despite the generous emission reductions, we cannot ignore the fact that the batteries are still subject to producing a huge amount of emissions particularly with the GWP. Given this, we may still have a question on whether further steps should be taken to minimize them in order to reach close to ‘zero emissions’.
This paper continues to argue that the level of emissions heavily depends on the type and method of energies consumed for the electricity production and their logistics. Therefore, it may be necessary to undertake a further investigation on the relationship between the energy sources and emissions levels in sensitivity analysis.

3.2. Sensitivity Analysis

3.2.1. Electricity from Various Energy Sources

Six electricity generation scenarios were established to investigate the sensitivity of energy sources on emission levels. Each scenario was assumed 100% utilization of a single energy source among the following candidates: coal, oil, natural gas, wind, hydro and nuclear. Then, the analysis results were given in Figure 14. Surprisingly, the GWP from batteries was revealed greater than that of diesel propulsion if the electricity would fully rely on coal. Likewise, all other fossil fuel-based energies (HFO and natural gas), showed significantly higher environmental potentials than those from renewable or nuclear energies.
It provides an important message that the current maritime policies and strategies (which strongly encourage the use of batteries in pursuit of zero emissions) might have been misled. Instead, this paper emphasizes that the enormous environmental impact, as byproducts of electricity production and transportation, cannot be overlooked in order to truly purify our planet via greener shipping where complex and diverse activities with other industries are closely interconnected.
Meanwhile, the local environmental impacts – AP, EP and POCP – have been found to have higher with diesel propulsion than with electricity production in all energy cases. As such, fossil fuel energy sources have higher impact levels, compared to renewable energy sources.

3.2.2. 140 Ships Subject to Korean Policy

In addition, it may be worth investigating the actual environmental benefits obtainable from the Korean government policy in relation to the planned conversion of 140 ships into eco-friendly ships. Given this, a credible scenario was developed where 14 ships would be converted into the full battery powered ships each year, so that it will take 10 years to replace all 140 existing ships with the full battery propulsion. It was assumed that the national electricity grid would be equal to the share of energy in 2018.
Compared to the diesel only operation, in Figure 15(1), the LCA results show the GWP could be reduced by 5.27 × 10⁷ kg CO2 eq. whereas the other local pollutants of AP, EP and POCP are estimated in the reduction of 1.57E × 106 kg SO2 eq., 3.21 × 10⁵ kg phosphate eq. and 8.78 × 10⁴ kg ethane eq., respectively, in the ten year time (see Figure 15(2)–(4)). For the reduction rate, except for GWP, all potentials were reduced more than half. On the other hand, if the battery conversion policy continues for more than 140 planned vessels after the initial ten years, it can be certainly confirmed that a 50% reduction can be achieved before 2050.

3.3. Global 2050 Strategies

Taking into account the IMO’s goal of reducing GHG emissions by 50% from 2008 levels by 2050, LCA results, discussed in previous sections, can provide extended insights into the proper application of batteries with in-plug electricity for cleaner shipping. This paper tells us much of what we need to learn about why the use of fossil fuels for national electricity production should be curbed while the renewables be encouraged across the shipping industry in order to achieve this IMO goal. It is clearly stated that the benefits of battery application are significantly diminished if the electricity grid is heavily reliant on fossil fuel-based energies from the life cycle perspective.
According to the REN21’s 2019 report, renewable energies contributed about 33% to world electricity generation in 2018. On the other hand, about 70% of the world electricity is still generated from non-renewable sources [40]. According to IRENA [41], it has been observed that 155 out of 214 countries use less than 30% of renewable energies for electricity generation.
This paper demonstrates that the use of battery powered ships will be effective in these countries with higher ratio of electricity production from renewables but less effective in the other countries.
In this context, international directives or regulations may need to be further specified and quantified in order to properly apply cleaner systems to the marine industry.

4. Discussion

It is obvious that the state-of-the-art technologies/methods of battery powered ships can reduce ships’ emissions to certain levels and enable ships to comply with various international and regional emission standards and regulations.
The maritime industry often assumes that battery operation contributes to zero emissions; this may be true if we limit our scope to within the ship operation stage. However, this paper has argued that it should not be true if we are extending our view to the holistic side. Indeed, the LCA study conducted in this paper could demystify the holistic and realistic environmental impacts of battery powered ships. In this regard, it is believed that the research findings may be useful for establishing future marine policies. To facilitate the development and production of battery-powered vessels, it is advisable to answer the following questions:
  • Is the electricity from renewable sources enough to charge batteries to be used for the ships’ power?
  • Is it recognized that a new technology may merely shift the ship emission from operation stage to other life cycle stages, e.g., construction, transport or recycling?
Since South Korea is regarded as a country with high air pollution in the world, this paper has revealed the use of batteries will contribute to the significant reductions in not only the GWP but also local pollutants. This paper can be regarded a pilot research for offering proper guidance for the planned conversion of 140 vessels.

4.1. Contributions to Improving the Process of Maritime Environmental Assessment

The effectiveness of current IMO environmental indicators, known as Energy Efficiency Design Index (EEDI) and Energy Efficiency Operational Indicator (EEOI), are still open to doubt as they are far too vague to be of practical help in understanding the environmental impact of marine fuels. First, those indicators are limited in calculating vessel emissions from conventional oil products such as heavy fuel oil, diesel and liquefied natural gas. Second, those measurements are only valid for CO2 indication although a variety of gases contributes to GHG emissions and other local emissions. As a result, those indicators can suggest that the full battery propulsion be zero emission.
In this regard, the application of LCA method in this paper is highly believed to offer an insight to develop an enhanced indicator to estimate various emission levels from alternative fuel sources. In particular, this paper provides a useful input for the current IMO’s work that is to develop ‘the lifecycle GHG/carbon intensity guidelines for all relevant current and future maritime fuels’; the basic idea and LCA approach proposed in this paper were input to the IMO member states as a form of agenda document [42].

4.2. Limitations

Like most of the past research, this paper was focused on demonstrating environmental advantages for small ships engaged in short route services. For ocean going vessels, there still need a further investigation on determining the benefits and costs of the application in accordance with due to its technical pre-maturity: mainly related to limited battery capacities with low energy density, excessive battery weight, and long charging time [43].
The battery systems for the case ship were designed to be charged via plug-in port electricity. For ocean going vessels, plug-in service is not a realistic option while onboard generators inevitably need to supply electricity for charging batteries during the voyage. In this case, emissions from the generators may negatively contribute to the environmental footprints of the battery powered ships. To alleviate this matter, an introduction of a cleaner electricity generating system in place of conventional diesel generators can be combined with the battery systems. The systematic analysis for such a combined system should be a next stage of this research.

4.3. Guidelines for Future Study Directions

Last but not least, the LCA results have shown that it may be more difficult to achieve zero emissions in the shipping industry than it was thought. This is because the shipping is not a single and isolated business but interconnected with various activities associated with other fields, in particular of energy industry. What cleaner concepts, ideas, systems and practices are necessary for the marine industry to truly- achieve zero emissions for both short route and ocean going vessels? The follow-up research should pursue answering this question.

5. Conclusions

The research findings can be summarized as below:
(1) It demonstrated the benefits of using a battery driven propulsion with the significant decrease of the GWP by 35.7%, the AP by 77.6%, the EP by 87.8% and the POCP by 77.2%, compared to the conventional diesel mechanical propulsion. Nevertheless, it has been found that battery applications are currently unable to achieve the 50% GWP reduction target under the present electricity mix of South Korea.
(2) Key technological and operational factors that affect the emissions in the process of ‘Well to Propeller’ were identified as below:
  • Not only emissions associated with the on-board use, but also;
  • Emissions associated with production of these fuels and electricity based on locations and source of energy;
  • Emissions associated with transport of these fuels based on transport means and locations of ports and refineries;
(3) It was found that the current practices for maritime environmental assessment might have been misguided regarding cleaner shipping. This paper has proposed a corrective guidance with a highlight of the effectiveness of the LCA which should be standardized for proper use in consistent and integrated format.
(4) The proposed LCA approach is strongly believed to offer a valuable input for standardizing maritime LCA model. It provides a guideline for the process of evaluating effective fuels to achieve the IMO 2050 target, taking into account of lifecycle intensity of GHG/carbon and local pollutants.
(5) In terms of estimating the marine engine emissions, significant levels of deviation between the measurement and analytical calculation were identified. Therefore, research findings suggest the marine LCA should be conducted based on measurement.

Author Contributions

Conceptualization, B.J. and H.J.; methodology, B.J.; software, B.J. and H.J.; validation, B.J., H.J. and S.K.; formal analysis, B.J.; investigation, B.J., H.J. and S.K.; resources, H.J. and S.K.; data curation, B.J.; writing—original draft preparation, B.J.; writing—review and editing, J.K. and P.Z.; visualization, H.J. and S.K.; supervision, J.K. and P.Z.; project administration, J.K.; funding acquisition, J.K. All authors have read and agreed to the published version of the manuscript.

Funding

This research was funded by the Korea Institute of Marine Science & Technology Promotion (KIMST), grant number 20180066.

Acknowledgments

The authors would like to express our gratitude to Hallym Shipping Ltd and Hyosung Heavy Industry Ltd for their kindest support with offering valuable data.

Conflicts of Interest

The authors declare no conflict of interest.

Appendix A

Figure A1 shows the computational model of the battery-electric propulsion system in place of the diesel mechanical propulsion system using a PSIM program (power analysis program). A battery is used as a power source and a bi-directional DC-DC converter is installed for charging and discharging the battery. In addition, there is a DC/AC inverter for speed control of the propulsion motor, and the inverter controls the speed of the propulsion motor through an indirect vector control technique.
Figure A2 illustrates the charge/discharge control system for the batteries. The battery system controls the DC output voltage through a bidirectional DC-DC converter and converts the voltage from low voltage to high voltage or high voltage to low voltage. In the case of batteries, not only discharge, but also charging is required, therefore, a DC-DC boost converter (discharge) and DC-DC buck converter (charge) needs to be installed. DC-DC boost converter and buck converter are applied to the output of lithium ion battery for charging and discharging. The control logic is configured to step down the DC link voltage when charging the battery and boost the voltage to match the DC link voltage when discharging from the battery to the propulsion motor.
In addition, Figure A3 shows the schematic of the control system modelled with the inverter control algorithm using the indirect vector control for the speed and torque control of the propulsion motor. In the case of a ship with an electric propulsion system, an inverter for speed control is installed to control the speed of the propulsion motor. The output of the battery is direct current, and the DC output must be converted to an AC output. This function is an inverter, and a vector control technique (FOC: Field Oriented Control) is applied to control the speed of the induction motor. This vector control technique divides the stator current into torque and magnetic flux components so that it can be controlled independently, thereby obtaining the torque control characteristics of the DC motor. The three-phase current component supplied to the stator of the motor is simplified using abc-dq reference frame transformation technique, the d-axis is the magnetic flux component, and the q-axis is the torque component to control the speed of the induction motor.
Figure A1. Modelling for battery propulsion system.
Jmse 08 00580 g0a1
Figure A2. Modelling for battery charge/discharge control system.
Jmse 08 00580 g0a2
Figure A3. Configuration for control system.
Jmse 08 00580 g0a3
To determine the adequacy of the proposed battery system model for the case ship, a power analysis software, PSIM, was applied for the performance simulation in accordance with the ship operating profile. A series of simulations with the three step speed commands - low speed of 55 rpm, medium speed of 100 rpm and high speed of 400 (rpm) - were carried out to investigate the characteristics of the overshoot and speed response of the battery electric propulsion system. Figure A4 shows the motor speeds are fully responded within 0.5 s in all cases. Therefore, it could be confirmed that the battery system modelling was satisfactory.
Figure A4. Velocity step response characteristics.
Jmse 08 00580 g0a4
As shown in Figure A5(1), the effective current was estimated at 80 A at 55 rpm with a motor output of 100 kW. In the condition of 100 rpm with a motor output of 200 kW, the current effective value was estimated at 178 A, which is given in Figure A5(2). Lastly, Figure A5(3) shows the effective current of 281 A in the condition of 400 rpm with the 500 kW output.
Figure A5. Simulation results of battery electric propulsion; (1) at 100 kW–55 rpm, (2) at 200 kW–100 rpm, (3) 500 kW–400 rpm phases.
Jmse 08 00580 g0a5

References

  1. Zhang, N.; Zhou, P.; Choi, Y. Energy efficiency, CO2 emission performance and technology gaps in fossil fuel electricity generation in Korea: A meta-frontier non-radial directional distance functionanalysis. J. Energy Policy 2013, 56, 653–662. [Google Scholar] [CrossRef]
  2. Yang, L.; Cai, Y.S.; Yang, Y.X.; Deng, Z.W. Supervisory long-term prediction of state of available power for lithium-ion batteries in electric vehicles. Appl. Energy 2020, 257, 114006. [Google Scholar] [CrossRef]
  3. DNVGL. Energy Transition Outlook P50; DNVGL: Oslo, Norway, 2019. [Google Scholar]
  4. DNVGL. Maritime forecast to 2050; DNVGL: Oslo, Norway, 2018. [Google Scholar]
  5. Skjong, E.; Volden, R.; Rødskar, E.; Molinas, M.; Johansen, T.A.; Cunningham, J. Past, present, and future challenges of the marine vessel’s electrical power system. IEEE Trans. Transp. Electrif. 2016, 2, 522–537. [Google Scholar] [CrossRef] [Green Version]
  6. Mo, O.; Guidi, G. Design of Minimum Fuel Consumption Energy Management Strategy for Hybrid Marine Vessels with Multiple Diesel Engine Generators and Energy Storage. In Proceedings of the 2018 IEEE Transportation Electrification Conference and Expo (ITEC), Long Beach, CA, USA, 13–15 June 2018; pp. 537–544. [Google Scholar]
  7. Jeong, B.; Wang, H.; Oguz, E.; Zhou, P. An effective framework for life cycle and cost assessment for marine vessels aiming to select optimal propulsion systems. J. Clean. Prod. 2018, 187, 111–130. [Google Scholar] [CrossRef] [Green Version]
  8. Jeong, B.; Oguz, E.; Wang, H.; Zhou, P. Multi-criteria decision-making for marine propulsion: Hybrid, diesel electric and diesel mechanical systems from cost-environment-risk perspectives. Appl. Energy 2018, 230, 1065–1081. [Google Scholar] [CrossRef] [Green Version]
  9. Ling-Chin, J.; Roskilly, A.P. Investigating the implications of a new-build hybrid power system for Roll-on/Roll-off cargo ships from a sustainability perspective–A life cycle assessment case study. Appl. Energy 2016, 181, 416–434. [Google Scholar] [CrossRef] [Green Version]
  10. Wolfram, P.; Lutsey, N. Electric Vehicles: Literature Review of Technology Costs and Carbon Emissions; The International Council on Clean Transportation: Washington, DC, USA, 2016; pp. 1–23. [Google Scholar]
  11. JRC, R.E.; Hass, H.; Larivé, J.-F.; Jrc, L.L.; Maas, H.; Rickeard, D. WELL-TO-WHEELS Report Version 4; Publications Office of the European Union: Ispra, Italy, 2014. [Google Scholar]
  12. Ellingsen, L.A.-W.; Singh, B.; Strømman, A.H. The size and range effect: Lifecycle greenhouse gas emissions of electric vehicles. Environ. Res. Lett. 2006, 11, 054010. [Google Scholar] [CrossRef]
  13. Onat, N.C.; Noori, M.; Kucukvar, M.; Zhao, Y.; Tatari, O.; Chester, M. Exploring the suitability of electric vehicles in the United States. Energy 2017, 121, 631–642. [Google Scholar] [CrossRef]
  14. Bauer, C.; Hofer, J.; Althaus, H.-J.; Del Duce, A.; Simons, A. The environmental performance of current and future passenger vehicles: Life cycle assessment based on a novel scenario analysis framework. J. Appl. Energy 2015, 157, 871–883. [Google Scholar] [CrossRef]
  15. Simons, A.; Bauer, C. A life-cycle perspective on automotive fuel cells. J. Appl. Energy 2015, 157, 884–896. [Google Scholar] [CrossRef]
  16. Offshore Energy. Korea Plans Eco-Friendly Fuel Conversion for 140 Ships by 2030. 2019. Available online: https://www.offshore-energy.biz/korea-plans-eco-friendly-fuel-conversion-for-140-ships-by-2030/ (accessed on 17 July 2020).
  17. Korean Shipping Association. Coastal Shipping Statistical Yearbook in Korean. 2017. Available online: http://www.haewoon.or.kr/ksa/bbs/selectBoardArticle.do?nttId=252918&bbsId=B_000801&menuNo=&viewType= (accessed on 21 July 2020).
  18. Ferguson Marine; Ferguson Marine Engineering Ltd.: Glasgow, UK, 2016.
  19. Tiano, F.A.; Rizzo, G.; De Feo, G.; Landolfi, S. Converting a Conventional Car into a Hybrid Solar Vehicle: A LCA Approach. J. IFAC-Pap. 2018, 51, 188–194. [Google Scholar] [CrossRef]
  20. Teodoru, S. Rechargeable lithium-ion battery VL 34570—High performance D-size cylindrical cell. In Proceedings of the 2017 10th International Symposium on Advanced Topics in Electrical Engineering (ATEE), Bucharest, Romania, 23–25 March 2017. [Google Scholar]
  21. Buchmann, I. Batteries in a Portable World: A Handbook on Rechargeable Batteries for Non-Engineers; Cadex Electronics: Richmond, BC, Canada, 2001. [Google Scholar]
  22. Powersim Inc. PSIM User’s Manual Version 12; Powersim Inc.: Rockville, MD, USA, 2019. [Google Scholar]
  23. Lee, Y.-C.; Kim, J.-S.; Yun, Y.-S.; Jeon, H.-M. Analysis on thermal loss reduction on electric power propulsion system on board ship. In Proceedings of the 2016 IEEE Transportation Electrification Conference and Expo, Asia-Pacific (ITEC Asia-Pacific), Busan, Korea, 1–4 June 2016; pp. 929–934. [Google Scholar]
  24. Ning, G.; Popov, B.N. Cycle life modeling of lithium-ion batteries. J. Electrochem. Soc. 2004, 151, A1584. [Google Scholar] [CrossRef] [Green Version]
  25. Guena, T.; Leblanc, P. How depth of discharge affects the cycle life of lithium-metal-polymer batteries. In Proceedings of the INTELEC 06-Twenty-Eighth International Telecommunications Energy Conference, Providence, RI, USA, 10–14 September 2006; pp. 1–8. [Google Scholar]
  26. Zhang, Y.; Chow, M.-Y. Microgrid cooperative distributed energy scheduling (CoDES) considering battery degradation cost. In Proceedings of the 2016 IEEE 25th International Symposium on Industrial Electronics (ISIE), Santa Clara, CA, USA, 8–10 June 2016; pp. 720–725. [Google Scholar]
  27. ISO. Environmental Management: Life Cycle Assessment; Principles and Framework; ISO: Geneva, Switzerland, 2006. [Google Scholar]
  28. Wang, H.; Oguz, E.; Jeong, B.; Zhou, P. Life cycle and economic assessment of a solar panel array applied to a short route ferry. J. Clean. Prod. 2019, 219, 471–484. [Google Scholar] [CrossRef] [Green Version]
  29. Jeong, B.; Jang, H.; Zhou, P.; Lee, J.U. Investigation on Marine LNG Propulsion Systems for LNG Carriers through an Enhanced Hybrid Decision Making Model. J. Clean. Prod. 2019, 230, 98–115. [Google Scholar] [CrossRef]
  30. Sphera. GaBi Solutions: GaBi LCA Database Documentation 2020; Extension database II: Energy. 2020. Available online: http://www.gabi-software.com/support/gabi/gabi-database-2020-lci-documentation/extension-database-ii-energy/ (accessed on 21 July 2020).
  31. BP. BP Statistical Review of World Energy June 2017. London SW1Y 4PD. 2017. Available online: https://www.bp.com/content/dam/bp/en/corporate/pdf/energy-economics/statistical-review-2017/bp-statistical-review-of-world-energy-2017-full-report.pdf (accessed on 10 July 2020).
  32. Power, A.E. Fact Book. In Proceedings of the 43rd EEI Financial Conference, Huston, TX, USA, 6 November 2008. [Google Scholar]
  33. Hwang, S.; Jeong, B.; Jung, K.; Kim, M.; Zhou, P. Life cycle assessment of LNG fueled vessel in domestic services. J. Mar. Sci. Eng. 2019, 7, 359. [Google Scholar] [CrossRef] [Green Version]
  34. Wang, H.; Oguz, E.; Jeong, B.; Zhou, P. Life cycle cost and environmental impact analysis of ship hull maintenance strategies for a short route hybrid ferry. Ocean. Eng. 2018, 161, 20–28. [Google Scholar] [CrossRef] [Green Version]
  35. Tietge, U.; Díaz, S.; Mock, P.; German, J.; Bandivadekar, A.; Ligterink, N. From Laboratory to Road. A 2016 Update of Official and Real-World Fuel Concumption and CO2 Values for Passenger Cars in Europe; International Council on Clean Transportation Europe: Berlin, Germany, 2016. [Google Scholar]
  36. IMO. Third IMO Greenhouse Gas Study. In Executive Summary Final Report, London; International Maritime Organization: London, UK, 2014. [Google Scholar]
  37. Dreyer, L.C.; Niemann, A.L.; Hauschild, M.Z. Comparison of three different LCIA methods: EDIP97, CML2001 and Eco-indicator 99. Int. J. Life Cycle Assess. 2003, 8, 191–200. [Google Scholar] [CrossRef]
  38. Monteiro, H.; Freire, F. Life-cycle assessment of a house with alternative exterior walls: Comparison of three impact assessment methods. Energy Build. 2012, 47, 572–583. [Google Scholar] [CrossRef] [Green Version]
  39. Cavalett, O.; Chagas, M.F.; Seabra, J.E.; Bonomi, A. Comparative LCA of ethanol versus gasoline in Brazil using different LCIA methods. Int. J. Life Cycle Assess. 2013, 18, 647–658. [Google Scholar] [CrossRef]
  40. REN21. What are the Current Trends in Renewable Energy. 2019. Available online: https://www.ren21.net/what-are-the-current-trends-in-renewable-energy/ (accessed on 13 January 2020).
  41. IRENA. Renewable Electricity Capacity and Generation Statistics, IRENA: Abu Dhabi, United Arab Emirates, June 2018.
  42. IMO. ISWG-GHG 5/4/5: Consideration of concrete proposals on candidate short-term measures; Consideration on development of the lifecycle GHG/carbon intensity guidelines for all types of fuels; International Maritime Organization: London, UK, 2019. [Google Scholar]
  43. Kim, K.; Park, K.; Ahn, J.; Roh, G.; Chun, K. A study on applicability of Battery Energy Storage System (BESS) for electric propulsion ships. In Proceedings of the 2016 IEEE Transportation Electrification Conference and Expo, Asia-Pacific (ITEC Asia-Pacific), Busan, Korea, 1–4 June 2016; pp. 203–207. [Google Scholar]
Figure 1. Outline for the life cycle environmental assessment for battery ships and diesel ships: (1) fuel consumption measurements for diesel engine; (2) Emission measuring devices; (3) battery propulsion system modeling.
Jmse 08 00580 g001
Figure 2. Voyage route for the case ship.
Jmse 08 00580 g002
Figure 3. Engine power, rotation speed and operating time for each voyage.
Jmse 08 00580 g003
Figure 4. Mechanical propulsion system (diesel engine) schematic diagram.
Jmse 08 00580 g004
Figure 5. Electrical propulsion system (battery) schematic.
Jmse 08 00580 g005
Figure 6. Lifecycle modelling for electricity grid for South Korea.
Jmse 08 00580 g006
Figure 7. Overview of LCA for the case study.
Jmse 08 00580 g007
Figure 8. Energy sources for the electricity grid of South Korea [31].
Jmse 08 00580 g008
Figure 9. Lifecycle modelling of electricity production with various energy sources (modified from GaBi database 2019); (a) Nuclear, (b) coal, (c) Natural gas, (d) Oil, (e) Renewables (f) Hydro.
Jmse 08 00580 g009
Figure 10. Concept of onshore power supply system.
Jmse 08 00580 g010
Figure 11. Configuration of test bed.
Jmse 08 00580 g011
Figure 12. Results of emission measurements; (1) at 100 kW–55 rpm, (2) at 200 kW–100 rpm, (3) 500 kW–400 rpm phases.
Jmse 08 00580 g012aJmse 08 00580 g012b
Figure 13. Results of life cycle assessment: (1) GWP, (2) AP, (3) EP and (4) POCP.
Jmse 08 00580 g013
Figure 14. LCA results with various energy sources for electricity generation: (1) GWP, (2) AP, (3) EP and (4) POCP.
Jmse 08 00580 g014
Figure 15. LCA results with battery conversion scenario for 140 ships over ten years; (1) GWP, (2) AP, (3) EP, (4) POCP.
Jmse 08 00580 g015
Table 1. Case ship and its specifications (courtesy of Hallym Shipping Ltd., 15, Eogokgongdan 5-gil, Yangsan-si, Gyeongnam, Korea).
Jmse 08 00580 i001
ItemSpecification (Unit)
Design speed10 (Knot)
Gross tonnage69 (ton)
Outputs500 (kW) at 400 (rpm)
Operation time (voyage)72 (mins)
Ship length26.8 (m)
Breadth7 (m)
Draft1.9 (m)
Table 2. Battery discharge depth and times [21].
Depth of DischargeDischarge Times
100%500
50%1500
25%2500
20%4700
Table 3. Motor specification (courtesy of Hyosung Heavy Industry Ltd., Seoul, Korea).
ParameterValue (Unit)
Outputs500 (kW)
No. of Poles6
Rotation speed400 (rpm)
Stator resistance0.0045 (Ω)
Stator inductance0.0957 (H)
Rotor resistance0.007 (Ω)
Rotor inductance0.1486 (H)
Mutual inductance2.75 (H)
Moment of Inertia20.1 (kg·m2)
Table 4. Key emission factors associated with various energy sources for electricity generation (Unit: /1 kWh electricity production).
CategoryItemsCoalOilNatural GasHyoNuclearRenewables
PVWind
Major Emissions (kg)CO2 8.68 × 10−16.95 × 10−15.23 × 10−16.16 × 10−35.31 × 10−36.22 × 10−29.87 × 10⁻³
CO3.38 × 10−42.23 × 10−42.53 × 10−41.01× 10−56.24 × 10−68.32 × 10−53.48 × 10−5
NOx2.29 × 10−39.84 × 10−47.26 × 10−44.98 ×10−62.04 × 10−51.18 × 10−41.38 × 10−5
SOx1.46 × 10−41.68 × 10−31.94 × 10−43.05 × 10−61.65 × 10−51.73 × 10−41.48 × 10−5
PM101.01 × 10−41.90 × 10−61.66 × 10−61.80 × 10−64.82 × 10−63.96 × 10−52.49 × 10−6
PM2.52.04 × 10−51.50 × 10−52.23 × 10−53.73 ×10−74.56 × 10−72.18 × 10−59.42 × 10−7
Environmental potentialsGWP (kg CO2 eq.)9.12 × 10−17.06 × 10−15.65 × 10−16.24 × 10−35.68 × 10−36.71 × 10−21.05 × 10⁻²
AP (kg SO2 eq.)1.20 × 10−32.52 × 10−36.01 × 10−46.90 × 10−63.13 × 10−52.82 × 10−42.92 × 10⁻⁵
EP (kg Phosphate eq.)1.46 × 10−41.36 × 10−49.67 × 10−59.03 × 10−76.13 × 10−62.11 × 10−53.18 × 10⁻⁶
POCP (kg Ethene Eq.)9.09 × 10−51.45 × 10−46.79 × 10−53.80 × 10−72.62 × 10−62.45 × 10−51.04 × 10⁻⁶
Table 5. Results of fuel consumption measurements.
100 kW at 55 rpm200 kW at 100 rpm500 kW at 400 rpm
Inlet
(kg/h)
Return
(kg/h)
(kg/h)g/kWhInlet
(kg/h)
Return
(kg/h)
(kg/h)g/kWhInlet
(kg/h)
Return
(kg/h)
(kg/h)g/kWh
1st631.8981.6850.21251.1668.21554.24113.97227.9668.21554.24113.97227.9
2nd632.29581.5250.77253.9668.15554.03114.12228.2668.15554.03114.12228.2
3rd632.78581.5651.22256.1667.88554.05113.83227.7667.88554.05113.83227.7
4th633.52581.1852.34261.7667.78553.66114.12228.2667.78553.66114.12228.2
5th633.17580.7652.41262.1667.80553.99113.81227.6667.80553.99113.81227.6
Average51.39257.0Average113.97227.9Average113.97227.9
Table 6. Fuel consumption and emissions measured over various operating conditions.
Operation RouteDiesel SystemBattery System
Actual MeasurementIMO Analytic CalculationDeviation
(Actual vs. Analytic)
Fuel Consumption (kg)CO2 (kg)NOx (kg)CO2 (kg)NOx (kg)CO2 (%)NOx (%)Electricity
Consumption (kWh)
A-B8.9122.610.0828.600.78126.50%968.96%66.67
B-C40.05101.652.22128.563.48126.47%156.95%180.00
C-B40.05101.652.22128.563.48126.47%156.95%180.00
B-A8.8922.610.0828.540.77126.21%966.79%66.67
One Voyage97.92248.524.60314.268.52126.45%185.20%493.33
One Day391.68994.0818.401257.0434.08126.47%185.20%1973.32
(Four Voyages)

