Abstract
The DeepWater Horizon oil spill in the Gulf of Mexico (GoM) in 2010 raised the public awareness on potential spills from offshore exploration activities. It became apparent that knowledge of potential oil pathways in the case of a spill is important for preparedness and response. This study focuses on such scenarios from potential oil spills in the Cuban Exclusive Economic Zone (EEZ), a vast area in the GoM and the Straits of Florida that has not received much attention in oil spill studies, even though this region has been under evaluation for oil exploration. The Cuban EEZ is also in the crossroads of heavy tanker traffic, from the areas of intense oil exploration in the Northern GoM to the adjacent Caribbean Sea and Atlantic Ocean. The study also evaluates how the oil transport and fate are influenced by the main circulation patterns of the GoM, such as the Loop Current (LC) system and the mesoscale dynamics inside the Straits of Florida, such as the Florida Current (FC) and the accompanying cyclonic (along the northern Straits) and anticyclonic (along the Cuban coasts) eddies. We used oil spill numerical simulations, in tandem with high resolution data-assimilative ocean simulations, to test the fate of potential oil spills originating from different release sites within the Cuban EEZ during a six-year period (2011–2016) to exhibit certain aspects of interannual variability of ocean dynamics. The LC extended and retracted phases in the GoM interior revealed different impacts on the oil fate depending on the release site. The meandering of the FC, which is strongly related to the mesoscale eddies that evolve inside the Straits of Florida, controlled oil pathways either towards the northern Straits or along the Cuban coast. The most likely scenario for oil stranding at southern Florida is from oil released at the deep central Straits of Florida. Oil release near the Yucatan Strait and in the deep Gulf interior showed the highest risk of overall oil beaching at the Gulf beaches. The regional (e.g., LC) and local (e.g., eddies in the Straits) dynamics are proven to be significant indicators to predict the oil fate and stranding along the Gulf coasts, which should lead to improving planning and preparedness in the case of a spill in the Cuban EEZ.
1. Introduction
The Gulf of Mexico (GoM) is a major source of oil from offshore exploration in the United States, reaching 17% of the total US production [1]. Although the major activity has been over the northern GoM region, new potential exploration sites (Figure 1) were recently identified over the southeastern GoM, inside the Exclusive Economic Zone (EEZ) of Cuba [2].
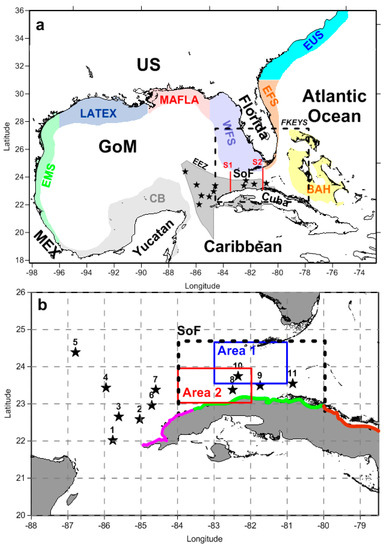
Figure 1.
(a) The Gulf of Mexico (GoM) domain of the GoM-HYCOM 1/50 simulations with the main geographical areas (United States: US; Mexico: MEX; Gulf of Mexico: GoM; Straits of Florida: SoF; Florida; Yucatan; Cuba), the adjacent seas (Atlantic Ocean and Caribbean Sea) and the respective major continental shelves (Eastern Mexico Shelf: EMS; Louisiana and Texas Shelf: LATEX; Mississippi, Alabama, and Florida Shelf: MAFLA; Western Florida Shelf: WFS; Campeche Bank: CB; Eastern Florida Shelf: EFS; Eastern US Shelf: EUS; Bahamas Shelf: BAH) as defined by the 200 m isobath. The grey shaded area around western Cuba represents the Petroleum leasing concession area [4]. The dashed black box indicates the domain of the FKEYS-HYCOM 1/100 simulations. (b) The star symbols mark the 11 locations of the potential oil exploration sites used in the study, the blue (Area 1) and red (Area 2) boxes indicate the regions of cyclonic and anticyclonic activity inside the SoF (dashed black box) and the red lines in (a) mark Sections S1 and S2. The northern Cuban coast is divided into three parts (Magenta: West of 83.5° W, Green: 83.5–80° W, and Brown: East of 80° W).
The first oil exploration attempts in Cuba were placed at Motembo in 1881 and more recently (in the 1980s) in Boca de Jaruco and Varadero [3]. The recent efforts have been exploratory, with some current oil drilling activity that is limited to coastal areas around Havana and Matanzas [2]. The potential offshore sites of drilling are located both along the Straits of Florida and within the GoM interior, extending to the Northwest, and around the Yucatan Channel, reaching south to the Caribbean Sea [4]. It has been estimated that approximately 4.6 billion barrels of oil are reserved in the northern Cuban basin [5]. Around 70% of this oil was estimated to be located no more than 80 km offshore of the western and northern coasts of Cuba [4]. The possibility of an oil spill is not only related to the offshore exploration but also to the heavy traffic of oil tankers and other ships at the cross-roads of GoM with the Atlantic Ocean and the Caribbean Sea.
The motivation for this study is that the possible implications from an oil spill within the vast Cuban EEZ, but also within the southeastern GoM and adjacent straits in general, are currently unknown. These potential offshore drilling sites, in an area of heavy maritime traffic, are in close proximity to Cuba, US, Mexico, and the Bahamas; the degree to which these countries could be impacted requires a study that combines oil spill scenarios with the understanding of the complex oceanic circulation over the exploration area. The study objectives are thus two-fold. We will quantify how much oil would be stranded over each part of the entire GoM and adjacent regions (southern US Atlantic coasts, Cuba, and the Bahamas), resulting from a possible oil spill in the Cuban EEZ. In addition, we will examine how these effects are influenced by the prevailing ocean circulation patterns.
Our study expands on a very limited number of previous published studies that have examined scenarios of oil spills in the Cuban EEZ. These studies mainly focus on oil effects within the Straits of Florida. Drouin et al. [6] based on a Lagrangian floating oil trajectory model, tested the release of oil from numerous sites inside the Straits and the effects within this region. Murawski et al. [7] tested a blowout scenario similar to the flow rate and period (spring to autumn of 2010) of the Deepwater Horizon accident, but only from one site at the western entrance of the Straits of Florida, (western tip of Cuba). Our study is the first one to take into account potential oil spills both in the Straits of Florida and the GoM interior, and to connect the petroleum pathways to all main ocean circulation features that prevail inside the GoM, Straits of Florida, Yucatan Channel, and the marginal region of the Atlantic Ocean. We employ high-resolution (~1.8 km), data-assimilative ocean circulation simulations over the entire Gulf, nested with very high-resolution (~900 m) simulations inside the Straits of Florida and state-of-the-art oil spill modeling, during a six-year period (2011–2016; six annual simulations starting on January 1st of each year). We present detailed test case studies from 11 characteristic oil release sites, which are spread over the entire Cuban EEZ (Figure 1). We investigate the connectivity of each oil release site to all regions of the GoM, the Southeastern US continental shelf, Cuba, and the Bahamas, connecting oil pathways to the prevailing ocean circulation. This study is based on scenarios of hypothetical oil spills. However, we expect that study findings will be valuable in case of an actual oil spill, based on the understanding of how the variability in ocean circulation over a number of years influences the oil pathways. The knowledge of how ocean circulation would impact oil pathways was critical during the DeepWater Horizon oil spill in 2010. French-McCay et al. [8] showed that the massive deployment of equipment applied during the DeepWater Horizon response was able to remove only a small fraction of the oil. A large number of studies (from academia, government, and the private sector) have shown how the ocean circulation, local and regional, in tandem with prevailing meteorological conditions, determined the oil pathways from this massive deep blow-out [9] in the northern GoM, near the Mississippi Delta, e.g., [10,11,12,13,14,15,16,17,18,19,20,21,22]. Another petroleum leakage from the bottom of the ocean, with a smaller outflow rate and which lasted for a much longer time (2004–2019), also took place close to the Mississippi Delta, after the destruction of the Taylor Energy platform by Hurricane Ivan [23,24,25,26]. River plume dynamics over the shelf and regional circulation determined the oil pathways from Taylor and especially their offshore spreading toward the central Gulf [27,28]. The connectivity between the northern and southeastern GoM is strong and is mainly controlled by the variability of the Loop Current (LC) system [29,30,31,32,33]. However, no clear evidence of oil from these two major leakages (one large and one long) was ever found over the southeastern GoM and the Straits of Florida, where several environmentally protected regions (especially fragile coral reef ecosystems) are located. Thus, we seek to understand how potential spills within the southeastern GoM and the adjacent straits would impact both neighboring and remote areas, guided by the oceanographic connectivity patterns.
The basin-wide circulation patterns of the GoM are related to the Gulf Stream and its regional branches that carry warm Caribbean waters into the Gulf before exiting to the Atlantic Ocean through the Straits of Florida. The branch within the GoM is the LC system that consists of the LC main body, the anticyclonic rings that periodically are shed from the main LC body (LC Eddy: LCE), and the cyclonic LC Frontal Eddies (LCFEs) that circulate around the LC. The branch inside the Straits of Florida is the Florida Current (FC) that exhibits a meandering pattern inside the Straits due to the evolution of anticyclonic eddies along Cuba (namely CubANs; [34,35,36]) and cyclonic eddies along the southern slope of the Western Florida Shelf (WFS; [37]). After its exit into the Atlantic Ocean, the FC turns northward along the Eastern Florida Shelf (EFS), feeding warm waters to the main Gulf Stream. The transport pathways of material such as sargassum, pollutants, and petroleum between remote areas of the Gulf and the Atlantic Ocean are strongly determined by these mesoscale circulation features in the Gulf and the Straits of Florida; the LCE detachment during the 2010 oil spill actually interrupted the southward spreading of oil towards the Atlantic [12]. We investigate the influence of the regional circulation on the fate of oil that might be released in the southeastern GoM. The knowledge of the ocean circulation features of the Gulf of Mexico [38] is a key factor for the assessment of the risk analyses regarding potential oil spills. The main question of this study is: Which oceanic processes of the Gulf can be used as indicators to predict oil spreading and stranding in the case of a severe oil spill in the Cuban EEZ.
Following the introductory Section 1, Section 2 includes the description of the ocean and oil spill models used in the study. The main circulation patterns (LC System and accompanying mesoscale features) and the oil spreading and pathways during the six-year study period are presented in Section 3. The effects of ocean conditions on oil pathways, the oil presence over the study shelves, and the stranding along the coastline (Gulf and adjacent Atlantic coast) are discussed in Section 4. The main concluding remarks are included in Section 5.
2. Methodology
2.1. Ocean Circulation Simulations
The hydrodynamic numerical simulation used in this study to discuss the prevailing circulation patterns during the six-year study period, is based on a modeling system with a hierarchy of implementations of the Hybrid Coordinate Ocean Model (HYCOM; hycom.org). The outer model is the operational GLoBal HYCOM (GLB-HYCOM 1/12° resolution, 32 vertical layers; [39]; https://www.nrl.navy.mil/). This is used for the Atlantic Ocean areas over the Southeastern US Continental Shelf and to provide boundary conditions to a regional implementation in the GoM at a higher horizontal resolution (1/50°) with 32 hybrid vertical layers (GoM-HYCOM 1/50). The GoM-HYCOM 1/50 was developed and has been implemented in a near-real time model by the Coastal and Shelf Modeling Group at the Rosenstiel School of Marine and Atmospheric Science (RSMAS), University of Miami (https://coastalmodeling.rsmas.miami.edu/), together with the Ocean Modeling and OSSE Center (OMOC) between RSMAS and the NOAA Atlantic Oceanographic and Meteorological Laboratory (AOML). The model covers the entire Gulf as well as a part of the Caribbean Sea, the Straits of Florida and a part of the Atlantic Ocean along Florida, Georgia and the Bahamas islands (Figure 1a). This HYCOM implementation is forced by the three-hourly winds, thermal forcing, and precipitation on the spatial resolution of 0.125° produced by the European Centre for Medium-Range Weather Forecasts (ECMWF; https://www.ecmwf.int/). Detailed description of the technical characteristics of the GoM-HYCOM 1/50 simulation (parameterizations, initial, boundary, and atmospheric forcing) and extended evaluation against non-assimilated in situ and satellite observations were conducted by Le Hénaff and Kourafalou [31] and Androulidakis et al. [33,35]. In order to increase the resolution of oil simulations in the Straits, we also used as forcing to the oil spill simulations, ocean fields from an even higher resolution (1/100°) ocean model that covers a vast area around the Straits of Florida (Figure 1a; Florida Straits, South Florida, and Florida Keys: FKEYS-HYCOM 1/100, with 26 vertical layers). Detailed information and data-based evaluation of the FKEYS-HYCOM 1/100 simulations were presented by Kourafalou and Kang [37], and Kourafalou et al. [34,40]. For this study, FKEYS-HYCOM 1/100 is nested within GoM-HYCOM 1/50 to provide a multi-nested modeling system for the oil spill simulations. We use the simulated six-hourly ocean fields for the 2011–2016 period to examine the prevailing ocean dynamics that might determine the oil pathways and fate after its release at 11 locations inside the petroleum leasing concession area [4] presented in Figure 1 (see Section 2.2). The six-year period is sufficient to represent the seasonal and interannual variability of the main circulation patterns (e.g., LC evolution, local circulation features in the Straits), which reveal significantly smaller occurrence periods, e.g., every 11.5 months for LCE detachments [41] and just a few days for the cyclonic and anticyclonic eddies in the Straits [34,37].
2.2. Oil Spill Simulations
OpenOil is part of the open source OpenDrift trajectory modeling framework [42], developed at the Norwegian Meteorological Institute and available as an open source software. OpenOil is a fully fledged three-dimensional oil drift and fate model and has been evaluated against drifter and oil slick observations in the North Sea [43,44]. OpenOil is used as the operational model for oil spill response in Norway (as well as several international applications, e.g., EU Copernicus NOOS-Drift ensemble service, https://odnature.naturalsciences.be/noosdrift/) and has many of the characteristics of planning and preparedness models (such as the SIMAP model from RPS/ASA [45,46] and the TAP model from NOAA [47]). The OpenOil model has recently shown an excellent agreement with satellite observations of the DeepWater Horizon oil slick for two seven-day simulations forced by the oceanic and meteorological outputs (including waves) from the high resolution GoM-HYCOM 1/50 (in the GoM), FKEYS-HYCOM 1/100 (in the Straits), and ECMWF models [19]. Details of the element tracking model are given by Dagestad et al. [42], and model physics that are specific to the oil transport and fate are documented by Röhrs et al. [44]. We choose here to use the term “Lagrangian element” to avoid confusion with the actual oil particles or droplets. Each oil element in OpenOil represents a certain volume of oil which contains an oil particle size distribution decided by the oil type and sea state (wave breaking in particular). Wind drift and Stokes drift from wave forcing is required to bring the oil to shore [48,49]. Each numerical element is transported according to the current, wind, and Stokes drift at its location and subjected to a random walk to model diffusion due to unresolved turbulence [44]. Here, we used the oil droplet size distribution provided by Li et al. [50] which has proven to give realistic results in the studies previously mentioned [19]. Rather than using a cutoff droplet size to set small particles as dispersed and large particles to remain at the surface, as is common in some oil drift model descriptions (e.g., [49,50]), we use vertical diffusion and buoyancy to resolve the resurfacing of particles explicitly. Environmental conditions then determine when particles of a given size resurface in a physically realistic way [43].
Oil weathering effects (evaporation, emulsification, vertical mixing, and dispersion by breaking waves) are included, following the approach by Hole et al. [19]. To calculate weathering of the oil, OpenOil interfaces with the latest version of the open source ADIOS oil library (github.com/NOAA-ORR-ERD/OilLibrary; updated 13 March, 2019). In addition to the parameterization of weathering processes, this software contains a database of measured properties of almost 1000 oil types from around the world. Hence, the oil is described as pseudo-components with different evaporation rates. Here, we used the Light Louisiana Sweet Crude oil type (similar to the DeepWater Horizon oil spill), with an initial density of 849.2 kg/m3 and viscosity of 0.01 mPa·s. We have also tested a heavier IFO 180 oil (not shown), where relatively small differences between the light and heavy oil occurred; it is found that meteorological and ocean conditions contributed more to the oil pathways and therefore experiments with other oil types are out of the scope of this study and are not discussed here. Figure 2 shows the mass balance and development of density and viscosity of the emulsion during a one-year simulation from Point 5, where each element represents 1 kg of oil. Biodegradation was not included in the version of OpenOil used here. For this light type, most of the oil will be at or near the surface, so that evaporation can be expected to be a dominating factor (Figure 2). The initial decrease in density here is probably due to the high ocean temperatures in this study. For a heavier oil, such as the tested IFO 180, only about 5% will evaporate in the same time frame, and a higher fraction of the oil will be subject to biodegradation and stranding. For the low density oil studied here, we assume that sedimentation will be of secondary importance. Nevertheless, biodegradation and sedimentation will be included in future versions of OpenOil.
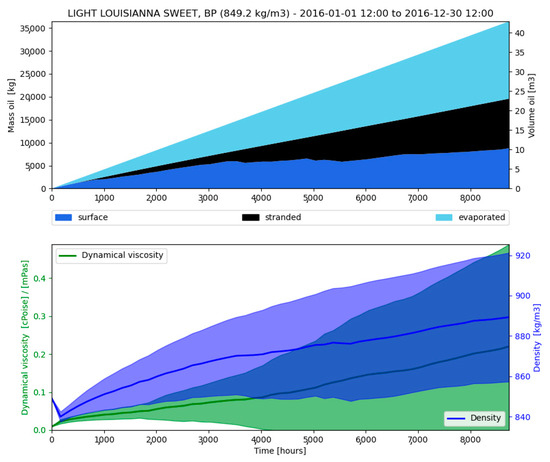
Figure 2.
Mass balance of one year (2016) simulation for Point 5 (upper panel) and the corresponding average and spread of oil mass density and viscosity (lower panel). Each oil element represents 1 kg of oil in this case and 100 elements are seeded per day.
OpenOil simulations were carried out for each of the exploration points shown in Figure 1b for each year of the period 2011–2016 (6 years × 11 sites = 66 annual simulations). A typical, short term oil drift simulation would involve 1000 elements or more [48]. However, the longer simulations [6] showed that seeding of 100 Lagrangian elements per day was sufficient for statistical stability and that increasing to 1000 elements only resulted in <1% difference in impact probability. Here, one hundred Lagrangian elements were released once every day at 00:00 GMT at the sea surface in each point starting on the first day of each year (January 1st) with a time step of 6 h. In OpenOil, the GSHHS database (http://www.earthmodels.org/data-and-tools/coastlines/gshhs) is used to define the coastline, and an element is considered stranded and will be deactivated once it hits the shoreline. Finally, no response operations were considered in these simulations, so the totality of the oil evolved freely.
3. Results
The main regional circulation patterns, derived from the six-year simulation period, are presented in Section 3.1. We computed the annual oil element density for each year of the simulation period (2011–2016), representing the number of elements that have been detected inside each model cell during the year. In Section 3.2, we present four test case studies from the release of elements at (a) Point 1 (near Yucatan Channel, ~2000 m depth), (b) Point 5 (deep GoM interior, ~2000 m depth), (c) Point 8 (near Northern Cuba, 1800 m depth), (d) Point 10 (in the Central Straits of Florida, 1400 m depth). The test cases were chosen as a characteristic of the different regimes that the 11 exploration points (Figure 1b) cover and for the differences in prevailing oceanic conditions, which will be discussed in detail. The first two points are dominated by LC influence, while the last two points are dominated by the variability of the FC branch inside the Straits of Florida, before the LC/FC system feeds into the main Gulf Stream in the Atlantic Ocean. In Section 4, we will discuss the cumulative results from all simulations (11 release points).
3.1. Mesoscale Ocean Dynamics (LC/FC System Variability)
The variability of the LC extension together with the major LCE shedding events during the 2011–2016 period are presented in Figure 3a. The LC variability is characterized by long extended phases in 2011, 2014, and 2015, while periods of retracted LC over the southeastern Gulf were mainly observed in 2012, 2013, and 2016. The mean annual axis of the LC, defined between the base of the LC in the Yucatan Channel (LC 17 cm contour along 22° N; Figure 3b) and its mean annual maximum latitude (Figure 3b), is used as a proxy for the overall annual position of the LC (Figure 3c). In addition, the “young” LC phases corresponded to the extended FC at the entrance of the Straits of Florida (Section S1; Figure 1a); during the retracted phases in 2012, 2013, and 2016, large LC axis angles (Figure 3c) and higher latitudes of the FC position along 83.5° W (>24° N; Figure 3a) were computed, in comparison to 2011, 2014, and 2015, when the FC evolved closer to the Cuban coast (<24° N; Figure 3a).
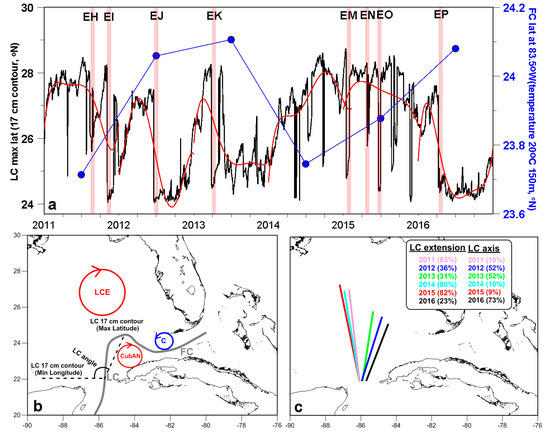
Figure 3.
(a) Daily evolution of the maximum latitude (°N; black line) of the Loop Current (LC) defined by the 17 cm Sea Surface Height (SSH) contour and annual means of the Florida Current (FC) latitude (°N; blue line) as derived from the location of the 20 °C temperature contour line at 150 m along the 83.5° W meridian (Section 1 in Figure 1a). The red shaded boxes indicate the major LC Eddy (LCE) detachments (Eddies Hadal: EH; Icarus: EI; Jumbo: EJ; Kraken: EK; Michael: EM; Nautilus: EN; Olympus: EO; Poseidon: EP). The red line indicates the 5th order annual polynomial fit of the LC time series. (b) Sketch of the definition of the LC axis and angle (dashed lines), showing the position of characteristic circulation features (LC, FC, anticyclonic eddies: LCE, CubAN, and a cyclone: C in the Straits of Florida). (c) Annual mean values of the LC axis angle for the 2011–2016 period. The annual frequency (%) of the LC extension and of the LC axis angle being larger than the respective long-term averages (LCmean extension = 26.25° N and LCmean axis = 100°), derived for the entire period (2011–2016), are also presented in (c).
The distinctive differences between each year with respect to the LC extension are also discussed based on the mean annual maps of simulated near-surface currents (Figure 4). The northeastward LC extension along the Western Florida Shelf (WFS) induced anticyclonic currents close to the northeastern corner of the Gulf (Figure 4a). Moreover, eastward currents due to westerly winds (see Section 4.1) prevailed over the MAFLA shelf in 2011 pushing surface waters towards the northern WFS. The two successive detachments of the Eddy Hadal and Eddy Icarus (Figure 3a) led to the persistent presence of anticyclonic circulation over the deep central Gulf in 2011 (Figure 4a). Northwestward currents prevailed over the MAFLA and WFS shelves in 2012, while the maximum LC evolved around 26° N and away from the WFS. 2013 is characterized by retracted LC phases (Figure 3a) and offshore currents over the WFS and MAFLA shelves (Figure 4c). The most extended phases of the LC occurred in 2014, reaching the 28° N south of the Mississippi Delta region and away from the WFS, which is characterized by offshore westward currents (Figure 4d); a clear anticyclonic circulation between the LC and the WFS at 27° N contributed to the transport of waters towards the northeastern region of the Gulf similarly to 2011 (Figure 4a). 2015 was a year with both most extended LC phases and three shedding events (Eddy Michael, Eddy Nautilus, Eddy Olympus; Figure 3a). The WFS was also characterized by northwestward along-shelf currents. On the contrary, in 2016, the prolonged retracted LC phases induced strong anticyclonic flows over the southeastern Gulf, where anticyclonic eddies (CubANs) evolved close to the northwestern Cuban coast (~84° W; Figure 4f). The formation of CubANs in 2016 agrees with results by Kourafalou et al. [34] and coincides with the retracted LC phases (Figure 3a), very large LC angle axis (larger than >100° for more than 70% of the year; Figure 3c), and northward shifts of the FC (24.1° N). The mesoscale anticyclonic (CubANs) and cyclonic eddies over the southern and northern Straits of Florida (Figure 3b), respectively, are strongly related to the meandering of the FC and moreover to the LC variability [34,35]. A mean anticlockwise circulation pattern, representing the evolution of cyclones along the northern Straits (~24° N), is also presented in Figure 4c (year 2013). The anticyclonic and cyclonic activity inside the Straits is strongly related to the Relative Vorticity (RV) distribution and oil pathways discussed in Section 4.1.
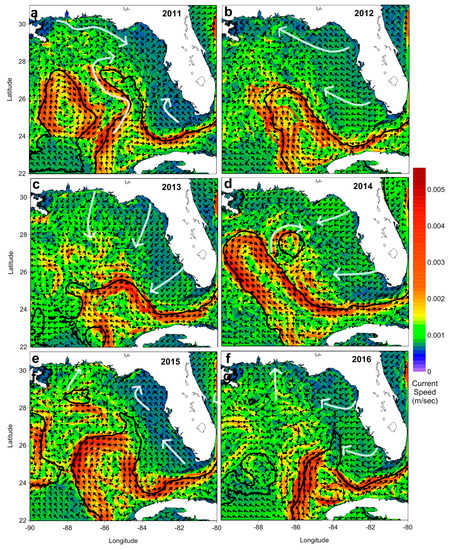
Figure 4.
Surface current vectors (black arrows) and the respective current speed in color (m/s), averaged for (a) 2011, (b) 2012, (c) 2013, (d) 2014, (e) 2015, and (f) 2016. The black lines indicate the anticyclonic features derived from the simulated mean annual Sea Surface Height (SSH) fields. The white arrows highlight the prevailing circulation that affects the MAFLA and WFS shelves.
3.2. Test Case Studies of Oil Element Simulations
The annual maps of the density of oil elements released offshore the western tip of Cuba in the Yucatan Channel (Point 1; Figure 1b) and at the northwestern tip of the EEZ (Point 5; Figure 1b) are presented in Figure 5 and Figure 6, respectively. Both sites are directly influenced by the LC system evolution. In particular, a potential leakage of oil at Point 1 is strongly affected by the LC at the entrance of the Gulf, while Point 5 is located either inside (extended LC) or outside (retracted LC) the main LC body. The annual density of oil elements released close to the northern Cuban coast (Point 8; Figure 1b) and offshore at the central Straits of Florida (Point 10; Figure 1b) is presented in Figure 7 and Figure 8, respectively. These two release sites are located in a region where the prevailing dynamics are controlled by the FC and the accompanying mesoscale eddies.
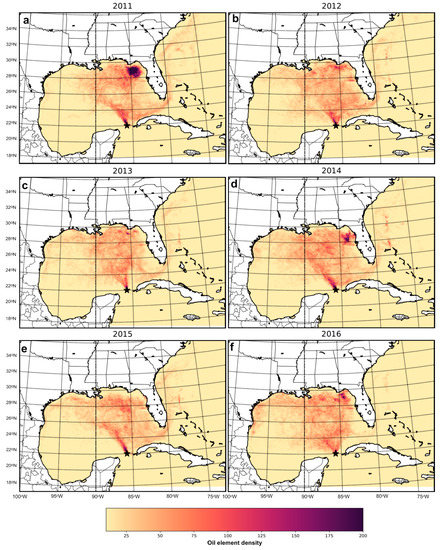
Figure 5.
Annual maps of the density of oil elements from the simulations where 100 oil elements were released daily at Point 1 (black star) for (a) 2011, (b) 2012, (c) 2013, (d) 2014, (e) 2015, and (f) 2016. Each grid cell in the plot is ~36 km2. All element positions are shown. If each Lagrangian element initially represents 1 ton of oil, 200 elements per grid cell will correspond to a ~2.5 mm oil layer assuming 50% oil mass loss (Figure 2). The values represent the sum of oil elements that crossed over each model cell during each year.

Figure 6.
Same as Figure 5 but for Point 5 for (a) 2011, (b) 2012, (c) 2013, (d) 2014, (e) 2015, and (f) 2016.
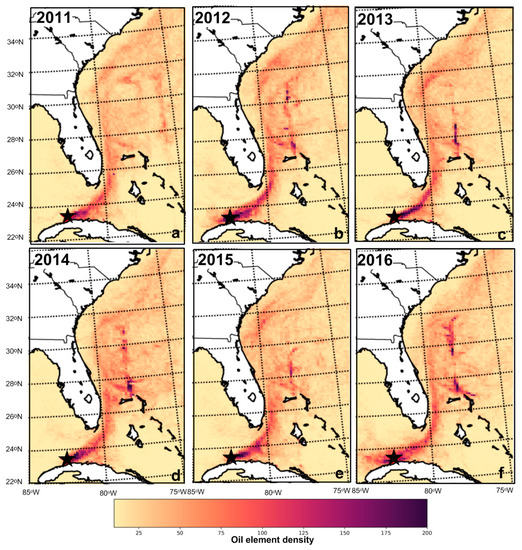
Figure 7.
Same as Figure 5 but for Point 8 for (a) 2011, (b) 2012, (c) 2013, (d) 2014, (e) 2015, and (f) 2016.
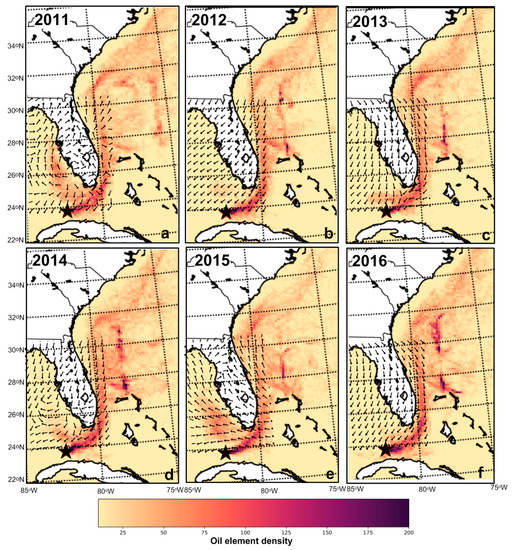
Figure 8.
Same as Figure 5 but for Point 10 for (a) 2011, (b) 2012, (c) 2013, (d) 2014, (e) 2015, and (f) 2016. The superimposed vectors indicate the annual mean distribution of wind direction over WFS and EFS shelves derived from the ECMWF fields.
3.2.1. Release Near Yucatan Strait (Point 1)
The Eddy Hadal and Eddy Icarus (Figure 3a) detachments and the accompanying anticyclonic circulation between 86° W and 90° W in 2011 (Figure 4a) are also depicted in the oil distribution (Figure 5a). A large number of oil elements (high oil element density) was aligned around the coherent LCEs with less oil element density closer to the core of the anticyclone (87.5° W, 26° N; Figure 5a). The majority of oil elements did not cross the front of the anticyclonic gyre toward its core but they rotated around its periphery. Despite the two LCE shedding events in 2011, a large number of oil elements also propagated toward the northern Gulf due the extended phases of the LC, especially during the first half of the year (>28° N; Figure 3a), increasing the oil element density over the northeastern Gulf (Figure 5a); the oil element density reached the levels of 200 over this region, corresponding to approximately 2.75 ton/km2 and 2.5 mm of oil thickness in the surface. The local currents in tandem with the winds that contributed to the accumulation of the elements over this region of the Gulf, will be discussed in Section 4.1.
Similar results were obtained during 2014, when a very large number of oil elements was detected at the same region (Figure 5d) due to the long periods of extended LC, especially during the second half of the year (Figure 3a and Figure 4d) and the anticyclonic circulation that prevailed west of the northern WFS (Figure 4d). The oil was entrained directly northward after its release at Point 1 and covered large areas over the deep eastern region and the northern shelves. In 2015, a year with three shedding events (Eddy Michael, Eddy Nautilus, Eddy Olympus; Figure 3a), the oil elements moved northward and were entrapped around the LCEs, similarly to 2011 (Figure 5). During the retracted periods of the LC (Figure 3a) in tandem with offshore currents (southward over the MAFLA shelf and westward over the WFS shelf; e.g., in 2013: Figure 4c), the majority of the oil elements mainly followed the clockwise (anticyclonic) turn of the “young” LC into the Straits of Florida (Figure 5). The alignment of the oil along the northern periphery of the “young” LC located south of the 26° N over the southeastern Gulf (Figure 4c) is clearly apparent in 2013 (Figure 5e), when the longest period with very low LC maximum latitudes occurred among all study years (Figure 3a).
3.2.2. Release in the Deep Gulf Interior (Point 5)
The oil that was released at the deep northern part of the Cuban EEZ (Point 5), an area that is not always directly affected by the LC (depending on the LC extension phase), revealed different dominant pathways (Figure 6) than the ones obtained from Point 1 (Figure 5), especially during the years characterized by the retracted LCs. In 2011, the extended LC, especially during the first half of the year, firstly dragged the oil toward the northern Gulf and then, in combination with the local ocean and meteorological conditions (see Section 4.1), increased the oil element density over the northeastern shelf. Eventually, oil elements moved toward the Straits of Florida, increasing the number of oil elements exiting to the Atlantic Ocean via the Straits. Similar results were obtained during 2014, when a large number of oil elements were identified in the Atlantic portion of our study area (Figure 6d) due to the significantly extended LC inside the GoM (Figure 3a). Only during extended LC periods (2011, 2014, and 2015), oil elements succeeded to exit into the Atlantic Ocean and were entrained northward along the Gulf Stream. “Young” LCs usually locate south of the release site (Point 5) and, therefore, a smaller number of oil elements were entrained by the currents into the Straits and into the Atlantic Ocean. In 2012, only a very small amount of petroleum reached the Straits of Florida, while the oil mainly spread over the broader Gulf without specific high concentrations in particular areas (Figure 6b). Especially in 2013 and 2016, no oil was detected in the Atlantic Ocean, while petroleum even reached the Louisiana-Texas (LATEX) shelf and the Eastern Mexico Shelf (EMS; see Figure 1a) under the influence of the broader circulation and wind conditions (Figure 6). During the years with retracted LCs (2012, 2013, and 2016), oil reached the coasts of the western Gulf away from the LC evolution, increasing the risk of oil beaching on the Mexican coasts (see Section 4.2). On the contrary, the oil element density revealed very low values over the western Gulf during the extended LC phases (2011, 2014, and 2015; Figure 6).
3.2.3. Release Near Northern Cuba (Point 8)
The main pathways of oil elements released at areas close to the northern Cuban coast (Point 8) are presented in Figure 7. This region is strongly affected by the meandering of the FC which is mainly determined by the formation and evolution of mesoscale eddies, anticyclonic along Cuba (CubANs; [34,35]), and cyclonic along the Dry Tortugas and the Florida Keys [37]. The prevailing pathway is eastward inside the Straits and northward after the exit to the Atlantic, following the FC evolution between Florida and the Bahamas. However, in 2012 and 2016, the density of oil elements reveals a different distribution in comparison to other years, with increased values both east and west of the release site; especially in 2016, the density levels are significantly high (>150) between Point 8 (82.5° W) and 85° W, an area where usually CubANs evolve (see Section 4.1).
3.2.4. Release in the Central Straits of Florida (Point 10)
The annual density of the oil elements released in the central Straits (Point 10) is presented in Figure 8. In all years, except 2011 and 2015, almost all oil elements followed the FC path towards the Atlantic Ocean similar to the elements released from Point 8, located close to the Cuban coast. The prevailing circulation over the southern WFS in 2011 and 2015 was characterized by northeastward currents (Figure 4a,e), which increased the density of oil elements in the WFS (Figure 8a,e). The density of oil elements per grid cell is around 100 over the shelf, representing the occurrence of approximately 1.25 mm of oil in the surface. The respective density value is significantly lower for the rest of the years over the same region (<50, i.e., less than 0.625 mm of oil). Although the main pathway of the oil is along the FC and towards the Atlantic Ocean, it is noted that the wind forcing over this area plays a critical role in the formation of oil pathways over the WSF (see Section 4.1).
4. Discussion
4.1. Influence of Ocean Circulation on Oil Pathways
We discuss the specific oceanographic conditions that influenced the results from the four test case studies presented in Section 3. The general circulation inside the Gulf, which is mainly determined by the LC variability, may control the oil pathways depending on the location of the release site inside the Cuban EEZ. However, the different phases of the LC in tandem with local dynamics (oceanic and meteorological) may alter the oil pathways revealing significant interannual differences between the study years. The existence of persistent LCEs may concentrate elements around their periphery with less oil element density closer to the core of the eddies; for example, the high occurrence frequency of LCEs in 2011 and 2015 was characterized by such oil pathways, especially for releases in the Yucatan Channel (Point 1).
The retracted LCs may carry oil elements directly from the Yucatan area into the Straits of Florida, while the elongated LCs might bring oil elements to the northern Gulf, where local dynamics control the circulation over the shelves. This was the case in 2011 (Figure 4a) when the concentration of oil over the northeastern Gulf (Figure 9b) mainly took place in only three months from July to September, when the prevailing winds were eastward (Figure 9d). This specific period is associated with the total annual high densities detected over this area (Figure 9d). The wind-induced near-surface currents, also apparent in the mean annual current fields presented in Figure 4a, determined the flow of waters across Section S3, imposing the prevailing eastward upper-ocean transport during July, August, and September (Figure 9a), and increased the oil element density at the eastern side of Section S3 (Figure 9d). On the contrary, the prevailing easterly winds during the six-month period from January to June (Figure 9c) and during October to December (Figure 9e) led to very strong westward currents (Figure 9a) and almost no oil presence over the northeastern corner of the Gulf. The LC extension over the northeastern Gulf (Figure 3a) and along the WFS slope, in combination with the westerly winds over the shelves in the summer, were the major factors of oil concentration at such distance from the release point area. On the contrary, the oil accumulation over the northeastern Gulf was weaker for longer periods (e.g., January–June) due to the absence of favorable meteorological (westerly winds) and ocean conditions (extended LC toward this region).
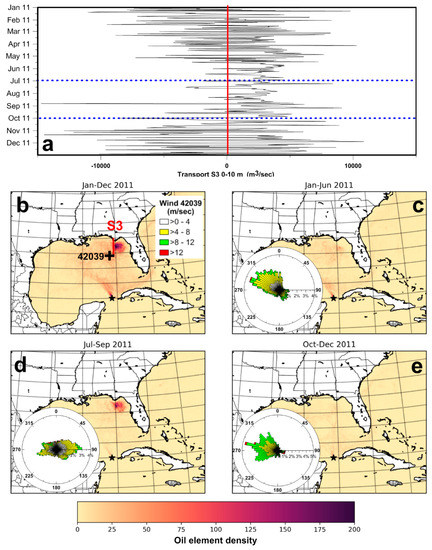
Figure 9.
(a) Daily time series of near-surface (0–10 m) transport (m3/s; positive is eastward) across Section S3 (red line in (b)) for 2011. Maps of the density of oil elements (see Figure 5 for description) released at Point 1 (black star) for (b) January to December, (c) January to June, (d) July to September, and (e) October to December. The distribution in (b) represents the sum of the three sub-periods. The rose diagrams of observed (NDBC 42,039 Buoy; black cross) wind vectors for each period are overlaid at each respective map. All element positions are shown. The July to September 2011 period is marked with blue dashed lines in (a).
In the cases of release in the deep northwestern tip of the EEZ (Point 5; Figure 1), the elongated LC may carry oil elements anticyclonically around its periphery and towards the Straits of Florida and into the Atlantic Ocean (e.g., 2011, 2014, and 2015). We conclude that the LC variability (retracted and extended phases) is a good indicator to predict whether oil released over the deep part of the Cuban EEZ would either reach the northern and western areas of the GoM (“retracted” LC phases) or travel toward the Straits into the Atlantic Ocean (“elongated” LC phases).
The retraction of the FC closer to the Cuban coast, which was directly related to the LC variation (extended LC phases with small axis angles) affected the transport of the oil elements from the western Cuban EEZ to the Straits; the largest number of total oil elements, released at Point 1, occurred for 2011 and 2015 (>20,000; Figure 10). The oil released at Point 5 revealed its strongest presence inside the Straits in 2011, 2014, and 2015, when the largest number of elements occurred (~24,000; Figure 10) in agreement with the oil element density distribution presented in Figure 6. On the contrary, the smallest number of elements was detected in 2012, 2013, and 2016 (<6000; Figure 10), when the largest LC axis angles occurred (Figure 10). The angle of the LC axis in 2012, 2013, and 2016 exceeded 100° more than 50%, 50%, and 70% of the year (Figure 3c), respectively, when the FC was extended north of 24° N (Figure 10). Although the extension of the LC towards the northern Gulf (“extended” phase, small axis angles) increased the oil presence over the northeastern part of the Gulf (Figure 5 and Figure 6), the oil presence also increased inside the Straits, probably related to the eastward flow of the FC closer to Cuba that also increased the stranding of oil along the Cuban coasts (see Section 4.2). Therefore, both the position (angle and length) of the LC axis and the corresponding FC position at the entrance of the Straits are also reliable indicators of the oil fate and presence inside the Straits of Florida in the case of oil spill in the Yucatan Channel (Point 1) and especially at the northern part of the Cuban EEZ (Point 5).
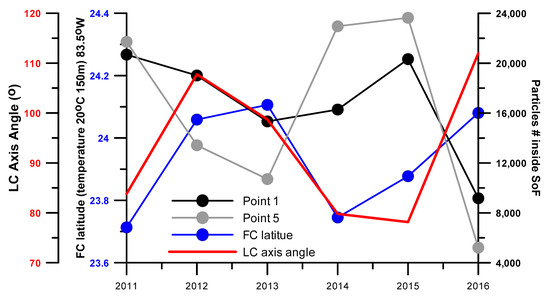
Figure 10.
Annual means of the Florida Current (FC; blue line) latitude as derived from the location of the 20 °C temperature contour line at 150 m along the 83.5° W meridian (Section S1, Figure 1a), annual mean values of the Loop Current (LC) axis angle (red line; described in Figure 3) and the total number of oil elements detected inside the Straits of Florida (dashed box in Figure 1b) released at Point 1 (black line) and Point 5 (grey line); see Figure 1b for the location of release points.
We now focus on the mesoscale dynamics that control the oil pathways inside the Straits of Florida, such as the FC and the accompanying anticyclonic and cyclonic eddies. The presence of such eddies, based on the RV variability, was evaluated for the 2011–2016 study period with respect to the FC variation and the respective effects on the presence of oil released from Point 8 (Figure 11), located at the south-central area of the Straits (Figure 1b). Cyclonic eddies usually cover the Straits region north of the FC (marked as Area 1 in Figure 1b) and contribute to the retraction of the FC away from the WFS and closer to the Cuban coast [37]. CubANs evolve along the northwestern coast of Cuba (marked as Area 2 in Figure 1b) extending the FC towards the northern Straits [34,35]. The cyclonic activity associated with a high positive RV in Area 1 coincides with periods of weak oil presence inside the Straits (Figure 11a). A large number of oil elements, released at Point 8, was identified in the Straits during the periods with small positive RV values and absence of cyclones (e.g., 2012). The impact of the anticyclonic activity, computed in Area 2, is described in Figure 11b. Here, contrary to the cyclonic activity, the presence of anticyclonic eddies (high negative RV values) coincides with the large number of oil elements inside the Straits. Kourafalou et al. [34], based on satellite data and numerical simulations, showed that the highest occurrence frequency of CubAN eddies was observed in 2016 (more than 80% of the year) as derived from data of a long period of 13 years (2004–2016). Especially in 2016, the number of oil elements was increased during the entire year, while the RV is characterized by a very long period of high negative values. The LC axis showed its highest mean annual values in 2012 and 2016 (Figure 10), associated with periods of retracted LC and high occurrence frequency of CubAN anticyclones. The entrapment of oil elements inside these anticyclones is apparent both in 2012 and 2016 (strong anticyclonic activity and high number of elements; Figure 11b) is also apparent in the oil density maps presented in Figure 7, where oil elements spread even at the western area of Point 8 (see Section 3.2). The relatively high Pearson coefficient [51] between the anticyclonic RV and the number of oil elements (r = −0.56) confirms the good correlation between the two variables. The formation of anticyclonic eddies, which is also related to the LC axis position, is also a good indicator for the oil fate and presence inside the Straits of Florida.
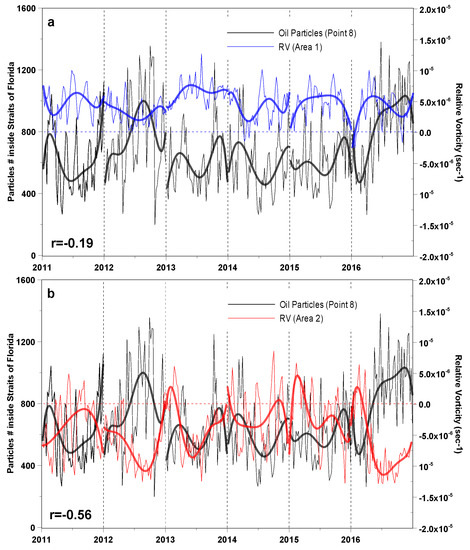
Figure 11.
Time series of weekly number of oil elements (black line) that were released at Point 8 and computed inside the Straits of Florida (dashed box in Figure 1b), overlaid with the respective Relative Vorticity (RV; s−1), averaged over (a) Area 1 and (b) Area 2. The annual polynomial fit (5th order) of each time series is also presented as a solid line. See Figure 1b for the position of Point 8 and definitions of Area 1 and Area 2.
The formation of CubANs is strongly related to the FC location, especially at the entrance of the Straits at 83.5° W (Section S1; Figure 1a). The evolution of the FC location during 2011–2016 confirms this relation, when the periods of extended FC (Figure 12a) match with the periods of CubAN activity (Figure 11b) and the large number of oil elements (Figure 12a), released at Point 8. In 2012 and 2016, the FC extended north of 24.3° N, very close to the shelf-slope of the WFS. The Pearson correlation coefficient between the FC latitude at 83.5° W (Section S1; Figure 1b) and the presence of oil elements is positive and relatively high (r = 0.60; pvalue < 0.0001), supporting the relation between the two variables at the entrance of the Straits (the linear fit is aligned to the x = y identity line; Figure 12b). On the contrary, the North to South variation of the FC at the eastern Straits, (Section S2 at 81° W; Figure 1a), is not an efficient indicator of the oil presence inside the Straits; a very low and statistically insignificant correlation coefficient was computed between oil elements and the FC position at that longitude (Figure 12c).
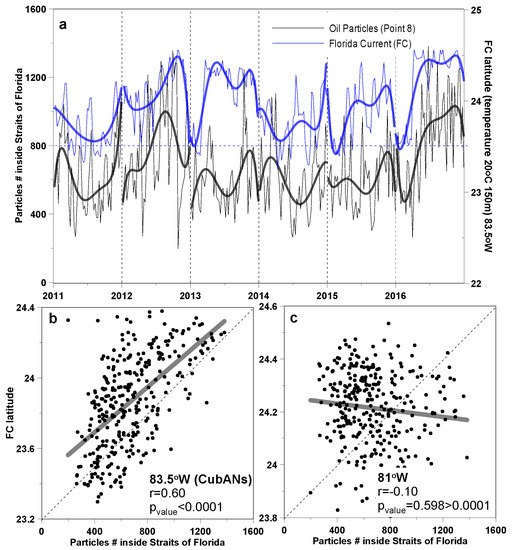
Figure 12.
(a) Time series of weekly number of oil elements (black line) that were released at Point 8 and computed inside the Straits of Florida (dashed box in Figure 1b) overlaid with the respective Florida Current (FC) latitude, derived as the location of the 20 °C temperature contour line at 150 m along 83.5° W (Section S1). The respective annual polynomial fit (5th order) for each time series is indicated with a solid line. Scatter diagrams between the element number and the FC latitude are shown along (b) 83.5° W (Section S1) and (c) 81° W (Section S2) meridians. The linear fits (thick grey line), the Pearson correlation coefficients r, and the pvalue are also presented in (b,c). See Figure 1a for the positions of Sections S1 and S2 and Figure 1b for the position of Point 8.
Here, the pathways of the oil toward the eastern and the northern Straits of Florida, along the Florida shelves (southern WFS and EFS; Figure 1a), and eastern US coasts (EUS; Figure 1a) in the Atlantic are investigated. The surface circulation over the inner WFS (closer to the coast) is strongly influenced by the local winds [52], especially the prevailing northeasterly winds that enhance the southwestward component of the surface currents. The southward flows on the outer shelf are also affected by the southward currents of the LC eastern boundary [53]. In both 2011 and 2015, the oil is spread along the inner shelf and close to the western Florida coast, after its removal from the FC in the area south of the Florida Keys due to the easterly winds that are opposed to the eastward FC (Figure 8a,e). The domination of northward winds over the shelf during these two years (Figure 8a,e) resulted in the formation of northward surface currents (Figure 4a,e) and the increase of oil density between 24 and 28° N (Figure 8a,e). On the contrary, although the prevailing winds over the Straits were also easterly during most of the years (2012, 2013, 2014, 2016), favoring the northwestward removal of oil towards the shelf, the prevailing winds over the inner shelf were northeasterlies (Figure 8), resulting in the domination of offshore flows (Figure 4) that remove the oil from the shelf and significantly reduce the density of oil elements over the WFS (Figure 8). The prevailing easterly winds (Figure 8a) removed oil elements from the FC-induced oil pathway in 2011, although the FC revealed its most distant location from the WFS shelf, as derived from the latitude of the 20 °C isotherm at 150 m along 81° W (Figure 13a). During the following years (2012, 2013, and 2014), the FC evolved closer to the shelf (Figure 13a) in comparison to 2011, but the absence of strong southerly winds reduced the risk of oil advection towards the WFS (Figure 8). The different distribution of oil elements in 2015 is strongly related to both the evolution of the FC over the shelf slope (>24.25° N; Figure 13a) and the prevailing southeasterly winds over the southern shelf (Figure 8e). The highest FC latitude with 1st and 3rd quartiles closer to the mean is computed for 2015, indicating the prolonged presence of the FC along the Florida Keys and the WFS slope (Figure 13a). An example of the oil pathways along the southern shelf slope due to the FC proximity is presented in Figure 13b (May 2015). A cyclonic eddy, associated with a patch of high positive RV at 83° W (Figure 13d), might also have contributed to both the FC meandering (low FC latitude at 83.5° W and high FC latitude at 81° W; Figure 13b), in agreement with Kourafalou and Kang [34], and the direct northeastward spreading of the oil along the Florida Keys. The synergy between the FC proximity to the shelf, the southeasterly winds, and the cyclonic circulation of this eddy contributed to the spreading of oil over the southern WFS that was mainly detected east and north of the eddy (Figure 13b). This mesoscale cyclone at 83° W also dragged a small number of oil elements directly from 25.5 to 23° N along the 84° W meridian where a patch of negative RV (cyclonic circulation: Southward flows) was detected between the LC and the cyclone (Figure 13d). On the contrary, the southern (distant from the Florida Keys) position of the FC (~81° W) in February 2011 (Figure 13c) contributed to the formation of oil pathways toward the central Cuban coast before its exit to the Atlantic Ocean. The variation of the FC location played a role on the movement of oil closer (Figure 13b) or away (Figure 13c) from the southern tip of Florida (81° W). For example, the evolution of the FC close to the Upper Florida Keys at 81° W in May 2015 led to the formation of an oil pathway along the southeastern Florida coasts (25–26° N in Figure 13b). On the contrary, the increase of the FC distance from the shelf in February 2011 formed an oil pathway away from the southern Florida coasts (Figure 13c).
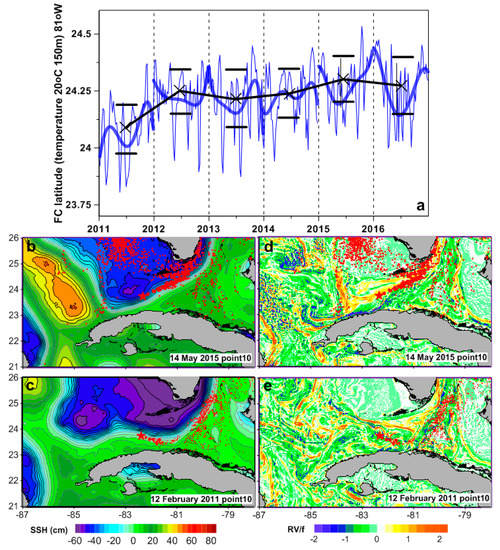
Figure 13.
(a) Weekly position (thin blue line) of the Florida Current (FC) derived from the latitude of the 20 °C isotherm at 150 m along 81° W (Section S2; Figure 1a). The annual polynomial fit (5th order; thick blue line), the annual mean (marked with X), and the 1st and 3rd quartiles of each year are included. Sea Surface Height (SSH; cm) on (b) 14 May, 2015 and (c) 12 February, 2011. Surface Relative Vorticity (RV) normalized with the Coriolis frequency on (d) 14 May, 2015 and (e) 12 February, 2011. The locations of oil elements (red dots), released at Point 10 (red star), are also overlaid.
The northward oil pathways in the Atlantic Ocean and along the Eastern Florida coasts are mainly determined by the respective northward transport and location of the FC as it evolves northward along the eastern Florida coasts. The onshore (close to eastern Florida) and offshore (close to the Bahamas) mean annual position of the FC, as derived along four successive zonal sections (26, 27, 28, and 29° N), is presented in Figure 14a. Proximity of the FC to the eastern Florida coast was detected in 2015. This condition was also depicted on the oil presence over the narrow EFS coastal area (Figure 1a), resulting in the highest number of elements for EFS (Figure 14b; ~10,000) and high stranding rates along the eastern Florida coasts (see Section 4.2.2). The onshore evolution of the FC in 2015 also determined the strong oil presence over the downstream EUS shelf (~14,000). The most offshore position of the FC was observed in 2011 (Figure 14a), when the number of oil elements over the EFS area was significantly smaller (~4000; Figure 14b). The position of the FC (away from Florida) both in the Straits (Figure 13a) and in the Atlantic (Figure 14a) together with upwelling-favorable southerly winds over the EFS in 2011 (Figure 8a) kept the oil away from the Florida coast.
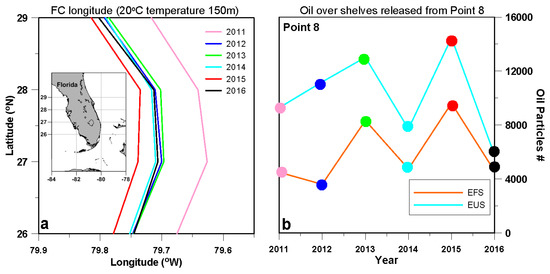
Figure 14.
(a) Florida Current (FC) longitude, as derived from the 20 °C temperature contour line at 150 m along 26, 27, 28, and 29° N in the Atlantic Ocean (map in the insert) and averaged for each year during the 2011–2016 period. (b) Annual number of oil elements released at Point 8 (Figure 1b) detected inside the Eastern Florida Shelf (EFS; orange line) and Eastern US (EUS; blue line). The dot color in (b) represents the respective year presented in (a).
4.2. Estimates of Oil Presence and Stranding
The strong variability of the ocean circulation patterns in the Gulf, in tandem with the prevailing meteorological conditions, may determine the fate and pathways of the oil spill from the future exploration sites inside the EEZ of Cuba. We quantify the risk of all the Gulf’s shelves and coasts in relation to the potential oil spill site by computing the respective occurrence frequencies of oil presence and stranding. The goal is to identify the main oil pathways from the potential exploration sites and detect the Gulf and Atlantic shelves and coastal regions that could be exposed to the highest risk of oil presence and stranding with respect to the different leakage sites and ocean circulation variability.
4.2.1. Oil Presence Over the Shelf Areas
The mean location of the oil elements released from all potential exploration sites during the entire study period (2011–2016) is presented in Figure 15 for all the shelf study areas. We show only the location of elements with a total number greater than 25,000 (the sum of oil elements “detected” over the shelf) during the six-year period (Figure 16). The oil detected over the shelf areas from the southwestern to the northern GoM (CB, EMS, LATEX, MAFLA) is localized over a relatively small region, regardless of the release point. The connectivity of these remote regions with the Cuban EEZ is mainly based on the LC system variability. The highest number of elements over the EMS (in green) was related to oil that originated from Points 1, 3, 4, and 5 (Figure 16) and is usually aligned over the northward bound (western boundary) of the LC, as presented in Section 3.1. The release of oil at these four sites led to a large number of oil elements (>100,000; Figure 16) over the central LATEX (~93° W); the release from the eastern part of the Straits (e.g., Point 11) revealed a very low number of elements (Figure 16) over all continental shelves in the GoM (CB, EMS, MAFLA, LATEX, and WFS). Only the release from the north-central Straits of Florida (Point 10) affected the concentration of oil over the southern WFS shelf (Figure 15) under processes discussed in Section 4.1. The mean concentration area of the MAFLA shelf is located away from the Mississippi River Delta, along the shelf-slope of the northeastern GoM (~86° W; Figure 15). Conversely, the mean concentration on the LATEX shelf is detected at the center of the shelf (~28° N) and closer to the Atchafalaya outflow and Mississippi Delta (~92° W; Figure 15). This is connected to the prevailing buoyancy-driven flows around the Mississippi Delta that are northeastward with an offshore transport tendency in MAFLA, while westward with an onshore transport tendency in LATEX [54,55,56].
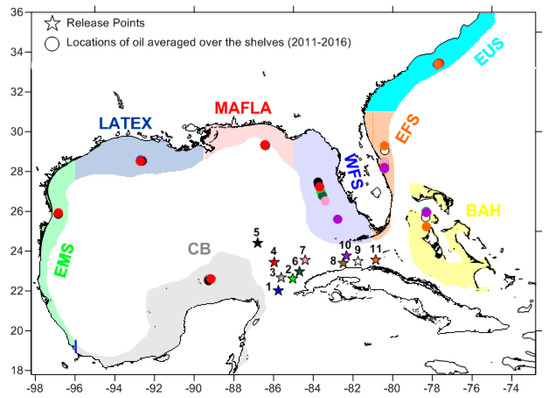
Figure 15.
Mean location (2011–2016) of all oil elements that passed over each shelf region derived by averaging the coordinates of these elements within its shelf area. Only the shelf regions for which the number of oil elements that reached them was larger than 25,000 are plotted. Each release point is indicated by a different color (colors match the release points marked as star symbols; Point 1: Blue, Point 2: Light green, Point 3: Grey, Point 4: Red, Point 5: Black, Point 6: Dark green, Point 7: Purple, Point 8: Brown, Point 9: White, Point 10: Magenta, Point 11: Orange). The continental shelf areas, delimited by the 200 m isobath, are presented (Eastern Mexico Shelf: EMS; Louisiana and Texas Shelf: LATEX; Mississippi, Alabama, and Florida Shelf: MAFLA; Western Florida Shelf: WFS; Campeche Bank: CB; Eastern Florida Shelf: EFS; Eastern US Shelf: EUS; Bahamas Shelf: BAH). Note that certain positions represent overlapping mean locations with more than one release points (see Figure 16 and text for details).
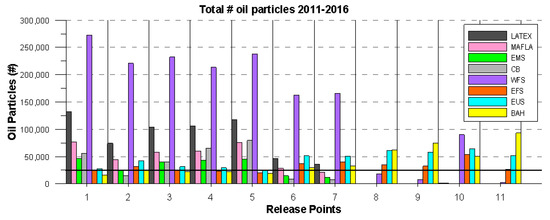
Figure 16.
Total number of oil Lagrangian elements (all release points in Figure 1) detected in the continental shelf areas (Figure 1a and Figure 15; Eastern Mexico Shelf: EMS; Louisiana and Texas Shelf: LATEX; Mississippi, Alabama and Florida Shelf: MAFLA; Western Florida Shelf: WFS; Campeche Bank: CB; Eastern Florida Shelf: EFS; Eastern US Shelf: EUS; Bahamas Shelf: BAH) for the 2011–2016 period. The threshold of 25,000 oil elements is marked with a horizontal solid black line.
Generally, the highest numbers of oil elements were computed for the WFS (Figure 16), which is located very close to the exploration sites and is usually aligned with the southward bound (eastern periphery) of the LC. Approximately 40% of the total oil elements from all sites and years ended up over the WFS. The largest total numbers of oil elements with a sum greater than 200,000 during the six years (Figure 16), originated from the western release points that are directly affected by the LC evolution (Points 1, 2, 3, 4, and 5). However, the release sites inside the central Straits (8, 9, and 11) revealed low occurrence frequency (<25,000) over the WFS, except Point 10 (~90,000; Figure 16), located closer to the shelf, as presented in Section 4.1. The smallest percentage was derived for EMS (~5%) among all the study shelf regions. The Bahamas shelf was more affected by oil released over the eastern Straits of Florida (>100,000; Points 8, 9, 10, and 11), where oil elements were entrained by the northward FC inside the Atlantic Ocean. The same release points also affected the EFS and EUS shelves. Generally, it is concluded that the shelf areas with a strong variability of the mean locations of the oil elements (Figure 15) are the Florida shelves (WFS and EFS) and the Bahamas (BAH) due to their proximity to the Cuban EEZ and the effects of all the dynamics that prevail in the Straits of Florida.
4.2.2. Oil Stranding at the Gulf and Atlantic Coasts
The annual occurrence frequency of the oil stranding along the entire coastal zone of the study region (Gulf and Atlantic coasts) is presented in Table 1. The release sites with the highest occurrence frequencies of stranding are Points 1 and 5, which are accounting for approximately 20% of stranded oil derived from all years. The smallest stranding occurrence frequency is derived for Point 10 (7.1%) located over the north-central Straits of Florida, an area that is mainly controlled by the northern shift of the FC. The highest value for Point 10 (Table 1) was computed for 2015 (8.1%), when the FC was at its northernmost position on average, closer to the northern Straits (Figure 13a), dragging more oil eastward and leading to increased stranding along the Florida Keys (17%), the Eastern Florida (30%), the Bahamas (15%), and Eastern US (17%) coasts (Table 2). In addition, the highest occurrence frequency for stranding at the Miami coastal area and Florida Keys during almost all years is from oil elements released at Point 10 (Table 2). This is in agreement with Drouin et al. [6] that showed that drilling sites at the center of the Straits of Florida might show the largest impact on southern Florida.

Table 1.
Annual percentages (%) of stranded oil elements for the entire coastline, released from the 11 study points (Figure 1).
Table 2.
Annual percentages (%, red fonts mark the cases greater than 15%) of oil elements released from the 11 study points stranded at specific coastlines: A: N Cuba (80–83.5° W), B: NE Cuba (East of 80° W), C: NW Cuba (West of 83.5° W), D: Florida Keys, E: Miami Area (25–27° N), F: E Florida (North of 27° N), G: W Florida, H: Bahamas, I: E US, J: Yucatan, K: N Gulf (MAFLA and LATEX), L: W Gulf. All the coastlines are associated with the shelf regions presented in Figure 1.
The highest stranding rates were computed for the Northern Cuban coast (80–83.5° W; Figure 1b) with significant high percentages (Table 2) especially in 2011 and 2014 (e.g., the stranding oil from the release Point 11 in 2011 over Cuba consisted of 58% of the entire stranding oil during that year from this point). These years are associated with elongated LC phases and respective retracted FC positions (Figure 3a), closer to the Cuban coast, as presented in Section 3.1. Northern Cuba is more affected by sites close to its shore (e.g., Points 8, 9, and 11; Table 2) in agreement with Drouin et al. [6]. However, even distant sites such as Points 4 and 5, revealed high occurrence frequencies of oil elements stranding over this area in 2011 and 2014. Focusing on Point 5, the annual time series of the stranding rates along the Northern Cuba region are presented in Figure 17. The highest values occurred during six periods over all study years, coinciding with respective periods with an extended LC (more northern latitudes) inside the Gulf (Figure 17). The northern latitudes of the LC extension affected the transport of oil from the northernmost release site (Point 5) along the LC path (see Section 3.2), bringing petroleum inside the Straits of Florida and closer to the Cuban coast. The extended phases of the LC also coincide with the retracted FC positions close to Cuba (Figure 3a) that may enhance the advection of oil elements closer to the local coasts, increasing the risk of stranding. However, the stranding along the Cuban coast was mainly restricted over the central coast, while very low rates occurred (Table 2) along both eastern (east of 80° W) and western coasts (west of 83.5° W).
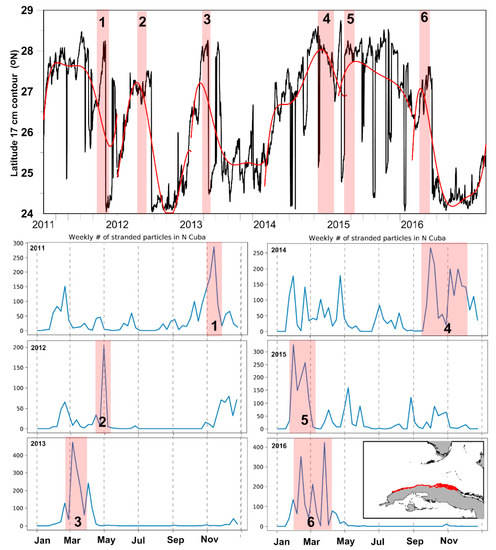
Figure 17.
Daily evolution of the maximum latitude (°N) of the Loop Current (LC) defined by the 17 cm Sea Surface Height (SSH) contour (upper panel). The red line indicates the 5th order annual polynomial fit of the LC time series. The red shaded boxes indicate the six periods with an extended LC and increased quantities of stranded oil (released at Point 5, Figure 1b) along the northern coast of Cuba (80–83.5° W; Figure 1b), presented for each year (lower six panels). The insert map presents the coastal area of northern Cuba where stranding was computed, colored in red.
Finally, the risk of stranding is generally very low over the Yucatan and Western Gulf coasts but is higher over the Northern Gulf coasts, as shown by the high occurrence frequencies of stranding from oil that was mainly released from the western part of the Cuban EEZ (e.g., Points 1 and 5; Table 2). The retracted LC phases in 2012, 2013, and 2016 permitted the oil transport from the northwestern EEZ (Point 5) toward the western Gulf, as presented in Section 3.2 (Figure 6), increasing the risk of oil stranding along the Mexican Gulf coast (Table 2). The eastern Florida coast (north of 27° N) was significantly affected in 2015 (all release points showed high occurrence frequencies of stranding elements; Table 2), when the FC evolved closer to the respective eastern Florida coasts (Figure 14a).
5. Conclusions
We used high resolution data-assimilative ocean simulations and state-of-the-art oil spill simulations to investigate the fate of potential oil spills originating from the future exploration sites inside the Straits of Florida and the southeastern Gulf of Mexico (GoM). In particular, we investigated the effects of the main ocean circulation features of the GoM on oil pathways and discussed the connectivity between different release sites in the Cuban Exclusive Economic Zone (EEZ) and all GoM shelf and coastal regions.
The regional and local ocean dynamics are proven to be significant indicators to predict the oil fate and stranding along the Gulf’s coasts, which should lead to improving planning and preparedness in the case of a spill in the Cuban EEZ. The Loop Current (LC) extended and retracted phases revealed different impacts on the fate of oil, depending on the release site. The axis of the LC (length and angle) is a good indicator to predict if oil released in the western Straits of Florida would either reach the remote northern and western shelves of the Gulf (extended LC phases correspond to westward LC axis tilts) or travel directly eastward along the Florida Current (FC), reaching the Gulf Stream in the Atlantic Ocean (retracted LC phases correspond to eastward LC axis tilts). During the small LC axis angles, the oil presence over the northeastern Gulf was enhanced when the oil leakage was located in the Yucatan Channel or in the northwestern tip of the Cuban EEZ. Moreover, under the same LC axis conditions (extended LC phases) the oil stranding increased along the northern Cuban coast related to the proximity of the FC closer to Cuba. The LC axis, due to its association with the anticyclonic eddies inside the Straits of Florida, is also a good indicator for the fate of oil spills, that originated inside the Straits; large LC axis angles (retracted LCs) are related to the strong anticyclonic eddy activity along the Cuban coast and thus entrapment of more oil inside the Straits. The most affected area, from almost all the tested release sites, is the adjacent northern coast of Cuba. The meandering of the FC under the effects of the accompanying anticyclones over northwestern Cuba [34] and the cyclones along the southern Western Florida Shelf (WFS) slope [37] control the presence of oil in the Straits of Florida, the oil pathways inside Atlantic waters between Florida and the Bahamas, and the oil beaching on the local coasts. Wind conditions over the WFS, along with the FC proximity to the shelf, determine the oil pathways over the southern WFS region. The northern WFS can also be affected by oil under the influence of an extended LC, if the LC is also close to the WFS shelf slope, and by westerly winds that favor the near-surface eastward along-shelf transport over the northeastern Gulf.
The oil stranding at the coasts revealed a strong variability between the various release sites and prevailing ocean conditions. The oil release at the western tip of Cuba (e.g., Point 1) and at the northwestern tip of the EEZ (e.g., Point 5) showed the highest risk of oil beaching. The smallest risk was computed for oil originating from the central and northern part of the Straits of Florida (e.g., Point 10). The northern coast of Cuba was mainly affected by oil released close to the shore, especially when the FC evolved close to Cuba. The FC position also determined the stranding in the Atlantic coasts of Florida.
We showed that the regional circulation in the GoM, including LC, FC, and associated eddies (especially anticyclonic LC rings and cyclonic frontal eddies), controls the connectivity between the southeastern Gulf and remote regions, either within the Gulf or at the adjacent Atlantic Ocean. Important new findings include the connectivity between remote coastal regions, as oceanic currents over the deep areas can facilitate the cross-marginal transport of materials not only locally, but also regionally. These findings form a broader and more challenging view for the management of coastal marine resources that should be integrated for preparedness and response in the case of a spill. It is noted that this six-year study is a demonstration of the ocean dynamics that play a role in oil trajectories in this area while full preparedness for possible oil spills in Cuban waters would require longer simulations with all oil processes included. These results confirmed that operational oil spill forecasting should employ modeling systems that cover the broader large-scale circulation, while also having a high-resolution within the immediate area of interest, to take into account the details of the local processes. Understanding both the predictions made by numerical models and their potential errors or uncertainties is very important in operational modeling. Collecting more observations for data assimilation into operational models may reduce uncertainty, especially in regions such as the GoM, where the LC system is a chaotic feature difficult to predict. The methodology described here should be part of best practices in any region of oil exploration, helping to advance the understanding and predictability of oil trajectories over pathways from the deep to the coastal environment and vice versa.
Author Contributions
Conceptualization, Y.A. V.K., L.R.H. and M.L.H.; Methodology, Y.A., V.K. and M.L.H.; Software, L.R.H., M.L.H. and H.K.; Validation, Y.A. and L.R.H.; Formal analysis, Y.A. and L.R.H.; Investigation, Y.A., V.K., L.R.H., M.L.H. and H.K.; Resources, L.R.H. and H.K.; Data curation, Y.A., L.R.H., M.L.H. and H.K.; Writing—original draft preparation, Y.A.; Writing—review and editing, Y.A., V.K., L.R.H., M.L.H. and H.K.; Visualization, Y.A. and L.R.H.; Supervision, V.K.; Project administration, V.K.; Funding acquisition, V.K. and L.R.H. All authors have read and agreed to the published version of the manuscript.
Funding
This research was made possible in part by a grant from The Gulf of Mexico Research Initiative (#G-231819) and in part by the National Academy of Sciences, Engineering and Medicine (Gulf Research Program UGOS #2000011056). Additionally, M. Le Hénaff received partial support for work on this publication by NOAA/AOML and was supported in part under the auspices of the Cooperative Institute for Marine and Atmospheric Studies (CIMAS), a cooperative institute of the University of Miami and NOAA (agreement NA10OAR4320143).
Acknowledgments
Atmospheric data were derived from the European Centre for Medium-Range Weather Forecasts (https://www.ecmwf.int). The data from the ocean and oil simulations are available through The Gulf of Mexico Research Initiative Information and Data Cooperative (DOI: 10.7266/n7-e1mg-8e73, DOI: 10.7266/n7-ctpa-q845, DOI: 10.7266/n7-s3t7-ab53, DOI: 10.7266/n7-a6wv-rj68, DOI: 10.7266/n7-3s8f-m404, DOI: 10.7266/n7-0gwc-ex81, DOI: 10.7266/n7-3vmj-nk86; https://data.gulfresearchinitiative.org/). We thank three anonymous reviewers for their constructive comments that helped improve the manuscript.
Conflicts of Interest
The authors declare no conflict of interest.
References
- US Energy Information Administration. U.S. Gulf of Mexico Crude Oil Production to Continue at Record Highs through 2019. Today in Energy, 11 April 2018. Available online: https://www.eia.gov/todayinenergy/detail.php?id=35732# (accessed on 6 June 2020).
- Genaw, J.L. A Discussion of Environmental Policy. Ind. Int Comp. L. Rev. 2010, 20, 47. [Google Scholar] [CrossRef]
- Echevarria-Rodriguez, G.; Hernandez-Perez, G.; Lopez-Quintero, J.O.; Lopez-Rivera, J.G.; Rodriguez-Hernandez, R.; Sanchez-Arango, J.R.; Socorro-Trujillo, R.; Tenreyro-Perez, R.; Yparraguirre-Pena, J.L. Oil and gas exploration in Cuba. J. Pet. Geol. 1991, 14, 259–274. [Google Scholar] [CrossRef]
- Wacaster, S.; Baker, M.S.; Soto-Viruet, Y.; Textoris, S.D. Recent Trends in Cuba’s Mining and Petroleum Industries; US Department of the Interior; US Geological Survey: Reston, VA, USA, 2015; Volume 3032.
- USGS. Assessment of Undiscovered Oil and Gas Resources of the North Cuba Basin. Cuba. Fact Sheet 2005, 2005–3009. Available online: http://pubs.usgs.gov/fs/2005/3009/ (accessed on 27 May 2020).
- Drouin, K.L.; Mariano, A.J.; Ryan, E.H.; Laurindo, L.C. Lagrangian simulation of oil trajectories in the Florida Straits. Mar. Pollut. Bull. 2019, 140, 204–218. [Google Scholar] [CrossRef]
- Scenarios and Responses to Future Deep Oil Spills: Fighting the Next War; Murawski, S.A., Ainsworth, C.H., Gilbert, S., Hollander, D.J., Paris, C.B., Schlüter, M., Wetzel, D.L., Eds.; Springer: Berlin/Heidelberg, Germany, 2019. [Google Scholar]
- French-McCay, D.; Crowley, D.; Rowe, J.J.; Bock, M.; Robinson, H.; Wenning, R.; Walker, A.H.; Joeckel, J.; Nedwed, T.J.; Parkerton, T.F. Comparative risk assessment of spill response options for a deepwater oil well blowout: Part 1. Oil spill modeling. Mar. Pollut. Bull. 2018, 133, 1001–1015. [Google Scholar] [CrossRef]
- McNutt, M.K.; Camilli, R.; Crone, T.J.; Guthrie, G.D.; Hsieh, P.A.; Ryerson, T.B.; Savas, O.; Shaffer, F. Review of flow rate estimates of the Deepwater Horizon oil spill. Proc. Natl. Acad. Sci. USA 2012, 109, 20260–20267. [Google Scholar] [CrossRef]
- Dietrich, D.E.; Bowman, M.J.; Korotenko, K.A.; Bowman, M.H.E. Oil Spill Risk Management: Modeling Gulf of Mexico Circulation and Oil Dispersal; John Wiley & Sons: Hoboken, NJ, USA, 2014. [Google Scholar]
- French McCay, D.P.; Jayko, K.; Li, Z.; Horn, M.; Kim, Y.; Isaji, T.; Crowley, D.; Spaulding, M.; Decker, L.; Turner, C.; et al. Technical Reports for Deepwater Horizon Water Column Injury Assessment–WC_TR14: Modeling Oil Fate and Exposure Concentrations in the Deepwater Plume and Cone of Rising Oil Resulting from the Deepwater Horizon Oil Spill. In DWH NRDA Water Column Technical Working Group Report; Prepared for National Oceanic and Atmospheric Administration: RPS ASA: South Kingstown, RI, USA, 2015. [Google Scholar]
- Liu, Z.; Liu, J.; Gardner, W.S.; Shank, G.C.; Ostrom, N.E. The impact of Deepwater Horizon oil spill on petroleum hydrocarbons in surface waters of the northern Gulf of Mexico. Deep Sea Res. Part II Top. Stud. Oceanogr. 2016, 129, 292–300. [Google Scholar] [CrossRef]
- Walker, N.D.; Pilley, C.T.; Raghunathan, V.V.; D’Sa, E.J.; Leben, R.R.; Hoffmann, N.G.; Brickley, P.J.; Coholan, P.D.; Sharma, N.; Graber, H.C.; et al. Impacts of Loop Current frontal cyclonic eddies and wind forcing on the 2010 Gulf of Mexico oil spill. In Monitoring and Modeling the Deepwater Horizon Oil Spill: A Record-Breaking Enterprise; Geophysical Monograph Series; American Geophysical Union: Washington, DC, USA, 2011; Volume 195, pp. 103–116. [Google Scholar]
- Mariano, A.J.; Kourafalou, V.H.; Srinivasan, A.; Kang, H.; Halliwell, G.R.; Ryan, E.H.; Roffer, M. On the modeling of the 2010 Gulf of Mexico oil spill. Dyn. Atmos. Ocean. 2011, 52, 322–340. [Google Scholar] [CrossRef]
- Socolofsky, S.A.; Adams, E.E.; Sherwood, C.R. Formation dynamics of subsurface hydrocarbon intrusions following the Deepwater Horizon blowout. Geophys. Res. Lett. 2011, 38, L09602. [Google Scholar] [CrossRef]
- Le Hénaff, M.; Kourafalou, V.H.; Paris, C.B.; Helgers, J.; Aman, Z.M.; Hogan, P.J.; Srinivasan, A. Surface evolution of the Deepwater Horizon oil spill patch: Combined effects of circulation and wind-induced drift. Environ. Sci. Technol. 2012, 46, 7267–7273. [Google Scholar] [CrossRef]
- Kourafalou, V.H.; Androulidakis, Y.S. Influence of Mississippi River induced circulation on the Deepwater Horizon oil spill transport. J. Geophys. Res. Ocean. 2013, 118, 3823–3842. [Google Scholar] [CrossRef]
- Smith, R.H.; Johns, E.M.; Goni, G.J.; Trinanes, J.; Lumpkin, R.; Wood, A.M.; Kelble, C.R.; Cummings, S.R.; Lamkin, J.T.; Privoznik, S. Oceanographic conditions in the Gulf of Mexico in July 2010, during the Deepwater Horizon oil spill. Cont. Shelf Res. 2014, 77, 118–131. [Google Scholar] [CrossRef]
- Hole, L.R.; Dagestad, K.F.; Röhrs, J.; Wettre, C.; Kourafalou, V.H.; Androulidakis, Y.; Kang, H.; Le Hénaff, M.; Garcia-Pineda, O. The DeepWater Horizon Oil Slick: Simulations of River Front Effects and Oil Droplet Size Distribution. J. Mar. Sci. Eng. 2019, 7, 329. [Google Scholar] [CrossRef]
- Plant, N.G.; Long, J.W.; Dalyander, P.S.; Thompson, D.M.; Raabe, E.A. Application of a Hydrodynamic and Sediment Transport Model for Guidance of Response Efforts Related to the Deepwater Horizon Oil Spill in the Northern Gulf of Mexico along the Coast of Alabama and Florida (No. 2012–1234); US Geological Survey: Reston, CA, USA, 2013.
- French-McCay, D.; Horn, M.; Li, Z.; Crowley, D.; Spaulding, M.; Mendelsohn, D.; Jayko, K.; Kim, Y.; Isaji, T.; Fonetanult, J. Simulation Modeling of Ocean Circulation and Oil Spills in the Gulf of Mexico: Appendix VI Data Collection, Analysis and Model Validation; Prepared by RPS ASA for the US Department of the Interior, Bureau of Ocean Energy Management, Gulf of Mexico OCS Region: New Orleans, LA, USA, 2017.
- Weisberg, R.H.; Zheng, L.; Liu, Y. On the movement of Deepwater Horizon Oil to northern Gulf beaches. Ocean Modell. 2017, 111, 81–97. [Google Scholar] [CrossRef]
- Warren, C.J.; MacFadyen, A.; Henry, C., Jr. Mapping oil for the destroyed Taylor Energy Site in the Gulf of Mexico. In International Oil Spill Conference Proceedings; American Petroleum Institute: Washington, DC, USA, 2014; Volume 2014, p. 299931. [Google Scholar]
- Asl, S.D.; Amos, J.; Woods, P.; Garcia-Pineda, O.; MacDonald, I.R. Chronic, anthropogenic hydrocarbon discharges in the Gulf of Mexico. Deep Sea Res. PART II Top. Stud. Oceanogr. 2016, 129, 187–195. [Google Scholar] [CrossRef]
- Mason, A.L.; Taylor, J.C.; MacDonald, I.R. An Integrated Assessment of Oil and Gas Release into the Marine Environment at the Former Taylor Energy MC20 Site; NOAA Technical Memorandum NOS NCCOS 260: Silver Spring, MD, USA, 2019; p. 147. [CrossRef]
- Garcia-Pineda, O.; Androulidakis, Y.; Le Hénaff, M.; Kourafalou, V.; Hole, L.R.; Kang, H.; Staples, G.; Ramirez, E.; DiPinto, L. Measuring oil residence time with GPS-drifters, satellites, and Unmanned Aerial Systems (UAS). Mar. Pollut. Bull. 2020, 150, 110644. [Google Scholar] [CrossRef]
- Androulidakis, Y.; Kourafalou, V.; Özgökmen, T.; Garcia-Pineda, O.; Lund, B.; Le Hénaff, M.; Hu, C.; Haus, B.K.; Novelli, G.; Guigand, C.; et al. Influence of River-Induced Fronts on Hydrocarbon Transport: A Multiplatform Observational Study. J. Geophys. Res. Ocean. 2018, 123, 3259–3285. [Google Scholar] [CrossRef]
- Sun, S.; Hu, C.; Garcia-Pineda, O.; Kourafalou, V.; Le Hénaff, M.; Androulidakis, Y. Remote sensing assessment of oil spills near a damaged platform in the Gulf of Mexico. Mar. Pollut. Bull. 2018, 136, 141–151. [Google Scholar] [CrossRef]
- Walker, N.D.; Rouse, L.J., Jr.; Fargion, G.S.; Biggs, D.C. The great flood of summer 1993: Mississippi River discharge studied. Eos Trans. Am. Geophys. Union 1994, 75, 409–415. [Google Scholar] [CrossRef]
- Gilbert, P.S.; Lee, T.N.; Podesta, G.P. Transport of anomalous low-salinity waters from the Mississippi River flood of 1993 to the Straits of Florida. Cont. Shelf Res. 1996, 16, 1065–1085. [Google Scholar] [CrossRef]
- Le Hénaff, M.; Kourafalou, V.H. Mississippi waters reaching South Florida reefs under no flood conditions: Synthesis of observing and modeling system findings. Ocean Dyn. 2016, 66, 435–459. [Google Scholar] [CrossRef]
- Chen, S.; Hu, C. Estimating sea surface salinity in the northern Gulf of Mexico from satellite ocean color measurements. Remote Sens. Environ. 2017, 201, 115–132. [Google Scholar] [CrossRef]
- Androulidakis, Y.; Kourafalou, V.; Le Hénaff, M.; Kang, H.; Sutton, T.; Chen, S.; Hu, C.; Ntaganou, N. Offshore spreading of Mississippi waters: Pathways and vertical structure under eddy influence. J. Geophys. Res. Ocean. 2019, 124, 5952–5978. [Google Scholar] [CrossRef]
- Kourafalou, V.; Androulidakis, Y.; Le Hénaff, M.; Kang, H. The dynamics of Cuba anticyclones (CubANs) and interaction with the Loop Current/Florida Current system. J. Geophys. Res. Ocean. 2017, 122, 7897–7923. [Google Scholar] [CrossRef]
- Androulidakis, Y.; Kourafalou, V.; Le Hénaff, M.; Kang, H.; Ntaganou, N.; Hu, C. Gulf Stream evolution through the Straits of Florida: The role of eddies and upwelling near Cuba. Ocean Dyn. 2020, 70, 1005–1032. [Google Scholar] [CrossRef]
- Le Hénaff, M.; Kourafalou, V.H.; Androulidakis, Y.; Smith, R.H.; Kang, H.; Hu, C.; Lamkin, J. In situ measurements of circulation features influencing cross-shelf transport around Northwest Cuba. J. Geophys. Res. Ocean. 2020, 125, e2019JC015780. [Google Scholar] [CrossRef]
- Kourafalou, V.H.; Kang, H. Florida Current meandering and evolution of cyclonic eddies along the Florida Keys Reef Tract: Are they interconnected? J. Geophys. Res. Ocean. 2012, 117. [Google Scholar] [CrossRef]
- Chiri, H.; Abascal, A.J.; Castanedo, S.; Antolínez, J.A.A.; Liu, Y.; Weisberg, R.H.; Medina, R. Statistical simulation of ocean current patterns using autoregressive logistic regression models: A case study in the Gulf of Mexico. Ocean Model. 2019, 136, 1–12. [Google Scholar] [CrossRef]
- Chassignet, E.P.; Hurlburt, H.E.; Metzger, E.J.; Smedstad, O.M.; Cummings, J.A.; Halliwell, G.R.; Bleck, R.; Baraille, R.; Wallcraft, A.J.; Lozano, C.; et al. US GODAE: Global ocean prediction with the HYbrid Coordinate Ocean Model (HYCOM). Oceanography 2009, 22, 64–75. [Google Scholar] [CrossRef]
- Kourafalou, V.; Androulidakis, Y.; Kang, H.; Smith, R.H.; Valle-Levinson, A. Physical Connectivity between Pulley Ridge and Dry Tortugas coral reefs under the influence of the Loop Current/Florida Current system. Prog. Oceanogr. 2018, 165, 75–99. [Google Scholar] [CrossRef]
- Leben, R.R. Altimeter-derived loop current metrics, in Circulation in the Gulf of Mexico: Observations and Models. In Geophysical Monograph-American Geophysical Union; Sturges, W., Lugo-Fernandez, A., Eds.; AGU: Washington, DC, USA, 2005; Volume 161, pp. 181–201. [Google Scholar]
- Dagestad, K.F.; Röhrs, J.; Breivik, Ø.; Ådlandsvik, B. OpenDrift v1.0: A generic framework for trajectory modelling. Geosci. Model Dev. 2018, 11, 1405–1420. [Google Scholar] [CrossRef]
- Jones, C.E.; Dagestad, K.F.; Breivik, Ø.; Holt, B.; Röhrs, J.; Christensen, K.H.; Espeseth, M.; Brekke, C.; Skrunes, S. Measurement and modeling of oil slick transport. J. Geophys. Res. Ocean. 2016, 121, 7759–7775. [Google Scholar] [CrossRef]
- Röhrs, J.; Dagestad, K.F.; Asbjørnsen, H.; Nordam, T.; Skancke, J.; Jones, C.; Brekke, C. The effect of vertical mixing on the horizontal drift of oil spills. Ocean Sci. 2018, 14, 1581–1601. [Google Scholar] [CrossRef]
- French, D.P.; Schuttenberg, H.Z.; Isaji, T. Probabilities of oil exceeding thresholds of concern: Examples from an evaluation for Florida Power and Light. In Arctic and Marine Oilspill Program Technical Seminar; Ministry of Supply and Services: Calgary, AB, Canada, 1999; Volume 1, pp. 243–270. [Google Scholar]
- French-McCay, D.P.; Horn, M.; Li, Z.; Jayko, K.; Spaulding, M.L.; Crowley, D.; Mendelsohn, D. Modeling distribution, fate, and concentrations of Deepwater Horizon Oil in subsurface waters of the Gulf of Mexico. In Oil Spill Environmental Forensics Case Studies; Butterworth-Heinemann: Oxford, UK, 2018; pp. 683–735. [Google Scholar]
- Barker, C.H.; Galt, J.A. Analysis of methods used in spill response planning: Trajectory Analysis Planner TAP II. Spill Sci. Technol. Bull. 2000, 6, 145–152. [Google Scholar] [CrossRef]
- De Jong, K. A Comparison of Four Particle Models: A Comparison of DemWaq, DREAM, GNOME and SIMPAR; Werkdocument: OS/2004.121 w; The Hague, Netherlands, 2004. Available online: http://edepot.wur.nl/174587 (accessed on 21 June 2020).
- Moghimi, S.; Ramirez, J.; Restrepo, J.M.; Venkataramani, S.C. Mass exchange dynamics of surface and subsurface oil in shallow-water transport. arXiv 2017, arXiv:1703.05361. [Google Scholar]
- Li, Z.; Spaulding, M.L.; French-McCay, D. An algorithm for modeling entrainment and naturally and chemically dispersed oil droplet size distribution under surface breaking wave conditions. Mar. Pollut. Bull. 2017, 119, 145–152. [Google Scholar] [CrossRef]
- Pearson, K. Mathematical contributions to the theory of evolution.—XI. On the influence of natural selection on the variability and correlation of organs. Philos. Trans. R. Soc. Lond. (Ser. A Contain. Pap. Math. Phys. Character) 1903, 200, 1–66. [Google Scholar]
- Li, Z.; Weisberg, R.H. West Florida continental shelf response to upwelling favorable wind forcing: 2. Dynamics. J. Geophys. Res. Ocean. 1999, 104, 23427–23442. [Google Scholar] [CrossRef]
- Weisberg, R.H.; Liu, Y.; Mayer, D.A. West Florida Shelf mean circulation observed with long-term moorings. Geophys. Res. Lett. 2009, 36, L19610. [Google Scholar] [CrossRef]
- Schiller, R.V.; Kourafalou, V.H.; Hogan, P.; Walker, N.D. The dynamics of the Mississippi River plume: Impact of topography, wind and offshore forcing on the fate of plume waters. J. Geophys. Res. Ocean. 2011, 116, C06029. [Google Scholar] [CrossRef]
- Androulidakis, Y.S.; Kourafalou, V.H. On the processes that influence the transport and fate of Mississippi waters under flooding outflow conditions. Ocean Dyn. 2013, 63, 143–164. [Google Scholar] [CrossRef]
- Androulidakis, Y.S.; Kourafalou, V.H.; Schiller, R.V. Process studies on the evolution of the Mississippi River plume: Impact of topography, wind and discharge conditions. Cont. Shelf Res. 2015, 107, 33–49. [Google Scholar] [CrossRef]
© 2020 by the authors. Licensee MDPI, Basel, Switzerland. This article is an open access article distributed under the terms and conditions of the Creative Commons Attribution (CC BY) license (http://creativecommons.org/licenses/by/4.0/).