Article

Population Genomic Analyses of Wild and Farmed Striped Catfish Pangasianodon Hypophthalmus in the Lower Mekong River

1
GeneCology Research Centre, School of Science and Engineering, University of the Sunshine Coast, 90 Sippy Downs drive, Sippy Downs, QLD 4556, Australia
2
Research Institute for Aquaculture No.2, 116 Nguyen Dinh Chieu, District 1, Ho Chi Minh, Vietnam
3
Research Institute for Aquaculture, No.1, Dinh Bang, Tu Son, Bac Ninh 220000, Vietnam
4
Institute of Genome Research, Vietnam Academy of Science and Technology, 18 Hoang Quoc Viet, Cau Giay, Ha Noi 100000, Vietnam
*
Authors to whom correspondence should be addressed.
J. Mar. Sci. Eng. 2020, 8(6), 471; https://doi.org/10.3390/jmse8060471
Submission received: 5 June 2020 / Accepted: 23 June 2020 / Published: 25 June 2020
(This article belongs to the Special Issue Genomic Prediction and Functional Genomics in Aquaculture)

Abstract

:
The striped catfish Pangasianodon hypophthalmus is an important freshwater fish cultured in many countries where the collection of wild brooders is still widely practiced. Global farming development of this species makes use of significant natural resources that pose challenges for the genetic diversity of striped catfish. Hence, this study aims to conduct a systematic genetic diversity assessment of wild and farmed catfish stocks collected from four major pangasius-farming countries, using a new genotyping by sequencing platform known as DArT-seq technology. Our population genomic analyses using 7263 single-nucleotide polymorphisms (SNPs) after high-quality-control showed that there were two distinct populations of striped catfish in the lower Mekong river: (i) wild catfish from Thailand and (ii) catfish from Cambodia and Vietnam. The genetic diversity was greatest (0.363) in the wild stock from Thailand, but it was lower in farmed and wild stocks in other countries (0.049 to 0.088). The wild stocks were more genetically diverse than the farmed animals (0.103 vs. 0.064). The inbreeding coefficient ranged from 0.004 and 0.109, with the lowest value (−0.499) in the wild animals from Thailand. Molecular inference methods revealed high degree of historical effective population size (1043.9–1258.4), but there was considerable decline in the contemporary estimates in all populations (10.8 to 73.6). Our additional analyses calculating divergent times and migration patterns showed that the wild catfish from Thailand stand out as separate lineages, while those from Cambodia and Vietnam are genetically identical. Our results also indicated that the cultured stock in Bangladesh originated from the lower part of the Mekong river. These findings have significant practical implications in the context of genetic selection and conservation of striped catfish in the region. Collectively, they will contribute to the sustainable development of the striped catfish sector in these countries.

1. Introduction

The striped catfish Pangasianodon hypophthalmus belongs to Pangasiidae family. Pangasius is an upstream migratory fish with spawning locations between Cambodia, Laos and Thailand [1]. The spawning season normally occurs at the beginning of the flooding season when female catfish deposit sticky eggs on the root systems of tree species Gimenila asiatica [1]. Then, the larvae drift downstream to the Mekong Delta of Vietnam. Wild-caught fry and fingerling have been a main source of seed for aquaculture in Cambodia and Vietnam, especially before 1999 [2]. The fish grow on the floodplain and return upstream to spawn when they reach maturation at the age of about three years. Although artificially induced spawning has been practiced since 2000 [3], wild-brooding catfish are still the main source of seed production and was the source for more than 95% fingerlings in Vietnam in 2017 [4]. Some hatcheries have used catfish raised in commercial ponds for breeding without any genetic considerations [4]. As a result, there has been a growing concern regarding genetic deterioration in commercial stocks. It is thus necessary to examine population structure and genetic diversity of P. hypophthalmus populations, due to its special role and distribution in the lower Mekong basin.
P. hypophthalmus is natively distributed in the Mekong and Chao Phraya rivers in the Lower Mekong basin [5,6], including four countries: Thailand, Laos, Cambodia and Vietnam. Domestication of this species started in 1967 in Thailand [7] and in 1979 in Vietnam [3]. However, commercial production has taken off recently, especially in Vietnam since 1999 [3]. With the significant production achieved during the last two decades—for instance 1.33 million metric tons produced in 2018, valuing 2.36 billion U.S. dollars in Vietnam alone [8]—the striped catfish has been introduced to other countries in the region for farming purposes, including China, Bangladesh, Indonesia, Malaysia, India and Myanmar [9]. The expanding aquaculture of P. hypophthalmus has opened new economic opportunities, but there are also concerns regarding the quality of striped catfish stocks for sustaining commercial production for this species [10].
First, there have been controversies regarding genetically distinct populations of striped catfish in the lower Mekong river. Previous studies using earlier generations of DNA markers reported that there may be three distinct populations of striped catfish—when microsatellites markers were used [11] or the population structure was not clearly distinguished with mitochondrial RFLP markers [12]. On the other hand, Poulsen and colleagues supported a proposition of two P. hypophthalmus populations in the lower Mekong river, with the largest population from Vietnam and Cambodia (i.e., below Khone Falls) and another smaller population above Khone Falls [13]. Second, there is no or limited published information regarding the genetic diversity of striped catfish in the lower Mekong basin countries. In particular, it is not known if the currently farmed stocks used in hatcheries and catfish producers show any genetic deterioration relative to their wild counterparts. Recently, Na-Nakorn and Moeikum [7] reported insignificant genetic differentiation of broodstock between hatchery- and wild-striped catfish in Thailand (using the population above Khone Falls). Likewise, Hà Phước Hùng, et al. [14] also found that there was no difference between wild versus hatcheries stocks in Vietnam (population below Khone Falls). Yet, the relationship between stock of above and below Khone Falls has not been documented. The third question regards choice and recruitment of striped catfish for genetic improvement programs. Ongoing breeding programs for disease resistance to Edwardsiella ictaluri in this species have collected wild stocks from Mekong river within Cambodia and Vietnam [15]. Thus, knowledge about demographic history and evolution of striped catfish from diverse geographically areas in the lower Mekong river will provide genetic information regarding variability and fitness of wild and farmed fish to establish foundation populations for future domestication and selection [16]. For instance, if there is large genetic variability in the striped catfish stock from the upper part of lower Mekong river, it would be an important genetic resource to strengthen the current breeding population [15] to ensure long-term genetic viability. Furthermore, with the available information about population structure, genetic diversity, divergent time and migration pattern, they would contribute to genetic conservation programs and international trade of this species.
In an attempt to address these questions, we used high-throughput next-generation genomic sequencing platforms (i.e., genotyping by sequencing, GBS) [17,18] to investigate genetic diversity of striped catfish. This approach has been widely used in plants and animals [19,20,21,22]. An example is SNP–single nucleotide polymorphism which has greater power to examine genetic evolution–selection [23,24] or to differentiate between wild and farmed Atlantic Salmon [25,26] and also, to trace aquaculture products [27] with higher levels of accuracies compared with DNA microsatellite markers [28,29,30,31]. In aquaculture species, studies using GBS approach have been conducted, for examples in peripheral freshwater fish Polynemus melanochir [32], blue swimming crab Portunus pelagicus [33], Nile tilapia Oreochromis niloticus [34], Australasian snapper Chrysophrys auratus [35] or Eastern Oyster Crassostrea virginica [36].
However, large scale genome-wide markers analysis has not been conducted in any pangasius species, including P. hypophthalmus. Therefore, the principal aim of this study was to conduct a systematic genetic diversity assessment of both farmed and wild striped catfish stocks collected from three countries in the lower Mekong river and an introduced stock to Bangladesh. Specifically, the study had three main objectives: (i) identifying populations of striped catfish in the lower Mekong river, (ii) understanding genetic diversity of wild and farmed stocks by making a within and between-population comparison and (iii) recruiting genetic stocks for the future breeding program for striped catfish. To achieve these aims, we estimated population genetic structure, gene flows and migration patterns as well as effective population sizes for the seven stocks studied. This information will contribute to sustainable development of the catfish sector in the region especially in the lower Mekong river basin where human and environmental impacts strongly influence genetic resources of freshwater species including P. hypophthalmus.

2. Materials and Methods

2.1. Samples and Tissue Collection

We collected and analyzed 93 catfish samples collected from both farmed and wild locations in three countries, comprising Vietnam (65), Cambodia (10) and Thailand (9) and farmed fish only from Bangladesh (9). Except for Bangladesh, all the collected samples were in the mainstream of the lower part of Mekong river (Figure 1). The number of samples of wild and farmed fish and 24 locations are also presented in Supplementary Table S1. Vietnam samples have dispersed to seven locations and there were both wild and farmed fish in each location [37].

2.2. DNA Extraction, Library Preparation and Sequencing

Genomic DNAs from 93 fin samples were separately extracted using a commercial KIT (DNeasy Blood & Tissues Kit, Germany). The DNA products were then purified using a standard protocol as described by Kilian, et al. [38] for ligation/digestion reactions and sequencing. The same DNA sequencing and SNP calling procedures were applied as given in Nguyen et al. [39]. Briefly, the DArTSeqTM used a reduction-based sequence technology on high throughput platforms, using restriction enzymes tested for P. hypophthalmus. The sequences were then filtered using customized python scripts at https://github.com/esteinig/dartqc. This included the linkage disequilibrium pruning for linkage between loci. SNP sequences were removed from the dataset if the average read depth < 7, average repeatability < 99%, call rate < 90% and similar sequence clusters < 0.95. Further quality-control of the SNP data is given below.

2.3. Data Analysis

2.3.1. SNP Quality-Control and Outlier Detection

The SNP data acquired from DArT company (https://www.diversityarrays.com/) was read by ‘dartR’ package [40] in R environment [41], including 16,896 coded (i.e., numeric) SNPs for 93 individuals. The downstream data were extracted following seven orderly steps by filtering relevant genetic parameters as describe in Gruber, Unmack, Berry and Georges [40] and based on loci with: i. at 99% reproducibility rate, ii. discarding monomorphic loci to retain only polymorphic loci, iii. retaining loci with call-rate ≥ 95%, iv. removing duplicate SNP sequence to assume no linkage between loci, v. retaining taxa with call-rate ≥ 90%, vi. removing loci with significant (α = 0.05) departure from Hardy–Weinberg (HW) with Bonferroni corrected and last, vii. removing loci under selection pressure (or outlier loci) by OutFLANK method [42] which filtered loci with 5% of lowest and 5% highest FST from the majority distribution of the central loci. The numbers of SNPs of downstream analysis was 7263 polymorphic SNPs with 90 individuals (3 individuals were discarded from a wild and a farm of Vietnam and a wild Cambodia). No loci (of 7263 SNPs) has significant deviated from HW equilibrium and no outlier loci was detected. This dataset was utilized for all subsequent analyses. The descriptive statistical differences between full and downstream data were showed in Supplementary Table S2.

2.3.2. Basic Genetic Analysis

The downstream data were then translated to ‘fasta’ and ‘structure’ formats using ‘dartR’. Then, PGDSpider [43] was also used to convert the data into other genetic software’s inputs for subsequent analyses. Fundamental genetic parameters such as observed heterozygote (Ho), expected heterozygote (He) and total genetic diversity (FST) and inbreeding or fixation index (FIS) within/between stock variation were estimated by ‘dartR’. Standard deviations were based on estimates over all loci in a population which extracted under ‘gl.basic.stats’ function. Pairwise differences for genetic diversity (FST) were computed under 1000 bootstraps at 95% significant level between and within population variations in ‘dartR’ under ‘gl.fst.pop’ function. Lastly, analysis of molecular variance with the interaction between wild and farmed catfish with seven populations studied was estimated in Arlequin v3.5 under 1000 permutations using standard pairwise difference matrix as used in ‘dartR’.

2.3.3. Cluster Analysis

Structure v2.3.4. [44] was used to infer population structure by simulation with 10,000 burn-ins and 100,000 Markov chain Monte Carlo steps toward each run, testing for one to eight clusters (k = 1–8) and 5 replicates. In addition, structure harvester web-based [45] uptakes result from Structure software [46] for defining a number of proper clusters (possibly number of populations) and were plotted by CLUMPAK wed-based software [47]. In addition, we also used PartitionML v1.01 [48] to assign each individual to k population defined by Structure to double checks the consistency between two analyses. This software uses maximum likelihood estimation of single sample to the best of panmictic unit according to genetic mixture model used by Smouse et al. [49].

2.3.4. Phylogenetic and Molecular Relative Times

Phylogenetic analysis was conducted in MEGA-X v10.0.5 [50] by using ‘fasta’ format converted from ‘dartR’. The ‘fasta’ sequence utilized variant nucleotide sites to generate a single composite haplotype (7263 nucleotides) for maximum likelihood (ML) phylogenetic analysis. First, we defined the best ML model. Second, under phylogeny inferring, we fitted the suggested model with 500 replications (bootstraps) via Gamma distributed among sites. Inferring relative times between lineages used RelTime-ML method in MEGA-X with outgroup as ‘wild Thailand stock’ (as it showed the greatest genetic distance to the other fish groups). Because of the nature of DArT data (generated by combining single variant nucleotide of all SNPs), it is impossible to obtain the aligned sequences in any database to calibrate to the calendar time [51,52], otherwise the relative times between lineages are scalable. Both resultants trees from Newick format were visualized in FigTree v1.4.4 (http://tree.bio.ed.ac.uk/software/figtree/).

2.3.5. Migration Rate

To estimate relative and significant migration rate, the ‘genpop’ file format exported from PGDspider [43] was processed by ‘divMigrate’ function in ‘diveRsity’ package [53,54] in R environment. These analyses were obtained under 95% significant level with zero (for relative Nm) and 1000 bootstrapping (for significant Nm) using Nm method [55].

2.3.6. Effective Population Size

To estimate contemporary effective population size (cNe), we converted ‘structure’ to ‘fstat’ format using PGDspider [43] and analyzed the data by NeEstimator v.2 [56] using Linkage disequilibrium (LD) method under random mating assumption. The LD method is one of the most common Ne estimate methods for a range of studies (reviewed by Marandel, et al. [57]). We also acknowledged the underestimating of true Ne using LD method [58,59] as low representatives of sampling and overlapping generation existed in striped catfish. In this regard, we estimated the cNe for each individual population separately. Small sample size (population) was excluded to obtain reliable estimates. Historical effective population sizes (hNe) were estimated using Migrate-N software [60] based on Bayesian inference using the structured coalescent method which assumed migration rate (S) is 4 × N × m, where m is assumed fixed migration rate across loci. The run for SNP data coded as one haplotype (one site) is set by a chain of 10,000 steps by 100 increments, following Felsentein-84 model [61]. Ten independent runs were accomplished to obtain the better accuracy and confident intervals of the estimates.

3. Results

3.1. Within Population Diversity

There were generally high standard deviations of all four parameters estimated in Table 1, except FST values for wild, farmed catfish and of Vietnam stocks. Regarding the farmed catfish, both the observed and expected heterozygosities were greatest in FTL (Ho = 0.076 ± 0.161, He = 0.090 ± 0.169), followed by those from FBD (Ho = 0.071 ± 0.141, He = 0.083 ± 0.155) and FCM (Ho = 0.055 ± 0.182, He = 0.056 ± 0.173). FVN had the lowest values (Ho = 0.049 ± 0.123, He = 0.049 ± 0.118). Likewise, the similar tendency was observed for all the wild stocks, the WTL had highest diversity (Ho = 0.497 ± 0.459, He = 0.333 ± 0.236). The WTL had also highest genetic diversity (0.363 ± 0.198); however, no significant differences in measures of the genetic diversities between stocks due to high standard errors of the estimates. The lowest FIS was observed in wild Thailand stock (FIS = −0.499) while there were little differences in the FIS value among other stocks (0.055–0.088). The wild catfish had a lower degree of inbreeding compared to the farmed catfish (0.096 vs. 0.108). The diversity differed slightly between farmed and wild stocks which ranged 0.064–0.103, being lowest in Vietnam stocks (0.049 ± 0.023) and Cambodia stocks (0.055 ± 0.036 to 0.060 ± 0.031).

3.2. Genetic Distance

Analysis of molecular variance showed 11.04% variance among individual and populations, 87.43% variation within individuals, only 1.53% between populations (i.e., wild vs. farm fish) (Table 2).
Genetic distance analysis using Josh’s D method showed that WTL was genetically distinct from other stocks studied, ranging from 0.363 to 0.666 (Table 3). However, the FTL had closer genetic distance to FBD, FCM and WCM (0.033, 0.072 and 0.125, respectively) than to FVN and WVN (0.220 and 0.217, respectively). On the other hand, the P. hypophthalmus currently cultured in Bangladesh is closer to the farmed animals in Thailand than those from Cambodia and Vietnam (FST = 0.033 vs. 0.039 to 0.148, respectively). We also found the close genetic relatedness among Vietnam and Cambodia stocks, FST range from 0.005 to 0.018. Additionally, the principal component analyses (PCoA) indicated that the wild catfish in Thailand was clustered as a separate group from other catfish included in this study and explained 29.4% of molecular variance in this data (Figure 2).

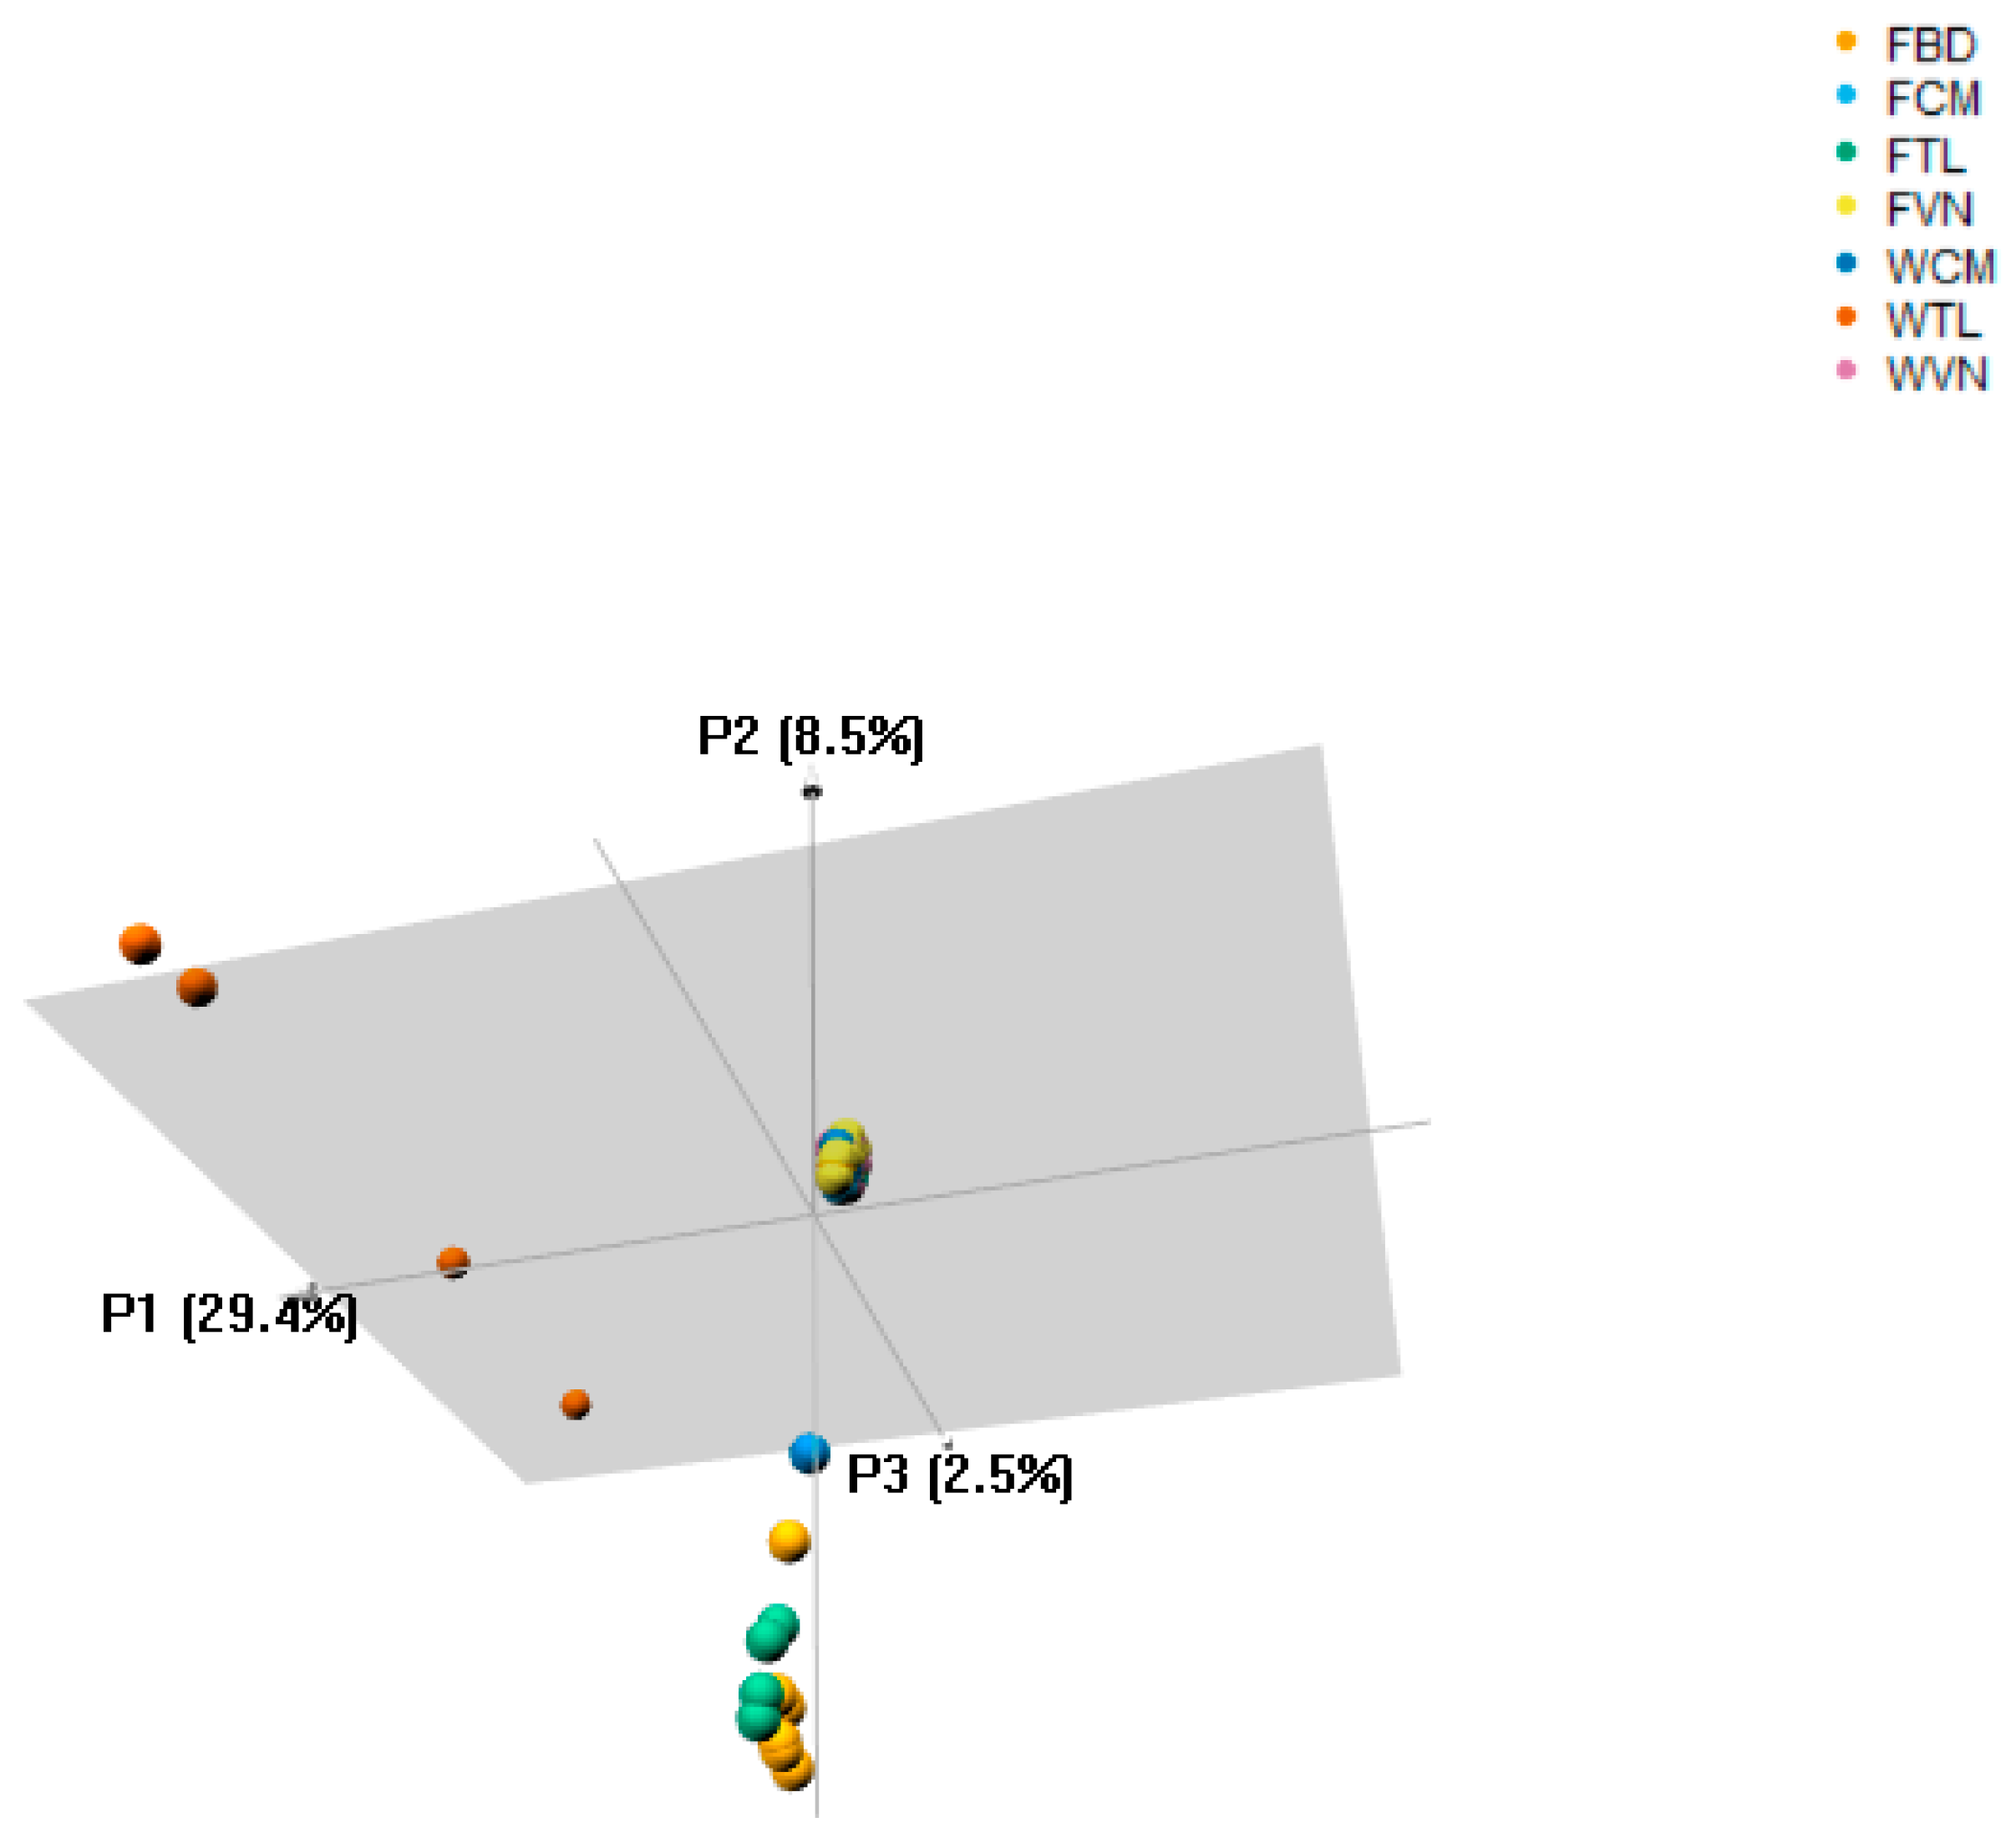
3.3. Population Structure

The Bayesian genetic-cluster analysis clearly defined two populations of striped catfish in the lower Mekong river. The wild striped catfish from Thailand were assigned to a separate cluster, which is consistent with its genetic distance (Table 3), individual assignment (to 3 populations) from PartitionML and PCoA analysis (Figure 2 and Figure 3). Furthermore, the WTL had significantly greater number of private alleles (0.502 ± 0.006) compared to other catfish groups (0.002 ± 0.000 to 0.042 ± 0.002) (Supplementary Table S3). On the other hand, the striped catfish groups from Cambodia and Vietnam are closely related and had strong ancestry connections. Both farmed catfish from Thailand and Bangladesh were also grouped in the same cluster alike of those from Cambodia and Vietnam, likely due to the introduction of striped catfish from Mekong river for aquaculture in Thailand [7] and subsequently to Bangladesh [63].

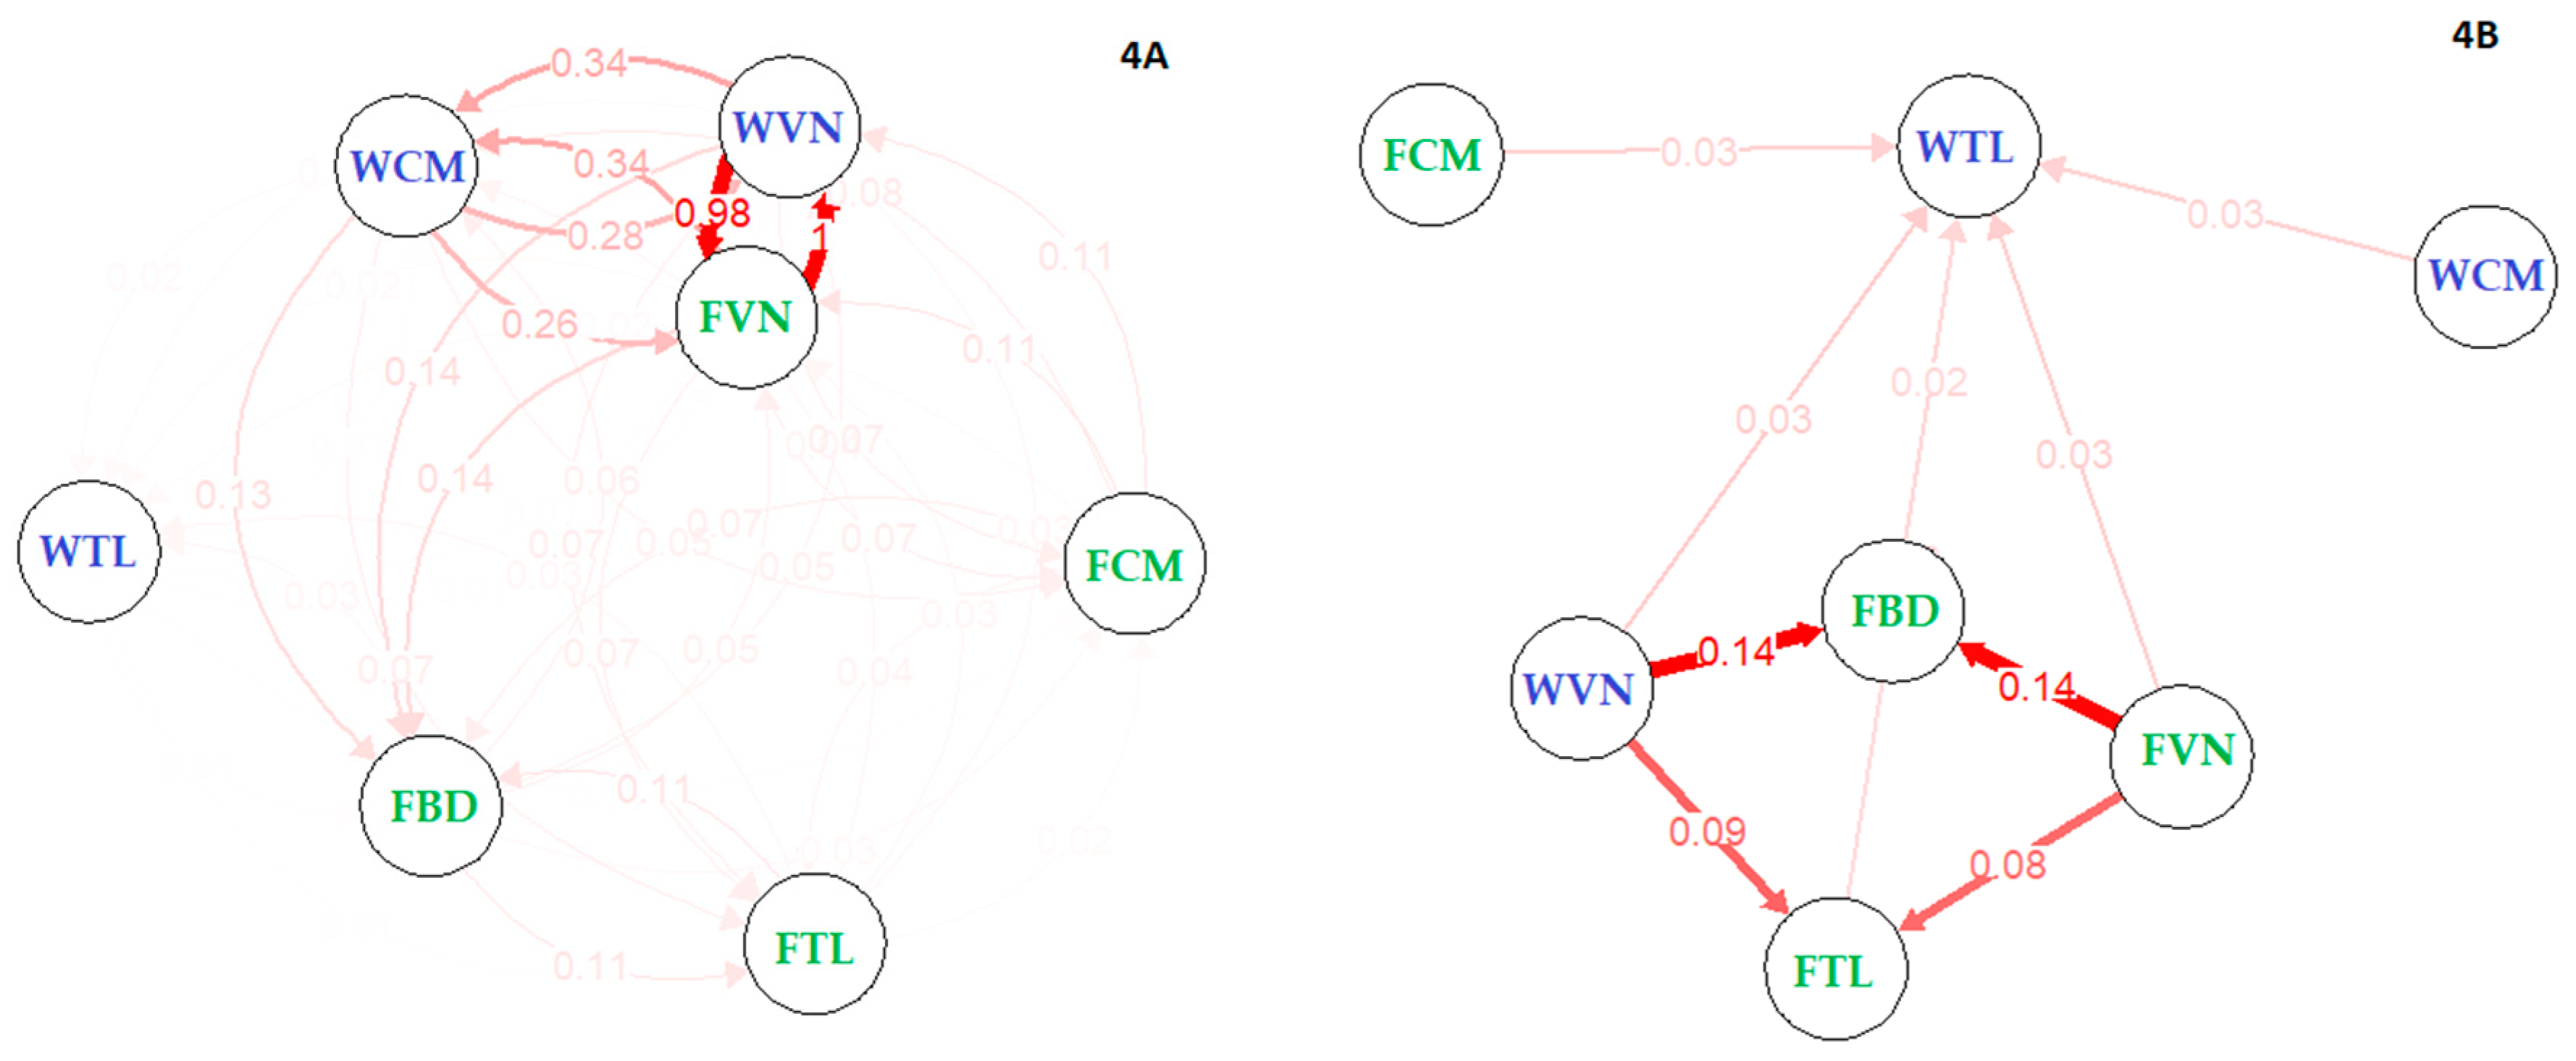
3.4. Migrations between Stocks

First, the historic migration rate between populations were inferred with Migrate-N software revealed large migration movements among these population (mean 0.57, from 0.40 to 0.70, Supplementary Table S4). These migrations exhibited both directions between any pair at significant rates, supporting a unique population in prehistoric times. Second—to understand contemporary gene flow and genetic links among populations—migration networks were estimated using two methods: (i) no bootstrapping (Figure 4A) and (ii) with 1000 bootstraps (Figure 4B). These analyses approached asymmetric estimation of migration rate between populations. The first analysis when no bootstrapping was used showed there was substantial two-way directions of genetic movement, e.g., between farmed and wild Vietnam (98–100%). It also indicated the moderate movement between wild Cambodia and Vietnam stocks (26–34%), while the movements between remained groups (FBD, FCM, WTL and FTL) were small (less than 12%). Farmed catfish in Bangladesh received 7–14% genetic share from Vietnam and Cambodia stocks, indicating the origin of animal from lower Mekong river. Additionally, FBD equally received and shared 11% with FTL. However, under significant analysis (i.e., 1000 bootstrapping), directional genetic movements have prevailed; that is from WVN and FVN to both FBD and FTL (8–14%). Interestingly, WTL accounted for about 12% of the total genetic shares from lower populations in Mekong river (Vietnam and Cambodia stocks). Our results when taken collectively indicated that the striped catfish cultured in Thailand and Bangladesh had a certain genetic uptake from ancestor catfish in the lower Mekong river, especially from Cambodia and Vietnam. On the other hand, our additional calculation of the gene flow (Nm values) based on Wright [62] which assumes symmetric migration between groups also displayed corresponding gene flow among populations compared to that estimated in diveRsity package (Table 3 vs. Figure 4A). There were high gene flows among Vietnam and Cambodia stocks (13.6–49.8) compared to the lower gene flows between FBD and Thailand stocks (0.3–7.3).

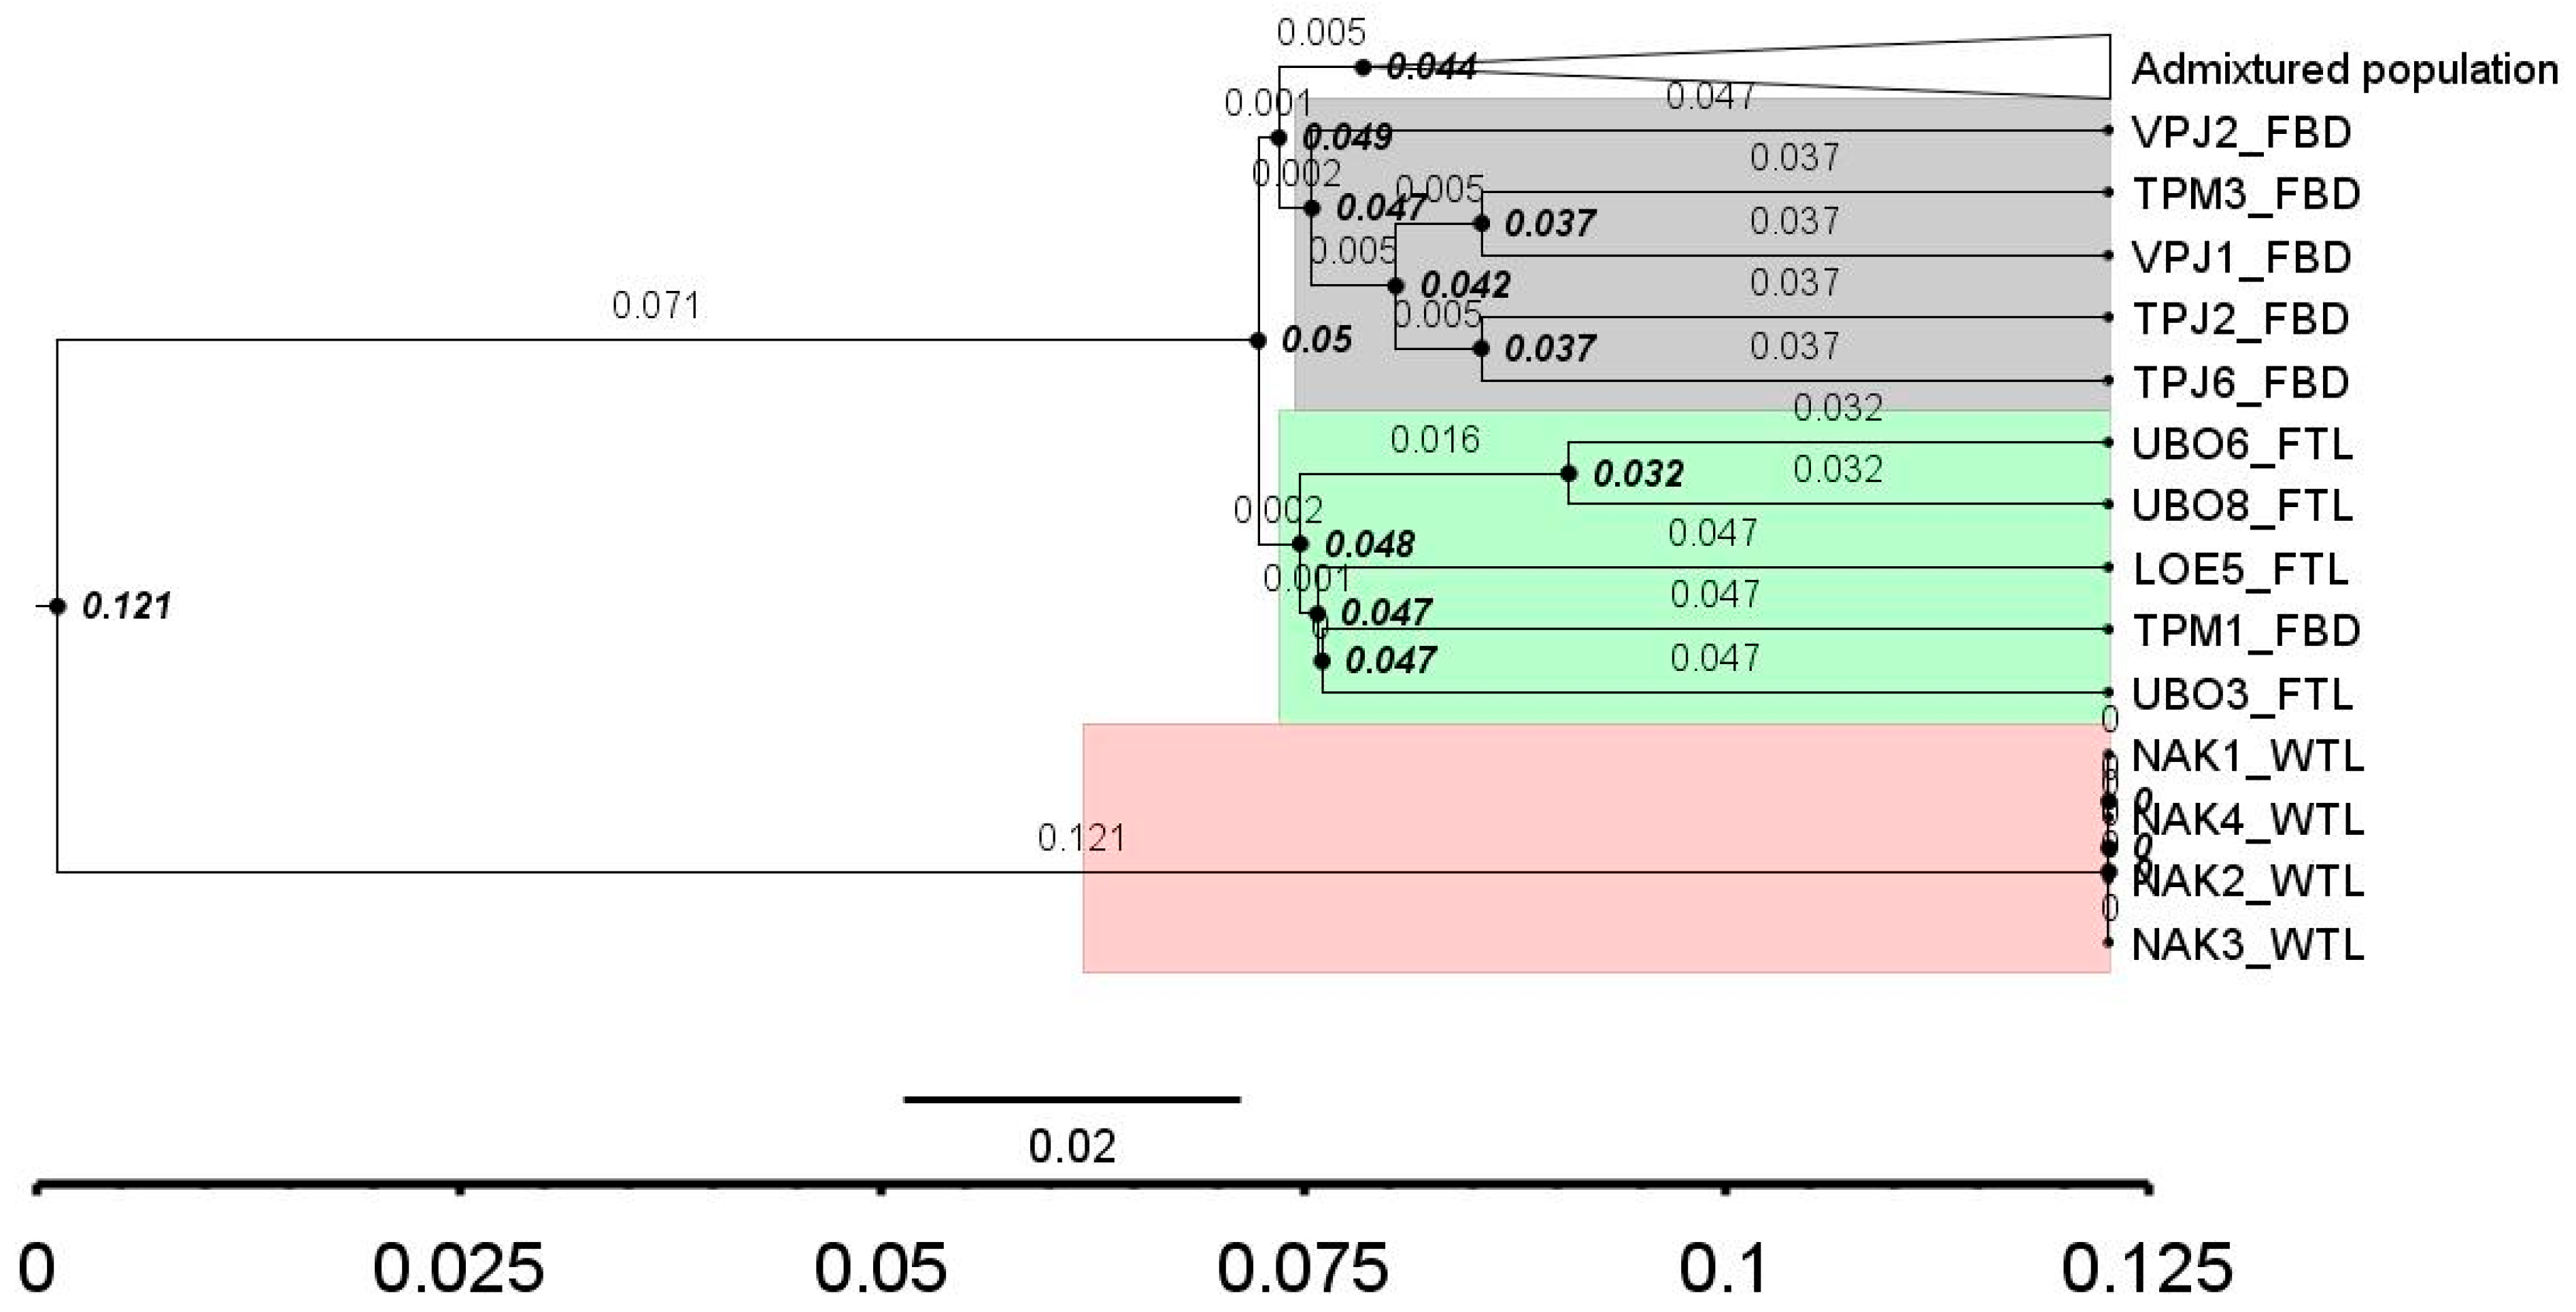
3.5. Molecular Relative Time

Relative divergent time between lineages of all catfish stocks is presented in Figure 5. The time distances of the wild from Thailand were 2.5 to 3.8 times greater than other lineages. There was however very little time divergence between individuals from Cambodia and Vietnam and they were assigned as an admixture population. Node times of all population (except wild Thailand) were 0.044 to 0.049 (Figure 5). The closer to zero–time divergence between farmed Bangladesh and Thailand indicated genetic similarity between these lineages.

3.6. Effective Population Sizes

Both contemporary (cNe) and historical (hNe) population sizes were estimated separately for farmed and wild stocks in each country with 7 samples or more in each stock (Table 4). Regardless of the analyses carried out, the historic effective population sizes were large across the populations studied, ranging from 1043.9 to 1258.4 (CI = 746.5 to 1518.7). However, the cNe of stocks estimated were lower than the hNe (approximately 17 to 97 times lower), being lowest in Bangladesh (10.8) and greatest in Vietnam stocks (52.2–73.6). However, these estimates had a wide range of confident interval, according to the jackknife method, the lower limit from 2.9 to 32.1 to infinity in the upper limit, except for FBD with definite value, from 2.9–511.4. This indicates the lowest and explicit magnitude of Ne for FBD.

4. Discussion

Our first large scale genomic population analysis has addressed important questions regarding population structure, genetic diversity, population size and migration pattern of striped catfish.
Our first important finding was that there are two distinct populations in the lower Mekong river: (i) the wild stock from upper part of lower Mekong river in Thailand and (ii) the other populations from Cambodia and Vietnam in the Mekong river. The wild population from upper part of the lower Mekong river (above Khone Fall) in Thailand may have been isolated (i.e., lack of upstream migration). However, So, Maes and Volckaert [11], reported three distinct populations of striped catfish under Khone Falls of the Mekong river, with a high level of sympatry among them. Note that the study of So, Maes and Volckaert [11] used microsatellite markers. Interestingly, our study showed that the currently farmed stock in Thailand originated from the Mekong river, likely due to the inferior performance of the native catfish from Chao Phraya [7]. Our GBS data also provided power to indicate that the catfish cultured in Bangladesh originated from the introduction of stock originated from lower part of Mekong river despite of some mentions of its source from farmed Thai catfish [7,63].
Second, our results also showed that there was no difference in genetic diversity between wild and farmed stocks (Table 2). The magnitudes of heterogeneities in this study were much lower than those reported in studies that used microsatellite markers (e.g., Ho = 0.633–0.763; He = 0.593–0.834 in Thai pangasius population [7]) or Cambodian and Vietnamese catfish populations with Ho = 0.720–0.759; He = 0.729–0.772 [11]. However, within SNP data, the values of Ho (0.048–0.497) and He (0.049–0.333) in the wild groups used in our study were among interval values reported in blue seawater swimming crab (Ho = 0.166–0.216, He = 0.211–0.246 [33]) or Mekong freshwater fish (Ho = 0.274–0.344, He = 0.343–0.345 [32]). Furthermore, the close genetic diversity between wild and farmed stocks in Cambodia and Vietnam in Table 3 indicated the small changes in farmed stocks in these countries or the genetic nature of the farmed stocks were not deteriorated. This could be due to the recent domestication of this species [15,64].
Third, we examined the effective population size of catfish populations in the context of captive breeding and evolution. Despite the large hNe across populations, the cNe were significantly reduced by 17–97 folds considering the last 32 generations or approximately 96–128 years (Table 4). This pattern (i.e., reduced Ne with domestication) is also observed in several species, such as from 30 to about 17.2 in 10 years duration in cattle [65] or in Australian white shark [66]. However, there was little reduction in the cNe between the wild and farmed stocks in Vietnam (from 73.6 to 52.2) as reflected by the recent domestication of this species in captivity for about 4–5 decades. More important, the cNe of farmed catfish in Vietnam (52.2) is in the order of recommendations (Ne ≥ 50) by FAO to maintain inbreeding level below 1% per generation in captive breeding programs for terrestrial and aquatic animal species [67]. However, to retain evolutionary adaptation to environmental changes, a significantly larger cNe is required, e.g., between 500 to 1000 as suggested by Franklin and Frankham [68]. To date, there is no comparative cNe estimates for striped catfish to compare with this study. A recent report in paradise fish species which habitat in Mekong Delta reported that the effective population sizes of this species across Mekong region was lower than 500 and this may constrain the adaptation capacity of this fish species to environmental changes [32]. However, due to the low and imbalanced sample sizes in our study (see Section 2.3.6), the estimates are likely somewhat biased and hence, deserving further studies to confirm the current results when resources are permitted.
Fourth, our study provided answers to pertinent questions regarding divergence time and migration rate of catfish populations in the lower Mekong basin. P. hypophthalmus is migratory catfish to upstream of the Mekong river [69]. Due to geographical constraint, the wild stock from upper Khone Falls may be isolated and shows significant genetic differences from other lineages. As shown in our study, the wild Thailand fish exhibited different genetic characteristics from other stocks—especially the greatest time divergence of its lineages to other stock lineages. Under different methods in our study, the estimated migration rates altered slightly between populations studied; however, the pattern of the migration route remained clear, namely, the genetic movement to Bangladesh population from other genetic sources from Mekong river (i.e., from farmed Thailand under traditional FST-based calculation or from Vietnam populations under divMigrate function or among populations in the Mekong river (except wild Thailand)). This indicated loose (farmed Thai to others) to high (between Vietnam and Cambodia) interconnections. However, in the near future, those relations between those stocks could be potentially affected due to the loss of connectivity with accrediting to geographical constraints. Some study reported that no or little pangasiid fish migration was observed in the upper stream of the Mekong river [70,71]. This has attributed to dam constructions in the Mekong stream [72,73] which possibly affect the migratory pathways of many aquatic species, such as Siamese Mud Carp in Thailand [74].
Collectively, our findings have two significant practical implications in the context of stock management and selective breeding. A combined analysis of population structure, genetic diversity, migration rate suggests that management of the striped catfish stock is country dependent. For Thailand where the farmed fish had much deviation to the wild, management of these fish should consider them as different lineages. On the other hand, the similar genetic characteristics between wild and farmed fish in Vietnam and Cambodia pointed out that the captive stock in Vietnam can be used as an alternative to the wild to produce seeds for commercial production. By this way, it would help to minimize overexploitation of striped catfish in the wild and hence, contributing to the conservations of genetic resources for this species.
Regarding genetic improvement for catfish populations, due to the large genetic diversity of the wild striped catfish in Thailand, this population could be a good candidate to incorporate into existing breeding programs [15] for P. hypophthalmus. However, phenotypic evaluation of this lineage relative to other populations for traits of interests (e.g., growth or disease resistance) should be conducted to avoid possible depressions in performance of the improved stocks. Additionally, the genetic diversity of the existing striped catfish can be strengthened by including wild stocks from Cambodia or Vietnam to sustain long-tern selection program for this species.

5. Conclusions

There are two distinct populations of striped catfish in the lower Mekong basin: (i) wild stock from Thailand and (ii) those from Cambodia and Vietnam. Both farmed and wild stocks from these countries showed reasonable level of genetic diversity. Recent domestication–selection had little impact on genetic diversity of the farmed relative to wild stocks although the contemporary effective population sizes (cNe) of the farmed stocks were declined compared with the historical Ne. Estimation of the divergent time and migration pattern also showed the wild stock from Thailand stands alone as a separate population and the others from Cambodia and Vietnam including farmed stock in Thailand are genetically related. These results provide important information to assist the genetic improvement and conservation of this species in the Mekong region.

Supplementary Materials

The following are available online at https://www.mdpi.com/2077-1312/8/6/471/s1, Table S1: Ninety-three samples of striped catfish information based on farm and wild catfish stocks in 4 major pangasius-farming countries, Table S2: Basic statistics about the sequence data, Table S3: Mean allelic pattern across seven catfish stocks based on GenAlEx analyses, Table S4: Historic migration between seven catfish stocks.

Author Contributions

All authors conducted the study. T.T.T.H. and V.T.B.T. and V.T.T. collected the samples. All authors read and approved manuscript prior to submission, N.T.V. and N.H.N. conceived and designed the study, analyzed the data and prepared and finalized the manuscript. All authors have read and agreed to the published version of the manuscript.

Funding

This project was funded by the Ministry of Agriculture and Rural Development, Vietnam under the grant of Biotechnology Program in Agriculture and Fishery.

Acknowledgments

We would like to thank colleagues from the Department of Fisheries in Cambodia and Thailand; researchers from Research Institute for Aquaculture No.1, Research Institute for Aquaculture No.2 in Viet Nam and Department of Fisheries Biology and Genetics, Bangladesh Agricultural University for their assistances in samplings for this project.

Conflicts of Interest

We have no conflicts of interest to declare.

References

  1. Touch, S. Life cycle of Pangasianodon hypophthalmus and the impact of catch and culture. In Proceedings of the Catfish Asia Conference, Bogor, Indonesia, 15–20 May 2000. [Google Scholar]
  2. Van Zalinge, N. Update on the status of the Cambodian inland capture fisheries sector with special reference to the Tonle Sap Great Lake. Mekong Fish. Catch Cult. 2002, 8, 1–9. [Google Scholar]
  3. Trong, T.Q.; Hao, N.V.; Griffiths, D. Status of Pangasiid Aquaculture in Viet Nam; MRC Technical Paper No. 2; Mekong River Commission: Phnom Penh, Cambodia, 2002; 16p, ISSN 1683-1489. [Google Scholar]
  4. Vũ, N.T.; Trọng, T.Q.; Đỉnh, L.T.; Nga, H.T.N.; Hiệp, N.V. Draft report: Survey results from Project “Investigation for develop national standard regulation: Freshwater fish-striped catfish broodtsock and fingerlings-quality requirements”. Draft. Rep. Fish. Dep. Res. Inst. Aquac. 2017, 25. [Google Scholar]
  5. Rainboth, W.J. Fishes of the Cambodian Mekong; Food & Agriculture Organization: Quebec City, QC, Canada, 1996. [Google Scholar]
  6. Roberts, T.R.; Vidthayanon, C. Systematic revision of the Asian catfish family Pangasiidae, with biological observations and descriptions of three new species. Proc. Acad. Nat. Sci. Phila. 1991, 143, 97–143. [Google Scholar]
  7. Na-Nakorn, U.; Moeikum, T. Genetic diversity of domesticated stocks of striped catfish, Pangasianodon hypophthalmus (Sauvage 1878), in Thailand: Relevance to broodstock management regimes. Aquaculture 2009, 297, 70–77. [Google Scholar] [CrossRef]
  8. VASEP. Available online: http://m.vasep.com.vn/Tin-Tuc/1018_52802/Hieu-qua-va-nang-suat-san-xuat-ca-tra-so-voi-ca-hoi-ca-chem-va-ca-trap-chau-Au.htm (accessed on 15 December 2019).
  9. Griffiths, D.; Van Khanh, P.; Trong, T.Q. Cultured Aquatic Species Information Programme: Pangasius Hypophthalmus. Fish. Aquac. Dep. Rome. Available online: http://www.fao.org/fishery/culturedspecies/Pangasius_hypophthalmus/en (accessed on 28 April 2015).
  10. Vu, N.T.; Van Sang, N.; Phuc, T.H.; Vuong, N.T.; Nguyen, N.H. Genetic evaluation of a 15-year selection program for high growth in striped catfish Pangasianodon hypophthalmus. Aquaculture 2019, 509, 221–226. [Google Scholar] [CrossRef]
  11. So, N.; Maes, G.; Volckaert, F. High genetic diversity in cryptic populations of the migratory sutchi catfish Pangasianodon hypophthalmus in the Mekong River. Heredity 2006, 96, 166–174. [Google Scholar] [CrossRef] [PubMed] [Green Version]
  12. So, N.; Van Houdt, J.K.; Volckaert, F.A. Genetic diversity and population history of the migratory catfishes Pangasianodon hypophthalmus and Pangasius bocourti in the Cambodian Mekong River. Fish. Sci. 2006, 72, 469–476. [Google Scholar] [CrossRef]
  13. Poulsen, A.F.; Hortle, K.; Valbo-Jorgensen, J.; Chan, S.; Chhuon, C.; Viravong, S.; Bouakhamvongsa, K.; Suntornratana, U.; Yoorong, N.; Nguyen, T.J.M. Distribution and ecology of some important riverine fish species of the Mekong River Basin. MRC Tech. Pap. 2004, 10, 116. [Google Scholar]
  14. Ha, H.P.; Nguyen, T.T.T.; Poompuang, S.; Na-Nakorn, U. Microsatellites revealed no genetic differentiation between hatchery and contemporary wild populations of striped catfish, Pangasianodon hypophthalmus (Sauvage 1878) in Vietnam. Aquaculture 2009, 291, 154–160. [Google Scholar] [CrossRef]
  15. Vu, N.T.; Sang, N.V.; Trong, T.Q.; Duy, N.H.; Dang, N.T.; Nguyen, N.H. Breeding for improved resistance to Edwardsiella ictaluri in striped catfish (Pangasianodon hypophthalmus): Quantitative genetic parameters. J. Fish. Dis. 2019, 42, 1409–1417. [Google Scholar] [CrossRef]
  16. Lind, C.; Ponzoni, R.; Nguyen, N.; Khaw, H.J.R. Selective breeding in fish and conservation of genetic resources for aquaculture. Reprod. Domest. Anim. 2012, 47, 255–263. [Google Scholar] [CrossRef] [PubMed] [Green Version]
  17. Robledo, D.; Palaiokostas, C.; Bargelloni, L.; Martínez, P.; Houston, R. Applications of genotyping by sequencing in aquaculture breeding and genetics. Rev. Aquac. 2018, 10, 670–682. [Google Scholar] [CrossRef] [PubMed]
  18. Gurgul, A.; Miksza-Cybulska, A.; Szmatoła, T.; Jasielczuk, I.; Piestrzyńska-Kajtoch, A.; Fornal, A.; Semik-Gurgul, E.; Bugno-Poniewierska, M.J.G. Genotyping-by-sequencing performance in selected livestock species. Genomics 2019, 111, 186–195. [Google Scholar] [CrossRef] [PubMed]
  19. Egan, A.N.; Schlueter, J.; Spooner, D.M. Applications of next-generation sequencing in plant biology. Am. J. Bot. 2012, 99, 175–185. [Google Scholar] [CrossRef] [PubMed] [Green Version]
  20. Davey, J.W.; Blaxter, M.L. RADSeq: Next-generation population genetics. Brief. Funct. Genomics 2010, 9, 416–423. [Google Scholar] [CrossRef]
  21. Mardis, E.R. Next-generation DNA sequencing methods. Annu. Rev. Genom. Hum. Genet. 2008, 9, 387–402. [Google Scholar] [CrossRef] [Green Version]
  22. Eltaher, S.; Sallam, A.; Belamkar, V.; Emara, H.A.; Nower, A.A.; Salem, K.F.; Poland, J.; Baenziger, P.S. Genetic diversity and population structure of F3: 6 nebraska winter wheat genotypes using genotyping-by-sequencing. Front. Genet. 2018, 9, 76. [Google Scholar] [CrossRef]
  23. Vignal, A.; Milan, D.; SanCristobal, M.; Eggen, A. A review on SNP and other types of molecular markers and their use in animal genetics. Genet. Sel. Evol. 2002, 34, 275–305. [Google Scholar] [CrossRef] [Green Version]
  24. Morin, P.A.; Luikart, G.; Wayne, R.K. SNPs in ecology, evolution and conservation. Trends Ecol. Evol. 2004, 19, 208–216. [Google Scholar] [CrossRef]
  25. Karlsson, S.; Moen, T.; Lien, S.; Glover, K.A.; Hindar, K. Generic genetic differences between farmed and wild Atlantic salmon identified from a 7K SNP-chip. Mol. Ecol. Resour. 2011, 11, 247–253. [Google Scholar] [CrossRef] [Green Version]
  26. Glover, K.A.; Pertoldi, C.; Besnier, F.; Wennevik, V.; Kent, M.; Skaala, Ø. Atlantic salmon populations invaded by farmed escapees: Quantifying genetic introgression with a Bayesian approach and SNPs. BMC Genet. 2013, 14, 74. [Google Scholar] [CrossRef] [PubMed] [Green Version]
  27. Zhao, H.; Li, C.; Hargrove, J.S.; Bowen, B.R.; Thongda, W.; Zhang, D.; Mohammed, H.; Beck, B.H.; Austin, J.D.; Peatman, E. SNP marker panels for parentage assignment and traceability in the Florida bass (Micropterus floridanus). Aquaculture 2018, 485, 30–38. [Google Scholar] [CrossRef]
  28. Puckett, E.E.; Eggert, L.S. Comparison of SNP and microsatellite genotyping panels for spatial assignment of individuals to natal range: A case study using the American black bear (Ursus americanus). Biol. Conserv. 2016, 193, 86–93. [Google Scholar] [CrossRef]
  29. Schaid, D.J.; Guenther, J.C.; Christensen, G.B.; Hebbring, S.; Rosenow, C.; Hilker, C.A.; McDonnell, S.K.; Cunningham, J.M.; Slager, S.L.; Blute, M.L.; et al. Comparison of microsatellites versus single-nucleotide polymorphisms in a genome linkage screen for prostate cancer–susceptibility loci. Am. J. Hum. Genet. 2004, 75, 948–965. [Google Scholar] [CrossRef] [Green Version]
  30. Fernández, M.E.; Goszczynski, D.E.; Lirón, J.P.; Villegas-Castagnasso, E.E.; Carino, M.H.; Ripoli, M.V.; Rogberg-Muñoz, A.; Posik, D.M.; Peral-García, P.; Giovambattista, G.J.G.; et al. Comparison of the effectiveness of microsatellites and SNP panels for genetic identification, traceability and assessment of parentage in an inbred Angus herd. Genet. Mol. Biol. 2013, 36, 185–191. [Google Scholar] [CrossRef] [Green Version]
  31. Trọng, T.Q.; van Bers, N.; Crooijmans, R.; Dibbits, B.; Komen, H.J.A. A comparison of microsatellites and SNPs in parental assignment in the GIFT strain of Nile tilapia (Oreochromis niloticus): The power of exclusion. Aquaculture 2013, 388, 14–23. [Google Scholar] [CrossRef]
  32. Dang, B.; Vu, Q.; Biesack, E.; Doan, T.; Truong, O.; Tran, T.; Ackiss, A.; Stockwell, B.; Carpenter, K.E. Population genomics of the peripheral freshwater fish Polynemus melanochir (Perciformes, Polynemidae) in a changing Mekong Delta. Conserv. Genet. 2019, 20, 1–12. [Google Scholar] [CrossRef]
  33. Dang, B.T.; Rahman, M.A.; Tran, S.Q.; Glenner, H. Genome-wide SNP analyses reveal population structure of Portunus pelagicus along Vietnam coastline. PLoS ONE 2019, 14, e0224473. [Google Scholar] [CrossRef] [Green Version]
  34. Tibihika, P.D.; Curto, M.; Dornstauder-Schrammel, E.; Winter, S.; Alemayehu, E.; Waidbacher, H.; Meimberg, H. Application of microsatellite genotyping by sequencing (SSR-GBS) to measure genetic diversity of the East African Oreochromis niloticus. Conserv. Genet. 2019, 20, 357–372. [Google Scholar] [CrossRef] [Green Version]
  35. Ashton, D.T.; Hilario, E.; Jaksons, P.; Ritchie, P.A.; Wellenreuther, M. Genetic diversity and heritability of economically important traits in captive Australasian snapper (Chrysophrys auratus). Aquaculture 2019, 505, 190–198. [Google Scholar] [CrossRef]
  36. Thongda, W.; Zhao, H.; Zhang, D.; Jescovitch, L.N.; Liu, M.; Guo, X.; Schrandt, M.; Powers, S.P.; Peatman, E. Development of SNP panels as a new tool to assess the genetic diversity, population structure, and parentage analysis of the eastern oyster (Crassostrea virginica). Mar. Biotechnol. 2018, 20, 385–395. [Google Scholar] [CrossRef] [PubMed]
  37. Vo, T.; Nguyen, H.; Nguyen, T.; Tran, H.T.T. Identification and Analysis of SNPs in Population of Vietnamese Catfish (Pangasianodon hypophthalmus), using Next Generation Sequencing and SNP Validation. MOJ Curr. Res. Rev. 2018, 1, 12–19. [Google Scholar]
  38. Kilian, A.; Wenzl, P.; Huttner, E.; Carling, J.; Xia, L.; Blois, H.; Caig, V.; Heller-Uszynska, K.; Jaccoud, D.; Hopper, C. Diversity arrays technology: A generic genome profiling technology on open platforms. In Data Production and Analysis in Population Genomics; Springer: Berlin/Heidelberg, Germany, 2012; pp. 67–89. [Google Scholar]
  39. Nguyen, N.H.; Premachandra, H.; Kilian, A.; Knibb, W. Genomic prediction using DArT-Seq technology for yellowtail kingfish Seriola lalandi. BMC Genom. 2018, 19, 107. [Google Scholar] [CrossRef] [PubMed]
  40. Gruber, B.; Unmack, P.J.; Berry, O.F.; Georges, A. dartr: An r package to facilitate analysis of SNP data generated from reduced representation genome sequencing. Mol. Ecol. Resour. 2018, 18, 691–699. [Google Scholar] [CrossRef] [PubMed]
  41. Team R Core. R: A Language and Environment for Statistical Computing; R Foundation for Statistical Computing: Vienna, Austria, 2018. [Google Scholar]
  42. Whitlock, M.C.; Lotterhos, K.E. Reliable detection of loci responsible for local adaptation: Inference of a null model through trimming the distribution of F ST. Am. Nat. 2015, 186, S24–S36. [Google Scholar] [CrossRef]
  43. Lischer, H.E.; Excoffier, L. PGDSpider: An automated data conversion tool for connecting population genetics and genomics programs. Bioinformatics 2011, 28, 298–299. [Google Scholar] [CrossRef] [Green Version]
  44. Pritchard, J.K.; Wen, W.; Falush, D. Documentation for STRUCTURE software: Version 2. 2003. Available online: http://citeseerx.ist.psu.edu/viewdoc/download?doi=10.1.1.323.9675&rep=rep1&type=pdf (accessed on 10 February 2020).
  45. Earl, D.A. STRUCTURE HARVESTER: A website and program for visualizing STRUCTURE output and implementing the Evanno method. Conserv. Genet. Resour. 2012, 4, 359–361. [Google Scholar] [CrossRef]
  46. Pritchard, J.K.; Stephens, M.; Donnelly, P. Inference of population structure using multilocus genotype data. Genetics 2000, 155, 945–959. [Google Scholar]
  47. Kopelman, N.M.; Mayzel, J.; Jakobsson, M.; Rosenberg, N.A.; Mayrose, I. Clumpak: A program for identifying clustering modes and packaging population structure inferences across K. Mol. Ecol. Resour. 2015, 15, 1179–1191. [Google Scholar] [CrossRef] [Green Version]
  48. Belkhir, K.; Bonhomme, F. Partitionml: A Maximum Likelihood Estimation of the Best Partition of a Sample into Panmictic Units; Université de Montpellier: Montpellier, France, 2002; Available online: http://www.genetix.univ-montp2.fr/partitionml.htm (accessed on 15 February 2020).
  49. Smouse, P.E.; Waples, R.S.; Tworek, J.A. A genetic mixture analysis for use with incomplete source population data. Can. J. Fish. Aquat. Sci. 1990, 47, 620–634. [Google Scholar] [CrossRef]
  50. Kumar, S.; Stecher, G.; Li, M.; Knyaz, C.; Tamura, K. MEGA X: Molecular evolutionary genetics analysis across computing platforms. Mol. Biol. Evol. 2018, 35, 1547–1549. [Google Scholar] [CrossRef] [PubMed]
  51. Mello, B. Estimating TimeTrees with MEGA and the TimeTree Resource. Mol. Biol. Evol. 2018, 35, 2334–2342. [Google Scholar] [CrossRef] [PubMed] [Green Version]
  52. Hall, B.G. Building Phylogenetic Trees from Molecular Data with MEGA. Mol. Biol. Evol. 2013, 30, 1229–1235. [Google Scholar] [CrossRef] [PubMed] [Green Version]
  53. Keenan, K.; McGinnity, P.; Cross, T.F.; Crozier, W.W.; Prodöhl, P.A. diveRsity: An R package for the estimation and exploration of population genetics parameters and their associated errors. Methods Ecol. Evol. 2013, 4, 782–788. [Google Scholar] [CrossRef] [Green Version]
  54. Sundqvist, L.; Keenan, K.; Zackrisson, M.; Prodöhl, P.; Kleinhans, D. Directional genetic differentiation and relative migration. Ecol. Evol. 2016, 6, 3461–3475. [Google Scholar] [CrossRef] [Green Version]
  55. Alcala, N.; Goudet, J.; Vuilleumier, S. On the transition of genetic differentiation from isolation to panmixia: What we can learn from GST and D. Theor. Popul. Biol. 2014, 93, 75–84. [Google Scholar] [CrossRef]
  56. Do, C.; Waples, R.S.; Peel, D.; Macbeth, G.; Tillett, B.J.; Ovenden, J.R. NeEstimator v2: Re-Implementation of software for the estimation of contemporary effective population size (Ne) from genetic data. Mol. Ecol. Resour. 2014, 14, 209–214. [Google Scholar] [CrossRef]
  57. Marandel, F.; Charrier, G.; Lamy, J.-B.; Le Cam, S.; Lorance, P.; Trenkel, V.M. Estimating effective population size using RADseq: Effects of SNP selection and sample size. Ecol. Evol. 2020, 10, 1929–1937. [Google Scholar] [CrossRef]
  58. England, P.R.; Cornuet, J.-M.; Berthier, P.; Tallmon, D.A.; Luikart, G. Estimating effective population size from linkage disequilibrium: Severe bias in small samples. Conserv. Genet. 2006, 7, 303. [Google Scholar] [CrossRef]
  59. Waples, R.S. A bias correction for estimates of effective population size based on linkage disequilibrium at unlinked gene loci. J. Conserv. Genet. 2006, 7, 167. [Google Scholar] [CrossRef] [Green Version]
  60. Beerli, P. How to use MIGRATE or why are Markov chain Monte Carlo programs difficult to use. Popul. Genet. Anim. Conserv. 2009, 17, 42–79. [Google Scholar]
  61. Felsenstein, J. Distance methods for inferring phylogenies: A justification. Evolution 1984, 38, 16–24. [Google Scholar] [CrossRef] [PubMed]
  62. Wright, S. The genetical structure of populations. Ann. Eugen. 1949, 15, 323–354. [Google Scholar] [CrossRef] [PubMed]
  63. Ali, H.; Haque, M.M.; Belton, B. Striped catfish (Pangasianodon hypophthalmus, Sauvage, 1878) aquaculture in Bangladesh: An overview. Aquac. Res. 2013, 44, 950–965. [Google Scholar] [CrossRef]
  64. Nguyen, P.; Oanh, D. Striped catfish (Pangasianodon hypophthalmus) aquaculture in Viet Nam: An unprecedented development within a decade. In Success Stories in Asian Aquaculture; Springer: Dordrecht, The Netherlands; NACA: Bangkok, Thailand; IDRC: Ottawa, ON, Canada, 2009; pp. 133–150. [Google Scholar]
  65. Nomura, T.; Honda, T.; Mukai, F. Inbreeding and effective population size of Japanese Black cattle. J. Anim. Sci. 2001, 79, 366–370. [Google Scholar] [CrossRef] [PubMed]
  66. Blower, D.C.; Pandolfi, J.M.; Bruce, B.D.; Gomez-Cabrera, M.D.C.; Ovenden, J.R. Population genetics of Australian white sharks reveals fine-scale spatial structure, transoceanic dispersal events and low effective population sizes. Mar. Ecol. Prog. Ser. 2012, 455, 229–244. [Google Scholar] [CrossRef] [Green Version]
  67. Tave, D. Inbreeding and Brood Stock Management; Food & Agriculture Organization: Quebec City, QC, Canada, 1999. [Google Scholar]
  68. Franklin, I.; Frankham, R. How large must populations be to retain evolutionary potential? J. Anim. Conserv. 1998, 1, 69–70. [Google Scholar] [CrossRef]
  69. Poulsen, A.F.; Valbo-Jørgensen, J.J. Fish migrations and spawning habits in the Mekong mainstream: A survey using local knowledge (Basin-Wide). In Assessment of Mekong fisheries: Fish Migrations Spawning the Impact of Water Management Component; Internal report; Mekong River Commission: Vientiane, Laos, 2000. [Google Scholar]
  70. Hawkins, P.; Hortle, K.; Phommanivong, S.; Singsua, Y. Underwater video monitoring of fish passage in the Mekong River at Sadam Channel, Khone Falls, Laos. River Res. Appl. 2018, 34, 232–243. [Google Scholar] [CrossRef]
  71. Kang, B.; He, D.; Perrett, L.; Wang, H.; Hu, W.; Deng, W.; Wu, Y. Fisheries. Fish and fisheries in the Upper Mekong: Current assessment of the fish community, threats and conservation. Rev. Fish Biol. Fish. 2009, 19, 465. [Google Scholar] [CrossRef]
  72. Dugan, P.J.; Barlow, C.; Agostinho, A.A.; Baran, E.; Cada, G.F.; Chen, D.; Cowx, I.G.; Ferguson, J.W.; Jutagate, T.; Mallen-Cooper, M.; et al. Fish Migration, Dams, and Loss of Ecosystem Services in the Mekong Basin. AMBIO 2010, 39, 344–348. [Google Scholar] [CrossRef] [Green Version]
  73. Baran, E.; Myschowoda, C. Management. Dams and fisheries in the Mekong Basin. Aquat. Ecosyst. Health Manag. 2009, 12, 227–234. [Google Scholar] [CrossRef]
  74. Fukushima, M.; Jutagate, T.; Grudpan, C.; Phomikong, P.; Nohara, S. Potential Effects of Hydroelectric Dam Development in the Mekong River Basin on the Migration of Siamese Mud Carp (Henicorhynchus siamensis and H. lobatus) Elucidated by Otolith Microchemistry. PLoS ONE 2014, 9, e103722. [Google Scholar] [CrossRef] [PubMed]
Figure 1. Sampling localities of samples of striped catfish across Thailand (blue star), Cambodia (yellow) and sampling clusters in Vietnam (7 locations each green star) along two main river branches of Mekong river (for details, please see Supplementary Table S1). This map was plotted by ‘maps’ and ‘mapdata’ packages in R.
Jmse 08 00471 g001
Figure 2. Principal component analyses of all catfish stocks. It is showed that the wild catfish in Thailand had greater genetic distances to the other samples. Abbreviations are given in Table 1.
Jmse 08 00471 g002
Figure 3. Structure results with K = 2, 3 and 4 according to subfigure ac. Results were plotted against CLUMPAK web-based indicated the population structure of striped catfish in this study (Subfigure a,b). The one big population comprised FCM, FVN, WCM and WVN; the second is the near standalone WTL (presented in three subfigures) and other populations (FTL & FBD) were admixture to Vietnam and Cambodia populations. Abbreviations are given in Table 1.
Jmse 08 00471 g003
Figure 4. Relative and significant migration between catfish stocks revealed under Nm method. (A) Relative migration network showed high genetic movement between farmed (green) and wild (violet) Vietnam. One direction of genetic migration from Vietnam to Bangladesh stock indicated the genetic origin from Lower Mekong river, (B) even under significance migration analysis. On the right network, WTL and FTL received genetic materials from Lower Mekong River (including WCM, FCM, WVN and FVN). Our results when taken collectively displayed there was no genetic difference between wild and farmed Vietnam, and they are in the very early stage of domestication.
Jmse 08 00471 g004
Figure 5. Time divergence between lineages. Number in bold is node relative time, normal number is branch times. Admixture population included all samples from Cambodia and Vietnam, 3 samples from Bangladesh (4%). Stock acronyms are given in Table 1.
Jmse 08 00471 g005
Table 1. Observed (Ho), expected heterozygosity (He), inbreeding (FIS) and diversity in each stock.
Catfish GroupObserved Heterozygote *Expected Heterozygote *Inbreeding *Diversity **
FBD0.071 ± 0.1410.083 ± 0.1550.109 ± 0.3300.082 ± 0.041
FCM0.055 ± 0.1820.056 ± 0.1730.068 ± 0.5120.055 ± 0.036
FTL0.076 ± 0.1610.090 ± 0.1690.102 ± 0.3980.088 ± 0.046
FVN0.049 ± 0.1230.049 ± 0.1180.004 ± 0.1780.049 ± 0.023
WCM0.056 ± 0.1380.059 ± 0.1330.037 ± 0.3220.060 ± 0.031
WTL0.497 ± 0.4590.333 ± 0.236−0.499 ± 0.7120.363 ± 0.198
WVN0.048 ± 0.1190.049 ± 0.1170.018 ± 0.1960.049 ± 0.023
Farmed catfish0.056 ± 0.1140.064 ± 0.1040.108 ± 0.2490.064 ± 0.030
Wild catfish0.092 ± 0.0100.122 ± 0.1050.096 ± 0.2840.103 ± 0.049
* Estimates and standard deviations extracted by ‘gl.basic.stats’ function in dartR, ** standard errors were based on both sampling and stochastic processes of standard diversity indices analysis in Arlequin v3.5. Abbreviations as FBD = farmed Bangladesh, FCM = farmed Cambodia, FTL = farmed Thailand, FVN = farmed Vietnam, WCM = wild Cambodia, WTL = wild Thailand and WVN = wild Vietnam.
Table 2. Results of analysis of molecular variance.
Source of VarianceDegree of FreedomSum of SquaresVariance ComponentsPercentage of Variation
Among population (wild vs. farmed fish)1743.44.61 (Va)1.53
Among individuals and population8729,098.933.34 (Vb)11.04
Within individuals8923,759.5263.99 (Vc)87.43
Fixation indices included FIS = 0.112, FST = 0.015 and FIT = 0.126. Significance test with 1023 permutations are all significant for Vb and FIS with P = 0.057 ± 0.008, for Va and FST with P = 0.070 ± 0.009 and for Vc and FIT with P = 0.032 ± 0.007.
Table 3. Pairwise FST genetic distance (below diagonal) and gene flow Nm (above diagonal) between populations.
StockFBDFCMFTLFVNWCMWTLWVN
FBD 6.27.31.43.00.31.4
FCM0.039 *** 3.213.622.40.416.4
FTL0.033 ***0.072 *** 0.91.80.40.9
FVN0.148 ***0.018 **0.220 *** 14.10.149.8
WCM0.076 ***0.011NS0.125 ***0.014 *** 0.320.6
WTL0.468 ***0.363 ***0.407 ***0.666 ***0.487 *** 0.1
WVN0.147 ***0.015 *0.217 ***0.005 ***0.012 ***0.664 ***
NS = non-significant (P > 0.05), * = P < 0.05, ** = P < 0.01, *** = P < 0.001. Nm values was calculated as [(1/FST) – 1]/4 according to Wright [62]. Stock acronyms are given in Table 1.
Table 4. Effective population size over catfish stocks for farm vs. wild fish, country and region levels.
StockNcNeCIhNeCI*
FBD910.82.9 to 511.41043.9746.5 to 1341.3
FVN3152.218.7 to infinite1239.61020.5 to 1458.7
WCM714.92.9 to infinite1210.1927.7 to 1492.4
WVN3273.632.1 to infinite1258.4998.2 to 1518.7
-: not estimable due to small sample sizes. N: number of individuals used for analysis, cNe: contemporary effective population size by LD method under random mating assumption at lowest frequency 0.05 and its CI (jackknife 95% confident interval) and hNe: historical effective population size by Migrate-N inference under Bayesian model with CI* (95% confident interval obtained by 10 independent runs). Noted that populations with sampling sizes less than 7 was not estimated. Stock acronyms are given in Table 1.

