Molecular Cloning and Polymorphism Analysis of PmFGF18 from Pinctada fucata martensii

 ,
,  ,
,
Abstract
1. Introduction
2. Materials and Methods
2.1. Samples Used in this Study
2.2. Method for the Gene Cloning and Sequence Analysis of PmFGF18
2.3. PmFGF18 Expression Level
2.4. SNP Polymorphism of PmFGF18
2.5. Data Analysis
3. Results
3.1. Cloning and Bioinformatic Analyses of PmFGF18
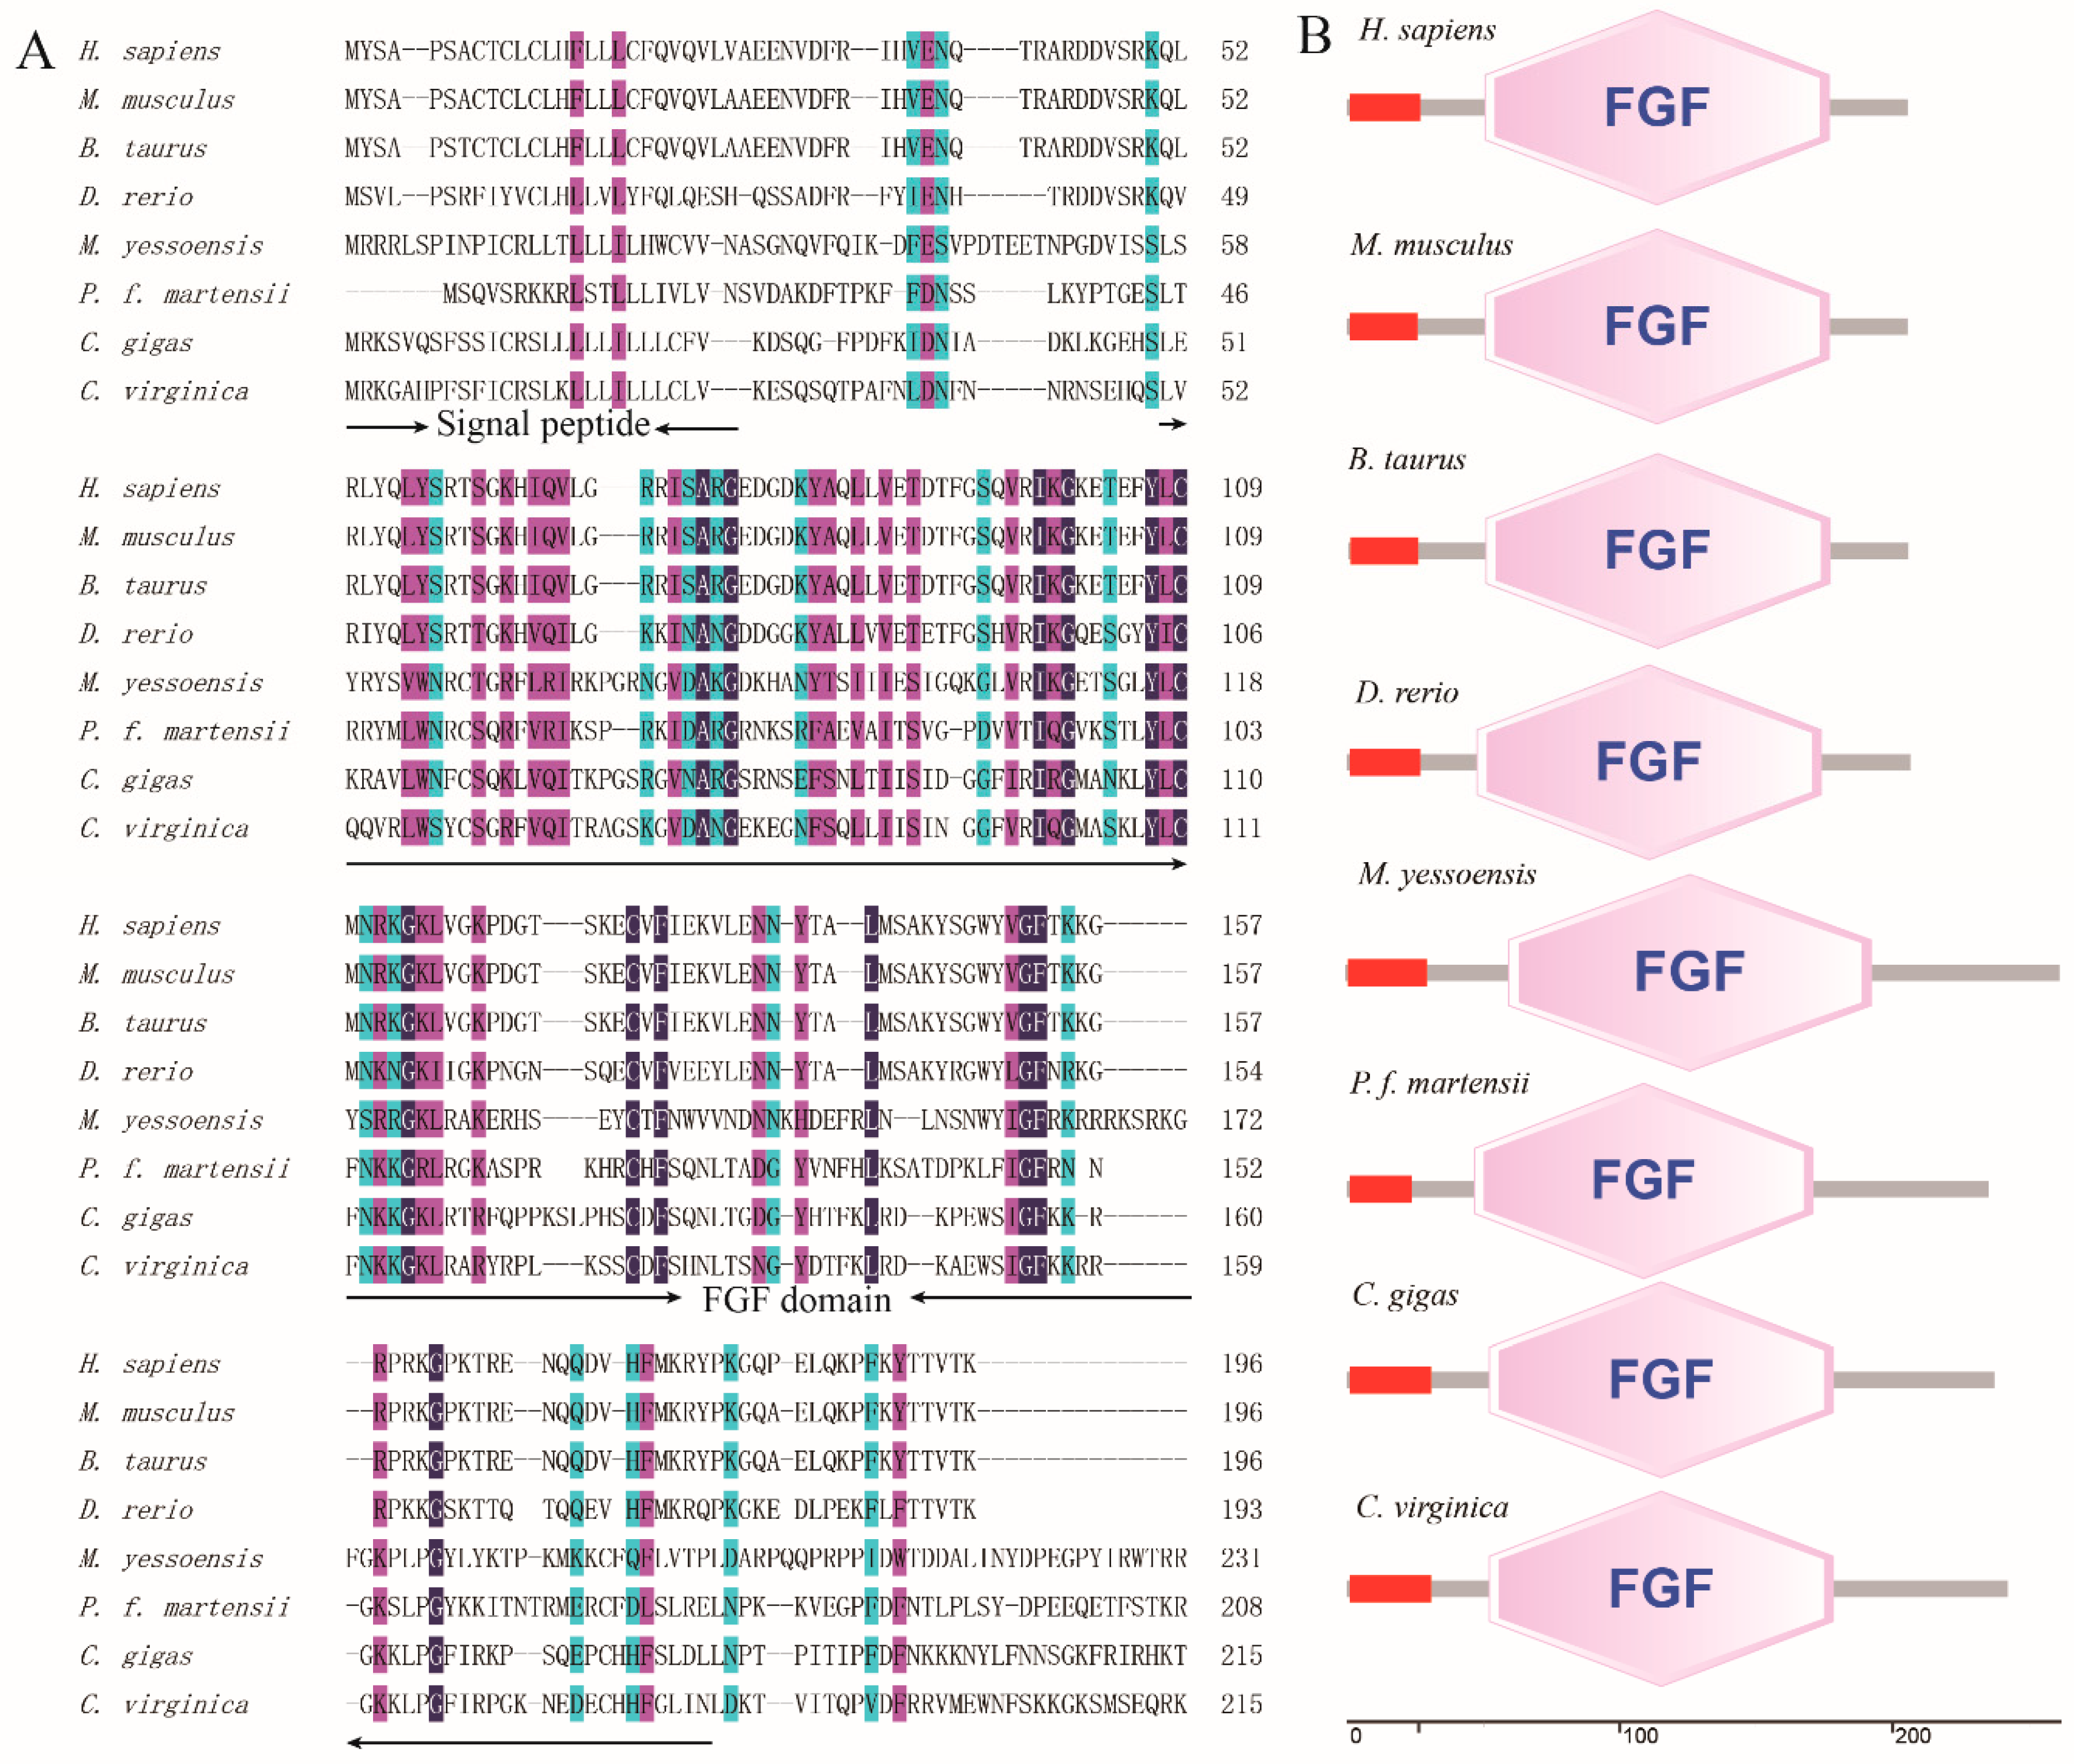
3.2. PmFGF18 Structure and Protein Homology Analysis
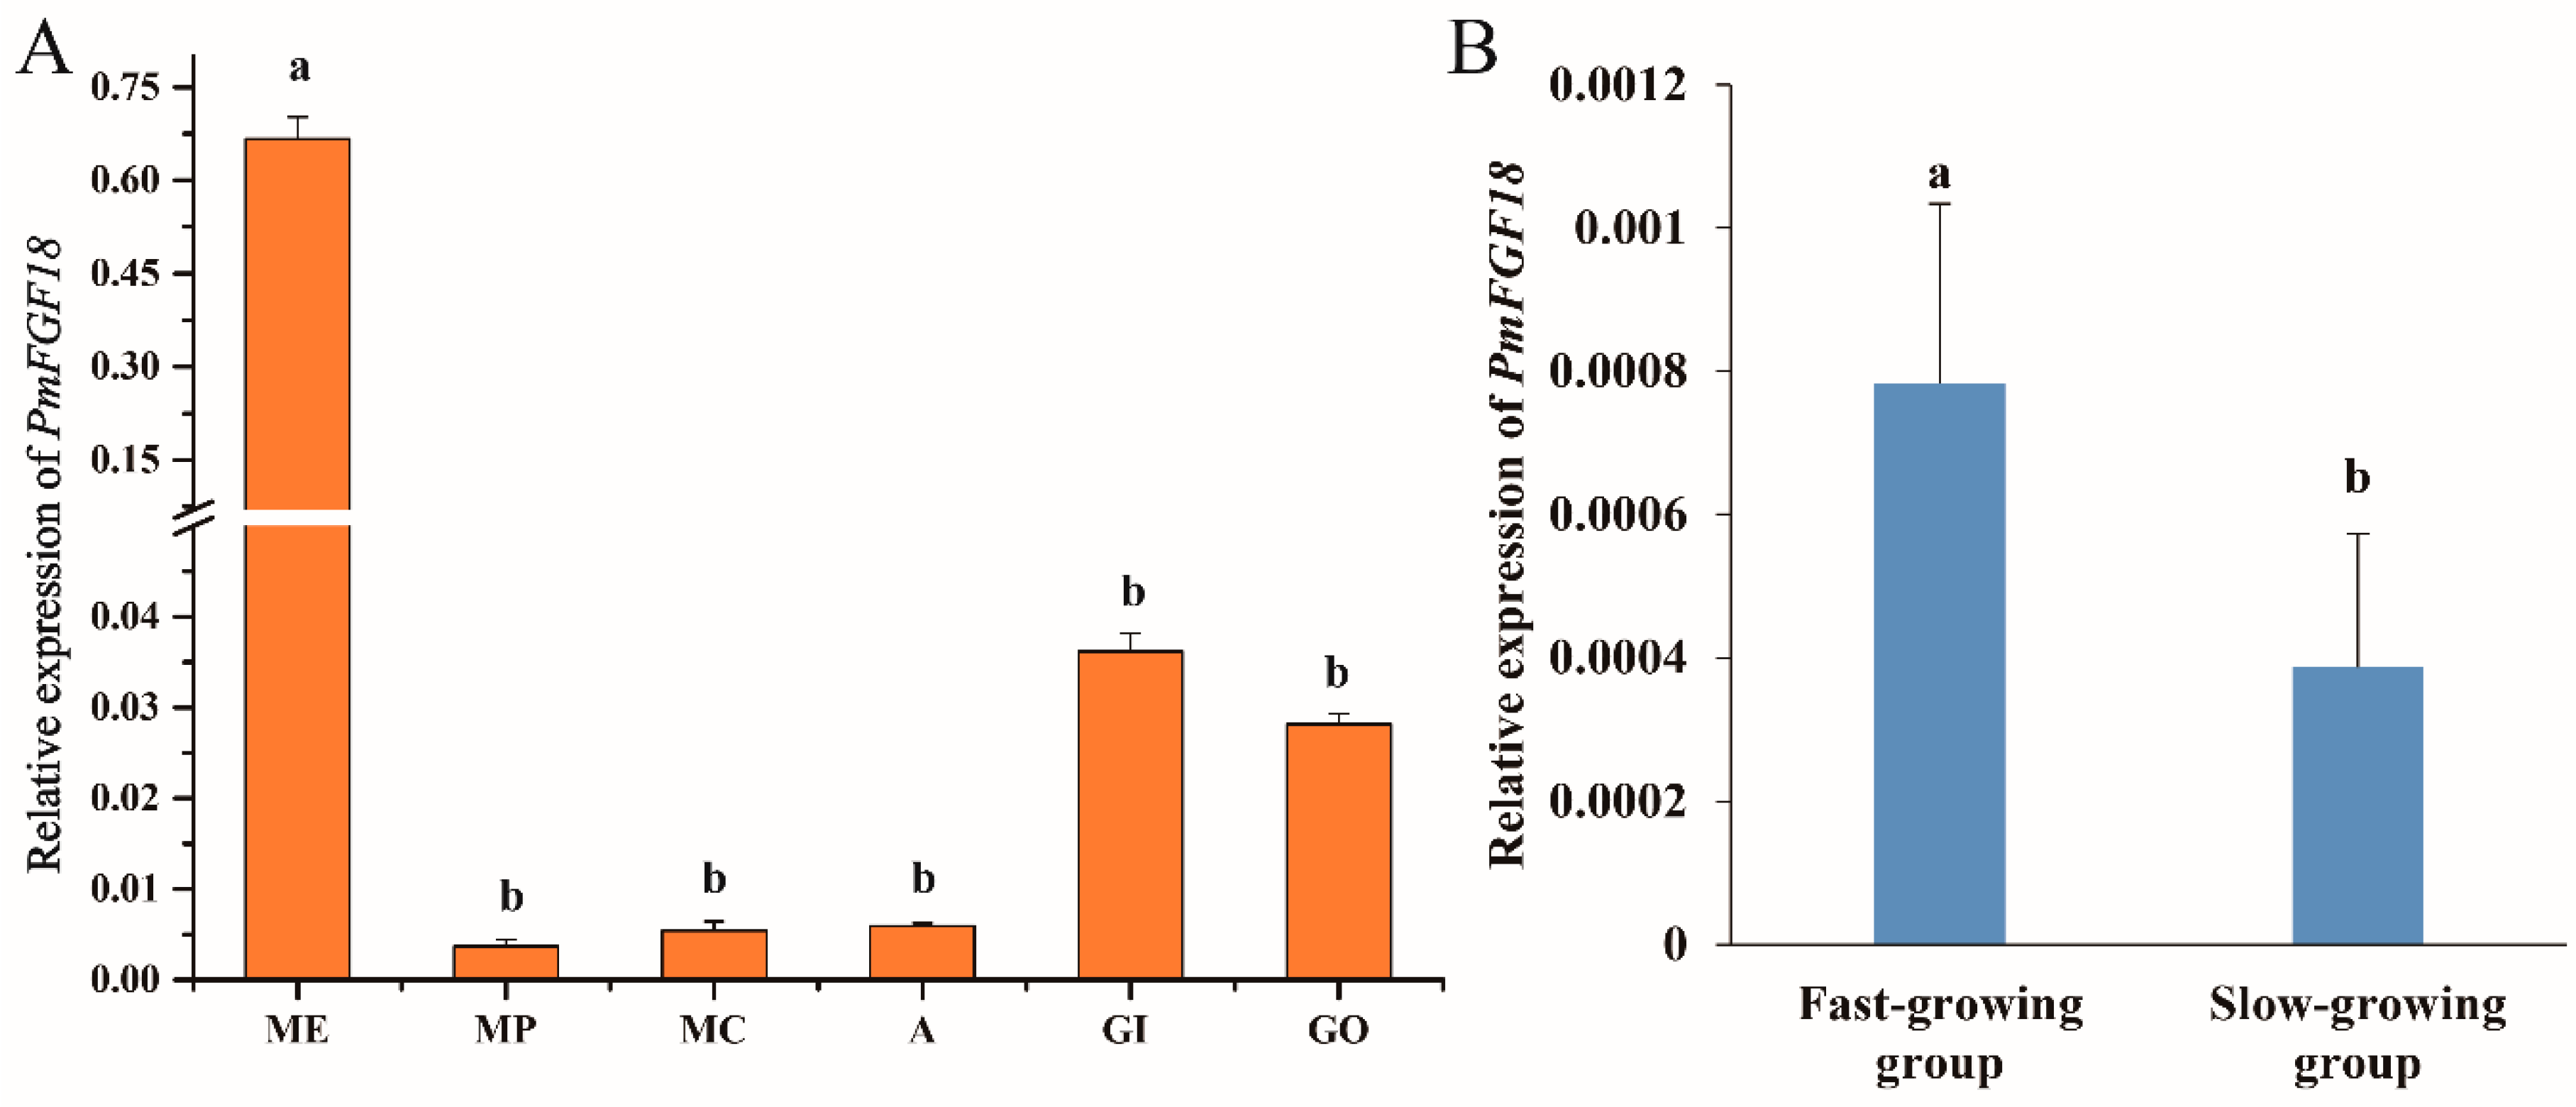
3.3. Expression Analysis of PmFGF18
3.4. PmFGF18 Polymorphism Analysis and SNP Identification
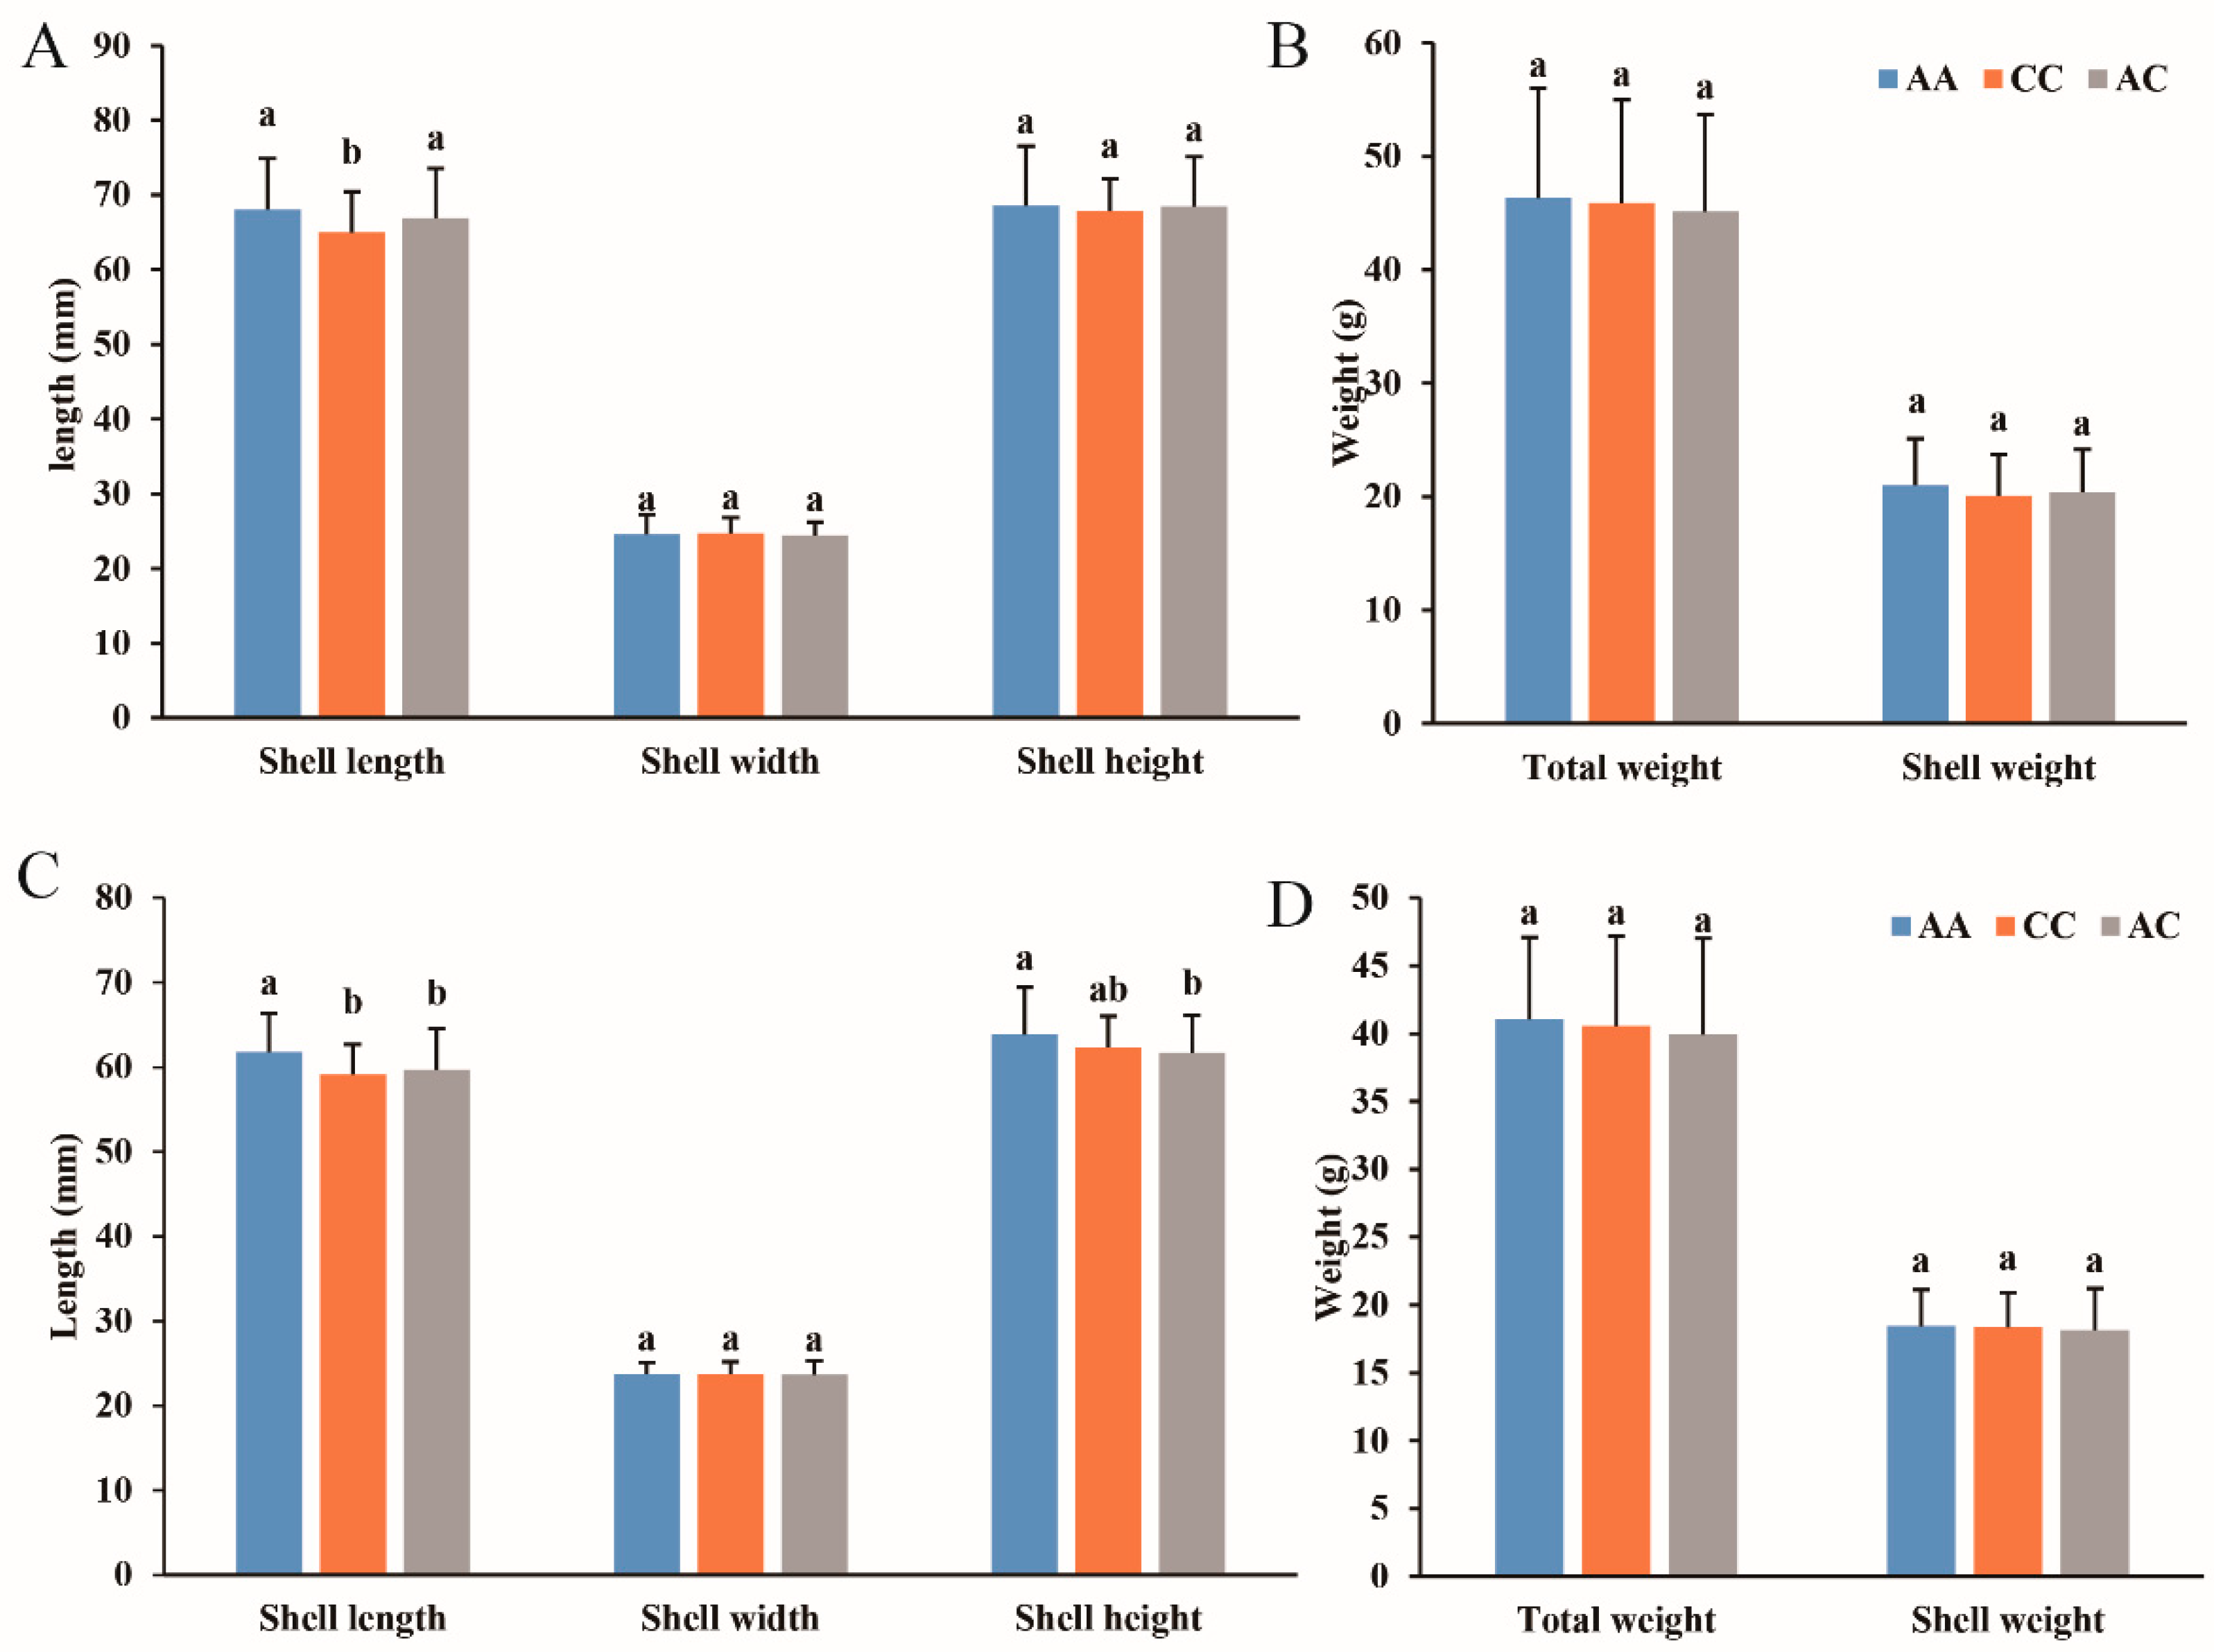
3.5. Association Analysis
3.6. SNP Verification in the Yellow Shell Color Line
4. Discussion
5. Conclusions
Supplementary Materials
Author Contributions
Funding
Conflicts of Interest
References
- Yang, C.; Du, X.; Hao, R.; Wang, Q.; Deng, Y.; Sun, R. Effect of vitamin D3 on immunity and antioxidant capacity of pearl oyster Pinctada fucata martensii after transplantation: Insights from LC-MS-based metabolomics analysis. Fish Shellfish Immun. 2019, 94, 271–279. [Google Scholar] [CrossRef] [PubMed]
- Wada, K.T.; Komaru, A. Color and weight of pearls produced by grafting the mantle tissue from a selected population for white shell color of the Japanese pearl oyster Pinctada fucata martensii (Dunker). Aquaculture 1996, 142, 25–32. [Google Scholar] [CrossRef]
- Hao, R.; Zheng, Z.; Wang, Q.; Du, X.; Deng, Y.; Huang, R. Molecular and functional analysis of PmCHST1b in nacre formation of Pinctada fucata martensii. Comp. Biochem. Phys. B 2018, 225, 13–20. [Google Scholar] [CrossRef] [PubMed]
- Deng, Y.; Fu, S.; Lu, Y.; Du, X.; Wang, Q.; Huang, H.; Liu, D. Fertilization, Hatching, Survival, and Growth of Third-Generation Colored Pearl Oyster (Pinctada martensii) Stocks. J. Appl. Aquac. 2013, 25, 113–120. [Google Scholar]
- Deng, Y.; Gao, Y.; Chen, W.; Du, X.; Lu, J. Comparison of growth performance and genetic diversity of pearl oyster (Pinctada martensii) families in a breeding program. Afr. J. Agric. Res. 2011, 6, 6530–6536. [Google Scholar] [CrossRef]
- Ren, P.; Peng, W.; You, W.; Huang, Z.; Guo, Q.; Chen, N.; He, P.; Ke, J.; Gwo, J.; Ke, C. Genetic mapping and quantitative trait loci analysis of growth-related traits in the small abalone Haliotis diversicolor using restriction-site-associated DNA sequencing. Aquaculture 2016, 454, 163–170. [Google Scholar] [CrossRef]
- Wang, J.; Li, L.; Zhang, G. A High-Density SNP genetic linkage map and QTL analysis of growth-related traits in a hybrid family of oysters (Crassostrea gigas × Crassostrea angulata) using genotyping-by-sequencing. G3 Genes Genomes Genet. 2016, 6, 1417–1426. [Google Scholar] [CrossRef]
- Li, Y.; He, M. Genetic mapping and QTL analysis of growth-related traits in Pinctada fucata using restriction-site associated DNA Sequencing. PLoS ONE 2014, 9, e111707. [Google Scholar] [CrossRef]
- Nie, H.; Yan, X.; Huo, Z.; Jiang, L.; Chen, P.; Liu, H.; Ding, J.; Yang, F. Construction of a high-density genetic map and quantitative trait locus mapping in the manila clam Ruditapes philippinarum. Sci. Rep. 2017, 7, 229. [Google Scholar] [CrossRef]
- Li, C.; Wang, J.; Song, K.; Meng, J.; Xu, F.; Li, L.; Zhang, G. Construction of a high-density genetic map and fine QTL mapping for growth and nutritional traits of Crassostrea gigas. BMC Genom. 2018, 19, 626. [Google Scholar] [CrossRef]
- Jiao, W.; Fu, X.; Dou, J.; Li, H.; Su, H.; Mao, J.; Yu, Q.; Zhang, L.; Hu, X.; Huang, X.; et al. High-resolution linkage and quantitative trait locus mapping aided by genome survey sequencing: Building up an integrative genomic framework for a bivalve mollusc. DNA Res. 2014, 21, 85–101. [Google Scholar] [CrossRef] [PubMed]
- Liu, H.; Zhang, H.; Pan, X.; Xu, M.; Huang, J.; He, M. A high density genetic map by whole-genome resequencing for QTL fine-mapping and dissecting candidate genes for growth or sex traits in the pearl oyster (Pinctada fucata martensii). Aquaculture 2020, 519, 734839. [Google Scholar] [CrossRef]
- Shi, Y.; He, M. Differential gene expression identified by RNA-Seq and qPCR in two sizes of pearl oyster (Pinctada fucata). Gene 2014, 538, 313–322. [Google Scholar] [CrossRef] [PubMed]
- Prudence, M.; Moal, J.; Boudry, P.; Daniel, J.Y.; Quere, C.; Jeffroy, F.; Mingant, C.; Ropert, M.; Bedier, E.; Van Wormhoudt, A.; et al. An amylase gene polymorphism is associated with growth differences in the Pacific cupped oyster Crassostrea gigas. Anim. Genet. 2006, 37, 348–351. [Google Scholar] [CrossRef]
- Cong, R.; Li, Q.; Kong, L. Polymorphism in the insulin-related peptide gene and its association with growth traits in the Pacific oyster Crassostrea gigas. Biochem. Syst. Ecol. 2013, 46, 36–43. [Google Scholar] [CrossRef]
- Huvet, A.; Jeffroy, F.; Fabioux, C.; Daniel, J.Y.; Quillien, V.; Van Wormhoudt, A.; Moal, J.; Samain, J.F.; Boudry, P.; Pouvreau, S. Association among growth, food consumption-related traits andamylase gene polymorphism in the Pacific oyster Crassostrea gigas. Anim. Genet. 2008, 39, 662–665. [Google Scholar] [CrossRef]
- Wang, X.; Meng, X.; Song, B.; Qiu, X.; Liu, H. SNPs in the myostatin gene of the mollusk Chlamys farreri: Association with growth traits. Comp. Biochem. Physiol. B 2010, 155, 327–330. [Google Scholar] [CrossRef]
- Guo, L.; Li, L.; Zhang, S.; Guo, X.; Zhang, G. Novel polymorphisms in the myostatin gene and their association with growth traits in a variety of bay scallop, Argopecten irradians. Anim. Genet. 2011, 42, 339–340. [Google Scholar] [CrossRef]
- Fan, S.; Xu, Y.; Liu, B.; He, W.; Zhang, B.; Su, J.; Yu, D. Molecular characterization and expression analysis of the myostatin gene and its association with growth traits in Noble scallop (Chlamys nobilis). Comp. Biochem. Physiol. B 2017, 212, 24–31. [Google Scholar] [CrossRef]
- Beenken, A.; Mohammadi, M. The FGF family: Biology, pathophysiology and therapy. Nat. Rev. Drug Discov. 2009, 8, 235–253. [Google Scholar] [CrossRef]
- Itoh, N.; Ornitz, D.M. Evolution of the Fgf and Fgfr gene families. Trends Genet. 2004, 20, 563–569. [Google Scholar] [CrossRef] [PubMed]
- Ohbayashi, N.; Shibayama, M.; Kurotaki, Y.; Imanishi, M.; Fujimori, T.; Itoh, N.; Takada, S. FGF18 is required for normal cell proliferation and differentiation during osteogenesis and chondrogenesis. Gene Dev. 2002, 16, 870–879. [Google Scholar] [CrossRef] [PubMed]
- Liu, Z. Coordination of chondrogenesis and osteogenesis by fibroblast growth factor 18. Gene Dev. 2002, 16, 859–869. [Google Scholar] [CrossRef] [PubMed]
- Ellsworth, J.L.; Berry, J.; Bukowski, T.; Claus, J.; Feldhaus, A.; Holderman, S.; Holdren, M.S.; Lum, K.D.; Moore, E.E.; Raymond, F.; et al. Fibroblast growth factor-18 is a trophic factor for mature chondrocytes and their progenitors. Osteoarthr. Cartil. 2002, 10, 308–320. [Google Scholar] [CrossRef] [PubMed]
- Shimoaka, T.; Ogasawara, T.; Yonamine, A.; Chikazu, D.; Kawano, H.; Nakamura, K.; Itoh, N.; Kawaguchi, H. Regulation of Osteoblast, Chondrocyte, and Osteoclast Functions by Fibroblast Growth Factor (FGF)-18 in Comparison with FGF-2 and FGF-10. J. Biol. Chem. 2002, 277, 7493–7500. [Google Scholar] [CrossRef] [PubMed]
- Moore, E.E.; Bendele, A.M.; Thompson, D.L.; Littau, A.; Waggie, K.S.; Reardon, B.; Ellsworth, J.L. Fibroblast growth factor-18 stimulates chondrogenesis and cartilage repair in a rat model of injury-induced osteoarthritis. Osteoarthr. Cartil. 2005, 13, 623–631. [Google Scholar] [CrossRef]
- Wang, S.; Zhang, J.; Jiao, W.; Li, J.; Xun, X.; Sun, Y.; Guo, X.; Huan, P.; Dong, B.; Zhang, L.; et al. Scallop genome provides insights into evolution of bilaterian karyotype and development. Nat. Ecol. Evol. 2017, 1, 0120. [Google Scholar] [CrossRef]
- Bonasio, R.; Zhang, G.; Ye, C.; Mutti, N.; Fang, X.; Qin, N.; Greg, D.; Yang, P.; Li, Q.; Li, C.; et al. Genomic comparison of the ants Camponotus floridanus and Harpegnathos saltator. Science 2010, 329, 1068. [Google Scholar] [CrossRef]
- Hao, R.; Du, X.; Yang, C.; Deng, Y.; Zheng, Z.; Wang, Q. Integrated application of transcriptomics and metabolomics provides insights into unsynchronized growth in pearl oyster Pinctada fucata martensii. Sci. Total Environ. 2019, 666, 46–56. [Google Scholar] [CrossRef]
- Du, X.; Deng, Y.; Wang, Q.; Xie, S.; Liu, D. Haixuan NO1 stock of pearl oyster Pinctada martensii. China Fish. 2015, 10, 53–56. (In Chinese) [Google Scholar]
- Yang, J.; Luo, S.; Li, J.; Zheng, Z.; Du, X.; Deng, Y. Transcriptome analysis of growth heterosis in pearl oyster Pinctada fucata martensii. FEBS Open Bio 2018, 8, 1794–1803. [Google Scholar] [CrossRef] [PubMed]
- Wu, Q.; Yu, H.; Wei, W.; Cheng, Y.; Huang, S.; Shi, H.; Liu, S.; Xia, J.; Jia, H.; Hao, L. Linkage disequilibrium and functional analysis of PRE1 insertion together with SNPs in the promoter region of IGFBP7 gene in different pig breeds. J. Appl. Genet. 2018, 59, 231–241. [Google Scholar] [CrossRef] [PubMed]
- Lei, C.; Li, J.; Zheng, Z.; Du, X.; Deng, Y. Molecular cloning, expression pattern of beta-carotene 15,15-dioxygenase gene and association analysis with total carotenoid content in pearl oyster Pinctada fucata martensii. Comp. Biochem. Physiol. B 2019, 229, 34–41. [Google Scholar] [CrossRef] [PubMed]
- Du, X.; Fan, G.; Jiao, Y.; Zhang, H.; Guo, X.; Huang, R.; Zheng, Z.; Bian, C.; Deng, Y.; Wang, Q.; et al. The pearl oyster Pinctada fucata martensii genome and multi-omic analyses provide insights into biomineralization. Gigascience 2017, 6, 1–12. [Google Scholar] [CrossRef] [PubMed]
- Kocot, K.M.; Aguilera, F.; McDougall, C.; Jackson, D.J.; Degnan, B.M. Sea shell diversity and rapidly evolving secretomes: Insights into the evolution of biomineralization. Front. Zool. 2016, 13, 23. [Google Scholar] [CrossRef]
- Haszprunar, G.; Wanninger, A. Molluscs. Curr. Biol. 2012, 22, 510–514. [Google Scholar] [CrossRef]
- Acosta-Salmón, H.; Southgate, P.C. Mantle regeneration in the pearl oysters Pinctada fucata and Pinctada margaritifera. Aquaculture 2005, 246, 447–453. [Google Scholar] [CrossRef]
- Sato, Y.; Inoue, N.; Ishikawa, T.; Ishibashi, R.; Obata, M.; Aoki, H.; Atsumi, T.; Komaru, A. Pearl microstructure and expression of shell matrix protein genes MSI31 and MSI60 in the pearl sac epithelium of Pinctada fucata by In Situ Hybridization. PLoS ONE 2013, 8, e52372. [Google Scholar] [CrossRef]
- Wang, Q.; Hao, R.; Zhao, X.; Huang, R.; Zheng, Z.; Deng, Y.; Chen, W.; Du, X. Identification of EGFR in pearl oyster (Pinctada fucata martensii) and correlation analysis of its expression and growth traits. Biosci. Biotechnol. Biochem. 2018, 82, 1073–1080. [Google Scholar] [CrossRef]
- Wang, Z.; Liang, F.; Huang, R.; Deng, Y.; Li, J. Identification of the differentially expressed genes of Pinctada maxima individuals with different sizes through transcriptome analysis. Reg. Stud. Mar. Sci. 2019, 26, 100512. [Google Scholar] [CrossRef]
- Zheng, Z.; Huang, R.; Tian, R.; Jiao, Y.; Du, X. Pm-miR-133 hosting in one potential lncRNA regulates RhoA expression in pearl oyster Pinctada martensii. Gene 2016, 591, 484–489. [Google Scholar] [CrossRef]
- Guo, H.; Bao, Z.; Li, J.; Lian, S.; Wang, S.; He, Y.; Fu, X.; Zhang, L.; Hu, X. Molecular characterization of TGF-beta type I receptor gene (Tgfbr1) in Chlamys farreri, and the association of allelic variants with growth traits. PLoS ONE 2012, 7, e51005. [Google Scholar] [CrossRef] [PubMed]
- Li, Y.; He, M. Correlation between Genome Methylation Level and Growth Trait of Pearl Oyster, Pinctada fucata. Pak. J. Zool. 2017, 49, 833–839. [Google Scholar] [CrossRef]
- Huang, X.; Wu, S.; Guan, Y.; Li, Y.; He, M. Identification of sixteen single-nucleotide polymorphism markers in the pearl oyster, Pinctada fucata, for population genetic structure analysis. J. Genet. 2015, 941, E1–E4. [Google Scholar] [CrossRef]
- Mastrangelo, S.; Di Gerlando, R.; Tolone, M.; Tortorici, L.; Sardina, M.T.; Portolano, B. Genome wide linkage disequilibrium and genetic structure in Sicilian dairy sheep breeds. BMC Genet. 2014, 15, 108. [Google Scholar] [CrossRef]
- Nazari, S.; Jafari, V.; Pourkazemi, M.; Miandare, H.K.; Abdolhay, H.A. Association between polymorphism in myostatin gene with quantitative traits in domesticated rainbow trout (Oncorhynchus mykiss) using PCR-SSCP method. Iran. J. Fish. Sci. 2016, 25, 109–115. [Google Scholar]
- Yang, C.; Yang, J.; Hao, R.; Du, X.; Deng, Y. Molecular characterization of OSR1 in Pinctada fucata martensii and association of allelic variants with growth traits. Aquaculture 2020, 516, 734617. [Google Scholar] [CrossRef]
- Liu, X.; Chang, Y.; Xiang, J.; Song, J.; Ding, J. Analysis of effects of shell size characters on live weight in Chinese scallop Chlamys Farreri. Oceanol. Limnol. Sin. 2002, 33, 673–677. (In Chinese) [Google Scholar]
- Hu, W.; Chen, S.; Zhang, R.; Lin, Y. Single nucleotide polymorphisms in the upstream regulatory region alter the expression of myostatin. In Vitro Cell. Dev. Biol. Anim. 2013, 49, 417–423. [Google Scholar] [CrossRef]
- Stinckens, A.; Luyten, T.; Bijttebier, J.; Van den Maagdenberg, K.; Dieltiens, D.; Janssens, S.; De Smet, S.; Georges, M.; Buys, N. Characterization of the complete porcine MSTN gene and expression levels in pig breeds differing in muscularity. Anim. Genet. 2008, 39, 586–596. [Google Scholar] [CrossRef]


| Primes | Sequence (5’–3’) | Application |
|---|---|---|
| 5’-outer | TTGTTGAAGCAGAGGTACAGGGTAGATT | Outer PCR |
| 5’-inner | GTTCTCTGCTGCCTCCGTCTTTTCCTT | Inner PCR |
| 3’-outer | CTACCCTGTACCTCTGCTTCAACAAGAA | Outer PCR |
| 3’-inner | GATGTCACTTTTCCCAAAATCTGACTGC | Inner PCR |
| PmFGF18-A | GAAATGTTACCCGTCTGTGCC | qRT-PCR |
| PmFGF18-S | GGTGGGAATTGATACGTTGATC | qRT-PCR |
| GAPDH-A | CGTTGATTATCTTGGCGAGTG | qRT-PCR |
| GAPDH-S | GCAGATGGTGCCGAGTATGT | qRT-PCR |
| Location | Number | Locus | Ho | He | HWE | PIC |
|---|---|---|---|---|---|---|
| Promoter | SNP1 | 50916942 T > C | 0.1023 | 0.0999 | 0.532498 | 0.094861 |
| SNP2 | 50916948 T > G | 0.0992 | 0.0971 | 0.576594 | 0.092275 | |
| SNP3 | 50916962 G > A | 0.0885 | 0.0875 | 0.75112 | 0.083585 | |
| SNP4 | 50916963 T > C | 0.0901 | 0.0889 | 0.724239 | 0.084909 | |
| SNP5 | 50916970 T > C | 0.0947 | 0.093 | 0.647506 | 0.088691 | |
| SNP6 | 50916971 T > A | 0.0947 | 0.093 | 0.647506 | 0.088691 | |
| SNP7 | 50916977 A > G | 0.0962 | 0.0944 | 0.623226 | 0.089835 | |
| SNP8 | 50916978 A > T | 0.0977 | 0.0958 | 0.59959 | 0.091139 | |
| SNP9 | 50916986 A > T | 0.0977 | 0.0958 | 0.59959 | 0.091139 | |
| SNP10 | 50916996 T > A | 0.0977 | 0.0958 | 0.59959 | 0.091139 | |
| SNP11 | 50917667 A > C | 0.1924 | 0.1862 | 0.396673 | 0.168744 | |
| SNP11 | 50917717 A > G | 0.5756 | 0.4769 | 0 | 0.362973 | |
| SNP12 | 50917735 A > T | 0.0611 | 0.0592 | 0.426239 | 0.057391 | |
| SNP13 | 50917780 A > T | 0.5603 | 0.4734 | 0.000003 | 0.361182 | |
| SNP14 | 50917839 A > T | 0.0779 | 0.0805 | 0.396651 | 0.077234 | |
| SNP15 | 50917897 T > C | 0.1267 | 0.1214 | 0.26371 | 0.11401 | |
| SNP16 | 50918021 T > C | 0.5496 | 0.5 | 0.010962 | 0.37479 | |
| SNP17 | 50918198 A > C | 0.4763 | 0.4221 | 0.001006 | 0.332859 | |
| SNP18 | 50918226 G > A | 0.1771 | 0.174 | 0.646955 | 0.158772 | |
| SNP19 | 50918333 C > T | 0.4366 | 0.3989 | 0.01529 | 0.319141 | |
| SNP20 | 50918342 C > A | 0.5099 | 0.4647 | 0.012593 | 0.356514 | |
| SNP21 | 50918354 T > G | 0.5099 | 0.4663 | 0.016496 | 0.35739 | |
| SNP22 | 50918365 T > G | 0.2672 | 0.2621 | 0.619233 | 0.227641 | |
| SNP23 | 50918376 C > A | 0.0473 | 0.0462 | 0.541862 | 0.045206 | |
| SNP24 | 50918398 A > T | 0.5618 | 0.5004 | 0.001655 | 0.374995 | |
| SNP25 | 50918446 G > A | 0.0611 | 0.0621 | 0.663095 | 0.060209 | |
| SNP26 | 50918498 A > G | 0.5634 | 0.5004 | 0.001261 | 0.37499 | |
| SNP27 | 50918638 A > G | 0.0641 | 0.0621 | 0.40245 | 0.060209 | |
| SNP28 | 50918729 T > C | 0.5557 | 0.5003 | 0.004568 | 0.374972 | |
| SNP29 | 50918839 T>C | 0.1405 | 0.1333 | 0.168189 | 0.124406 | |
| EXON | SNP30 | 50926498 G > T | 0.5389 | 0.4626 | 0.000024 | 0.355408 |
| SNP31 | 50926618 A > G | 0.5252 | 0.4622 | 0.000478 | 0.355171 | |
| SNP32 | 50926642 G > A | 0.0595 | 0.0578 | 0.438406 | 0.056152 | |
| SNP33 | 50926661 G > A | 0.0595 | 0.0578 | 0.438406 | 0.056152 |
| SNP | SNP Name | Genotype | Sample Number | Shell Length (mm) | Shell Width (mm) | Shell Height (mm) | Total Weight (g) | Shell Weight (g) |
|---|---|---|---|---|---|---|---|---|
| SNP1 | 50916942 T > C | TT | 587 | 67.29 ± 6.73 | 24.58 ± 2.12a | 68.42 ± 7.24 | 45.87 ± 9.18 | 20.75 ± 3.99 |
| TC | 67 | 67.53 ± 6.46 | 23.80 ± 3.14b | 68.99 ± 6.59 | 44.68 ± 8.59 | 19.89 ± 3.41 | ||
| SNP2 | 50916948 T > G | TT | 589 | 67.29 ± 6.72 | 24.58 ± 2.13a | 68.42 ± 7.22 | 45.85 ± 9.19 | 20.74 ± 3.99 |
| TG | 65 | 67.59 ± 6.53 | 23.83 ± 3.16b | 68.94 ± 6.68 | 44.78 ± 8.55 | 19.91 ± 3.45 | ||
| SNP3 | 50916962 A > G | GG | 596 | 67.29 ± 6.72 | 24.58 ± 2.12a | 68.45 ± 7.21 | 45.90 ± 9.23 | 20.76 ± 4.00a |
| AG | 58 | 67.58 ± 6.49 | 23.73 ± 3.30b | 68.70 ± 6.77 | 44.21 ± 7.86 | 19.64 ± 3.08b | ||
| SNP4 | 50916963 T > C | TT | 595 | 67.30 ± 6.73 | 24.58 ± 2.12a | 68.45 ± 7.22 | 45.92 ± 9.22 | 20.77 ± 4.00a |
| TC | 59 | 67.51 ± 6.45 | 23.68 ± 3.29b | 68.71 ± 6.72 | 44.00 ± 7.95 | 19.61 ± 3.06b | ||
| SNP5 | 50916970 T > C | TT | 592 | 67.32 ± 6.73 | 24.58 ± 2.12a | 68.46 ± 7.23 | 45.92 ± 9.25 | 20.77 ± 4.01a |
| TC | 62 | 67.26 ± 6.40 | 23.74 ± 3.19b | 68.61 ± 6.62 | 44.13 ± 7.76 | 19.63 ± 3.05b | ||
| SNP6 | 50916971 T > A | TT | 592 | 67.32 ± 6.73 | 24.58 ± 2.12a | 68.46 ± 7.23 | 45.92 ± 9.25 | 20.77 ± 4.01a |
| TC | 62 | 67.26 ± 6.40 | 23.74 ± 3.19b | 68.61 ± 6.62 | 44.13 ± 7.76 | 19.63 ± 3.05b | ||
| SNP7 | 50916977 A > G | AA | 591 | 67.30 ± 6.73 | 24.58 ± 2.13a | 68.45 ± 7.22 | 45.88 ± 9.21 | 20.75 ± 3.99 |
| AG | 63 | 67.42 ± 6.48 | 23.77 ± 3.17b | 68.76 ± 6.68 | 44.52 ± 8.30 | 19.82 ± 3.36 | ||
| SNP8 | 50916978 A > T | AA | 590 | 67.32 ± 6.72 | 24.59 ± 2.12a | 68.46 ± 7.22 | 45.90 ± 9.20 | 20.76 ± 3.98a |
| AT | 64 | 67.31 ± 6.49 | 23.72 ± 3.17b | 68.60 ± 6.74 | 44.32 ± 8.38 | 19.73 ± 3.40b | ||
| SNP9 | 50916986 A > T | TT | 590 | 67.31 ± 6.73 | 24.59 ± 2.12a | 68.44 ± 7.23 | 45.90 ± 9.20 | 20.76 ± 4.00 |
| AT | 64 | 67.36 ± 6.45 | 23.72 ± 3.17b | 68.77 ± 6.62 | 44.32 ± 8.37 | 19.78 ± 3.35 | ||
| SNP10 | 50916996 A > T | TT | 590 | 67.29 ± 6.74 | 24.58 ± 2.12a | 68.43 ± 7.24 | 45.88 ± 9.21 | 20.75 ± 4.00 |
| AT | 64 | 67.55 ± 6.33 | 23.75 ± 3.17b | 68.88 ± 6.56 | 44.51 ± 8.29 | 19.85 ± 3.31 | ||
| SNP12 | 50917717 A > G | AA | 68 | 66.95 ± 6.49 | 24.32 ± 1.92 | 66.77 ± 9.29b | 44.21 ± 8.62 | 20.96 ± 4.08 |
| GG | 210 | 66.54 ± 6.47 | 24.33 ± 2.44 | 68.10 ± 6.86ab | 45.03 ± 8.83 | 20.24 ± 3.68 | ||
| AG | 377 | 67.79 ± 6.84 | 24.63 ± 2.21 | 68.97 ± 6.85a | 46.39 ± 9.34 | 20.83 ± 4.05 | ||
| SNP13 | 50917735 A > T | AA | 615 | 67.21 ± 6.68 | 24.57 ± 2.10a | 68.39 ± 7.20 | 45.77 ± 9.13 | 20.67 ± 3.95 |
| AT | 40 | 68.75 ± 6.98 | 23.34 ± 3.82b | 69.69 ± 6.71 | 45.13 ± 9.20 | 20.32 ± 3.92 | ||
| SNP14 | 50917780 A > T | AA | 68 | 66.70 ± 6.36 | 24.27 ± 1.90 | 66.66 ± 9.20b | 44.16 ± 8.75b | 20.90 ± 4.15 |
| TT | 220 | 66.65 ± 6.32 | 24.33 ± 2.42 | 68.15 ± 6.79ab | 44.93 ± 8.83ab | 20.22 ± 3.72 | ||
| AT | 367 | 67.80 ± 6.96 | 24.64 ± 2.21 | 68.99 ± 6.91a | 46.50 ± 9.32a | 20.86 ± 4.02 | ||
| SNP17 | 50918021 T > C | TT | 138 | 67.81 ± 6.83 | 24.44 ± 2.66b | 68.23 ± 8.16 | 45.83 ± 9.65 | 21.05 ± 4.22a |
| CC | 157 | 66.41 ± 6.40 | 24.17 ± 2.60ab | 68.04 ± 7.44 | 44.94 ± 9.11 | 20.04 ± 3.72b | ||
| TC | 360 | 67.50 ± 6.76 | 24.66 ± 1.89a | 68.74 ± 6.63 | 46.03 ± 8.94 | 20.77 ± 3.91ab | ||
| SNP18 | 50918198 A > C | AA | 301 | 68.03 ± 6.85a | 24.57 ± 2.67 | 68.56 ± 7.99 | 46.33 ± 9.69 | 21.02 ± 4.11 |
| CC | 42 | 65.01 ± 5.43b | 24.70 ± 2.11 | 67.86 ± 4.33 | 45.89 ± 9.12 | 20.07 ± 3.67 | ||
| AC | 312 | 66.91 ± 6.63a | 24.40 ± 1.80 | 68.45 ± 6.63 | 45.13 ± 8.55 | 20.37 ± 3.79 | ||
| SNP26 | 50918498 A > G | AA | 145 | 67.96 ± 6.79a | 24.62 ± 1.88 | 68.26 ± 8.00 | 45.80 ± 9.51 | 20.82 ± 4.11a |
| GG | 141 | 66.37 ± 6.12b | 24.47 ± 1.87 | 67.86 ± 7.32 | 44.83 ± 8.39 | 19.96 ± 3.39b | ||
| AG | 369 | 67.40 ± 6.86ab | 24.46 ± 2.52 | 68.78 ± 6.76 | 46.04 ± 9.25 | 20.85 ± 4.05a | ||
| SNP28 | 50918729 T > C | TT | 142 | 68.22 ± 6.78a | 24.49 ± 2.64 | 68.49 ± 8.04 | 46.15 ± 9.63 | 21.10 ± 4.18 |
| CC | 149 | 66.48 ± 6.16b | 24.48 ± 1.93 | 67.93 ± 7.16 | 45.23 ± 8.83 | 20.29 ± 3.65 | ||
| TC | 364 | 67.28 ± 6.85ab | 24.51 ± 2.22 | 68.68 ± 6.82 | 45.77 ± 9.07 | 20.62 ± 3.96 | ||
| SNP32 | 50926642 G > A | GG | 616 | 67.23 ± 6.68 | 24.58 ± 2.10a | 68.40 ± 7.19 | 45.81 ± 9.15 | 20.69 ± 3.96 |
| AG | 39 | 68.44 ± 7.07 | 23.24 ± 3.84b | 69.52 ± 6.81 | 44.43 ± 8.86 | 20.00 ± 3.65 | ||
| SNP33 | 50926661 G > A | GC | 616 | 67.23 ± 6.68 | 24.58 ± 2.10a | 68.40 ± 7.19 | 45.81 ± 9.15 | 20.69 ± 3.96 |
| AG | 39 | 68.44 ± 7.07 | 23.24 ± 3.84b | 69.52 ± 6.81 | 44.43 ± 8.86 | 20.00 ± 3.65 |
Publisher’s Note: MDPI stays neutral with regard to jurisdictional claims in published maps and institutional affiliations. |
© 2020 by the authors. Licensee MDPI, Basel, Switzerland. This article is an open access article distributed under the terms and conditions of the Creative Commons Attribution (CC BY) license (http://creativecommons.org/licenses/by/4.0/).
Share and Cite
Hao, R.; Mo, C.; Adzigbli, L.; Yang, C.; Deng, Y.; Wang, Q. Molecular Cloning and Polymorphism Analysis of PmFGF18 from Pinctada fucata martensii. J. Mar. Sci. Eng. 2020, 8, 896. https://doi.org/10.3390/jmse8110896
Hao R, Mo C, Adzigbli L, Yang C, Deng Y, Wang Q. Molecular Cloning and Polymorphism Analysis of PmFGF18 from Pinctada fucata martensii. Journal of Marine Science and Engineering. 2020; 8(11):896. https://doi.org/10.3390/jmse8110896
Chicago/Turabian StyleHao, Ruijuan, Chuchu Mo, Linda Adzigbli, Chuangye Yang, Yuewen Deng, and Qingheng Wang. 2020. "Molecular Cloning and Polymorphism Analysis of PmFGF18 from Pinctada fucata martensii" Journal of Marine Science and Engineering 8, no. 11: 896. https://doi.org/10.3390/jmse8110896
APA StyleHao, R., Mo, C., Adzigbli, L., Yang, C., Deng, Y., & Wang, Q. (2020). Molecular Cloning and Polymorphism Analysis of PmFGF18 from Pinctada fucata martensii. Journal of Marine Science and Engineering, 8(11), 896. https://doi.org/10.3390/jmse8110896