Abstract
The average overtopping discharge is an important parameter for the design and reinforcement of dikes. Rock armour on the waterside slopes and berms of dikes is widely used to reduce the wave overtopping discharge by introducing slope roughness and dissipation of energy in the permeable armour layer. However, methods for estimating the influence of a rock berm and roughness of rock armour at dikes on the average overtopping discharge still need to be developed and/or validated. Therefore, this study aims to develop empirical equations to quantify the reductive influence of rock armour on wave overtopping at dikes. Empirical equations for estimating the effects of rock berms and roughness are derived based on the analysis of experimental data from new physical model tests. The influence of roughness of the rock armour applied on parts of waterside slopes is estimated by introducing the location weighting coefficients. Results show that the newly derived equations to predict the average overtopping discharge at dikes lead to a significantly better performance within the tested ranges compared to existing empirical equations.
1. Introduction
Dikes protect property and people living in the hinterland from flooding [1]. Low-lying countries especially rely heavily on good and strong dikes [2]. Nowadays, climate change and sea level rise might result in extreme events occurring more frequently, which increases the probability of wave overtopping at dikes. Wave overtopping over dikes may cause dangerous situations, like grass erosion at the inner slope (e.g., [3,4]) or even breaching of dikes [5]. Wave overtopping can be characterised by average overtopping discharge (m/s/m or L/s/m), which acts as a key parameter in the design and reinforcement of dikes. Many studies have been conducted in the last decades on wave overtopping (see for instance [6,7,8,9,10,11]) and empirical formulas are available for estimating the average overtopping discharge at dikes (see Appendix A).
With the background of climate change and sea level rise, some existing dikes may not satisfy the safety standard and therefore require reinforcement. Berms and roughness elements are widely applied to dikes, which effectively reduce the average overtopping. Herein, rock armour is often combined with other types of roughness elements (for instance Figure 1). Empirical equations from previous research including [6,10] take the effects of berms and roughness on the wave overtopping discharge into account by introducing a berm influence factor and a roughness influence factor . When the influence factors are 1.0, no influence of berms or the roughness is present, where smaller values of the influence factors indicate a larger reduction of wave overtopping due to a berm or slope roughness.
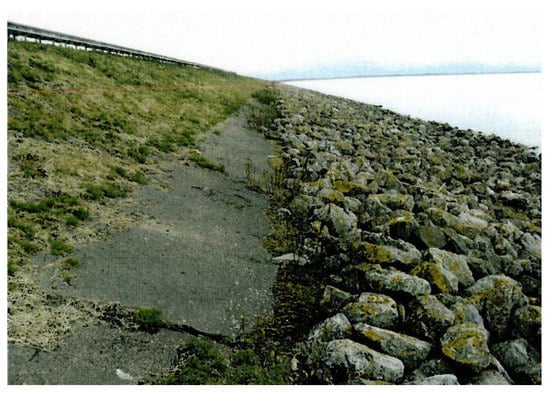
Figure 1.
Rock armour on the low part of the seaward slope (from [12]).
Several approaches have been proposed to account for the effects of roughness and berms. For the roughness influence factor, Refs. [6,10] provide reference values for various types of roughness elements in breaking wave conditions. Roughness factors are slightly influenced by the breaker parameter (Equation (A5)) in non-breaking wave conditions. For combinations of different types of roughness elements on the waterside slopes of a dike, Equation (A6) is proposed by [6,10] to estimate the overall roughness of the slopes. The roughness influence factor for two layers of rock armour on an impermeable core is recommended as 0.55 in [6]. Bruce et al. (2009) [13] determined roughness factors for 13 types of armour by conducting small-scale physical model tests and recommended that the roughness influence factor corresponds to a constant for one specific type of roughness element. Those influence factors suggested by [13] have been applied to the neural network prediction of overtopping (see for instance [7]). However, some research (e.g., [14,15,16,17]) showed that the roughness influence factors are not constant but change with wave conditions and structure configurations. Until now, there is no validated method available to evaluate the roughness influence factor of rock armour taking the effects of wave conditions and dike configurations into account.
For the estimation of the berm influence factor, Refs. [6,10] provide equations for calculating the influence factor of impermeable berms for breaking wave condition. Recently, Ref. [18] developed empirical equations with different forms from those given by [6,10] for impermeable berms that distinguish between breaking and non-breaking wave conditions. Nevertheless, these studies are limited to impermeable berms while validated equations for estimating the influence of a permeable rock berm on the average overtopping discharge at dikes are not available to the knowledge of the authors.
Chen et al. (2020) [17] developed empirical equations for the roughness and berm influence factors based on the analysis of experimental results. The equation for the berm influence factor was derived based on tests on both permeable and impermeable berms, but has until now not been validated for rock-armoured dikes.
in which is an empirical coefficient and the value of this coefficient is affected by the type of armour layer on the berm. An increasing value of means an increasing reductive influence of a berm on the average overtopping discharge.; is the wave steepness (), in which is the significant wave height and is the mean energy wave period; is a parameter representing the effect of berm width and can be calculated using Equation (A7); represents the influence of the berm level (Equation (A7)). The equation for roughness influence developed by [17] is given below:
in which is an empirical coefficient which can vary with the type of revetment and the permeability of the structure. A larger value of means a larger reductive influence of the revetment on the average overtopping discharge. For combinations of various types of armour applied along the waterside slopes of dikes, [17] introduced location weighting coefficients to account for different contributions of roughness elements installed on the upper slope, berm and down slope to the overall roughness influence factor.
where , and represent effective coverage lengths of roughness elements located between SWL – 0.25 and SWL + 0.5 as shown in Figure 2. According to [6,10], roughness elements outside of the range of SWL – 0.25 and SWL + 0.5 have little influence on the overall roughness factor. , and are roughness influence factors of roughness elements applied on the upper slope, on the berm and on the down slope respectively; , and are location weighting coefficients with for upper slope, for a berm and for down slope. The values of the location weighting coefficients indicate the contributions of roughness elements applied on different locations along the waterside slope to the overall roughness influence factor. Therefore, the roughness elements applied on the upper slope with are the most effective in reducing the average overtopping discharges while roughness elements on the berm () and on the down slope () have a relatively small reductive influence on the overtopping discharge. It is worth mentioning that the berm Equation (1), the roughness Equation (2) and the combined roughness Equation (3), were derived based on the physical model tests on smooth slopes, slopes covered by protruding blocks and open blocks. It remains unknown if these location weighting coefficients are still valid for rock armour combined with other types of roughness elements. Model tests on rock armour have not been reported in [17]. Therefore, the applicability of Equations (1)–(3) for rock armour is still unclear.
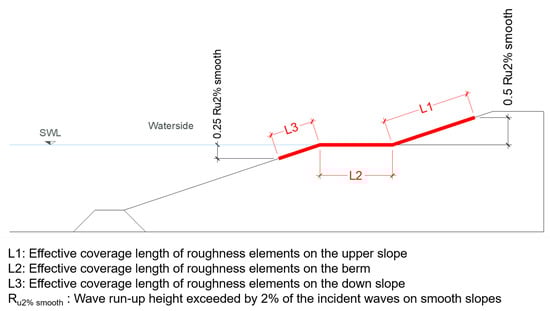
Figure 2.
Coverage lengths of roughness elements applied along the waterside slopes.
This study aims to develop empirical equations for the berm and roughness influence factors of rock armour thereby improving the predictive accuracy of average overtopping discharge at rock-armoured dikes. Chen et al. (2020) [17] forms the basis of this research. In the present study, small-scale physical model tests were conducted on the wave overtopping at rock-armoured dikes. The berm Equation (1) and the roughness Equation (2) will be evaluated for rock armour based on the analysis of experimental data. Additionally, the validity of the location weighting coefficients that are included in the combined roughness Equation (3) is evaluated for rock armour.
This paper is structured as follows: Section 2 describes test set-up, including the experimental facility and test procedure; In Section 3, the results from the physical model tests are presented; Section 4 follows with the detailed analysis of the berm and roughness influence of rock armour. The influence of the location weighting coefficients on estimated overtopping discharges is also discussed. The performances of the newly derived equations for berm and roughness influence factors of rock armour are discussed in Section 5. Section 6 summarises the main conclusions of the presented research.
2. Test Set-Up
2.1. Experimental Facility
Physical model tests on wave overtopping at rock-armoured dikes were performed in the Pacific Basin at Deltares in the Netherlands, as shown in Figure 3. This is the same experimental facility as applied in [17]. In the following, a review of the experimental facility which was also used in the present investigation is given. The Pacific Basin has a length of 18.6 m, a width of 14 m and a depth of 1.25 m. The basin is equipped with a cradle type wave board which is capable of generating both regular and irregular long-crested waves. This wave board makes use of a second order wave control to compensate for spurious waves. An irregular wave condition was applied in all of the physical model tests based on the JONSWAP spectrum with an enhancement factor of = 3.3. Wave conditions were measured by using three wave gauges installed near the toe of the modelled structures as shown in Figure 4a. The incident and reflected waves were separated by using the method given by [19]. The analysis was based on the time series of incident waves. The spectral significant wave height ( = 4) and the wave period ( = ) were obtained from the measured wave energy spectra. In [20,21] the wave period was found to appropriately describe the influence of wave energy spectra on wave run-up and wave overtopping. A wooden tank was placed behind each model to collect the overtopped water led by a chute connecting with the inner edge of the crest (see Figure 4b). One wave gauge was installed in each overtopping tank to measure the variations of water level, in which way the volume of overtopping water can be determined.
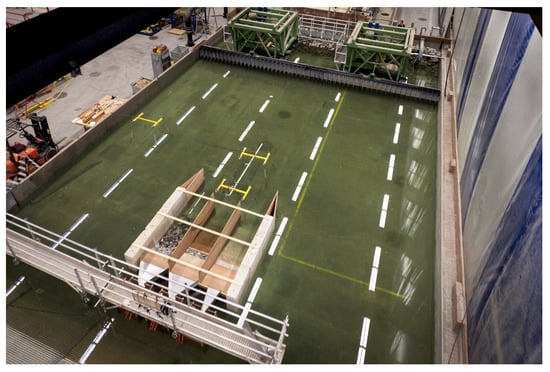
Figure 3.
Pacific Basin with models.
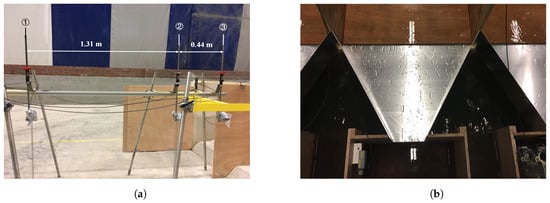
Figure 4.
Experimental instruments for measurement with (a) wave gauges in front of models (side view) and (b) overtopping chute and overtopping tank with wave gauge (top view).
2.2. Tested Structures and Test Procedure
The width of each model was 1.0 m. The core of each tested structure was impermeable and was made of concrete. The basic configurations consisted of slopes with a horizontal berm with a 1:3 slope above and below the berm. The position of the dike crest was fixed during the tests. The variations in the physical model tests included the applied location of rock armour, the berm width, the water level and the wave conditions ( and ), resulting in six series of tests of which the configurations are listed below:
- R1: Rock-armoured upper slope and a smooth berm (0.2 m) and lower slope (Figure 5);
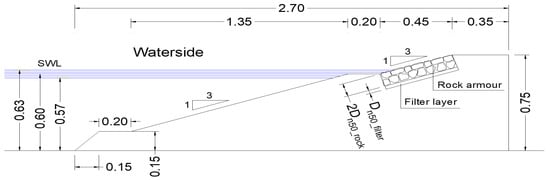 Figure 5. Test configuration (unit: m) of the R1 tests, with a rock-armoured upper slope, a smooth berm and a smooth lower slope and with = 5 cm and = 2.5 cm.
 - R2: Rock-armoured upper slope and berm (0.2 m), and a smooth lower slope (Figure 6);
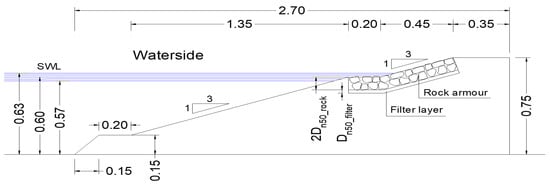 Figure 6. Test configuration (unit: m) of the R2 tests, with a rock-armoured upper slope, a rock-armoured berm and a smooth lower slope and with = 5 cm and = 2.5 cm.
 - R3: Rock-armoured structure over the entire structure with a berm (0.2 m) (Figure 7);
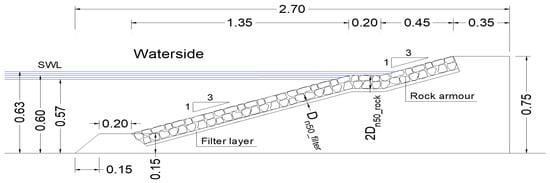 Figure 7. Test configuration (unit: m) of the R3 tests, with the entire slopes and a berm covered by rock armour and with = 5 cm and = 2.5 cm.
 - RB: Rock-armoured berm (0.2 m) with a smooth upper and lower slope (Figure 8);
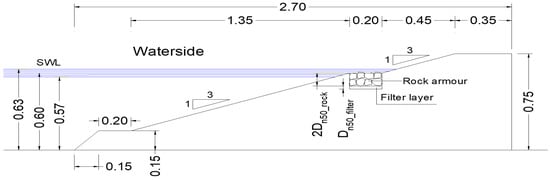 Figure 8. Test configuration (unit: m) of the RB tests, with a smooth upper slope, a rock-armoured berm and a smooth lower slope and with = 5 cm and = 2.5 cm.
 - R1N: Rock-armoured upper slope and a smooth berm (0.2 m) and down slope with wider ranges of test conditions including water levels and wave conditions than Model R1 (Figure 9);
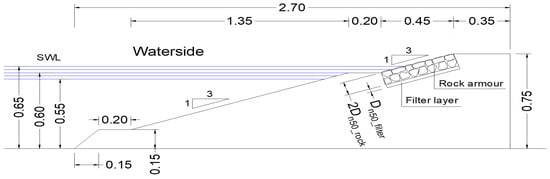 Figure 9. Test configuration (unit: m) of the R1N tests, with a rock-armoured upper slope, a smooth berm and a smooth lower slope with wider test conditions (including water levels and wave conditions) than R1. = 5 cm and = 2.5 cm.
 - R3WB: Rock-armoured structure over the entire structure with a wider berm (0.5 m) than Model R3 (0.2 m) (Figure 10).
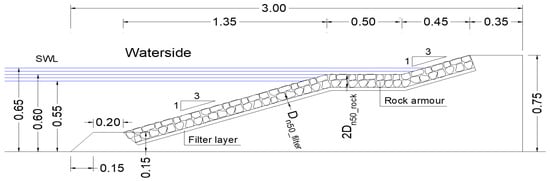 Figure 10. Test configuration (unit: m) of the R3WB tests, with rock armour on the entire slopes with a wider berm (0.5 m) than Model R3 (0.2 m) and the same test conditions as R1N. = 5 cm and = 2.5 cm.
Rock armour consisted of two layers of rocks ( = 5 cm, total thickness = 10 cm) with a filter layer underneath (thickness = 2.5 cm with = 2.5 cm). The filter layer was placed on the smooth impermeable core. Smooth parts of structures were made of detachable plywood which could be easily installed or removed to install rock armour. Rock armour was applied to different parts of the waterside slope surface to study the roughness influence including the varying roughness along the slope surface. A berm (impermeable made of concrete or permeable made of rock armour) was applied to all of the tested models in order to investigate the berm influence.
For each configuration, a series of tests were performed with various still water levels (SWL) and different wave conditions ( and ). The overtopping volume was measured for approximately 1000 waves for each test condition. The berm position as shown in Figure 5, Figure 6, Figure 7, Figure 8, Figure 9 and Figure 10 remained unchanged in the tests. Thus, the berm level relative to the still water level varied with the variation of the water depth. Datasets R1, R2, R3 and RB were analyzed to derive new equations for the berm and roughness influence factors of rock armour. Datasets R1N and R3WB were used to evaluate the performance of the newly derived equations based on the analysis of Datasets R1, R2, R3 and RB. In the four Datasets R1, R2, R3 and RB, the water depth increased from 0.57 m to 0.63 m in a step of 0.015 m for each series of tests resulting in five freeboards (0.18 m, 0.165 m, 0.15 m, 0.135 m, 0.12 m) where refers to the distance between the crest level and SWL and five berm levels with respect to SWL (−0.03 m, −0.015 m, 0 m, 0.015 m, 0.03 m). For each water level, different wave heights () were combined with different wave periods (). The wave steepness ( = ) covered the range of (0.026, 0.036). Dataset R1N, which was an extension of Dataset R1, had the same configuration as that in R1 but with a wider range of test conditions. The water level varied between 0.55 m and 0.65 m in steps of 0.025 m and the corresponding five freeboards were (0.2 m, 0.175 m, 0.15 m, 0.125 m, 0.1 m). The wave steepness varied between 0.013 and 0.042. Note that a fixed berm width B of 0.2 m was applied in Datasets R1, R2, R3, RB and R1N. Dataset R3WB was similar to the configuration of R3, but had a wide berm, with the width of 0.5 m. Wave conditions in Dataset R3WB were in nearly the same ranges as those in Dataset R1N. A summary of the parameter ranges in the tests is given in Table 1, in which is the breaker parameter ( = ). In total, 139 tests were performed in this study.

Table 1.
Summary of parameter ranges of all tests.
3. Test Results of the Average Overtopping Discharges
This section presents the results of measured average overtopping discharges from the physical model tests. All the experimental data are plotted in Figure 11a with the relative freeboard on the horizontal axis and dimensionless average overtopping discharge ( = ) on the logarithmic vertical axis. Figure 11a shows that the measured dimensionless mean overtopping discharges cover a wide range between and . Note that there also are some data points that have low values of < . However, these small values mostly result in overtopping rates less than 0.5 L/s/m in prototype in reality (which is outside the relevant range) while these very small measured discharges can be affected by scale effects in the model (see for instance, [14,22]). Therefore, those data points inside the shaded area in Figure 11a are discarded in the data analysis in this study. For completeness, four discarded data points are depicted in Figure 11a and in the figures related to the following analysis.
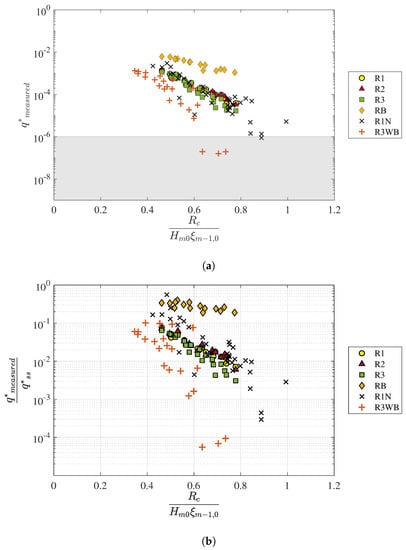
Figure 11.
Experimental results of average overtopping discharge with (a) Overtopping data for all physical model tests and (b) Overtopping ratio of measured average overtopping discharge () at rough bermed slopes and overtopping discharge () at smooth straight slopes calculated by using overtopping Equations (A1) and (A2).
Figure 11a shows that Dataset RB, which has a rock-armoured berm (0.2 m) and a smooth upper and a smooth down slope, gives the largest overtopping discharge compared to the other configurations with the same conditions. Applying rock armour on the upper slope (R1 and R1N) significantly reduces the overtopping discharge compared to RB. However, further adding rock armour on the berm (R2) and even on the down slope (R3) does not lead to a significant reduction of the overtopping discharge in comparison with R1. This indicates that the applied locations of rock armour along the waterside slopes and the berm affect the overtopping discharge reduction, which is in consistency with the finding from [17] that the roughness elements installed on the upper slope contributed the most to the overall slope roughness while the armour units on the berm and down slope have limited reductive influence on the average overtopping discharge. Figure 11a also shows that the extension of the berm width (R3WB) leads to significantly less overtopping than the narrower berm (R3), which indicates that the berm width also plays an important role in reducing the overtopping discharge at dikes.
In order to have an intuitive understanding of the effectiveness of a berm and roughness in reducing the average overtopping discharge, we plotted the ratio of measured dimensionless mean overtopping discharge () at rough bermed structures and the corresponding discharges () over smooth and straight slopes as shown in Figure 11b. was calculated using [6] overtopping Equations (A1) and (A2) since [17] showed that Equations (A1) and (A2) can provide accurate estimations of mean overtopping discharge at smooth straight slopes. It can be observed from Figure 11b that the application of a berm and rock armour at dikes could reduce the average overtopping discharge by up to 1000 times, demonstrating that berms and roughness can dramatically influence the average overtopping discharge. Nevertheless, this overtopping reduction ratio varies over quite a wide range between 0.5 and 0.001. Therefore, the predictive accuracy of berm and roughness influence is essential for estimating the mean average overtopping discharge at dikes.
4. Analysis
4.1. Evaluation of Existing Overtopping Equations
TAW and EurOtop equations provided by [6,10] respectively are widely used for predicting average overtopping discharge. The performances of these two sets of overtopping equations are first evaluated. Figure 12 shows all the measured overtopping data and the empirical equations. Note that for rock armour applied over the entire seaward side, the value of the roughness influence factor , present in on the horizontal axis, is 0.55 for two layers of rock with an impermeable core as suggested by [6,10]. For a combination of various types of roughness elements applied along the waterside slope surface (e.g., Model R1), Equation (A6) is used to calculate the overall roughness influence factor . The berm influence factor is obtained by using Equaiton (A7).
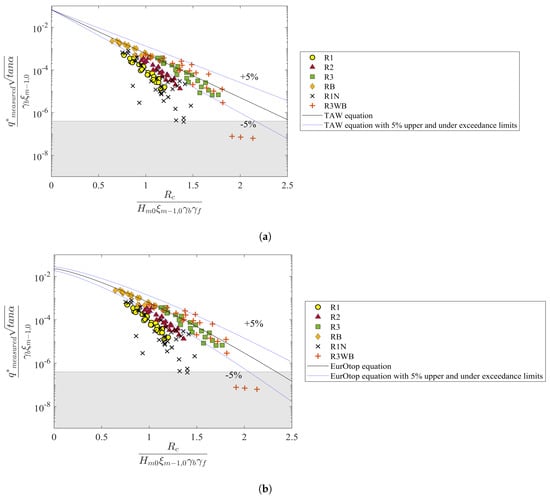
Figure 12.
Comparisons between measured overtopping data and empirical equations from (a) [6] and (b) [10].
From Figure 12, we can see that the existing TAW and EurOtop equations can give reasonable estimates of discharges for the models R3 and R3WB in which the rock armour was applied over the whole waterside slopes. However, both TAW and EurOtop equations significantly overestimate the average overtopping discharge for cases in which rock is only applied on parts of the seaward side (R1, R2 and R1N). This means that they underestimate the reductive influence of berms and roughness on the overtopping discharge, especially for rock armour on the upper slope only (R1 and R1N). Thus, it is necessary to improve the predictive methods for the berm and roughness influence of rock armour on mean overtopping discharge at dikes.
4.2. Development of Equations for Rock Berm and Rock Roughness Influence
As mentioned in Section 1, [17] developed empirical equations for the berm and the roughness influence and introduced the location weighting coefficients to deal with the varying roughness along the waterside slopes that have a berm. Here, the equations developed by [17] are used as a basis for the derivation of new equations for the berm and roughness influence factors of rock armour. First, it is assumed that the location weighting factors (0.65 for the upper slope, 0.22 for the berm and 0.13 for the down slope) as derived by [17] are also valid for rock armour. Thereafter, the Equations (1) and (2) for the berm and roughness influence factors are applied to rock armour where the two empirical coefficients and in Equations (1) and (2) require recalibration. Data sets R1, R2, R3 and RB are used for the recalibration. The berm factor for R1 is calculated by using Equation (1) with for impermeable berms as suggested in [17] since rock armour was only applied on the upper slope while the berm and down slope were smooth and impermeable in model R1. Chen et al. (2020) [17] recalibrated the [6] overtopping Equation (A1) for breaking wave conditions based on the overtopping data on smooth straight slopes. The recalibrated overtopping Equation (4) was then used as the reference formula when investigating the influence of berms and roughness elements in [17]. This study is an extension of [17], and the same experimental facilities were used in this study as those in [17]. Thus, the recalibrated overtopping Equation (4) is also applied here as a reference equation in the analysis.
The least square method is used to calibrate the values of and for rock armour such that the sum of the errors is at a minimum, and the error is defined as:
The sum of squared estimates of errors (SSE) is defined as follows:
where N is the total number of measurements; is the estimated dimensionless average overtopping discharge using empirical equations; is the measured dimensionless average overtopping discharge from one test. Applying this procedure, we determine and as 0.19 and 0.7 respectively for rock armour. Chen et al. (2020) [17] suggested that the permeable berm may have less reductive influence on the average overtopping compared with the impermeable berm with = 0.21. It is worth noting that = 0.19 for rock armour is also smaller than 0.21, showing that the permeable rock berm also has a slightly smaller reductive effect than an impermeable berm, which is in consistency with the result in [17]. Chen et al. (2020) [17] derived = 0.36 for protruding blocks. Here, is calibrated for rock armour as 0.7 using Equation (2). With the same freeboard () and wave condition ( and ), = 0.7 for rock armour results in larger reductive influence than that for protruding blocks. This is in line with earlier found results, as for instance described in [10], that the roughness of rock armour is larger than a protruding block revetment. Thus, the application of the weighting location coefficients as suggested by [17] leads to reasonable values of and for rock armour. The new equations for berm and roughness influence factors of rock armour are given below:
where and can be calculated using Equation (A7).
The wave overtopping data and empirical equations are shown in Figure 13, in which is calculated using the Equation (8) and the overall roughness factor for rock armour installed on parts of slope surface is calculated by applying Equation (3). Equation (7) is used to calculate the berm influence factor for the rock berm. There is only a slight difference between TAW equation and the recalibrated TAW Equation (4), which means that the application of Equation (4) leads to a limited improvement of the predictions of average overtopping discharge. In contrast, Figure 13 shows that the new berm and roughness equations for rock armour contribute to much less scatter than TAW and EurOtop methods presented in Figure 12. The data points calculated by using the new equations are more concentrated around the empirical equation lines compared to existing Equations (A5)–(A7) for the roughness and berm influence.
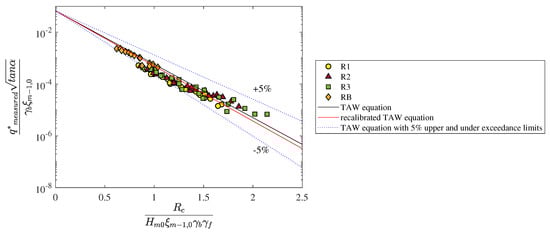
Figure 13.
Wave overtopping data calculated using the new berm and roughness equations for rock armour.
The performances of the new Equations (7) and (8) and the existing prediction methods are also quantitatively evaluated and compared using the accuracy metrics of , Root Mean Square Error () and Nash–Sutcliffe model efficiency coefficient (NSE) defined as follows:
where N is the total number of measurements; is the mean value of . indicates the tendency of the prediction method to overestimate or underestimate the average overtopping discharge. reflects the difference between the predicted and measured average overtopping discharge, where a small indicates a tight fit of prediction models to the measured data. is a measure of correlation between the measured and the predicted overtopping rates and it can vary between −∞ and 1. = 1 corresponds to a perfect match of predicted data to the measured data. = 0 indicates that the predicted values are as accurate as the mean of the measured data and < 0 means that the measured mean is a better predictor than the empirical formula. The closer the is to 1, the more accurate the prediction model is. Table 2 presents the accuracy measures of different prediction equations and shows that the and of the new Equations (7) and (8) are better than those given by TAW and EurOtop equations. Both TAW and EurOtop equations give the same value of (0.42) and the same value of (0.56), which indicates that these two methods provide comparable estimates of average overtopping discharges within the tested ranges. The value of 0.42 shows that TAW and EurOtop overall overestimate the average overtopping discharge, which is in accordance with the observations from the scatter diagram (Figure 12). The new equations have a much smaller positive value (0.09) of , showing a significantly smaller overestimation of the average overtopping discharge. The of new equations has a value of 0.21 which is smaller than 0.56 produced by TAW and EurOtop. The NSE for Equations (7) and (8) is 0.89, which is also significantly better than the NSE values given by TAW and EurOtop equations, further demonstrating that the new equations significantly improved the estimates of the overtopping rates compared to the existing prediction methods.
Table 2.
Accuracy measures of estimates given by new equations and existing methods for data sets R1, R2, R3 and RB.
4.3. Influence of Location Weighting Factors on Estimated Average Overtopping Discharges
In the derivation of new equations for berm and roughness factors of rock armour, it was assumed that the location weighting factors (0.65, 0.22 and 0.13) are still valid for rock-armoured structures. The location weighting coefficients were first introduced by [17] to deal with combinations of different types of roughness elements installed along the slopes with a berm and are therefore expected to not be affected by types of armour units. According to [17], these weighting factors (0.65, 0.22 and 0.13) work well for protruding blocks or open blocks applied on parts of the seaward side as well as combinations of protruding blocks and open blocks applied along the slope surface (e.g., protruding blocks on the upper slope and open blocks on the berm and down slope). Here, it is analyzed whether these values also work well for estimating the overall roughness factor for rock armour applied on parts of the waterside slopes that have a berm. The analysis was performed following the procedure as listed below:
- Vary the location weighting coefficients, i.e., , and in the range of (0, 1) with = 1. For each set of values of , and , the least square method is applied to calibrate the values of empirical coefficients and using all data sets such that the sum of squares of the errors (Equation (6)) is at the minimum. Here, we introduce the least of sum of squared estimates of errors () to represent the minimum value of SSE. Thus, each set of location weighting factors produces one value. Smaller indicates better estimates of average overtopping discharge.
- In Section 4.2, we already argue that should be smaller than 0.21 (for impermeable berms) and is expected to be larger than 0.36. Therefore, all the resulting data that have > 0.21 or < 0.36 were regarded as invalid and therefore be discarded.
- The contour of the effective data of varying with the variations of and () is plotted in Figure 14.
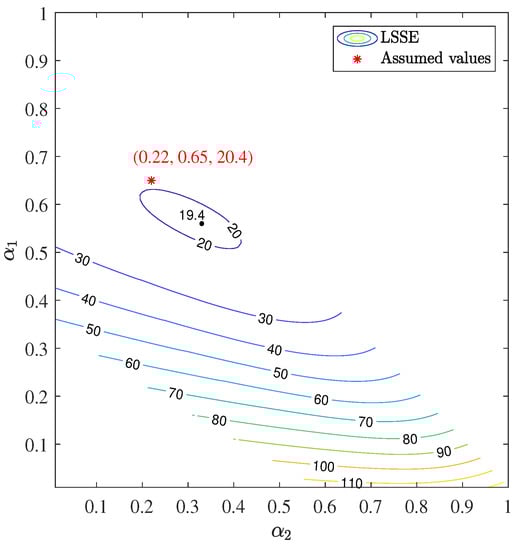 Figure 14. Effect of variations of location weighting factors with < 0.21 and > 0.36 on LSSE of overtopping data from all data sets R1, R2, R3, RB, R1N and R3W.
Figure 14 shows that is the most sensitive to the value of for upper slope. If the value of is fixed, the variations of the values of and do not change the values of significantly. As seen from Figure 14, the minimum of is 19.4 corresponding to = 0.56, = 0.33 and = 0.11. However, we do not aim at searching for the optimal values of location weighting factors. Instead, the focus is to check whether the assumed values (0.65, 0.22 and 0.13) lead to good estimates of the average overtopping discharge at slopes partly covered by rock armour. If the assumed weighting factors produce a that is much larger than the minimum 19.4, they cannot be regarded as being valid for rock armour. Figure 14 shows that the assumed values of the location weighting factors result in a of 20.4 which is quite close to the minimum 19.4. Therefore, even though the assumed weighting factors are not the optimal values, they can still provide accurate estimates of the average overtopping discharges with a relatively small value of . We therefore conclude that the location weighting coefficients (0.65, 0.23 and 0.13) are also valid for rock armour applied on parts of the waterside slopes with a berm.
5. Discussion
New empirical equations for berm and roughness influence factors of rock armour are derived by recalibrating the empirical coefficients in the berm and roughness equations developed by [17], making use of Datasets R1, R2, R3 and RB. In this section, the newly derived empirical equations are first validated by using Datasets R1N and R3WB. Following that, comparisons of the measured and the predicted average overtopping discharges given by the new equations and existing prediction methods for all data sets are provided.
5.1. Validation of New Equations
In order to check the performance of the new equations for estimating the average overtopping discharge at rock-armoured dikes, Datasets R1N with a wider range of test conditions and R3WB with a wider berm, i.e., 0.5 m are analysed.
Figure 15 shows the comparisons between the measured and the predicted dimensionless average overtopping discharges using [6,10] and the new equations. There is less scatter present in Figure 15c than in Figure 15a,b. The performance of the new equations is significantly better for the structure R1N tested for a wider range of test conditions (wider ranges of wave steepness and berm levels, etc.) but for the structure with a very wide berm, there is no improvement using the new equations compared to TAW and EurOtop equations.
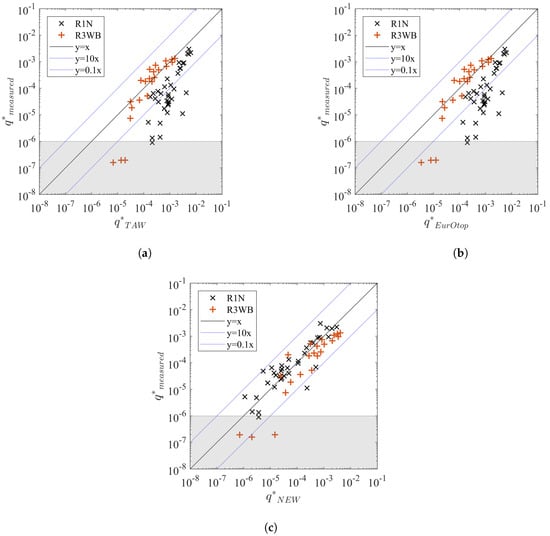
Figure 15.
Comparisons of dimensionless average overtopping discharges between the measured and the predicted values for the Datasets R1N and R3WB using (a) the TAW equations given by [6], (b) the EurOtop equations given by [10] and (c) the new equations.
The factors are −0.70 for TAW equations, −0.71 for EurOtop equations and 0.68 for the new equations, which demonstrates that the new equations on average improve the estimations of the average overtopping discharge. For the Dataset R1N (a wider range of test conditions), the new equations lead to a significantly better performance than the other equations: −1.32 for TAW, −1.33 for EurOtop and 0.7 for the new equations. For the Dataset R3WB (very wide berm, ), the NSE factor is 0.81 for TAW, 0.82 for EurOtop and 0.5 for the new equations.
To explain possible causes for the reduced performance of the new equations for the structure with a very wide berm, further analysis is performed by analysing whether the expression for the berm (Equation (7)) or the expression for the roughness (Equation (8)) contributes the most to the reduced performance for a very wide berm. Therefore, the data for the wide berm (Dataset R3WB) is compared to the new berm equation (Equation (7)) in combination with the TAW roughness value, and to the new roughness equation (Equation (8)) in combination with the TAW berm equation. Figure 16 shows the results by using the new equation for the berm influence (Equation (7)) combined with the roughness factor of 0.55 recommended by [6]. By comparing Figure 16a with Figure 15a, we can see that the results are similar to those given by TAW. The factors for the data in Figure 16a and Figure 15a are 0.75 and 0.81 respectively, which means that the new berm equation performs with similar accuracy as the TAW berm equation for this very wide berm (0.5 m). Figure 16b shows the results using the new equation for the roughness Equation (8) combined with the TAW berm Equation (A7), indicating the new roughness equation results in an overestimation of average overtopping discharge. The factor decreases from 0.81 for TAW to 0.36. Thus, it is the new roughness equation (Equation (8)) that mainly reduces the accuracy of the new set of equations for a very wide berm. The possible cause of the overestimation given by the new roughness equation is that this equation (Equation (7)) overestimates the overtopping for small relative freeboard as shown in Figure 17. Similar results are also found in Figure 6 in [17] in which some data with deviate from the fitting curve, resulting in an underestimation of roughness influence on average overtopping discharge. This underestimation of the roughness influence is limited in Dataset R1N as the rock armour is only applied on the upper slope. Thus, further research on roughness influence for smaller relative freeboard (), is needed to further improve the predictions of the overtopping discharge, especially for cases with combined wide berms and roughness elements applied on the most of or the entire waterside slope surface.
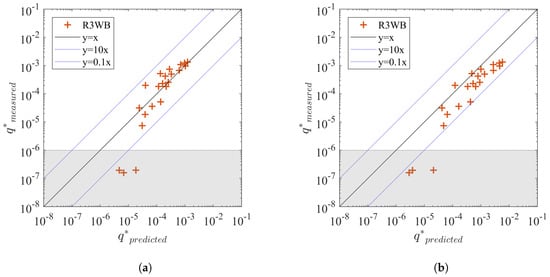
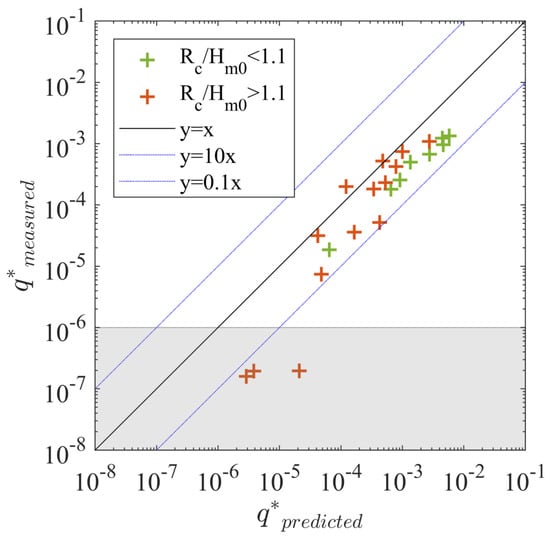
Figure 17.
Measured vs estimated average overtopping discharge with different ranges of relative freeboard for Dataset R3WB.
5.2. Comparison with Existing Equations
The performance of the new equations for berm and roughness influence of rock armour derived in this study is compared with [6,10] equations using all data sets. The comparisons of the measured and the predicted average overtopping discharges using the new equations and the existing equations in Figure 18 show that the new equations lead to much less scatter than the mentioned existing equations. Additionally, the number of outliers larger than a factor of 10 difference between the measured and predicted values, are reduced using the new equations. The new equations fit well with the experimental data with a of 0.073, an of 0.34 and a of 0.8. TAW equations with an of 0.81 and a of −0.13 performs similarly as, although slightly better than, EurOtop equations with an of 0.82 and a of −0.14 and both of them overestimate the average overtopping discharges with the same of 0.56, especially for rock armour applied on parts of the waterside slope surface. The new equations for the berm and the roughness influence factors of rock armour significantly improved the predictions of the average overtopping discharge within the tested ranges.
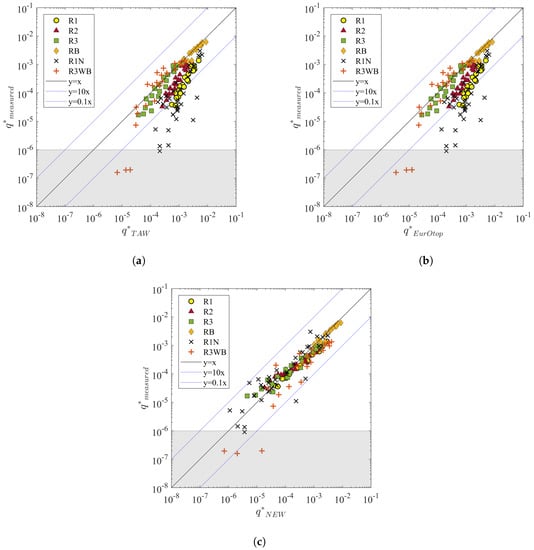
Figure 18.
Comparisons of measured and predicted dimensionless average overtopping discharges calculating using (a) TAW equations given by [6], (b) EurOtop equations given by [10] and (c) New equations for all data sets.
6. Conclusions
This study is an extension of [17]. The effects of a berm and roughness of rock armour on the average overtopping discharge are investigated through small-scale physical model tests. 139 tests were performed in total by varying wave conditions and structure configurations.
Test results show that the application of a berm and rock armour can significantly reduce the average overtopping discharge compared to that at smooth straight slopes. New equations for estimating the berm and roughness factors of rock armour are derived based on most of the experimental data by recalibrating the empirical coefficients in the Equations (1) and (2) as suggested by [17] for structures with other protections. The location weighting factors proposed by [17] are used to estimate the overall roughness of slope partly covered by rock armour. The influence of the values of the location weighting factors on predictions of average overtopping discharges is also investigated. It is found that the values of location weighting factors as proposed by [17] for structures with other slope protections, appear to be valid for rock-armoured slopes as well.
The performance of the new equations is validated by using the experimental data with a wider range of test conditions compared with the calibration set. The new equations contribute to an obvious improvement with a of 0.7 on estimates of average overtopping discharge over the structure with rock armour applied on the upper slope, even though the wave conditions are outside the calibration ranges. For the structure with a wider berm (), the new berm equation performs comparably with the TAW berm equation. The range of validity of the new expression for roughness is limited to rock-armoured structures that have a larger relative freeboard (). Thus, the new equation for the influence of roughness on rock-armoured slopes needs further investigation for smaller relative freeboards () in combination with very wide berms (). Overall, the new equations to account for the influence of a rock berm and the influence of roughness of rock armour significantly improve the predictions of the average overtopping discharges at rock-armoured dikes with within the tested ranges.
The present study is performed with relatively deep-water at the toe of the dike (). It is recommended to verify the findings from the present study also for conditions with shallow foreshores, including conditions with severe wave breaking on the foreshore.
The berm and roughness equations developed in this study can be applied to estimate the effectiveness of a rock berm or rock armour in reducing the average overtopping discharge when designing or reinforcing a dike. An accurate estimation of berm and roughness influence on the average overtopping discharge would help with the cost-effective design or reinforcement and safety assessment of a dike.
Author Contributions
Conceptualization, research plan and supervision, M.R.A.v.G., W.C., J.J.W. and S.J.M.H.H.; Experiments and data analysis, W.C. and A.M.; writing—original draft preparation, W.C.; writing—review and editing, M.R.A.v.G., J.J.W., S.J.M.H.H. and A.M. All authors discussed the results and contributed to the final manuscript. All authors have read and agreed to the published version of the manuscript.
Funding
The first author was financially supported by China Scholarship Council (CSC).
Acknowledgments
This work is also part of the All-Risk research programme, with project number P15-21. Professors Giorgio Bellotti and Leopoldo Franco (University of Roma Tre, Italy) are acknowledged for their advise to parts of the study. The model technicians of Deltares are thanked for their contributions to the physical model tests.
Conflicts of Interest
The authors declare no conflict of interest. The funders had no role in the design of the study; in the collection, analyses, or interpretation of data; in the writing of the manuscript, or in the decision to publish the results.
Abbreviations
| Angle of the waterside slope of a dike [] | |
| Location-weighting factor for the upper slope [-] | |
| Location-weighting factor for the berm [-] | |
| Location-weighting factor for the down slope [-] | |
| Roughness influence factor [-] | |
| Berm influence factor [-] | |
| Influence factor of a vertical wall [-] | |
| Influence factor of oblique waves [-] | |
| Combined factor of all kind of geometrical influences [-] | |
| Breaker parameter [-] | |
| Empirical coefficient for the berm influence factor [-] | |
| B | Berm width [m] |
| Level of dike crest relative to the still water level [m] | |
| Empirical coefficient for the roughness influence factor [-] | |
| Spectral significant wave height obtained from spectral analysis [m] | |
| Wave period obtained from spectral analysis [s] | |
| Wave steepness based on wave period [-] | |
| Influence of berm width [-] | |
| Influence of berm level [-] | |
| Water depth above the berm [m] | |
| q | Average overtopping discharge [m/s/m] or [L/s/m] |
| Dimensionless average overtopping discharge [-] | |
| Effective coverage length of roughness elements on the upper slope [m] | |
| Effective coverage length of roughness elements on the berm [m] | |
| Effective coverage length of roughness elements on the down slope [m] | |
| Characteristic berm length [m] | |
| Wave run-up height, exceeded by 2% of the incident waves [m] | |
| Wave run-up height, exceeded by 2% of the incident waves on the smooth slopes [m] | |
| Median value of rock armour unit nominal diameter[m] | |
| Median value of armour unit nominal diameter for filter layer [m] | |
| Thickness of rock armour layer [m] | |
| Thickness of filter layer [m] |
Appendix A. Technical Background
Appendix A.1. Overtopping Equations
Overtopping equations for breaking and non-breaking waves are given by [6] as below:
with a maximum of
EurOtop (2018) [10] adapted the [6] overtopping equations especially for low freeboards, including a zero freeboard. The EurOtop overtopping equations are listed as follows
with a maximum of
where q [m/s/m] is the average overtopping discharge; is the angle of waterside slope; [m] is the freeboard which is the vertical distance between the dike crest and the still water level; is the breaker parameter; [-] is the influence factor for berms; [-] is the influence factor for roughness; [-] is the influence factor for oblique waves; is the influence factor for vertical walls; [-] is a combined factor of all kind of geometrical influences.
Appendix A.2. Equations for Roughness and Equation Influence Factors
The method given by [6,10] to deal with the roughness is described as:
in which refers to the recommended values of the roughness factors by [6,10]. For varying roughness along the slopes and berms, the various influence factors are weighted in [6,10] by using the lengths of the relevant sections of the slope. For example, if three types of roughness elements with applied lengths of , and and influence factors of , and respectively are applied along the slopes with a berm, then the weighted average as proposed by [6,10] is:
TAW (2002) [6] and EurOrop (2018) [10] provide a method to calculate the influence factor for berms.
where [-] represents the influence of the berm width B [m] and represents the effect of [m] which refers to the water depth above the berm; is the characteristic berm length (see Figure A1); is the wave run-up height that is exceeded by 2% of the number of incoming waves at the toe of the structure and can be calculated by using the equations below [6]:
with a maximum of

Figure A1.
Definition of a berm of a dike from [6].
References
- Schmocker, L.; Hager, W.H. Modelling dike breaching due to overtopping. J. Hydraul. Res. 2009, 47, 585–597. [Google Scholar] [CrossRef]
- Van der Meer, J.W. Wave run-up and overtopping. In Dikes and Revetments; Routledge: Abingdon, UK, 2017; pp. 145–160. [Google Scholar]
- Bomers, A.; Lopez, J.A.; Warmink, J.J.; Hulscher, S.J.M.H. Modelling effects of an asphalt road at a dike crest on dike cover erosion onset during wave overtopping. Nat. Hazards 2018, 93, 1–30. [Google Scholar] [CrossRef]
- Van Bergeijk, V.M.; Warmink, J.J.; Van Gent, M.R.A.; Hulscher, S.J.M.H. An analytical model of wave overtopping flow velocities on dike crests and landward slopes. Coast. Eng. 2019, 149, 28–38. [Google Scholar] [CrossRef]
- Van Gent, M.R.A. Wave overtopping events at dikes. In Coastal Engineering 2002: Solving Coastal Conundrums; World Scientific: Singapore, 2003; pp. 2203–2215. [Google Scholar]
- TAW. Technical report wave run-up and wave overtopping at dikes. In TAW Report (Incorporated in the EurOtop Manual); Technical Advisory Committee on Flood Defence: The Hague, The Netherlands, 2002. [Google Scholar]
- Van Gent, M.R.A.; Van den Boogaard, H.F.P.; Pozueta, B.; Medina, J.R. Neural network modelling of wave overtopping at coastal structures. Coast. Eng. 2007, 54, 586–593. [Google Scholar] [CrossRef]
- Goda, Y. Derivation of unified wave overtopping formulas for seawalls with smooth, impermeable surfaces based on selected CLASH datasets. Coast. Eng. 2009, 56, 385–399. [Google Scholar] [CrossRef]
- Van Doorslaer, K.; De Rouck, J.; Audenaert, S.; Duquet, V. Crest modifications to reduce wave overtopping of non-breaking waves over a smooth dike slope. Coast. Eng. 2015, 101, 69–88. [Google Scholar] [CrossRef]
- Van der Meer, J.W.; Allsop, N.W.H.; Bruce, T.; De Rouck, J.; Kortenhaus, A.; Pullen, T.; Schüttrumpf, H.; Troch, P.; Zanuttigh, B. Manual on Wave Overtopping of Sea Defences and Related Structures. An Overtopping Manual Largely Based on European Research, but for Worldwide Application. 2018. Available online: www.overtopping-manual.com (accessed on 22 December 2018).
- Williams, H.E.; Briganti, R.; Romano, A.; Dodd, N. Experimental analysis of wave overtopping: A new small scale laboratory dataset for the assessment of uncertainty for smooth sloped and vertical coastal structures. J. Mar. Sci. Eng. 2019, 7, 217. [Google Scholar] [CrossRef]
- Van der Meer, J.W.; Bruce, T.; Pearson, J.M.; Hart, R. Overtopping on Rock Berm With Smooth Upper Slope; Validation Tests at University of Edinburgh; Infram Report: 04i080; Infrastructure and Water Management: The Hague, The Netherlands, 2004.
- Bruce, T.; Van der Meer, J.W.; Franco, L.; Pearson, J.M. Overtopping performance of different armour units for rubble mound breakwaters. Coast. Eng. 2009, 56, 166–179. [Google Scholar] [CrossRef]
- Capel, A. Wave run-up and overtopping reduction by block revetments with enhanced roughness. Coast. Eng. 2015, 104, 76–92. [Google Scholar] [CrossRef]
- Van Steeg, P.; Joosten, R.; Steendam, G. Physical model tests to determine the roughness of stair shaped revetments. In Proceedings of the 3rd International Conference on Protection against Overtopping, Lake District, UK, 6–8 June 2018. [Google Scholar]
- Kerpen, N.B.; Schoonees, T.; Schlurmann, T. Wave overtopping of stepped revetments. Water 2019, 11, 1035. [Google Scholar] [CrossRef]
- Chen, W.; Van Gent, M.R.A.; Warmink, J.J.; Hulscher, S.J.M.H. The influence of a berm and roughness on the wave overtopping at dikes. Coast. Eng. 2020, 156, 103613. [Google Scholar] [CrossRef]
- Liu, S.; Ju, Q.; Huang, W.; Hu, X.; Qi, D.; Zhong, G. Effects of Crown Wall and Berm on Wave-Overtopping Discharge over a Seawall. J. Coast. Res. 2018, 34, 968–978. [Google Scholar] [CrossRef]
- Mansard, E.P.D.; Funke, E.R. The measurement of incident and reflected spectra using a least squares method. Coast. Eng. 1980, 1980, 154–172. [Google Scholar]
- Van Gent, M.R.A. Physical Model Investigations on Coastal Structures With Shallow Foreshores: 2D Model Tests with Single and Double-Peaked Wave Energy Spectra; Delft Hydraulics Report H3608; Deltares (WL): Delft, The Netherlands, 1999. [Google Scholar]
- Van Gent, M.R.A. Coastal flooding initiated by wave overtopping at sea defences. In Proceedings of the Coastal Disasters 2002, San Diego, CA, USA, 24–27 February 2002; ASCE: Reston, VA, USA, 2002; pp. 223–237. [Google Scholar]
- Sigurdarson, S.; Van der Meer, J.W. Wave overtopping at berm breakwaters in line with EurOtop. In Proceedings of the 33rd International Conference on Coastal Engineering, Santander, Spain, 1–6 July 2012. [Google Scholar]
© 2020 by the authors. Licensee MDPI, Basel, Switzerland. This article is an open access article distributed under the terms and conditions of the Creative Commons Attribution (CC BY) license (http://creativecommons.org/licenses/by/4.0/).