Abstract
A compact low-velocity ocean current energy harvester (LOCH) is developed to power undersea instrument platforms for long-term scientific seafloor observation. Noncontact magnetic couplings are used in the LOCH to eliminate friction and achieve reliable underwater sealing so that the LOCH can adapt the low-velocity ocean current and its energy transmission efficiency can be improved. The parameters of the magnetic couplings are optimized by the three-dimensional finite-element method (3D FEM). A laboratory experiment platform is designed; and the static and dynamic performances of the magnetic couplings with different parameters are tested. The experiment results are compared with computer simulations to verify the optimal parameter design. Finally; a prototype of the LOCH is designed and its underwater experiment proves that it can start smoothly and work stably at a current velocity of as low as 0.4 m/s
1. Introduction
Seafloor oceanography instruments mainly rely on batteries for science data collection at present. The data can only be obtained after instrument recovery and the data acquisition frequency is low. Cabled seafloor observatories realize long-term, real-time, and high-frequency ocean observation by linking fixed undersea stations on the seafloor to shore by submarine cables [1,2]. However, the seafloor coverage and instrument interfaces of a cabled observatory are limited. When an instrument is deployed far away from fixed undersea stations, it is difficult and of high cost to wire the instrument directly to the cabled observatory. If the instrument can be self-powered by harvesting a kind of ocean energy on the seafloor, data can be collected sustainably and even sent to the nearest undersea station by acoustic communications [3]. At present, the power consumptions of typical oceanography instruments are around one to several watts.
Ocean energies mainly include thermal energy, salinity gradient energy, wave energy, tidal energy, current energy, and biomass energy in seafloor sediments [4,5,6,7]. The thermal energy and the salinity gradient energy are widely distributed in the ocean, but the spatial scales of the temperature and the salinity differences are large, both leading to large power generators. The wave energy and the tidal energy are difficult to be used by the instruments located at the seafloor and far away from the shore, which is often the case in scientific seafloor observation. Benthic microbial fuel cells use biomass energy in seafloor sediments to generate electricity, but they only have tens of milliwatts of electricity per square meter [8]. As the ocean on our planet is a continuously dynamic natural system, the ocean current energy is widely distributed and the energy density is larger than other ocean energies, which makes it an ideal energy source for in situ instruments [9,10].
In recent years, various ocean current turbines have been developed and reported by many countries [11,12,13,14,15]. Some remain in the design stage and some have been put into pilot demonstrations [16]. Most of them have blades of more than ten meters, power of kilowatts to megawatts, and weigh hundreds of tons. They can only operate in strong ocean currents of above 2 m/s, so the areas with high-velocity currents need to be selected as installation sites, and the huge volume and weight also make them unable to move flexibly after installation.
However, high-velocity ocean currents only exist in a few special seafloor areas or periods, and most of the seafloor areas have low-velocity ocean currents most of the time, where the average velocity is less than 1.0 m/s [17,18]. If a compact device can be developed to harvest the kinetic energy of widely existing low-velocity ocean currents and then convert it into electrical energy to power instruments, a self-powered long-term seafloor observation node can be realized and the high cost of underwater cables and the cable laying can be saved. Moreover, the frequent battery replacement in the traditional method can be avoided and the high risk of underwater cable damage can be eliminated. As the low-velocity ocean current energy is unstable, these self-powered extension nodes might have lower data frequency than the ones wired to cabled observatories.
At present, low-velocity ocean current energy harvesters (LOCHs) are still in the laboratory stage [19]. Compared with the high-velocity ocean current power generator, the key of LOCHs is to start at low-velocity ocean currents. The solution is to improve the turbine power coefficient via parameter optimizations or to improve energy transmission and conversion efficiency by system damping reduction. Currently, most of the studies have focused on the turbine [20,21,22] and the generator [23]. Goundar and Ahmed designed a 5 m horizontal axis marine current turbine using a genetic algorithm, at an average velocity of 0.85 m/s and with a maximum efficiency of 47% to 48% at a rated velocity of 2.1 m/s [24]. Masoud et al. studied a two-bladed horizontal axis marine current turbine by testing two scale models of 500 and 800 mm, and the maximum power coefficient is 0.44 [25]. Tian et al. optimized the blade design for a cut-in velocity of 0.25 m/s to increase the maximum power coefficient [26]. Seifeddine et al. compared different generator types and found that permanent magnet synchronous generator (PMSG) direct drives are much more applicable for marine applications [27]. Xu et al. developed a device that can generate an average power of 0.08 W at 0.16 m/s using an integral generator [28]. However, there are few studies on the transmission module optimization [29]. The traditional mechanical transmission and dynamic sealing widely used tends to wear out, leading to frictional resistance increasing, energy transfer efficiency reduction, water leakage, and even device failure [30].
A compact LOCH for seafloor observation is proposed in this paper. The hermeticity and low friction resistance is the key for LOCHs to achieve long-term reliable operation under low-velocity ocean current environments, especially under the deep sea. As the mechanical torque loss caused by big friction in traditional dynamic sealing greatly affects the starting performance of LOCHs, noncontact magnetic couplings are used in this study to deal with this issue and to improve the energy transmission efficiency. The proposed LOCH is compared with previous studies in terms of the radius of the turbine, current velocity, output power, and overall efficiency, as shown in Table 1. The comparison results show that the proposed LOCH has an advantage in overall efficiency.

Table 1.
Comparison between previous studies and the proposed low-velocity ocean current energy harvester (LOCH).
The paper is organized as follows. Firstly, the overall structure and turbine design of the proposed LOCH is introduced. Secondly, the magnetic coupling parameters are optimized by the three-dimension finite-element method (3D FEM). Then, an experiment platform is designed and the static and dynamic performances of the magnetic coupling are tested. At last, a prototype of the LOCH is developed and verified by underwater experiments.
2. LOCH Design and Parameter Optimization
2.1. Overall Design
The principle and the overall design of the proposed LOCH are shown in Figure 1a,b. Ocean currents drive the turbine to rotate, and the kinetic energy of the seawater is transmitted to the electrical power generator via the magnetic coupling to generate electricity for powering instruments. Then, the data collected by the instruments can be sent to the nearby fixed undersea stations by an acoustic communication module. The generated electrical power can also be stored in the energy storage module for later use.
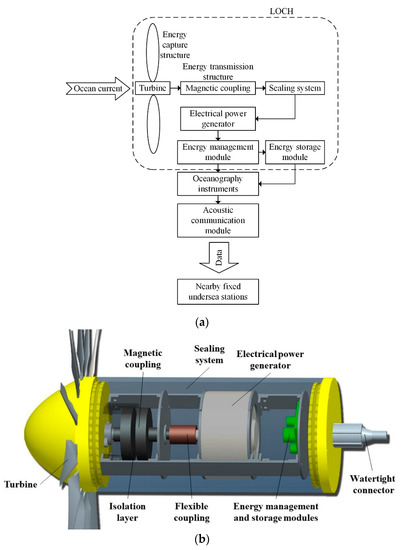
Figure 1.
The principle (a) and the overall design (b) of the proposed LOCH.
2.2. Turbine Selection
For a horizontal axis LOCH, the turbine design is similar to that in the horizontal axis wind power generation device. The current energy captured by the turbine Pin is
where CP is the power coefficient of the turbine, ρ is the density of the seawater, r is the radius of the turbine and v is the ocean current velocity. The turbine airfoil is optimized based on the NACA4412 type and the CP is 0.4 [31].
The output power of the LOCH Pout is
where ηL is the overall efficiency of the LOCH, thus the radius of the turbine r can be expressed as:
Considering the power consumption of instruments, the LOCH needs to output at least 2 W of power at the lowest rated ocean current velocity of 0.4 m/s. Assuming ηL is 55%, the radius of the turbine r must be at least 0.3 m and Pin is 3.6 W. The turbine parameters are shown in Table 2 and the manufactured turbine is shown in Figure 2.

Table 2.
The parameters of the turbine.
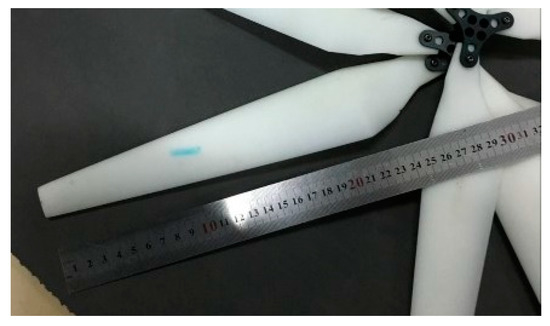
Figure 2.
The manufactured turbine.
The transmitted torque of the turbine is
where Tt is the transmitted torque of the turbine and ωt is the angular velocity of the turbine.
Therefore, the maximum transmission torque of the magnetic coupling should be greater than 14.5 Nm.
2.3. Magnetic Coupling Structure
A magnetic coupling is composed of an active rotor connected with the turbine, a driven rotor connected with the electrical power generator, and an isolation layer made of non-ferromagnetic material that allows the magnetic field to pass completely. Magnetic couplings can be divided into axial-flux and radial-flux types, as shown in Figure 3. They both consist of two rotors with the same number of permanent magnets, which are alternately magnetized along the circumference.
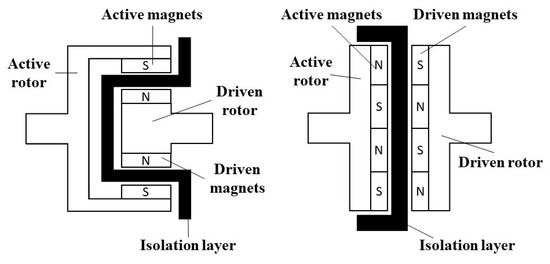
Figure 3.
Radial-flux (left) type and axial-flux (right) type magnetic couplings.
In the static state, the N-poles and the S-poles face each other under the magnetic attractive force, and there is no deflection angle between them. In the starting state, the active rotor is rotated by the turbine, but the driven rotor is still at rest initially due to the inertia and friction, so a deflection angle appears. Then, the N-poles (S-poles) of the magnets on the active rotor pull the S-poles (N-poles) of the magnets on the driven rotor, and meanwhile, the N-poles (S-poles) push the N-poles (S-poles), which causes the driven rotor to rotate along with the active rotor. Under the working state, there is a deflection angle between the driven rotor and the active rotor, as shown in Figure 4. Thus, magnetic couplings can transmit torque without mechanical contact and the two rotors can be separated by an isolation layer, which achieves static sealing of the torque transmission structure.
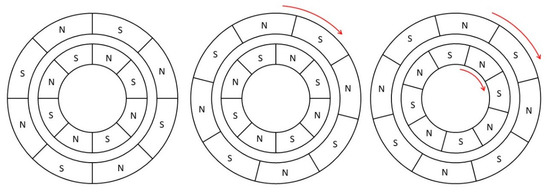
Figure 4.
The static (left), starting (middle) and working (right) states of magnetic couplings.
The axial-flux type magnetic coupling is used in this paper, as shown in Figure 5, because of its compact volume, simple magnet shape, small axial length, and adjustable air-gap length. As the LOCH needs to be compact for installation in instrument platforms, the outer radius of the magnet is set to be 54 mm, and the inner radius is 12 mm. Nd-Fe-B rare-earth permanent magnets are used and the remanence Br is 1.25 T. The magnets are sector-shaped and the pole-arc to pole-pitch ratio is 1.
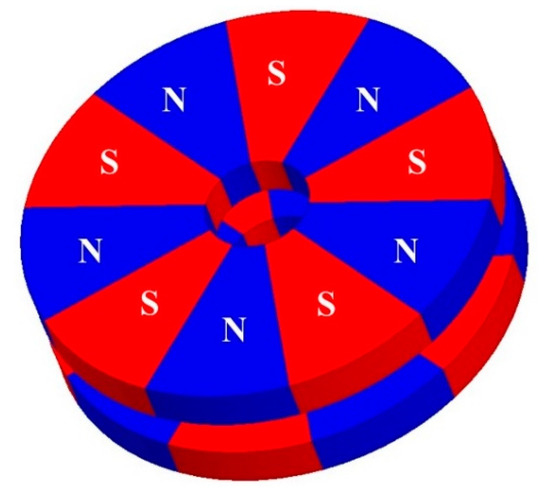
Figure 5.
The axial-flux type magnetic coupling used in the proposed LOCH.
The torque transmission performance of the magnetic coupling is mainly affected by the number of pole pairs p, the magnet thickness h, the air-gap length a and the iron yoke thickness e. The influence of these parameters on the transmission performance is studied individually in the following sections by 3D FEM to obtain an optimal design.
3. Magnetic Coupling Parameter Optimization
3.1. D FE Simulation Modeling
The electromagnetic computation of magnetic couplings is carried out by the 3D FEM because of its high accuracy. The software ANSOFT MAXWELL is used in this study for the torque analysis. Figure 6 shows the simulation model of the magnetic coupling and Figure 7 shows the meshing of the simulation model.
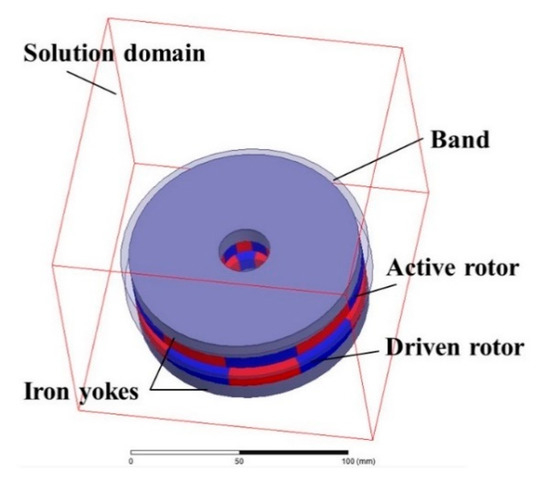
Figure 6.
The simulation model of the magnetic coupling.
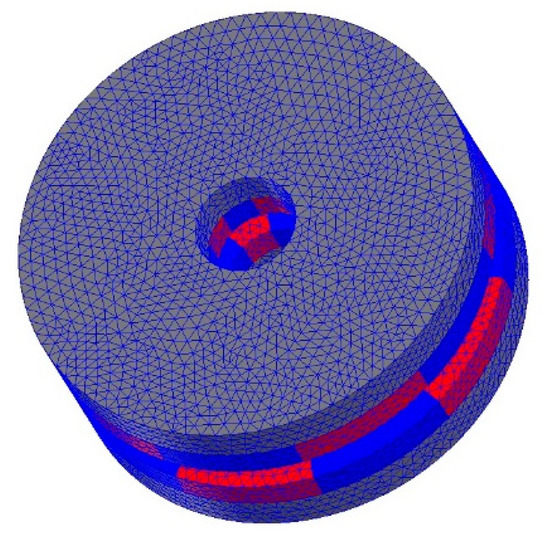
Figure 7.
The meshing of the simulation model.
3.2. Pole Pairs
The number of pole pairs p is an important parameter of magnetic couplings. Ten groups of magnetic couplings that only differ in the number of pole pairs, from 1 to 10, are studied. The transmitted torque of the magnetic couplings with different pole pairs is shown in Figure 8.
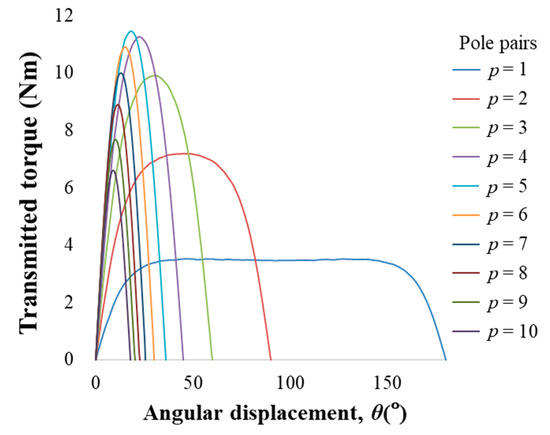
Figure 8.
The transmitted torque of the magnetic couplings with different pole pairs.
As shown in Figure 8, the transmitted torque is a periodic function of the angular displacement θ. The period of the periodic function is 2π/p, and the maximum transmitted torque is produced by the magnetic coupling when the angular displacement is half of a pole pitch. When the load torque is greater than the maximum transmitted torque, the magnetic coupling will slip and stop working to achieve overload protection.
Figure 9 shows the relationship between the maximum transmitted torque and the number of pole pairs at air-gap lengths from 4 to 14 mm.
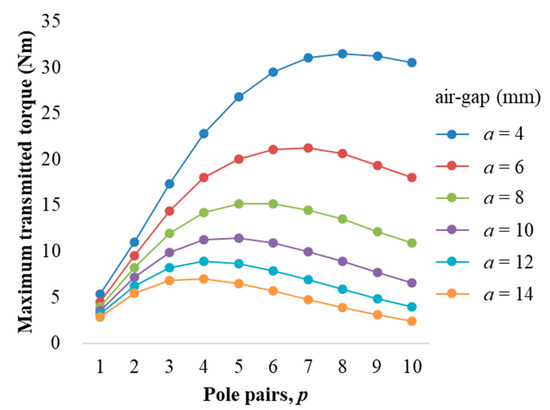
Figure 9.
The maximum transmitted torque versus the number of pole pairs.
As shown in Figure 9, the maximum transmitted torque increases first and then decreases as the number of pole pairs increases, and there is an optimal number of pole pairs. This is because the more pole pairs there are, the greater the frequency of magnetic field changes, and the more energy of the static magnetic field is stored. Thus, the maximum transmitted torque increases as the number of pole pairs increases, when the number of pole pairs is small. However, when the number of pole pairs exceeds a certain value, the air-gap magnetic field density between the two rotors will reach saturation or supersaturation, and the increase rate of the magnetic flux leakage will be greater than that of the magnetic field density, so the maximum transmitted torque will decrease when the number of pole pairs continues to increase.
It can be seen that the optimal number of pole pairs is affected by the air-gap length. When the air-gap length decreases, the optimal pole pair number will gradually increase. The air-gap length of the axial-flux type magnetic coupling can be flexibly adjusted, while the pole pair number is difficult to be changed once set, so the pole pair number should be determined initially. Since the isolation layer is placed in the air-gap, the air-gap length will not be too small. When the air-gap length is too large, the maximum transmitted torque will be very small. In the trade-off design, the air-gap length in the proposed LOCH is between 8 and 12 mm, and the optimal number of pole pairs is 5.
3.3. Magnet Thickness
Theoretically, the larger the volume of the permanent magnet, the greater the magnetic energy that can be produced. To obtain the relationship between the maximum transmitted torque and the magnet thickness, ten groups of magnet thicknesses from 2 to 20 mm were studied and the result is shown in Figure 10.
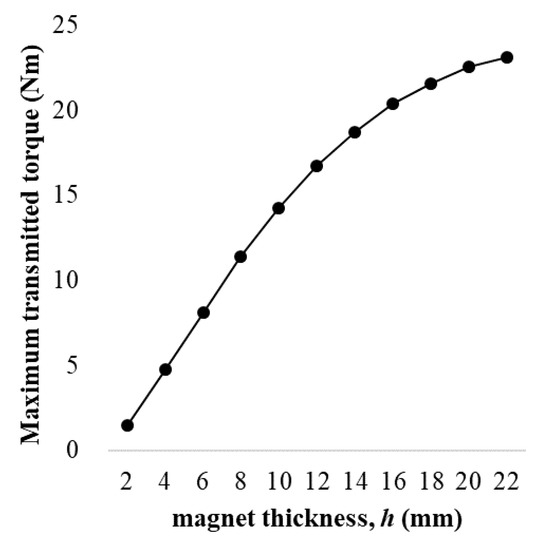
Figure 10.
The maximum transmitted torque versus the magnet thickness.
As shown in Figure 10, the maximum transmitted torque of the magnetic coupling increases gradually with the increasing magnet thickness, but the growth rate is getting slower and slower. This is because when the magnet thickness is small, with the thickness increasing, the magnetic potential generated by the magnets becomes larger, as do the air-gap magnetic density and the transmitted torque. However, as the thickness of the magnet continues to increase, the reluctance will offset the increase in magnetic potential, so the growth rate of the transmitted torque gradually decreases.
3.4. Iron Yoke Thickness
The iron yoke plays an important role in the magnetic circuit. After adding the iron yokes, the yokes can become the self-loop of the magnetic system and can change the magnetic flux density in the magnetic circuit by adjusting the magnitude of the magnetic leakage, thereby affecting the transmitted torque. According to the distribution of the magnetic flux density, as shown in Figure 11a–d, the magnetic flux density increases significantly after the iron yokes are added. When the thickness of the iron yoke increases, the magnetic flux density also increases gradually, as the magnetic flux leakage gradually decreases. When the iron yoke thickness increases to a certain value, the magnetic flux density stops increasing because of the non-saturation of the iron yoke.
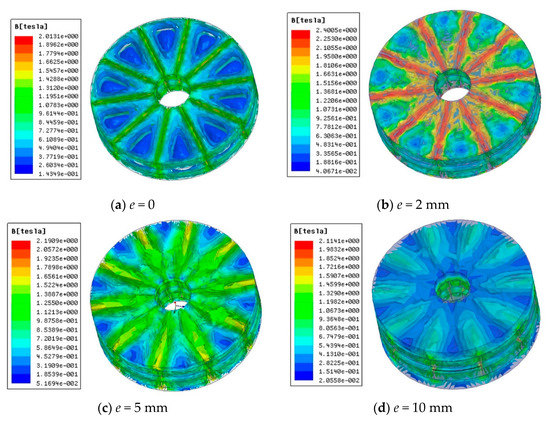
Figure 11.
The magnetic flux density distribution of magnetic couplings with different iron yoke thickness.
In order to minimize the thickness of the iron yoke, it is necessary to use a material with high permeability, high magnetic saturation, and low remanence, so Q235 carbon steel was used in this study. Ten groups of iron yoke thicknesses from 2 to 20 mm were studied, and the relationship between the maximum transmitted torque and the iron yoke thickness is shown in Figure 12.
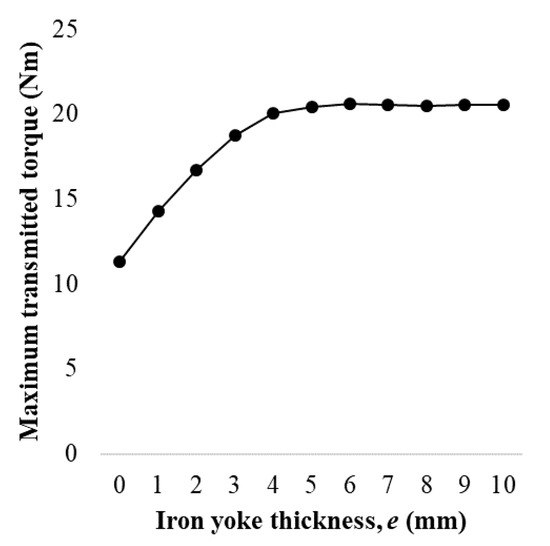
Figure 12.
The maximum transmitted torque versus the iron yoke thickness.
It can be seen that the variation in maximum transmitted torque matches that in magnetic flux density. The maximum transmitted torque rises when the iron yoke thickness increases under small iron yoke thickness and stops rising when the iron yoke thickness increases to a certain value. Continuing to increase the thickness of the iron yoke has no impact on the transmitted torque, but it will raise the inertia moment of the rotating parts, thereby raising the starting moment, as well as reducing the utilization of magnetic materials and the transmission performance of the magnetic coupling.
3.5. Air-Gap Length
The magnetic coupling is driven by the magnetic force between the magnets on the active rotor and the driven rotor. Therefore, the air-gap length has a very important influence on the transmission performance of the magnetic coupling. If the air-gap length is too large, the magnetic force is small, and the stability of the operation cannot be guaranteed. If the air-gap length is too small, the LOCH assembly is difficult because of the huge axial force between the permanent magnets, and the oscillation and deflection may cause the transmission to fail. The influence of the air-gap length on the maximum transmitted torque is shown in Figure 13.
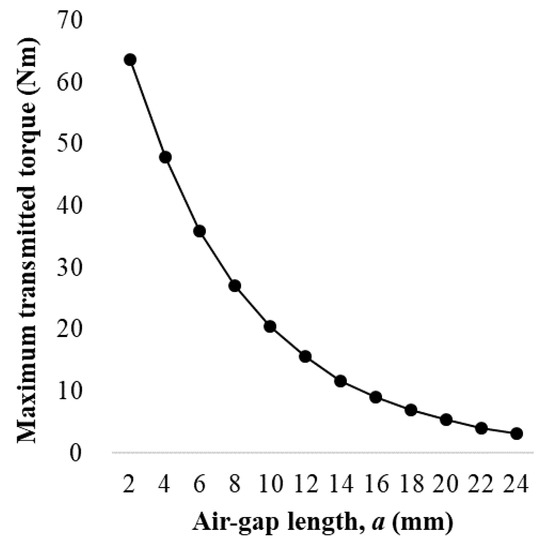
Figure 13.
The maximum transmitted torque versus the air-gap length.
It can be seen that the maximum transmitted torque decreases rapidly as the air-gap length increases. Because the magnetic resistance of the air-gap is much larger than the one of the iron yoke, the magnetic potential is mainly consumed on the air-gap. As the magnetic flux density in the air-gap decreases when the air-gap length increases, the maximum transmitted torque also decreases.
4. Magnetic Coupling Experiment
According to the above analysis, the optimal parameters of the axial-flux type magnetic coupling are designed, as listed in Table 3.

Table 3.
The optimal parameters of the axial-flux type magnetic coupling.
The experimental prototype is shown in Figure 14, packaged in stainless steel to improve the strength and corrosion resistance.
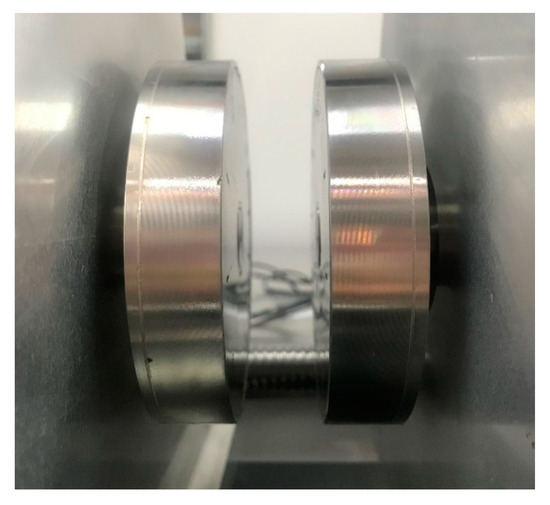
Figure 14.
The prototype of the optimized magnetic coupling.
4.1. Experimental Platform Design
An experiment platform was designed to test the static and dynamic performances of the magnetic coupling, and the test configuration is shown in Figure 15. The active rotor can be translated along the threaded rods by turning the handle so the air-gap length can be flexibly changed. The three threaded rods and the bearings ensure that the active rotor is always parallel to the driven rotor during the movement.

Figure 15.
The test configuration of the experimental platform.
The load simulator is used to lock the driven rotor when the static performances of the magnetic coupling are tested, and the active rotor is driven by the motor at the speed of one degree per second. The transmitted torques at different angular displacements can be read directly from the torque/speed sensors, and the relationship between the transmitted torques and the angular displacements can be obtained after averaging multiple repeated experiments.
When testing the dynamic performance of the magnetic coupling, the input torque Ti and rotating speed ni of the active rotor and the output torque To and rotating speed no of the driven rotor can be read directly from the torque/speed sensors, and the input power Pi and output power Po of the magnetic coupling are expressed as follows:
The transmission efficiency of the magnetic coupling ηmc is
Because the active and the driven rotors have the same rotating speed, the transmission efficiency is finally expressed as
The load can be changed by adjusting the working current of the load simulator, and the rotating speed n can be changed by the motor, so the transmission efficiencies under different rotating speeds and different loads can be easily obtained.
4.2. The Static Performance of The Magnetic Coupling
The static performances of air-gap lengths of 7, 12, 17 and 22 mm were measured, since the active rotor moves 5 mm after each rotation of the handle and the thickness of the stainless steel housing is 1 mm. The results are compared with those obtained from 3D FEM, as shown in Figure 16a–d.
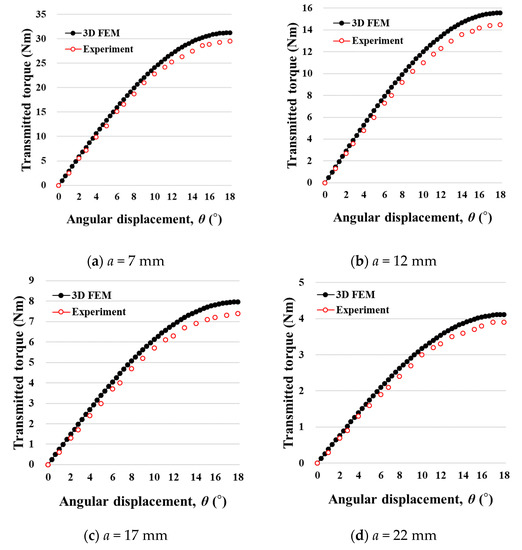
Figure 16.
The static performance of the magnetic couplings with different air-gap lengths from the three-dimensional finite-element method (3D FEM) and experimental tests.
It can be seen that the measured and simulated values of transmitted torques are close. The simulated values are slightly larger because the simulation model is ideal.
4.3. The Dynamic Performance of The Magnetic Coupling
When testing the dynamic performances, the load torque is continuously increased by gradually raising the working current of the load simulator until the magnetic coupling slips. The same experiments were performed multiple times at different rotating speeds n, then the transmission efficiency at different rotating speeds and loads were obtained, as shown in Figure 17a–f.
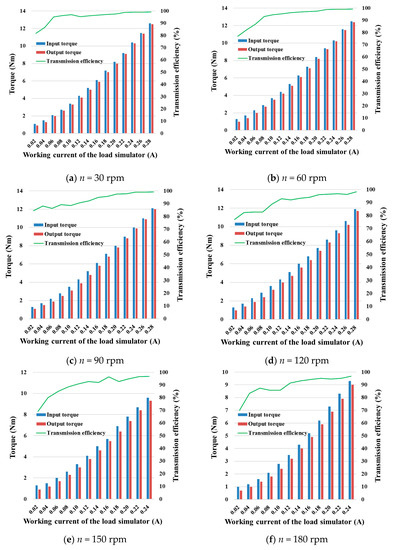
Figure 17.
The dynamic performance of the magnetic coupling.
It can be seen that the magnetic coupling has a high transmission efficiency. The loss torque of the driven rotor is within 0.1 Nm and the transmission efficiency can be up to 99%. The maximum load capacity decreases while the working rotating speed increases, because greater rotational inertia and system friction need to be overcome under higher rotating speed.
5. LOCH Assembly and Experiment
The assembled LOCH is shown in Figure 18. The pressure housing is 24 cm in diameter and 60 cm in length. The working depth of the prototype is 50 m and the thickness of the housing is 10 mm. It is fixed on a stainless steel frame with a lifting ring and the frame size is 45 cm × 40 cm × 60 cm.
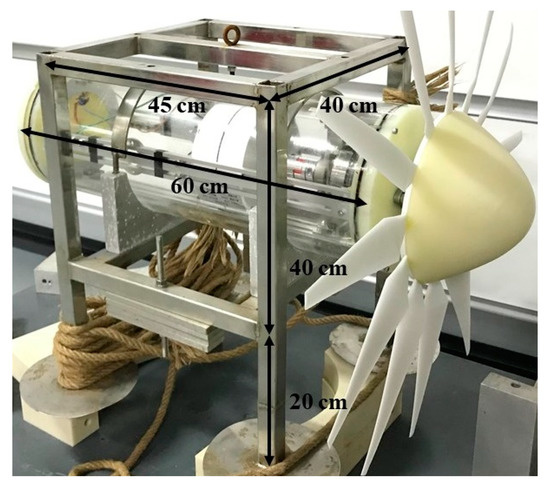
Figure 18.
The assembled LOCH.
5.1. Hydrostatic Seal Test
The hydrostatic seal test was performed by placing the LOCH on the bottom of a tank for 24 h, as shown in Figure 19.
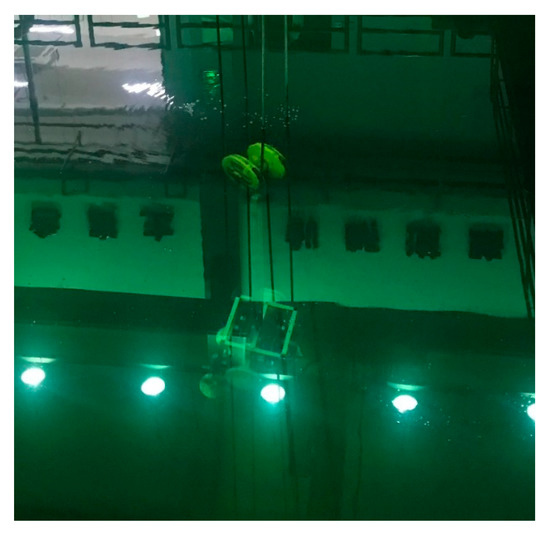
Figure 19.
The hydrostatic seal test.
5.2. Underwater Test
The LOCH was tested underwater several times, once at Yangshupu Port (31.28° N, 121.51° E). The velocity during the test period was 0.40–0.58 m/s, as shown in Figure 20, and the field test is shown in Figure 21.
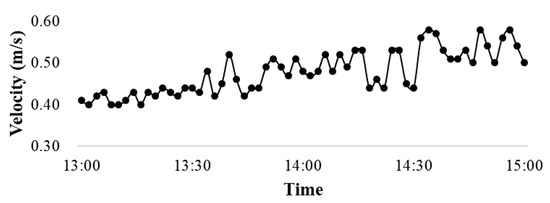
Figure 20.
The current velocity during the underwater test.
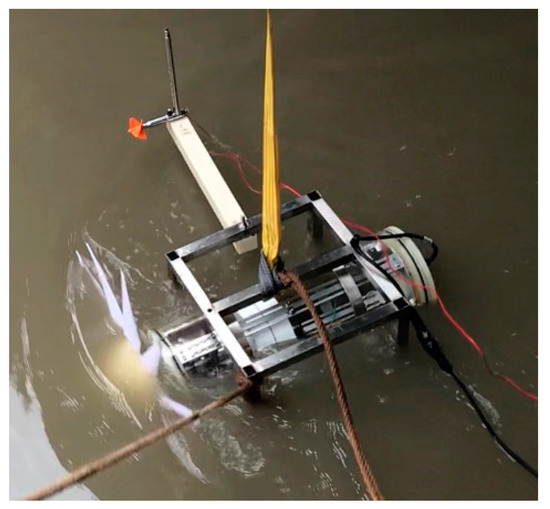
Figure 21.
The field test.
According to the underwater field test results, the LOCH can start smoothly at a current velocity of as low as 0.4 m/s, outputting power of 2.8 W. The energy is enough for most underwater instruments, and it can be seen from Figure 1a that the generated power can be stored in the energy storage module. By reducing the frequency of data acquisition, more instruments can be powered.
Furthermore, Equation (1) shows that the power harvested by the turbine is proportional to the square of the radius and the cube of the flow velocity, so it can be deduced from the experiment results that the LOCH can output more power at a larger turbine radius and higher flow velocity to supply more instruments. Limited by the dimensions of the underwater instrument platforms, the radius of the turbine should not exceed 1 m. Table 4 shows the calculated power output of the LOCH with different turbine radiuses at the lowest and the rated flow velocities when the overall efficiency remains the same.

Table 4.
The calculated power output with a larger radius turbine for the proposed LOCH.
The power consumption of most low-power underwater oceanopraghic sensors is below several watts, so the LOCH with a 0.3 m radius turbine meets their power requirements. A larger radius can also be applied to power multiple sensors in an underwater science platform simultaneously.
6. Conclusions
A compact LOCH is developed to power undersea instrument platforms for long-term scientific seafloor observation. Noncontact magnetic couplings are used in the LOCH to eliminate friction and achieve reliable underwater sealing so that the LOCH can adapt the low-velocity ocean current and its energy transmission efficiency can be improved. The parameters of the magnetic couplings are optimized by 3D FEM.
An experiment platform is designed to test the static and dynamic performances of the magnetic coupling. The static performance test results show that the maximum transmitted torque of the magnetic coupling can reach 29.5 Nm at an air-gap length of 7 mm. The dynamic performance test results show that the torque loss of the driven rotor under different loads is within 0.1 Nm, and the maximum transmission efficiency can reach 99%. The actual measured values are compared with the simulation results to verify the accuracy of the simulation and the superiority of the design parameters.
The whole assembly and several experiments of the proposed LOCH are carried out. The hydrostatic seal test results show that the harvester has a good sealing capability. The underwater filed test results show that the LOCH can be started smoothly and run stably at a current velocity of as low as 0.4 m/s and has a significant advantage on overall efficiency, compared with previous studies. The LOCH can output 2.8 W electrical power at the lowest rated current velocity, enough for most oceanography instruments. Moreover, solutions for higher power instruments are also given, i.e., reducing the frequency of data acquisition or increasing the turbine radius.
Author Contributions
Conceptualization, F.L.; methodology, L.H. and F.L.; software, L.H.; validation, F.L.; formal analysis, L.H.; investigation, L.H. and F.L.; resources, F.L.; data curation, L.H.; writing-original draft preparation, L.H.; writing-review and editing, F.L.; visualization, L.H.; supervision, F.L.; project administration, F.L.; funding acquisition, F.L. All authors have read and agreed to the published version of the manuscript.
Funding
This research was funded by the National Natural Science Foundation of China under Grant 61936014, the Shanghai Science and Technology Innovation Initiative under Grant 16DZ1205000, and the State Key Laboratory of Marine Geology fund under Grant MG20204.
Conflicts of Interest
The authors declare no conflict of interest.
References
- Barnes, C.R.; Best, M.M.R.; Johnson, F.R.; Pautet, L.; Pirenne, B. Challenges, benefits, and opportunities in installing and operating cabled ocean observatories: Perspectives from NEPTUNE Canada. IEEE J. Ocean. Eng. 2013, 38, 144–157. [Google Scholar] [CrossRef]
- Lu, F.; Zhou, H.; Peng, X.; Yue, J.; Wang, P. Technical preparation and prototype development for long-term cabled seafloor observatories in Chinese marginal seas. In Seafloor Observatories: A New Vision of the Earth from the Abyss; Springer Praxis Books; Springer: Berlin/Heidelberg, Germany, 2015; pp. 503–529. [Google Scholar]
- Sandeep, D.N.; Kumar, V. Review on clustering, coverage and connectivity in underwater wireless sensor networks: A communication techniques perspective. IEEE Access 2017, 5, 11176–11199. [Google Scholar] [CrossRef]
- Bahaj, A.S. Generating electricity from the oceans. Renew. Sustain. Energy Rev. 2011, 15, 3399–3416. [Google Scholar] [CrossRef]
- Hussain, A.; Arif, S.M.; Aslam, M. Emerging renewable and sustainable energy technologies: State of the art. Renew. Sustain. Energy Rev. 2017, 71, 12–28. [Google Scholar] [CrossRef]
- Khan, N.; Kalair, A.; Abas, N.; Haider, A. Review of ocean tidal, wave and thermal energy technologies. Renew. Sustain. Energy Rev. 2017, 72, 590–604. [Google Scholar] [CrossRef]
- Melikoglu, M. Current status and future of ocean energy sources: A global review. Ocean Eng. 2018, 148, 563–573. [Google Scholar] [CrossRef]
- Schrader, P.S.; Reimers, C.E.; Girguis, P.; Delaney, J.; Doolan, C.; Wolf, M.; Green, D. Independent benthic microbial fuel cells powering sensors and acoustic communications with the MARS underwater observatory. J. Atmos. Ocean. Technol. 2016, 33, 607–617. [Google Scholar] [CrossRef]
- Ng, K.-W.; Lam, W.-H.; Ng, K.-C. 2002–2012: 10 years of research progress in horizontal-axis marine current turbines. Energies 2013, 6, 1497–1526. [Google Scholar] [CrossRef]
- Guney, M.S.; Kaygusuz, K. Hydrokinetic energy conversion systems: A technology status review. Renew. Sustain. Energy Rev. 2010, 14, 2996–3004. [Google Scholar] [CrossRef]
- Finkl, C.W.; Charlier, R. Electrical power generation from ocean currents in the Straits of Florida: Some environmental considerations. Renew. Sustain. Energy Rev. 2009, 13, 2597–2604. [Google Scholar] [CrossRef]
- Khan, M.J.; Bhuyan, G.; Iqbal, M.T.; Quaicoe, J.E. Hydrokinetic energy conversion systems and assessment of horizontal and vertical axis turbines for river and tidal applications: A technology status review. Appl. Energy 2009, 86, 1823–1835. [Google Scholar] [CrossRef]
- O’Rourke, F.; Boyle, F.; Reynolds, A. Marine current energy devices: Current status and possible future applications in Ireland. Renew. Sustain. Energy Rev. 2010, 14, 1026–1036. [Google Scholar] [CrossRef]
- Sen, Z. Energy generation possibility from ocean currents: Bosphorus, Istanbul. Ocean Eng. 2012, 50, 31–37. [Google Scholar] [CrossRef]
- Mutsuda, H.; Rahmawati, S.; Taniguchi, N.; Nakashima, T.; Doi, Y. Harvesting ocean energy with a small-scale tidal-current turbine and fish aggregating device in the Indonesian Archipelagos. Sustain. Energy Technol. Assess. 2019, 35, 160–171. [Google Scholar] [CrossRef]
- Zhou, Z.; Benbouzid, M.; Charpentier, J.-F.; Scuiller, F.; Tang, T. Developments in large marine current turbine technologies—A review. Renew. Sustain. Energy Rev. 2017, 71, 852–858. [Google Scholar] [CrossRef]
- Lankhorst, M.; Zenk, W. Lagrangian observations of the middepth and deep velocity fields of the northeastern Atlantic Ocean. J. Phys. Oceanogr. 2006, 36, 43–63. [Google Scholar] [CrossRef][Green Version]
- Chang, Y.-C.; Chu, P.C.; Tseng, R.-S. Site selection of ocean current power generation from drifter measurements. Renew. Energy 2015, 80, 737–745. [Google Scholar] [CrossRef]
- Qi, C.; Lin, Y.; Zhao, J. Ocean current power generation at low flow velocity for oceanographic instruments. J. Mech. Electr. Eng. 2017, 34, 1055–1059. [Google Scholar] [CrossRef]
- Bahaj, A.S.; Molland, A.F.; Chaplin, J.R.; Batten, W.M.J. Power and thrust measurements of marine current turbines under various hydrodynamic flow conditions in a cavitation tunnel and a towing tank. Renew. Energy 2007, 32, 407–426. [Google Scholar] [CrossRef]
- Suzuki, T.; Mahfuz, H. Analysis of large-scale ocean current turbine blades using Fluid-Structure Interaction and blade element momentum theory. Ships Offshore Struct. 2018, 13, 451–458. [Google Scholar] [CrossRef]
- Mohammadi, S.; Hassanalian, M.; Arionfard, H.; Bakhtiyarov, S. Optimal design of hydrokinetic turbine for low-speed water flow in Golden Gate Strait. Renew. Energy 2020, 150, 147–155. [Google Scholar] [CrossRef]
- Li, Z.; Maki, N.; Ida, T.; Miki, M.; Izumi, M. Comparative study of 1-MW PM and HTS synchronous generators for marine current turbine. IEEE Trans. Appl. Supercond. 2018, 28, 1–5. [Google Scholar] [CrossRef]
- Goundar, J.N.; Ahmed, M.R. Marine current energy resource assessment and design of a marine current turbine for Fiji. Renew. Energy 2014, 65, 14–22. [Google Scholar] [CrossRef]
- Rahimian, M.; Walker, J.; Penesis, I. Performance of a horizontal axis marine current turbine—A comprehensive evaluation using experimental, numerical, and theoretical approaches. Energy 2018, 148, 965–976. [Google Scholar] [CrossRef]
- Tian, W.; Mao, Z.; Ding, H. Design, test and numerical simulation of a low-speed horizontal axis hydrokinetic turbine. Int. J. Nav. Archit. Ocean Eng. 2018, 10, 782–793. [Google Scholar] [CrossRef]
- Benelghali, S.; Benbouzid, M.E.H.; Charpentier, J.F. Generator systems for marine current turbine applications: a comparative study. IEEE J. Ocean. Eng. 2012, 37, 554–563. [Google Scholar] [CrossRef]
- Xu, M.; Zhang, X.; Zhu, W.; Dong, Y.; Guo, J. The study of miniaturization electrical energy supplement for the independent power supply marine monitoring instrument. Acta Energ. Sol. Sin. 2013, 34, 2045–2050. [Google Scholar] [CrossRef]
- Tian, Y.; Yuan, R.; Li, X.; Chen, G. Design and test of under deep sea micro-flow power generation system. Acta Energ. Sol. Sin. 2018, 39, 873–878. [Google Scholar]
- Chikaura, H.; Oka, Y.; Nakashima, Y.; Nakanishi, Y. Development of a new type of seal system for use in ocean current or tidal power generation. In Proceedings of the 16th International Power Electronics and Motion Control Conference and Exposition, Antalya, Turkey, 21–24 September 2014; pp. 828–832. [Google Scholar]
- Li, J.; Mi, Z.; Lv, F.; Wang, K. Research on airfoil improvement of current generation devices. Fluid Power Transm. Control 2017, 03, 20–23. [Google Scholar] [CrossRef]
© 2020 by the authors. Licensee MDPI, Basel, Switzerland. This article is an open access article distributed under the terms and conditions of the Creative Commons Attribution (CC BY) license (http://creativecommons.org/licenses/by/4.0/).