1. Introduction
The offshore wind power technology has developed rapidly. The power output and fatigue life of wind turbine are affected by turbulent wake. The wind turbine wake flow is a series of complex spatiotemporal evolution processes of multi-scale coherent structures. Therefore, accurately determining the wake characteristics for an analysis of the aerodynamic performance and load change of a wind turbine is crucial.
Recent research studies have shown that vertical-axis wind turbines (VAWTs) have a broader application prospect in urban [
1] and offshore [
2] areas than horizontal-axis wind turbines (HAWTs) owing to their special rotor structure. The solidity, which is the main structural parameter of VAWTs, represents the density of a rotating blade. The swept area formed by the rotating blade of a VAWT (or an HAWT) is similar to a cylindrical (or disk-like) surface. The wind turbine can be regarded as a typical bluff body, which induces a turbulent wake and decelerates the wind speed of the airflow. This assumption is widely used in the study of wake characteristics of wind turbines.
Research on the aerodynamic characteristics of VAWTs is often based on the actuator cylinder (or disk) model. Fortunato et al. [
3] adapted the Actuator Cylinder (AC) model to compute the flow around a VAWT. Cheng et al. [
4] applied the AC method to build the aerodynamic model of floating VAWTs and combined it with SIMO-RIFLEX (Strength analysis software released by DET Norske Veritas in 1969). The coupled tool predicted the dynamic response well after comparing with the codes HAWC2 (Aerodynamic design and research program developed by the National Laboratory of renewable energy, University of science and technology of Denmark). Madsen et al. [
5] proposed a modification of the AC model to explore megawatt floating VAWTs. The modified results were closer to full AC model. De Tavernier and Ferreira [
6] extended the AC model to simulate two actuator cylinders in 2D. The calculation results were good under low
Ct. Newman [
7] applied the actuator disk model for the prediction of performance of VAWTs. Moreover, Batten et al. [
8] applied the actuator disk-Reynolds Averaged Navier-Stokes (RANS) model for the prediction of tidal turbine wakes. The comparison between the numerical simulation and experimental results showed that the turbulence intensity near the disk was underestimated.
Periodic vortex shedding is an important characteristic of a typical bluff body wake. This wake instability behaviour has been detected in some HAWT model experiments. For instance, Medici and Alfredsson [
9] measured the wake of an HAWT model in a wind tunnel test; they discovered a low-frequency peak with Strouhal numbers between 0.12 and 0.2 and attributed the wake meandering to bluff body vortex shedding. In Medici’s study, this low frequency oscillation happened only at a tip speed ratio λ > 3, where the thrust coefficient
Ct started to approach the value of 1. Araya et al. [
10] conducted experiments in a recirculating water channel to analyse the wake characteristics of VAWTs with different blade numbers; they defined the dynamic solidity and related quantitatively the far-wake dynamics to the wake dynamics of a cylinder.
In the evolution process from a near wake of a bluff body to a complete three-dimensional flow, a characteristic frequency that is lower than the low-frequency large-scale vortex shedding frequency occurs. This low-frequency instability has been widely studied in the wakes of cylinders, disks and other typical bluff bodies. For a finite-length cylinder, Park and Lee [
11] measured a low frequency outside the upstream near wake of a cylinder with different aspect ratios (
H/
D = 6, 10, 13), and Yang et al. [
12] investigated the low-frequency characteristics related to vortex dislocations in the near wake of a plate. Najjar and Balachandar [
13] studied low-frequency instabilities in the wake of a vertical plate and stated that the low-frequency instability was caused by the unsynchronised formation of spanwise and streamwise vortices. Wu et al. [
14] used the smoke line and hot wire velocity measurement methods to display the flow field around the plate and confirmed the results of the previously mentioned two researchers. The flow field showed that there were two distinct states in the vortex formation region, which could be divided into mode L and mode S. Mode L corresponds to the long vortex formation region, and mode S corresponds to the short vortex formation region. The conversion between these two coherent structures required much time, which led to the generation of low-frequency values. A two-point correlation analysis verified the previously presented conclusions. Miau et al. [
15,
16,
17] discovered that the low-frequency instability was related to the unsteady pulsation in the formation region of a large-scale vortex. Furthermore, Berger et al. [
18] discovered that a wake around a ball or disk had three instability mechanisms: low-frequency large-scale vortex shedding, low-frequency instability, and high-frequency instability of the shear layer. They believed that the low-frequency instability originated from the expansion and contraction pulsation in the re-circulation region. The researchers came to the same conclusions regarding the low-frequency large-scale vortex shedding and high-frequency instability of the shear layer. However, the presented physical mechanisms for the low-frequency instability, which occurs also in the wakes of other bluff bodies, are controversial. It should be investigated whether the double low-frequency instability mode also occurs when the VAWT wake develops into a bluff body wake.
Based on the assumption that the wind turbine can be regarded as a typical bluff body (e.g., a cylinder or disk), research studies on the wake characteristics of wind turbines have provided fruitful results. Owing to the inherent characteristics of wind turbines (e.g., rotation and blade vortex shedding), the wake induced by a wind turbine and a typical bluff body wake are not identical; nevertheless, there exists an inevitable relationship, which requires further research. Particularly, the low-frequency instability, which occurs in typical bluff body wakes, has rarely been reported in studies of the wake evolution process of VAWTs, and only limited wind tunnel experimental data are available. Therefore, this study provides experimental wind tunnel data for investigating the near-wake characteristics of VAWTs with different solidity levels. In addition, it focuses on the low-frequency instability characteristics when the VAWT wake develops into a bluff body wake mode.
This paper is organised as follows:
Section 2 describes the measurement method, and
Section 3.1 presents the aerodynamic performance results.
Section 3.2 analyses the mean and turbulent wake characteristics, and
Section 3.3 discusses the dynamic characteristics of the wake evolution. The influences of the operation state on the wake evolution are considered in
Section 3.4, and
Section 3.5 introduces the double low-frequency instability mode. Finally,
Section 4 summarises the results of this study.
2. Methods
2.1. VAWT Model and Wind Tunnel Facility
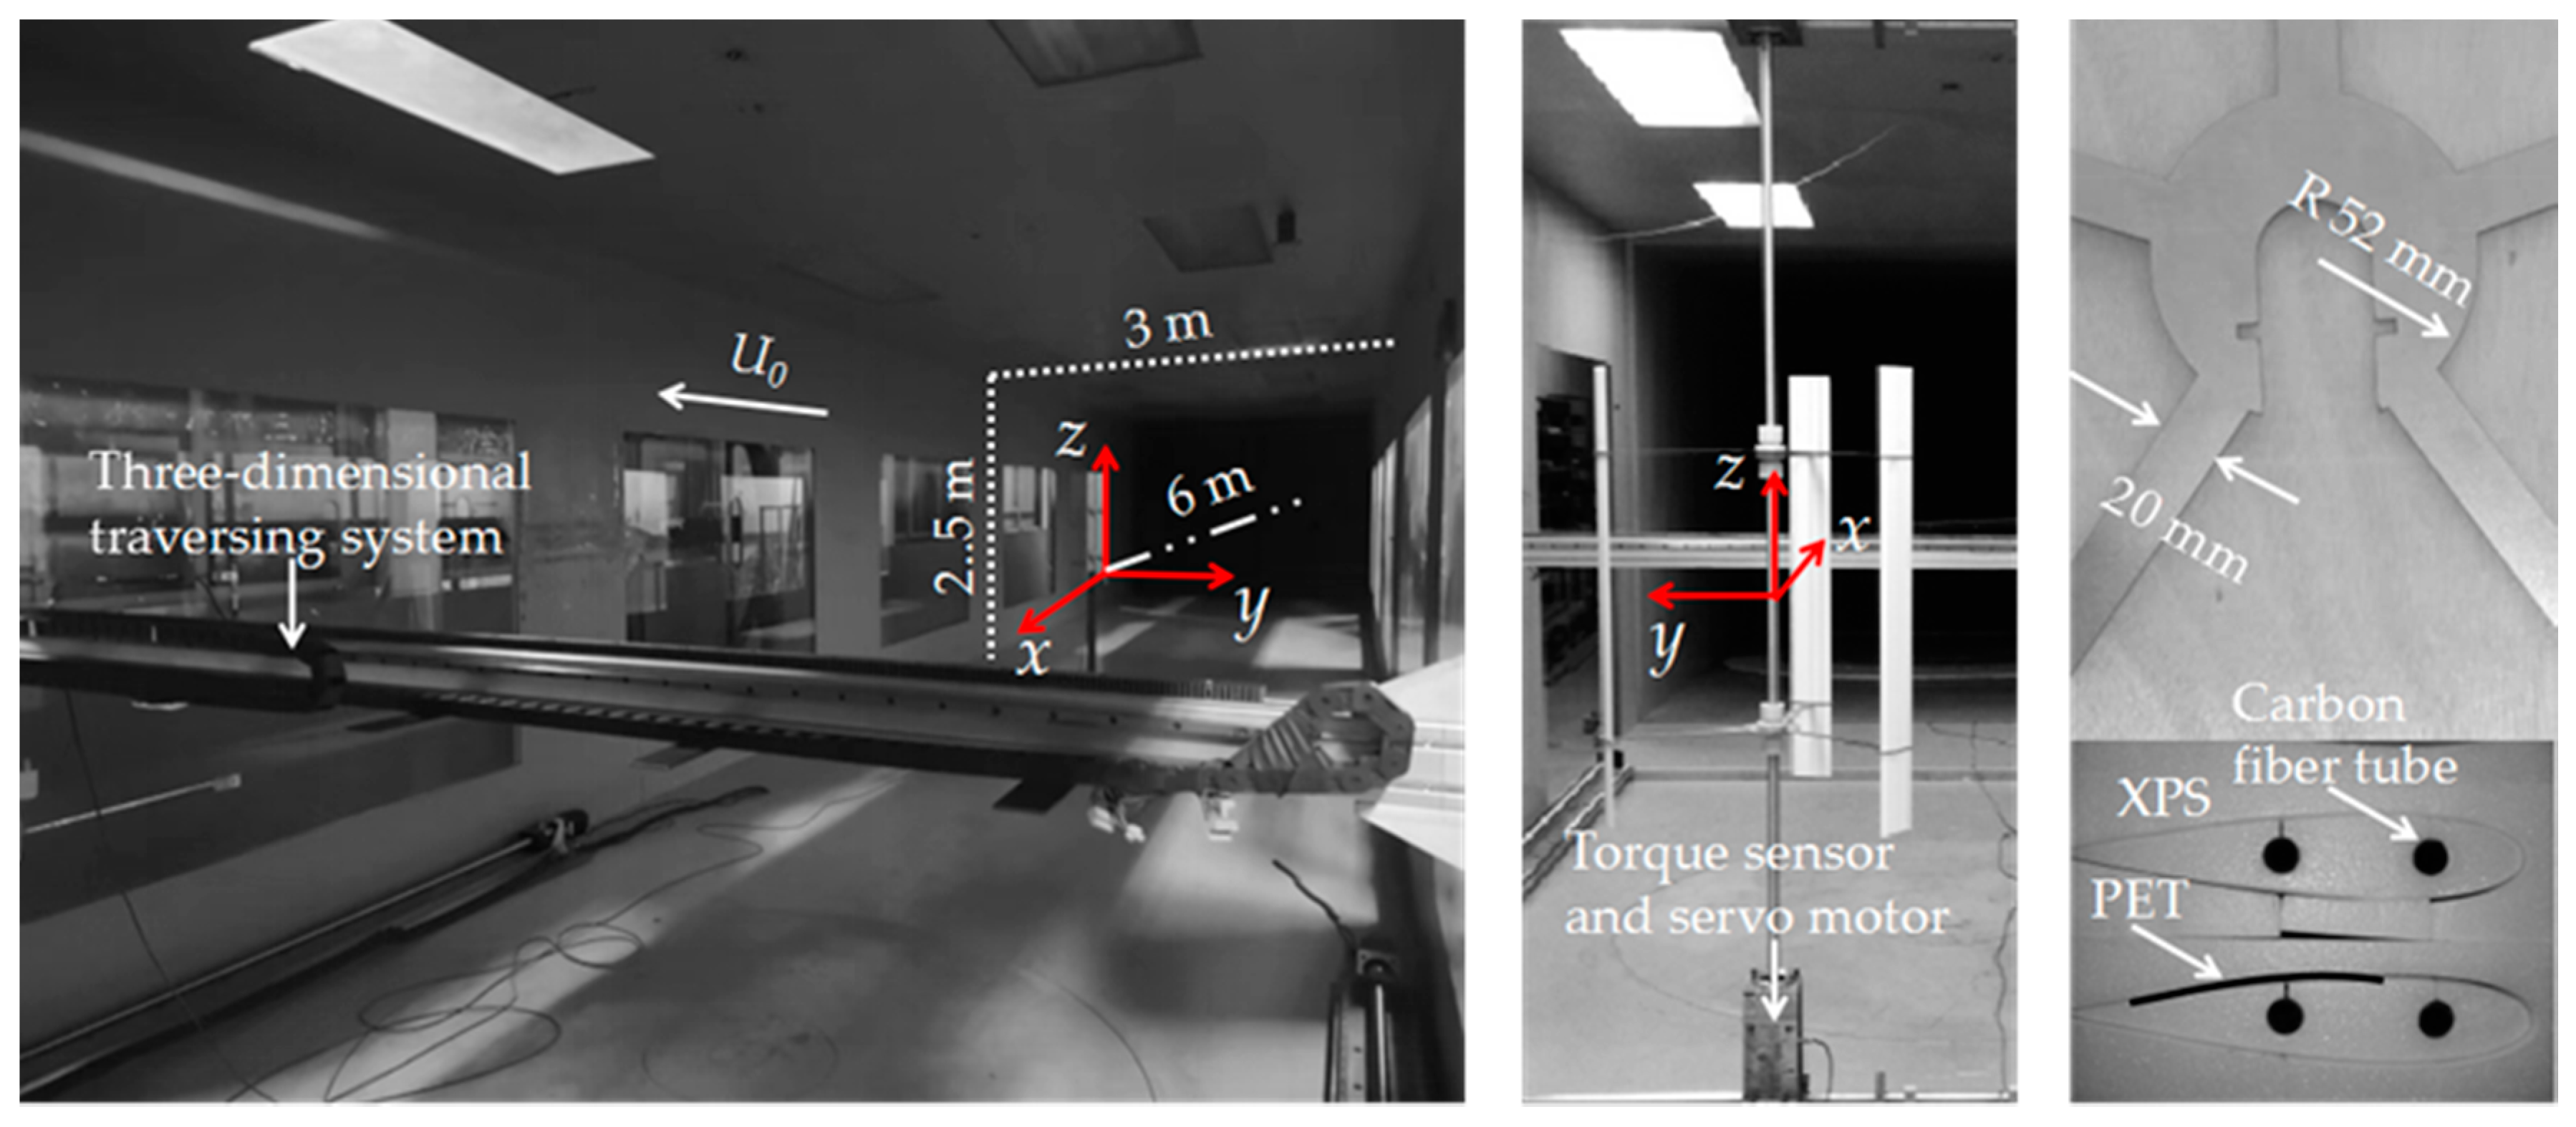
The blades of the VAWT models with NACA 0018 arfoils shapes (NACA airfoils are a series of airfoils developed by the National Advisory Committee for Aeronautics) and pitch angles of 0° were prepared with extruded polystyrene, carbon fibre rod was embedded in the blade for reinforcement and a polyethylene terephthalate thin film attached to the blade surface was used for smoothing. The blades and a pair of stainless-steel struts with thicknesses of 1 mm constituted the rotor (
Figure 1: centre and right side). The VAWT rotors with constant radii of 300 mm and heights of 810 mm had different blade numbers and chord lengths (see
Table 1).
The solidity is defined as follows:
where
n is the number of the blades,
c the chord length and
D the diameter of the rotor. As shown in
Table 1, the blade numbers of configurations A, B and C were equal; however, the chord lengths were different. By contrast, configurations B, D and F had equal chord lengths and different blade numbers. For configurations C, D and E, the blade numbers and chord lengths were different, and the solidity levels were equal. In this paper, configuration B, D and F were taken as examples to discuss the dynamic characteristics of wake evolution. As shown in
Table 1, configurations B, D and F had equal Reynolds number based on chord. Since configuration C, D and E were taken as examples to discuss the evolution of large-scale wake structure, the Reynolds number based on turbine diameter was chosen.
The experiments were performed in the closed-circuit wind tunnel of the Dalian University of Technology; the test section was 18 m long, 3 m wide and 2.5 m high (
Figure 1: left side). The wind turbine model was placed 6 m downstream from the entrance of the test section, and the geometric centre of the wind turbine rotor was concentric with the geometric centre of the wind tunnel section, which was also the origin of the rectangular coordinate system.
The blockage effect is an inevitable problem in wind tunnel testing. According to the review [
19] of the corrections of blockage effects of VAWTs, the correction is not required when the blockage ratio is below 5%. The following equation is proposed.
In this experiment, the rotor frontal area of each configuration was 0.486 m2. According to the previously presented equation, the blockage ratio was 1.62%. Therefore, no blockage correction was required. Since the expansion of the far downstream wake was somewhat limited by the wind tunnel walls, the measurement area of the wake is controlled within 5D.
2.2. Aerodynamic Performance and Wake Measurements
The aerodynamic performance of the VAWT was measured by a torque sensor with a measurement range of ±2 Nm, an accuracy of ±0.1% and a sampling frequency of 1000 Hz. The torque sensor was installed between the rotor and the servo motor (
Figure 1: centre), and the measurement devices were equipped with a rectifier board. Under the provided wind speed conditions, the tip speed ratios of the wind turbine were adjusted by controlling the rotation speed of the servo motor. Before the rotor was installed, the free-stream wind speed at the origin of the coordinate system was 7.7 m/s, and the turbulence intensity was below 0.5%.
The wake was measured with a fast-response multi-hole pressure probe (Cobra Probe) set in a three-dimensional traversing system. The probe monitored the instantaneous pressure acting on the four faces of the head, which was converted into an instantaneous velocity value in the three directions by the calibration function. The Cobra probe can be used to measure complex three-dimensional turbulent flow fields [
20] to determine the time-averaged velocity, instantaneous velocity, Reynolds stress and high-order correlation. Lam et al. [
21] measured the wake characteristics of a dual VAWT system by applying the Cobra probe. The frequency of the Cobra probe can reach 2 kHz; thus, it can theoretically distinguish a turbulent energy spectrum below 1 k Hz. The sampling frequency in this experimental study was 100 Hz with a measurement time of 30 s. This sampling frequency was sufficient for the turbulence scale range in this study and stabilised the sampling process.
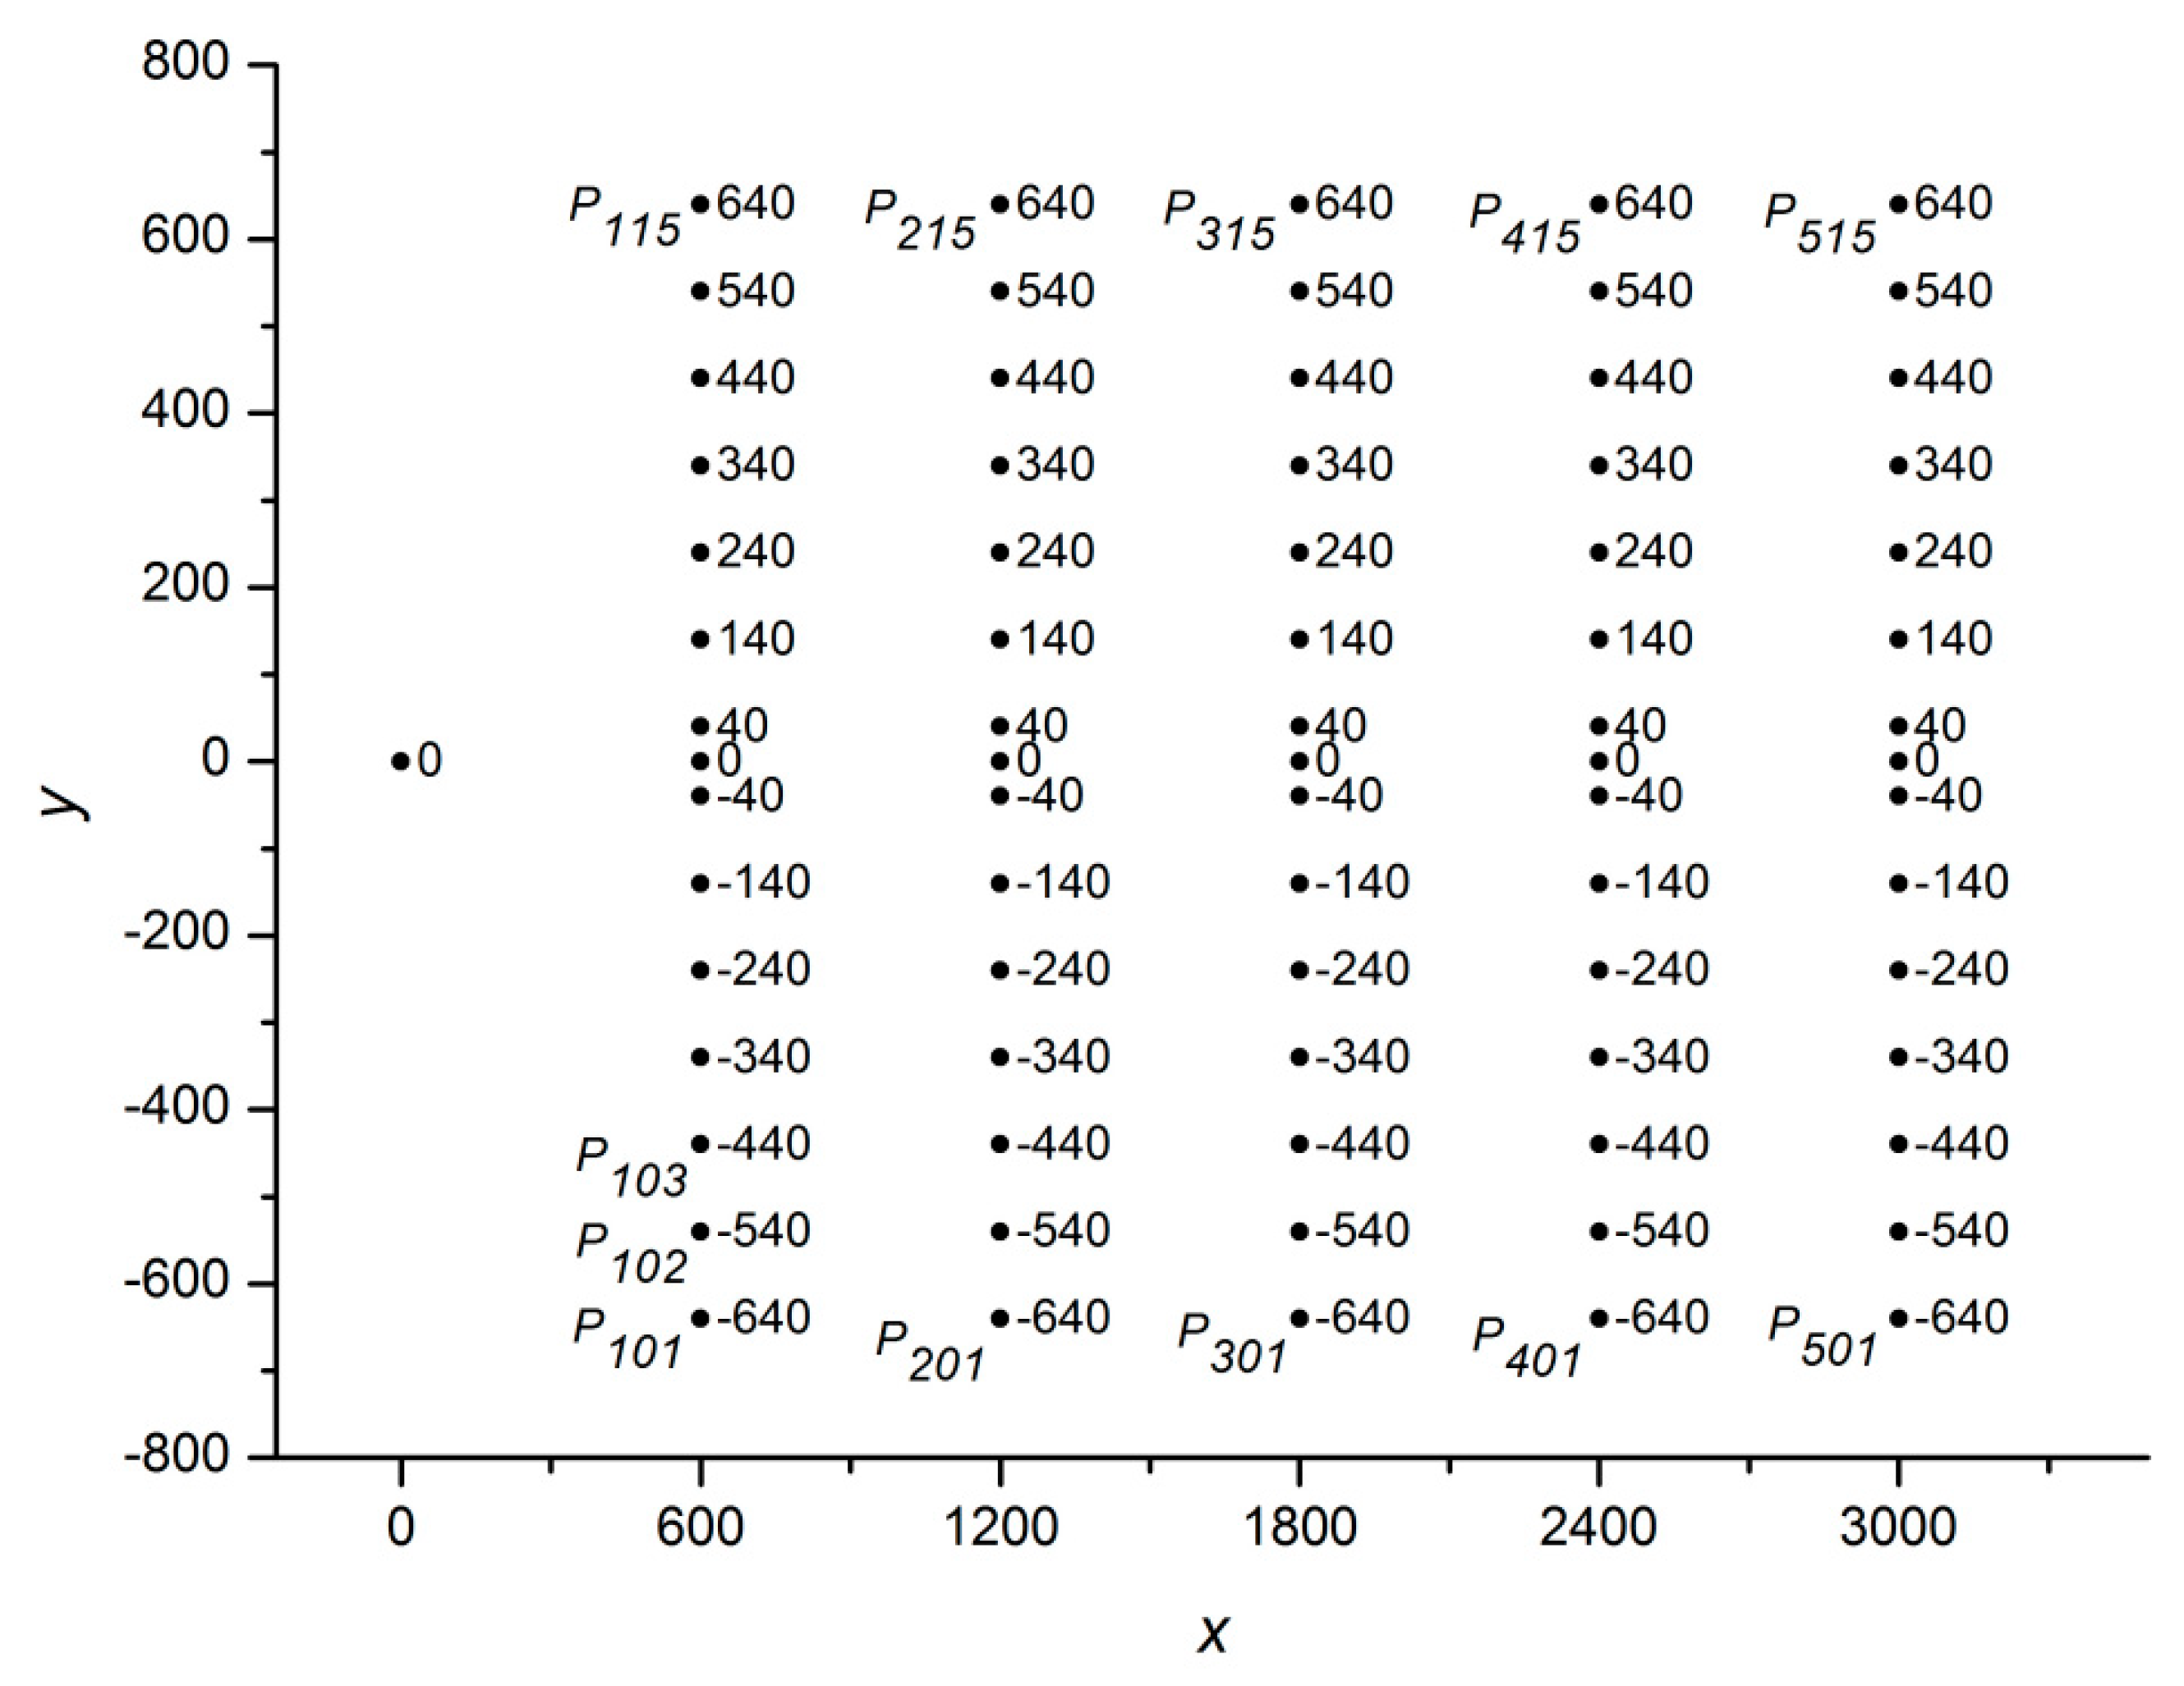
The wake was measured in the
XY plane. The measurement range is shown in
Figure 2. When
x = 2–5
D, the ordinate did not change. The VAWT rotated clockwise from the top view.
The total uncertainty of the experiment was determined as follows [
21]
The random errors, ER, were estimated by repeatedly measuring the streamwise velocity of a specific point (3000, −540, 505) in the wake; its uncertainty (ER) was 0.3%. The systematic errors were caused by the flow uniformity in the measurement area. Along the x-axis, (600, 0, 0), (1200, 0, 0), (1800, 0, 0), (2400, 0, 0) and (3000, 0, 0), and for x = 3D, 15 points along the y-axis were selected to measure the streamwise velocity. The systematic errors in the two directions were estimated as Ex = 0.9% and Ey = 1%, and the total uncertainty was 1.4%.
Turbulence intensity is defined as follows:
where
Ui,
Vi and
Wi are the instantaneous velocity components;
U,
V and
W are the time-average velocity components;
Vt is the time-average velocity.
3. Results and Discussion
3.1. Aerodynamic Performance
The power coefficient is defined as follows:
The tip-speed ratio,
λ, can be determined as follows:
where
T and
ω are the instantaneous torque and angular velocity measured by the torque sensor;
ρ is the fluid density,
Uo the given wind speed and
A the rotor frontal area. The rotor frontal area is equal to the rotor diameter times the rotor height.
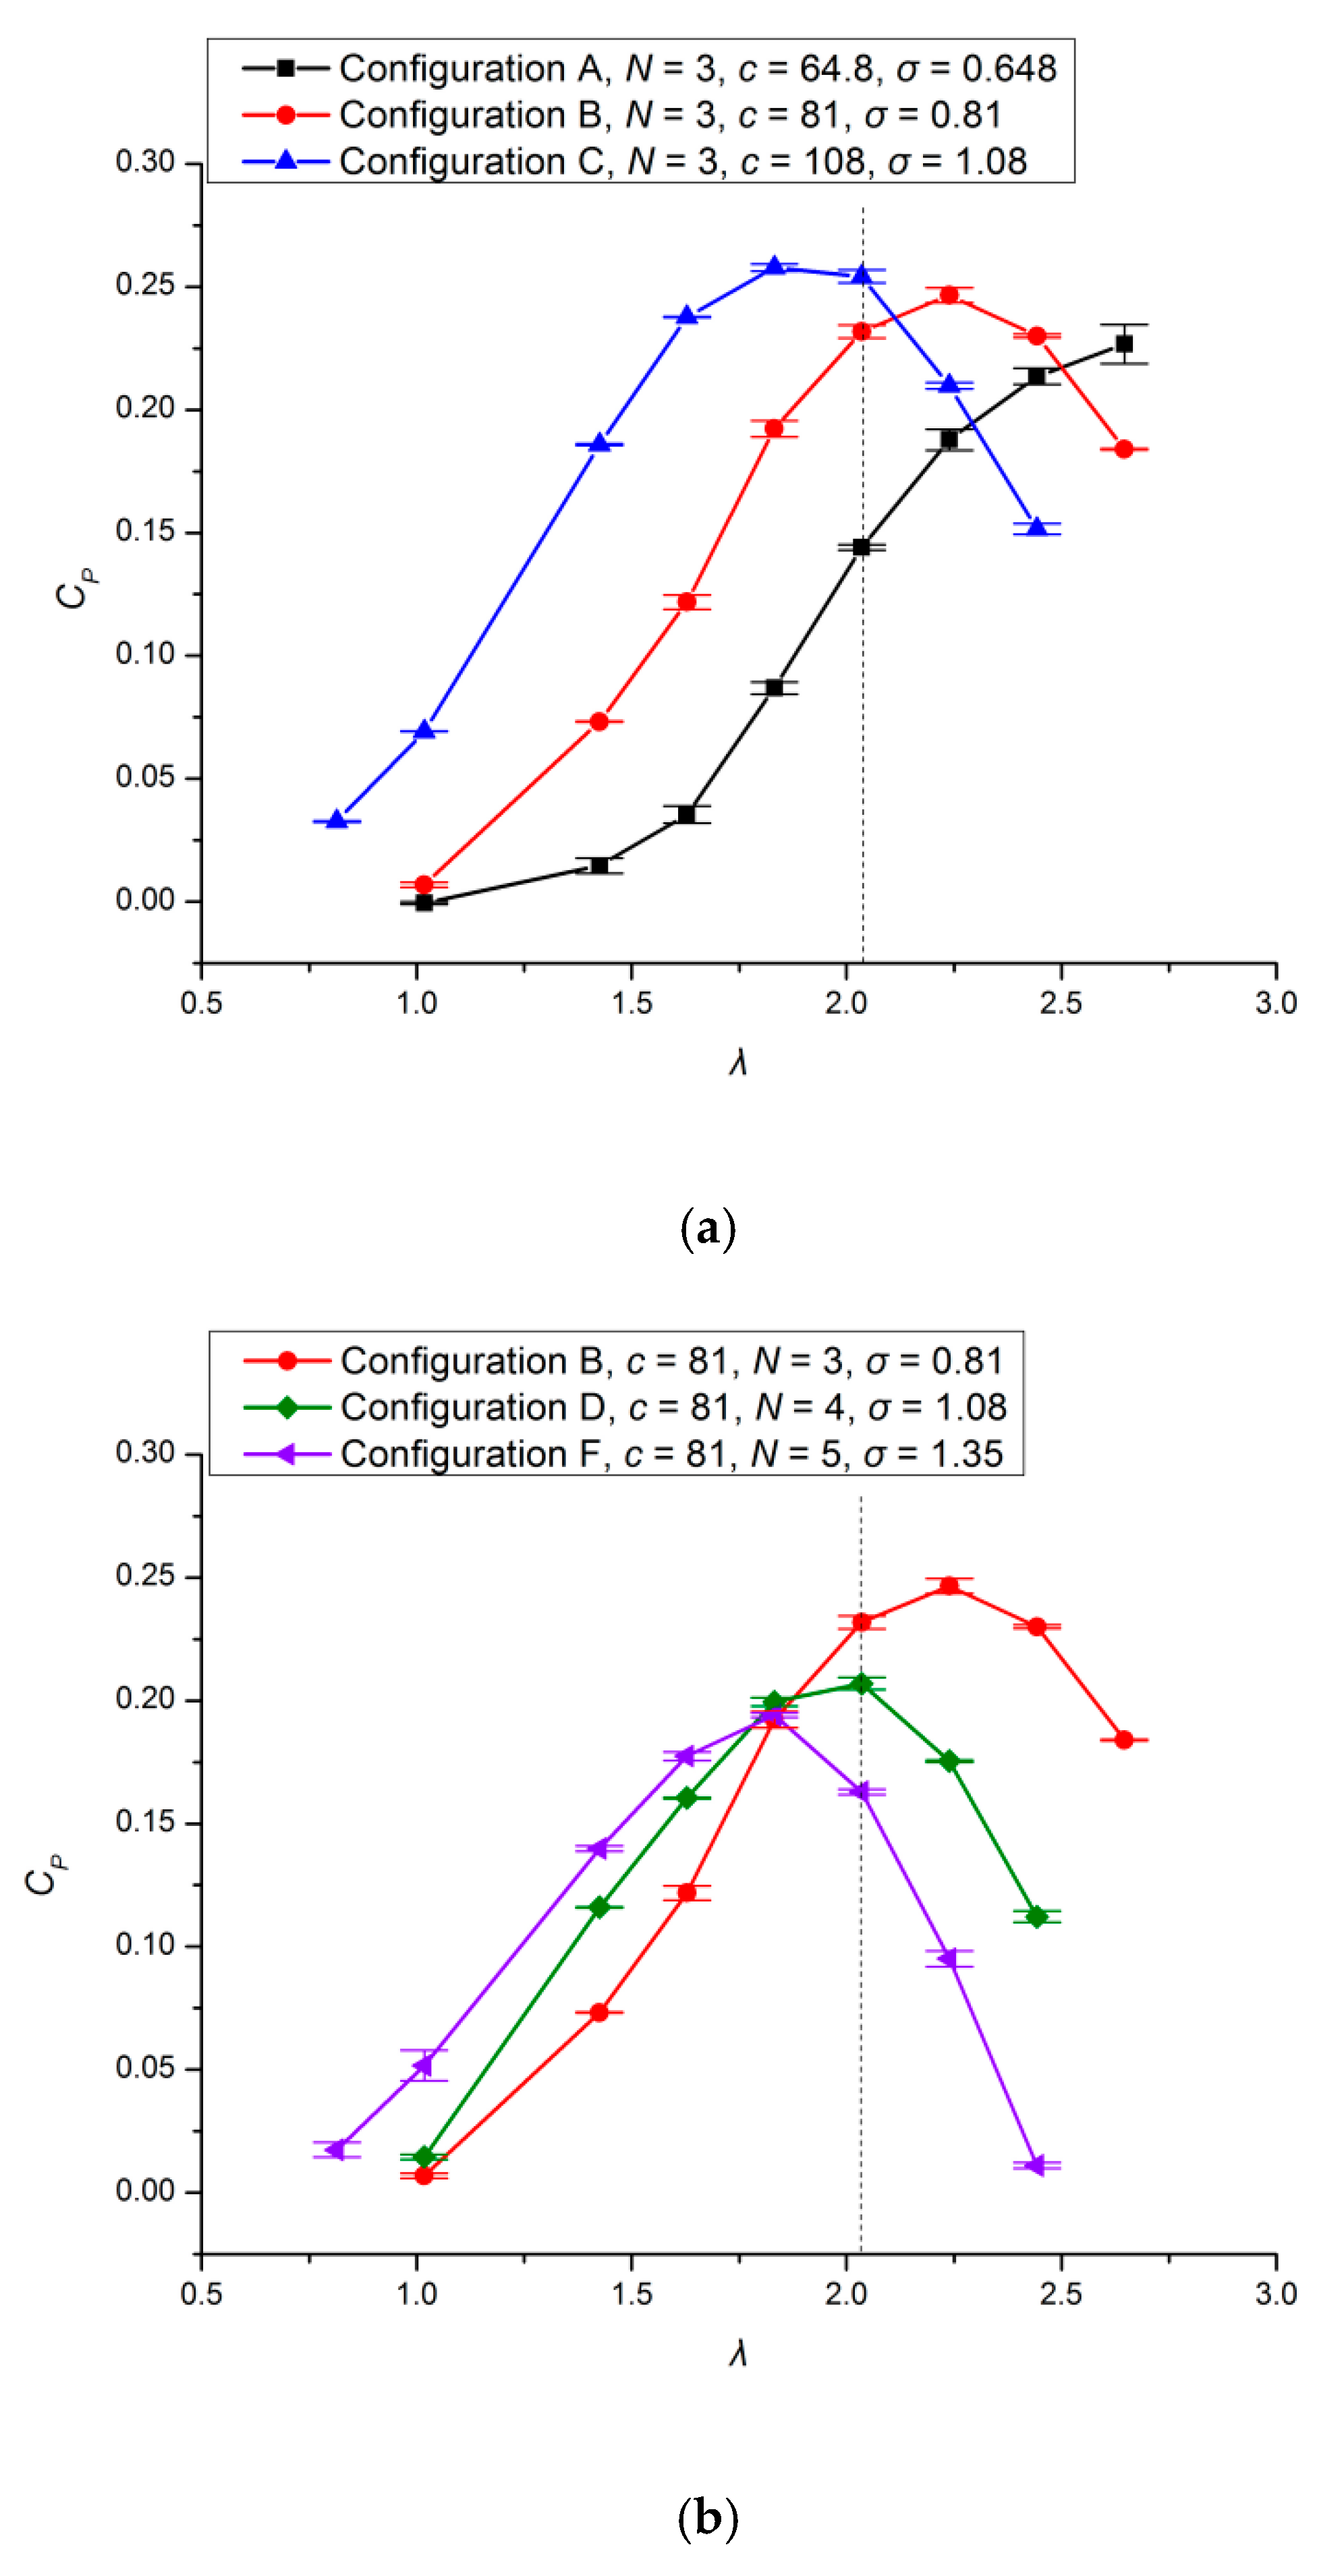
As shown in
Figure 3a, with increasing chord length, the maximal value of the wind energy utilisation coefficient increases and the optimal tip speed ratio decreases. In addition, the wind energy utilisation coefficient curve shifts to the left. When the chord length increases, the chord Reynolds number increases. However, when the chord Reynolds number exceeds a certain value, the influence of the blade on the lift coefficient becomes weaker and the interaction effects between the blade vortex shedding are enhanced. Therefore, when the chord length of the blade continues to increase, there is a marginal improvement of the power coefficient.
When the number of blades increases (
Figure 3b), the influence of the wake of the previous blade on the aerodynamic acquisition of the next blade increases, and the power coefficient decreases gradually. Simultaneously, the optimal tip speed ratio decreases gradually, and the effective working range decreases. In general, the power coefficient curve shifts to the left, and the self-starting behaviour of the wind turbine is improved. With increasing number of blades, the fluctuation period of the driving torque acting on the entire rotor decreases. Thus, the better working range decreases.
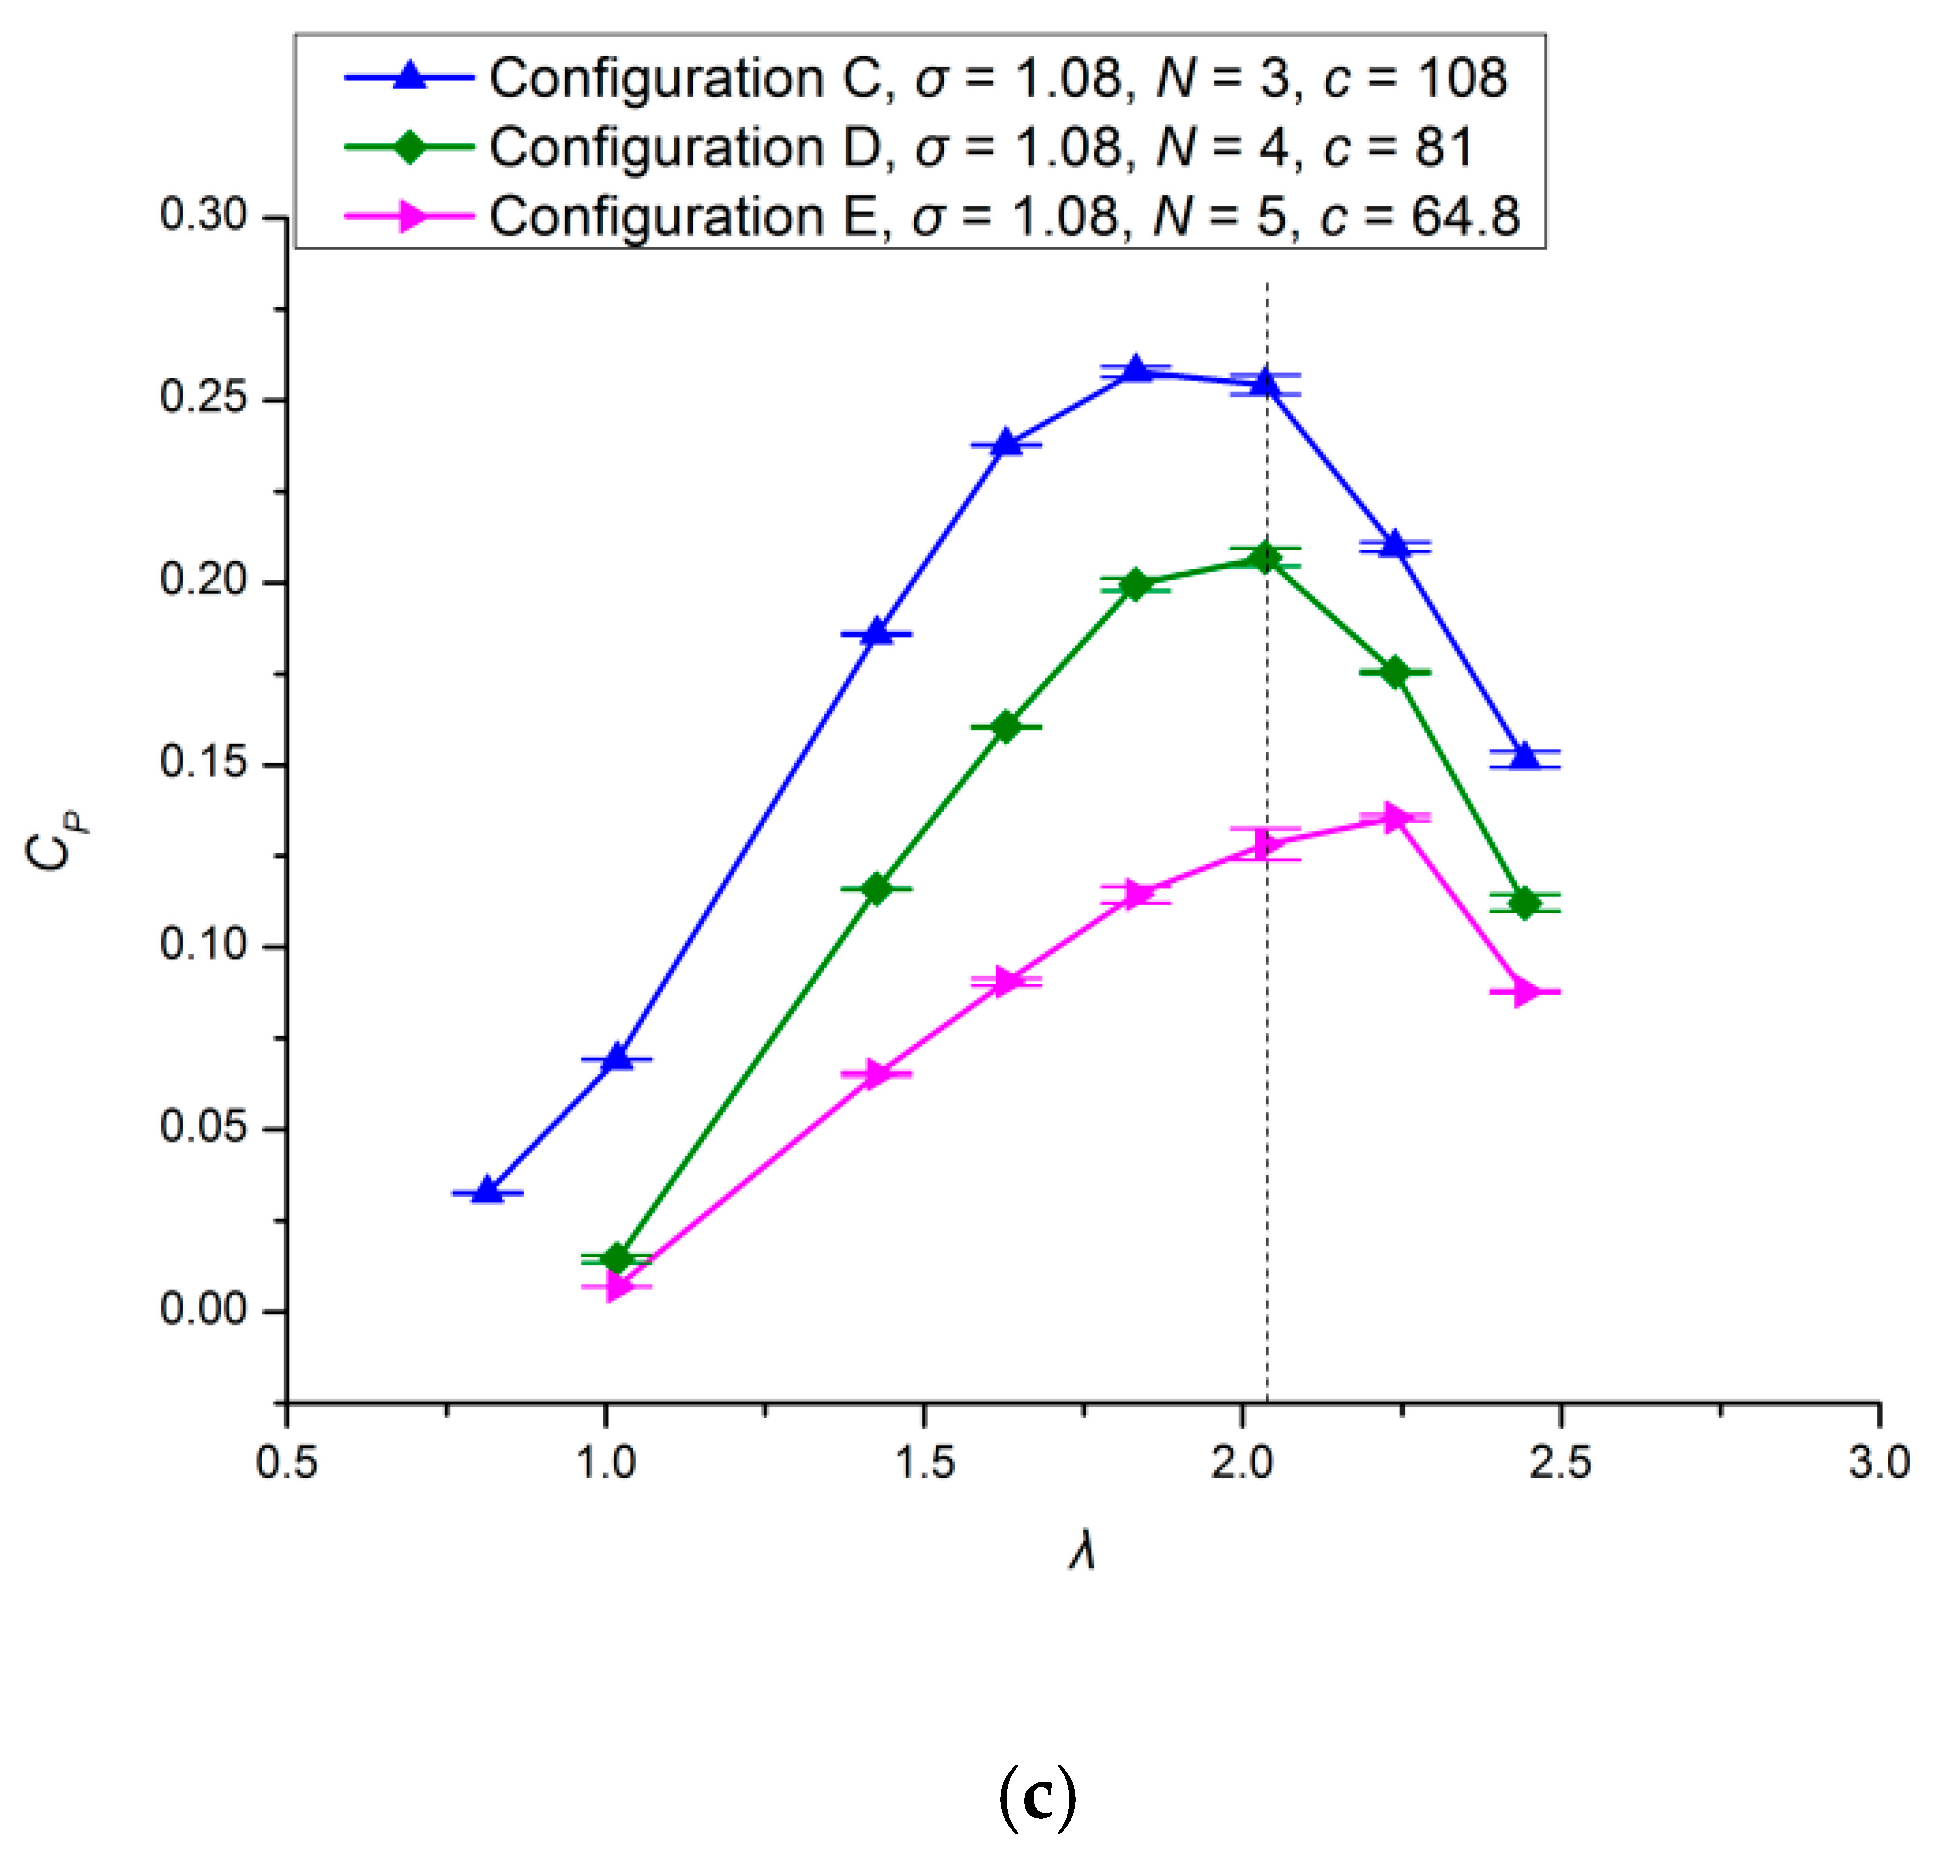
When the solidity of the wind turbine is constant (
Figure 3c), the blocking effect of the strut increases with increasing number of blades. In addition, the maximum of the wind energy utilisation coefficient decreases gradually.
Subsequently, a fixed rotation speed of 500 rpm (i.e., λ = 2.036) was applied to study the wake characteristics of different configurations. Three typical operational states were considered: turbulent wake state, design state and stall state. The state corresponding to the maximum value of the power coefficient curve is the design state. The state corresponding to the rising section of the power coefficient curve is the stall state. The state corresponding to the falling section of the power coefficient curve is the turbulent wake state. When λ is 2.036 (
Figure 3a), the turbines with configurations A and B are in the stall state, and the turbine with configuration C is in the turbulent wake state; in
Figure 3b, the turbine with configuration D is in the design state, and the turbine with configuration F is in the turbulent wake state; according to
Figure 3c, the turbine with configuration E is in the stall state.
3.2. Mean Wake Characteristics and Turbulent Wake Characteristics
The wake profiles are plotted with the position normalised with respect to the rotor diameter (
D). The time-averaged streamwise velocity (
U) is normalised with respect to the free-stream wind speed (
U0) of 7.7 m/s. Before each measurement, the probe was placed at a distance of 1.2 m from the rotor (−600, 0), and the input of the wind tunnel was adjusted to make the probe output (
U0) 7.7 m/s. The rotation speed of the rotor is 500 rpm, i.e.,
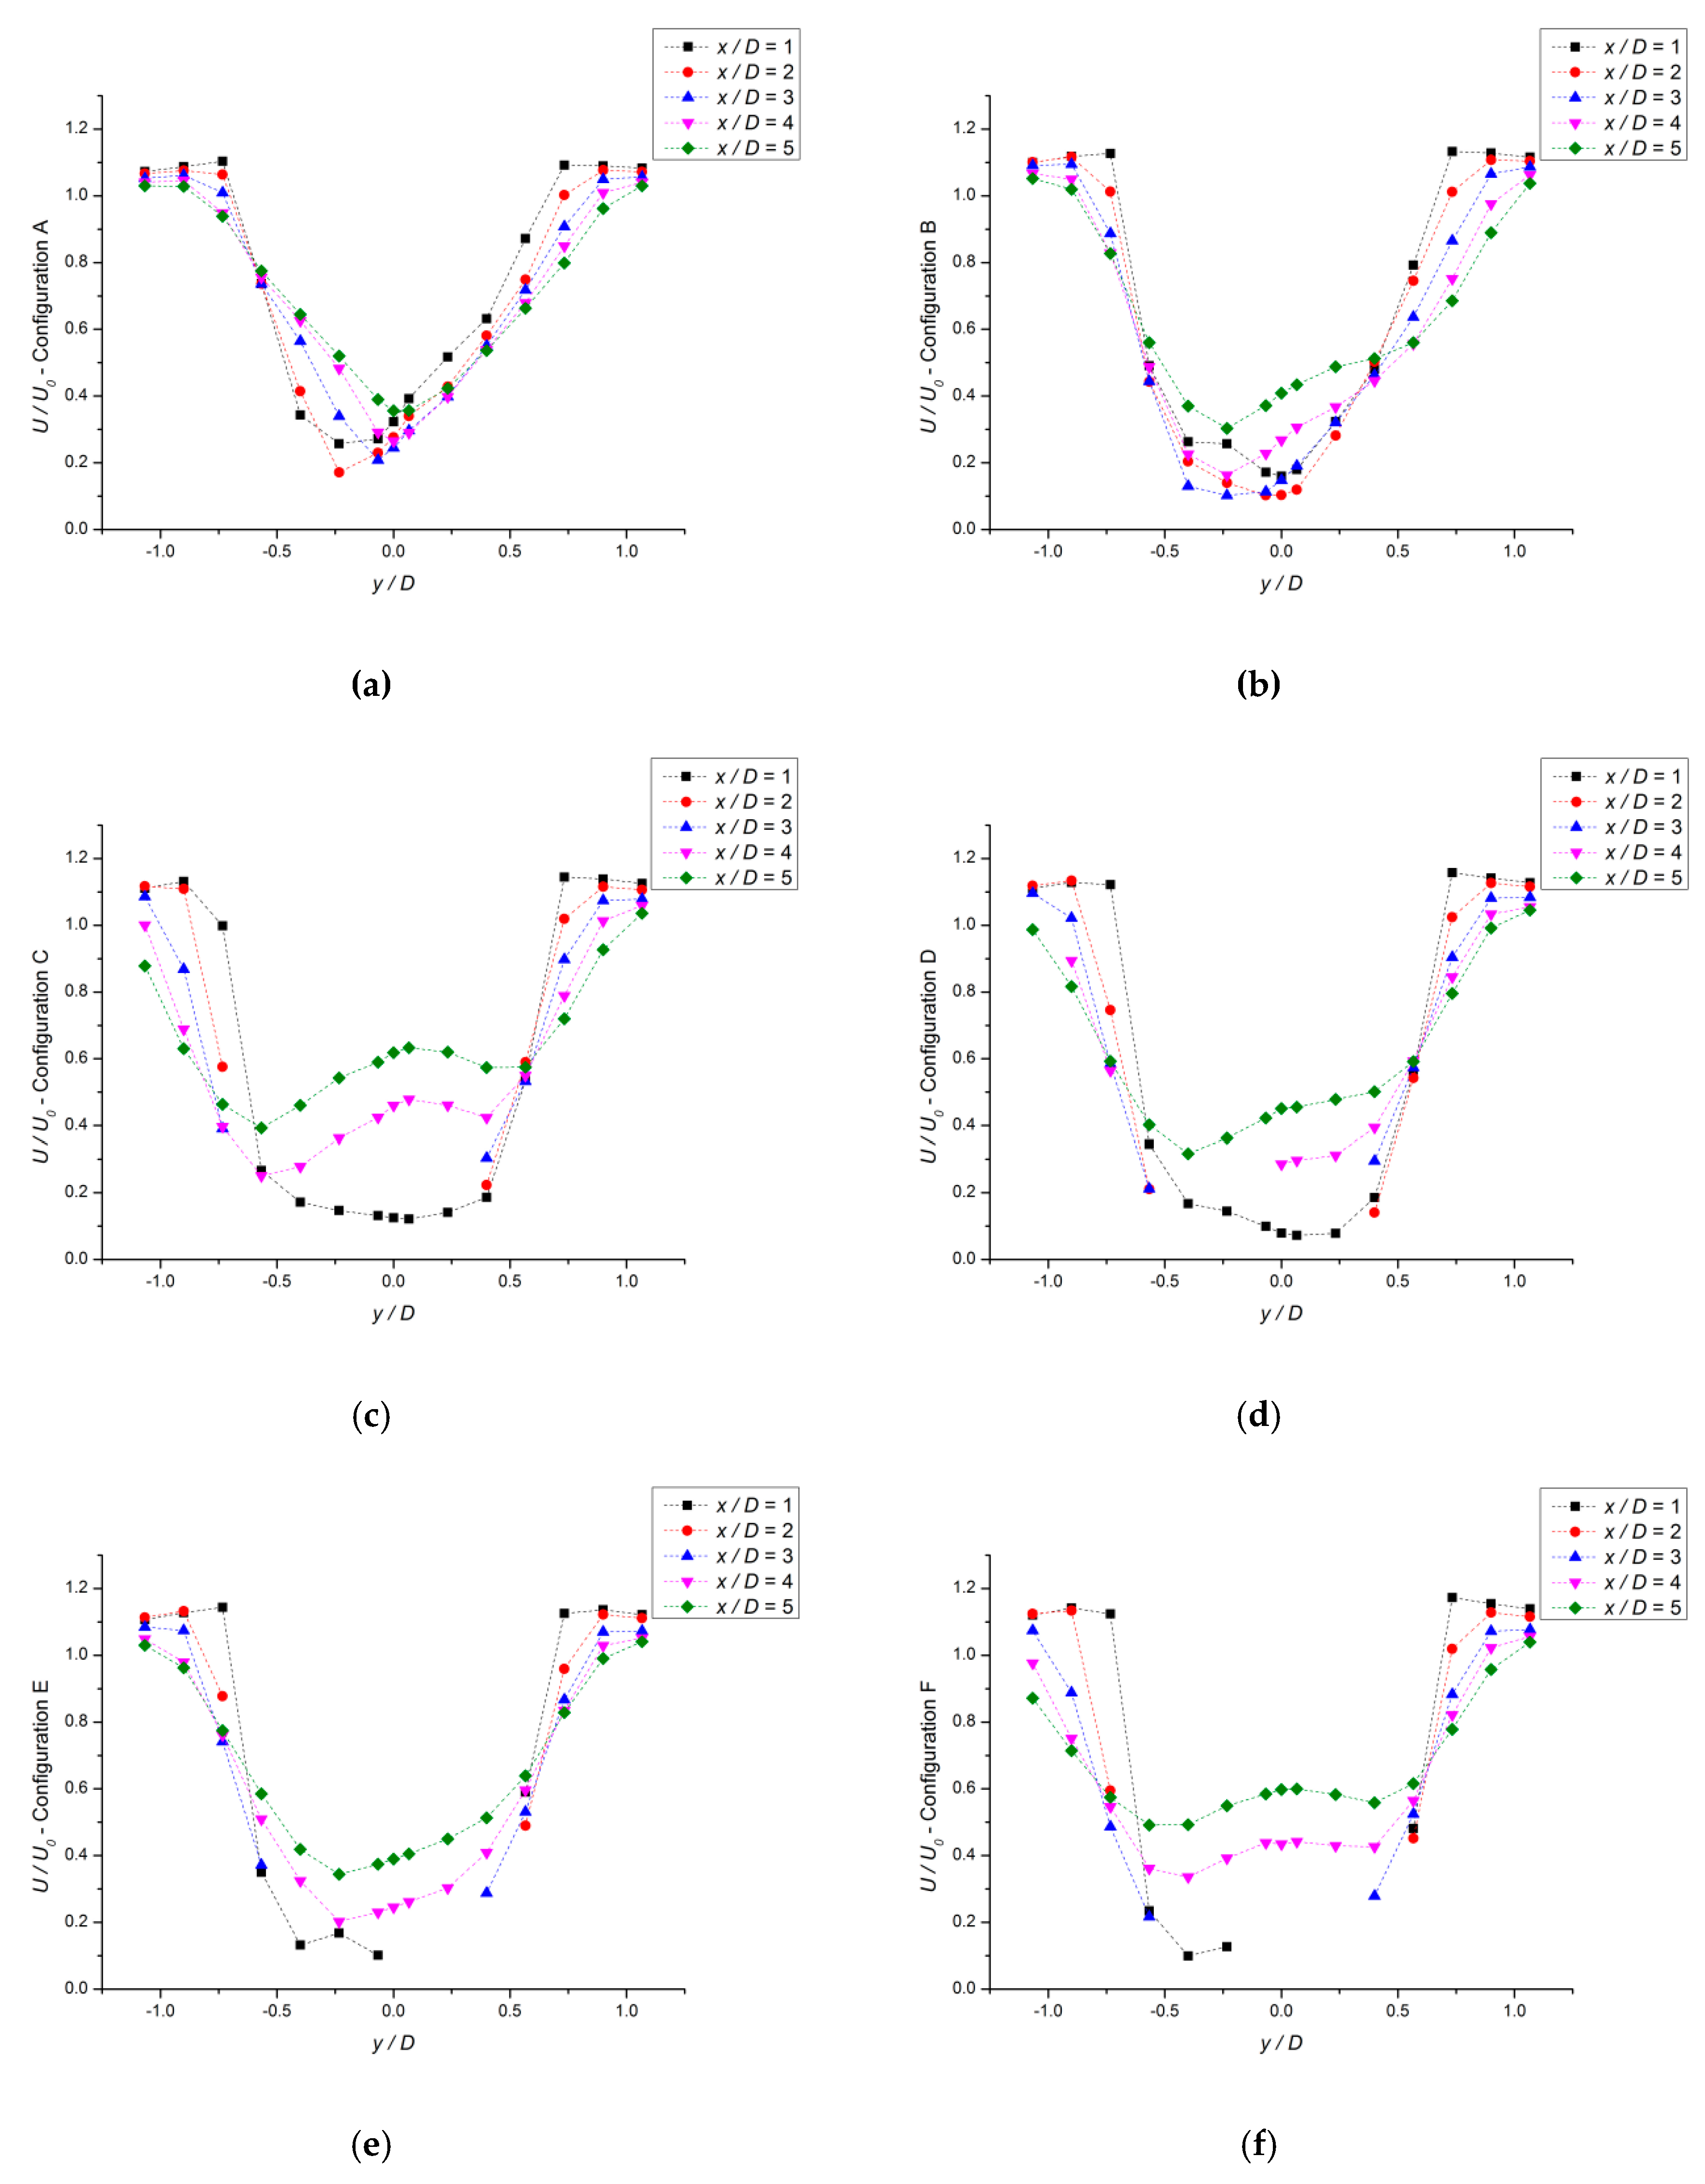
λ = 2.036. The VAWT rotates clockwise from the top view. For configurations C, D, E and F, the wake velocity profiles are absent at certain space points. Most of sample values are zero because the probe cannot recognize the negative pressure value. However, the probe captured the pressure of these space points well when it was installed in the opposite direction. This indicates that there are re-circulation regions behind the VAWT in configurations C, D, E and F. Based on [
22], the Cobra probe was used to detect the re-circulation regions in the wake.
Figure 4 shows the wake profiles of streamwise velocity component (
U) for different configurations on the blade mid-span plane. The wake velocity deficit caused by the energy extraction and blockage effect is consistent with those of previous findings [
23,
24,
25,
26]. In general, with increasing solidity, the rotation induction effect increases gradually and the wake asymmetry increases gradually. For configuration A, the wake profile (
Figure 4a) transforms gradually from asymmetrical to symmetrical. With increasing solidity, the wake profiles change from V- to (
Figure 4a,b) U-shape (
Figure 4c–f), and the wake speed recovers faster. The wake shear layer is formed by the difference in the velocities of the internal wake region and external free stream, and the size of the wake shear layer expands continuously in downstream direction.
Another feature of the wake flow is the presence of re-circulation regions in configurations C, D, E and F. With increasing solidity, the re-circulation region appears and its range becomes larger and closer to the VAWT. Behind the re-circulation region, the W-shaped wake profiles of configurations C and F occur at 4D and 5D. This results in a change in the direction of the fluid velocity gradient.
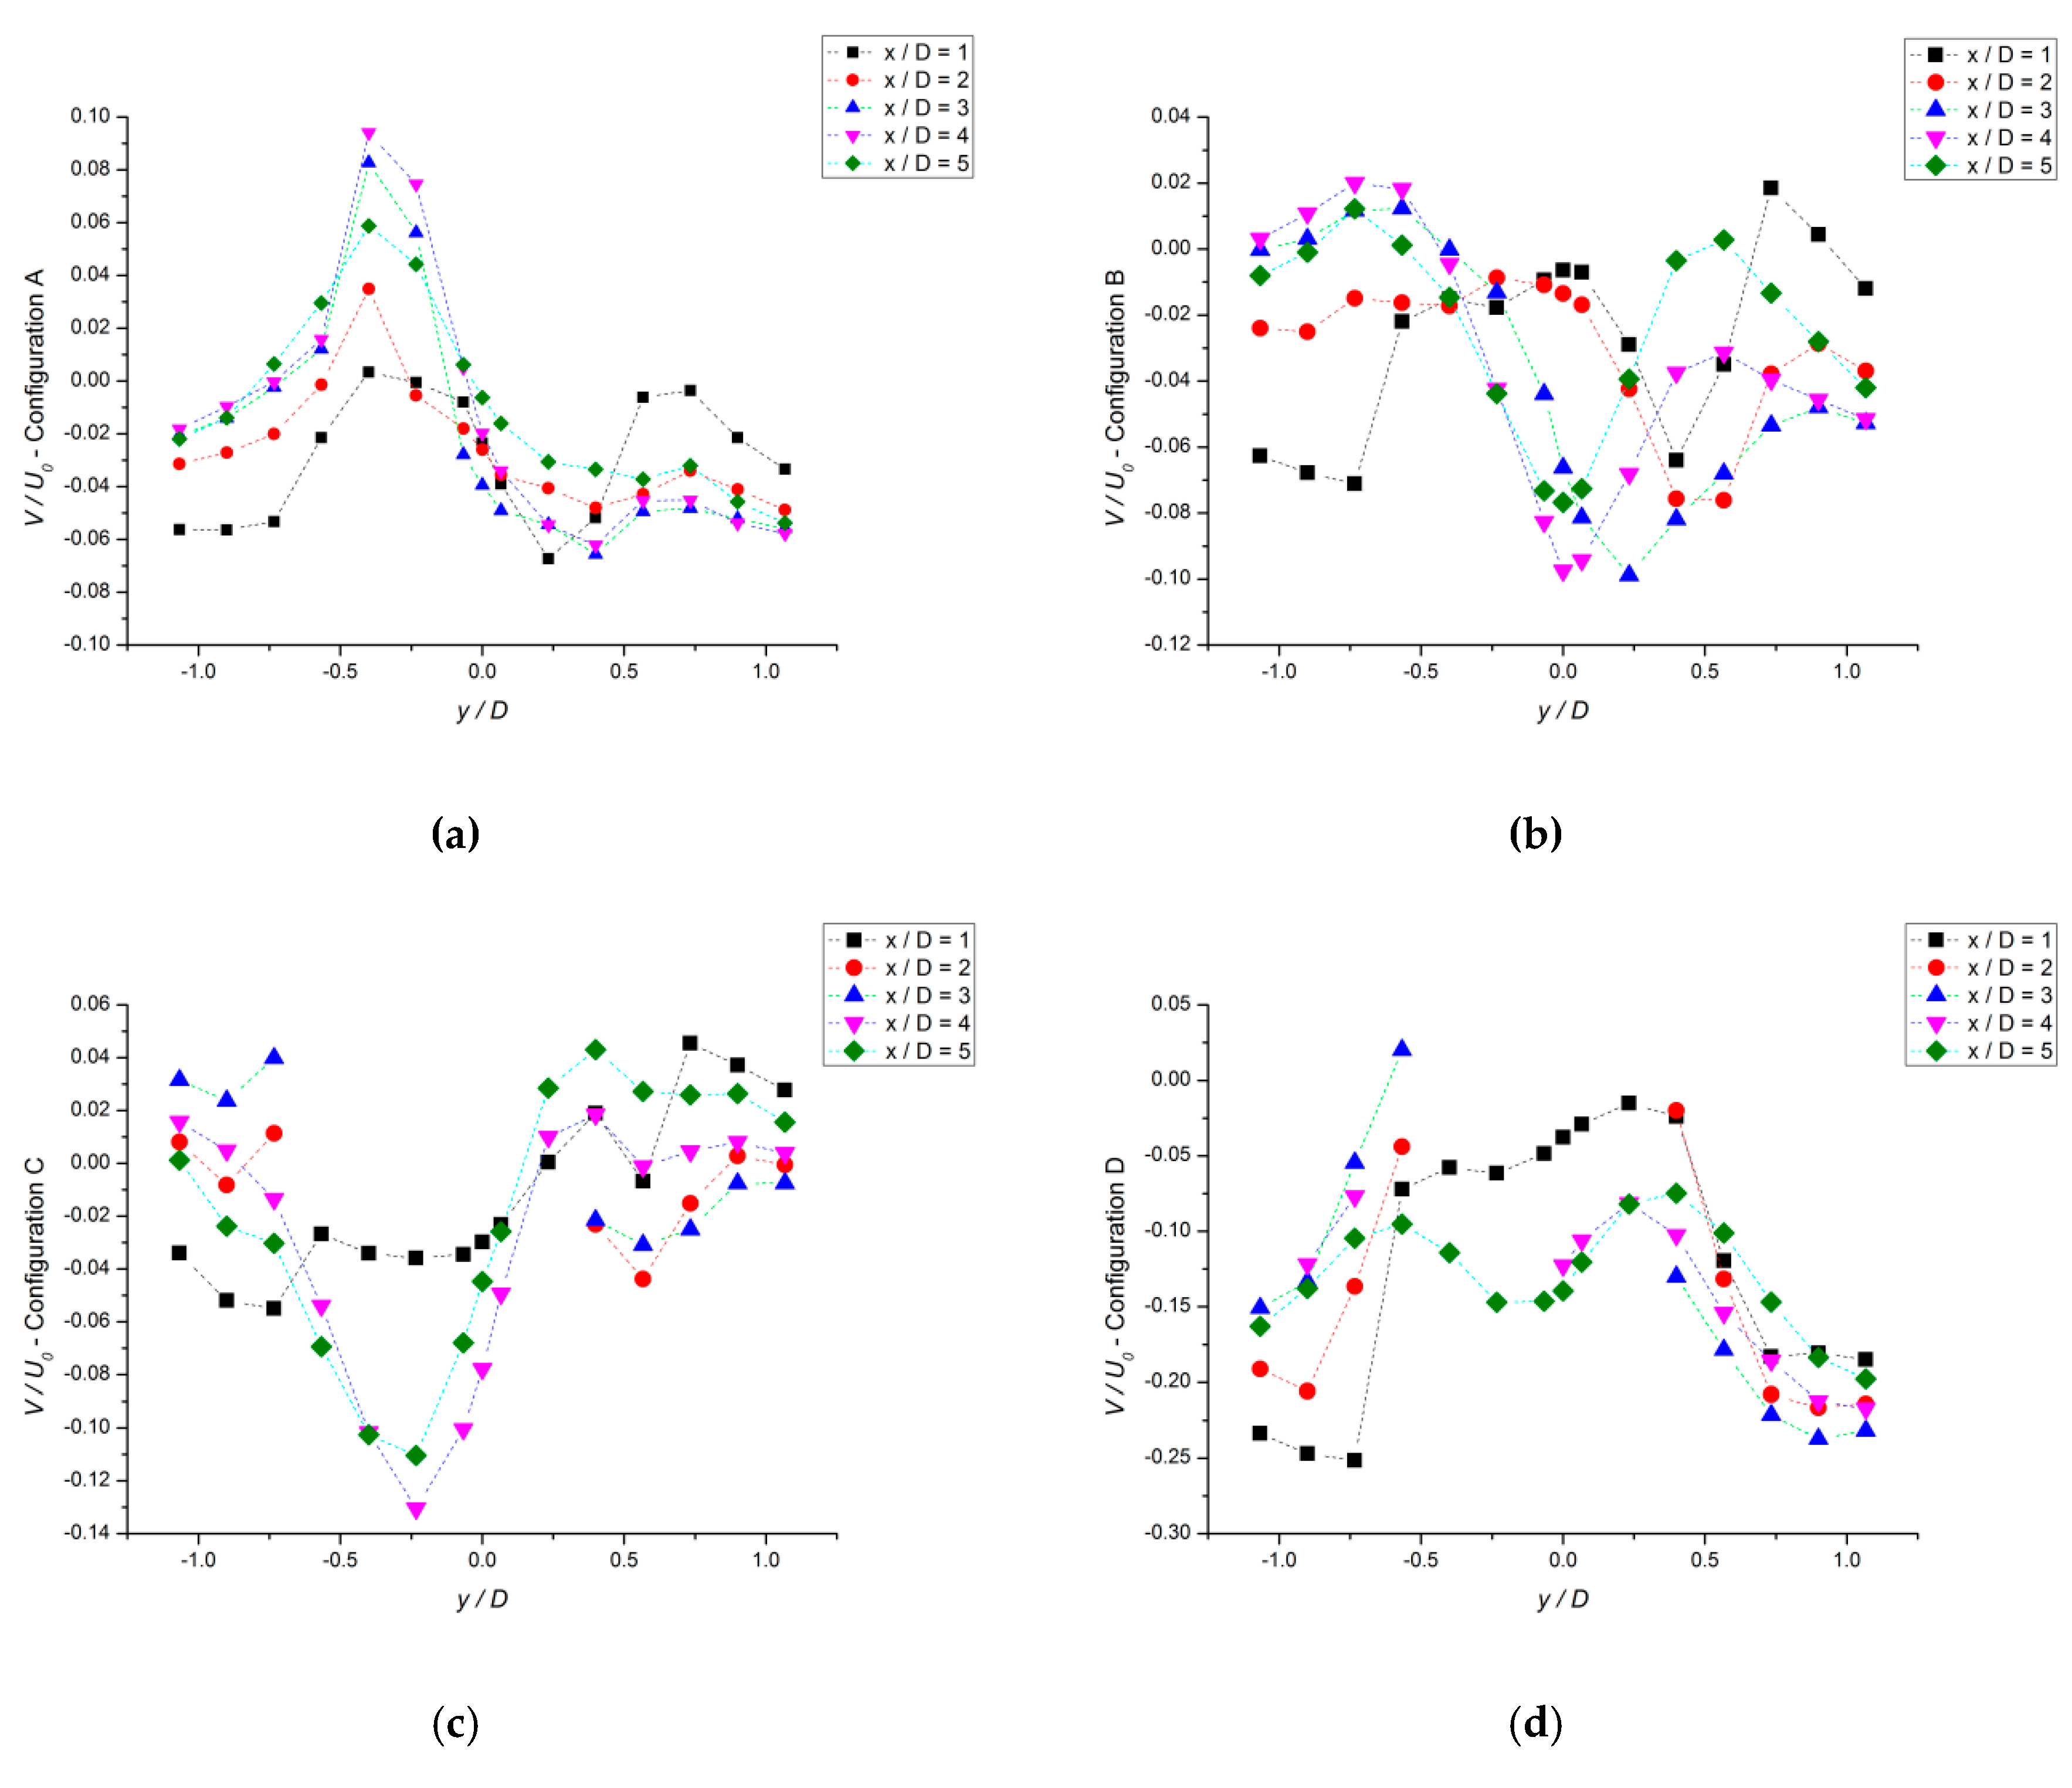
Figure 5 shows the spanwise velocity component (
V). For configuration A (
Figure 5a), the spanwise induction is gradually weakened in windward direction (
y −) and increases in downwind direction (
y +) with the development of the wake. Hence, in the near wake, the wake expansion is gradually weakened in windward direction (
y −) and increases in downwind direction (
y +). Moreover, in the wake shear layer, the lower negative value means that the spanwise induction and wake asymmetry increase gradually with increasing solidity; however, this is not the case for configurations C and F. In the wake shear layer region, the spanwise velocity component of configurations C and F oscillates around zero, thereby indicating the existence of a vortex structure.
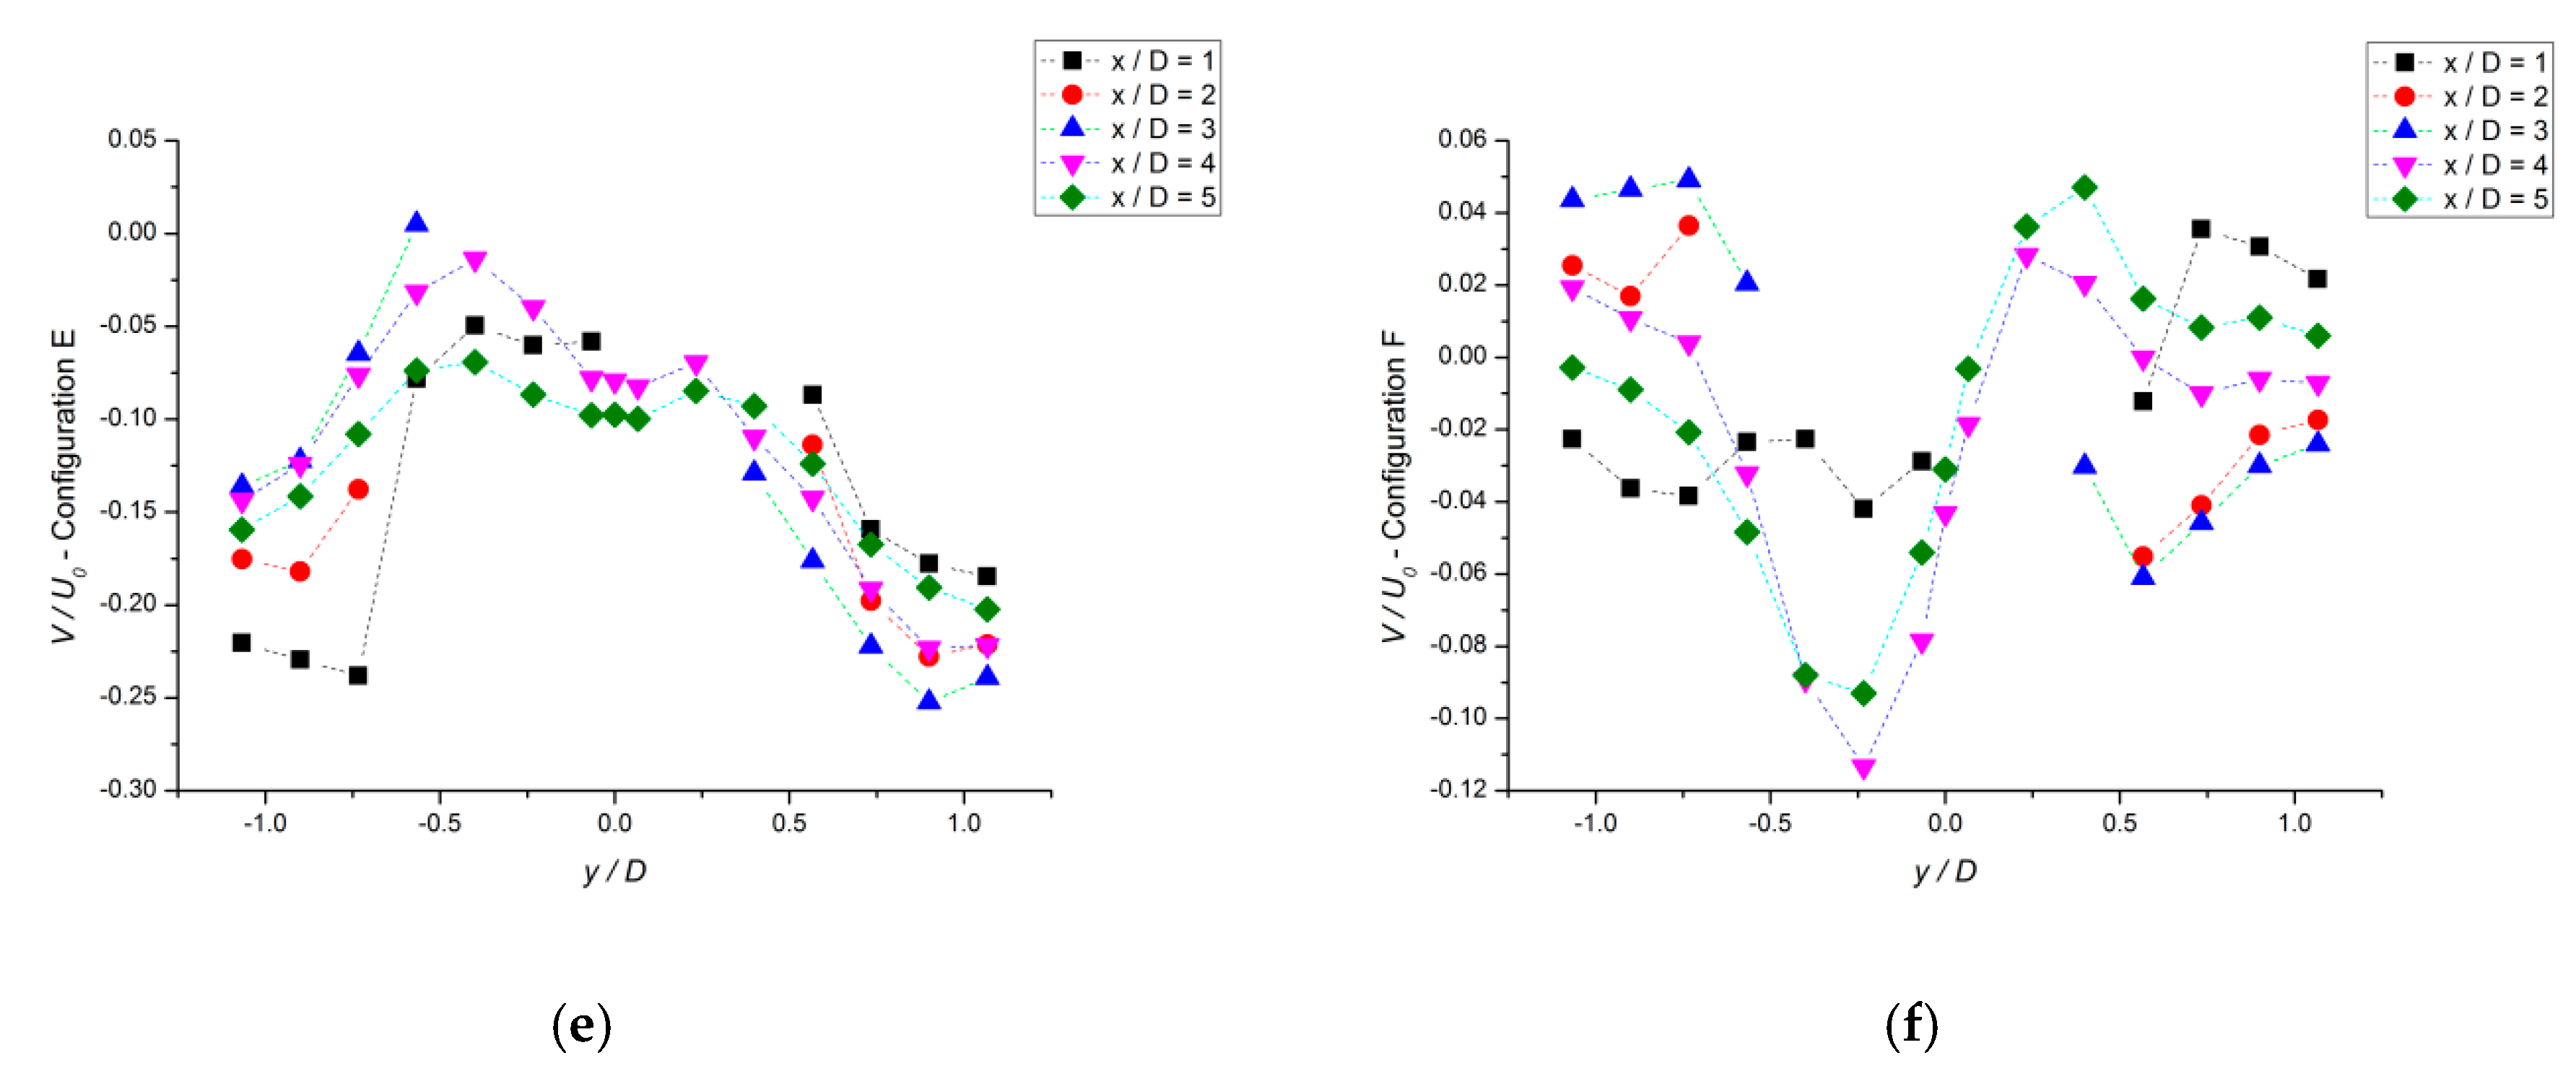
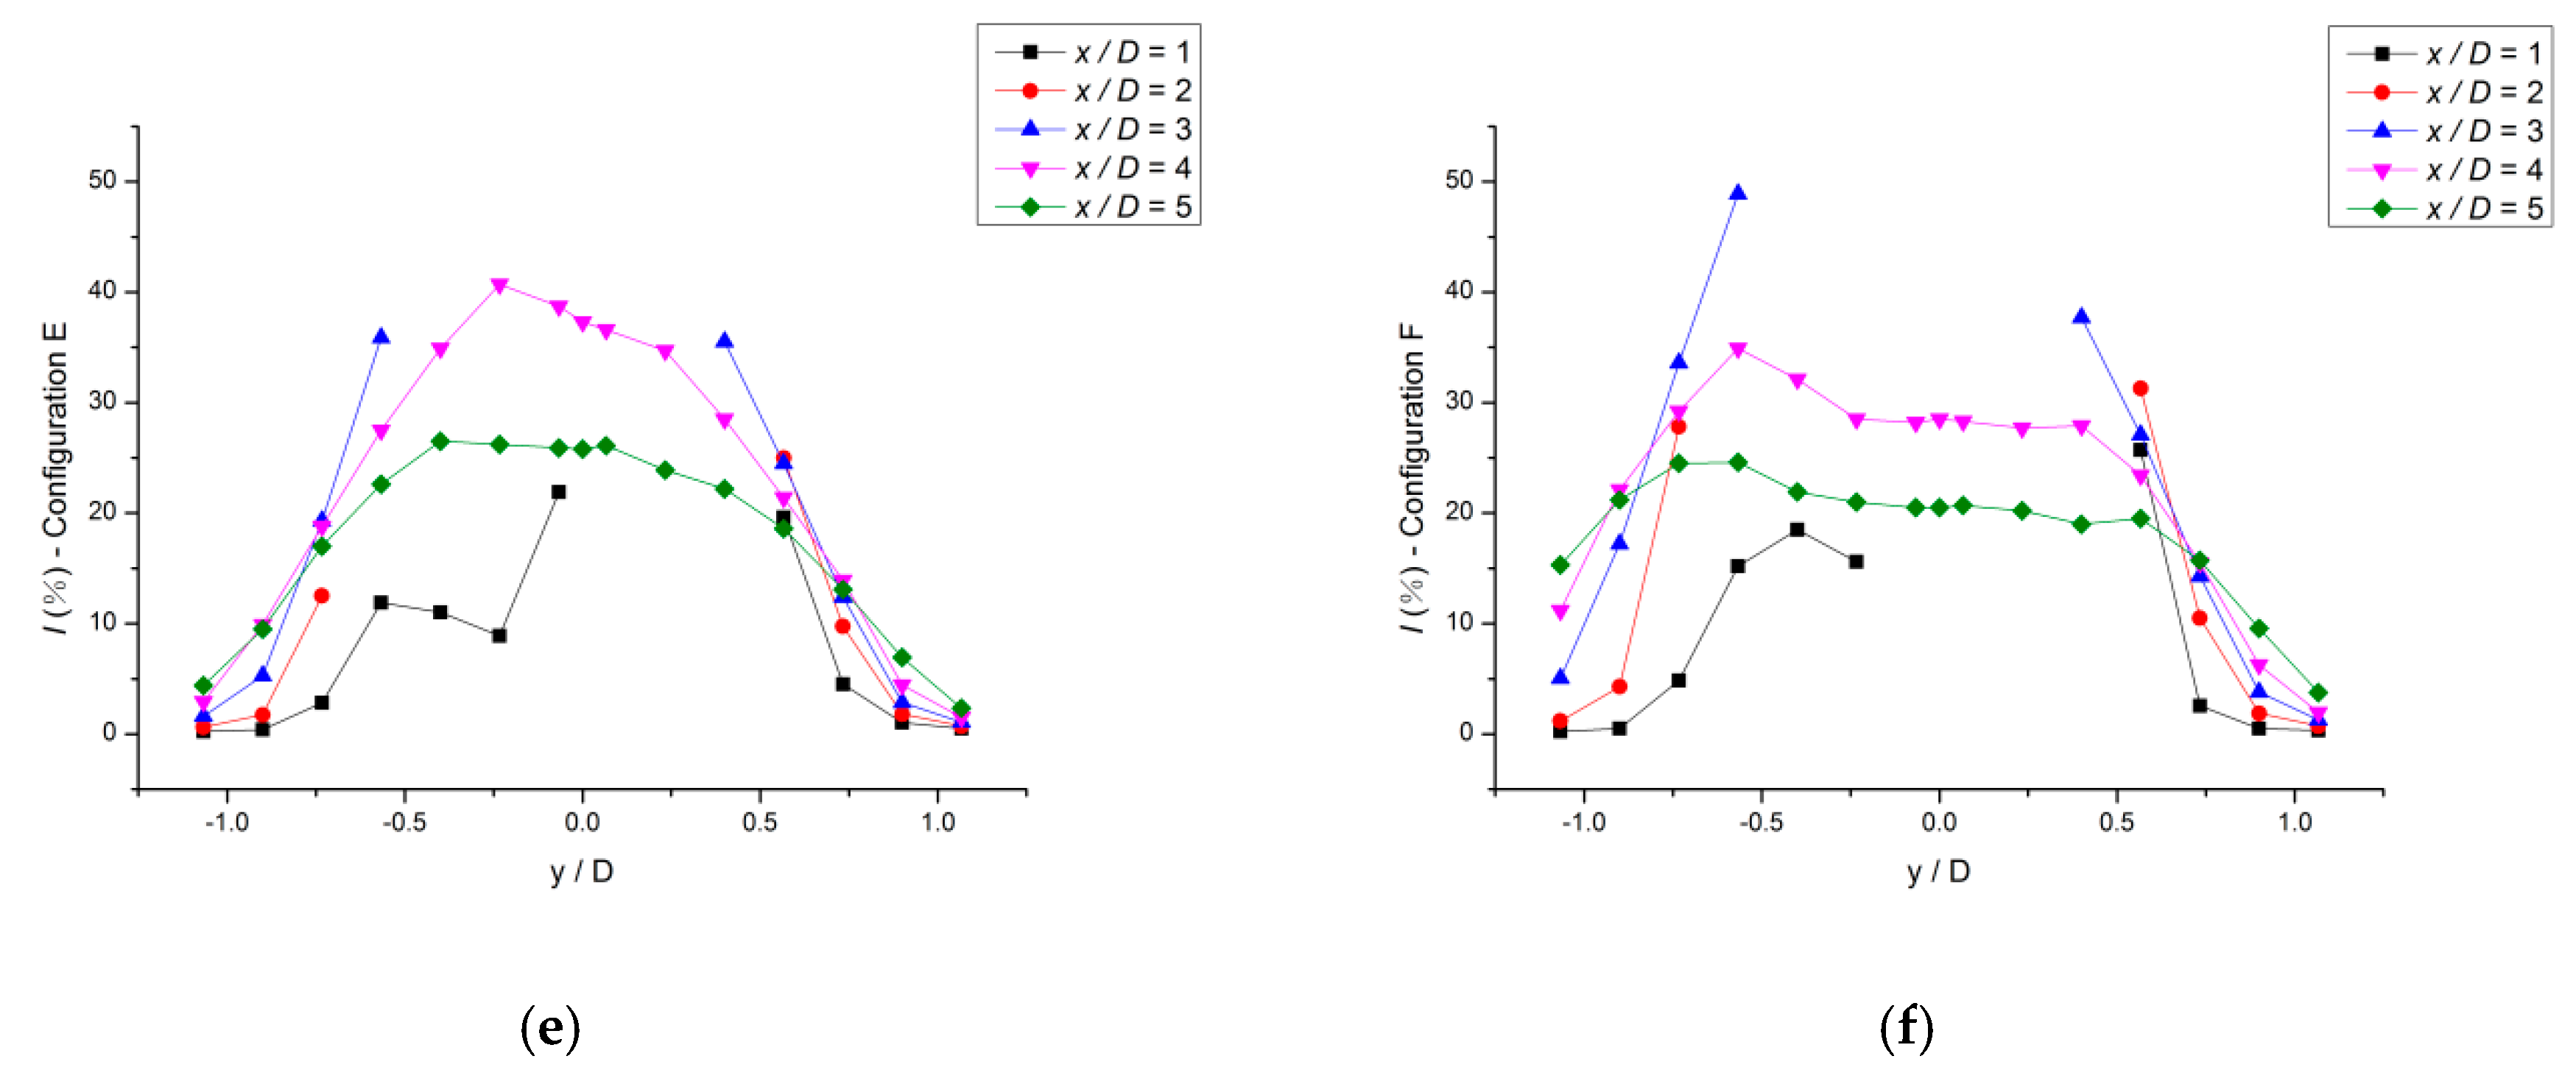
The fatigue life of the wind turbine rotor is related to its dynamic load, which is related to the turbulence intensity. The turbulence intensity is an important characteristic quantity for describing the characteristics of turbulent wakes.
Figure 6 shows the turbulence intensity profiles of different configurations. In the near wake, the turbulence intensity increases gradually. As the downstream distance from the rotor continues to increase, the turbulence intensity decreases slowly.
3.3. The Dynamic Characteristics of Wake Evolution
In this study, the Morlet wavelet was used as wavelet basis function to analyse the time series signals of the streamwise fluctuating velocity at different positions.
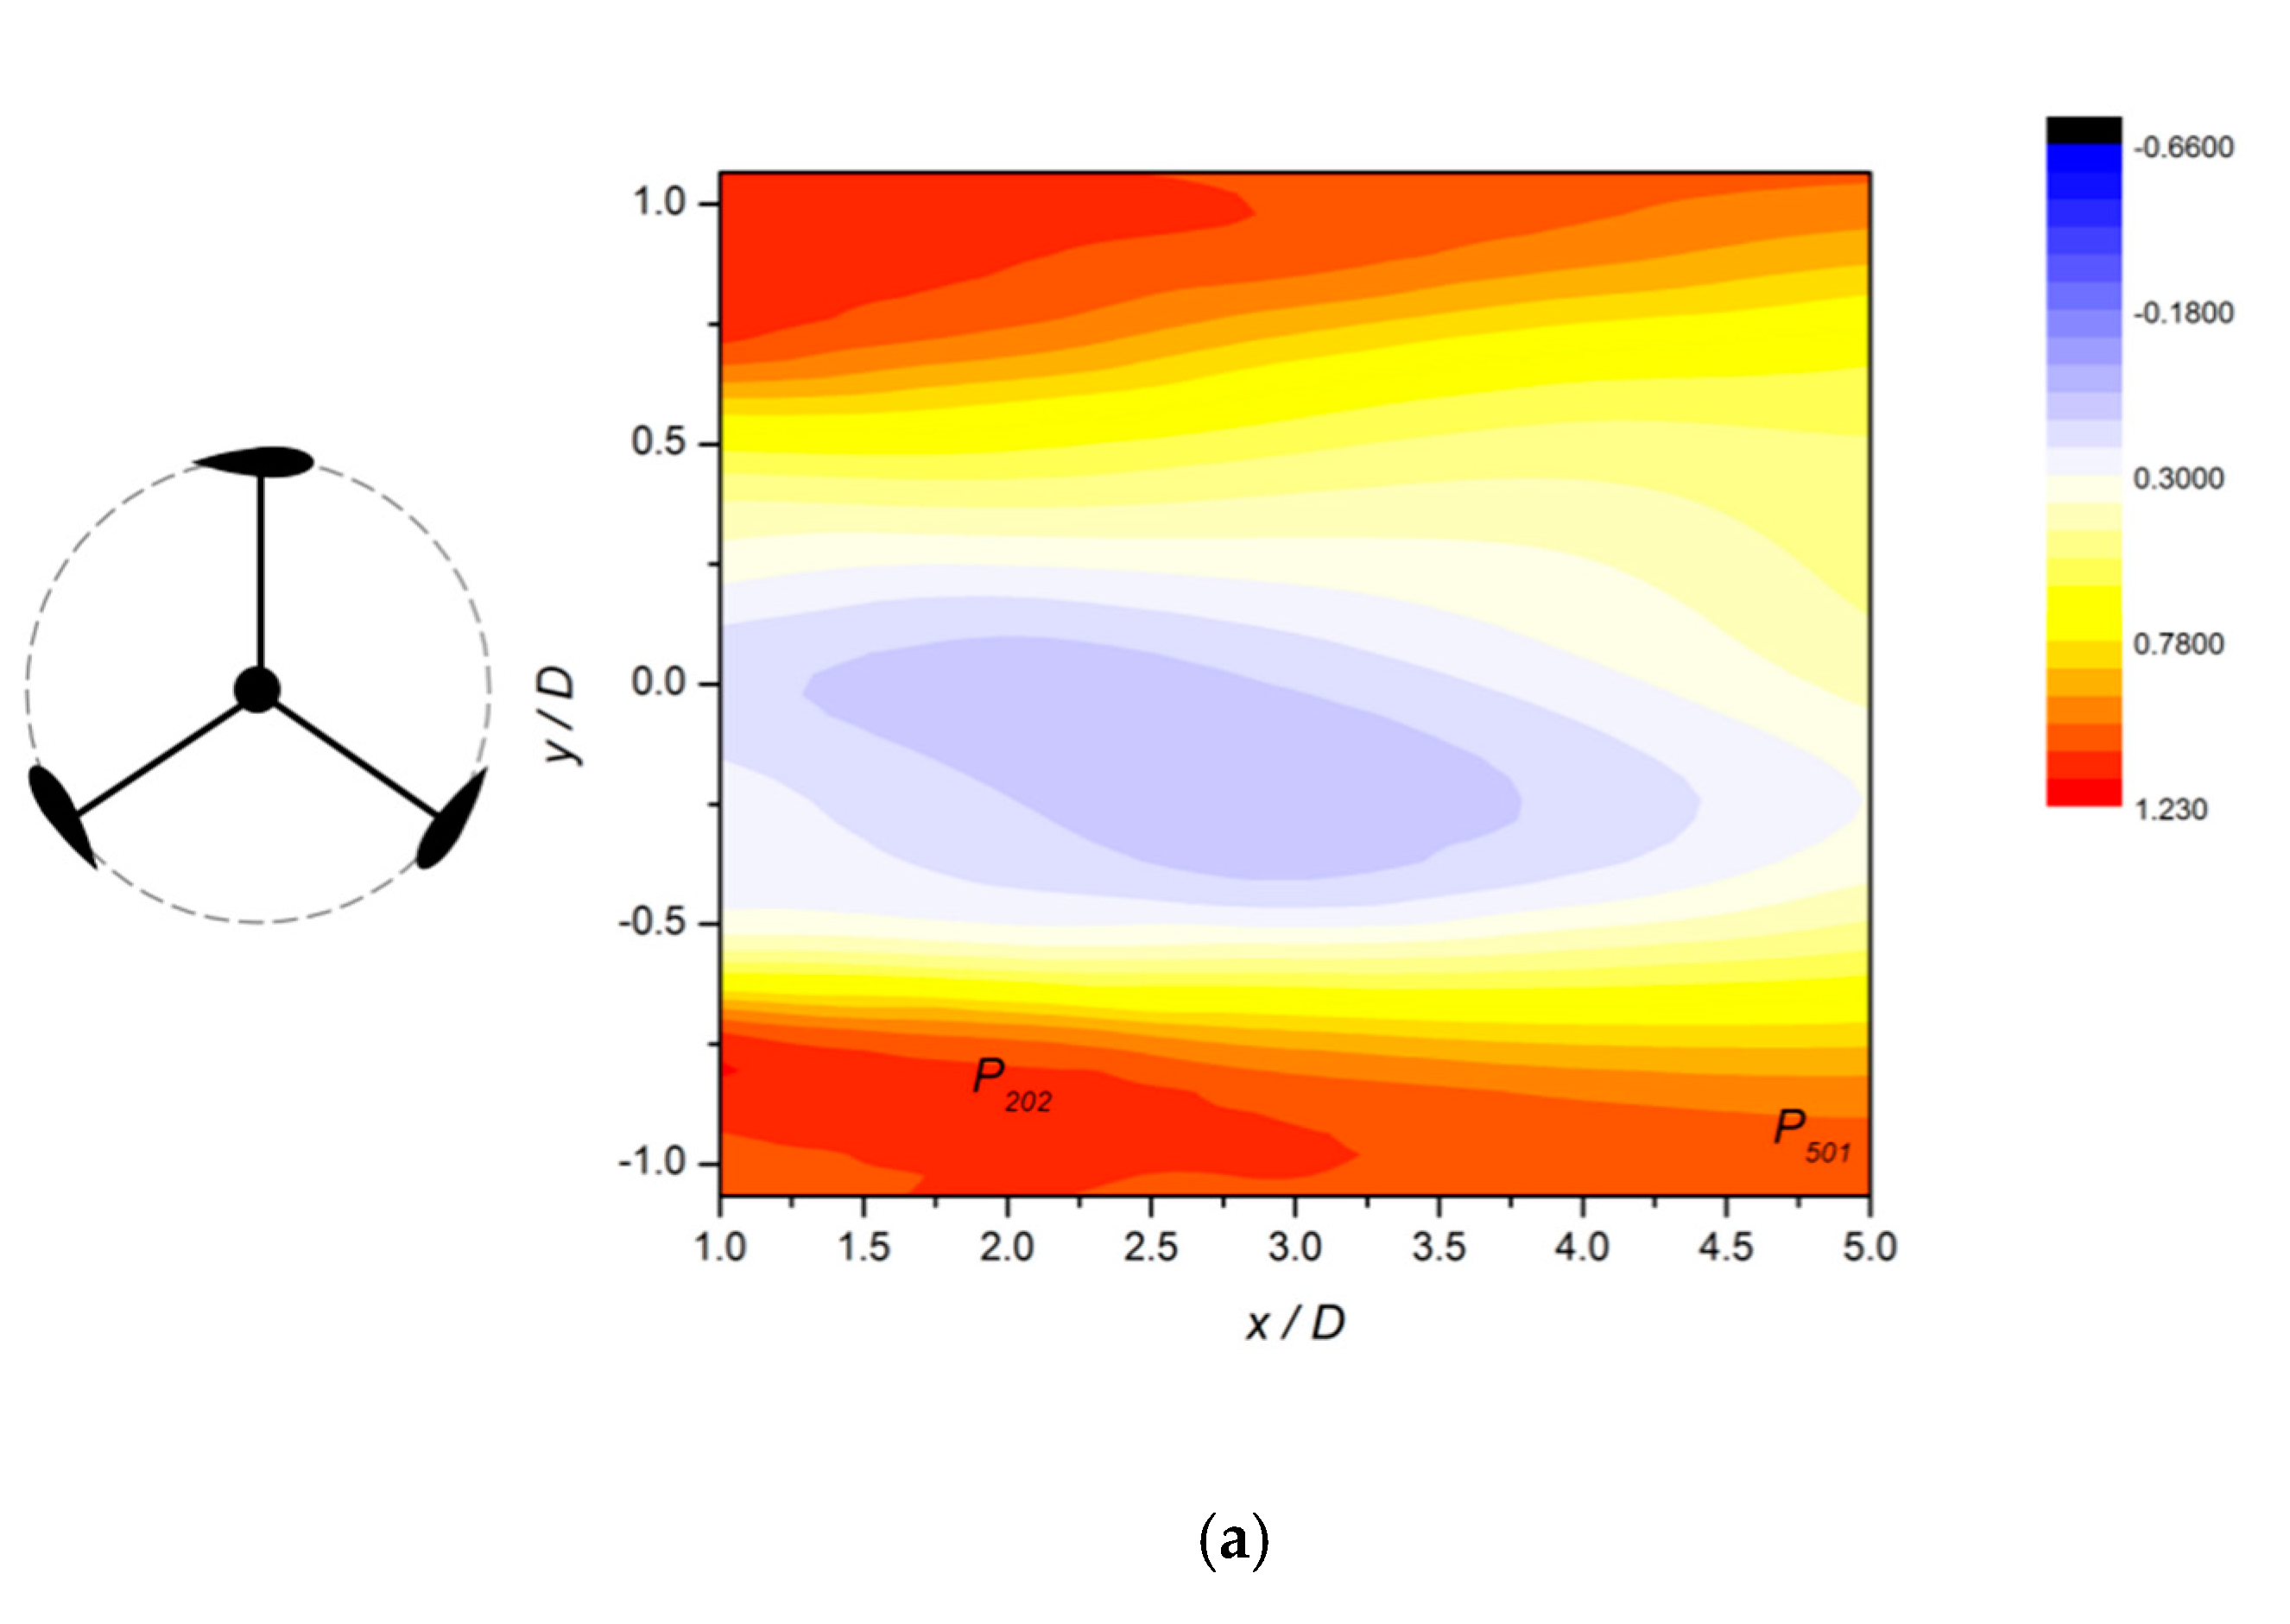
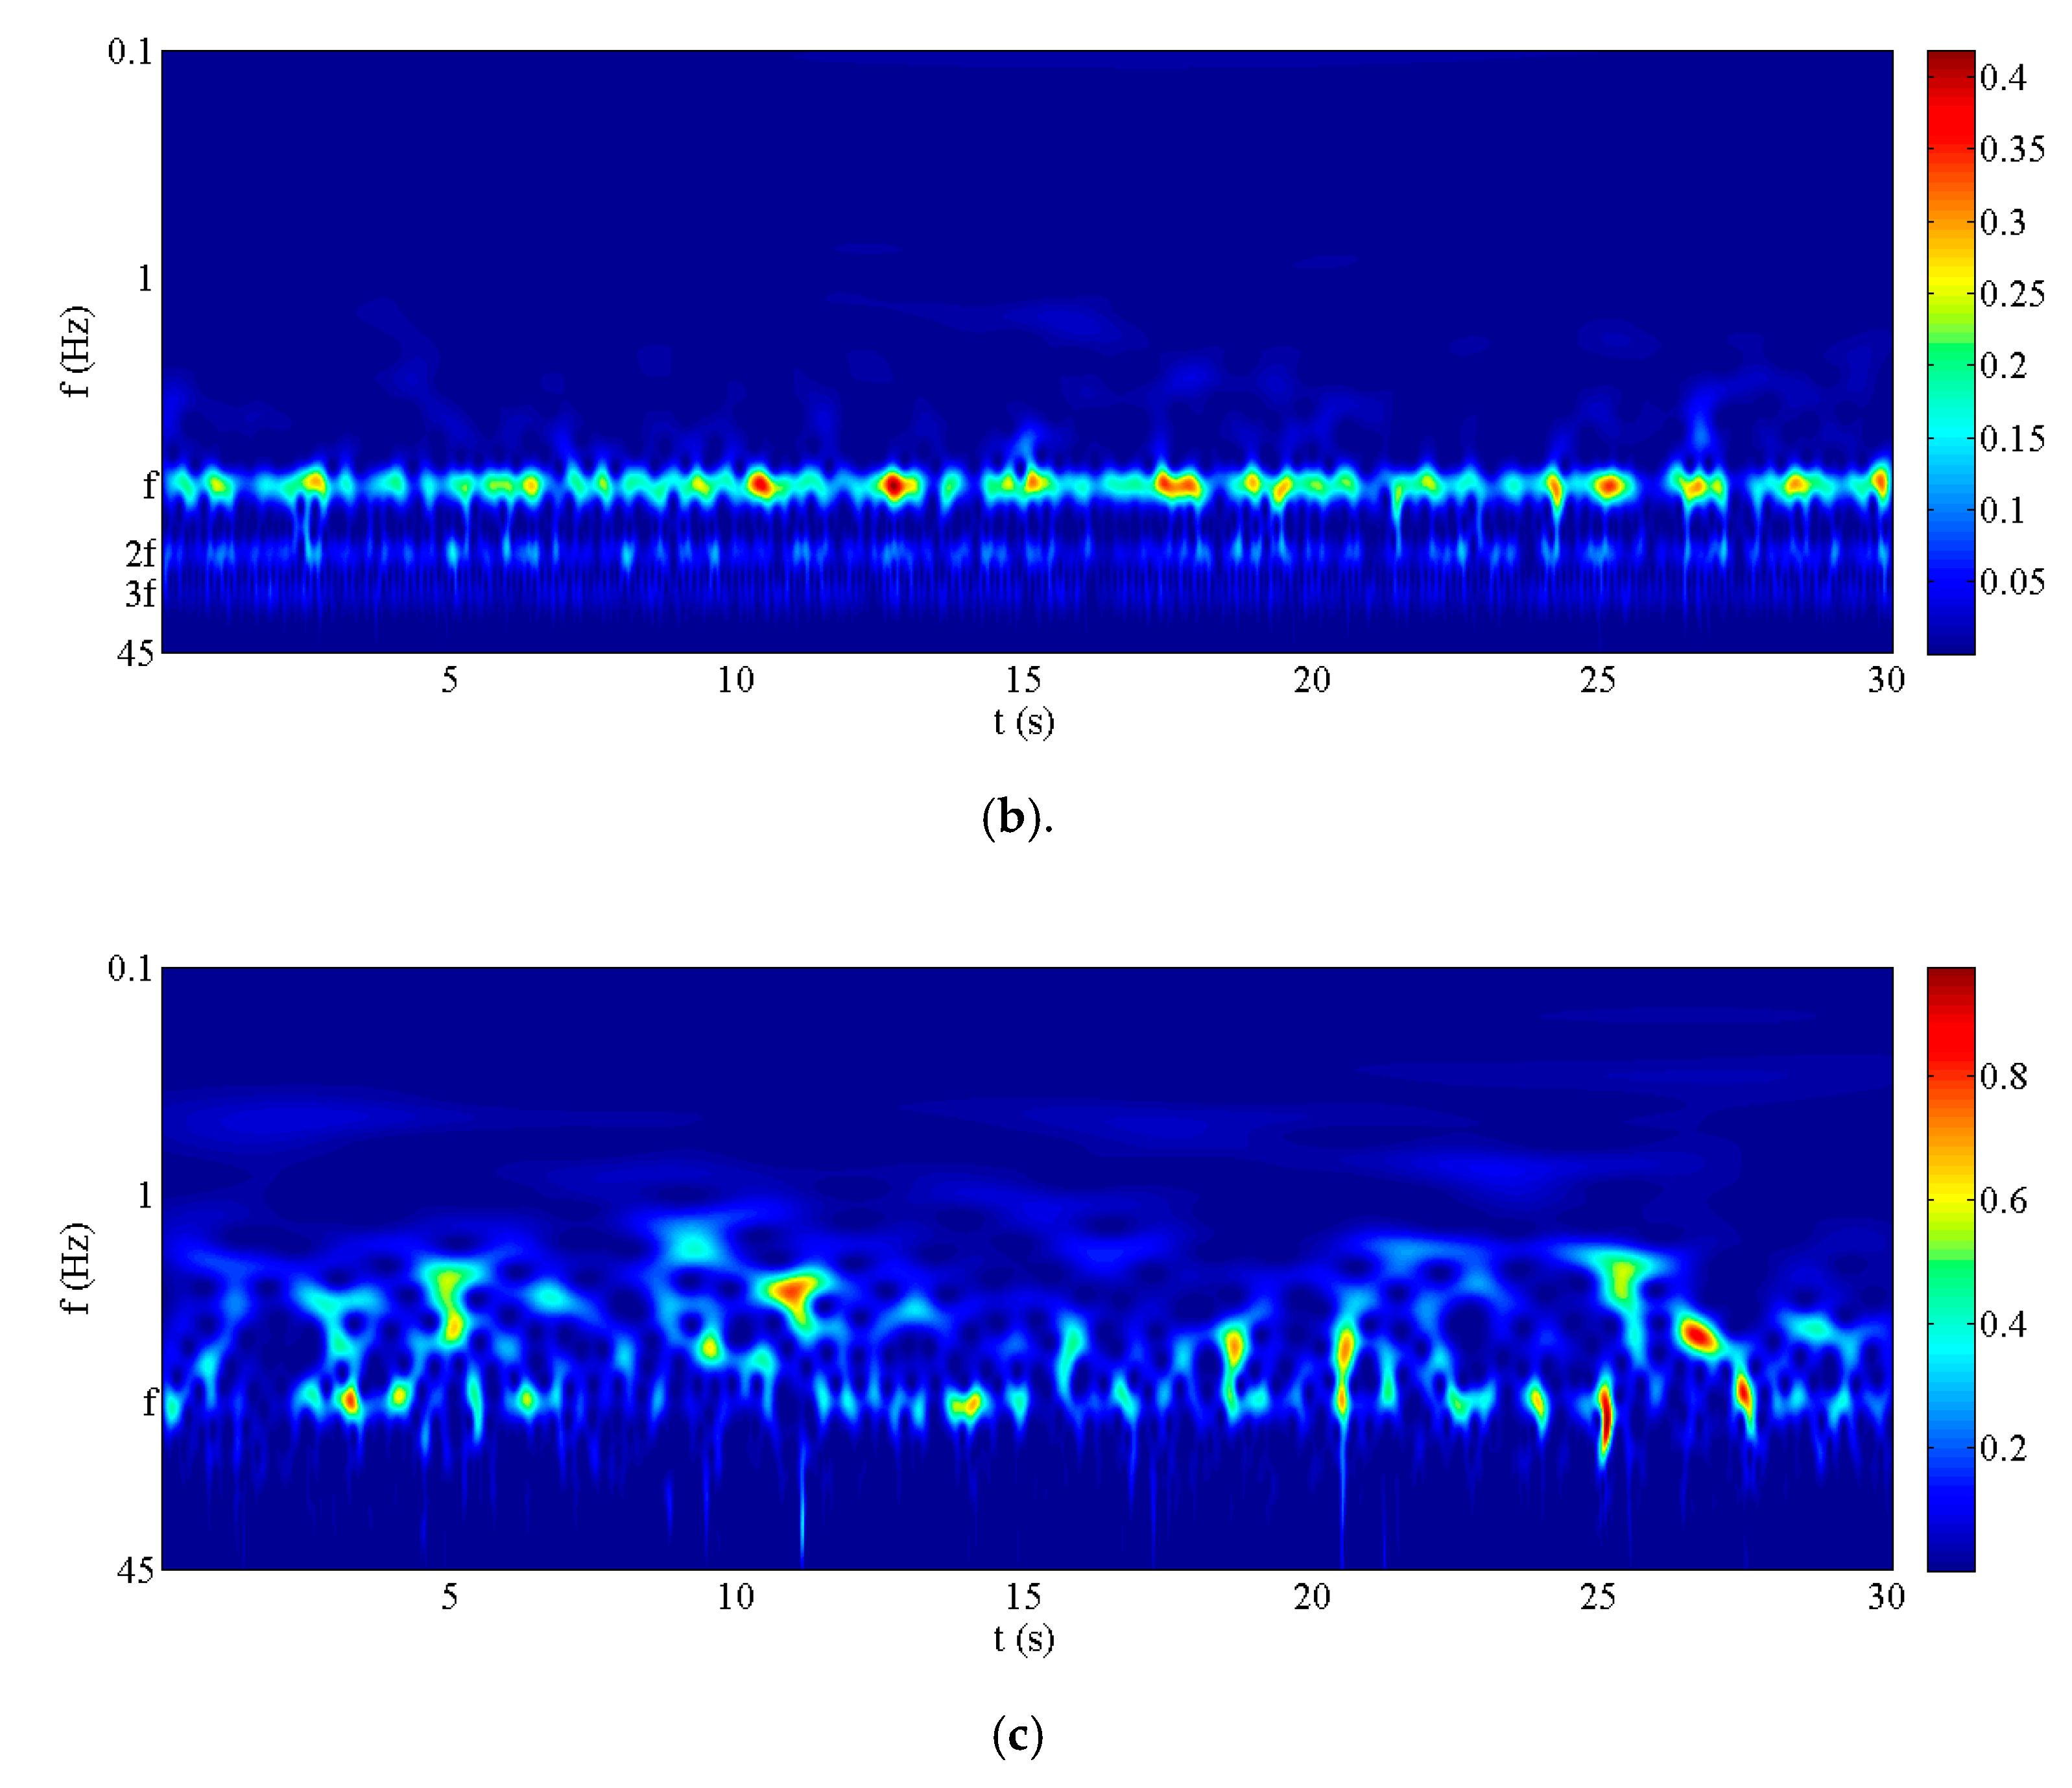
According to the wavelet spectrum of the wind turbine wake with configuration B in
Figure 7b,c, the high-frequency small-scale coherent structure induced by the wind turbine rotation is dominant in the near wake. At
P202 in the wake shear layer (
Figure 7b), the rotational dominant frequency
f and its harmonics can be observed. Moreover, the wavelet spectra reveal the intermittent character of the blade vortex shedding. This characteristics can not be reflected in the spectral analysis results in [
10]. A coherent structure covering a wide frequency range appears at
P501 (
Figure 7c). The low-frequency coherent structure includes a high-frequency coherent structure, which conforms to the energy cascade. The coherent structure at
P501 is the result of the evolution from the wake at 2
D downstream, and the interaction of the coherent structure becomes strengthened. At 5
D, an energy band with frequency
f induced by rotation can also be observed. Where
f is the rotor rotation frequency value.
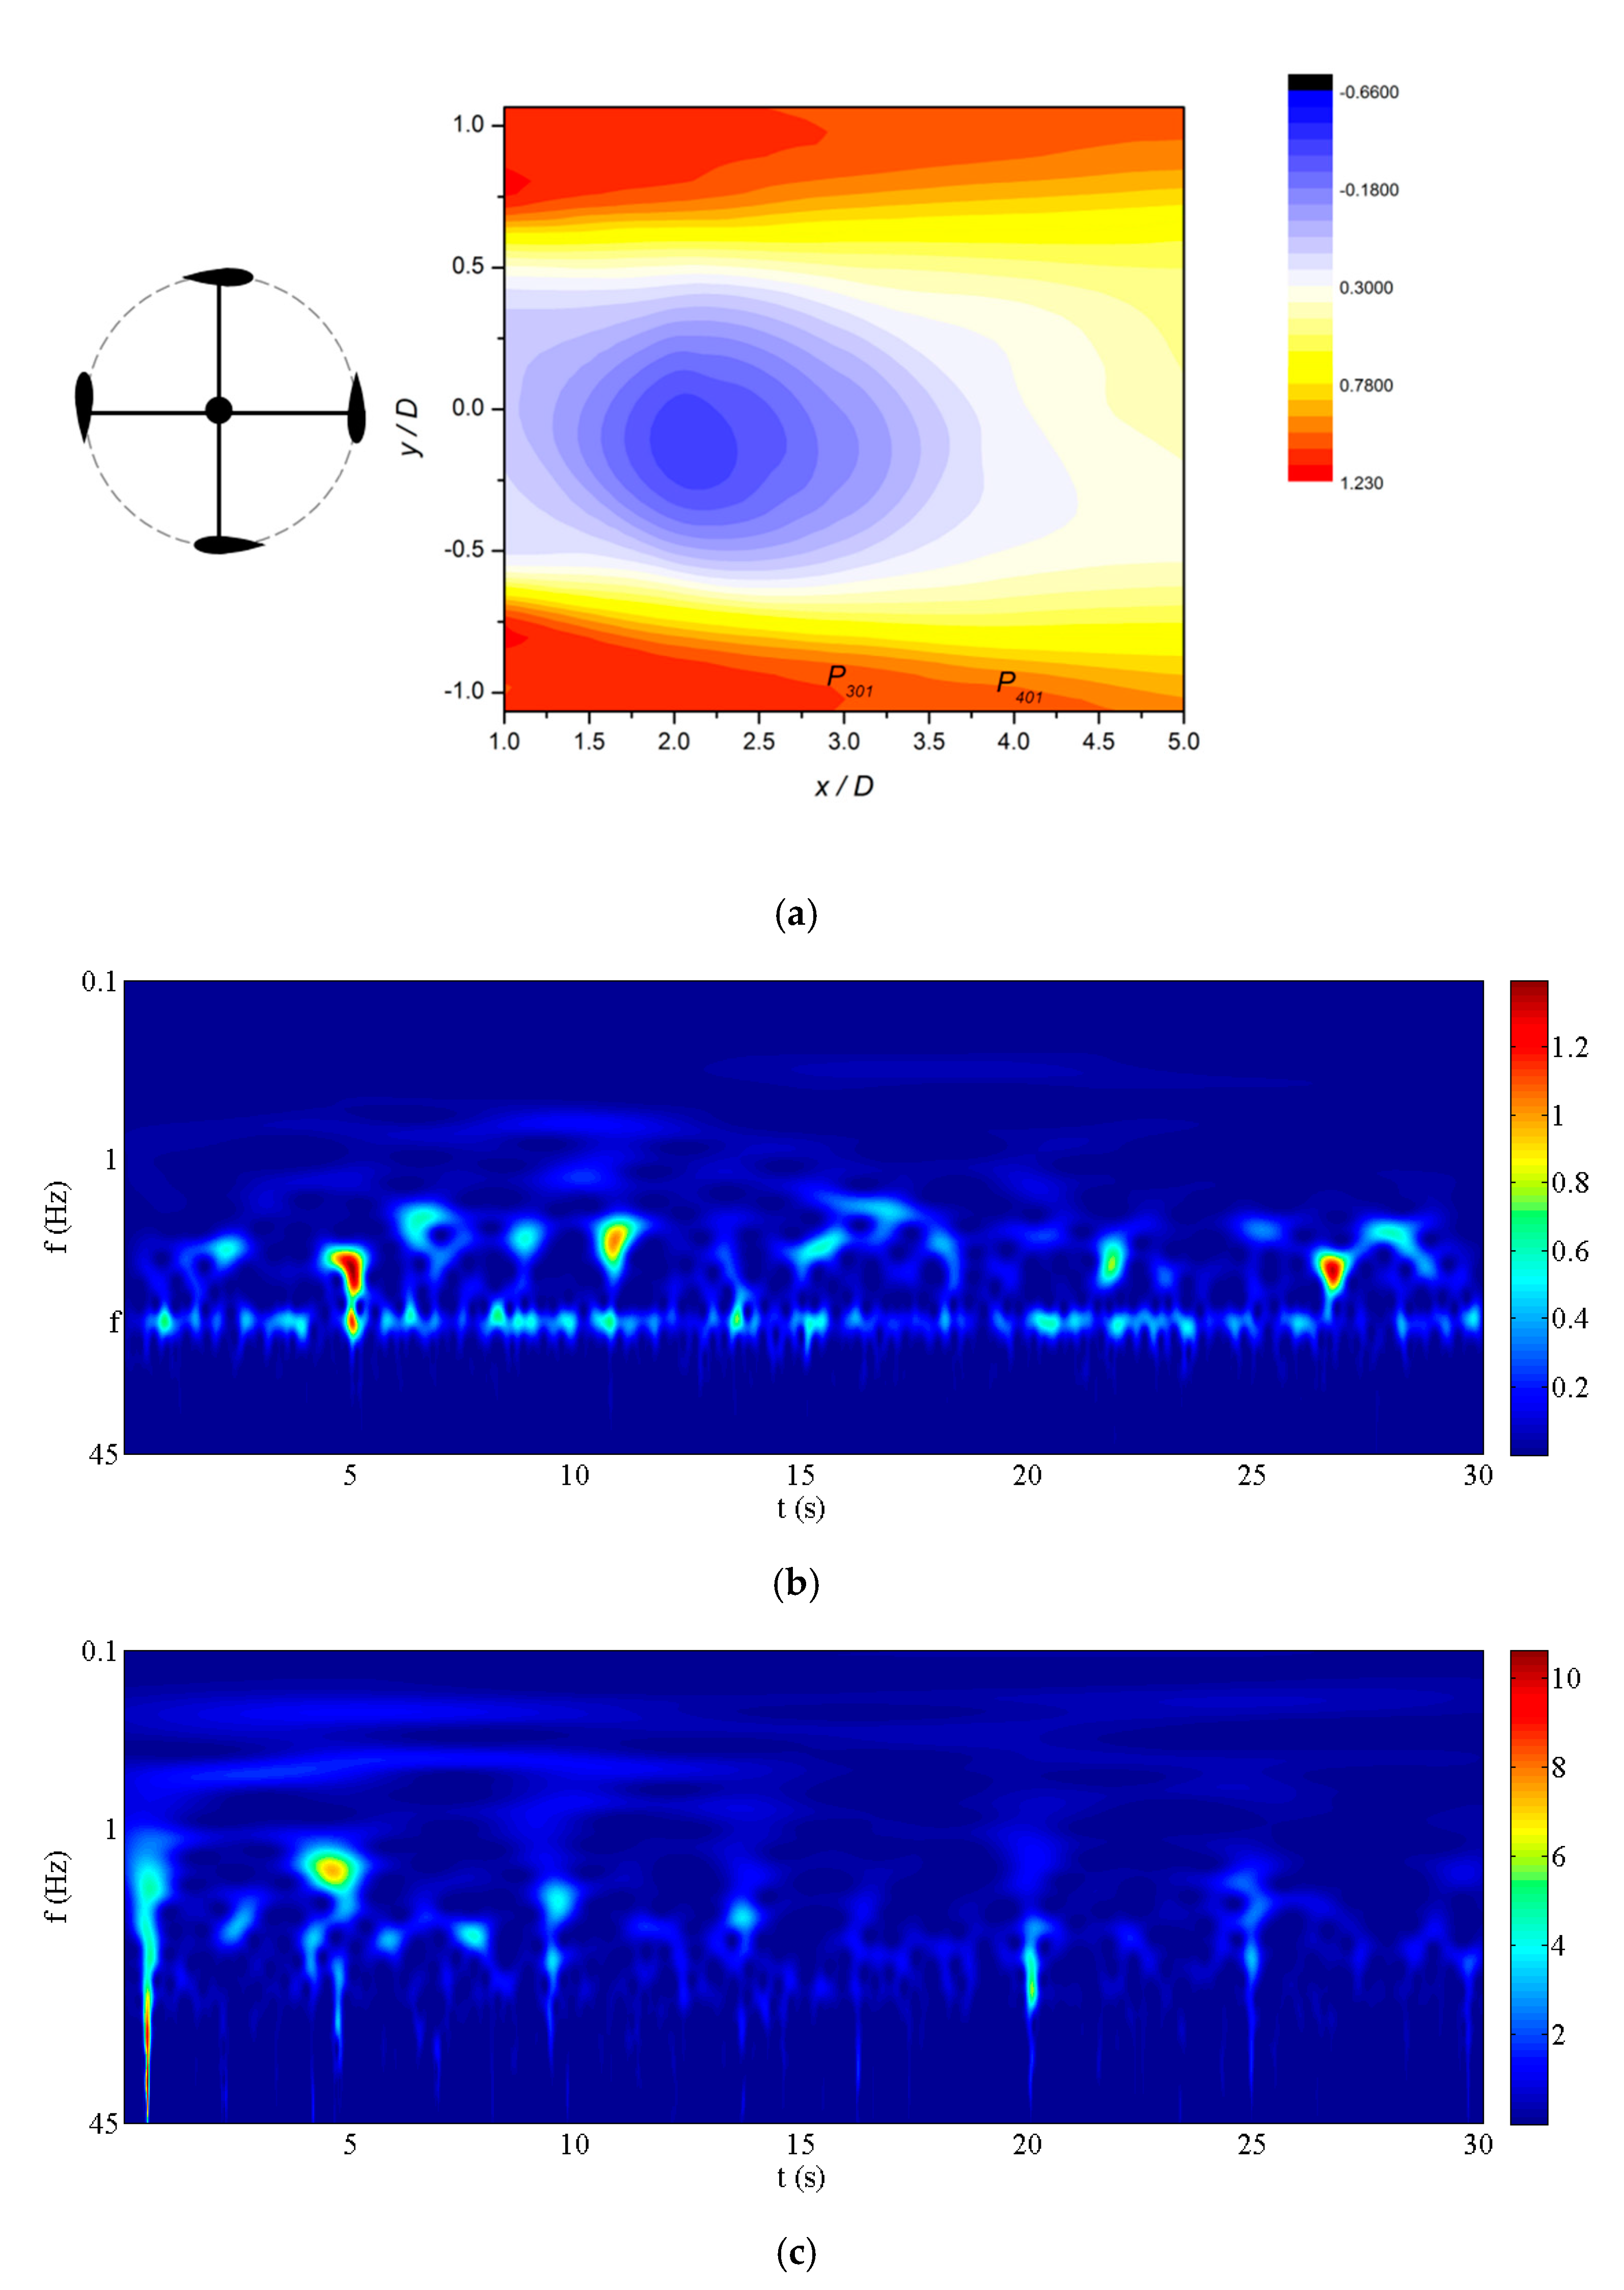
The wake of the wind turbine with configuration D contains a re-circulation region. During the development from
P301 (
Figure 8b) to
P401 (
Figure 8c) in the wake shear layer, the rotation induction effect becomes gradually weakened, and the coherent structure with dominant rotation frequency
f disappears gradually. Simultaneously, the coherent structure (over 1 Hz) becomes gradually dispersed, whereas the adjacent coherent structures remain relatively independent.
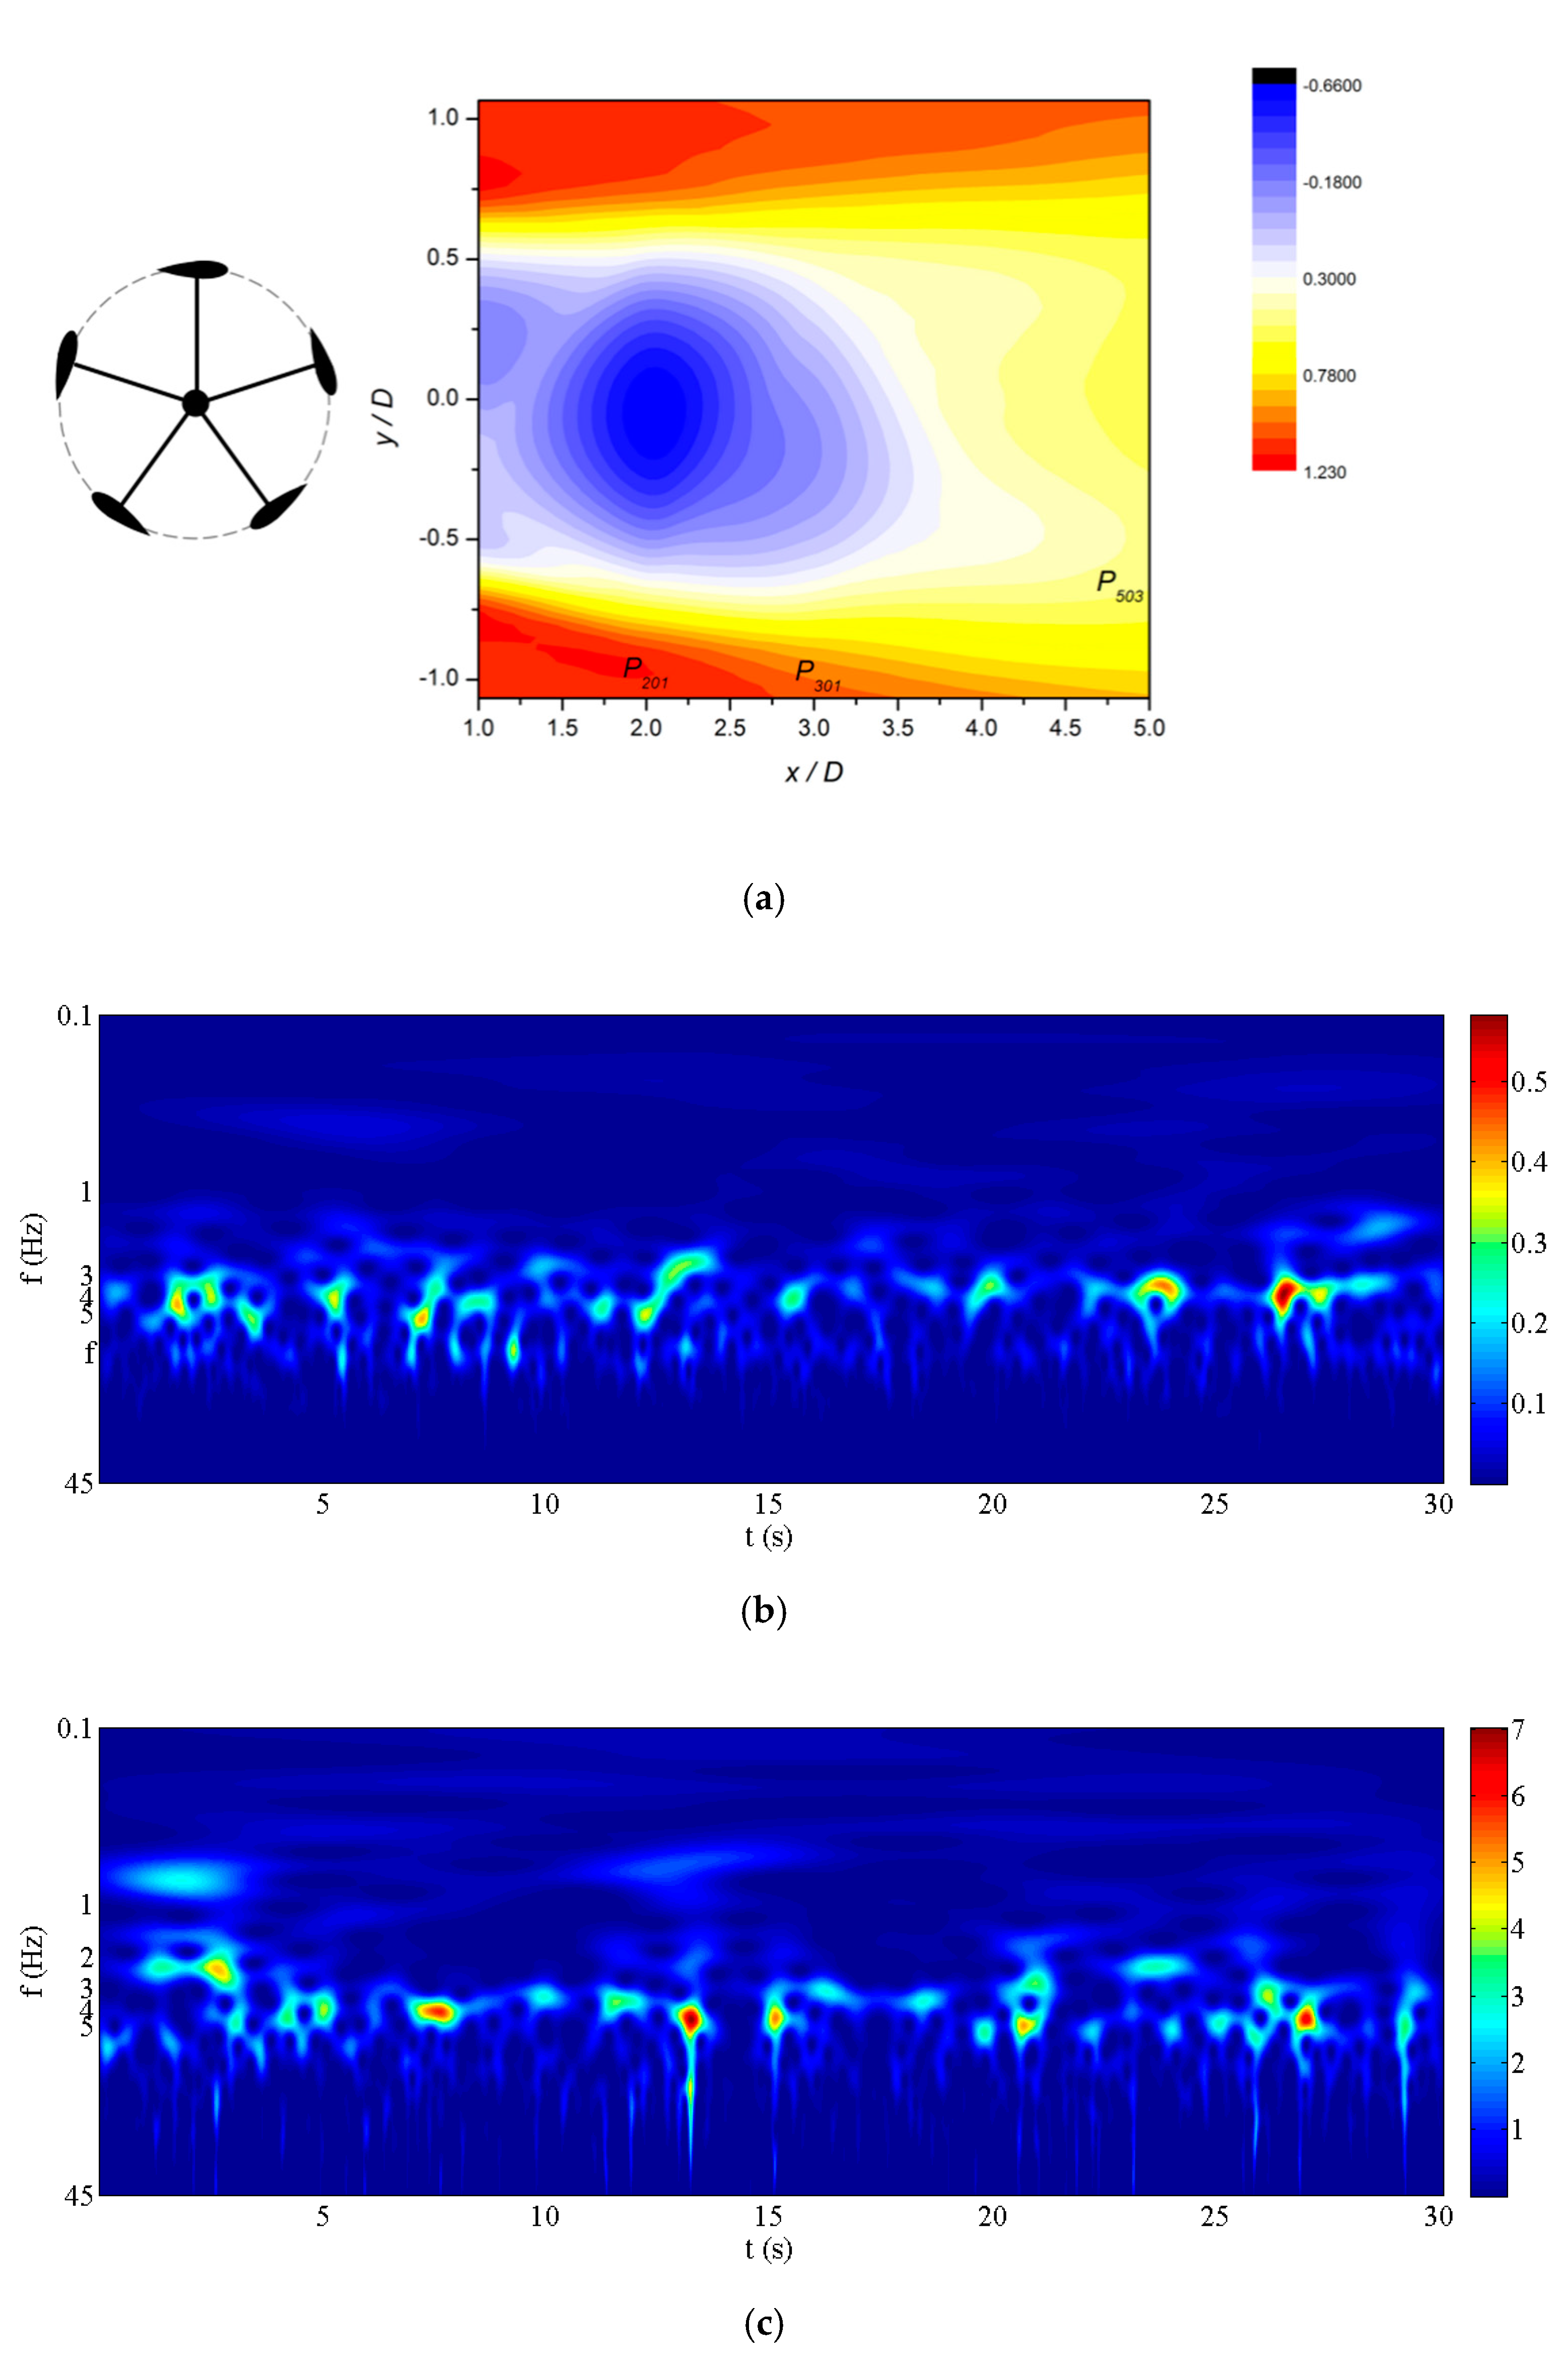
With increasing number of blades, the re-circulation region becomes larger and closer to the wind turbine. At
P201 (
Figure 9b), the energy is mainly between 3 and 8 Hz. However, the energy content and coherence of the high-frequency small-scale structures induced by rotation begin to decrease, and the rotation induction effect is weakened. The characteristic frequency decreases gradually. At
P301 (
Figure 9c), the energy is mainly between 3 and 5 Hz, and the self-organisation effect of the low-frequency large-scale structure increases gradually. At
P503 (
Figure 9d), the large-scale structure with a dominant frequency of 3 Hz shows better organisation and coherence. The large scale oscillations lead to the constant Strouhal number
St =
fsD/
U0 ≈ 0.23. This low-frequency large-scale vortex shedding behaviour is consistent with that presented in the flume experimental study in [
10]. Different from [
10], the vortex shedding frequency and intensity of wavelet spectrum change with time. The behaviour of the peak frequency with time can reveal more physical information about the flow [
27].
The previously presented evolution process shows that there are coherent vortex structures of different scales in the near wake. With increasing number of blades, the solidity increases gradually, and the high-frequency small-scale coherent structure induced by the rotation effect disappears gradually. Along the shear layer, the characteristic frequency decreases gradually. The shear layer structures finally fall off, thereby generating periodic large-scale vortex shedding. The wake of the VAWT presents the characteristics of a bluff body wake. In particular, with increasing solidity, the energy of the wake field is redistributed, and the low-frequency energy increases gradually; even a stable, strong low-frequency energy band can be observed (
Figure 9d).
3.4. The Influence of Operation State on the Wake of VAWT
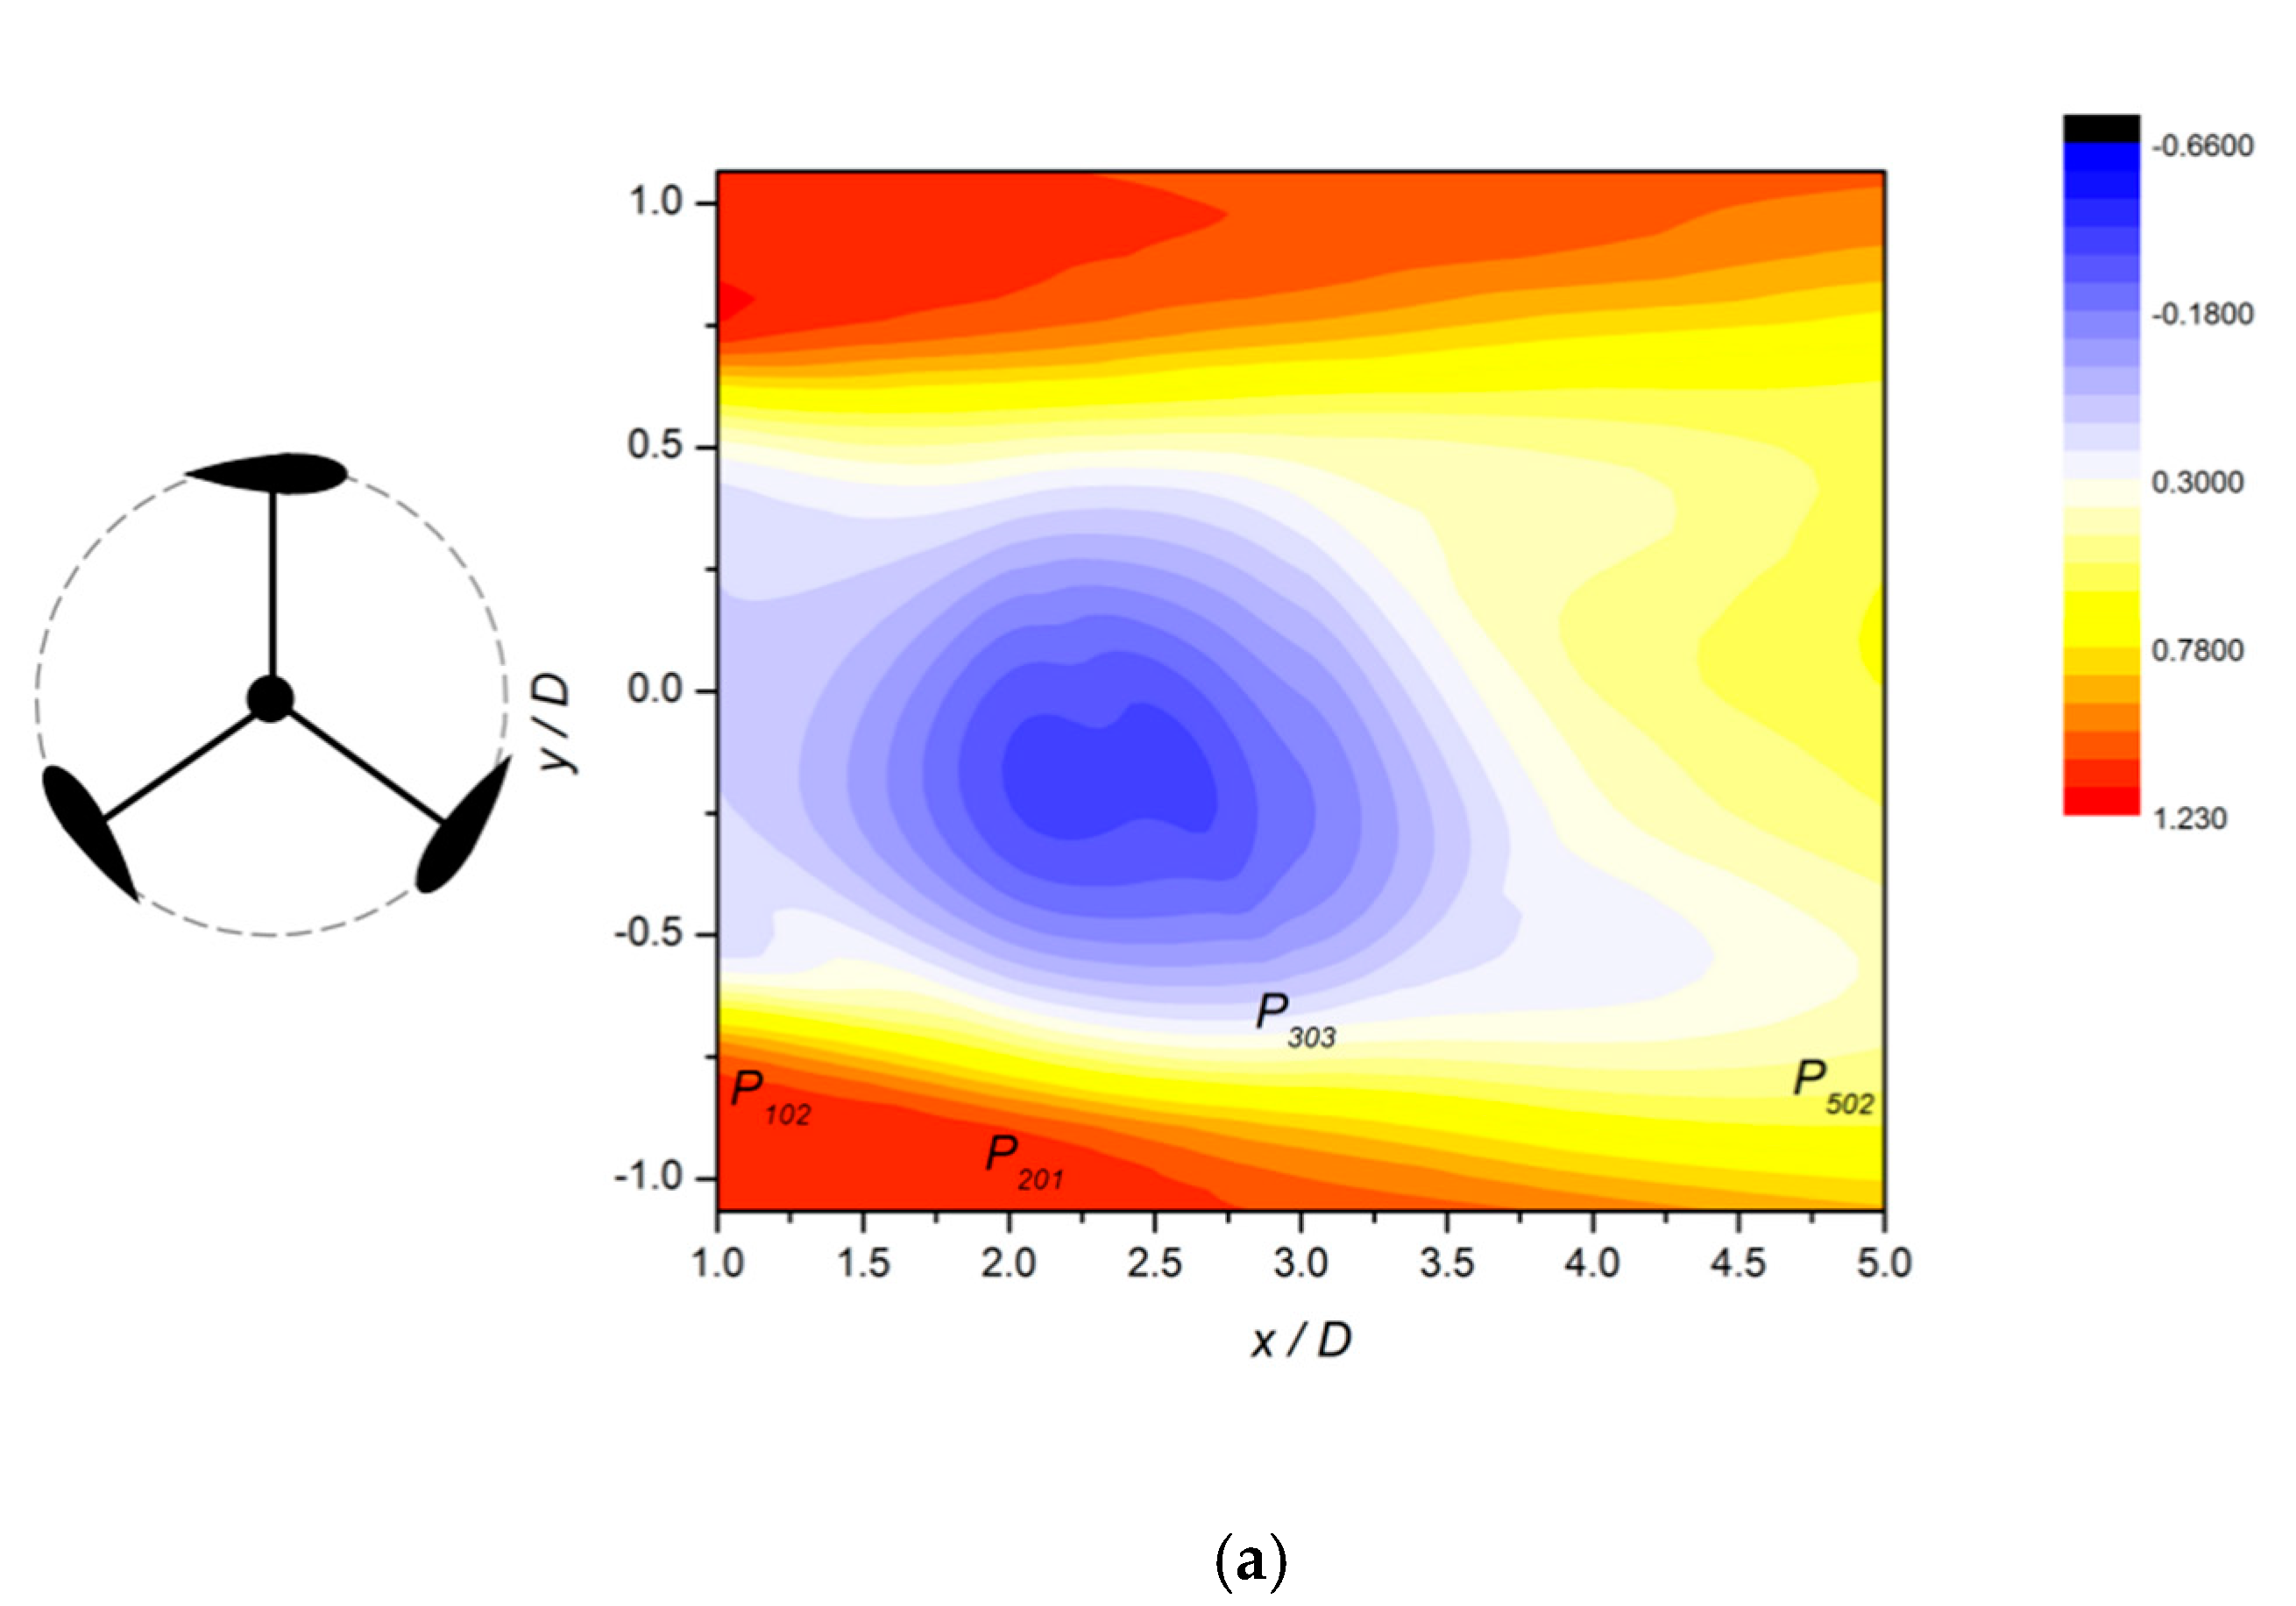
For configurations B, D and F, the wake of the VAWT develops gradually into a bluff body wake mode with increasing solidity. Subsequently, three groups of comparative tests were considered for the configurations C, D and E with equal solidity, and the bluff body wake of the VAWT was discussed by considering the operation states of the wind turbines.
At
P401 of the turbine wake with configuration E (
Figure 10b), no evident dominant frequency energy band can be observed. Thus, the wind turbine wake with configuration E does not transform into a bluff body wake mode.
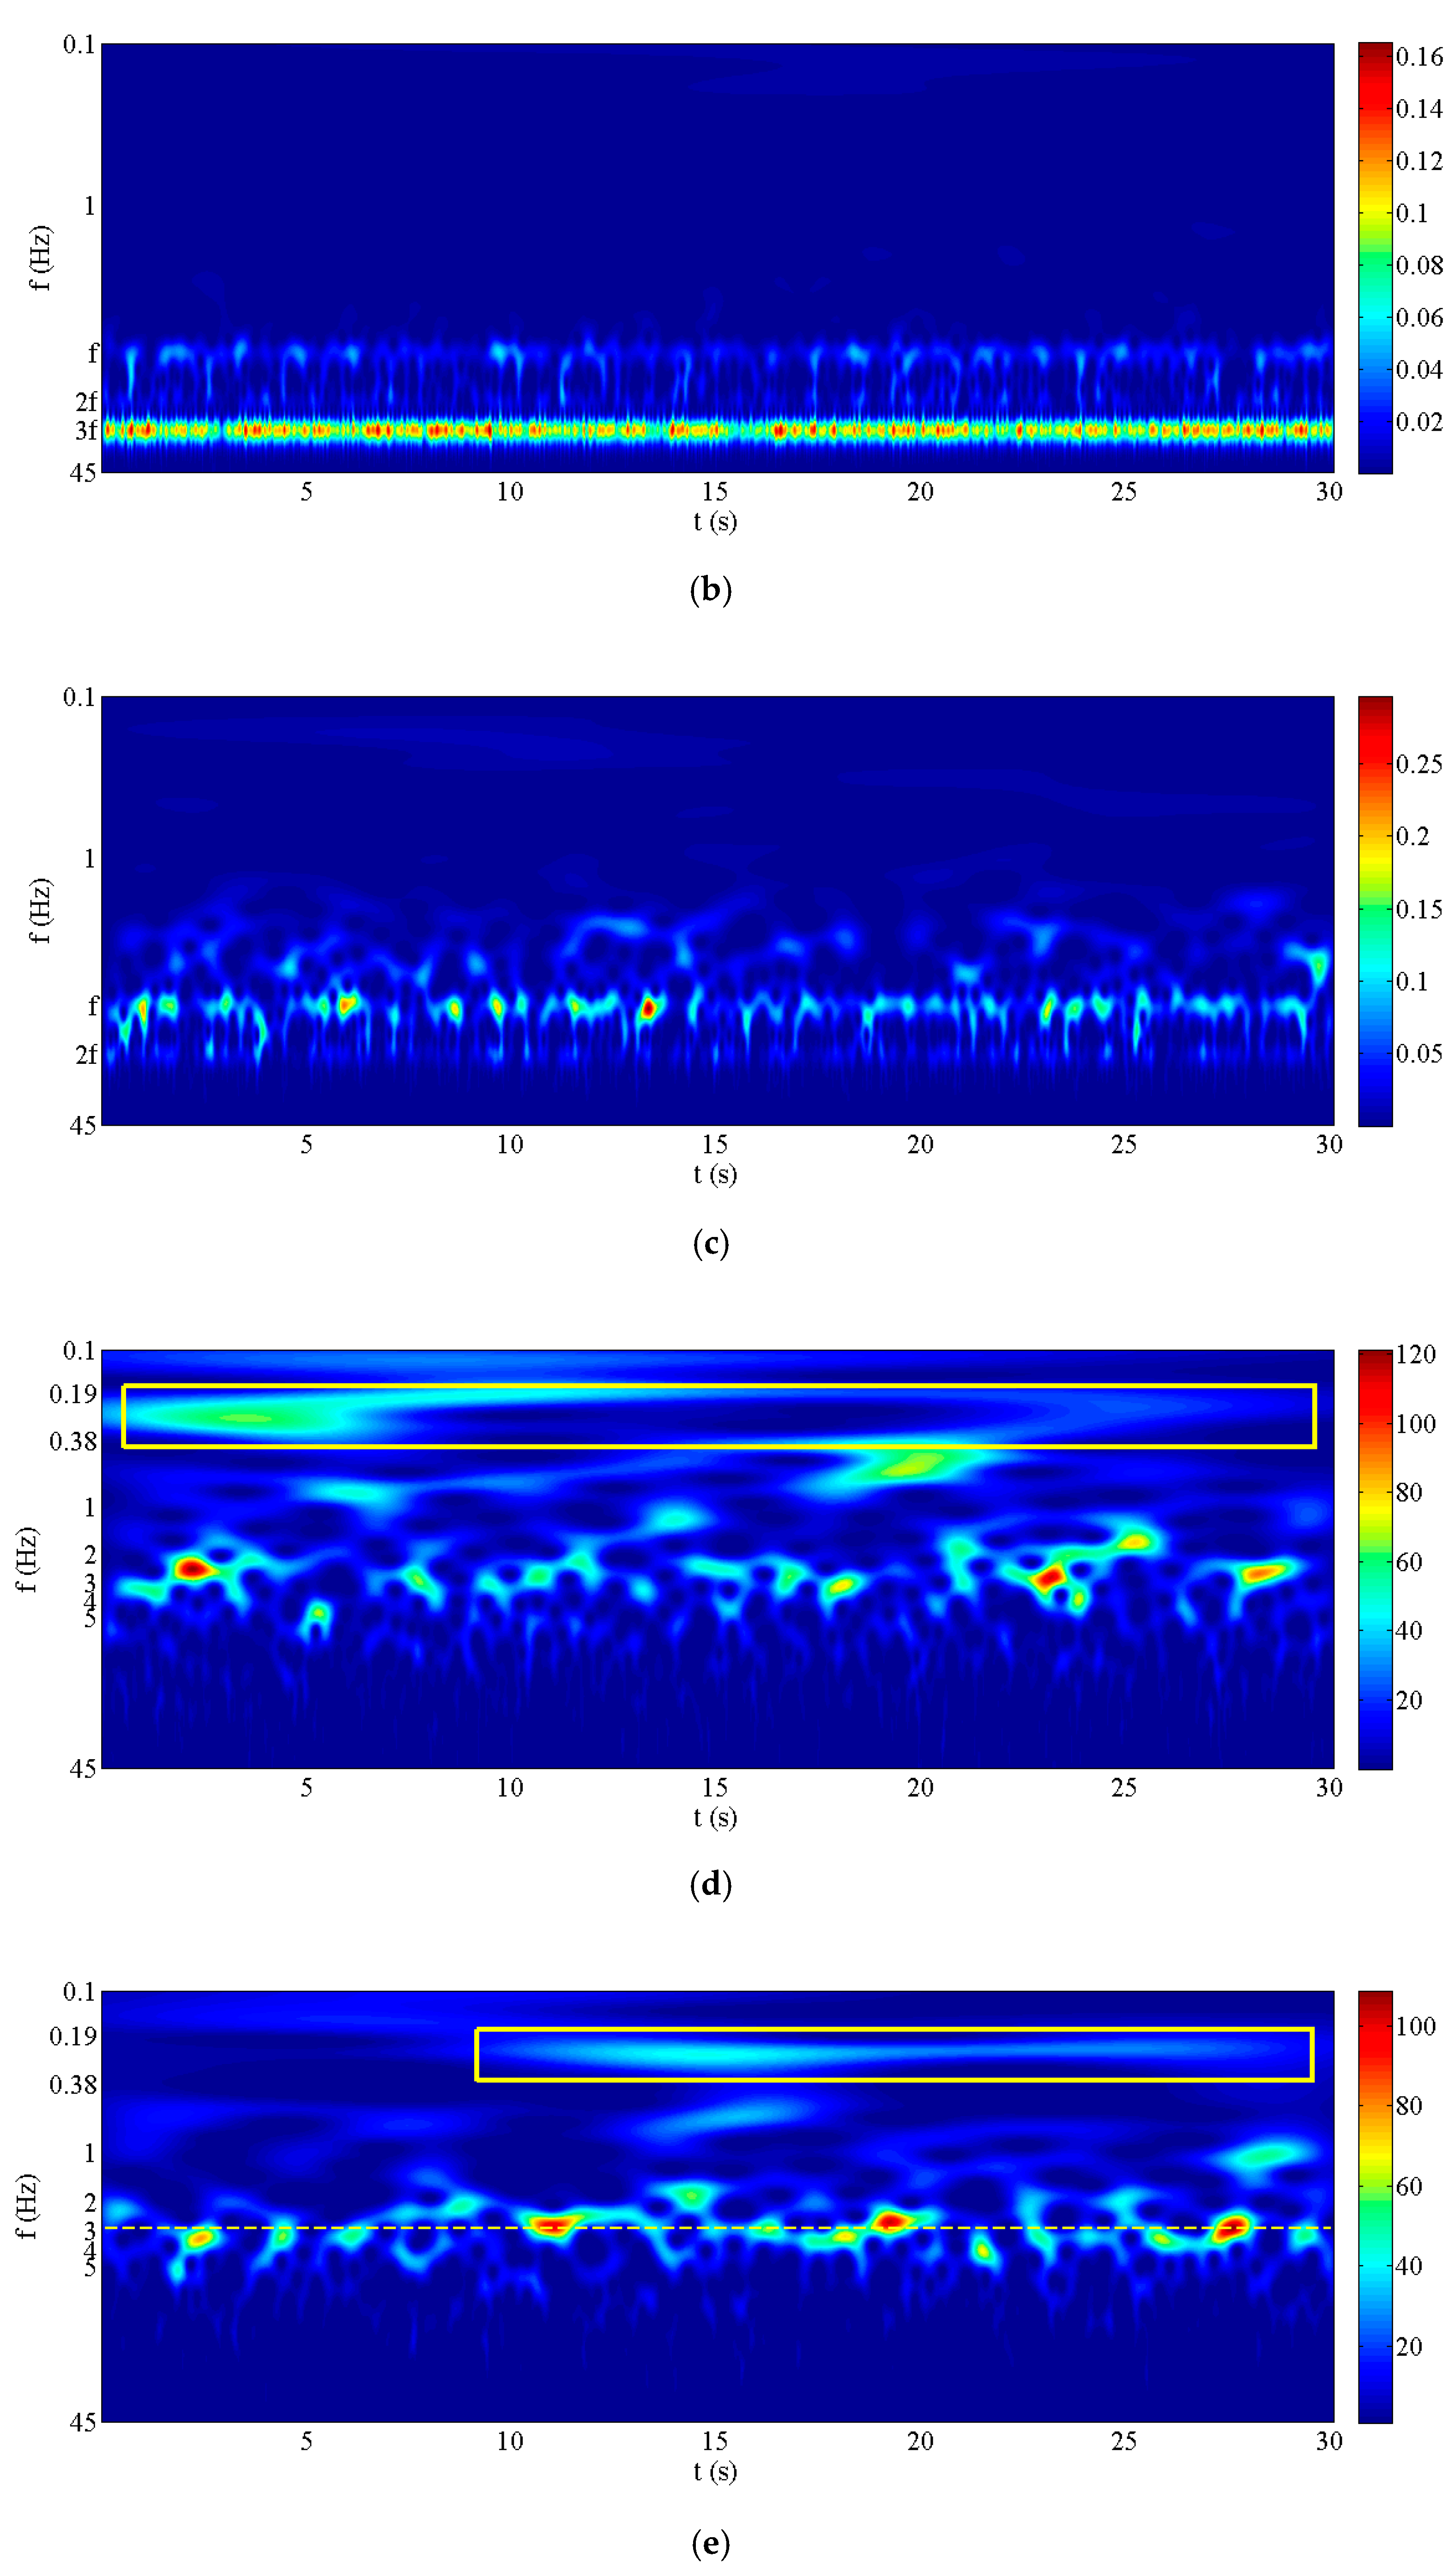
For configuration C, as shown in
Figure 11b,c, the high-frequency coherent structure induced by the wind turbine rotation is dominant, and the energy is relatively low owing to the high velocity attenuation and less infiltration of the external flow field. The wake shear layer between the re-circulation region and free stream forms large-scale strong entrainment structures, which can be seen at
P303 (
Figure 11d). At
P502 (
Figure 11e), the organisation and coherence of the large-scale structure with a dominant frequency of 3 Hz becomes gradually enhanced, and the wake of the wind turbine exhibits the bluff body wake characteristics of low-frequency large-scale vortex shedding. Simultaneously, with the generation of large-scale coherent structures, low-frequency strong energy bands (
Figure 11d,e) appear with frequencies between 0.19 and 0.38 Hz.
Configurations C, D and E have the same solidity; however, they exhibit different wake modes at the same tip speed ratio. Only configuration C develops into a bluff body wake mode. Thus, the bluff body wake mode is related to the operation state of the wind turbine itself. As previously mentioned, when
λ is 2.036, the wind turbines in
Figure 3c are in different operation states. Configuration C is in the turbulent wake state, configuration D is in the design state and configuration E is in the stall state. In the design and stall states, the blade vortex shedding is relatively stable. While configuration C is in a fully developed turbulent wake state, the high-frequency blade vortex shedding induced by the rotation loses its coherence and dissipates rapidly, which results in strong shear. The strong entrainment structure of the wake shear layer and the coherent vortex structure in the re-circulation region finally form periodic large-scale vortex shedding. The wake of the wind turbine presents the characteristics of a bluff body wake. Therefore, the wind turbine in the turbulent wake state is more likely to develop into a bluff body wake mode with large-scale vortex shedding. The configuration F, which is in the turbulent wake state, also exhibits the bluff body wake mode.
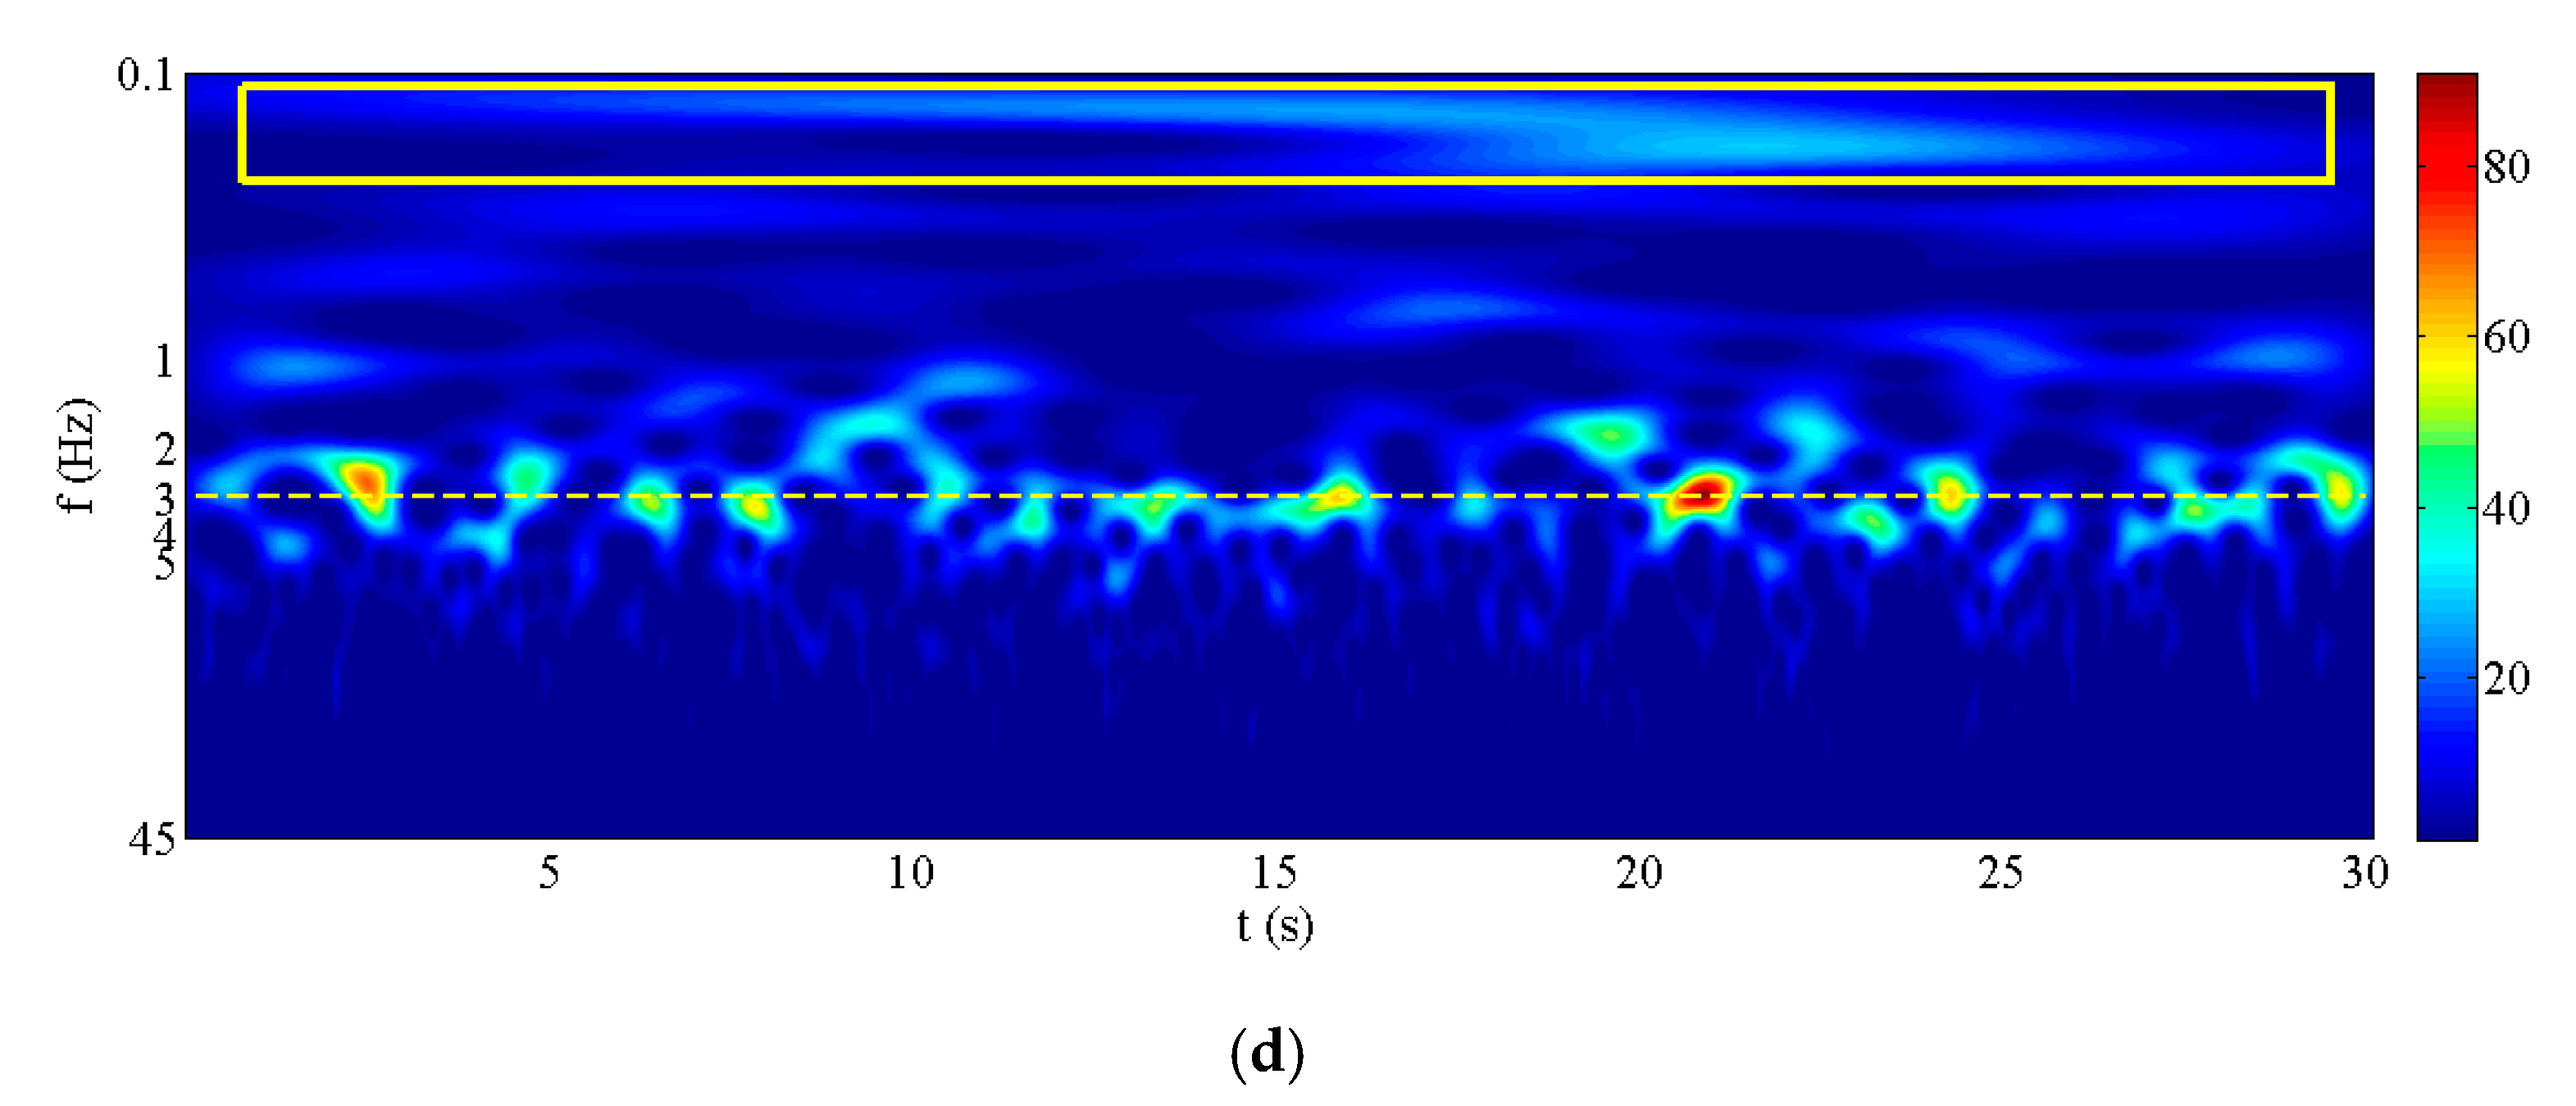
3.5. Double Low-frequency Instability Mode of Bluff Body Wake of VAWT
When the VAWT wake develops into a bluff body wake, there are two low-frequency instability modes: low-frequency large-scale vortex shedding and low-frequency instability with a lower characteristic frequency (
Figure 9d and
Figure 11d,e).
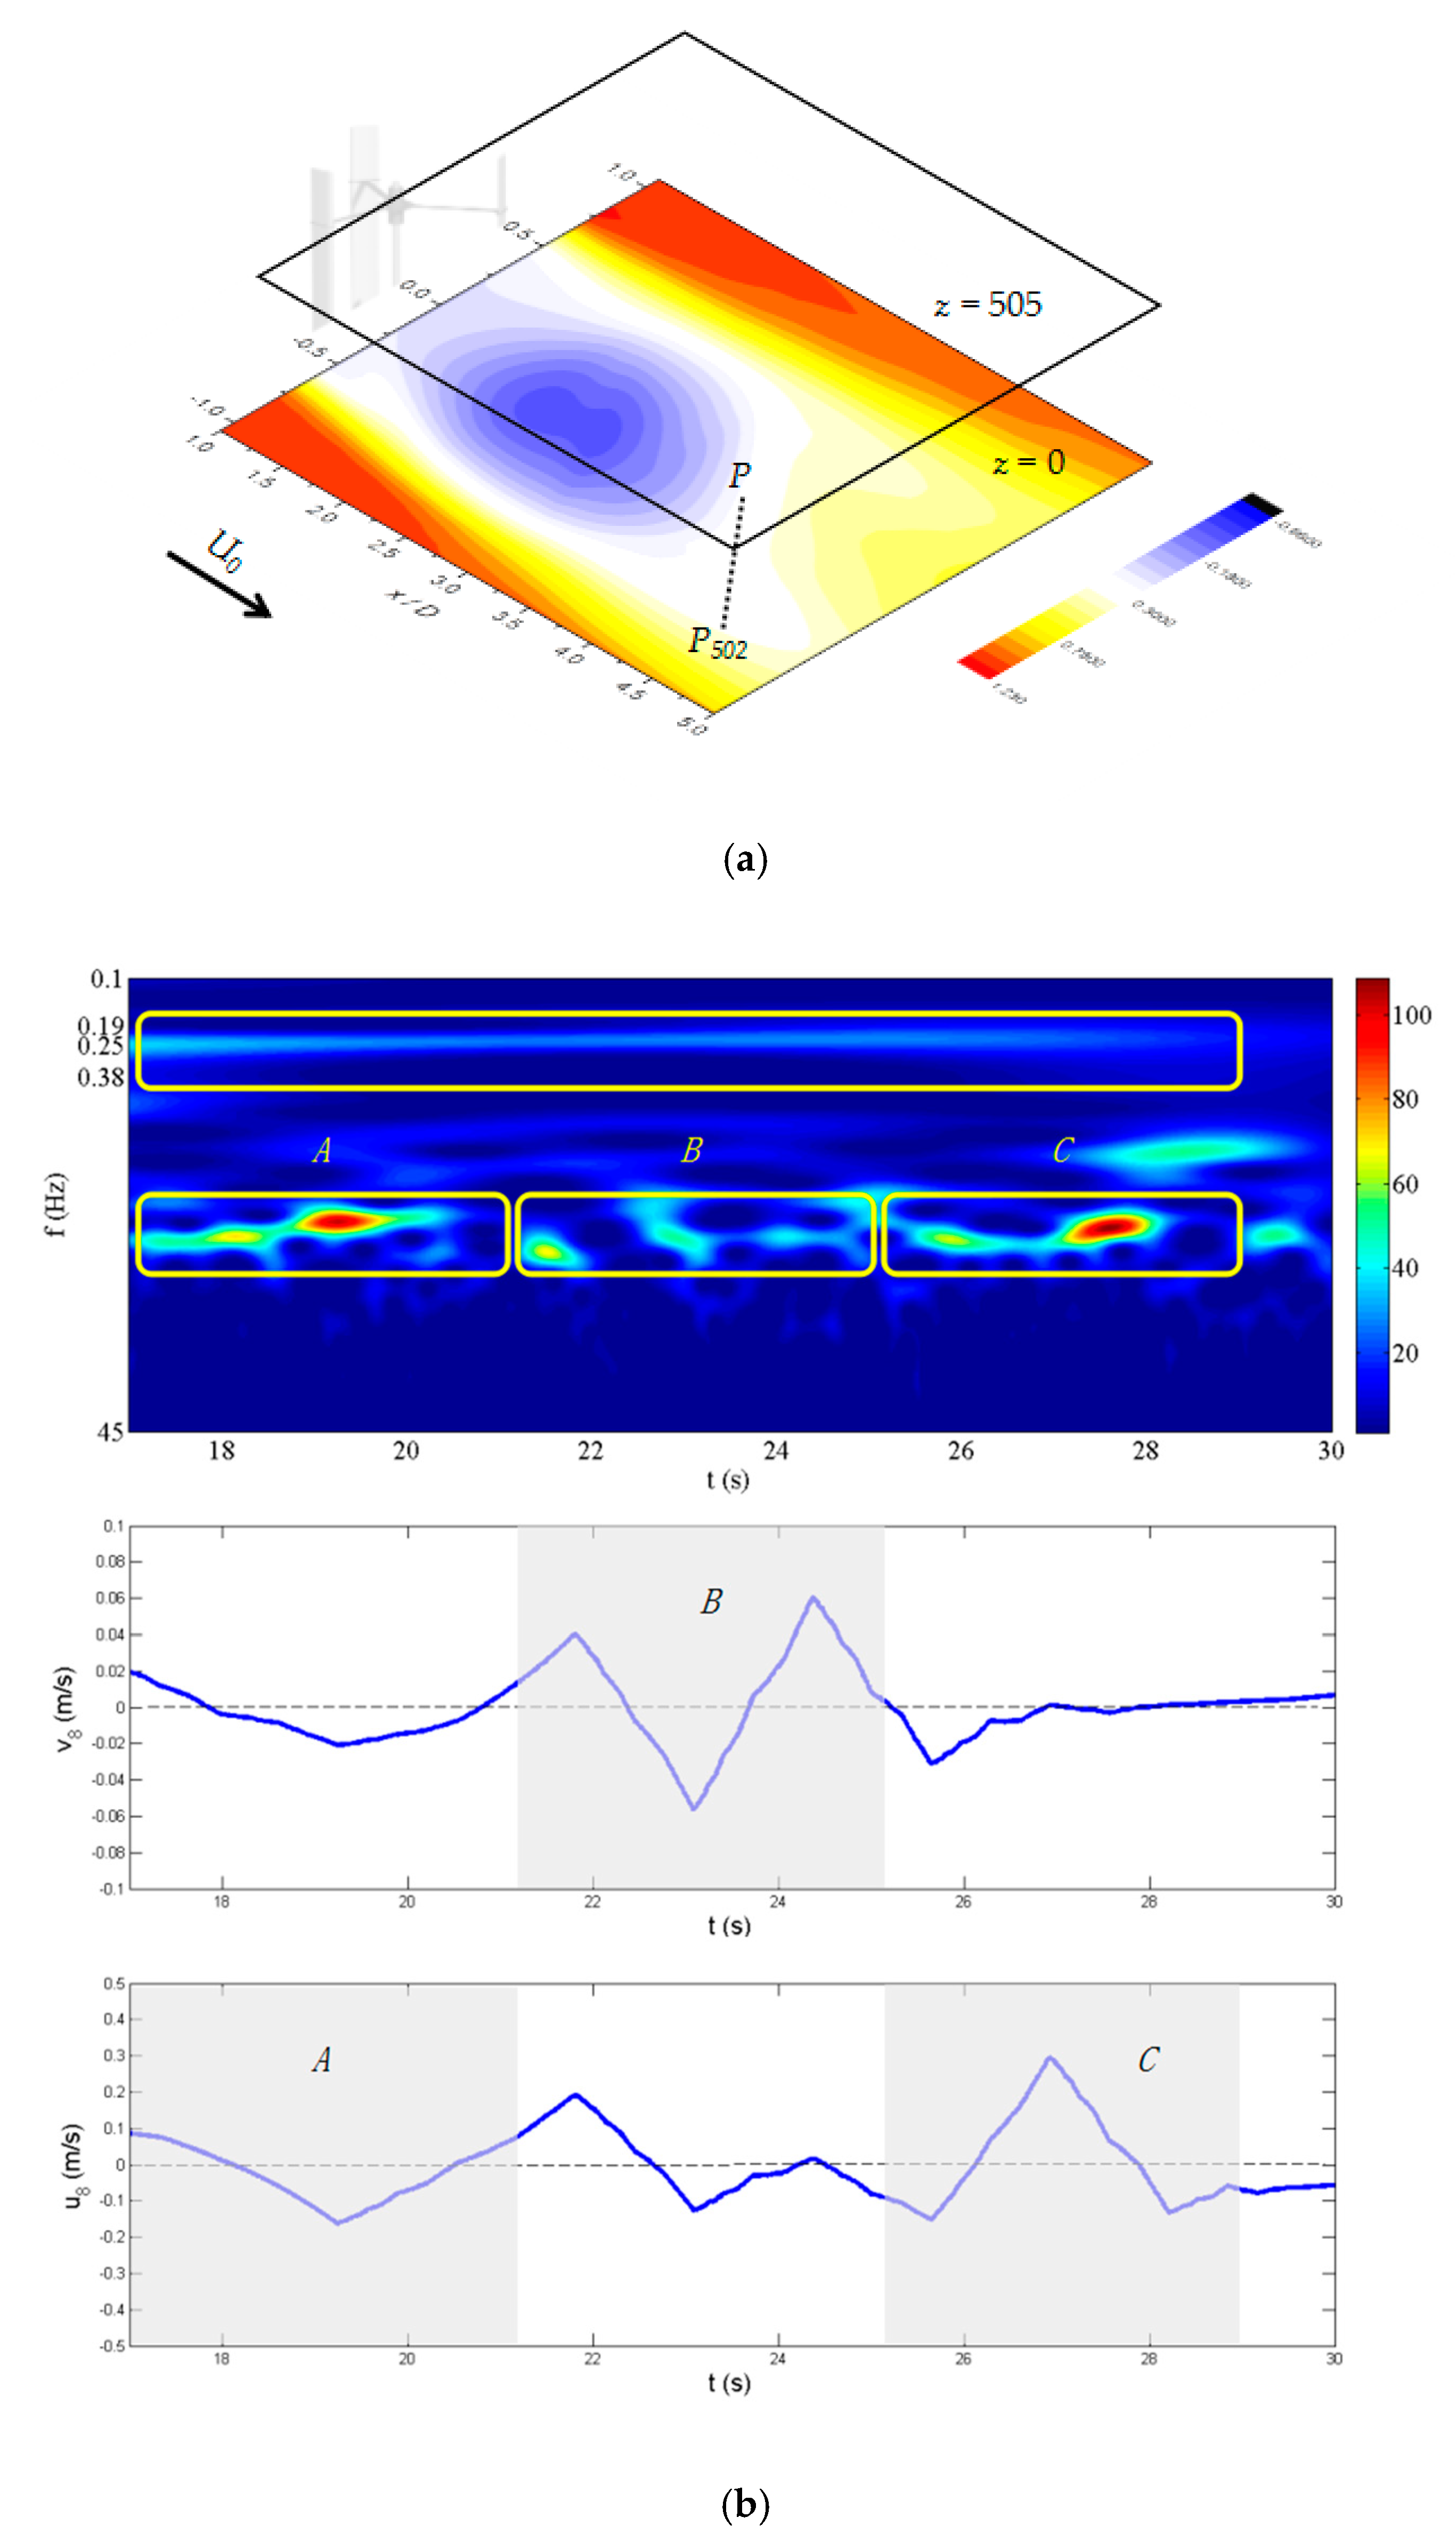
In this study, the db3 wavelet (where db refers to a particular family of wavelets and number 3 refers to the number of vanishing moments) was used to decompose and reconstruct the time series signal in the eight layers, and the signal components in different frequency ranges were obtained. The frequency range of the first layer high-frequency component (
d1) is between 24.2 and 48.4 Hz, and the frequency range of the first layer low-frequency component (
a1) is between 0 and 24.2 Hz. The frequency range of the eighth layer high-frequency component (
d8) is between 0.189 and 0.378 Hz. The top image in
Figure 12b presents the part of
Figure 10e. The period 17–30 s was chosen because the low-frequency energy band is more stable in this period.
Since previous literature showed that this low-frequency instability behaviour occurred during the evolution process from the near wake to the complete three-dimensional flow, we selected two different vertical positions in the formation region of the large-scale structure.
In the wavelet spectrum of the time series signal of the streamwise fluctuating velocity at
P502 (
Figure 12b: top), the low-frequency strong-energy band is between 0.19 and 0.38 Hz. The
P-point located at different vertical positions of the wake shear layer in the three-dimensional wake also captures the unsteady spanwise and streamwise pulsation between 0.19 and 0.38 Hz (
Figure 12b: centre and bottom).
As shown in the top of
Figure 12b, the large-scale structures exhibit strong coherence in the streamwise direction at 17–21 s in the
A-period and at 25–29 s in the
C-period. At the same time, the wake shear layer experiences evident streamwise pulsation (
Figure 12b: bottom).
The large-scale structures show weak coherence in the streamwise direction at 21–25 s in the
B-period (
Figure 12b: top). However, in the
B-period, the wake shear layer experiences evident spanwise pulsation (
Figure 12b: centre).
There are two distinct situations in the formation region of the large-scale structure, one exhibits strong coherence in the streamwise direction with evident streamwise pulsation; and the other exhibits weak coherence in the streamwise direction with evident spanwise pulsation. The transition period of these two situations is approximately 4 s, and the corresponding frequency is 0.25 Hz (between 0.19 and 0.38 Hz in the low-frequency energy band). Therefore, the low-frequency instability was attributed to the unsteady pulsation of the formation region of the large-scale structure.
In addition, the wavelet spectrum corresponds to the frequency band of coherent structures and low-frequency instability, and its spectral intensity and frequency change with time. The change with respect to time can reveal more physical characteristics of the flow. In addition, it indicates that the wavelet analysis is more representative than the traditional Fourier analysis in certain aspects.
4. Conclusions
In this study, wind tunnel experiments were conducted to explore the effect of solidity on near wake instability of vertical-axis wind turbine. In the near wake region, the high-frequency small-scale coherent structure induced by the rotation effect is dominant. With increasing solidity, the rotation induction effect increases gradually. With further increasing solidity, the re-circulation region appears, the rotation induction effect is weakened and the energy in the wake is redistributed. The high-frequency small-scale structure loses gradually coherence, and the low-frequency energy is gradually strengthened. Moreover, the high-frequency blade vortex shedding under turbulent wake loses its coherence and dissipates rapidly, which leads to the appearance of strong wake shear layer structures. The strong entrainment structure of the wake shear layer and coherent vortex structure near the re-circulation region finally fall off, which leads to periodic large-scale vortex shedding. Consequently, the VAWT wake presents a bluff body wake mode; that is, low-frequency large-scale periodic vortex shedding dominates the wake development. During the evolution process from the near wake to the complete three-dimensional flow, another low-frequency instability occurs along with the low-frequency large-scale vortex shedding. This low-frequency instability is attributed to the unsteady pulsation of the formation region of the large-scale structure.


