Abstract
We present findings from a geotechnical survey for a gravity-based Wave Energy Converter (WEC) to be installed in King Island, Tasmania. The goal of this work was to assess the deployment location for a 200 kW Oscillating Water Column (OWC) and to identify possible challenges for the foundation of the structure to make it Australia’s first operational offshore OWC for a remote offshore island. The proposed location for this OWC is the southeast coast of King Island, Tasmania, approximately in a depth of ~5.5 m LAT. The survey included sub-bottom profiling, sediment cores, surficial sediment strength by penetrometer drops, seabed imagery, as well as long-term deployment (>6 months) of pressure sondes and an acoustic wave current profiler (AWAC). Our findings demonstrate that the WEC can be installed in the proposed location with significant wave height Hs ~1–1.5 m and peak period Tp of 12–14 s, and that the site exhibits sufficient sand coverage and quasisteady bearing capacity. The period between the survey and prospective deployment is only one year, demonstrating the efficiency of the survey methods (in particular, the use of the penetrometer) and OWC design but also the suitability of the candidate site for this device design.
1. Introduction
1.1. Challenges for OWC Site Assessments
Australia has a considerable amount of wave energy that has been estimated to be about 1300 TWh/year [1], which is almost six times the country’s electricity consumption of 220 TWh in year 2015 [2]. Different techniques for wave energy conversion are classified by deployment location (e.g., shoreline, nearshore and offshore), type (point absorber, attenuator) and mode of operation (e.g., oscillating wave surge converter, oscillating water column and overtopping device) [3]. OWCs are relatively simple in design and principle of operation [4], and prototypes have been developed by a variety of companies, including Mighty Whale (Japan), Oceanlinx Mk3 (Australia) and OE Buoy (Ireland) [5]. However, despite their technological advancement, Oscillating Water Column (OWC) devices have not reached a fully commercial stage [6].
Device design, installation, operation and maintenance in offshore environments pose a challenge for developers of Wave Energy Converters (WECs) [7]. Especially at early stages of a site development in remote offshore locations, many aspects with respect to the geotechnical suitability of the site need to be considered [8]. Challenges in offshore locations include seabed and sediment transport characteristics, seabed–structure interaction, as well as the design of foundation and anchor systems that require assessment during the initial stage. However, this is often difficult due to high costs related to surveys in marine environments, budget constrictions and lack of best engineering practices for offshore seabed surveys. Thus, new information related to cost-efficient methods is significant as it helps developing and adopting standard procedures which in turn advances WEC techniques to commercial scale in offshore environments.
Wave Swell Energy Ltd. is a company based in Australia which was recently funded by the Australian Renewable Energy Agency (ARENA) to develop an advanced concept of an OWC [9]. Their design demonstrated very positive test results with respect to wave-to-wire efficiency, increasing the cost-competitiveness of this OWC type [10]. A demonstration type, “WSE Uniwave 200,” is currently being constructed in Launceston, Tasmania, with a prospective trial installation scheduled within the first half of 2020, likely making it the first ever installed offshore island OWC in Australia. The candidate site for this device is located on King Island’s southeast coast, exhibiting a mild wave climate with significant wave height Hs = 1–1.5 m and peak period Tp = 12–14 s (Figure 1). The footprint of the full-scale OWC will cover an area of approximately 13 × 24 m [9]. This prototype can generate a nominal peak capacity of 200 kW. Generally, King Island’s west coast is considered one of the world’s best coasts for WEC systems. However, based on a 2017 survey, the west coast was considered too challenging for a trial installation and the location was moved to the east coast. In order to advance with an installation date in 2020, more information about the geotechnical properties and local seafloor conditions was required.
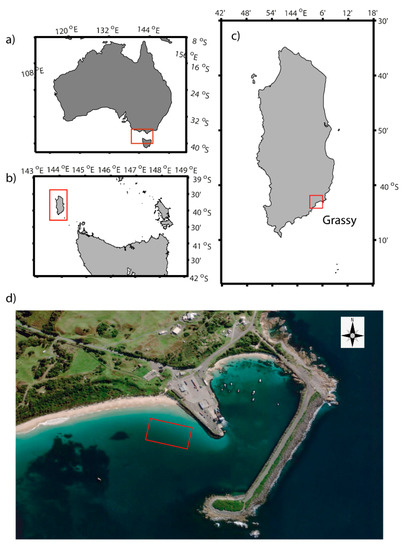
Figure 1.
(a) National map of Australia. (b) Regional scale of Northern Tasmania with the Furneaux Islands Group in the east and King Island in the west. (c) Local map of Tasmania with the location of Grassy on the southeast coastline. (d) Location and zoomed in satellite image of Grassy Harbour. The survey area is outlined by the red square near the rock wall of Grassy Harbour.
Usually, seabed site characterization methods include multibeam surveys, ground-penetrating radar (sub-bottom profiles, SBP), benthic samples with cores and grabbers, sidescan sonar and seabed imagery [7,8,11]. These surveys are then followed by geotechnical analysis and sediment transport studies to determine local seabed parameters to aid in the design and installation of a WEC [7,12,13]. The wide range of environmental and geological parameters require a detailed geotechnical analysis to guarantee the best possible design and construction of the WEC [14,15]. Thus, it is critical to understand the local geotechnical and geological conditions of the seabed to properly place and anchor a WEC and minimize maintenance costs.
1.2. Test Site and Energy Resource
King Island is located in the west of Bass Strait, approximately half way between Tasmania and mainland Australia. King Island’s population is estimated to be 1300 and the power is generated by its own grid system using wind and solar energy together with battery storage. The electrical grid is further complemented by power generation from diesel [10]. WSE has identified a 50 × 200 m area in which the OWC is to be placed. The distance to the shore is approximately 200 m and approximately 50 m (at its closest point) to a rockwall protecting Grassy Harbour from southeasterly swell.
The sea state at the site has been continuously measured (since 14 March 2019) with RBR pressure sondes, and since June 2019 with a Nortek acoustic wave current profiler (AWAC) profiler placed approximately in the center of the target area (Figure 1e). A representative time series of significant wave height Hs and peak period Tp observed between 16 June 2019 and 08 August 2019, as well as a wave rose, are depicted in Figure 2a–c, respectively.
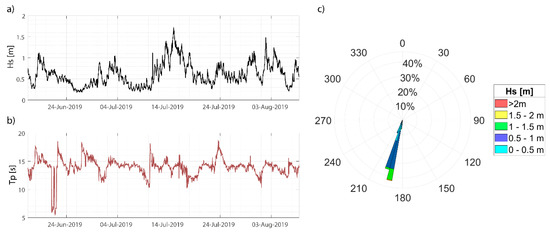
Figure 2.
(a) Significant wave height (Hs) and (b) spectral wave period (Tp) observed during the first six weeks of deployment. (c) Wave direction of significant wave heights for the same period.
The significant wave height increased from 0.49 m to approximately 0.65 m in July/August, which is also mirrored by a slightly longer significant wave period, between 13–14 s. The wave direction shows a very consistent reading between 194–198° with little spread, as shown in Figure 2b. These wave conditions (including more recent observations, not shown) are considered favorable to install an OWC in a depth of roughly 5.5 m (datum: lowest astronomical tide, LAT) at the site to harness wave energy and supply the township of Grassy with additional power.
Bathymetry measurements in the survey area conducted in March 2019 revealed water depths ranging from −2 to −12 m (see Figure 3) and a seabed that slopes gently towards the shore, with depths diminishing from −12 to −3 m over ca. 210 m. The seafloor within the target area is relatively flat without any significant bathymetric features. However, on the western side of the survey area there are some rocky underwater outcrops (also visible on satellite imagery in Figure 1d) and Frog Rock to the southwest of the survey area also evident in the satellite image.
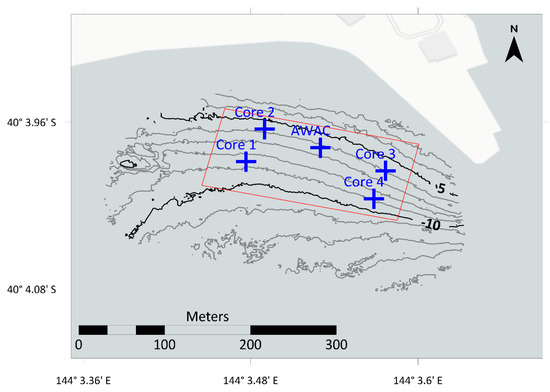
Figure 3.
Bathymetry of the candidate site (boundaries depicted by the red rectangle) overlaid with core locations. Blue crosses depict five cores at each site, i.e., the center locations and four cores taken 10 m away from the center in the cardinal directions.
2. Materials and Methods
During a calm weather period between 14 March 2019 and 17 March 2019, the geotechnical site survey including sediment coring, sub-bottom profiling and seabed imagery was carried out at the candidate site. In addition, sediment strength of surficial sediments was tested with a BlueDrop Penetrometer [11].
A piston corer (manually operated by a diver) was used to take the sediment cores. A georeferenced star picket was used to locate the core sites, for instance, the first core was taken near the picket and the other cores at this location were taken 10 m off the picket in the cardinal compass directions (north, east, south and west). During the retrieval of the piston corer (out of the seabed) some compaction was lost when extruded into the larger core bags. The dimensions of the piston sampler allowed for cores to be taken up to a length of 1 m, but sediment depths larger than 1 m were beyond the limit of manual coring. Representative core samples were shipped to the Geotechnical Research Laboratory at the University of Queensland for the geotechnical analysis.
Each core site included one core sample at the center point (coordinates given in Table 1) and four cores in the compass directions 10 m away from the centre point. In total, 25 cores at five different core locations were taken as outlined in Figure 3.

Table 1.
Coordinates of center location for each coring circle.
Two cores from each core site were taken to the geophysical laboratory. The geotechnical analysis was undertaken on three different sites (i.e., AWAC site, Site 2 and Site 3).
A series of sub-bottom profiling transects were obtained with the SBP system StrataBox 3510 HD manufactured by Syqwest Inc., Cranston, RI, (USA), which was operated at 10 kHz. Differences in sediment layering (acoustic impedance) was analyzed during postprocessing to detect potential boulder and reef formations, and to evaluate and assess the sand layer thickness. Transects were first taken along the sand bed, parallel and then perpendicular to the shoreline. A more detailed postprocessing routine is described in [16]. As the sub-bottom did not have an inertial motion unit, the resulting first return (seabed) was datum-aligned to the bathymetry grid from the bathymetry survey. Several factors were considered during postprocessing and interpreting the acoustic data: core sampling, in situ diver experience, base map and backscatter information. The presence of a strong subsurface single reflector and the parameters mentioned above were used to determine the sand layer thickness.
In addition, in situ measurements of surficial seafloor sediment strength was determined with the BlueDrop penetrometer. This torpedo-shaped instrument has eight sampling sensors, e.g., one pressure gauge (PSI), two horizontal accelerometers (+/− 55 g in x and y directions), and five vertical accelerometers (+/− 1.7, 18, 50, 200, 250 g). The sampling rate was 2 kHz at a resolution of 24 bit, allowing for all eight sensors to record simultaneously. The pressure gauge was able to accurately measure the depth during the freefall and final depth upon penetration, and it also recorded the pore pressure dissipation of the sediment upon impact [17,18]. The penetrometer created a high-resolution picture of the seabed which was used to identify the sediment types and allowed for multiple interpretations of the data, including quasistatic bearing capacity, sediment type, sediment remobilization, overall geotechnical characteristics [18] and undrained shear strength [19]. For the purpose of quantifying resistance, the firmness factor (FF) introduced by [20] was used. FF is the relationship between the maximum deceleration, impact velocity and penetration time defined as:
where the FF is equal to the peak acceleration (amax/g) normalized by the impact velocity in m/s (vi) and total duration of embedment in seconds (ti). The firmness factor is directly related to the quasistatic bearing capacity (QSBC), i.e., high values of FF represent larger QSBC values, which in turn was derived from the weight of the penetrometer and its deceleration upon impact with the seafloor [21].
The geotechnical analysis was performed on three randomly selected cores in order to classify soils. For each core the internal angle of friction, cohesion, density and void ratio was determined. In addition, the bearing capacity and particle size distribution were determined. The majority of the sections of the core samples were undisturbed and firm while only a few sections were softer, indicating a degree of disturbance. The density, stress and water content conditions in situ were quantified from these core sections. All samples were saturated to 100% saturation to replicate natural conditions. One triaxial test included three different loads of cell pressure or radial stress. Each sample was tested at different loads where the radial effective stress was taken as σ3’ = 6, 15.5 and 25.5 kPa. This represented a horizontal stress at roughly 7 m. Initially, the effective vertical stress started at σ1’ = 6, 15.5 and 25.5 kPa (isotropic conditions), respectively. After the initial stress was applied, the vertical stress was linearly increased by 10 kPa per minute. The test was conducted under fully drained conditions and the stress increased until failure occurred and then beyond.
3. Results
3.1. Cores
Positive results occurred for all cores revealing a sand layer thickness of >1000 mm (Figure 3). The soil classification and sieve curves are presented in Section 3.4.
3.2. Sub-Bottom Profiling
An accurate high-resolution map of the top 2–4 m of sediment was constructed from the SBP data with the profiling frequency of 10 kHz. At the proposed installation location (and in vicinity thereof), no boulder and reef formations were found and the sub-bottom profiling revealed relatively homogeneous surface substrate. Confirming the core data, the entire survey area revealed more than 1000 mm of sand layer thickness, with areas identified with a minimum of 2000 mm cover in 5 m of water for placement of the structure. Individual sub-bottom data of three shore-parallel transects are shown in Figure 4a whilst cross section profiles of sand coverage and underlying bedrock are depicted in Figure 4b. These profiles were created by visualizing a vertical slice representation of the seabed and the underlying second return associated with the bedrock boundary. The bedrock layer typically slopes downwards to the east, with the exception of Profile 1, where the underlying reef/rock approaches the surface near the tip of the rock wall and adjacent ferry terminal. On the western side, the reef/rock begins to approach the surface; however, this is outside of the survey area and nearing a subsurface reef/rock exposure on the seabed 75 m to the east of the survey area (see also the satellite image, Figure 1e).
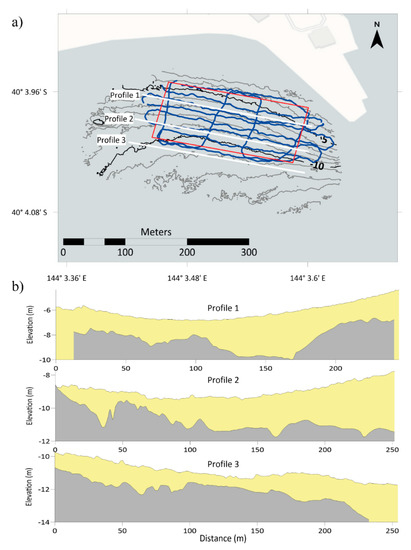
Figure 4.
(a) Map shows the sub-bottom coverage within the candidate site (along the blue vessel track line and the position of three transects that were interpolated from high-resolution coverage of the area). (b) Bottom panel shows the interpolated cross sections demonstrating the sand layer thickness in the survey area. Yellow shading reflects sand layer and the gray shades the underlying bedrock.
3.3. Penetrometer
In total, 26 penetrometer casts were carried out in a random pattern within or slightly outside of the survey area (Figure 5a). Three casts contained too much noise so that 23 casts were ultimately analyzed with respect to firmness factor (Figure 5b), deceleration profiles (Figure 5b) and quasistationary bearing capacity (Figure 5c) within the first 5 cm of the seafloor. Figure 5b shows maximum deceleration reach 60 g and deceleration peaks are located mainly at depths between 0.02 and 0.035 m, but profiles for drops 1, 2 and 9 show peaks at a depth of 0.04 and 0.05 m, respectively.
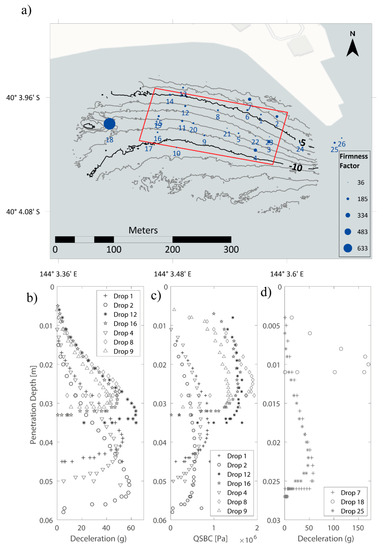
Figure 5.
(a) Location and firmness factor (FF) of penetrometer casts for the surficial sediment strength survey. Marker size refers to magnitude of the firmness factor. Generally, harder substrate is found along the edges of the surveyed area. Target area is marked by the red line. (b) Deceleration curves from selected penetrometer drops across the target area. (c) Quasistatic bearing capacity (QSBC) profiles from the same selected casts shown in (b). (d) Deceleration curves for profiles taken outside of the target area showing casts near the rockwall (drops 7 and 25) and over a rocky underwater outcrop (drop 18).
The smaller the penetration, the harder the substrate and the larger the FF values (and QSBC values). Thus, profiles with peaks around 0.02 and 0.03 m represent compacted sediments while the larger penetration depths suggest a softer substrate or looser compacted material. Despite these minor differences, all penetrometer casts exhibit characteristic deceleration curves for noncohesive sediments (Figure 5b). Likewise, the penetration depths range between 0.01 and 0.06 cm, which is typical in coastal areas dominated by sand [11,18,21]. Generally, the FF ranges between 50 and 120 with an average value of around FF = 80 (when drops on rock outside of the survey area are excluded). These values correspond to QSBC estimates of up to 2 MPa (Figure 5c), indicative of the sandy substrate found throughout the target area [11,18]. Figure 5d depicts deceleration profiles taken outside of the target area. The penetration depths are much smaller compared to casts obtained inside the candidate site, especially drop 18 that was carried out over a rocky submarine outcrop, peaking at 170 g with a penetration depth of ~10 mm.
3.4. Geotechnical Analysis
The sediment analysis revealed that the seabed consists of 100% sand with a negligible amount material passing the sieve of 0.075 mm (around 1%), as shown in Figure 6a. Only 1% of each sample was retained by the 2.36 mm sieve. This indicates that the sand is medium to fine in particle size. The particle diameters at 10%, 30% and 60% finer by weight were 0.15, 0.18 and 0.23 mm. According to these diameters, the corresponding coefficient of curvature Cc = 0.95 and the coefficient of uniformity Cu = 1.5 indicate that the sample material can be classified as poorly graded S and SP. The specific gravity of the sand was determined to be 2.657.
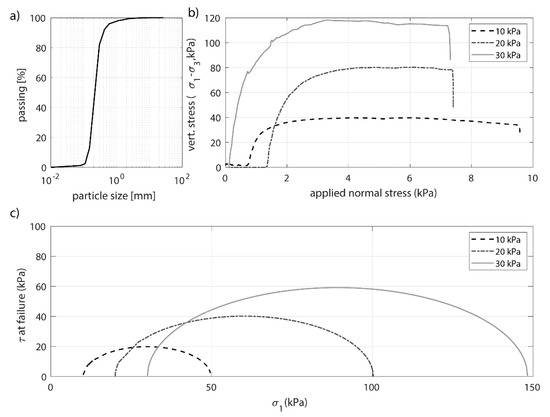
Figure 6.
(a) Average particle size distribution of the seabed sediment found within the candidate site. (b) Top right panel shows the deviatoric stress vs. the vertical stress. (c) Bottom panel depicts Mohr circles at failure state with failure plane and the tangent used to determine the friction angle indicating cohesionless and coarse sand particles.
In total, three samples from AWAC site (center), Site 2 (center) and Site 3 (west) were tested under the same conditions of saturation and cell or radial pressure. The results obtained from the OWC center location are shown in Figure 6b,c. The shear or deviatoric stress q = (σ1–σ3) is plotted against the vertical stress for the three applied loads (Figure 6a). Figure 6 shows first a linear increase of shear strength which is followed by a nonlinear section until failure is reached. This shear vs. stress relation shows a shear failure relation which is characteristic for a dense sand. Softening, indicating that the shear strength decreases with further deformation, is evident after the point of failure. Table 2 summarizes the stress conditions at failure for loads. Figure 6c shows the corresponding Mohr circles of the triaxial tests. A yield surface without cohesion is evident and the friction angle is determined to be ~φ = 41.75°.
Table 2.
Stress conditions at failure.
The nominal bearing capacity of offshore footings can be calculated from simple static considerations [22]. Assuming that there is no eccentricity and no horizontal load, and that the structure is sitting on the surface (shallow footing), the bearing capacity qf was calculated using:
with sy = 1–0.4 B’/L (B’ = B, without eccentricity) and with B’ = 15.5 m and L = 20 m yields sy ≈ 0.69. With Nγ’ ≈ 100 for φ’ = 41.76° [23], the bearing capacity qf can be calculated to be approximately qf = 5.35 MPa (with approximately L = 20 m and an effective sediment unit weight of γ’ = 10 kN/m3). However, if γ’ = 8 kN/m3 (which is possibly at shallower depth), then qf reduces to qf = 4.28 MPa. Under the conditions of B = L = 20 m, and a γ’ = 10 kN/m3, the calculated bearing capacity is qf = 6 MPa. We note that this is a simplified assumption (e.g., wave impact with cyclic loading or flow of water are neglected).
4. Discussion
The candidate site exhibits a relatively flat seafloor with depths varying between −12 and −3 m (below LAT), with a seafloor that slopes gently towards the shore. The sediments showed very consistent homogenous layering and all cores retrieved at the candidate site revealed a penetration depth of >1000 mm with no signs of boulders, reefs or rocky outcrops below the seafloor. These seabed characteristics were further confirmed by sub-bottom data, penetrometer drops and dive operations. The SBP survey resolved the seafloor to depths of up to 3–4 m with a clear seabed structure between compacted sand and bedrock. The level of resolution and accuracy can be partially attributed to the shallow water depth and to the seafloor characteristics, giving more confidence in the acoustic data interpretation. Boulders and hard substrate near the seabed surface were only evident towards the southwest and northeast, which is outside of the designated installation area. The sediment consists of 100% sand with a negligible fraction of coarser or finer classes having sufficient weight-bearing characteristics. With triaxial tests the bearing capacity was estimated on the order of approximately 4–6 MPa, which is in good agreement with the sediment strength tests from the penetrometer casts. In conclusion, these results confirmed that this is a suitable location to place the WEC on the sandy seabed in the desired water depth (~5.5 m below LAT). The deployment for the WSE Uniwave 200 is scheduled within the first half of 2020, meaning that the time between initial planning to installation spans a period of roughly one year. This rapid development can be attributed to a few factors which are linked to the specific location near Grassy Harbour, but also to the survey methods and device design, as discussed in the paragraphs that follow.
Favorable weather conditions and the chosen shallow water depths allowed for an area coverage of approximately 16,000–20,000 m2 within a relatively short time (2–3 days of fieldwork). In contrast, a similar geotechnical survey carried out in 2017 on King Island’s west coast for WSE’s 2MW OWC proved far more challenging due to larger water depths (~10m below LAT) and a much more dynamic wave climate of Hs ~2 m [16]. In 2017, the need for an acceptable weather window caused an almost 10 week delay due to unfavorable weather conditions. Likewise, similar uncertainties would apply for device installation, as conditions only allow such heavy-duty offshore operations a few times per year. Thus, the more sheltered location and easy accessibility of Grassy Harbour rendered the site assessment less risky, more cost-efficient and overall more suitable to advance the technology readiness level for WSE’s Uniwave type OWC.
The homogeneity of the seafloor in Grassy Harbour greatly reduced the geotechnical analysis and simplified the sampling method with respect to SBP, coring and penetrometer casts. Although physical samples from sediment cores combined with SBP are still the most robust method for seabed characterization, the penetrometer casts provided information about sediment strength with greater spatial density. The accuracy of the penetrometer is evidenced by comparing different deceleration curves from both inside and outside the target area. The deceleration profiles outside of the target area revealed the presence of harder substrate (for instance, drop 18, which was deliberately dropped over a rocky outcrop, and drops 7 and 25 in shallower water near the rock wall) indicating that distinction between soft and hard seabed can easily be deducted by the deceleration profiles (and/or FF). Likewise, all penetrometer profiles within the target area showed the distinct characteristic of noncohesive sands and, although the level of compactness varied (FF values and deceleration curves), the QSBC estimates were consistently on the order of 1–2 MPa, which was in good agreement with triaxial test results (see Section 3.4). We hypothesize that future site assessment will rely more rigorously on free-fall penetrometers as it provides rapid information of soil characteristics and sediment type over large areas. This is important as marine renewable energy systems at commercial scale will likely involve arrays that occupy areas of up to several square kilometers [24,25,26] and may span across multiple seafloor environments [12]. For instance, the authors have successfully used penetrometer surveys in Banks Strait with a much larger survey area of >50 km2 to characterize the seafloor for a renewable energy project [27]. Another advantage of penetrometer casts is that results can also be used to analyze recent sediment remobilization processes [28], or distinguish between sediment substrates, e.g., detect a thin layer of sand, gravel or shell fractures and softer substrate [11,18]. On the other hand, penetrometer data only sample surficial sediment characteristics, and should not be considered a full replacement for a substantial and more detailed survey method such as sediment coring or cone penetration tests [11,29]. However, information about the surficial substrate could assist in narrowing down locations for sediment cores (and reduce dive operations and/or expensive drill rigs and ROVs). This significantly decreases risk, survey time and survey costs, and can ultimately improve site assessment practices—currently not included in European Marine Energy Centre and International Electrotechnical Commission guidelines-and to help advance renewable energy projects offshore.
The placement of a caisson structure in shallow water with a large footprint in a sheltered area also narrows the required geotechnical parameter space, as many soil and material properties related to pile and anchor foundations can be omitted [30]. Gravity-based WECs can be placed on many soil types, in particular on sandy substrate with high shear strength (friction angle) and no cohesion, as described in this work. Homogeneity of soil material, which is often more prevalent in geologically less active regions, plays a major role to reduce the amount of seafloor types, in contrast to more complex seabed evolutions as reported in [12,31,32]. Stability against overturning, bearing and sliding was further assessed with loads due to wave propagation from deep to shallow (refraction and shoaling) being the most critical design parameter. Our field data show a nearly unidirectional wave attack which is confirmed by a numerical wave climate analysis indicating most common significant wave heights between 1.0 and 1.5 m, but maximum heights can reach up to 4.5 m, albeit with 0.1% frequency over a 30 year modeled period [33], leading to an estimated maximum horizontal loading of 3200 kN [34]. The foundation base of the OWC will be sloped to match the natural slope of the beach profile. Based on the geotechnical analysis, the OWC will be placed on the seafloor without any prior treatment of the seafloor but with additional protection against sliding and overturning. For instance, a skirting perimeter reinforced by three shear keys was added to the design and two 2Mton Stevshark ® Rex anchors or similar structural elements are required to achieve sliding safety of the OWC. In addition, the bearing pressure distribution will be controlled by ballast tanks used in combination with the anchors during installation. Observations during different periods of fieldwork between March and July 2019 at the site suggest that areas around the AWAC mooring have scoured. Larger waves during storms will have significant influence on loosely compacted sand layers, causing vortex-induced vibration and scour at the corners of the structure after installation [35,36]. Current estimates predict scour depths exceeding 1.5 m so that scour processes and sediment transport should be monitored after installation of the OWC prototype.
Whilst many studies have focused on optimizing the performance and Power Take Off (PTO) of offshore OWCs, little can be estimated about the structure–seabed interaction at laboratory or prototype scale without a geotechnical survey. Prior to deployment of an offshore structure, the geotechnical analysis of the candidate site is important for the renewable industry sector to prevent costly failures which run counter to demonstrating predictable energy production and high levels of technological readiness. This geotechnical survey and analysis aided in planning the first installation of an offshore island OWC in Australia and by the time of installation, the only operating OWC in Australia. We envision to gain a tremendously useful experience from the trial installation in 2020, which is a crucial step to advance the technology even further to more challenging environments such as the west coast of King Island with an anticipated 45 kW/m [1].
Author Contributions
Conceptualization, R.C. and C.H.; methodology, R.C. and C.H.; software and validation, R.C., C.H. and I.P.; formal analysis, R.C., C.H. and R.B.; investigation; resources, S.H.; data curation, R.C., I.P. and S.H.; writing—original draft preparation, R.C.; writing—review and editing, R.C.; visualization, R.C. and C.H.; supervision, R.C. and I.P.; project administration, R.C.; funding acquisition, R.C. All authors have read and agreed to the published version of the manuscript.
Funding
This research was funded by Wave Swell energy with resources coming from the Australian Renewable Energy Agency (ARENA). The fieldwork was also partially funded by the Australian Maritime College–Search.
Acknowledgments
The authors would like to acknowledge the following people for their help to accomplish and complete this study: Grant Jordan for his help, including the use of his vessel Abstar on King Island, aviation services between Essendon and Currie, supply of diving equipment and field operations in general; Alex Scheuermann and Sebastian Quintero Olaya from the University of Queensland for help with the core sample analysis. In addition, we thank the local IGA tool shop for support and ad hoc supply during the field campaign.
Conflicts of Interest
The authors declare no conflict of interest.
References
- Hemer, M.; Griffin, D. The wave energy resource along Australia’s Southern margin. J. Renew. Sustain. Energy 2010, 2. [Google Scholar] [CrossRef]
- Enerdata. Global Energy Trends—2016 Report; World Energy Council 2016: London, UK, 2016. [Google Scholar]
- ABC-News. Huge Swell Sinks Wave Energy Generator; ABC-News: New York, NY, USA, 2010. [Google Scholar]
- Drew, B.; Plummer, A.R.; Sahinkaya, M.N. A review of wave energy converter technology. Proc. Inst. Mech. Eng. Part A J. Power Energy 2009, 223, 887–902. [Google Scholar] [CrossRef]
- Falcão, A.F.d.O. Wave energy utilization: A review of the technologies. Renew. Sustain. Energy Rev. 2010, 14, 899–918. [Google Scholar] [CrossRef]
- Iturrioz, A.; Guanche, R.; Armesto, J.A.; Alves, M.A.; Vidal, C.; Losada, I.J. Time-domain modeling of a fixed detached oscillating water column towards a floating multi-chamber device. Ocean Eng. 2014, 76, 65–74. [Google Scholar] [CrossRef]
- Ramsay, P. Supporting renewable energy projects using high resolution hydrographic and geophysical survey techniques, Garden Island, Western Australia. Underw. Technol. Int. J. Soc. Underw. 2016, 33, 229–237. [Google Scholar] [CrossRef]
- Goff, J.A.; Kraft, B.J.; Mayer, L.A.; Schock, S.G.; Sommerfield, C.K.; Olson, H.C.; Gulick, S.P.S.; Nordfjord, S. Seabed characterization on the New Jersey middle and outer shelf: Correlatability and spatial variability of seafloor sediment properties. Mar. Geol. 2004, 209, 147–172. [Google Scholar] [CrossRef]
- Brown, J. Available online: http://waveswellenergy.com.au/technology/ (accessed on 12 January 2020).
- Fleming, A.A.M.G.; Hunter, S.; Denniss, T. Power performance prediction for a vented oscillating water column wave energy converter with a unidirectional air turbine power take-off. In Proceedings of the 12th European Wave and Tidal Energy Conference, Cork, Ireland, 27 August–1 September 2017. [Google Scholar]
- Stark, N.; Hay, A.E.; Trowse, G. Cost-effective Geotechnical and Sedimentological Early Site Assessment for Ocean Renewable Energies. In Proceedings of the 2014 Oceans—St. John’s, St. John’s, NL, Canada, 14–19 September 2014. [Google Scholar]
- Barrie, J.V.; Conway, K.W. Seabed characterization for the development of marine renewable energy on the Pacific margin of Canada. Cont. Shelf Res. 2014, 83, 45–52. [Google Scholar] [CrossRef]
- Chatzigiannakou, M.A.; Dolguntseva, I.; Leijon, M. Offshore Deployments of Wave Energy Converters by Seabased Industry AB. J. Mar. Sci. Eng. 2017, 5, 15. [Google Scholar] [CrossRef]
- Chen, L.; Lam, W.-H. Methods for predicting seabed scour around marine current turbine. Renew. Sustain. Energy Rev. 2014, 29, 683–692. [Google Scholar] [CrossRef]
- Schneider, J.; Maynard, M.L.; Senders, M. Geotechnical engineering for offshore wind turbine foundations. Sea Technol. 2010, 51, 29–33. [Google Scholar]
- Cossu, R.; Heatherington, C.; Grinham, A.; Penesis, I.; Hunter, S. A cost-efficient seabed survey for bottom-mounted OWC on King Island, Tasmania, Australia. AWTEC 2018 Proc. 2018, 411–420. [Google Scholar]
- Fitzgerald, M.; Elsworth, D. Evolution of the Pore-Pressure Field Around a Moving Conical Penetrometer of Finite Size. J. Eng. Mech. 2010, 136, 263–272. [Google Scholar] [CrossRef][Green Version]
- Stark, N.; Wilkens, R.; Ernstsen, V.B.; Lambers-Huesmann, M.; Stegmann, S.; Kopf, A. Geotechnical Properties of Sandy Seafloors and the Consequences for Dynamic Penetrometer Interpretations: Quartz Sand Versus Carbonate Sand. Geotech. Geol. Eng. 2012, 30, 1–14. [Google Scholar] [CrossRef]
- Stoll, D.; Sun, Y.-F.; Bitte, I. Seafloor Properties From Penetrometer Tests. Ocean. Eng. IEEE J. 2007, 32, 57–63. [Google Scholar] [CrossRef]
- Mulukutla, G.K.; Huff, L.C.; Melton, J.S.; Baldwin, K.C.; Mayer, L.A. Sediment identification using free fall penetrometer acceleration-time histories. Mar. Geophys. Res. 2011, 32, 397–411. [Google Scholar] [CrossRef]
- Stark, N.; Kopf, A.; Hanff, H.; Stegmann, S.; Wilkens, R. Geotechnical investigations of sandy seafloors using dynamic penetrometers. In Proceedings of the OCEANS 2009, Biloxi, MS, USA, 26–29 October 2009; pp. 1–10. [Google Scholar]
- Bjerrum, L. Problems of soil mechanics and construction on soft clays and structurally unstable soils-collapsiable expansive and others. Int. J. Rock Mech. Min. Sci. Geomech. Abstr. 1975, 12, A19–A20. [Google Scholar] [CrossRef]
- Hansen, J.B. A revised and extended formula for bearing capacity. Danish Geotech. Inst. Bull 1970, 98, 5–11. [Google Scholar]
- Toby Johnson, D.T. Grassy Harbour Wave Climate and Scour Assessment; Cardno: St Leonards, NSW, Australia, 2019. [Google Scholar]
- Ahmadian, R.; Falconer, R.; Bockelmann-Evans, B. Far-field modelling of the hydro-environmental impact of tidal stream turbines. Renew. Energy 2012, 38, 107–116. [Google Scholar] [CrossRef]
- Funke, S.W.; Farrell, P.E.; Piggott, M.D. Tidal turbine array optimisation using the adjoint approach. Renew. Energy 2014, 63, 658–673. [Google Scholar] [CrossRef]
- Ricci, P.; Rico, A.; Ruiz-Minguela, P.; Boscolo, F.; Villate, J. Design, modelling and analysis of an integrated mooring system for wave energy arrays. In Proceedings of the 4th International Conference on Ocean Energy, Dublin, Ireland, 19 October 2012; pp. 1–6. [Google Scholar]
- Project, A. Tidal Energy in Australia—Assessing Australia’s Tidal Energy Resource & Its Ability to Contribute to Australia’s Future Energy Mix. Available online: http://austen.org.au/ (accessed on 19 January 2020).
- Stark, N.; Kopf, A. Detection and quantification of sediment remobilization processes using a dynamic penetrometer. In Proceedings of the OCEANS’11 MTS/IEEE KONA, Waikoloa, HI, USA, 19–22 September 2011; pp. 1–9. [Google Scholar]
- Robertson, P.K. Soil classification using the cone penetration test. Can. Geotech. J. 1990, 27, 151–158. [Google Scholar] [CrossRef]
- Heath, J.E.; Jensen, R.P.; Weller, S.D.; Hardwick, J.; Roberts, J.D.; Johanning, L. Applicability of geotechnical approaches and constitutive models for foundation analysis of marine renewable energy arrays. Renew. Sustain. Energy Rev. 2017, 72, 191–204. [Google Scholar] [CrossRef]
- Howe, J.A.; Anderton, R.; Arosio, R.; Dove, D.; Bradwell, T.; Crump, P.; Cooper, R.; Cocuccio, A. The seabed geomorphology and geological structure of the Firth of Lorn, western Scotland, UK, as revealed by multibeam echo-sounder survey. Earth Environ. Sci. Trans. R. Soc. Edinb. 2015, 105, 273–284. [Google Scholar] [CrossRef]
- Shaw, J.; Todd, B.J.; Li, M.Z.; Wu, Y. Anatomy of the tidal scour system at Minas Passage, Bay of Fundy, Canada. Mar. Geol. 2012, 323, 123–134. [Google Scholar] [CrossRef]
- O’Halloran, N.L.B. Geotechnical Design Report; Cardno (NSW/ACT) Pty Ltd.: St Leonards, NSW, Australia, 2019; pp. 1–40. [Google Scholar]
- Lancaster, O.; Cossu, R.; Baldock, T. Experimental investigation into scour processes around a gravity based Oscillating Water Column Wave Energy Converter. Coast. Eng. 2020. submitted. [Google Scholar]
- Petersen, T.U. Scour around Offshore Wind Turbine Foundations. Ph.D. Thesis, Technical University of Denmark, Kongens Lyngby, Denmark, 2014. [Google Scholar]
© 2020 by the authors. Licensee MDPI, Basel, Switzerland. This article is an open access article distributed under the terms and conditions of the Creative Commons Attribution (CC BY) license (http://creativecommons.org/licenses/by/4.0/).