Comparative Study on Seismic Response of Pile Group Foundation in Coral Sand and Fujian Sand

Abstract
1. Introduction
2. Shaking Table Test
2.1. Similitude Ratio
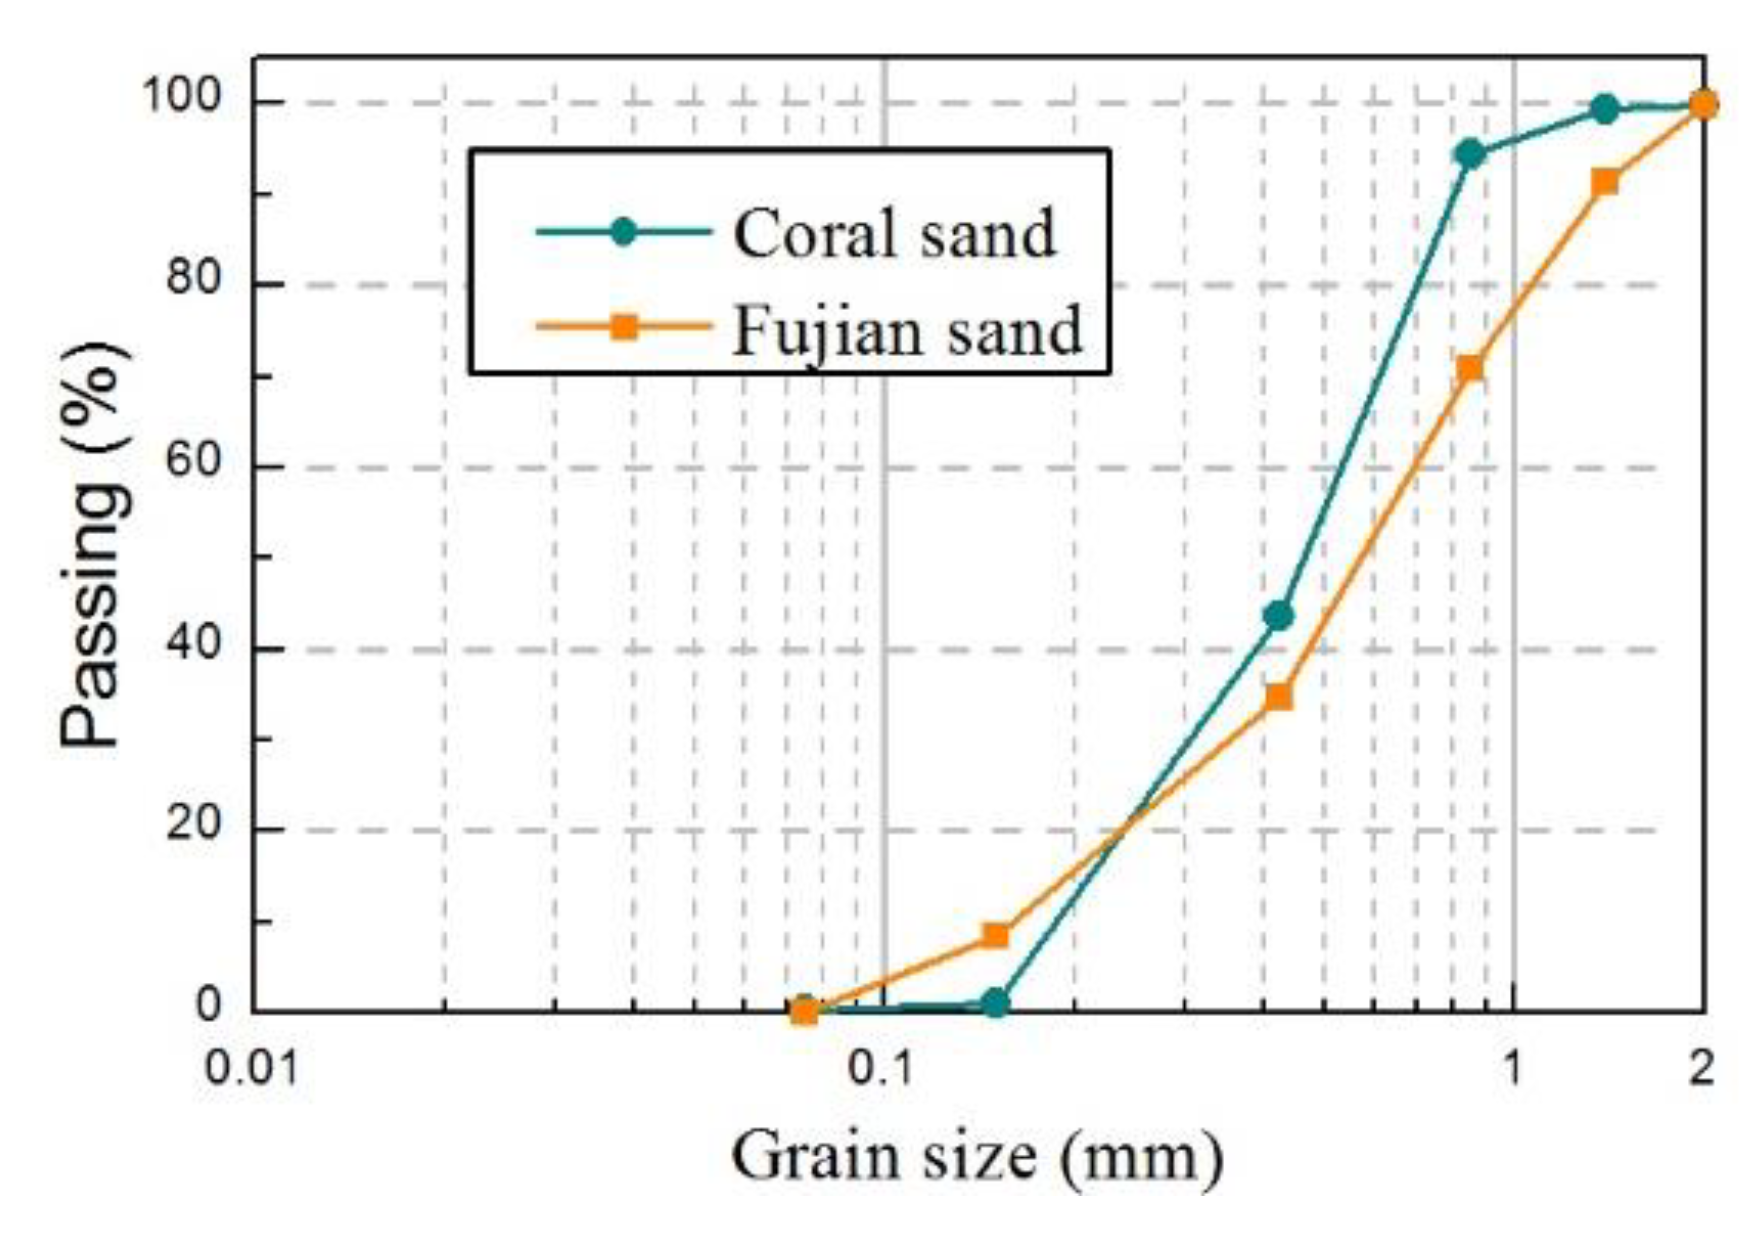
2.2. Preparation of the Model
2.3. Instrumentation and Experimental Program
3. Macroscopic Phenomena of Soil and Structure
4. Result and Discussion
4.1. Pore Water Pressure Response
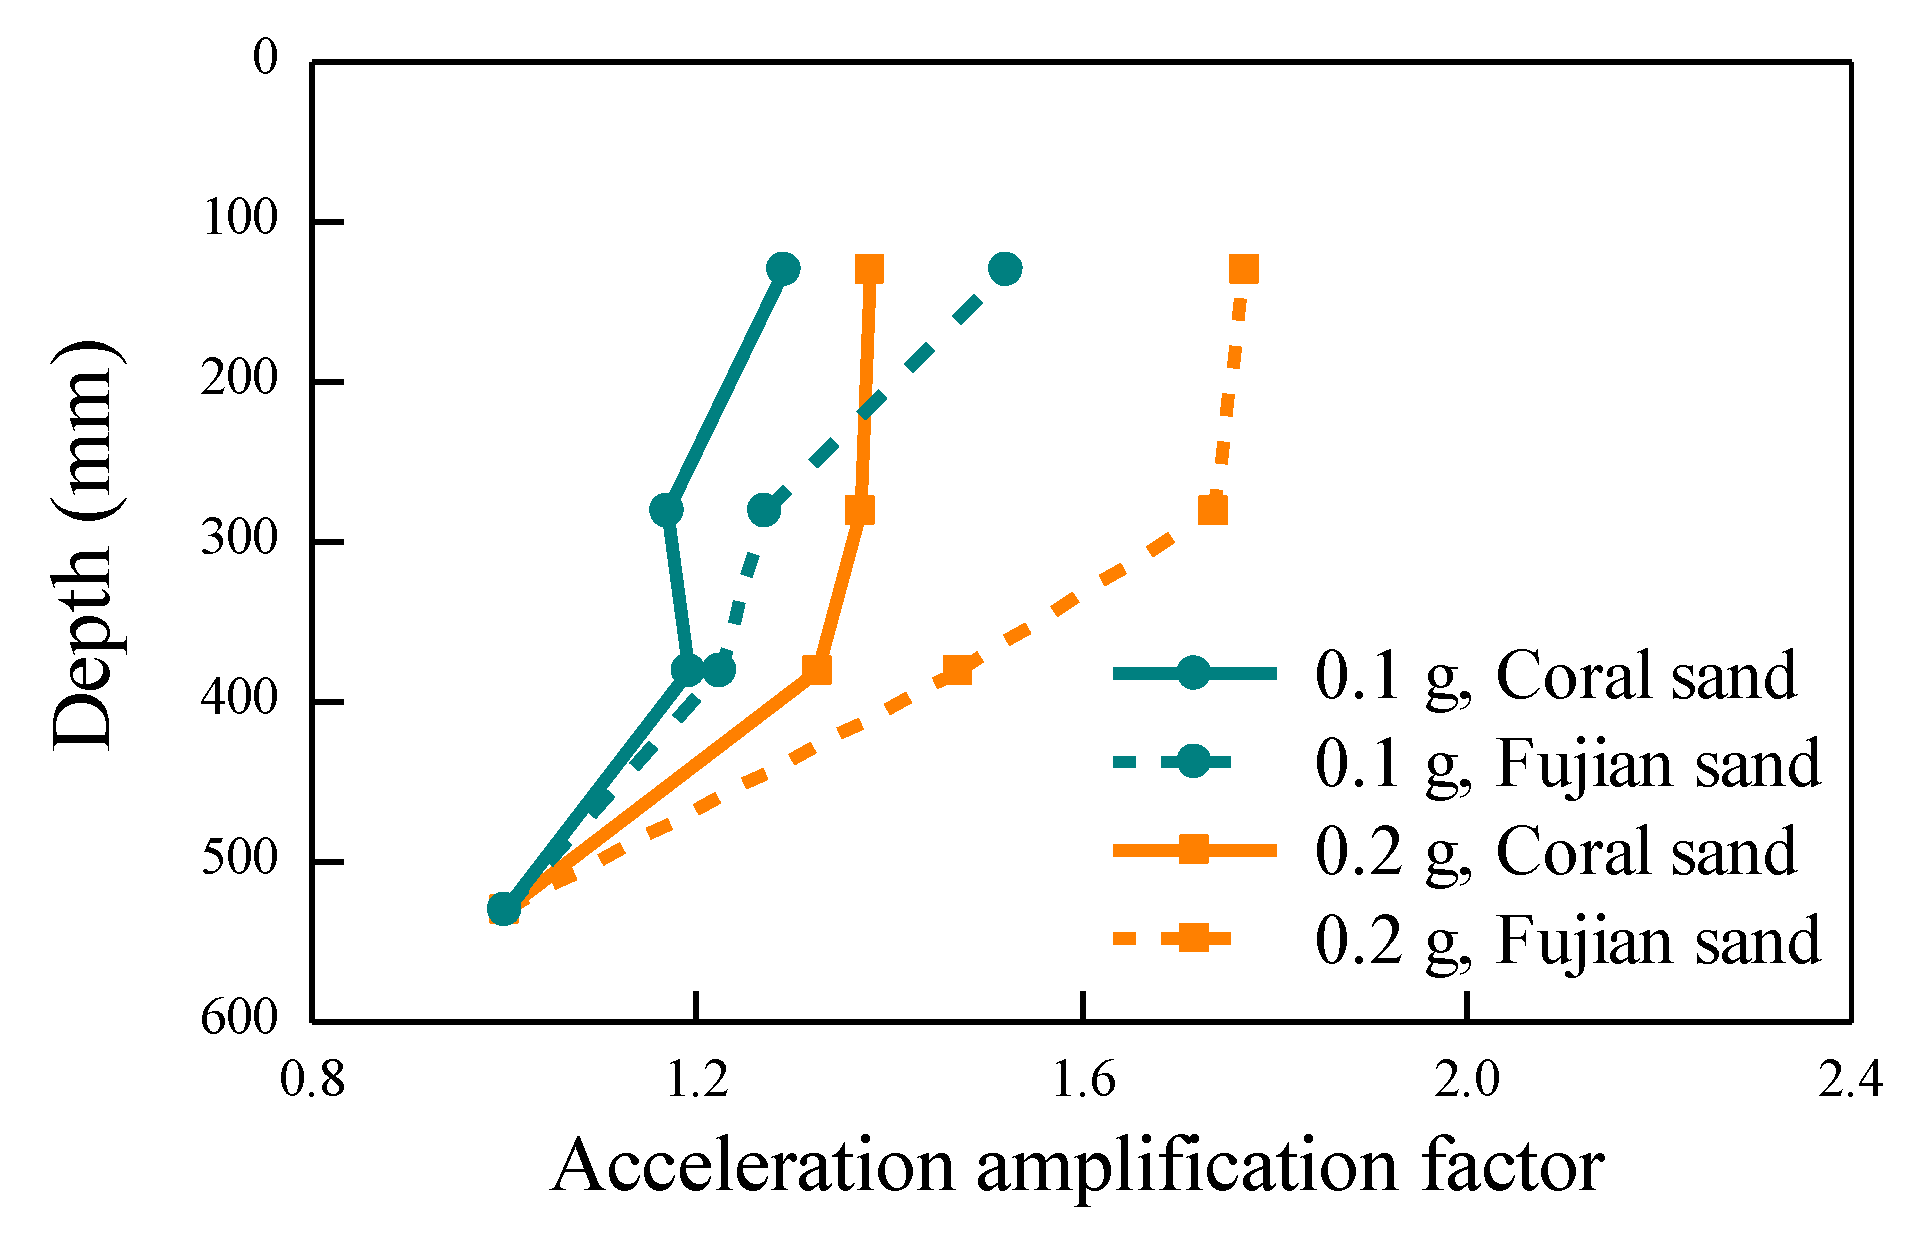
4.2. Acceleration Response
4.3. Displacement Response
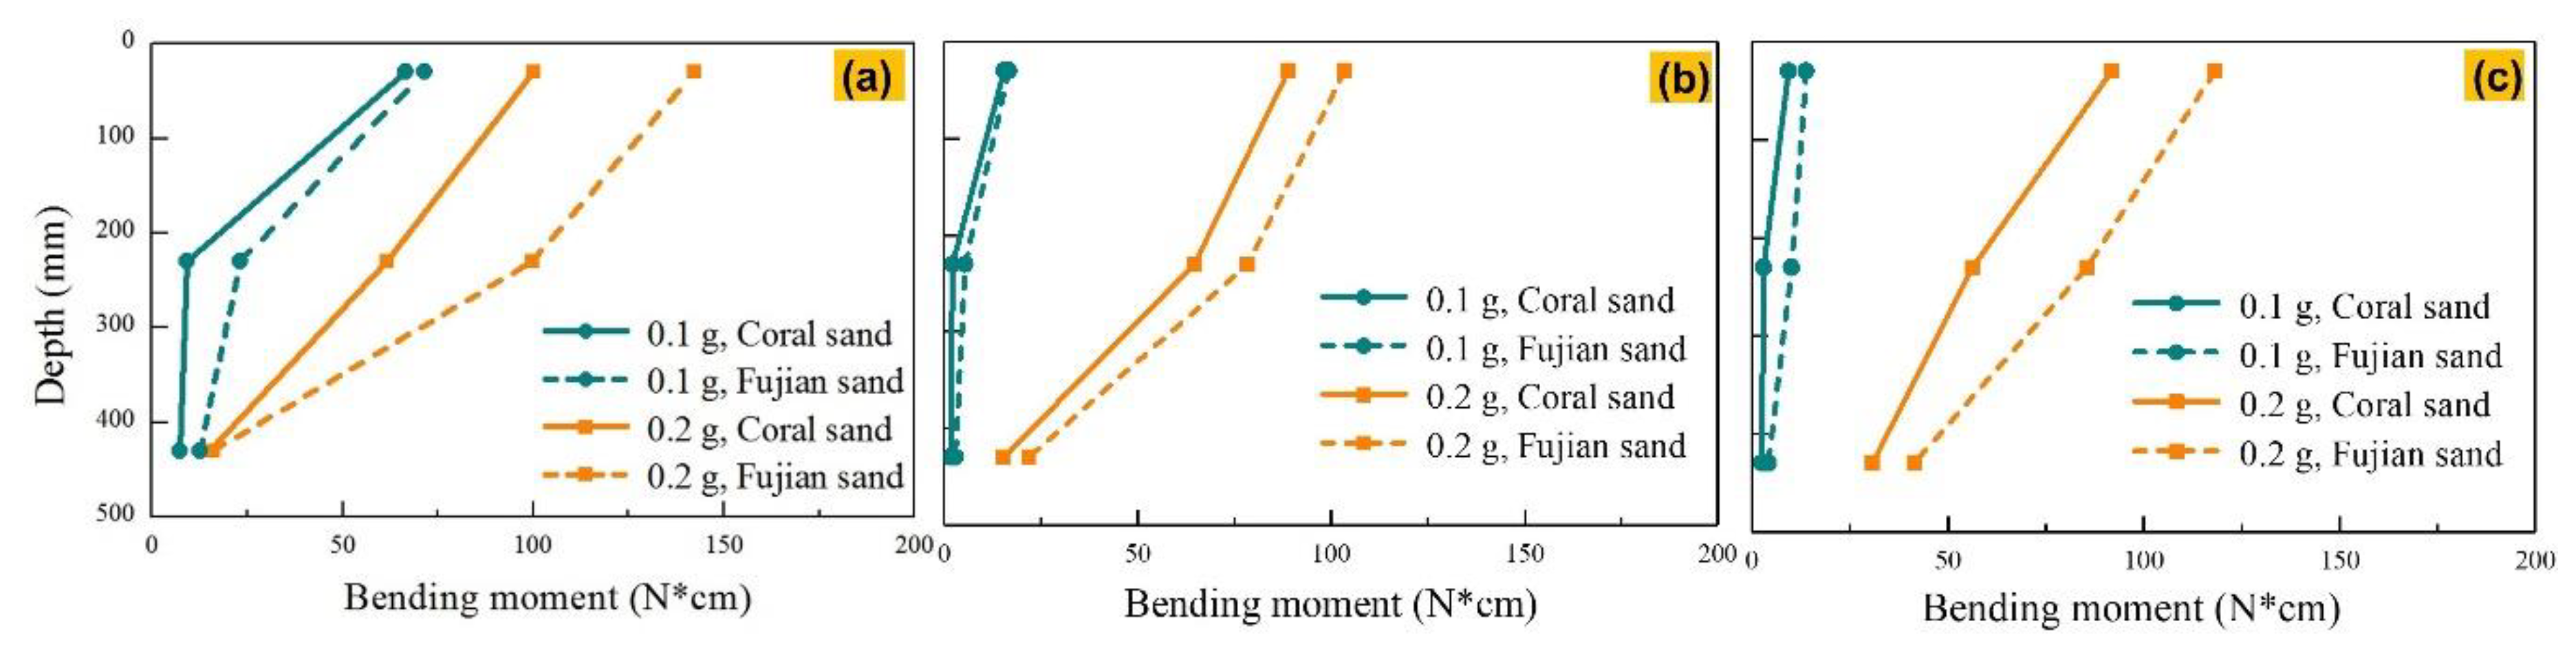
4.4. Dynamic Bending Moment Response
5. Summary and Conclusions
- (1)
- The peak values of excess pore pressure ratio of coral sand and Fujian sand were far less than 1 under 0.1 g shaking intensity, there was no liquefaction in two kinds of sand sites. The peak values of excess pore pressure ratio of coral sand were basically less than that of Fujian sand, which were approximately 0.67–1.00 times of that of Fujian sand.
- (2)
- The development rate of excess pore pressure ratio of coral sand was smaller than that of Fujian sand and the peak values of excess pore pressure ratio of coral sand were less than that of Fujian sand, which were about 0.53–0.78 times of that of Fujian sand. The coral sand sites were more difficult to liquefy than Fujian sand sites under the same relative density and similar grain-size distributions.
- (3)
- The acceleration amplification coefficient of coral sand and Fujian sand sites increased with the decrease of depth, and the acceleration amplification factors of coral sand was smaller than that of Fujian sand.
- (4)
- The building horizontal displacement in the coral sand site was smaller than that in the Fujian sand site. The building horizontal displacement in coral sand site was 0.09 times of that in the Fujian sand site under 0.1 g shaking intensity and 0.18 times of that in Fujian sand site under 0.2 g shaking intensity. The building settlement in coral sand site was also smaller than that in the Fujian sand site.
- (5)
- The dynamic bending moments of building columns in coral sand site were smaller than that in the Fujian sand site, and the magnification effect of increasing shaking intensity on the building column moment in coral sand site was smaller than that in the Fujian sand site. The peak values of dynamic bending moments of pile groups in the coral sand site were smaller than that in the Fujian sand site. The buildings in coral sand will withstand earthquakes better than buildings in silica sand.
Author Contributions
Funding
Acknowledgments
Conflicts of Interest
References
- Xiao, P.; Liu, H.; Xiao, Y.; Stuedlein, A.W.; Evans, T.M. Liquefaction resistance of bio-cemented calcareous sand. Soil Dyn. Earthq. Eng. 2018, 107, 9–19. [Google Scholar] [CrossRef]
- Hyodd, M.; Hyde, A.; Aramaki, N. Liquefaction of crushable soils. Geotechnique 1998, 48, 527–543. [Google Scholar] [CrossRef]
- Xiao, Y.; Liu, H.; Chen, Q.; Ma, Q.; Xiang, Y.; Zheng, Y. Particle breakage and deformation of carbonate sands with wide range of densities during compression loading process. Acta Geotech. 2017, 12, 1177–1184. [Google Scholar] [CrossRef]
- Ren, Y.; Wang, Y.; Yang, Q. Effects of particle size distribution and shape on permeability of calcareous sand. Rock Soil Mech. 2018, 39, 491–497. [Google Scholar]
- Ye, W.; Yin, W.; Qing, Y. Experiment on drag force coefficient of calcareous sand in liquid considering the effect of particle shape. Rock Soil Mech. 2018, 39, 3201–3212. [Google Scholar]
- Schwiderski, E.W. On charting global ocean tides. Rev. Geophys. 1980, 18, 243–268. [Google Scholar] [CrossRef]
- Singh, S.C.; Carton, H.; Tapponnier, P.; Hananto, N.D.; Chauhan, A.P.; Hartoyo, D.; Bayly, M.; Moeljopranoto, S.; Bunting, T.; Christie, P. Seismic evidence for broken oceanic crust in the 2004 Sumatra earthquake epicentral region. Nat. Geosci. 2008, 1, 777. [Google Scholar] [CrossRef]
- Wang, X.; Jiao, Y.; Wang, R.; Hu, M.; Meng, Q.; Tan, F. Engineering characteristics of the calcareous sand in Nansha Islands, South China Sea. Eng. Geol. 2011, 120, 40–47. [Google Scholar] [CrossRef]
- Choi, S.; Park, S.; Wu, S.; Chu, J. Methods for calcium carbonate content measurement of biocemented soils. J. Mater. Civ. Eng. 2017, 29, 6017015. [Google Scholar] [CrossRef]
- Potirakis, S.M.; Hayakawa, M.; Schekotov, A. Fractal analysis of the ground-recorded ULF magnetic fields prior to the 11 March 2011 Tohoku earthquake (M W = 9): Discriminating possible earthquake precursors from space-sourced disturbances. Nat. Hazards 2017, 85, 59–86. [Google Scholar] [CrossRef]
- Medley, E.W. Geological Engineering Reconnaissance of Damage caused by the October 15, 2006 Hawaii Earthquakes. Int. J. Geoeng. Case Hist. 2007, 1, 89–135. [Google Scholar]
- Green, R.A.; Olson, S.M.; Cox, B.R.; Rix, G.J.; Rathje, E.; Bachhuber, J.; French, J.; Lasley, S.; Martin, N. Geotechnical aspects of failures at Port-au-Prince seaport during the 12 January 2010 Haiti earthquake. Earthq. Spectra 2011, 27, S43–S65. [Google Scholar] [CrossRef]
- Williams, T.A.; Shepherd, D.A. Building resilience or providing sustenance: Different paths of emergent ventures in the aftermath of the Haiti earthquake. Acad. Manag. J. 2016, 59, 2069–2102. [Google Scholar] [CrossRef]
- Salem, M.; Elmamlouk, H.; Agaiby, S. Static and cyclic behavior of North Coast calcareous sand in Egypt. Soil Dyn. Earthq. Eng. 2013, 55, 83–91. [Google Scholar] [CrossRef]
- Xu, X.; Wang, R.; Hu, M.; Meng, Q. Experimental study of dynamic characteristics of saturated calcareous soil explosion compaction. Rock Soil Mech. 2012, 15, 402–406. [Google Scholar]
- Sandoval, E.A.; Pando, M.A. Experimental assessment of the liquefaction resistance of calcareous biogenous sands. Earth Sci. Res. J. 2012, 16, 55–63. [Google Scholar]
- Brandes, H. Simple shear behavior of calcareous and quartz sands. Geotech. Geol. Eng. 2011, 29, 113–126. [Google Scholar] [CrossRef]
- Sharma, S.S.; Fahey, M. Evaluation of cyclic shear strength of two cemented calcareous soils. J. Geotech. Geoenviron. Eng. 2003, 129, 608–618. [Google Scholar] [CrossRef]
- Tang, L.; Zhang, X.; Ling, X.; Su, L.; Liu, C. Response of a pile group behind quay wall to liquefaction-induced lateral spreading: A shake-table investigation. Earthq. Eng. Eng. Vib. 2014, 13, 741–749. [Google Scholar] [CrossRef]
- Dashti, S.; Bray, J.D.; Pestana, J.M.; Riemer, M.; Wilson, D. Centrifuge testing to evaluate and mitigate liquefaction-induced building settlement mechanisms. J. Geotech. Geoenviron. Eng. 2009, 136, 918–929. [Google Scholar] [CrossRef]
- Chen, G.; Chen, S.; Qi, C.; Du, X.; Wang, Z.; Chen, W. Shaking table tests on a three-arch type subway station structure in a liquefiable soil. Bull. Earthq. Eng. 2015, 13, 1675–1701. [Google Scholar] [CrossRef]
- Jiang, L.; Chen, J.; Li, J. Seismic response of underground utility tunnels: Shaking table testing and FEM analysis. Earthq. Eng. Eng. Vib. 2010, 9, 555–567. [Google Scholar] [CrossRef]
- Rasouli, R.; Towhata, I.; Hayashida, T. Mitigation of seismic settlement of light surface structures by installation of sheet-pile walls around the foundation. Soil Dyn. Earthq. Eng. 2015, 72, 108–118. [Google Scholar] [CrossRef]
- Luan, L.; Zheng, C.; Kouretzis, G.; Ding, X. Dynamic analysis of pile groups subjected to horizontal loads considering coupled pile-to-pile interaction. Comput. Geotech. 2020, 117, 103276. [Google Scholar] [CrossRef]
- Luan, L.; Ding, X.; Zheng, C.; Kouretzis, G.P.; Wu, Q. Dynamic response of pile groups subjected to horizontal loads. Can. Geotech. J. 2019. [Google Scholar] [CrossRef]
- Lv, Y.; Liu, J.; Zuo, D. Moisture effects on the undrained dynamic behavior of calcareous sand at high strain rates. Geotech. Test. J. 2018, 42, 725–746. [Google Scholar] [CrossRef]
- Lv, Y.; Wang, Y.; Zuo, D. Effects of particle size on dynamic constitutive relation and energy absorption of calcareous sand. Powder Technol. 2019, 356, 21–30. [Google Scholar] [CrossRef]
- Ni, P.; Song, L.; Mei, G.; Zhao, Y. Predicting excavation-induced settlement for embedded footing: Case study. Int. J. Geomech. 2018, 18, 5018001. [Google Scholar] [CrossRef]
- Cui, C.Y.; Meng, K.; Wu, Y.J.; Chapman, D.; Liang, Z.M. Dynamic response of pipe pile embedded in layered visco-elastic media with radial inhomogeneity under vertical excitation. Geomech. Eng. 2018, 16, 609–618. [Google Scholar] [CrossRef]
- Wu, W.; Liu, H.; Yang, X.; Jiang, G.; El Naggar, M.H.; Mei, G.; Liang, R. New method to calculate apparent phase velocity of open-ended pipe pile. Can. Geotech. J. 2020, 57, 127–138. [Google Scholar] [CrossRef]
- Iai, S. Similitude for shaking table tests on soil-structure-fluid model in 1g gravitational field. Soils Found. 1989, 29, 105–118. [Google Scholar] [CrossRef]
- Chen, S.; Tang, B.; Zhao, K.; Li, X.; Zhuang, H. Seismic response of irregular underground structures under adverse soil conditions using shaking table tests. Tunn. Undergr. Space Technol. 2020, 95, 103145. [Google Scholar] [CrossRef]
- Zhou, Z.; Lei, J.; Shi, S.; Liu, T. Seismic response of aeolian sand high embankment slopes in shaking table tests. Appl. Sci. 2019, 9, 1677. [Google Scholar] [CrossRef]
- Kheradi, H.; Morikawa, Y.; Ye, G.; Zhang, F. Liquefaction-Induced Buckling Failure of Group-Pile Foundation and Countermeasure by Partial Ground Improvement. Int. J. Geomech. 2019, 19, 4019020. [Google Scholar] [CrossRef]
- Ebeido, A.; Elgamal, A.; Tokimatsu, K.; Abe, A. Pile and Pile-Group Response to Liquefaction-Induced Lateral Spreading in Four Large-Scale Shake-Table Experiments. J. Geotech. Geoenviron. Eng. 2019, 145, 4019080. [Google Scholar] [CrossRef]
- Teparaksa, J.; Koseki, J. Effect of past history on liquefaction resistance of level ground in shaking table test. Géotech. Lett. 2018, 8, 256–261. [Google Scholar] [CrossRef]
- Chen, Y.; Liu, H.; Shao, G.; Zhao, N. Laboratory tests on flow characteristics of liquefied and post-liquefied sand. Chin. J. Geotech. Eng. 2009, 31, 1408–1412. [Google Scholar]


| Parameters | Similitude Relation | Similitude Ratio |
|---|---|---|
| Length l | Sl | 1:40 |
| Equivalent density ρ | Sρ | 6:1 |
| Elastic modulus E | SE | 3:20 |
| Acceleration a | Sa=SESρ−1Sl−1 | 1 |
| Duration t | St=SE−0.5Sρ0.5Sl | 0.158 |
| Frequency ω | Sω=St−1 | 6.325 |
| Stress σ | Sσ=SE | 3:20 |
| Linear displacement r | Sr=Sl | 1:40 |
| The Category of Sand | Specific Gravity | Maximum Dry Density (g·cm−3) | Minimum Dry Density (g·cm−3) | Coefficient of Uniformity, Cu | Mean Grain Size, (D50: mm) |
|---|---|---|---|---|---|
| Coral sand | 2.80 | 1.48 | 1.15 | 2.67 | 0.48 |
| Fujian sand | 2.63 | 1.64 | 1.35 | 4.50 | 0.60 |
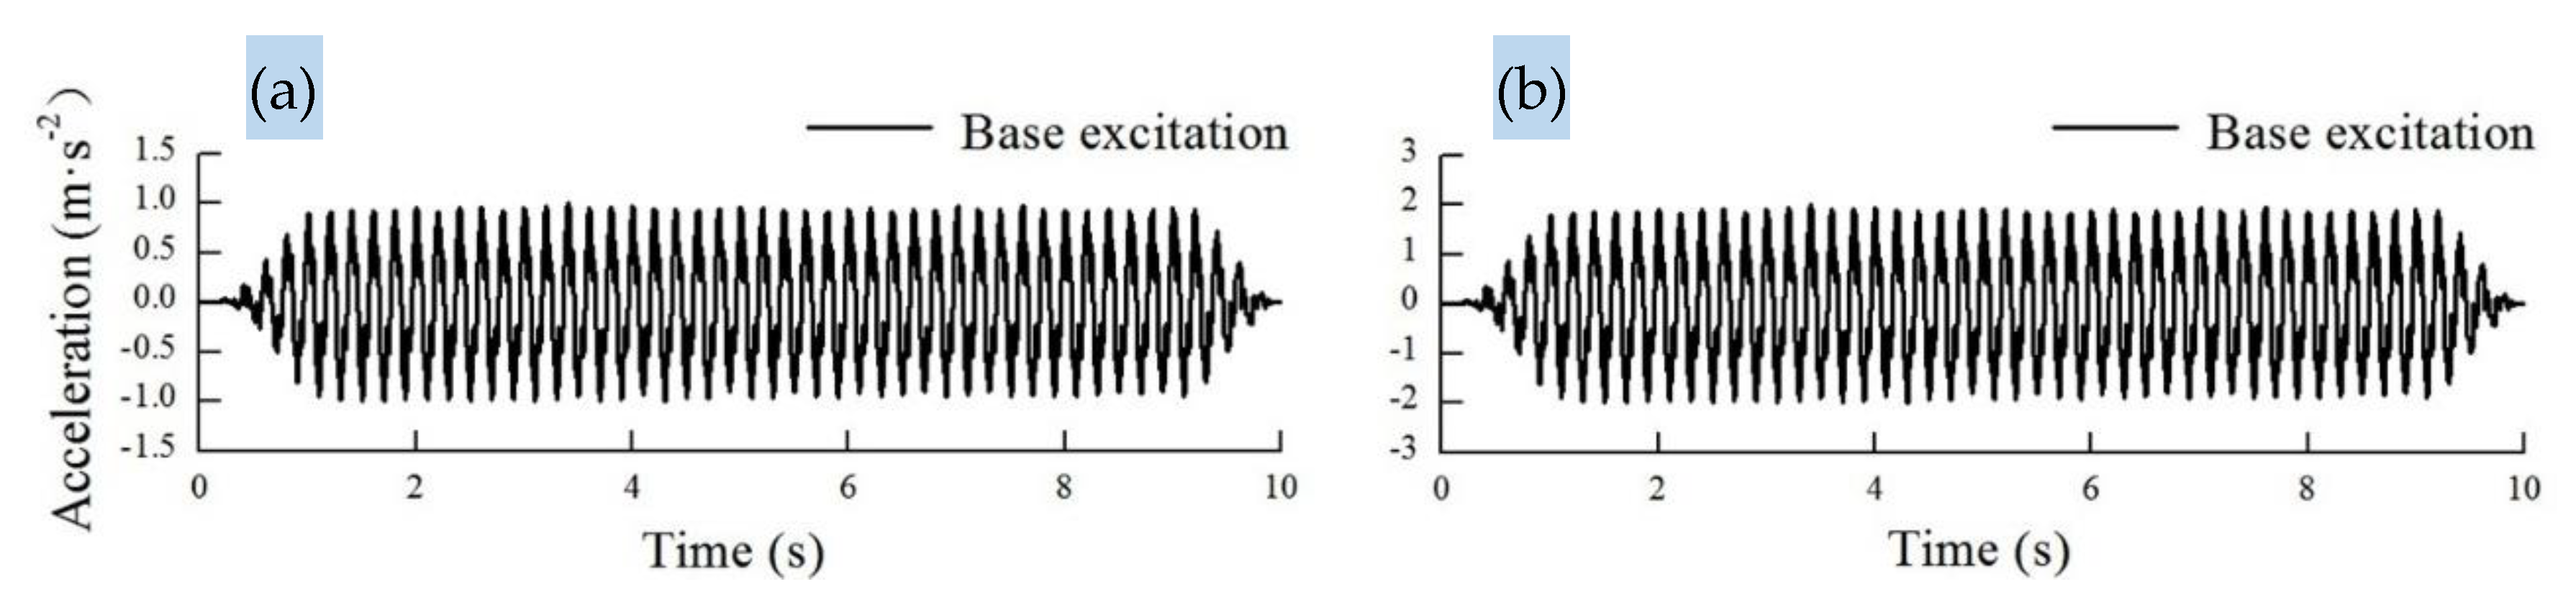
| Case | Relative Density | Input Motions | Peak Acceleration (g) | Duration (s) | Frequency (Hz) |
|---|---|---|---|---|---|
| 1 | 0.67 | Sine wave | 0.1 | 10 | 5 |
| 2 | 0.67 | Sine wave | 0.2 | 10 | 5 |
| Shaking Intensity | Sand Type | P1 | P2 | P3 | P4 | P5 | P6 | P7 | P8 |
|---|---|---|---|---|---|---|---|---|---|
| 0.1 g | Coral sand | 0.06 | 0.04 | 0.04 | 0.03 | 0.08 | 0.04 | 0.04 | 0.03 |
| Fujian sand | 0.07 | 0.06 | 0.05 | Lost | 0.09 | 0.06 | 0.04 | 0.04 | |
| 0.2 g | Coral sand | 0.94 | 0.68 | 0.62 | 0.5 | 1.1 | 0.72 | 0.59 | 0.54 |
| Fujian sand | 1.2 | 1.09 | 0.98 | Lost | 1.5 | 1.24 | 1.12 | 0.81 |
© 2020 by the authors. Licensee MDPI, Basel, Switzerland. This article is an open access article distributed under the terms and conditions of the Creative Commons Attribution (CC BY) license (http://creativecommons.org/licenses/by/4.0/).
Share and Cite
Wu, Q.; Ding, X.; Zhang, Y.; Chen, Z. Comparative Study on Seismic Response of Pile Group Foundation in Coral Sand and Fujian Sand. J. Mar. Sci. Eng. 2020, 8, 189. https://doi.org/10.3390/jmse8030189
Wu Q, Ding X, Zhang Y, Chen Z. Comparative Study on Seismic Response of Pile Group Foundation in Coral Sand and Fujian Sand. Journal of Marine Science and Engineering. 2020; 8(3):189. https://doi.org/10.3390/jmse8030189
Chicago/Turabian StyleWu, Qi, Xuanming Ding, Yanling Zhang, and Zhixiong Chen. 2020. "Comparative Study on Seismic Response of Pile Group Foundation in Coral Sand and Fujian Sand" Journal of Marine Science and Engineering 8, no. 3: 189. https://doi.org/10.3390/jmse8030189
APA StyleWu, Q., Ding, X., Zhang, Y., & Chen, Z. (2020). Comparative Study on Seismic Response of Pile Group Foundation in Coral Sand and Fujian Sand. Journal of Marine Science and Engineering, 8(3), 189. https://doi.org/10.3390/jmse8030189