Article

Relating Hydrodynamic Forcing and Topographic Response for Tide-Dominated Sandy Beaches

1
Hydrology and Hydraulic Engineering, Vrije Universiteit Brussel, Pleinlaan 2, 1050 Elsene, Belgium
2
Geoconsultant, Suikerkaai 8, 1500 Halle, Belgium
*
Author to whom correspondence should be addressed.
J. Mar. Sci. Eng. 2020, 8(3), 151; https://doi.org/10.3390/jmse8030151
Submission received: 31 January 2020 / Revised: 16 February 2020 / Accepted: 24 February 2020 / Published: 26 February 2020
(This article belongs to the Section Coastal Engineering)

Abstract

:
To relate hydrodynamic forcing and topographic response for a tide-dominated sandy beach, extensive field measurements were carried out in the intertidal zone. Hydrodynamics and beach topography were monitored during a total of 12 weeks at two different study sites: one with a featureless intertidal zone and one with intertidal bars. The results of both study sites indicate that the intertidal beach grows when wave steepness is small, whereas it erodes when wave steepness is large. Spring-neap variations in tidal current direction heavily distort this trend: strong spring tidal currents transport sediment away from the beach, resulting in enhanced erosion. Tide-induced beach volume changes are on the same order of magnitude as wave-induced changes. Besides waves and tides, the effect of variations in the amount of sediment supply is substantial, with enhanced accretion when the sediment supply is large. The effect of variations in sediment supply on the intertidal beach topography is subordinate to the effect of waves and tide, though. From this study, it is concluded that larger waves are primarily erosive, but they can also enhance the natural sediment supply. Furthermore, it is found that tidal currents can be equally important as waves in shaping the beach topography, especially during spring tide on macrotidal beaches.

1. Introduction

The intertidal zone is a key area for beach morphodynamics, as it serves as the pathway of sediment from the subtidal zone to the dunes and vice versa [1,2,3]. Generally, the intertidal beach erodes during storms, while sediment is transported back to the beach during calm conditions [4]. A persisting challenge is to unravel the exact forcing factors that control beach erosion and accretion, as multiple forcing factors (e.g., waves, tidal currents, and wind) act simultaneously on the intertidal beach.
It is generally acknowledged that wave steepness, i.e., wave height over length, is an important driving factor of topographic change in the intertidal zone [5,6,7,8,9]. Onshore sediment transport is commonly observed when wave steepness is small, whereas offshore transport is observed when wave steepness is large.
In contrast to the effect of waves, the effect of tide remains uncertain. A considerable number of studies on intertidal beach morphodynamics have been carried out on microtidal beaches, where tides generally play a passive role in sediment transport and topographic change [10,11]. The morphodynamics of macrotidal beaches has been studied to a lesser extent, but it has been recognized that the role of tidal currents may be significant [12,13,14,15,16,17]. It has been observed that the effect of tidal currents may vary over a spring-neap tidal cycle and can be reinforced by the wind [18]. It has also been acknowledged that tide is responsible for shifts in the position of the shoaling wave, surf, and swash zone across the beach. Variations in tidal amplitude enhance or limit the movement of these zones, and the tide can thus weaken or amplify the impact of waves on the intertidal beach [19,20,21]. Furthermore, the tide may play an important role in the transport of sediment [22]. However, the relative importance of tide in macrotidal beach morphodynamics remains uncertain.
Furthermore, the effect of short-term (i.e., daily) variations in (natural) sediment supply on intertidal beach dynamics has rarely been studied, due to difficulties related to measuring sediment transport [23,24]. Earlier studies based on geological evidence have proven that the exchange of sediment between the lower shoreface and the beach is an important element in the sediment budget of the coast [25,26,27,28]. Studies on the effect of monthly to seasonal variations in sediment supply (sediment transported from the lower shoreface to the beach) confirm this [29,30]. Nevertheless, field investigations of the effect of short-term variations in sediment supply to sandy beaches remain scarce [23].
To improve our knowledge of the macrotidal sandy beach morphodynamics on a daily scale, this study aimed to investigate and determine the relative importance of the impact of waves, tidal currents, and variations in (natural) sediment supply on the intertidal beach topography. This was done based on extensive field measurements to be able to perform a statistical analysis of the importance of the forcing factors.

2. Materials and Methods

2.1. Study Area

The two study sites that were investigated are located along the Belgian coast (Figure 1), a macrotidal coast with a tidal range of 3.5 m during neap and 5 m during spring tide [31,32]. This results in strong tidal currents of over 1 m/s in the nearshore area [32]. Wave energy is medium, with an average wave height of 0.5‒1 m and an average wave period of 3.5‒4.5 s. Offshore waves are mainly driven by westerly winds (WSW‒NW). With the SW‒NE orientation (55‒235°) of the Belgian coast, this results in a longshore drift towards the NE. Numerous sand banks, the Flemish Banks, are present along the coast (Figure 1). They are tens of kilometers long and up to a few kilometers wide [33]. The bank closest to the study sites, The Stroombank, has a maximum depth of ‒3 m TAW (Belgian reference level, i.e., relative to the lowest astronomical tide).
The first study site is Mariakerke, a developed site west of Oostende (Figure 1). At this beach, a seawall and groynes have long been present. Additionally, small-scale beach nourishments and beach scraping have been carried out for some decades and large beach and underwater nourishments have been carried out since 2006 [34]. The last nourishments took place in 2014, when 900.000 m3 was added to the beach and 300.000 m3 to the shoreface along a coastal stretch of 2‒4 km. The intertidal beach is featureless, but the transition to the dry beach is characterized by a steep slope (37%) approximately 2 m high. The intertidal beach is 160 m wide, and gently sloping (2%). It consists of well-sorted, normally distributed, medium sand with a median diameter (D50) of 325 µm. This is coarser than the natural grain size (150‒250 µm) as a result of the nourishments. The natural trend of the beach at Mariakerke is erosive (‒8 m3/m/yr, calculated over approximately 20 years), but this was counterbalanced with frequent nourishments over the past few decades (+4 m3/m/y) [34].
The second study site is Groenendijk, a natural site near Nieuwpoort (Figure 1). This is a natural beach where no protective measures have been taken. It is characterized by four intertidal bars (ridges and runnels) of 5‒60 cm high and is connected to a dune area. The intertidal beach is 290 m wide and gently sloping (1%). The sediment on the beach is medium sand with a D50 of 200 µm. The beach at Groenendijk has been growing steadily over the past decades (+18 m3/m/y, calculated over approximately 20 years) [34]. Differences in long-term beach behavior between Mariakerke and Groenendijk have mainly been attributed to human interventions, such as the groynes, and differences in natural sediment supply [34,35].

2.2. Measuring Campaigns

Six fortnight measuring campaigns were carried out to investigate the effect of marine forcing on the intertidal beach topography at Mariakerke and Groenendijk (Table 1). Flow velocity, water level, wave conditions, and Suspended Sediment Concentrations (SSC) were measured continuously with a frame (Figure 2) that was placed on the Mean Low Water (MLW, + 1.39 m TAW) line at Mariakerke and on top of the lowest bar (+1.90 m TAW) at Groenendijk. The beach topography of five cross-shore profiles from the toe of the dunes/dike to the low water line (Figure 1) was measured every day during low tide. Daily beach volume changes were determined from these topographic surveys. The hydrodynamic conditions were daily averaged to allow a comparison between hydrodynamic forcing and topographic response. Volume changes were related directly to hydrodynamic conditions, without considering sediment transport. Sediment transport was investigated in detail for two of the six campaigns in [22]. The campaigns covered both energetic and calm conditions (Table 1) and each covered a full spring-neap tidal cycle. The name of each campaign corresponds to the season (i.e., spring, summer, or winter) and the study site (i.e., flat = developed site Mariakerke; barred = natural site Groenendijk).

2.3. Measurements of Hydrodynamics and Sediment Concentrations

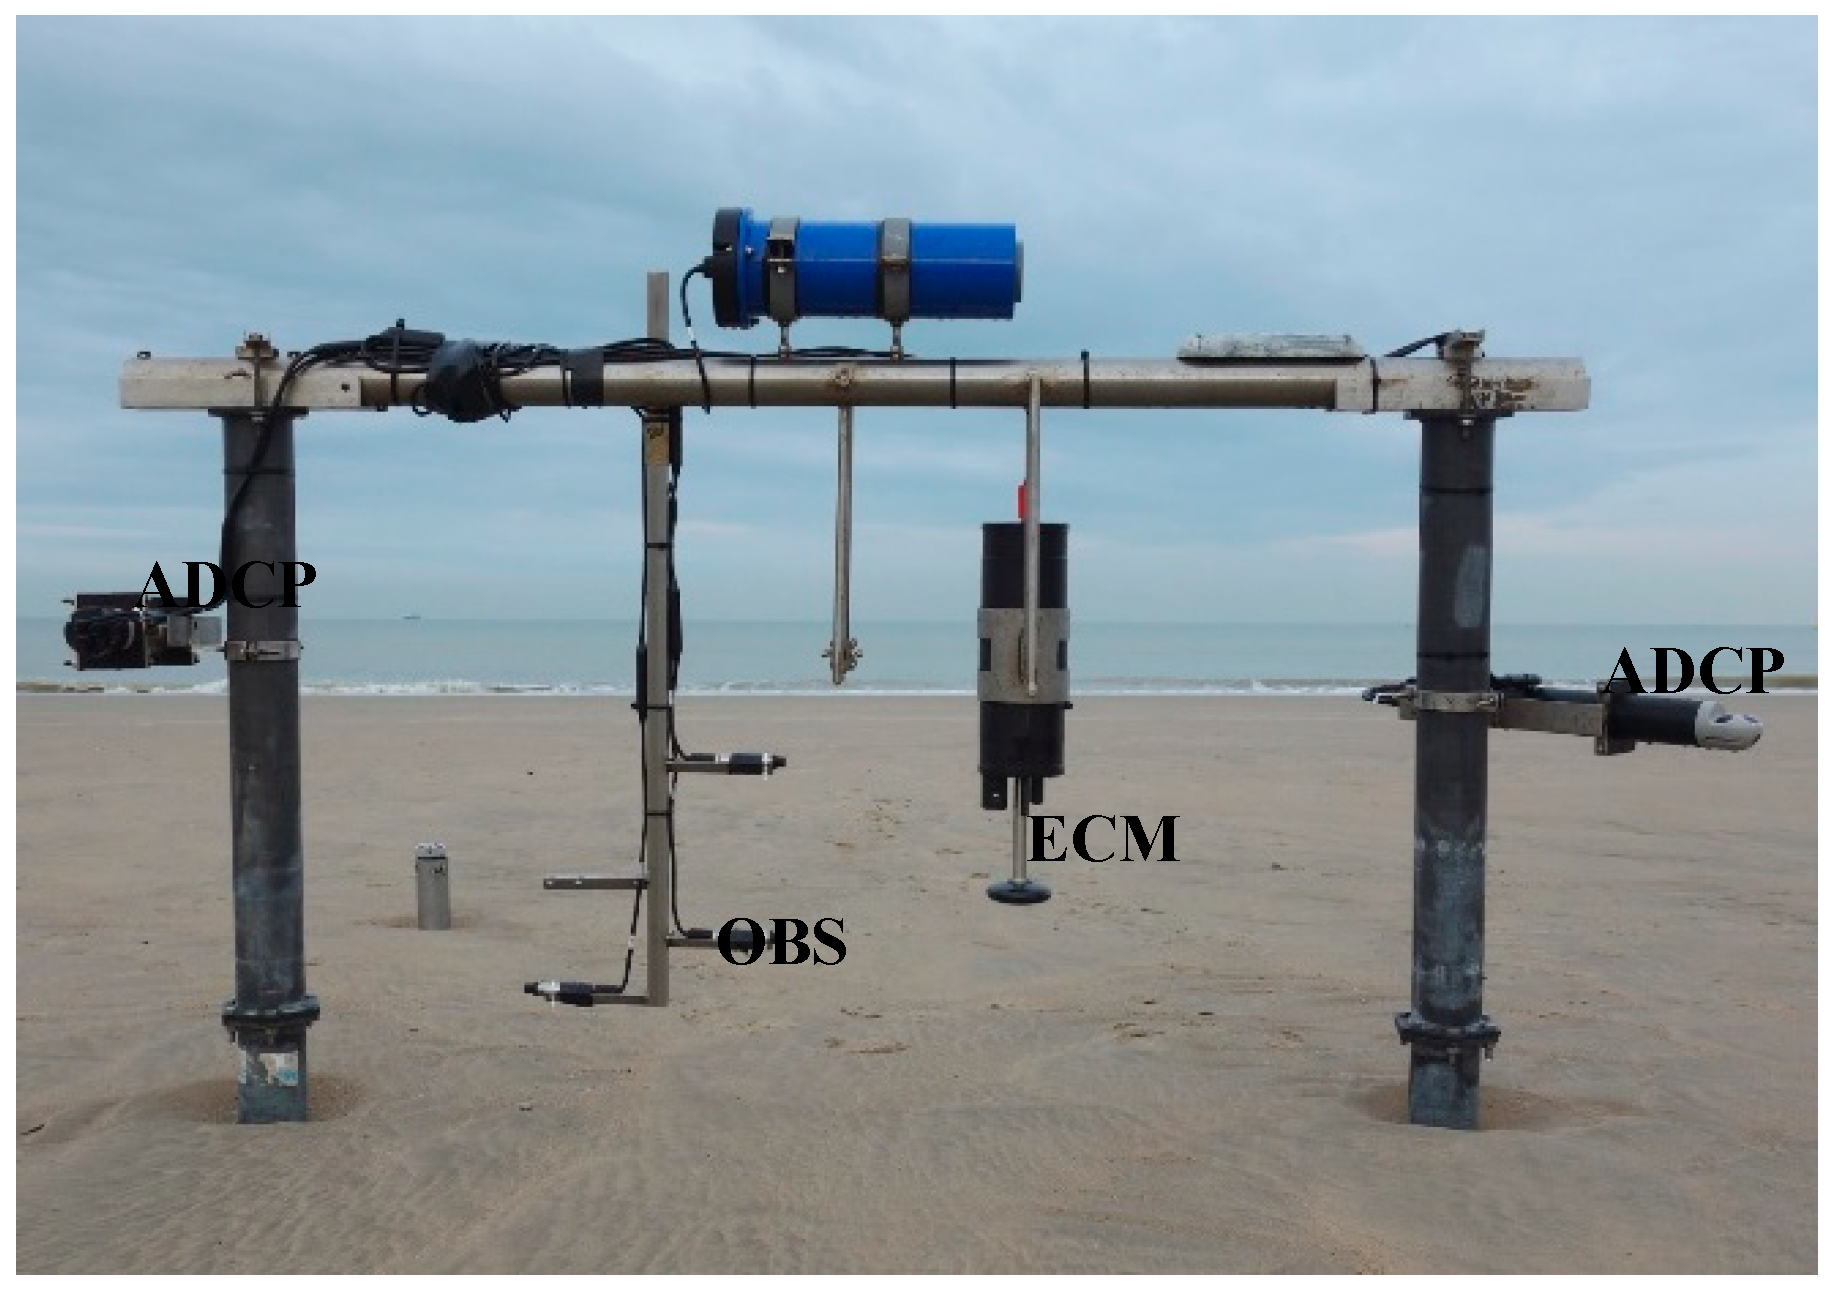
The measuring frame (Figure 2) was equipped with an Optical Backscatter point Sensor (OBS) at 35 cm above the bed to measure turbidity at a frequency of 1 Hz. Turbidity was converted to SSC based on a calibration with in-situ samples (Appendix A). Furthermore, two Acoustic Doppler Current Profilers (ADCPs, Aquadopp model) measured profiles of flow velocity with a 5-cm interval. One was mounted looking up 50 cm above the bed and measured at 1 Hz and the other was looking down 60 cm above the bed and measured at 4 Hz. Additionally, an Electromagnetic Current Meter (ECM) was mounted 50 cm above the bed. This sensor measured flow velocity and pressure at 8 Hz for 1 min, every 10 min, from which the significant wave height and period were calculated as the mean wave height/period (trough to crest) of the highest one-third of the waves. This was done over periods of 30 min to exclude the effect of wave groups.
The data were treated by removal of the obvious outliers and readings when the equipment was exposed to the air. The tidal water level was extracted from the water level measurements from the ECM with a least squares harmonic analysis [36]. The daily maximum tidal water level was determined. From the wave measurements wave steepness was calculated as:
W a v e   s t e e p n e s s = H / L ,
where H is wave height and L is wave length. Wave length was calculated with the dispersion equation or shallow water approximations depending on the water depth and wave height (Lshallow was used when h/L < 0.05), as waves are transformed when arriving in shallower water:
L = g T 2 tanh ( 2 π h / L ) / 2 π
L s h a l l o w = T g h ,
where h is the water level, g is the gravitational acceleration, and T is the wave period [37]. In this study, significant wave period (Tsig) and height (Hsig) were used. Wave direction and wind conditions were acquired from a wave buoy at ‒8 m TAW (Raversijde, 1 km from Mariakerke) and wind station (Oostende) from Meetnet Vlaamse Banken (Figure 1).

2.4. Measurements of Beach Topography

The beach topography was measured once per day during low tide. Five cross-shore profiles were surveyed: one central profile (b), two profiles at 25 m from the central profile (b1 and b2), and two distant profiles 75 m from the central profile (a and c, Figure 1). At Mariakerke, profiles a and c were 75 m away from groynes that bounded the study area at each side. The topography was measured with a Real-Time Kinematic Global Navigation Satellite System (RTK-GNSS), which has an accuracy of 2‒3 cm for the x, y, and z coordinates combined.
The volume of the intertidal beach was calculated from the topographic profiles. The intertidal beach was defined as the area between mean high water (MHW, + 4.39 m TAW) and MLW. Volumes were calculated for each profile separately using trapezoidal rules. The volumes of all profiles (a, b1, b, b2, and c) were averaged and daily volume changes were calculated. Due to poor RTK-GNSS signal or deviation of the measurements from the planned profile lines, volumes are lacking for approximately three days from each campaign.

2.5. Relating Forcing and Response: Principal Component Analysis

A PCA was applied to determine the common variation of multiple marine forcing factors and topographic change. This method has previously been applied successfully in coastal research to identify forcing factors for morphological changes [38,39,40]. A PCA was applied on wave steepness, maximum tidal water level, and current direction to determine which factor, waves or tide, predominantly determined the main current direction. Furthermore, a PCA was applied on wave steepness, wave direction, maximum tidal water level, SSC, and intertidal beach volume change, to investigate the relationship between marine forcing and topographic response. SSC served as a proxy for the natural sediment supply, because the majority of the suspended sediment is brought to the beach from the nearshore, as will be shown in the results (Section 3.1.2). Principal components were calculated and the correlations between each principal component, the forcing factors, and the topographic response were computed. In this study correlations above 0.5 were deemed relevant, and correlations between 0.3 and 0.5 were also considered.

3. Results

3.1. Hydrodynamics and Suspended Sediment Concentrations

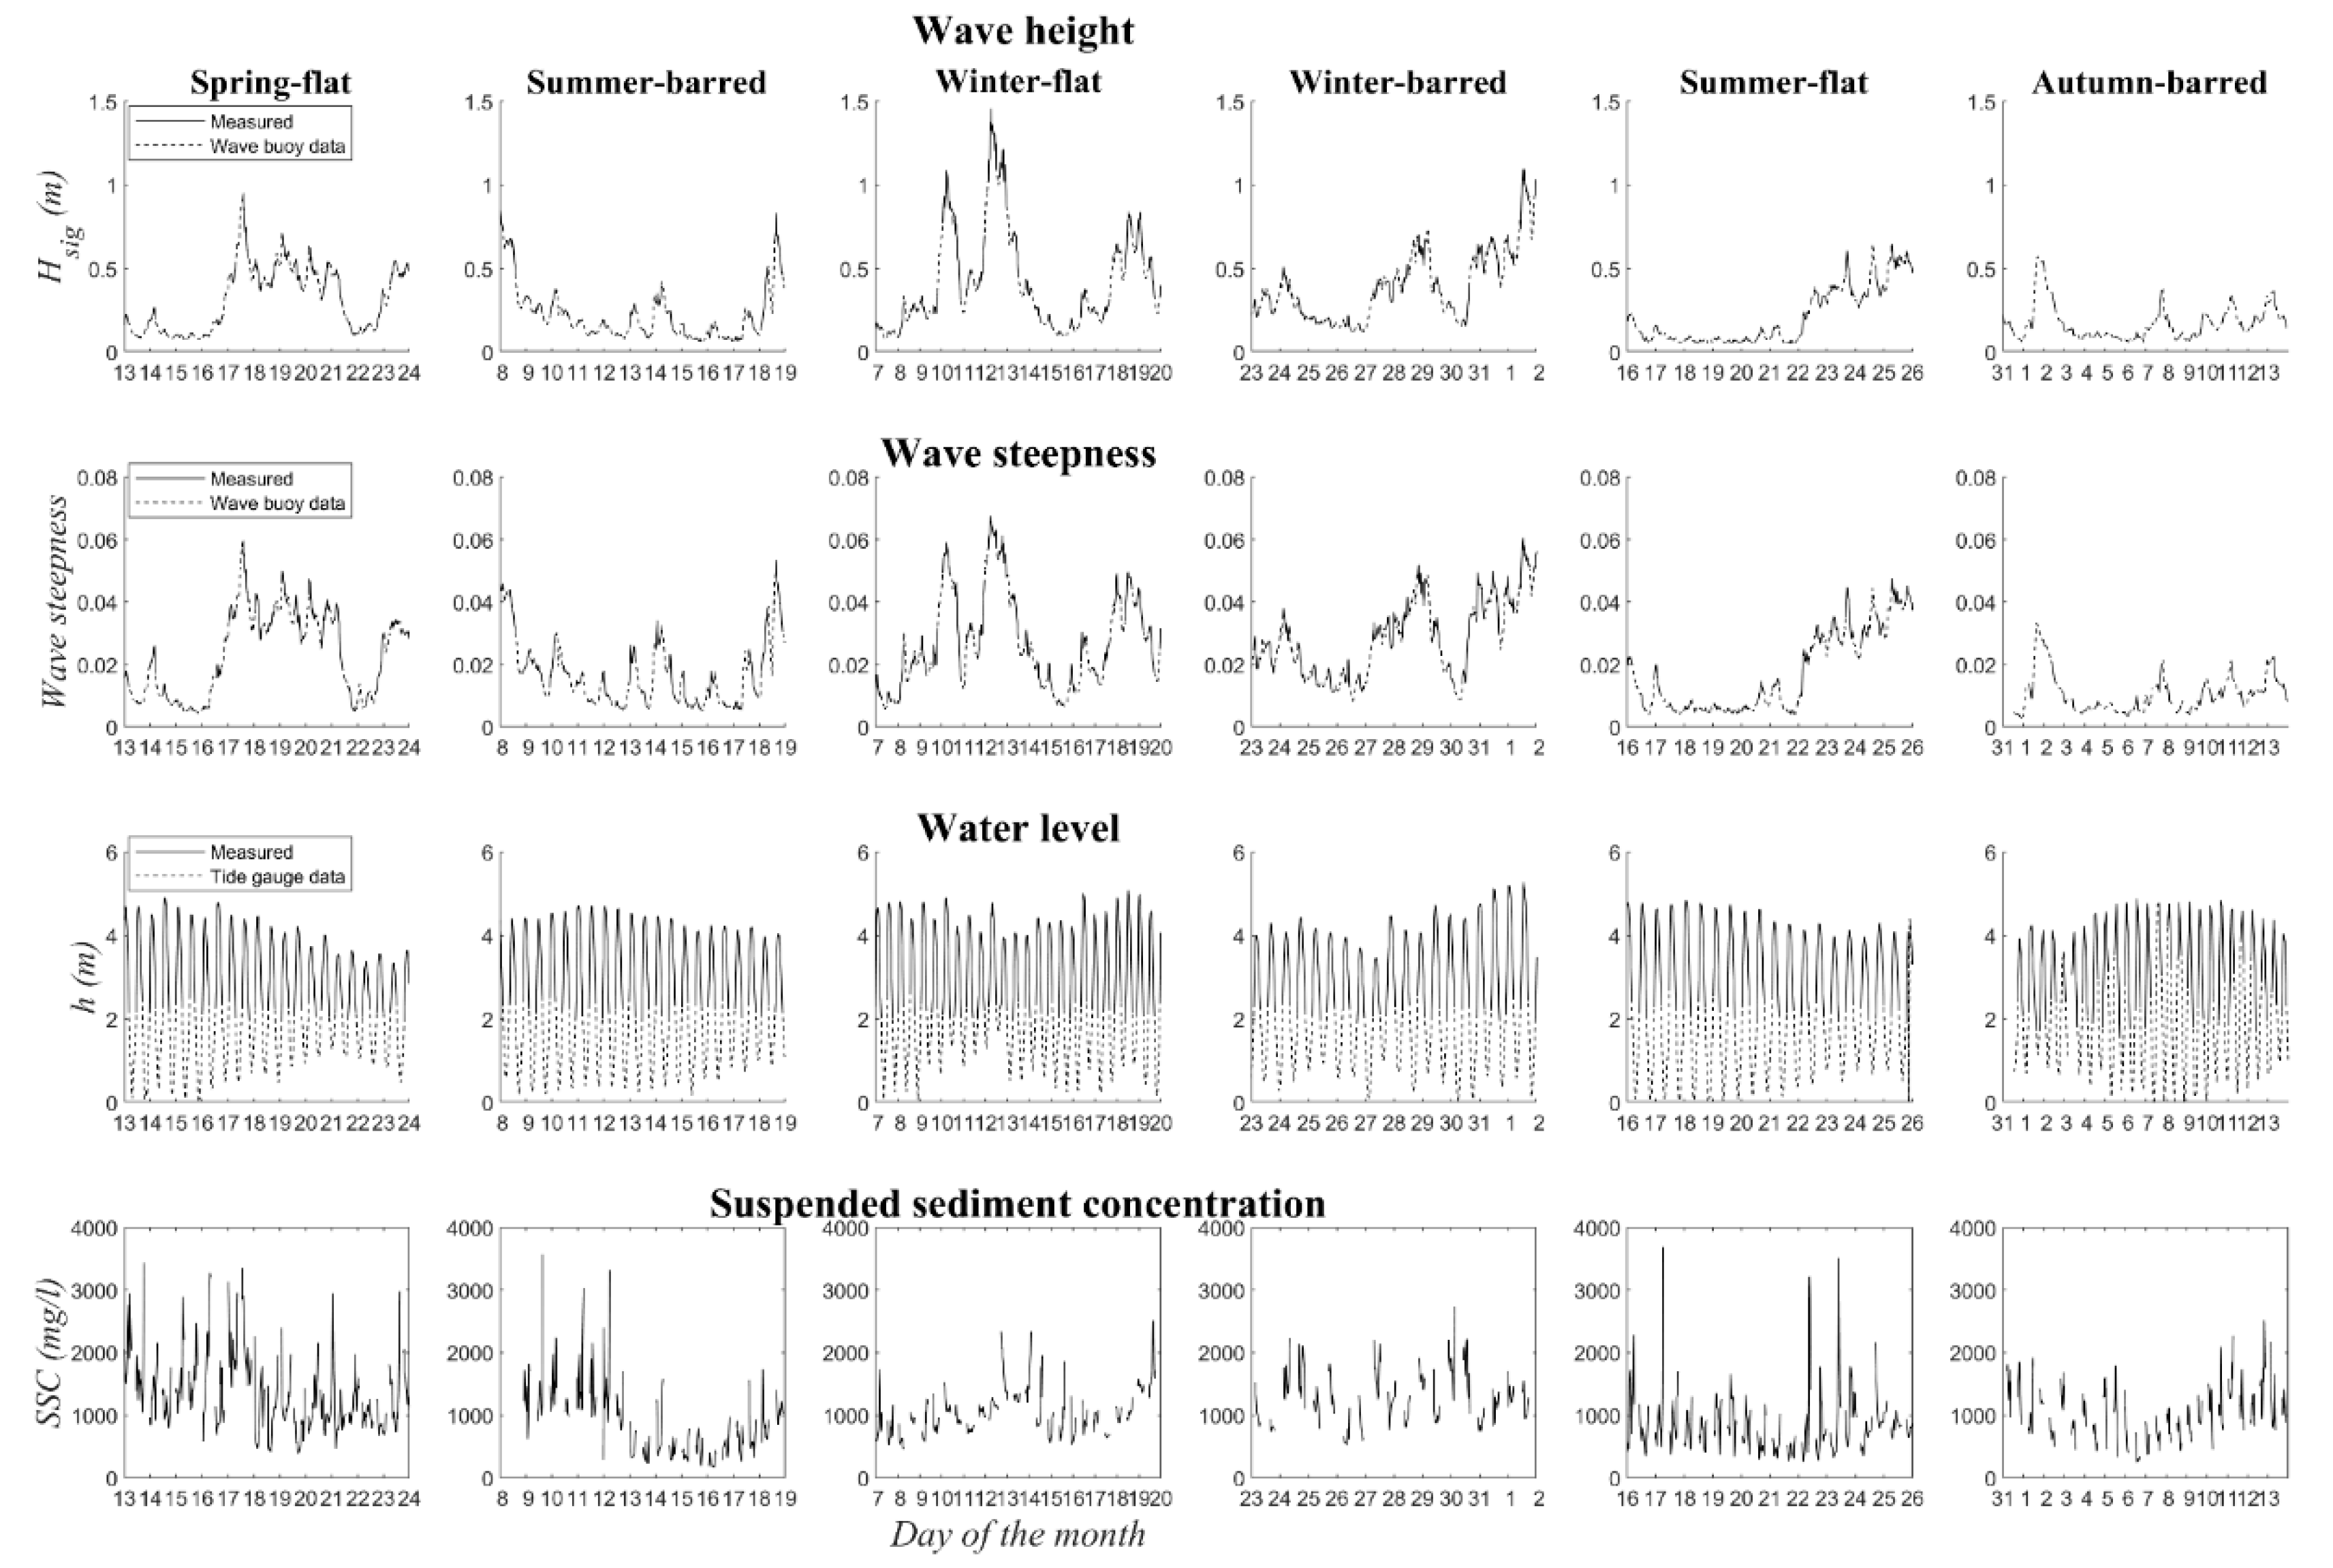
The investigated hydrodynamics covered a wide variety of conditions over the six campaigns (Figure 3 and Table 2). The wave conditions were calm during the Summer—barred and Summer—flat campaigns, with an average wave height of 0.22 m and 0.21 m, respectively, and an average wave steepness of 0.018. The conditions were more energetic during the other campaigns, especially during the Winter—flat campaign when peaks in wave height (steepness) reached 1.46 m (0.068). The average wave period over all campaigns was 3.7 s, with a minimum of 2.2 s and a maximum of 6.1 s. The offshore wave direction was W to NNW, varying between 260° and 340°. The wind conditions showed a similar pattern as the waves, with strong winds generating large waves. Wind speeds varied between 3 and 12 m/s and the direction between S (85°) and NW (325°).
The water level showed clear spring-neap tidal variations during all the campaigns (Figure 3). [32] defined a storm threshold for water level of 5 m TAW. This threshold was exceeded twice during the Winter—flat campaign and three times during the Winter—barred campaign. The highest water level was observed during the Winter—barred campaign, when a peak in water level reached 5.28 m TAW.
The 30-minute-averaged SSC ranged from 200 mg/L up to 3500 mg/L (Figure 3). During the Spring—flat campaign the SSC started high (around 2000 mg/L), while waves were only 0.1‒0.3 m, but this most likely resulted from the disposal of dredged material southwest of Mariakerke on 13 March (visual observations during the measurements). A thorough investigation of the high-frequency sediment transport and flow profile over the water column can be found in [22].
The occurrence of calm versus strong waves and neap versus spring tide during the campaigns is summarized in Table 3. A wave steepness of 0.013 is used as the theoretical boundary for strong waves as defined by [30]. All conditions are covered, but calm hydrodynamic conditions (neap tide and low waves) are less common than energetic conditions (spring tide and large waves).

3.1.1. Current Direction

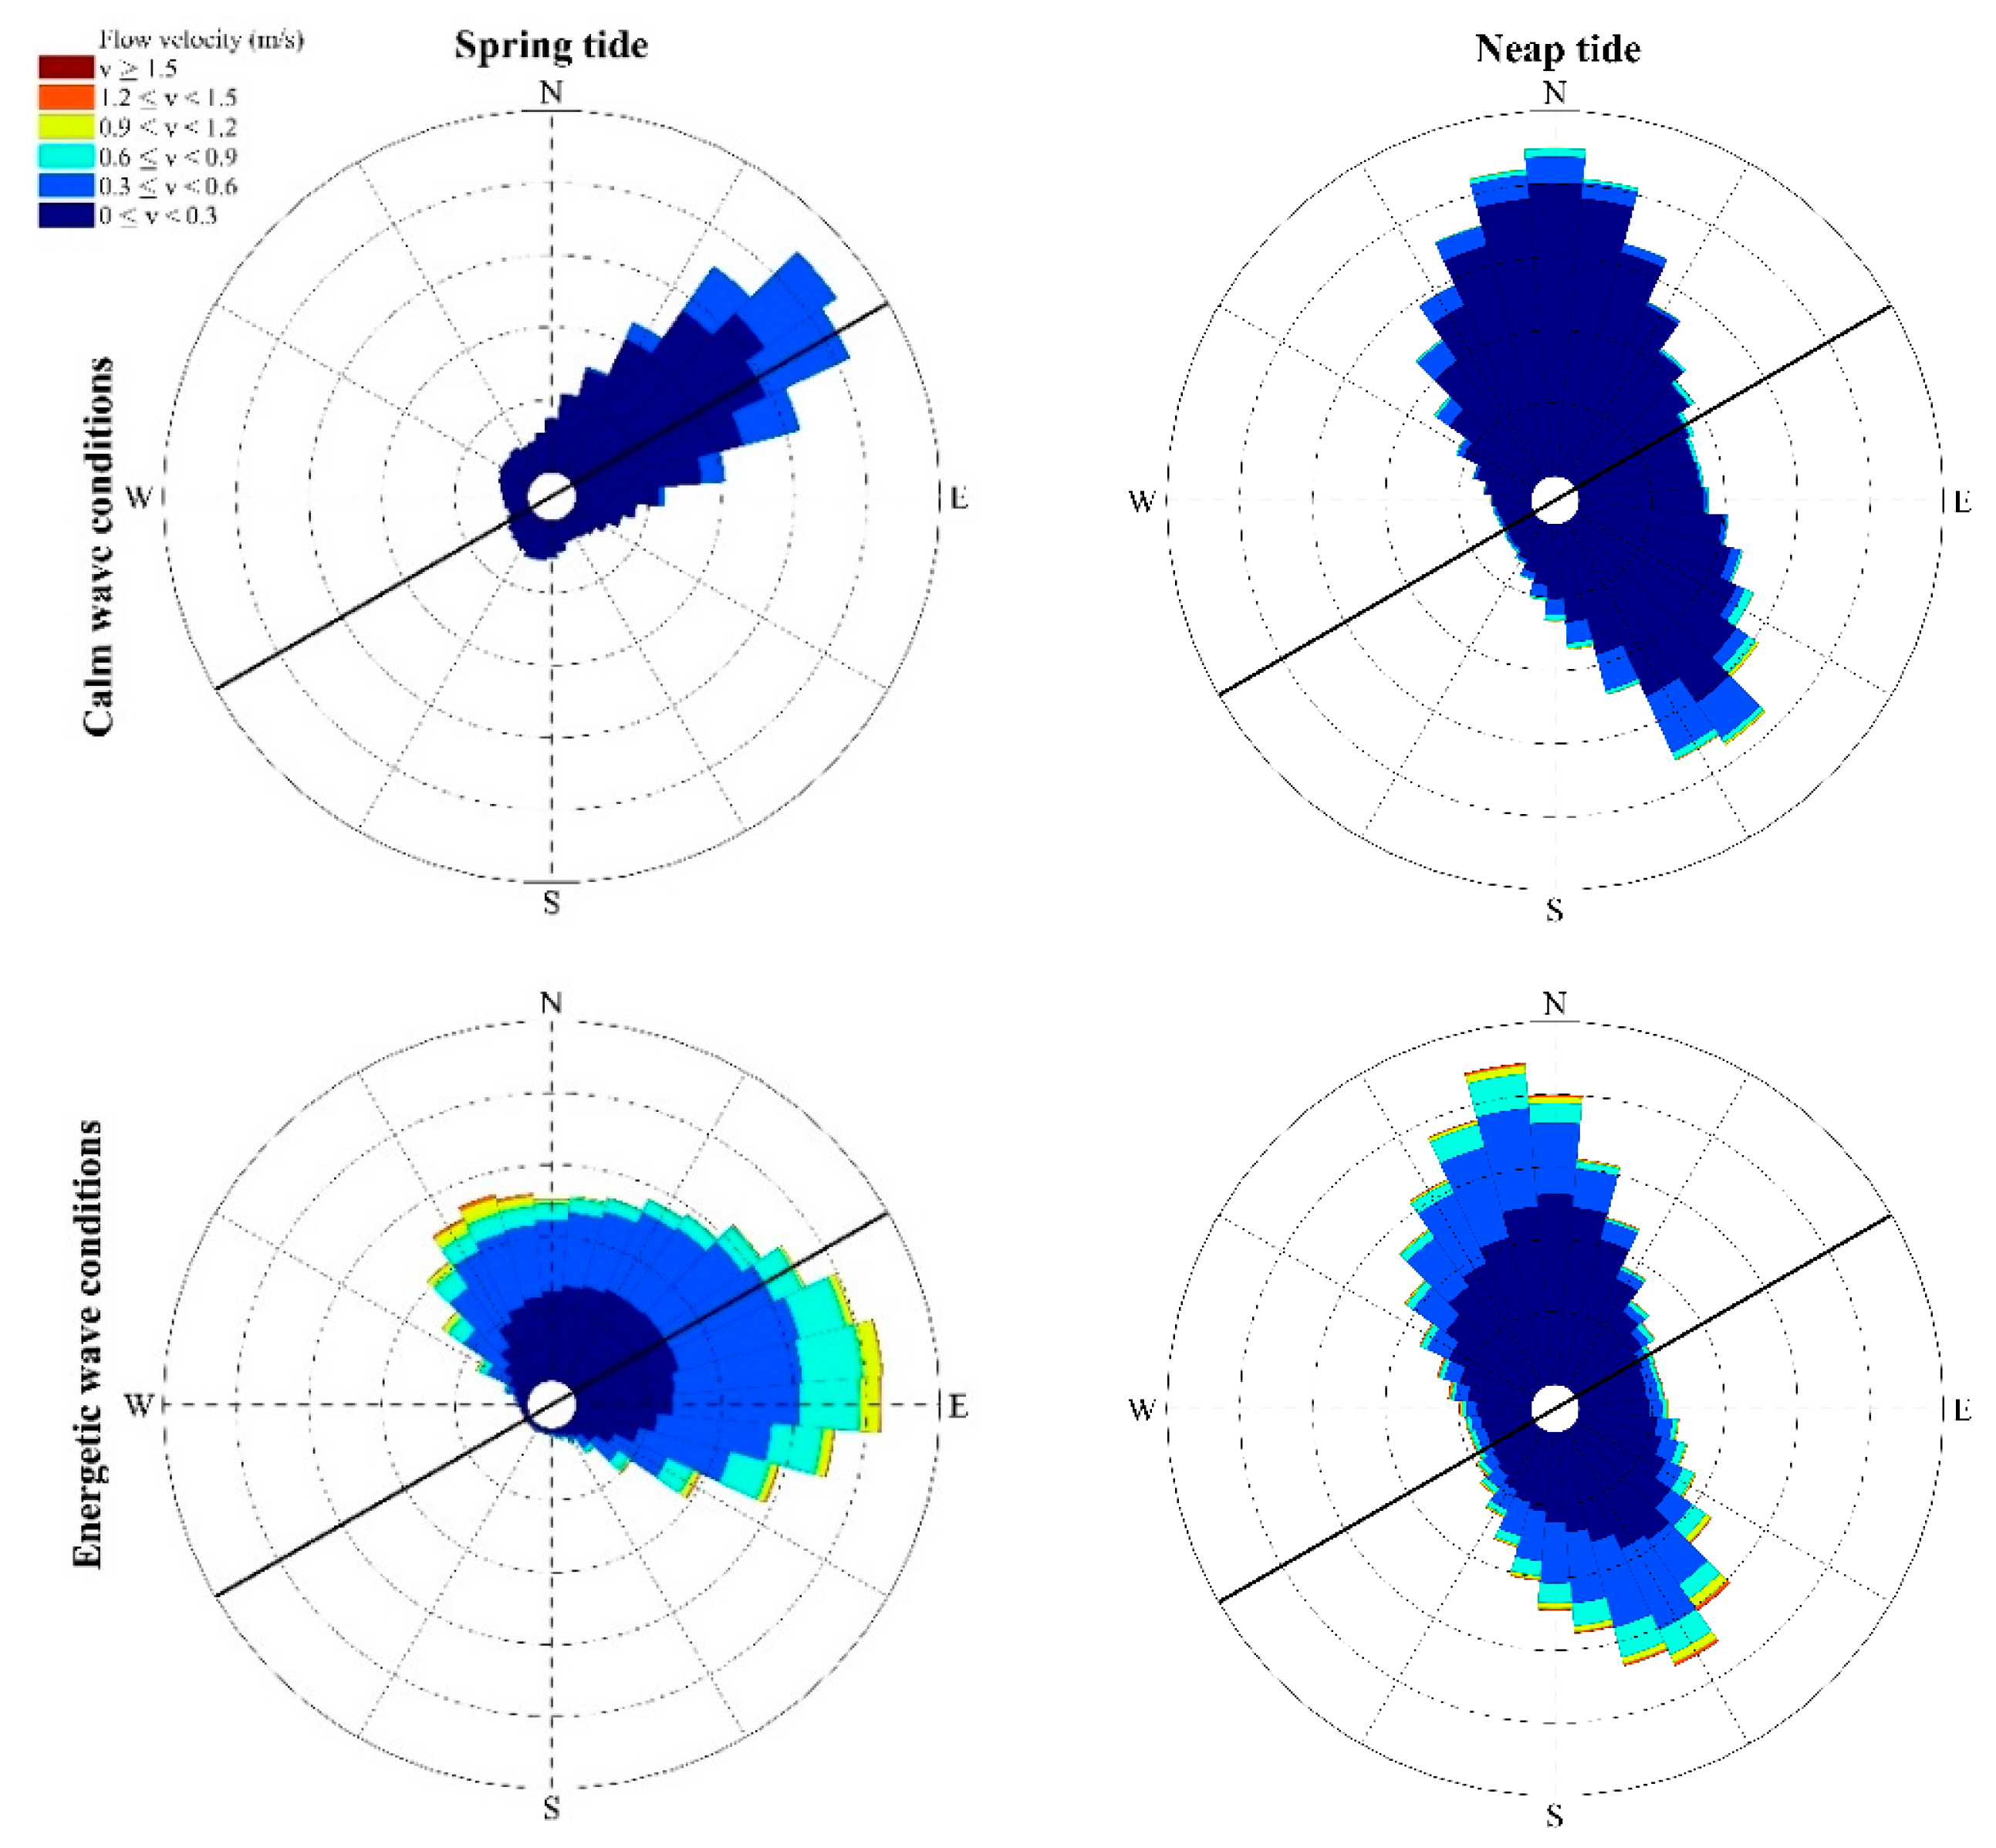
Figure 4 shows four typical current roses for spring and neap tidal cycles under calm and strong wave conditions. During spring tide (left panels) the alongshore oriented tide-generated currents dominated, whereas during neap tide (right panels) cross-shore oriented wave-generated currents were dominant. Besides the effect of tide, the wave conditions also influenced the current direction with more cross-shore oriented currents when waves were strong (bottom panels). The observations at 35 cm above the bottom were representative for the water column, except that seaward currents were stronger close to the bottom, whereas shoreward currents were stronger in the water column as a result of wave action.
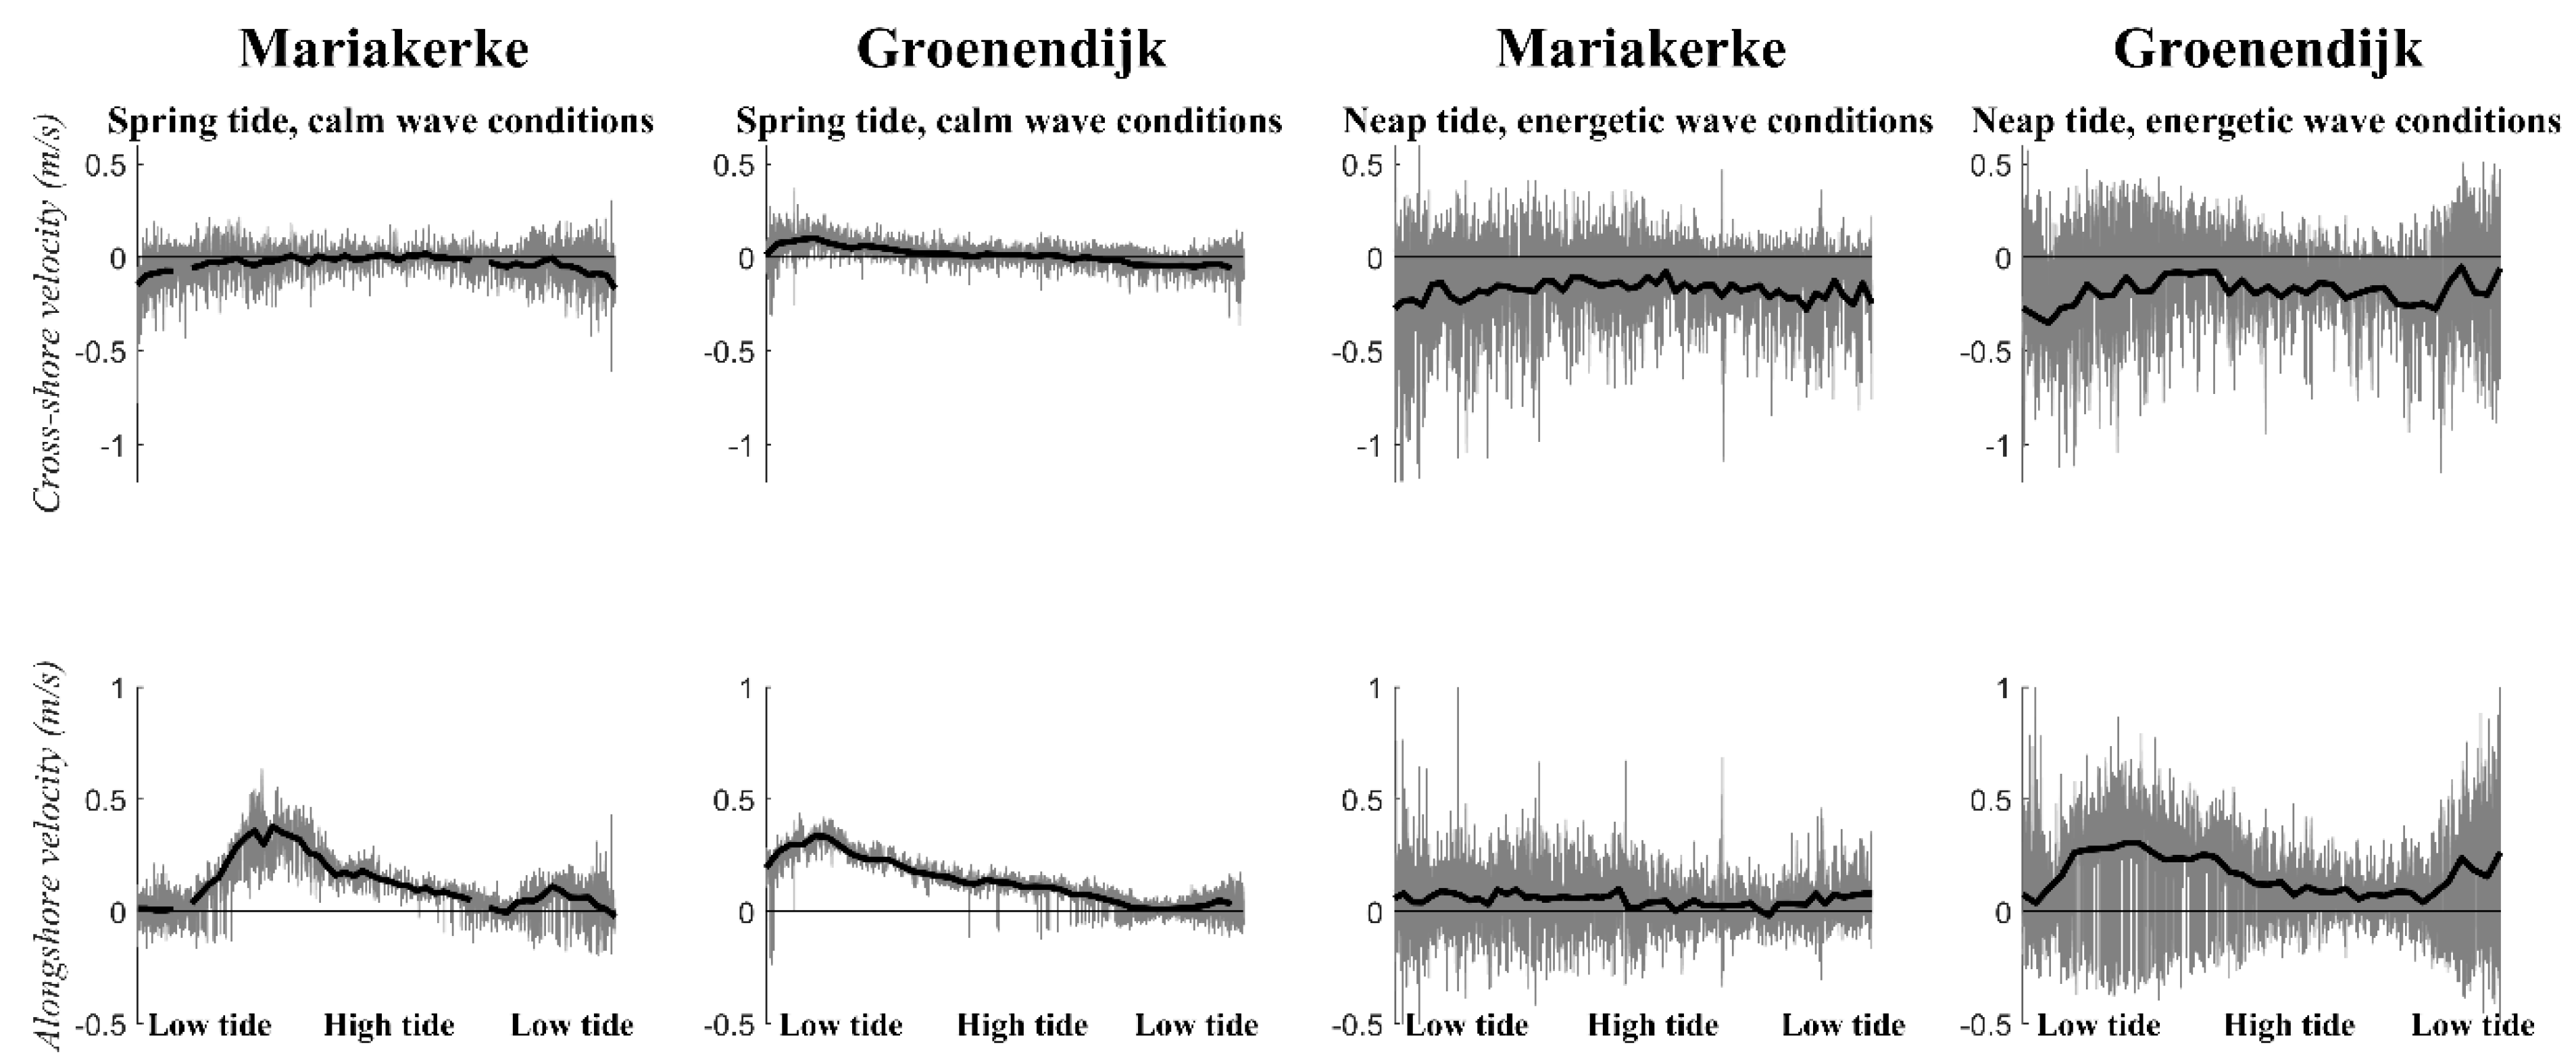
The alongshore currents were especially strong during the flood phase with an average speed up to 0.4 m/s (35 cm above the bed, Figure 5). During the ebb phase the average alongshore current was almost zero at the low water line. Fluctuations in the alongshore current were mainly observed when the waves were strong as a result of waves, especially during low tide when waves were breaking near the frame (Figure 5, bottom panels). The difference in alongshore flow velocity between spring and neap tide was large at Mariakerke, while it was small at Groenendijk. This contrast may be explained by the groynes at Mariakerke, which likely affect the current pattern or the larger flow section (wider intertidal beach) at Groenendijk.
The 10-min averaged cross-shore oriented current was almost zero when wave conditions were calm, whereas it was 0.2 m/s and seaward oriented when waves were strong. The current velocity was measured at 35 cm above the bed and because the measurements represent processes in the shoaling and breaking zone the current direction is away from the shore as a result of undertow. The fluctuations in cross-shore flow velocity were much larger when waves were strong than when they were calm as a result of waves.
A PCA was applied to assess the effect of waves and tide on the current pattern. The analysis included the dominant current direction, maximum tidal water level, and wave steepness. The PCA shows that the dominant current direction, wave steepness, and maximum tidal water level are all strongly correlated to the first principal component (Table 4). The current direction becomes more positive, thus more alongshore (NE) oriented, when it is spring tide and when wave conditions are calm. They become cross-shore oriented during neap tide and when waves are strong. The PCA shows that both waves and tide influence the current direction equivalently.

3.1.2. Natural Sediment Supply to the Beach

Tidally averaged SSC were compared to wave steepness (Figure 6, left panel) and it appears that SSC increased fast when wave steepness was small (< 0.025, with a linear relationship with an R2 of 0.40 and a p-value of 6.22e-5). When wave steepness exceeded 0.025 the increase in SSC over wave steepness declined with 70%, but they were still linearly related (R2 of 0.13 and a p-value of 0.07). From the right panel of Figure 6 it becomes clear that wave steepness and SSC indeed follow a similar pattern, but that SSC are often lagged in time. Peaks in wave steepness and SSC sometimes coincide (e.g., Winter—flat), but on average there is a time lag of 1.3 tidal cycles. At the start of the Spring—flat campaign the SSC was large even though wave conditions were calm. This was however explained by a disposal of sediment that happened on 13 March southwest of Mariakerke. Based on this time lag between wave steepness and SSC it can be assumed that most of the suspended sediment was not locally eroded but supplied to the beach from elsewhere, which is in agreement to the findings of [30]. Because of this, SSC will be used as a proxy for the amount of sediment supplied to the beach from now on.

3.2. Beach Topography

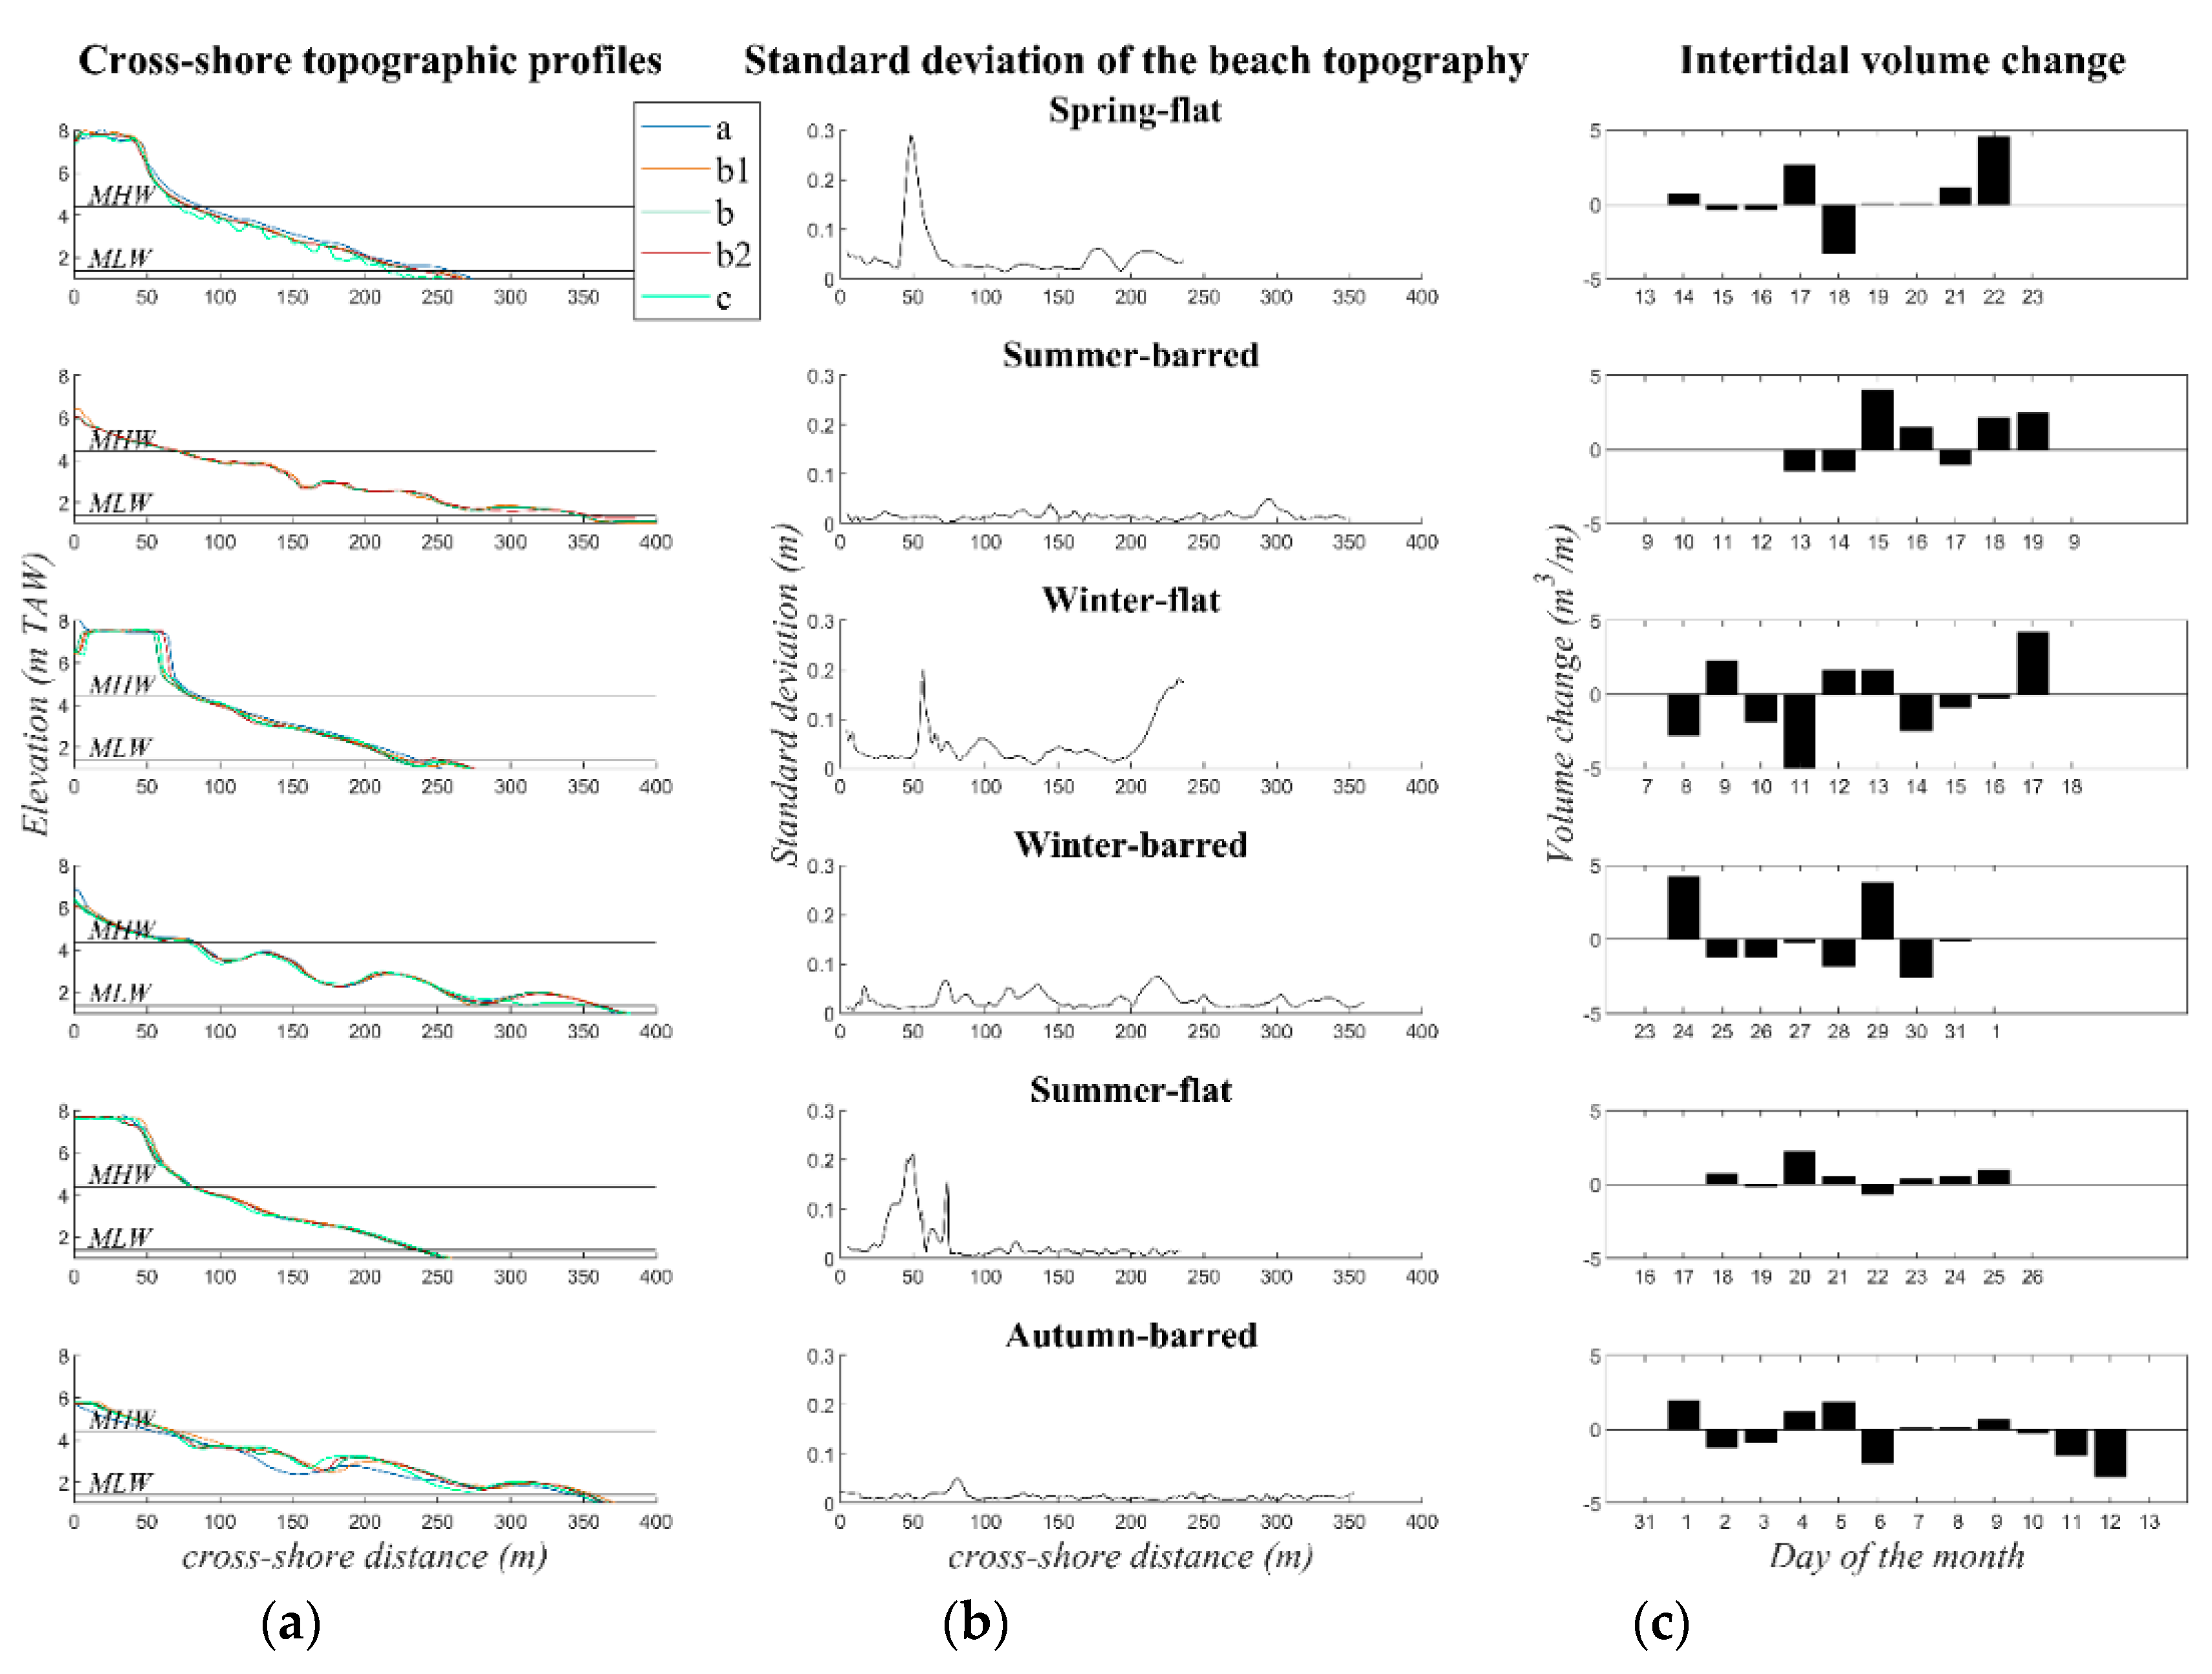
The topography of five cross-shore profiles (Figure 1) was measured every day at low tide (Figure 7, left panels). At Mariakerke, the profile shape was concave with a gently sloping, featureless intertidal beach (i.e., absence of bars and/or a berm). The highest part of the dry beach (> 7 m TAW) was relatively flat but a steep slope was located 50 m from the dike. The standard deviation of the beach topography was highest around this steep slope. At Groenendijk, the intertidal beach was characterized by four intertidal bars located 3.8, 2.8, 1.8, and 0.9 m TAW.
The standard deviation of the daily topographic change in the intertidal zone was in the order of 1–20 cm (Figure 7, middle panels) and daily intertidal beach volume changes were large with peaks up to 5 m3/m (Figure 7, right panels). Accretion was observed during the Summer—barred (+6.19 m3/m in total), Spring—flat (+5.23 m3/m in total), and Summer—flat (+4.49 m3/m in total) campaigns. Little net change was observed over the Winter—barred campaign (+1.09 m3/m in total), although the standard deviation of the beach topography was high (up to 8 cm), especially at the bars. Net erosion was observed during the Winter—flat campaign (‒3.28 m3/m in total), with the most erosion occurring on 11 November. At Groenendijk, the bars were flattened and migrated onshore during calm conditions (Summer—barred, Autumn—barred), whereas they became steeper during energetic conditions (Winter—barred), similar to the findings of [41].

3.3. The Relation between Hydrodynamics, Suspended Sediment Concentration, and Beach Topography

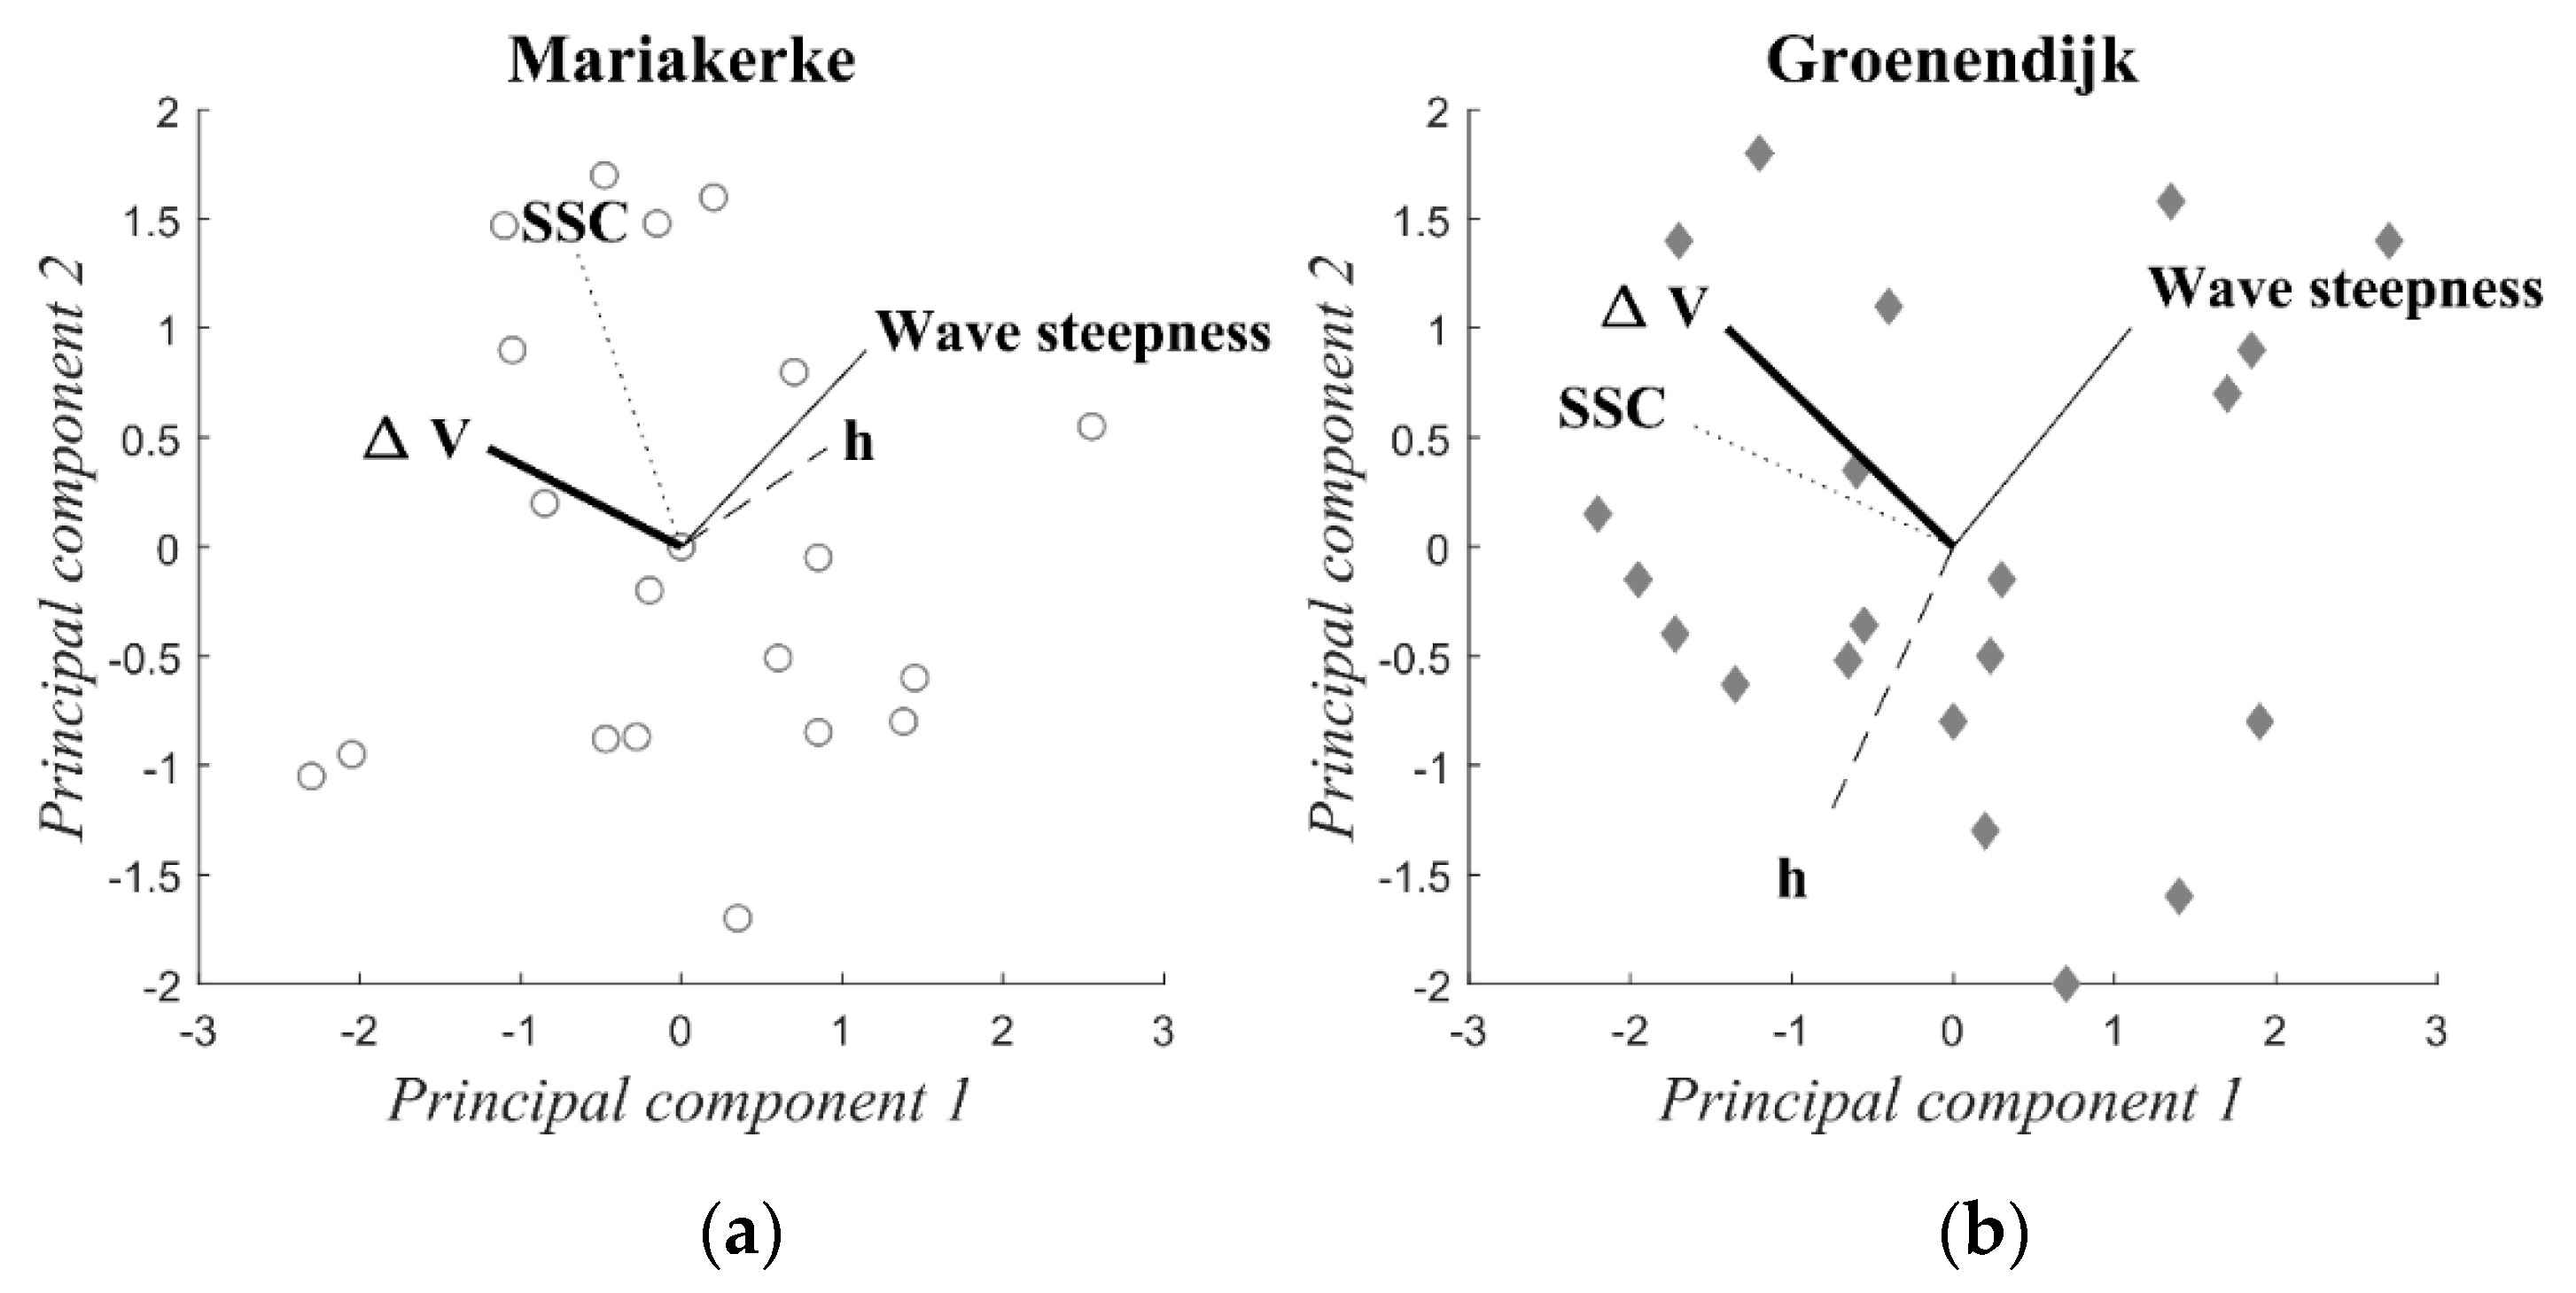
A PCA was applied to investigate the intertidal beach morphodynamics at Mariakerke and Groenendijk. The correlations between intertidal beach volume, wave steepness, offshore wave direction, maximum tidal water level, SSC (a proxy for natural sediment supply), and each principal component were calculated. PCAs were also carried out using wave height and wave energy instead of wave steepness, but the obtained relationships were strongest using wave steepness. Wave direction was not related to any of the variables, including the intertidal beach volume, and therefore the final PCA was applied without considering wave direction. In Table 5 and Figure 8, the first two principal components of the PCA are presented. The first principal component accounts for 36%–51% of the variance and the second accounts for 28% of the variance.
The first principal component explains most of the topographic change observed in the intertidal zone. For both sites the beach volume decreases when the wave steepness increases and/or when the natural sediment supply decreases, and vice versa. At Mariakerke, the first principal component also shows that the beach erodes (the volume decreases) when the maximum water level is large. At Groenendijk, the maximum water level is not related to the first principal component.
The second principal component mainly shows the relation between sediment supply and wave steepness. SSC increases along with wave steepness (as illustrated in Figure 6). Besides wave steepness and SSC, the second principal component is highly correlated to the intertidal beach volume and the water level at Groenendijk. This shows that the intertidal beach volume decreases when the tidal range increases, similar to the tidal influence that was described by the first principal component at Mariakerke. The second principal component also shows that the beach volume increases when wave steepness and thus sediment supply increases.
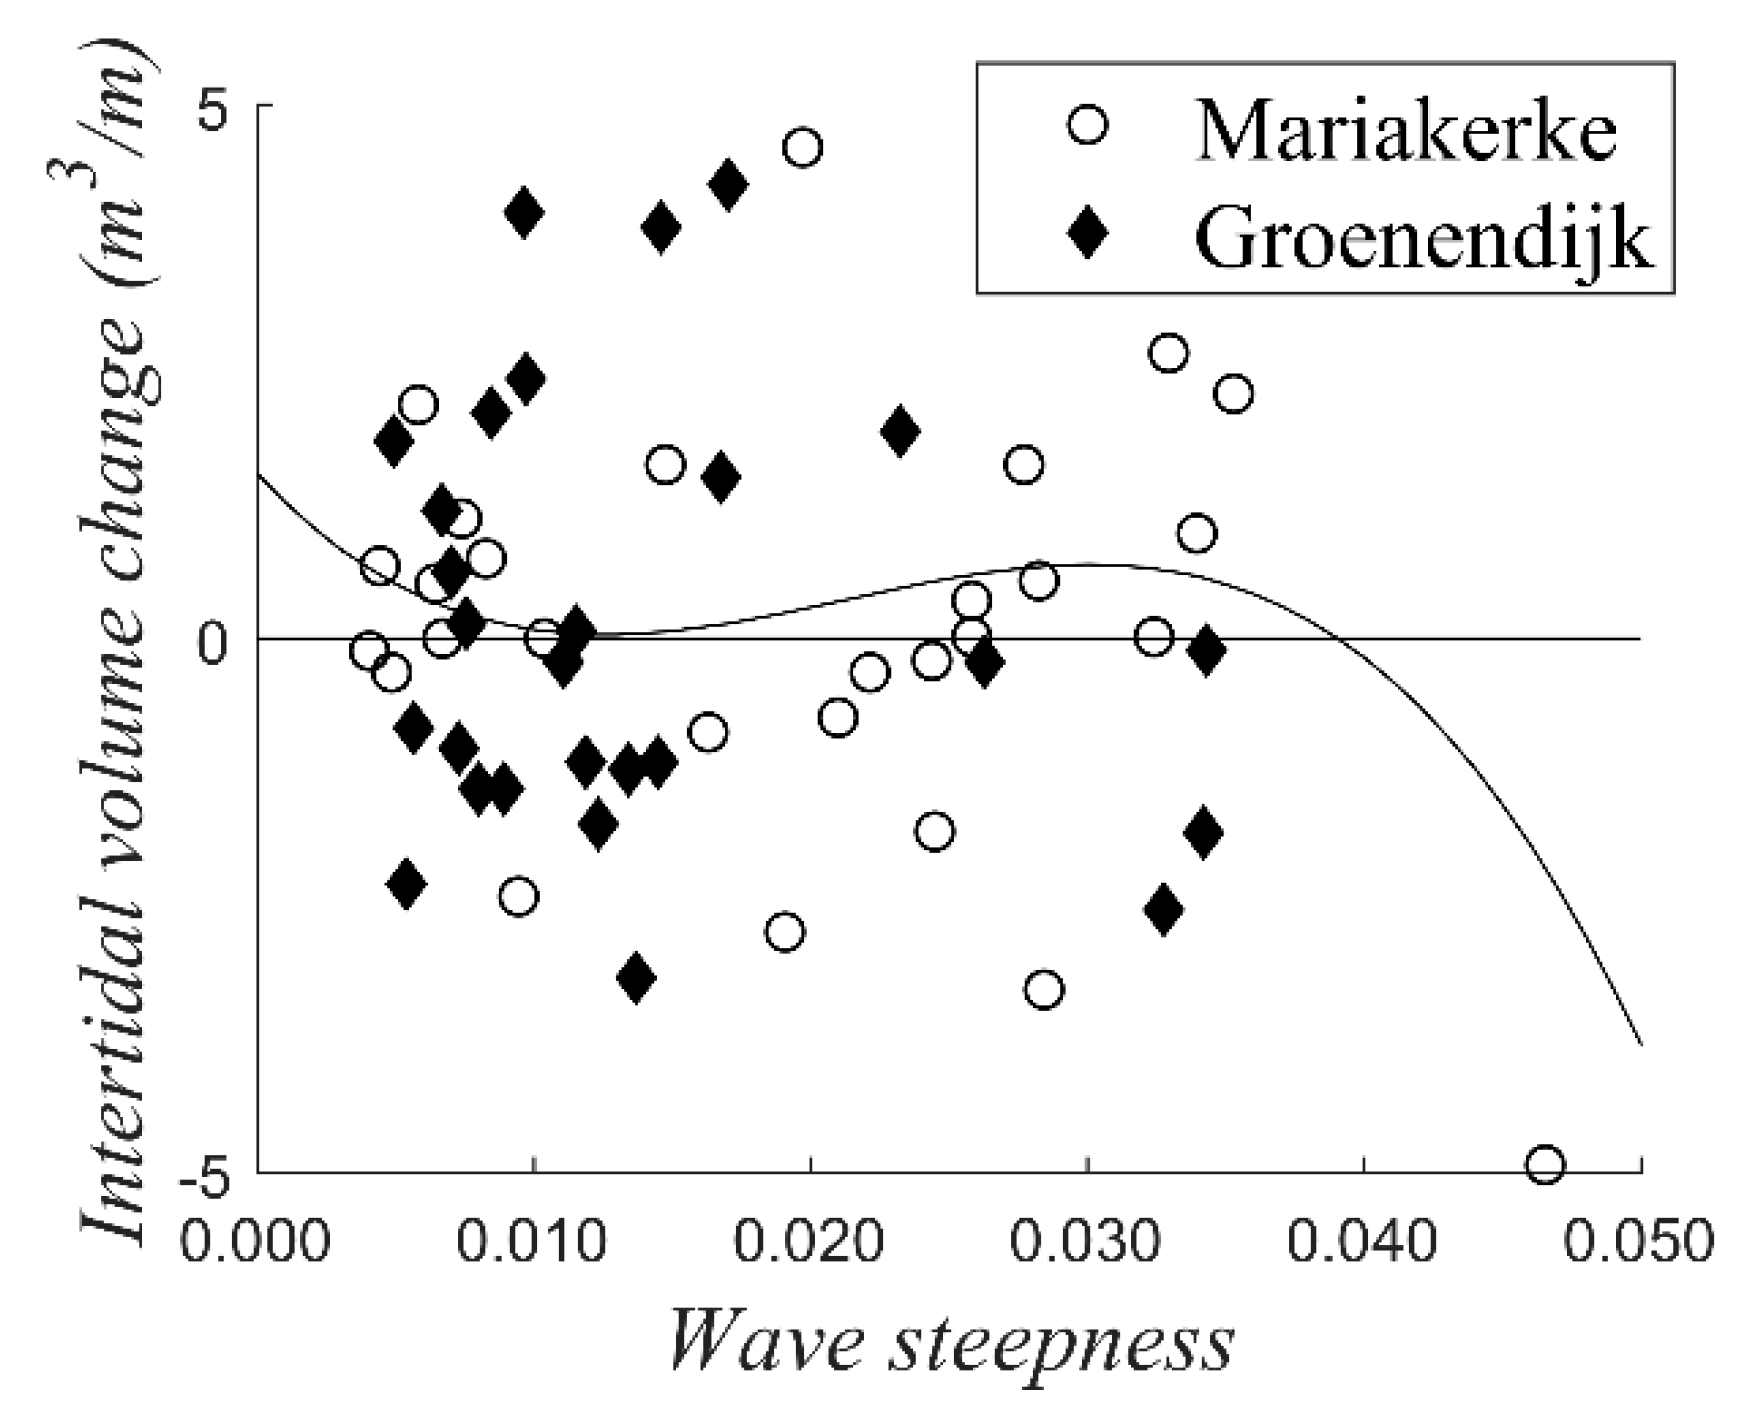
The intertidal beach thus erodes when wave steepness is large, sediment supply is limited, and when the tidal range is large, while the beach grows under opposite conditions. However, the effect of wave steepness is twofold: on the one hand, large waves erode the intertidal zone, while on the other hand large waves result in an increase in sediment supply and thus in beach growth. Intertidal beach volume changes and wave steepness are compared in Figure 9. A third-order polynomial relationship was fitted based on [30]. The relationship is rather weak and characterized by substantial scatter that can largely be attributed to the tidal range. However, it shows that the intertidal beach volume increases for a wave steepness between 0.010 and 0.030. This is similar to the range for which SSC increases over wave steepness.
Two differences in intertidal beach morphodynamics were observed between the developed beach of Mariakerke and the barred beach of Groenendijk. At Mariakerke the effect of tide is stronger than at Groenendijk, which is most likely due to the groynes that influence the tidal currents. At Groenendijk the effect of variations in sediment supply is larger than at Mariakerke. This is in agreement with previous studies that showed the large impact of natural sediment supply at Groenendijk [34,35]. In spite of these differences, the PCA results for both Mariakerke and Groenendijk are very similar. Although there are obvious differences in beach morphology between Groenendijk and Mariakerke, both beaches are classified as dissipative [35], which probably explains their comparable behavior.

4. Discussion

Wave steepness and tidal conditions are the main drivers for topographic change based on the PCA. The beach response to wave steepness is similar to previous studies with accretion for small and erosion for large wave steepness [5,6,42]. Strong erosion was observed under high water levels before, but this mainly concerned storm surges instead of tidal variations in water level [32]. Only few studies identified the tide as a driver for topographic change, especially for alongshore transport of bedforms [18,20].

4.1. Effect of Tide on the Beach Topography

4.1.1. Relative Tidal Range

A possible effect of tidal range on beach topography has been described by [19]. They argued that tidal range and wave height determine the relative importance of swash, surf zone, and shoaling wave processes, which in turn affects beach topography. Surf zone and swash conditions prevail in the intertidal zone when the relative tidal range (tidal range over wave height: TR/Hb,) is low, whereas shoaling waves prevail when the relative tidal range is high. In this study the relative tidal range varied between 1 and 22, which is a relatively large variation. However, no relation between relative tidal range and intertidal beach volume change was found. This suggests that the relative importance of wave processes is not the cause for erosion during spring tide. This is in agreement with the results of [18] for a nearby study area in Northern France.

4.1.2. Bed Shear Stress

Generally, most of the suspended sediment in the intertidal zone is locally stirred by wave-induced bed shear stress. However, strong tidal currents might also substantially contribute to bed shear stress, thus enhancing local erosion [43]. In order to determine the relative contribution of waves and tidal currents to the bed shear stress, it was calculated for tidal currents and waves separately as described in Appendix B. It was found that current-induced bed shear stress varied between 0.05 and 0.10 N/m2. This may be sufficiently large to get sediment in motion [44,45,46]. However, no significant differences in bed shear stress between spring and neap tide were observed. Additionally, the current-induced bed shear stress was small compared to the wave-induced bed shear stress. The wave-induced bed shear stress mostly varied between 2.5 and 25 N/m2. It is thus highly unlikely that tide-generated currents stirred a considerable amount of sediment and are thus not the cause of the increased erosion observed during spring tide.

4.1.3. Current Direction

Although tidal currents probably did not erode considerable amounts of sediment, they most likely did play an important role in transporting the sediment. The observed currents were wave-dominated (cross-shore) during neap tide and tide-dominated (alongshore) during spring tide (Figure 4), similar to other tide-dominated beaches [47]. At the low water line, mainly NE-directed currents were observed during spring tide, which most likely transported sediment away from the beach. This is in agreement with previous observations close to Groenendijk, where sediment transport in NE direction was observed at multiple locations across the intertidal zone based on sand tracer experiments [14] and to previous observations of a net gradient of sediment transport towards the NE along the Belgian coast [48,49,50]. The finding of sediment being transport away from the beach by tidal currents contradicts the findings of [47], who did not attribute sediment transport to tidal currents at two macro-tidal study sites in northern France. [51], on the other hand, did attribute alongshore transport of sediment stirred by waves to alongshore currents on a different study site in norther France. These disagreements are most likely due to the magnitude of the investigated currents. In this study and in [52] the current magnitude was twice (up to 0.6 m/s) the magnitude observed by [47]. Strong tide-generated currents were previously observed in the intertidal zone of macro- and megatidal beaches. It was noticed that the magnitude of these currents strongly varied over a spring-neap tidal cycle and that wave-generated currents can be subordinate to tidal currents during spring tide [18], comparable to the observations in this study. Previous studies also found that the current direction was influenced by wave direction [14,51] and wind speed [18,51]. The effect of wind speed and wave direction on the current direction was tested with the PCA, but was found to be negligible in this study. This might be due to rather constant W to NNW wave direction and the limited wind speed. In this study the maximum wind speed was 12 m/s, whereas [18] encountered wind speeds up to 15 m/s. Although strong tidal currents were observed previously, it remained unclear what their effect on the intertidal beach topography was. This was investigated in this study with PCA, from which it has become clear that the impact of tide can be large and may even be equivalent to that of waves.

4.2. Sediment Supply to the Beach

Besides wave and tidal conditions, variations in SSC were correlated to changes in intertidal beach topography. [30] stressed the importance of sediment supply from the nearshore as a driving factor for topographic change on a monthly scale. This is reaffirmed by the time lag of 1.3 tidal cycles between wave steepness and SSC that was found in this study (Figure 6, right panel). This sediment that is supplied to the beach might originate from the northern part of the French coast or the Flemish banks, as tidal currents in the nearshore area are strong [32,52], but it might also originate from the local shoreface [30,34]. The SSC increased over wave steepness until the latter reached 0.025 (Figure 6, left panel). This point coincides with the point where the positive relationship between wave steepness and intertidal beach volume becomes negative (Figure 9).

4.3. Summary of the Observed Intertidal Beach Morphodynamics

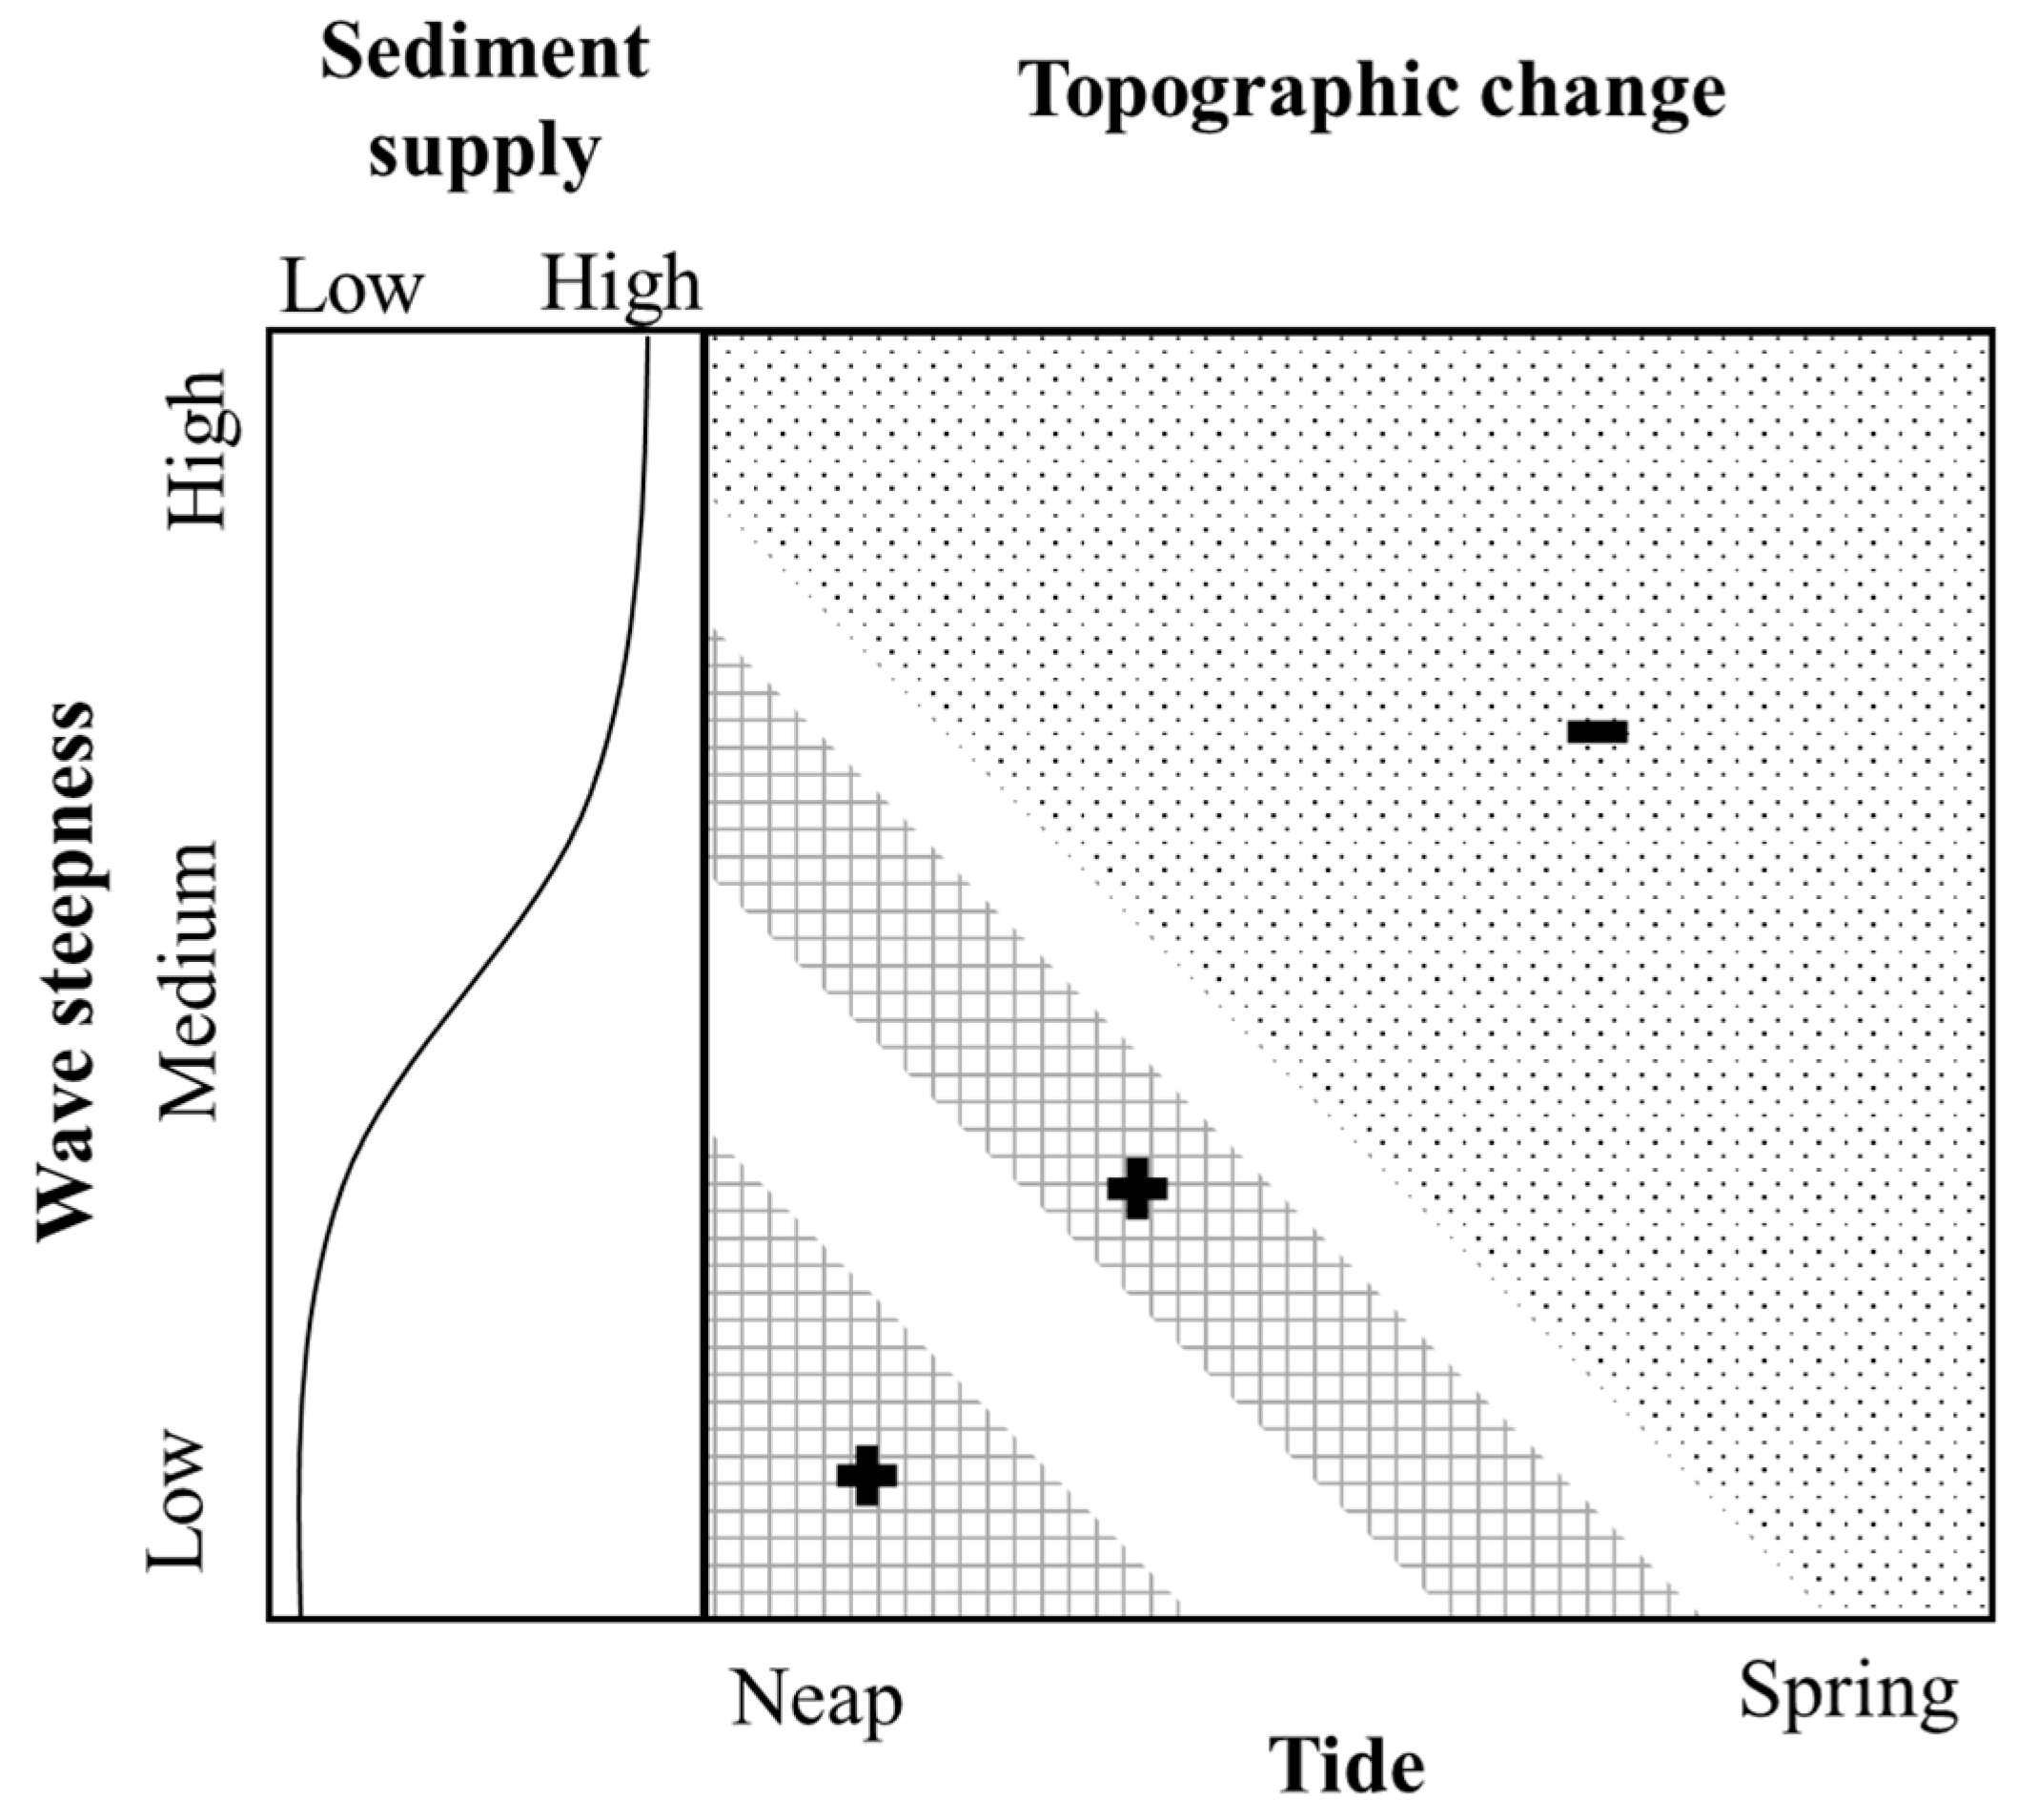
In Figure 10 the combined effect of waves, tidal conditions, and natural sediment supply on the intertidal beach topography is summarized. The beach grows when wave steepness is small, whereas it erodes when wave steepness is large. During spring tide more erosion is observed than during neap tide, because strong tide-generated currents can transport sediment away from the beach. When wave steepness is medium an increase in sediment supply to the beach is observed. This sediment supply results in accretion (or less erosion) of the intertidal beach. This study thus highlights that the optimal conditions for beach growth are calm wave conditions, neap tide, and/or a large sediment supply to the beach.
It is recognized that in situ measurements in the intertidal zone are prone to inaccuracies. For example, in this study the current direction was investigated but was only measured at the mean low water line. It was assumed that the current direction at the low water line was representative for the intertidal zone based on a study of [14], who observed rather homogeneous sediment transport (and thus current) directions across the intertidal zone at a nearby site. Furthermore, the hydrodynamics were daily averaged to compare them to the observed topographic changes, while the wave conditions and sediment supply may vary during the day. Also, only a limited number of parameters were investigated, while it is known that the relationship between hydrodynamic forcing and topographic response can be influenced by other processes, such as fluctuations in the ground water table [53]. Furthermore, the topographic changes are affected by RTK-GNSS inaccuracies and by alongshore variability in topographic change due to the relatively small amount (five) of topographic profiles [54].
However, in this study it was decided to gather a large dataset, so that inaccuracies would be averaged out. As a result, the findings of this study are in agreement with previous studies in nearby areas [14,18] and significant relationships (p-values < 0.10) between hydrodynamic forcing and topographic response were found, despite the limitations that are typical for intertidal measurements.

5. Conclusions

The relationship between hydrodynamic forcing and topographic response was investigated for two tide-dominated beaches based on extensive field measurements. The combined effect of waves, tidal currents, and sediment supply on the intertidal beach volume was investigated with a principal component analysis. With the dataset collected from six fortnight campaigns it was reaffirmed that wave steepness is an important driver for topographic change. Accretion was observed when wave steepness was small (<0.010), whereas erosion was observed when wave steepness was large (>0.010).
Besides wave impact, tidal currents also strongly influenced the intertidal beach topography. Strong alongshore tidal currents were observed during spring tide, whereas currents were cross-shore and wave-dominated during neap tide. These strong spring tidal currents were accompanied by erosion of the intertidal beach, most likely because they transport sediment that is locally eroded by waves away from the beach. Spring-neap variations in intertidal beach volume were in the same order of magnitude as wave-induced variations. Intertidal beach volume changes were also related to daily variations in natural sediment supply. Accretion was intensified when sediment supply was large. Daily variations in sediment supply were strongly related to the wave conditions, but with a time lag of 1.3 tidal cycles. The effect of waves was thus twofold: larger waves were primarily erosive, but they can also enhance the natural sediment supply to the beach. The effect of variations in sediment supply on the intertidal beach topography was subordinate to the erosive effect of wave steepness and tidal currents.
The morphodynamics of a developed site (Mariakerke) was compared to that of a natural site (Groenendijk). It was found that the groynes at the developed site enhanced the erosive effect of tidal currents. At the natural site the sediment supply to the beach was larger and the beach was more susceptible to variations in this supply than the developed site. In spite of these differences both beaches respond in a similar way to hydrodynamic forcing.
This study highlights that tide can be equally important as waves in shaping the beach topography on macrotidal beaches and that the effect of waves can be twofold: on the one hand, larger waves are primarily erosive, but on the other hand they can also play a role in beach growth through reinforced sediment supply.

Author Contributions

Conceptualization, E.B.; methodology, E.B., A.-L.M., R.H., and M.C.; software, E.B.; validation, E.B.; formal analysis, E.B.; investigation, E.B.; resources, E.B., A.-L.M., R.H., and M.C.; data curation, E.B.; writing—original draft preparation, E.B., writing—review and editing, A.-L.M., R.H., and M.C.; visualization, E.B.; supervision, A.-L.M., R.H., and M.C.; project administration, A.-L.M. and M.C.; funding acquisition, A.-L.M., R.H., and M.C. All authors have read and agreed to the published version of the manuscript.

Funding

This research was part of the CREST project, funded by the Strategic Basic Research (SBO) program of Instituut voor Innovatie door Wetenschap en Technologie (ITW), Grant Number 150028.

Acknowledgments

We wish to thank Vlaams Instituut voor Zeeonderzoek (VLIZ) and Flanders Hydraulics Research (FHR) for the use of equipment and help with the deployment of the frame. We thank Coastal Division, Agency for Maritime and Coastal Services (Meetnet Vlaamse Banken) for the tide gauge and wave buoy data.

Conflicts of Interest

The authors declare no conflict of interest.

Appendix A

In Figure A1 the three calibration curves of the OBS are presented. The corresponding calibration formulas are:
S S C 10 = t u r b i d i t y · 0.1841 + 71.766
S S C 30 = t u r b i d i t y · 0.2338 + 5.1059
S S C 50 = t u r b i d i t y · 0.2264 + 43.477
Figure A1. Calibration curves for the three OBS used in this study.
Jmse 08 00151 g0a1

Appendix B

In order to determine the relative contribution of waves and tidal currents to the bed shear stress, it was calculated for tidal currents (subscript c) and waves (subscript w) separately, according to [55]:
τ c = ρ C d u 2
τ w = 0.5 ρ f w U b 2 .
With the wave friction factor fw:
f w = 0.00251 exp ( 5.21 ( A / k s ) 0.19 ) .
With the semi-orbital excursion (A) and bed roughness (ks) [56]:
A = U b T / ( 2 π )
k s = 2.5 D 50 ,
where ρ is the water density, Cd is the drag coefficient (= 0.003 for sandy beds), and u is the flow velocity. In this study, the hourly averaged flow velocity was used to calculate the current-induced bed shear stress. Ub is the near bed orbital velocity, T is the wave period, and D50 is the grain size on the intertidal beach. The average D50 over the intertidal zone was used for each campaign.

References

  1. Aagaard, T.; Kroon, A.; Andersen, S.; Sørensen, R.M.; Quartel, S.; Vinther, N. Intertidal beach change during storm conditions; Egmond, The Netherlands. Mar. Geol. 2005, 218, 65–80. [Google Scholar] [CrossRef]
  2. Biausque, M.; Senechal, N. Seasonal morphological response of an open sandy beach to winter wave conditions: The example of Biscarrosse beach, SW France. Geomorphology 2019, 331, 157–169. [Google Scholar] [CrossRef]
  3. De Vries, S.; Gong, Y.; Hoonhout, B. The Role of Sediment Supply to the Aeolian Coastal Dune System in Contrasting Areas. In Proceedings of the International Conference on Coastal Sediments 2019, Tampa, FL, USA, 27–31 May 2019. [Google Scholar]
  4. Masselink, G.; Hughes, M.G. Introduction to Coastal Processes and Geomorphology; Oxford University Press Inc: Oxford, UK, 2003. [Google Scholar]
  5. Meyer, R.D. A Model Study of Wave Action on Beaches. M.S. Thesis in Civil Engineering, University of California, Oakland, CA, USA, 1936. [Google Scholar]
  6. Sunamura, T.; Horikawa, K. Two-dimensional beach transformation due to waves. In Proceedings of the 14th International Conference on Coastal Engineering, Copenhagen, Denmark, 24–28 June 1974. [Google Scholar]
  7. Ahrens, J.P.; Hands, E.B. Velocity parameters for predicting cross-shore sediment transport. J. Waterw Port Coast. Ocean. Eng. 1998, 124, 16–20. [Google Scholar] [CrossRef]
  8. Masselink, G.; Russell, P.; Turner, I.; Blenkinsopp, C. Net sediment transport and morphological change in the swash zone of a high-energy sandy beach from swash event to tidal cycle time scales. Mar. Geol. 2009, 267, 18–35. [Google Scholar] [CrossRef]
  9. Philips, M.S.; Harley, M.D.; Turner, I.L.; Splinter, K.D.; Cox, R.J. Shoreline recovery on wave-dominated sandy coastlines: The role of sandbar morphodynamics and nearshore wave parameters. Mar. Geol. 2017, 385, 146–159. [Google Scholar] [CrossRef]
  10. Wright, L.D.; Short, A.D. Morphodynamics variability of surf zones and beaches: A synthesis. Mar. Geol. 1984, 56, 93–118. [Google Scholar] [CrossRef]
  11. Davis, R.A. Beach and nearshore zone. In Coastal Sedimentary Environments; Davis, R.A., Ed.; Springer: Berlin/Heidelberg, Germany, 1985. [Google Scholar]
  12. Wright, L.D.; Nielsen, P.; Short, A.D.; Green, M.O. Morphodynamics of a macrotidal beach. Mar. Geol. 1982, 50, 97–128. [Google Scholar] [CrossRef]
  13. Masselink, G.; Hegge, B. Morphodynamics of meso- and macrotidal beaches: Examples from central Queensland, Australia. Mar. Geol. 1995, 129, 1–23. [Google Scholar] [CrossRef]
  14. Voulgaris, G.; Simmonds, D.; Michel, D.; Howa, H.; Collins, M.B.; Huntley, D.A. Measuring and Modelling Sediment Transport on a Macrotidal Ridge and Runnel Beach: An Intercomparison. J. Coast. Res. 1998, 14, 315–330. [Google Scholar]
  15. Sipka, V.; Anthony, E.J. Morphology and hydrodynamics of a macrotidal ridge and runnel beach under modal low wave conditions. J. Rech. Océanographique 1999, 24, 25–31. [Google Scholar]
  16. Masselink, G.; Pattiaratchi, C. Tidal asymmetry in sediment resuspension on a macrotidal beach in northwestern Australia. Mar. Geol. 2000, 163, 257–274. [Google Scholar] [CrossRef]
  17. Cartier, A.; Héquette, A. Variation in longshore sediment transport under low to moderate conditions on barred macrotidal beaches. J. Coast. Res. Spec. Issue 2011, 64, 45–49. [Google Scholar]
  18. Anthony, E.J.; Levoy, F.; Monfort, O. Morphodynamics of intertidal bars on a megatidal beach, Merlimont, Northern France. Mar. Geol. 2004, 208, 73–100. [Google Scholar] [CrossRef]
  19. Masselink, G.; Short, A.D. The Effect of Tide Range on Beach Morphodynamics and Morphology: A Conceptual Beach Model. J. Coast. Res. 1993, 9, 785–800. [Google Scholar]
  20. Levoy, F.; Anthony, E.J.; Monfort, O.; Larsonneur, C. Morphodynamics of megatidal beaches in Normandy, France. Mar. Geol. 2000, 171, 39–59. [Google Scholar] [CrossRef]
  21. Kroon, A.; Masselink, G. Morphodynamics of intertidal bar morphology on a macrotidal beach under low-energy wave conditions, North Lincolnshire, England. Mar. Geol. 2002, 190, 591–608. [Google Scholar] [CrossRef]
  22. Brand, E.; De Sloover, L.; De Wulf, A.; Montreuil, A.-L.; Vos, S.; Chen, M. Cross-shore Suspended Sediment Transport in Relation to Topographic Changes in the Intertidal Zone of a Macro-Tidal Beach (Mariakerke, Belgium). J. Mar. Sci. Eng. 2019, 7, 172. [Google Scholar] [CrossRef] [Green Version]
  23. Aagaard, T. Sediment supply to beaches: Cross-shore sand transport on the lower shoreface. J. Geophys. Res. Earth Surf. 2014, 119, 913–926. [Google Scholar] [CrossRef]
  24. Brand, E.; Chen, M.; Montreuil, A.-L. Optimizing measurements of sediment transport in the intertidal zone. Earth Sci. Rev. 2019, 200, 1–10. [Google Scholar] [CrossRef]
  25. Beets, D.J.; van der Valk, L.; Stive, M.J.F. Holocene evolution of the coast of Holland. Mar. Geol. 1992, 103, 423–443. [Google Scholar] [CrossRef] [Green Version]
  26. Stive, M.J.F.; DeVriend, H.J. Modelling shoreface profile evolution. Mar. Geol. 1995, 126, 235–248. [Google Scholar] [CrossRef] [Green Version]
  27. Cowell, P.J.; Stive, M.J.F.; Roy, S.; Kaminsky, G.M.; Buijsman, M.C.; Thom, B.G.; Wright, L.D. Shoreface sand supply to beaches. In Proceedings of the 27th International Conference on Coastal Engineering (ICCE), Sydney, Australia, 16–21 July 2000. [Google Scholar]
  28. Van Heteren, S.A.; van der Spek, A.; van der Valk, B. Evidence and implications of middle- to late-Holocene shoreface steepening offshore the western Netherlands. In Proceedings of the Coastal Sediments 2011, Miami, FL, USA, 2–6 May 2011. [Google Scholar]
  29. Dubois, R.N. Seasonal variation of mid-foreshore sediments at a Delaware beach. Sediment. Geol. 1989, 61, 37–47. [Google Scholar] [CrossRef]
  30. Brand, E.; Montreuil, A.-L.; Dan, S.; Chen, M. Macro-tidal beach morphology in relation to nearshore wave conditions and suspended sediment concentrations at Mariakerke, Belgium. Reg. Stud. Mar. Sci. 2018, 24, 97–106. [Google Scholar] [CrossRef]
  31. Short, A.D. Macro-Meso Tidal Beach Morphodynamics–An Overview. J. Coast. Res. 1990, 7, 417–436. [Google Scholar]
  32. Haerens, P.; Bolle, A.; Trouw, K.; Houthuys, R. Definition of storm thresholds for significant morphological change of the sandy beaches along the Belgian coastline. Geomorphology 2012, 143–144, 104–117. [Google Scholar] [CrossRef]
  33. Van Oyen, T.; van Lancker, V.; de Swart, H. De Noordzeebodem: Een landschap vol pieken en dalen. Available online: https://www.researchgate.net/publication/294124901_De_noordzeebodem_een_landschap_vol_pieken_en_dalen (accessed on 25 February 2020).
  34. Houthuys, R. Morfologische trends van de Vlaamse Kust in 2011. In Agentschap Maritieme Dienstverlening en Kust; Afdeling Kust: Oostende, Belgium, 2012. [Google Scholar]
  35. Deronde, B.; Houthuys, R.; Henriet, J.-P.; van Lancker, V. Monitoring of the sediment dynamics along a sandy shoreline by means of airborne hyperspectral remote sensing and LiDAR: A case study in Belgium. Earth Surf. Process. Landf. 2008, 33, 280–294. [Google Scholar] [CrossRef]
  36. Pawlowicz, R.; Beardsley, B.; Lentz, S. Classical Tidal Harmonic Analysis Including Error Estimates in MATLAB using T_TIDE. Comput. Geosci. 2002, 28, 929–937. [Google Scholar] [CrossRef]
  37. Masselink, G.; Hughes, M.G.; Knight, J. Introduction to Coastal Processes & Geomorphology, 2nd ed.; Hodder education: London, UK, 2011. [Google Scholar]
  38. Suanez, S.; Stéphan, P. Forçages météo-marins et dynamique morphosédimentaire saisonnière des cordons dunaires. Exemple de la baie de Saint-Michel-en-Grève (Côtes d’Armor, Bretagne). Geomorphol. Relief Process. Environ. 2006, 2, 91–110. [Google Scholar] [CrossRef] [Green Version]
  39. Montreuil, A.-L.; Bullard, J.E.; Chandler, J.H. Detecting seasonal variations in embryo dune morphology using a terrestrial laser scanner. J. Coast. Res. 2013, 65, 1313–1318. [Google Scholar] [CrossRef]
  40. Fabbri, S.; Giambastiani, B.M.S.; Sistilli, F.; Scarelli, F.; Gabbianelli, G. Geomorphological analysis and classification of foredune ridges based on Terrestrial Laser Scanning (TLS) technology. Geomorphology 2017, 295, 436–451. [Google Scholar] [CrossRef]
  41. Simmonds, D.J.; O’Hare, T.J.; Huntley, D.A. The influence of Long Waves on Macrotidal Beach Morphology. In Proceedings of the 25th International Conference on Coastal Engineering, Orlando, FL, USA, 2–6 September 1996. [Google Scholar]
  42. Masselink, G.; Russell, P.; Blenkinsopp, C.; Turner, I. Swash zone sediment transport, step dynamics and morphological response on a gravel beach. Mar. Geol. 2010, 274, 50–68. [Google Scholar] [CrossRef]
  43. Bartholdy, J.; Aagaard, T. Storm surge effects on a back-barrier tidal flat of the Danish Wadden Sea. Geo Mar. Lett. 2001, 20, 133–141. [Google Scholar] [CrossRef]
  44. Shields, A. Anwendung der Ähnlichkeitsmechanik und der Turbulenz Forschung auf die Geschiebewegung. Available online: https://repository.tudelft.nl/islandora/object/uuid%3A61a19716-a994-4942-9906-f680eb9952d6 (accessed on 25 February 2020).
  45. Soulsby, R. Dynamics of Marine Sands; Thomas Telford: London, UK, 1997. [Google Scholar]
  46. Kobayashi, N.; Payo, A.; Schmied, L. Cross-shore suspended sand and bed load transport on beaches. J. Geophys. Res. Oceans 2008, 113, C07001. [Google Scholar] [CrossRef] [Green Version]
  47. Reichmüth, B.; Anthony, E.J. Tidal influence on the intertidal bar morphology of two contrasting macrotidal beaches. Geomorphology 2007, 90, 101–114. [Google Scholar] [CrossRef]
  48. Deronde, B.; Houthuys, R.; Debruyn, W.; Fransaer, D.; Van Lancker, V.; Henriet, J. Use of airborne hyperspectral data and laserscan data to study beach morphodynamics along the Belgian coast. J. Coast. Res. 2006, 22, 1108–1117. [Google Scholar] [CrossRef]
  49. Houthuys, R. A sedimentary model of the Brussels Sands, Eocene, Belgium. Geol. Belg. 2011, 14, 1–2. [Google Scholar]
  50. Verwaest, T.; Delgado, R.; Janssens, J.; Reyns, J. Longshore sediment transport along the Belgian coast. In Proceedings of the Coastal Sediments 2011, Miami, FL, USA, 2–6 May 2011. [Google Scholar]
  51. Sedrati, M.; Anthony, E.J. Storm-generated morphological change and longshore sand transport in the intertidal zone of a multi-barred macrotidal beach. Mar. Geol. 2007, 244, 209–229. [Google Scholar] [CrossRef]
  52. Brand, E.; Chen, M.; Montreuil, A.-L.; Dan, S. Intertidal Beach Recovery in Relation to Nearshore Hydrodynamics; Hydrosensoft: Madrid, Spain, 2017. [Google Scholar]
  53. Turner, I.L.; Rau, G.C.; Andersen, M.S.; Austin, M.J.; Puleo, J.A.; Masselink, G. Coastal sand barrier hydrology–observations from the BARDEX II prototype-scale laboratory experiment. J. Coast. Res. 2013, 65, 1886–1891. [Google Scholar] [CrossRef]
  54. Theuerkauf, E.J.; Rodriguez, A.B. Impacts of Transect Location and Variations in Along-Beach Morphology on measuring Volume Change. J. Coast. Res. 2012, 28, 707–718. [Google Scholar]
  55. Dufois, F.; Garreau, P.; Le Hir, P.; Forget, P. Wave- and current-induced bottom shear stress distribution in the Gulf of Lions. Cont. Shelf Res. 2008, 28, 1920–1934. [Google Scholar] [CrossRef] [Green Version]
  56. De Swart, D.H. Offshore Sediment Transport and Equilibrium Beach Profiles; Delft Hydraulics Laboratory publication: Delft, The Netherlands, 1974. [Google Scholar]
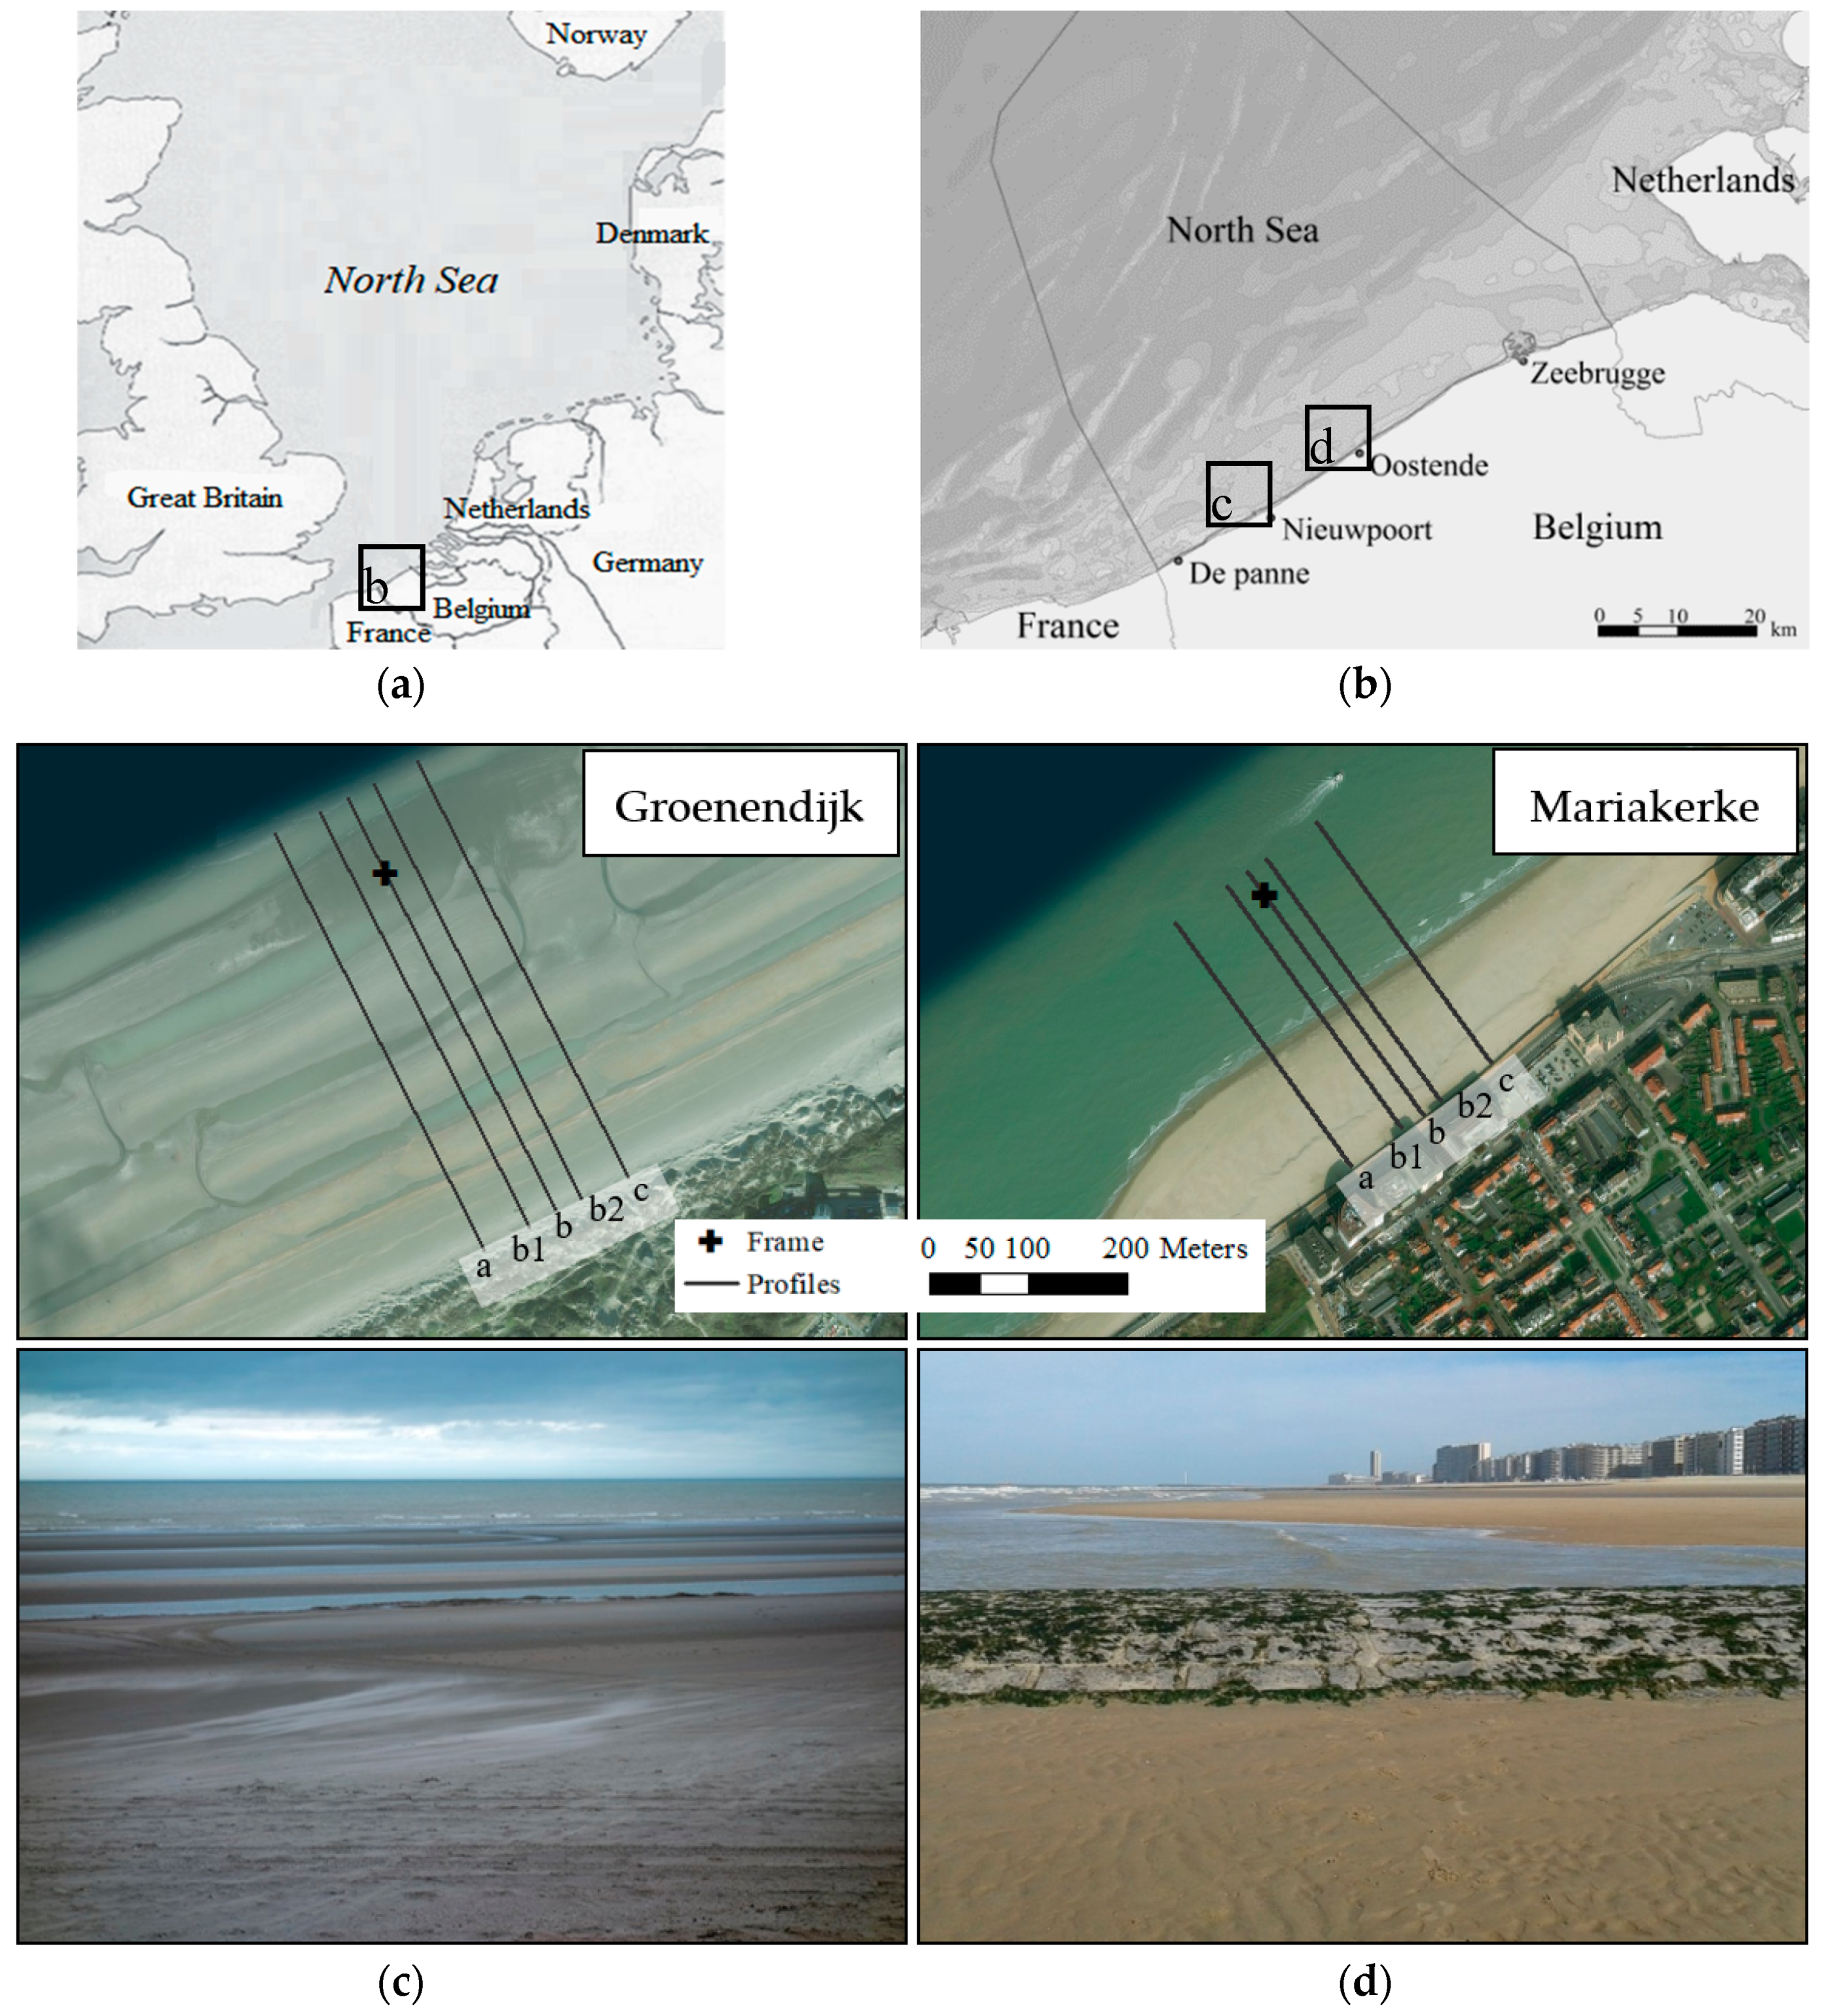
Figure 1. (a,b) Overview maps of the North Sea and the Belgian coast. (c,d) Ground pictures and maps of the intertidal beach at Groenendijk (c) and Mariakerke (d) with the intertidal frame and cross-shore topographic profiles indicated.
Jmse 08 00151 g001
Figure 2. The intertidal measuring frame (1 m high, 2.2 m wide) with (from left to right) the down-looking ADCP, the OBS, the ECM, and the up-looking ADCP.
Jmse 08 00151 g002
Figure 3. The 30-min-averaged hydrodynamics: significant wave height (Hsig), wave steepness, and water level (h), and suspended sediment concentration (SSC) for all the campaigns. The measured water level is supplemented with tide gauge data from Oostende Harbor for low tide (dashed lines).
Jmse 08 00151 g003
Figure 4. Typical current roses for spring vs. neap tide (left vs. right panels) and calm vs strong waves (top vs. bottom panels). Currents were measured at 35 cm above the bed at Mariakerke and currents are not included for water levels < 2.39 m TAW. The shoreline orientation is indicated by the black line. Each current rose represents one tidal cycle.
Jmse 08 00151 g004
Figure 5. Cross-shore (top) and alongshore (bottom) flow velocity at 35 cm above the bed over one tidal cycle during spring tide and calm wave conditions (left) vs. neap tide and strong waves (right), with the measured flow velocity in grey and the 10-minute averaged flow velocity in black.
Jmse 08 00151 g005
Figure 6. (a) Comparison between SSC and wave steepness when both are averaged over a tidal cycle. Data that were affected by the nearby sediment disposal during the Spring—flat campaign were removed. (b) Time series of SSC (gray line) and wave steepness (black, dotted line) for all campaigns. Wave steepness was supplemented with data from the wave buoy at Raversijde to illustrate the wave conditions before the campaign.
Jmse 08 00151 g006
Figure 7. Beach topography. (a) Cross-shore topographic profiles at the start of each campaign with the MHW and MLW line indicated. (b) The standard deviation of the representative central profile (b). (c) Daily volumetric changes alongshore averaged.
Jmse 08 00151 g007
Figure 8. A PCA biplot between volume change (ΔV) and hydrodynamic forcing factors: wave steepness, maximum tidal water level (h), and SSC for Mariakerke (a) and Groenendijk (b).
Jmse 08 00151 g008
Figure 9. Daily intertidal beach volume change compared to daily averaged wave steepness.
Jmse 08 00151 g009
Figure 10. Conceptual summary of the combined effects of waves through wave steepness, tide, and sediment supply on the intertidal beach volume, with checkered, white, and spotted indicating accretion, stability, and erosion, respectively.
Jmse 08 00151 g010
Table 1. Overview of the intertidal measuring campaigns. (Note that ‘flat’ here corresponds to the developed site Mariakerke and ‘barred’ corresponds to the natural site Groenendijk).
CampaignLocationDate
Spring—flatMariakerke13–24 March 2017
Summer—barredGroenendijk8–19 May 2017
Winter—flatMariakerke7–20 November 2017
Winter—barredGroenendijk23 January–2 February 2018
Summer—flatMariakerke16–26 April 2018
Autumn—barredGroenendijk31 October–13 November 2018
Table 2. Overview of the hydrodynamic conditions and SSC for all campaigns.
ConditionsSpring—FlatSummer—BarredWinter—FlatWinter—BarredSummer—FlatAutumn—Barred
Wave height (m)Avg.0.310.220.420.390.210.17
Max.0.950.851.461.100.650.55
Wave steepnessAvg.0.0240.0180.0280.0280.0180.011
Max.0.0590.0540.0680.0600.0480.028
Water level (m)Max.4.914.725.095.284.844.88
SSC (mg/L)Avg.1325733105612758391035
Bed shear stress (N/m2)Waves5.343.717.016.633.492.87
Currents0.060.060.080.080.070.07
Table 3. Occurrence of hydrodynamic conditions; calm vs. strong waves and neap vs. spring tide.
ConditionsNeap Tide (Max. Water Level < 4 m)Spring Tide (Max. Water Level > 4 m)
Calm waves (steepness < 0.013)14%28%
Strong waves (steepness > 0.013)26%32%
Table 4. Correlations between daily dominant current direction, daily averaged wave steepness, maximum tidal water level, and the first principal component for both study sites combined. High correlations are bold (>0.5).
PCAMariakerke
1st Principal Component
Groenendijk
1st Principal Component
Dominant current direction0.760.60
Wave steepness−0.43−0.54
Maximum tidal water level0.490.53
Percentage of variation explained54%62%
Table 5. Correlations between daily intertidal beach volume change, daily averaged wave steepness, maximum water level, daily averaged SSC, and the first two principal components for Mariakerke and Groenendijk. High correlations are in bold (>0.5).
PCA1st Principal Component2nd Principal Component
MariakerkeGroenendijkMariakerkeGroenendijk
Intertidal beach volume−0.60−0.540.260.52
Wave steepness0.560.410.520.52
Maximum tidal water level0.47−0.290.26−0.62
SSC−0.33−0.620.770.30
Percentage of variation explained36%51%28%28%