1. Introduction
Tidal inlets are important connections between the open sea and back-barrier sheltered basins, lagoons or estuaries. Morphodynamic processes involving their formation, maintenance and evolution are particularly complex, due to the strong interplay between tidal currents and wind waves. These two dominant factors and their non-linear interaction determine the magnitude and the direction of longshore and cross-shore sediment transport to a large extent, that lead to erosion and deposition mechanisms, and thus to the morphology of the seabed and the coastline [
1]. The relative role and the predominance of tidal currents on the wave motion or vice versa, can influence the shape of the barrier islands separated by tidal inlets, together with the growth of the flood and the ebb tidal delta [
2,
3,
4,
5]. The complex dynamism governing these environments makes them potentially unstable over time-scales which can vary differently from years to decades or centuries [
6,
7].
Tidal inlets act primarily as hydraulic regulators of water exchange between the sea and the back-barrier basin; they also function as both source and sinks of sediment in this manner governing the morphological, ecological and environmental balance of the adjacent coastal system [
8]. Moreover, in many cases, they represent preferential waterways towards harbor sites located at the back-barrier basin, increasing the socio-economical value of these natural connections [
9]. For these reasons, the morphological evolution of tidal inlets is the focus of a decadal detailed research, which has attempted to understand the main processes governing their behavior and their consequent prediction over a medium or long term.
The relationship between the hydrodynamic regime and the morphological evolution of tidal inlets and of the nearby coastline has been thoroughly examined. Hayes [
2] provided a pioneering classification scheme which linked the qualitative barrier island morphology to the combination of the mean tidal range and the mean wave height in the area immediately outside the inlet. In particular, different energy fields have been defined depending on which forcing prevails; this makes it possible to designate the coasts as mostly dominated by waves or by tides or as mixed energy environments if they are equally affected by both waves and tides. Further works have improved this initial analysis taking into account other factors, such as the tidal prism and emphasizing the importance of the ratio between tidal range and wave height, particularly along coastlines with moderate wave energy [
10,
11,
12]. In these contexts, Mulhern et al. [
12] have verified that the relative effects of tide and waves are of extreme importance, but the utility of the energy regime classification in predicting and constraining island shape is more limited. In this sense, the scheme developed by Hayes [
2] can be a valid descriptive reference providing useful information on the typical morphology of tidal inlets, but it needs to be supplemented by more complete physically-based approaches.
To this purpose, process-based morphodynamic modeling has shown it is capable of providing better insight into the respective roles of tides and waves in driving morphological changes of tidal inlets and to predict a realistic evolution of the coastline and of the bed morphology. Several modeling systems have been applied to analyze the interaction between currents, waves, and bathymetry in coastal environments numerically [
13,
14,
15,
16,
17,
18,
19,
20,
21,
22]. The most widely used methodology consists of coupling different modules: a hydrodynamic model based on the classical shallow water equations, a wind wave model to generate or propagate wave fields nearshore and a morphodynamic model to compute sediment transport and bed evolution [
7,
13,
15,
16,
17,
19,
20,
22]. The main differences between the performed applications concern: the choice to adopt the full 3D (tri-dimensional) or the 2DH approach, the simulated time-scale, and the consequent definition of the representative input boundary conditions in terms of tide and waves.
The use of a 2DH approach instead of a 3D one is preferable and more appropriate if the longshore processes are dominant over cross-shore mechanisms [
7,
13], which require the computing of the variability of hydrodynamic components along the vertical axis. This implies a great computational effort, especially when considering large domains. The time-scale of the simulations is very important, in order to define a proper representation of the input conditions, especially over medium-long periods varying from years to decades. A limited number of forcings has to be considered to avoid excessive computation times and this leads to the definition of a reduced set of tidal and wave conditions that accurately approximate the morphological evolution over a time period lasting longer than a storm [
23,
24]. The selection of the representative conditions and their sequencing depends on which phenomena prevail; since waves and tides evolve over different time scales, the task of recognizing the correct reduced input set is not an easy challenge. For this reason, in several applications the tide and the wave motion have been simulated separately [
25,
26,
27,
28], refer to simplified imposed wave conditions [
8,
15,
29] or short recorded time series [
30].
Finally, given the complexity and uncertainties derived from all the necessary simplifications, many studies are based on idealized configurations of the basin-tidal-delta system, reproducing a simple geometry with an initial regular bathymetry [
14,
17,
19,
21,
26]. Bed morphology turns out to be a dominant controlling variable [
17,
26], especially when a morphological factor is applied to accelerate or upscale the changes in the seabed [
27,
31,
32]. This means that the results of long-term morphodynamic modeling can be very different according to the initial bathymetry of the domain.
The Lignano tidal inlet belongs to the Marano and Grado lagoon system, in the northern Adriatic Sea, Italy. The complex dynamism of this transitional area is highlighted by significant morphological changes that have occurred over the last few decades, during which a narrowing trend has been outlined. Petti et al. [
9] provided an accurate historical reconstruction of the coastline evolution pointing out that the protective pier of the port beside the inlet has greatly affected the border of the Lignano barrier spit. Moreover, some preliminary numerical simulations were conducted on two configurations, before and after the construction of the port respectively. Beyond uncertainties due to the scarce bathymetric information preceding the construction of the port, the comparative analysis of the results seems to confirm that the pier is one of the main causes of the deposition mechanism, which is leading to progressive narrowing of the inlet. The simulations have been performed selecting some tide and wind events which can be considered as representative of the morphodynamics involving the nearshore of the Lignano barrier spit over an average year. These conditions have been defined according to the results of a numerical application carried out by Petti et al. [
22] to study the longshore sediment transport in the same area.
Based on the considerations made above, the present work aims to improve and complete the previous study of the narrowing phenomenon which is affecting the Lignano tidal inlet. In particular, a possible equilibrium evolutionary form of the barrier spit is proposed. This hypothesis is suggested and subsequently verified by means of an integrated approach which combines three methods. The historical reconstruction of the main morphological changes is interpreted in the light of the theoretical-experimental classification suggested by Hayes [
2]; this has allowed us to make a realistic prediction of the morphological evolution. Then a 2DH process-based model is applied in order to validate the empirical scheme and to prove the morphological trend of the narrowing condition. The chosen time-scale remains the average year and the reduced input set of hydrodynamic conditions is better defined taking into account the simultaneous presence of tides and wind waves which are equally important in the morphological evolution of this context.
The arrangement of the paper is as follows:
Section 2 presents a brief description of the study site with the historical analysis and the morphological characterization; in
Section 3 the adopted numerical model and the computational domains are described and
Section 4 reports the reduced set input conditions. Finally,
Section 5 shows the results obtained, followed by the relative discussion and conclusions.
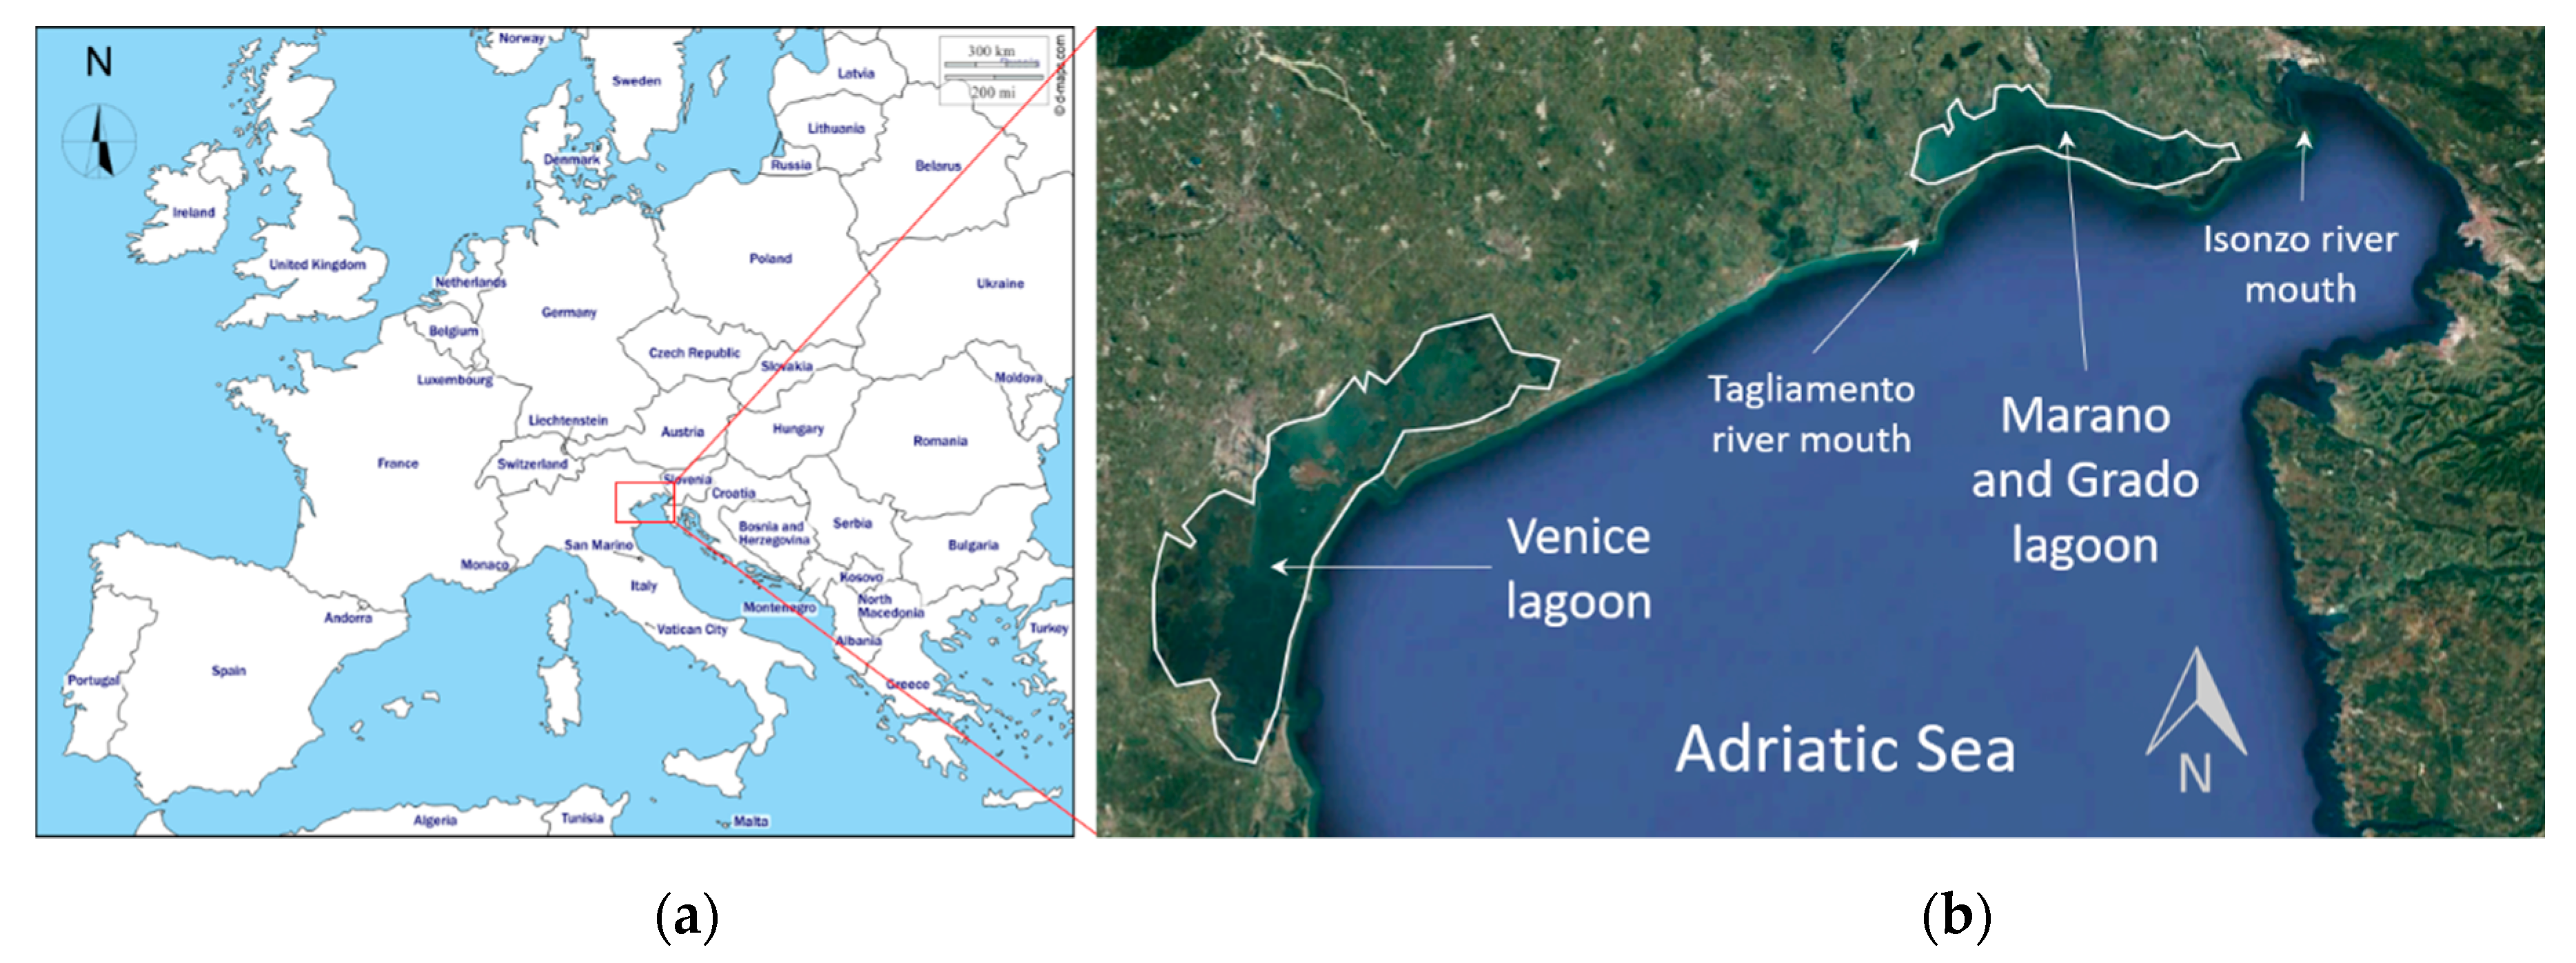
2. Study Site and Historical Analysis
The Marano and Grado lagoon is a transitional environment located in the north-east of Italy (
Figure 1a,b), between the river mouths of the Tagliamento river in the west and the Isonzo river in the east.
The lagoon spreads over an area of about 160 km
2, and it extends for 32 km alongside the coastline with an average width of 5 km [
20,
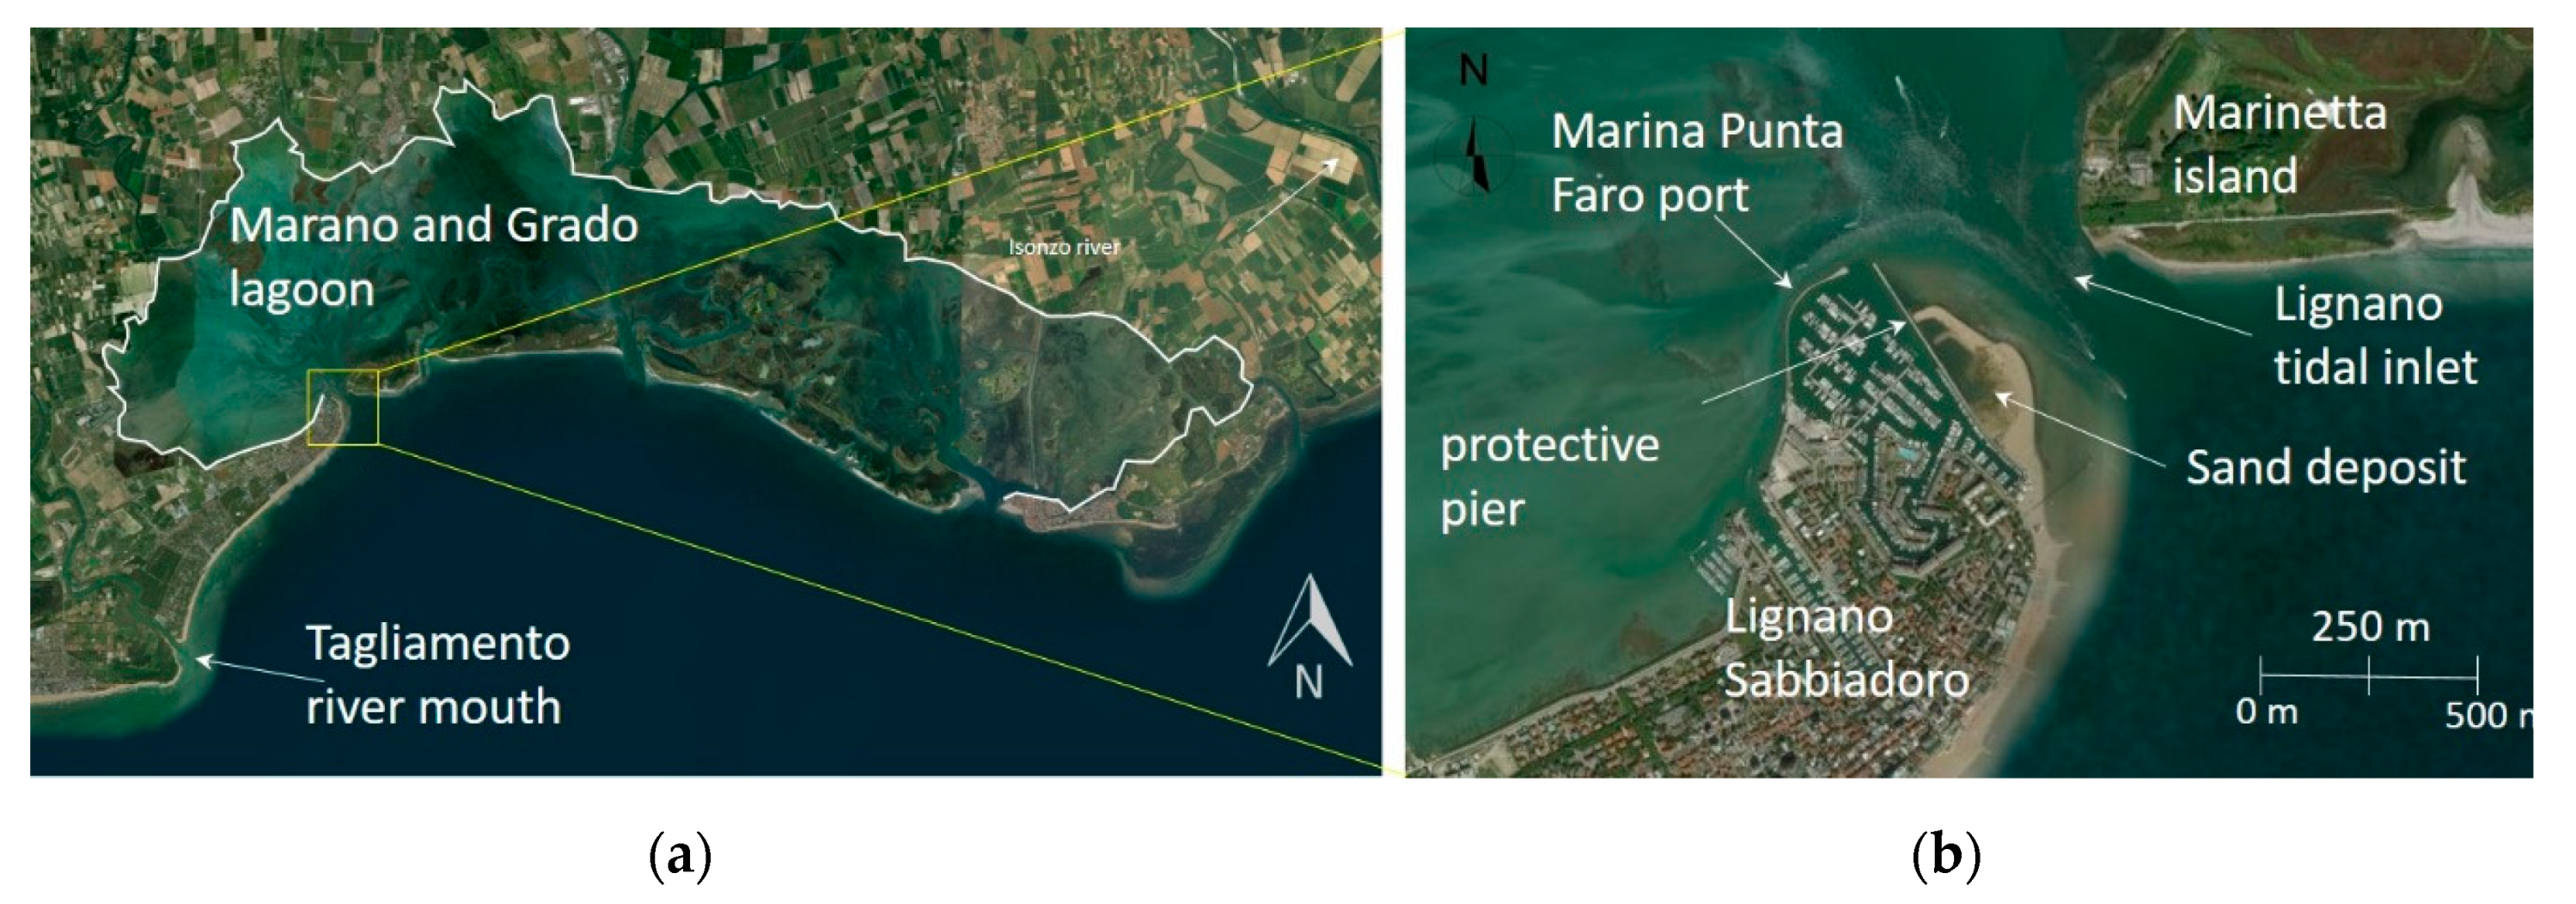
33]. It is one of the largest lagoons in Italy, second only to the Venice lagoon, and it is connected to the Adriatic Sea through six tidal inlets (
Figure 2a), from which a network of channels branches out towards the inner part of the lagoon with progressively shallower depths. As depicted in
Figure 2b, the Lignano tidal inlet is the most western inlet, and it separates the Lignano barrier spit and the Marinetta barrier island.
The Lignano tidal inlet is undergoing a progressive narrowing phenomenon, which is due to the formation and growth over time of a sand deposit on the external side of the protective pier of Marina Punta Faro port. In order to determine the causes of the inlet shrinking, an in-depth historical reconstruction has been carried out by Petti et al. [
9] with a focus on the morphological evolution of the easternmost part of Lignano Sabbiadoro barrier spit.
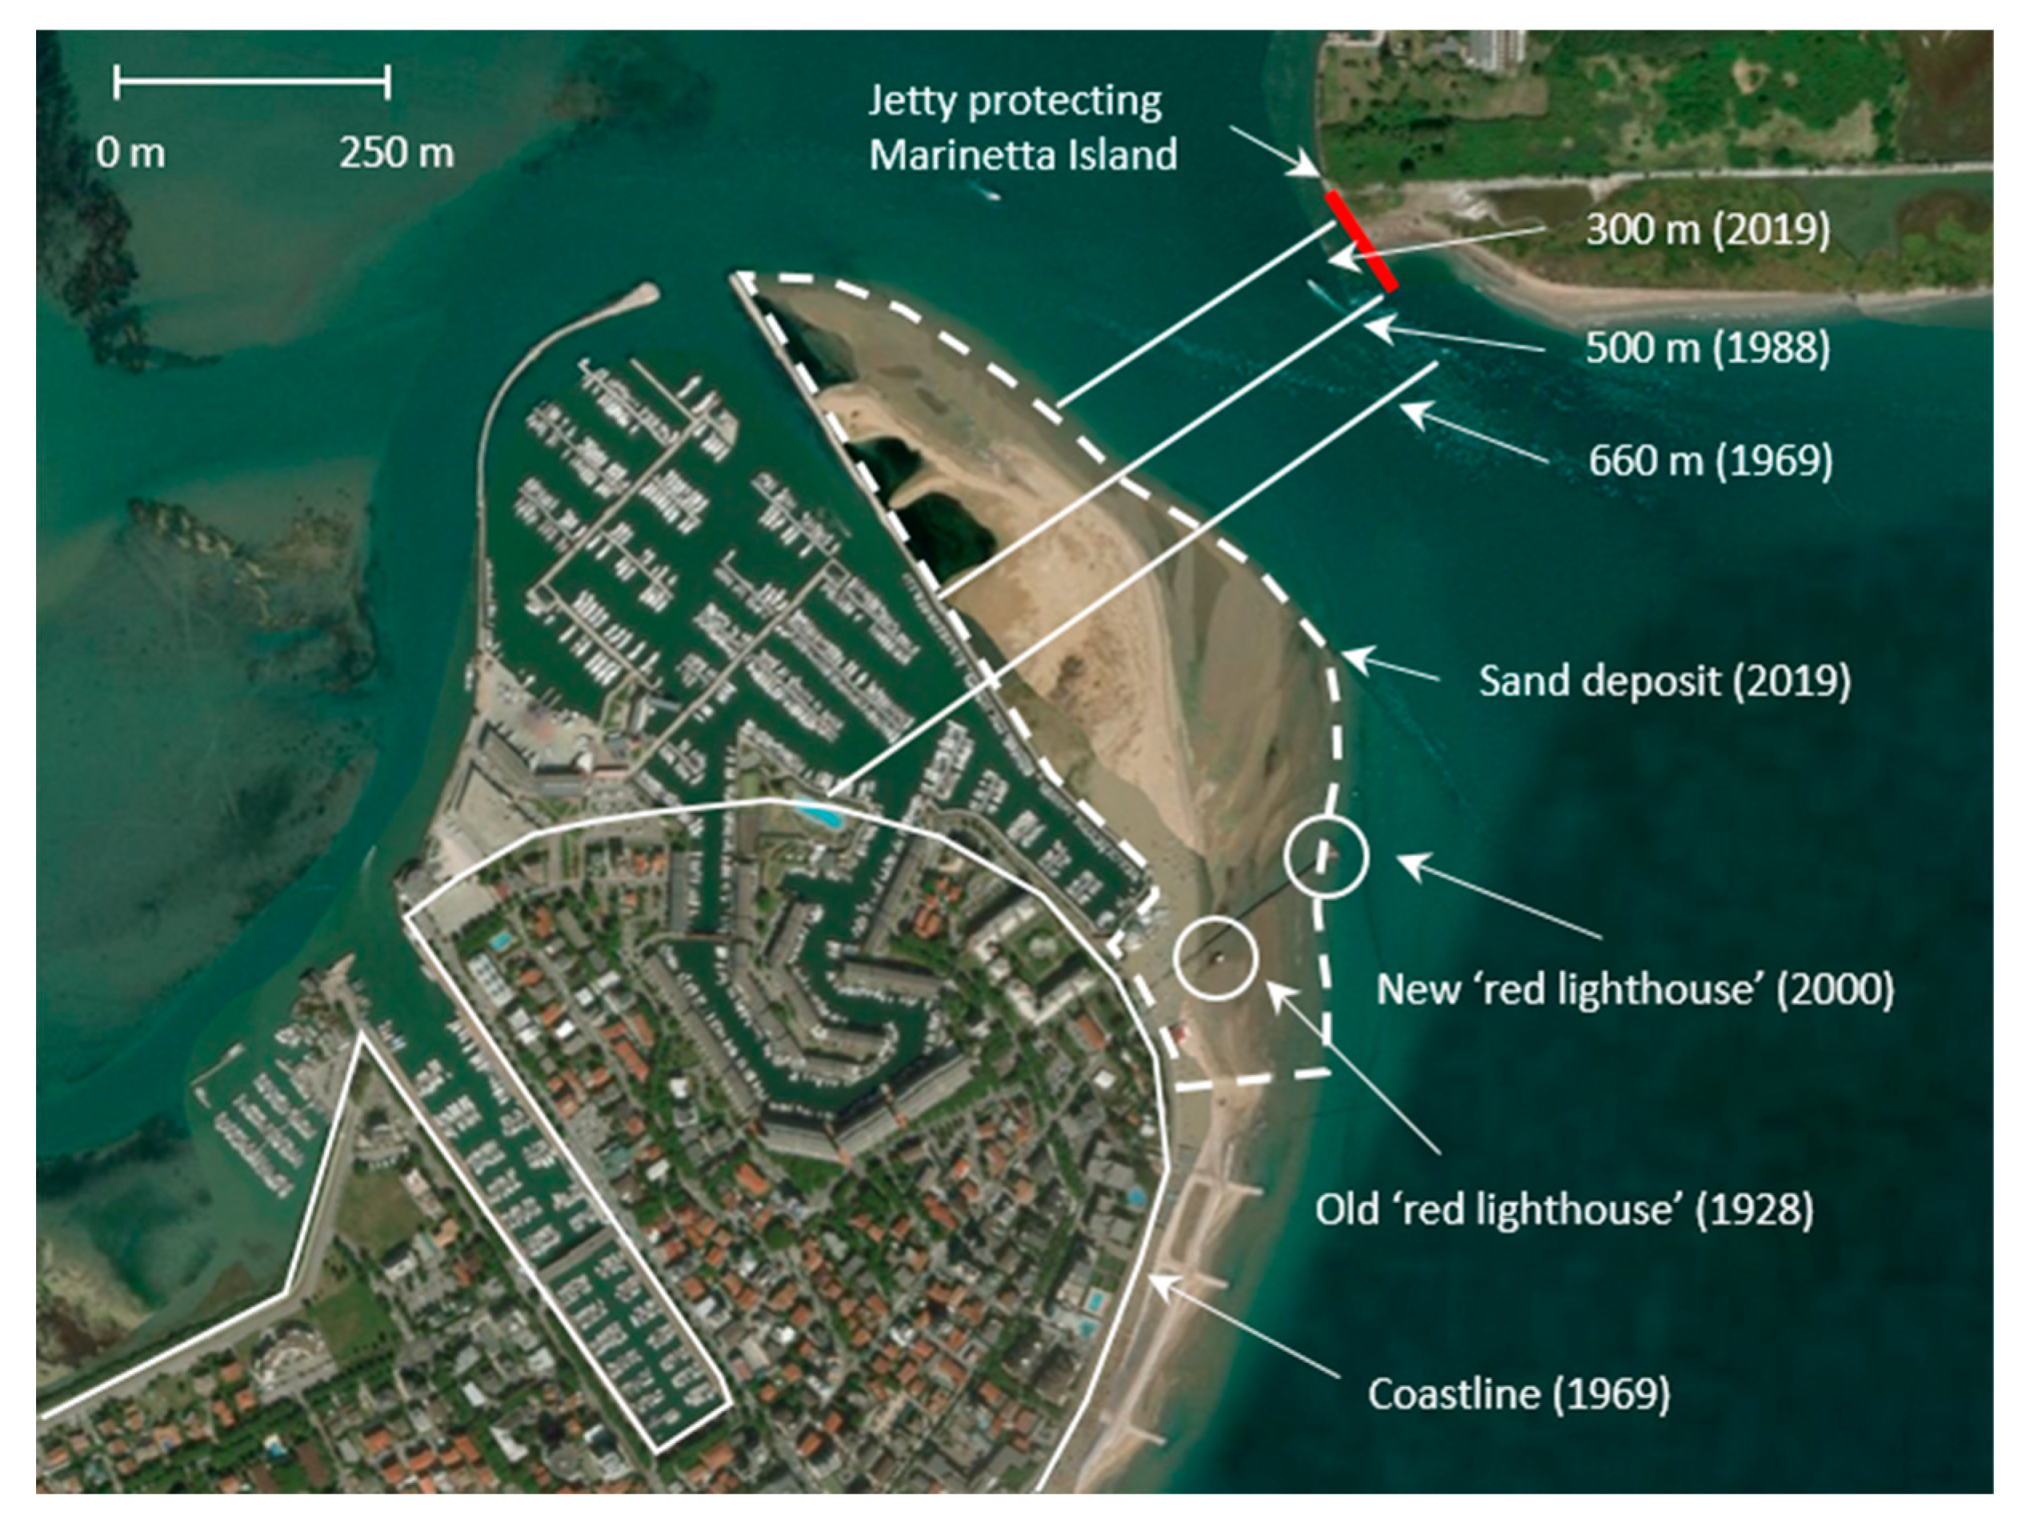
Figure 3 shows that until the beginning of the 1980s, when the Marina Punta Faro port was built, the width of the inlet was close to 660 m; after the construction of the protective pier, it was reduced to approximately 500 m.
Since 1988 the increase of the sand deposit, delineated by the dotted line, has led to a considerable narrowing of the inlet, which has been further reduced to 300 m with an overall loss of 55% compared to the 1988 width. The rapid expansion of this deposit is also proven by the need to move the lighthouse further towards the center of the inlet, to adequately signal the navigation channel entering the lagoon basin. The old red lighthouse, one of the most representative historical symbols of Lignano Sabbiadoro, dates back to 1928. However, from the early 2000s, its functionality rapidly ceased, and this subsequently required the construction of the new current lighthouse, which is located about 140 m from the previous one.
The historical reconstruction of the morphological development of the sand deposit provided by Petti et al. [
9] is based on a variety of cartographic, aerial and satellite images of this area. The first available image, dated 1891, highlights the rounded shape of the spit end of the Lignano barrier, which remained almost unchanged even after a series of groynes was built in 1938. The coastline substantially coincided with that of 1969, reported in
Figure 3.
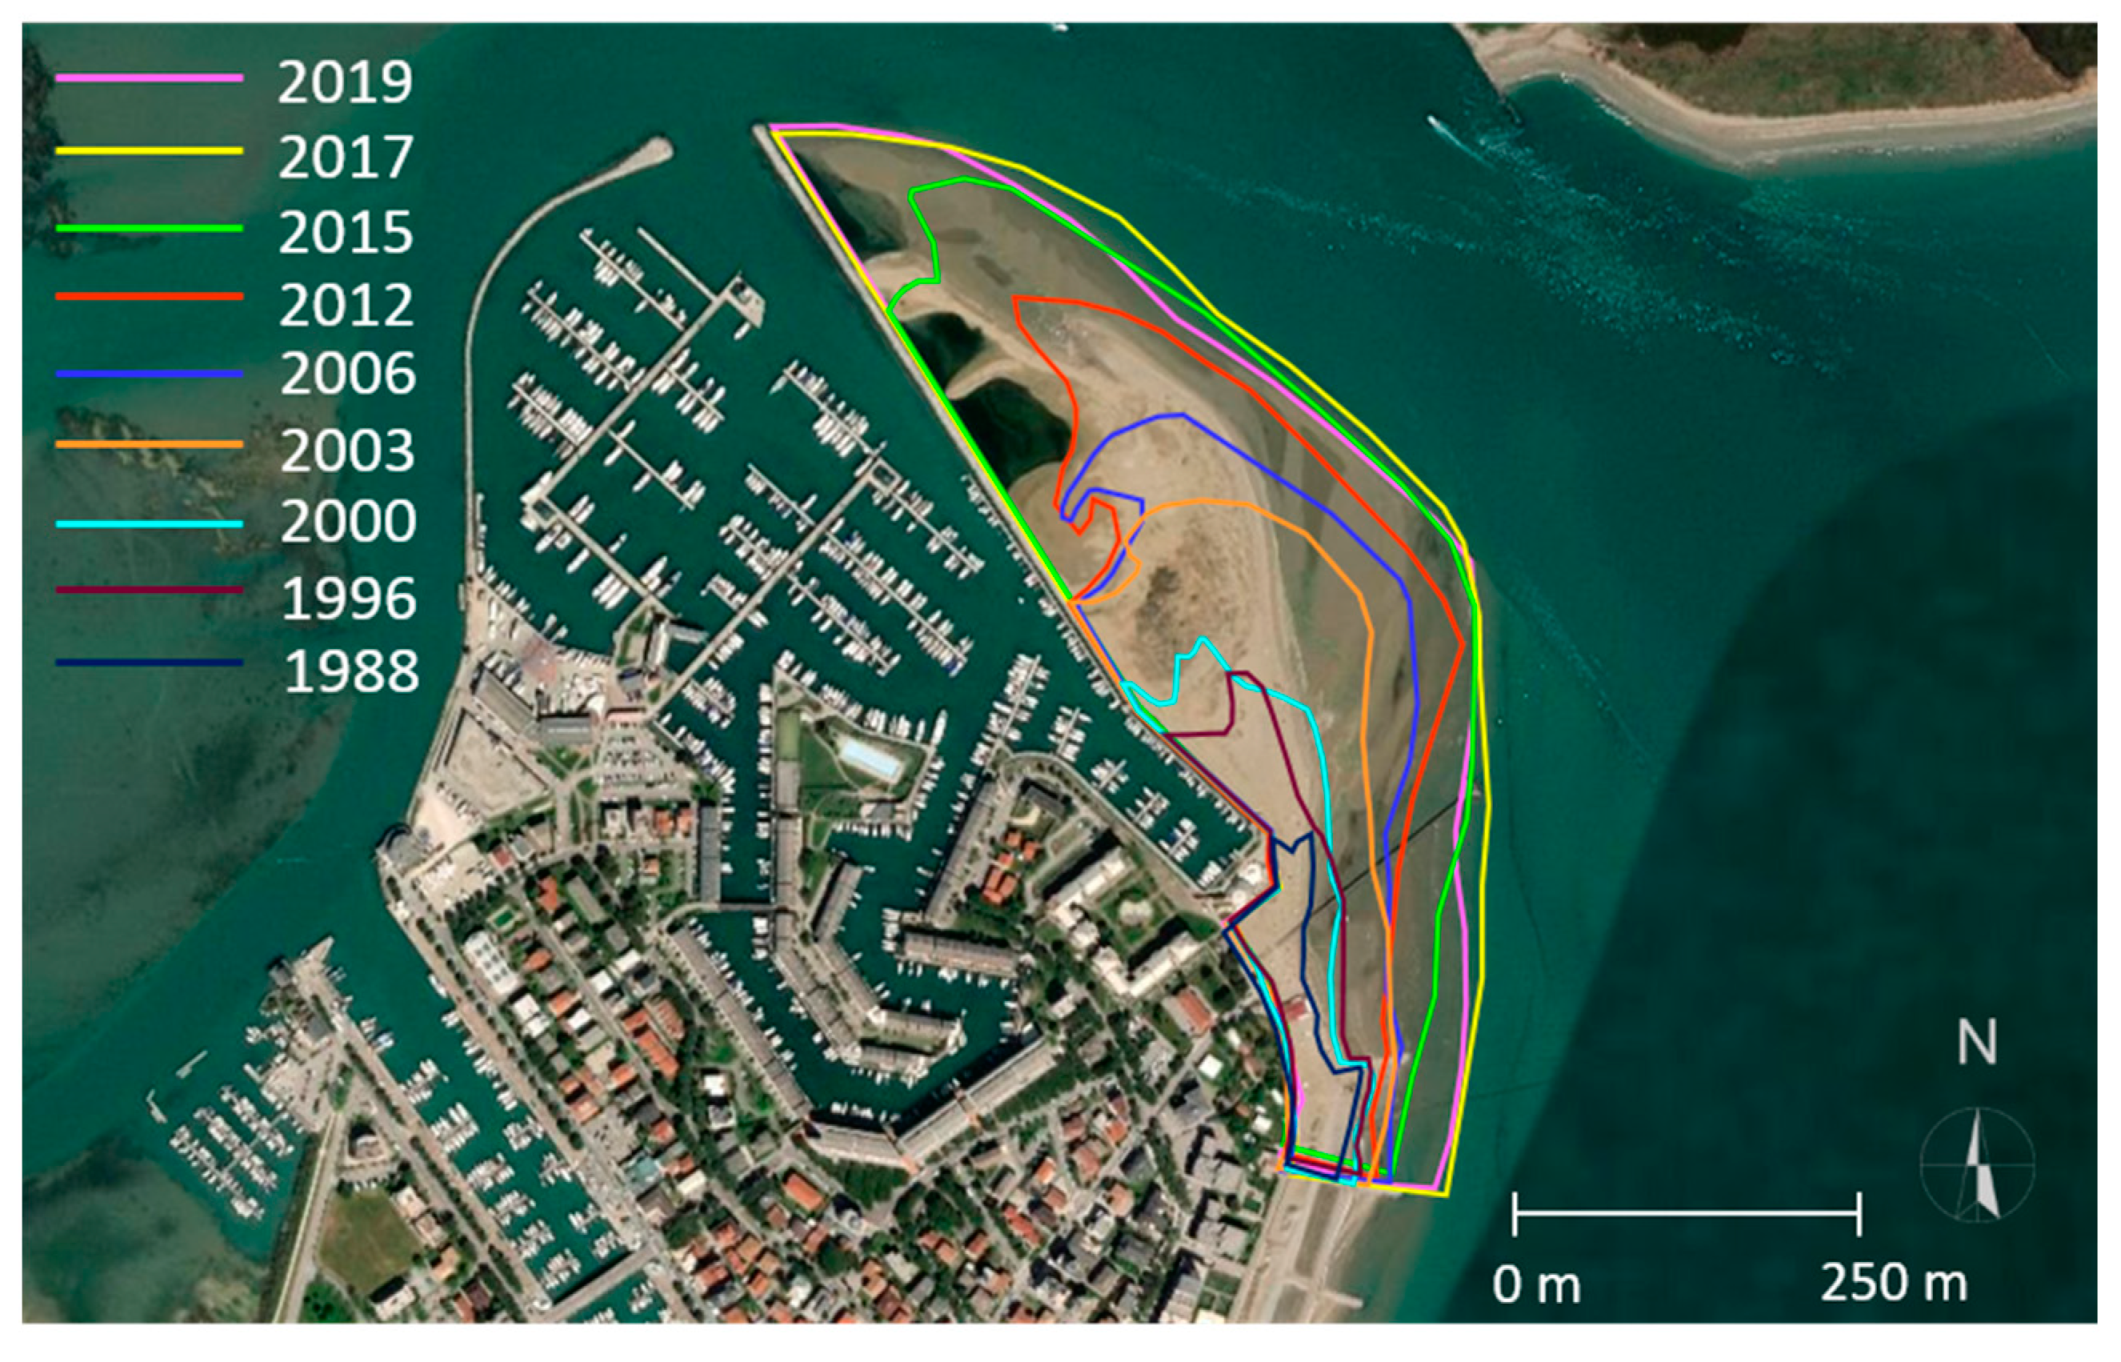
In 1976 the construction of the Marina Punta Faro port began, involving the north-east part of the barrier which has thus lost its equilibrium rounded border. During the years after 1991, when the harbor was completed, no other structures were built in this area; however, the shoreline progressively moved from the pier towards the center of the inlet, as shown in
Figure 4.
This picture has been realized by drawing the borders of the barrier spit end obtained by Petti et al. [
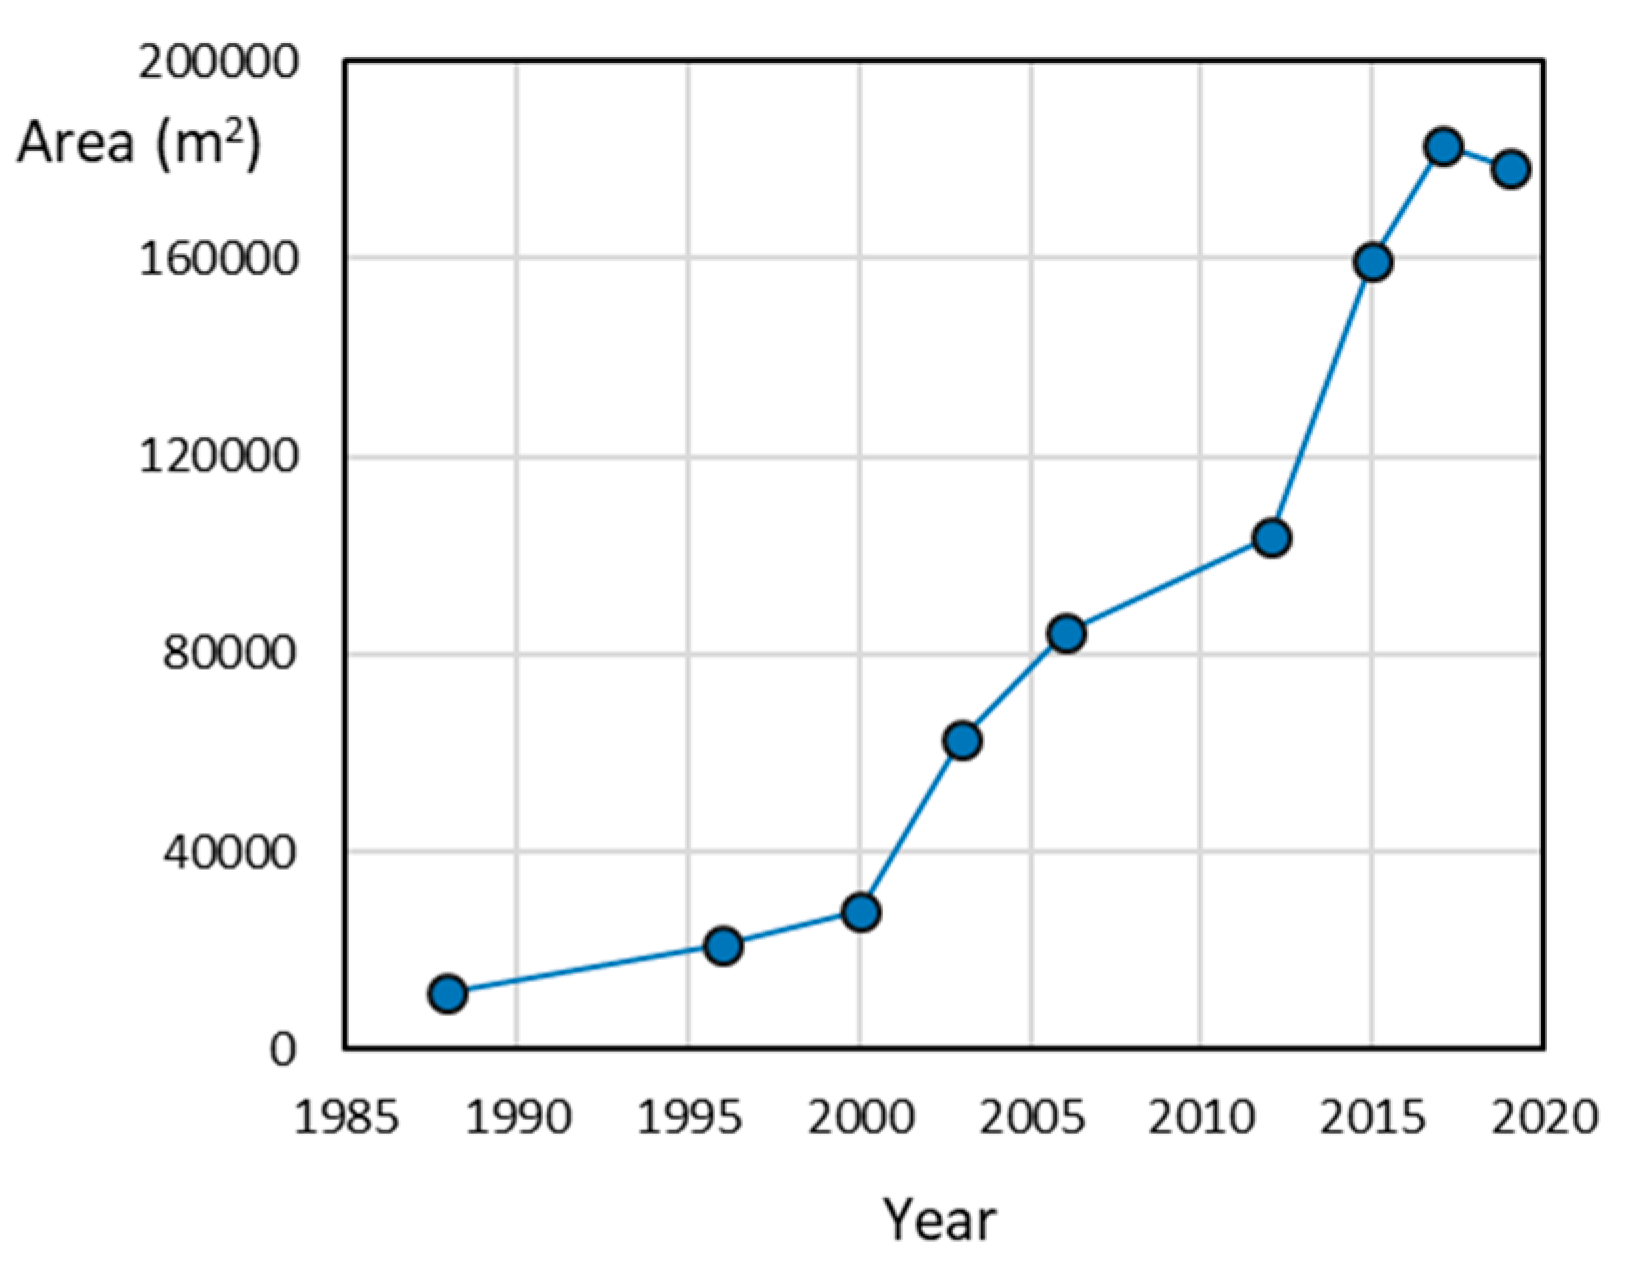
9] on the same figure, in different and separate georeferenced images and then supplementing them with additional available years. The lines were qualitatively identified visually, delimiting the emerging areas of the sand deposit from the submerged ones. The temporal evolution highlights the progressive rounding of the barrier spit end, as if to reconstitute a shape similar to the original one without the port. The accumulation of sediments started from the southern part of the port and has developed towards the north-east and the lagoon side, suggesting that the sand comes from the sea side. The area of the surfaces enclosed by the contours has been plotted in
Figure 5 to obtain the growth trend of the deposit on the horizontal plane.
Observing this curve, it can be stated that until 2000 the increase in the deposit area follows an almost linear trend; from 2000 to 2017 the curve is characterized by a sharp rise of its medium slope as evidence of a marked enlargement of the deposit extension. Finally, from 2017 this growth seems to have reached an upper limit, and there has even been a slight reduction in the last 2 years.
This evidence suggests that the construction of the pier has altered the morphological equilibrium of the Lignano tidal inlet determining the development of the rapid and progressive sand deposit, which has led to the cross section narrowing over the past 30 years due to the reformation of a newly rounded barrier spit. This evolution can be explained referring to the main morphological characteristics of the different typologies of tidal inlets classified by Hayes [
2]. According to this scheme, the energy regime that governs the coastal area in front of the Marano and Grado lagoon can be defined through the mean tidal range and the mean wave height. The mean tidal range, given by the difference between the mean high water level (MHWL) and the mean low water level (MLWL) is about 0.76 m as results from the analysis carried out by Petti et al. [
20,
34]. The mean wave height close to the Lignano tidal inlet is about 0.6 m as deduced from a 30-year-long wave simulation (1964–1995) carried out by Benatazzo et al. [
35] who reproduced the present average wave climate of the Adriatic Sea. According to the graph developed by Hayes [
2,
12] with these two values, the energy regime results mixed and tide-dominated.
Following a rigorous classification, the lagoon of Marano and Grado is a microtidal environment. However, the northern Adriatic Sea is characterized by shallow waters that strongly attenuate the wave motion through bottom friction dissipations [
36,
37]. As a consequence, the resulting mean wave height has a low average value, thus requiring a smaller tidal range to produce tidal-influenced morphology [
2]. This means that tidal processes are still predominant and lead to a morphology typical of mesotidal environments, which are characterized by short, stunted barrier islands and the abundance of tidal inlets, as the case of Marano and Grado lagoon.
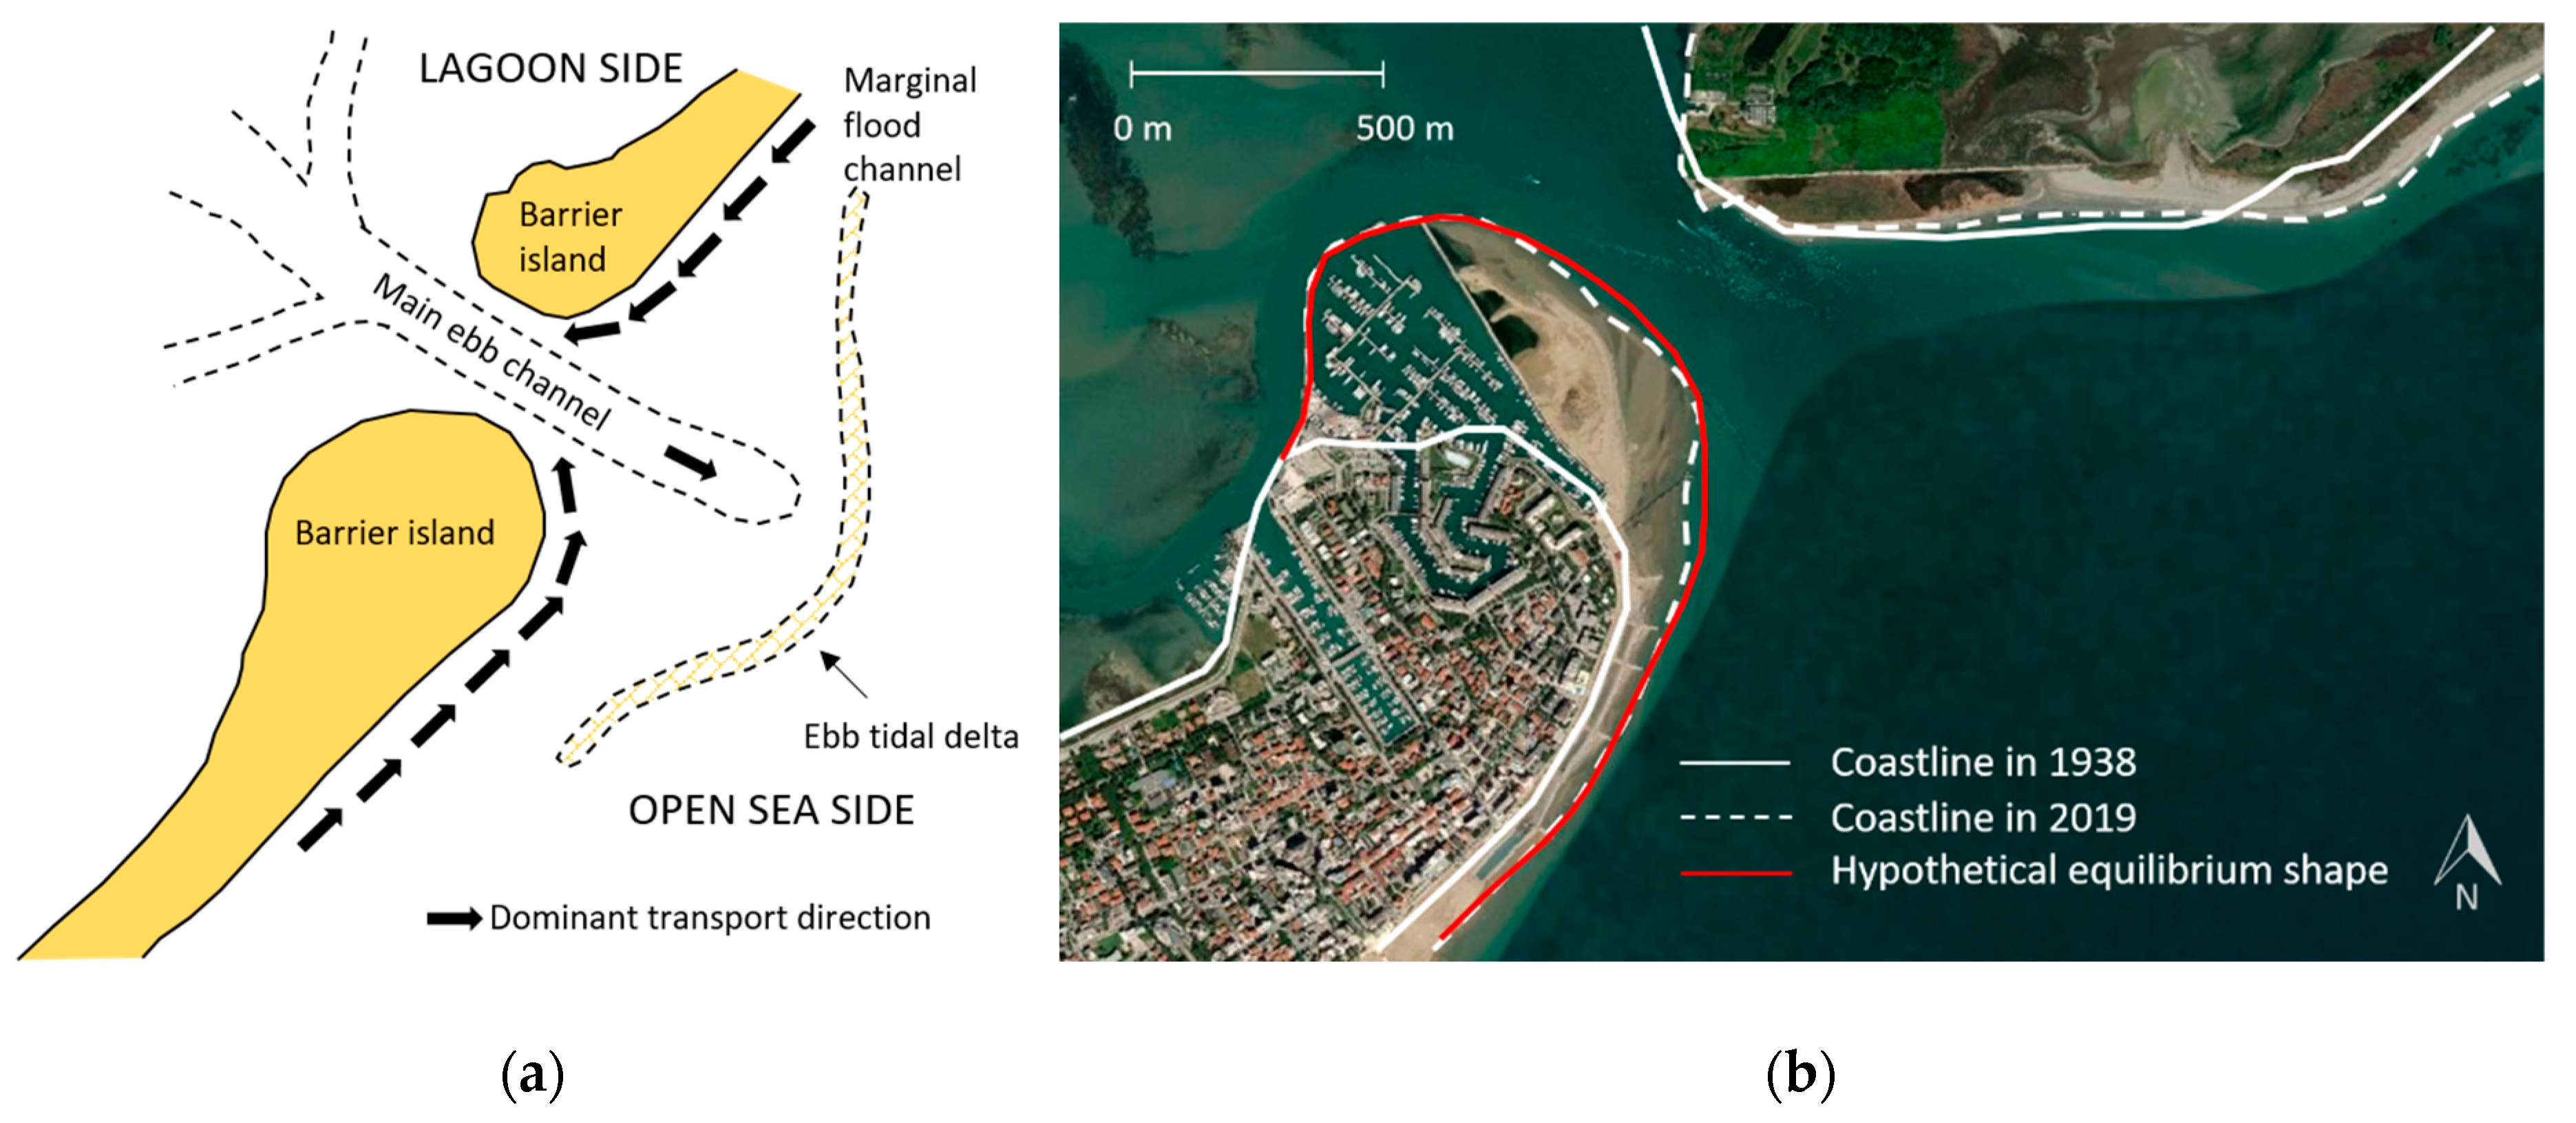
Generally, mesotidal barrier islands have a drumstick shape, with the fat part of the drumstick being located on the updrift side of the barrier [
2,
3,
4,
5], as illustrated in
Figure 6a.
The comparison between this morphological model and the historical evolution of the Lignano barrier spit, suggests a possible new equilibrium shape, depicted in
Figure 6b. The red shoreline recreates a rounded and broad shape similar to the one preceding the construction of the port, and which follows the curvature imposed by the pier. It is likely that the new equilibrium profile will be close to the current one, according to the growth curve of
Figure 5. In order to verify this hypothesis, a morphodynamic model is applied, taking into account the equally important role of tides and waves and their non-linear interaction in defining dominant sediment transport directions and magnitude.
3. Numerical Model and Computational Domains
The simulations of the morphodynamic evolution of the analyzed area have been carried out using a numerical model, which couples a morphological-hydrodynamic model and a fully spectral wind-wave model [
20].
The hydrodynamic model is based on classical 2DH shallow water equations, which include: turbulent fluxes treated according to the Smagorinsky approach as in the study of Pascolo et al. [
38], the forcings due to wind shear stress and radiation stress, and the mean bottom shear stress, which is influenced by both current and wave motion as pointed out by Soulsby [
39,
40]. The resulting differential equation system is integrated with a finite volume method which is able to represent phenomena such as the propagation of water front over a dry bed, which regularly occurs in lagoons and coastal environments at each tidal cycle, with the submergence and emergence of saltmarshes and beaches.
As also confirmed by the historical analysis of the terminal part of the Lignano barrier spit, sediment transport plays an important role in the morphodynamic changes of transitional environments like a lagoon tidal inlet. The finer sediments are usually transported in suspension, while the coarser ones move close to the bottom. In literature, the bed load study is typically carried out through an equilibrium approach [
29,
31,
41] while for the suspended one both equilibrium and non-equilibrium approaches are used [
30,
42,
43,
44]. Numerical comparisons conducted on laboratory tests seem to indicate the non-equilibrium approach as more accurate [
42]. However, this kind of approach requires knowledge of the form of the sediment concentration distribution over the water depth. When working on complex environments, the calibration of these parameters can be extremely difficult, and in this way a simpler approach would be preferable.
Following these considerations, in the present study both bed and suspended loads have been estimated through an equilibrium approach, according to which sediment flux is equal to the maximum flux compatible with the current, with instant adaptation to any change in the hydrodynamic conditions. In particular, van Rijn formulae have been adopted for both bed and suspended loads, considering the effects of both current and wave motion [
45,
46]. The sum of bed and suspended load present in Exner equation, is responsible for the bed level change, which has been associated with the hydrodynamic model to obtain a morphological-hydrodynamic model.
The fully spectral wind-wave model used to compute the wave parameters is SWAN (Simulating WAves Nearshore), an open source third generation model [
47], which solves the wave action density balance equation, applying a finite difference method.
The morphological-hydrodynamic model and SWAN interact through water depth, bottom height, currents, wave field and radiation stresses. The two models run separately one after each other and exchange the results of the former as input for the latter and vice versa [
20].
Each model runs for 1200 s and it works on its own computational grid. The results are interpolated on an exchange grid, to be transferred from one model to the other. The whole process is managed by a main program that runs the two models alternatively until the end of the simulation.
Based on the characteristics of the models described above, two different computational structured grids have been realized: one for the wave generation model and the other for the morphological-hydrodynamic model.
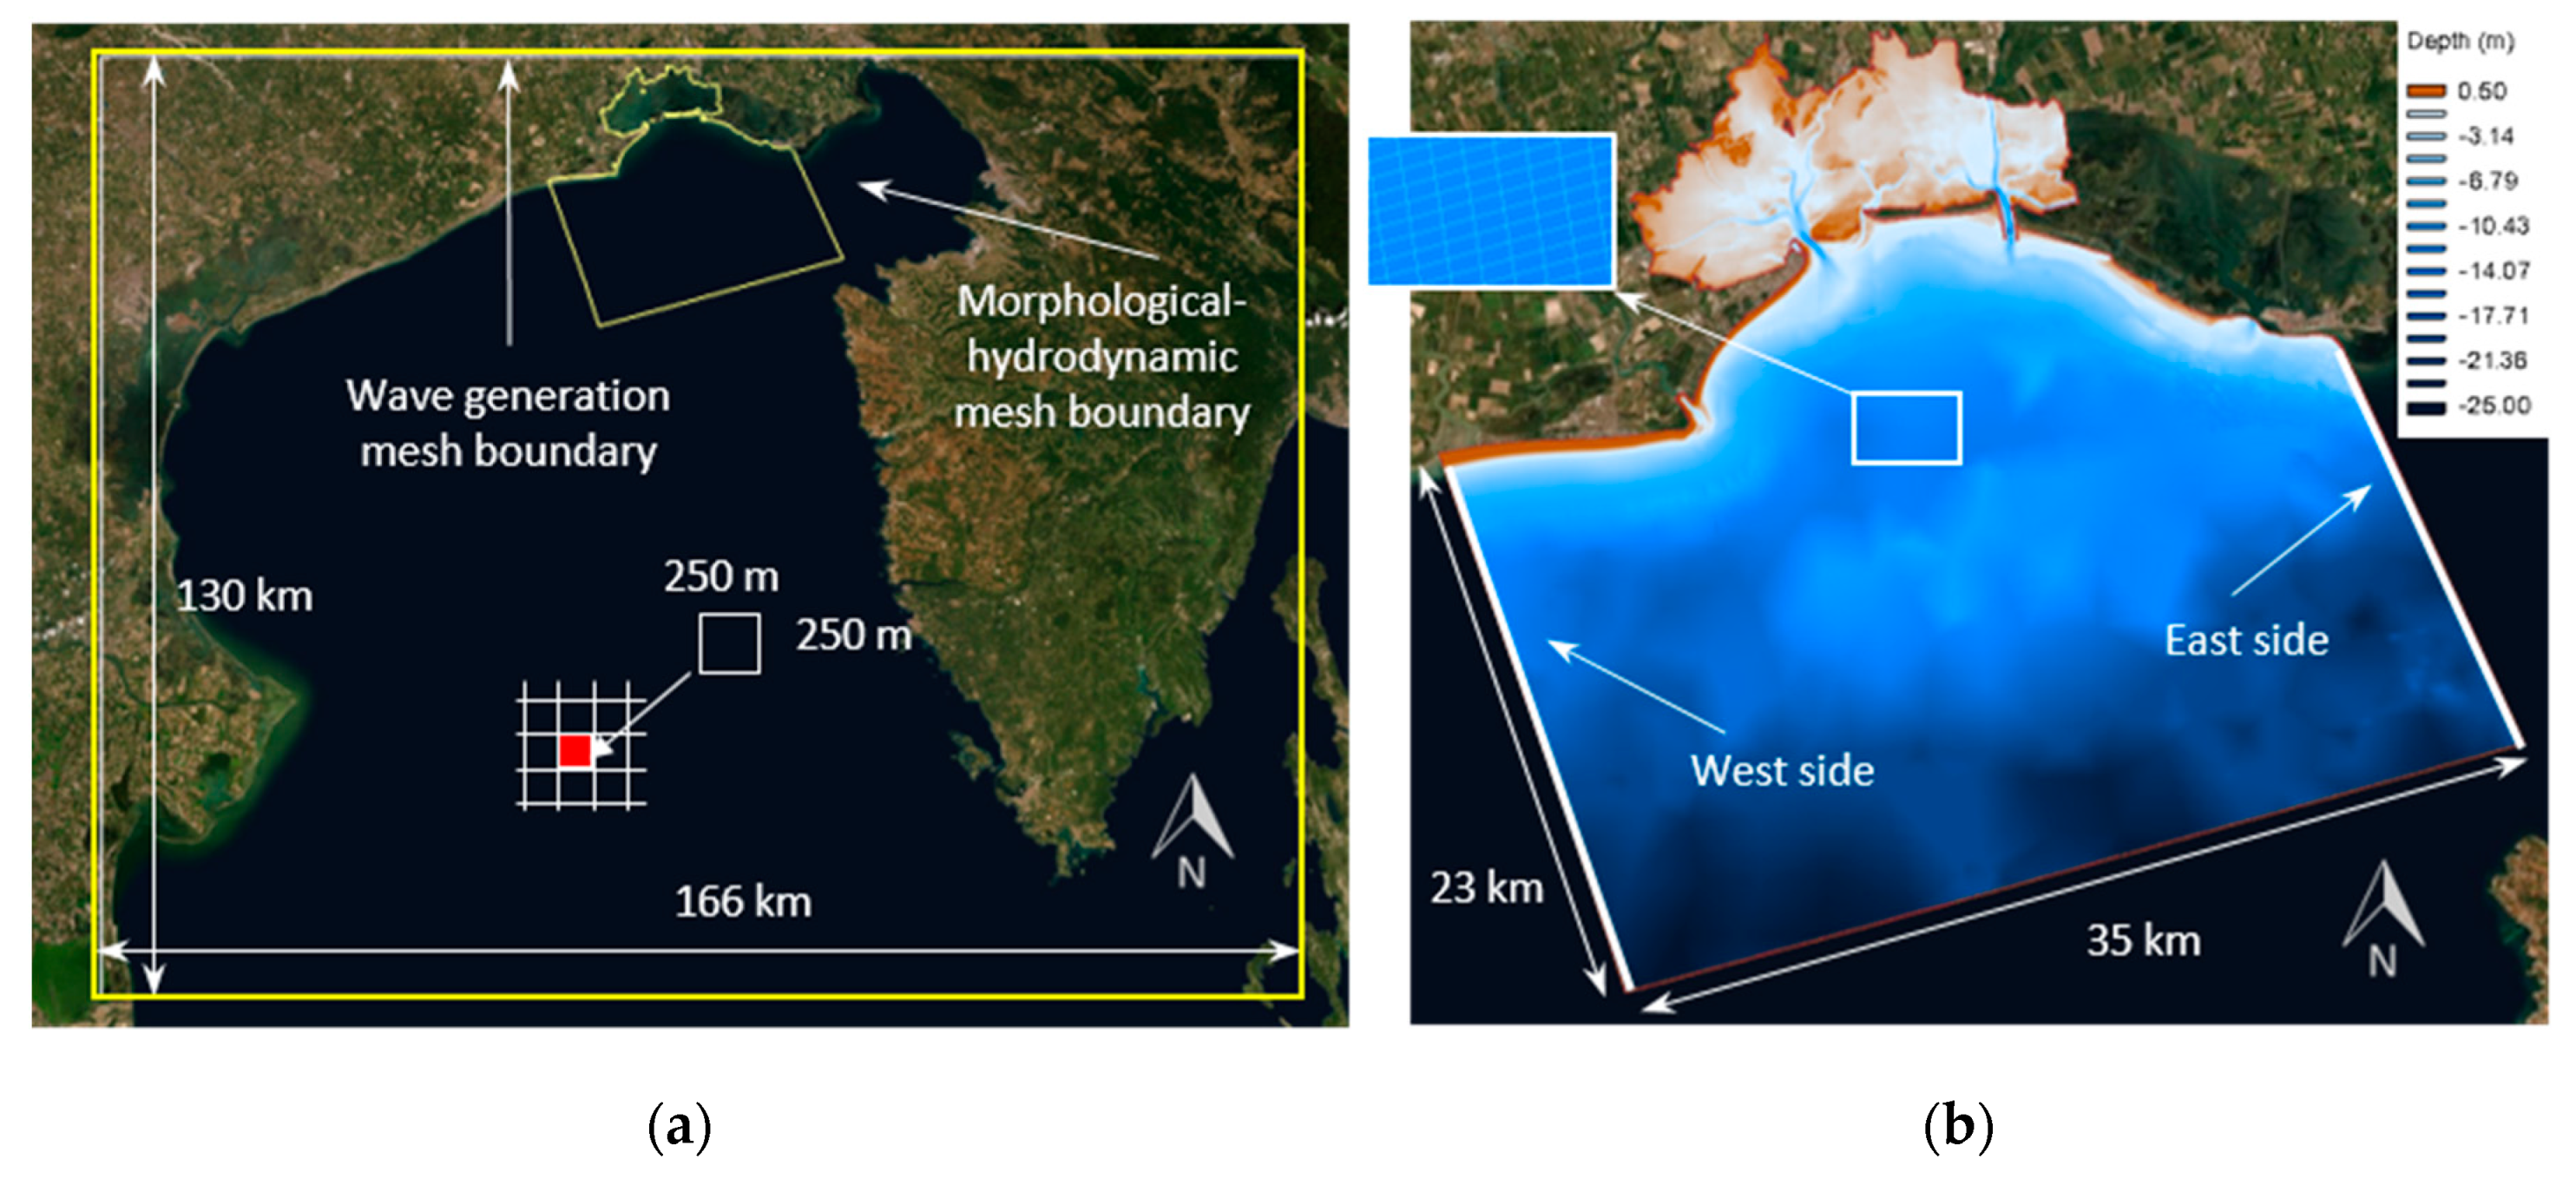
The wave generation process is a physical phenomenon, which involves the whole Adriatic Sea, and for this reason the wider the generation area, the more accurate the wave motion representation is. With this in mind, this mesh should cover a large area, which should also be represented in a sufficiently detailed manner. Therefore, to keep the computational times compatible with our purposes, it has been decided to discretize the northern Adriatic Sea, covering an area which extends for 130 km in the north-south direction and 166 km in the east-west direction. The resulting mesh has approximately 300,000 squared elements with size of 250 m (
Figure 7a).
The computational grid for the morphological-hydrodynamic model should cover a considerably smaller area in order to allow the use of denser cells and hence ensuring a higher resolution of the hydrodynamic variables. For this reason, in this work the morphological-hydrodynamic grid reproduces part of the Marano and Grado lagoon and a portion of the sea in front of the coast of Lignano (
Figure 7b). This smaller domain has been discretized with approximately 200,000 quadrangular irregular elements with sides ranging from 0.8 m to 375 m, where the smallest have been used to guarantee a particular detailed representation of the Lignano inlet area.
The bed elevation of both the computational grids has been assigned as in [
9,
22] combining several datasets, dating between 2000 and 2017. This was a necessary choice due to the lack of suitable surveys relating to the periods immediately preceding and following the construction of the Marina Punta Faro port.
Regarding the boundary conditions assigned to the morphological-hydrodynamic mesh, a reflective condition has been applied to all land boundaries, while on the seaside a tidal boundary condition has been used. Considering that in the Adriatic Sea the tide moves counter clockwise [
48], the same tidal oscillation has been assigned to the “east side” and “west side” boundaries (
Figure 7b), with a time shift of about 50 minutes, as deduced from preliminary simulations aimed at determining the tidal propagation speed. For the spectral grid, outflow boundary conditions have been imposed at the southern boundary, allowing the waves to freely leave the domain.
Manning’s coefficients used to evaluate current bed shear stress have been assigned as in Petti et al. [
20] for the portion of mesh that describes the lagoon, while for the sea side a Manning’s coefficient of 0.025 s/m
1/3 has been applied. According to measurement campaigns carried out by ARPA FVG [
49], the fraction of cohesive sediment tends to zero in the tidal inlet, which is the focus of this study, and also on the seaside. Hence, in this work only granular sediments have been used, with a mean diameter of 200 μm. This value has been obtained following granulometric investigations carried out on a series of samples taken along the Lignano littoral by OGS (National Institute of Oceanography and Experimental Geophysics) [
50].
4. Wind and Tide Characterization
As stated above, the morphological evolution of the tidal inlet is strongly influenced by tides, wind waves and their mutual interaction. Tidal oscillations directly enter the morphological-hydrodynamic model as boundary conditions and indirectly into the spectral model since they affect water level and currents. On the other hand, wind energy input is fundamental in the wave generation process and acts as a drag force over the water surface in the morphological-hydrodynamic model.
The simulation setup is defined selecting the forcings which govern the morphodynamic mechanisms that occur over an average year on the present configuration. This choice is based on the availability of the measured data. On the one hand there are no precise and extensive bathymetric surveys carried out in the period immediately before or after the construction of the pier; since the bed morphology is one of the main variables that greatly affects and controls the results, this work is a first attempt to verify the current situation rather than the morphological evolution over a decadal period. On the other hand, there are no extensive bathymetric surveys carried out subsequently, with a relatively short time lag, through which the model can be validated.
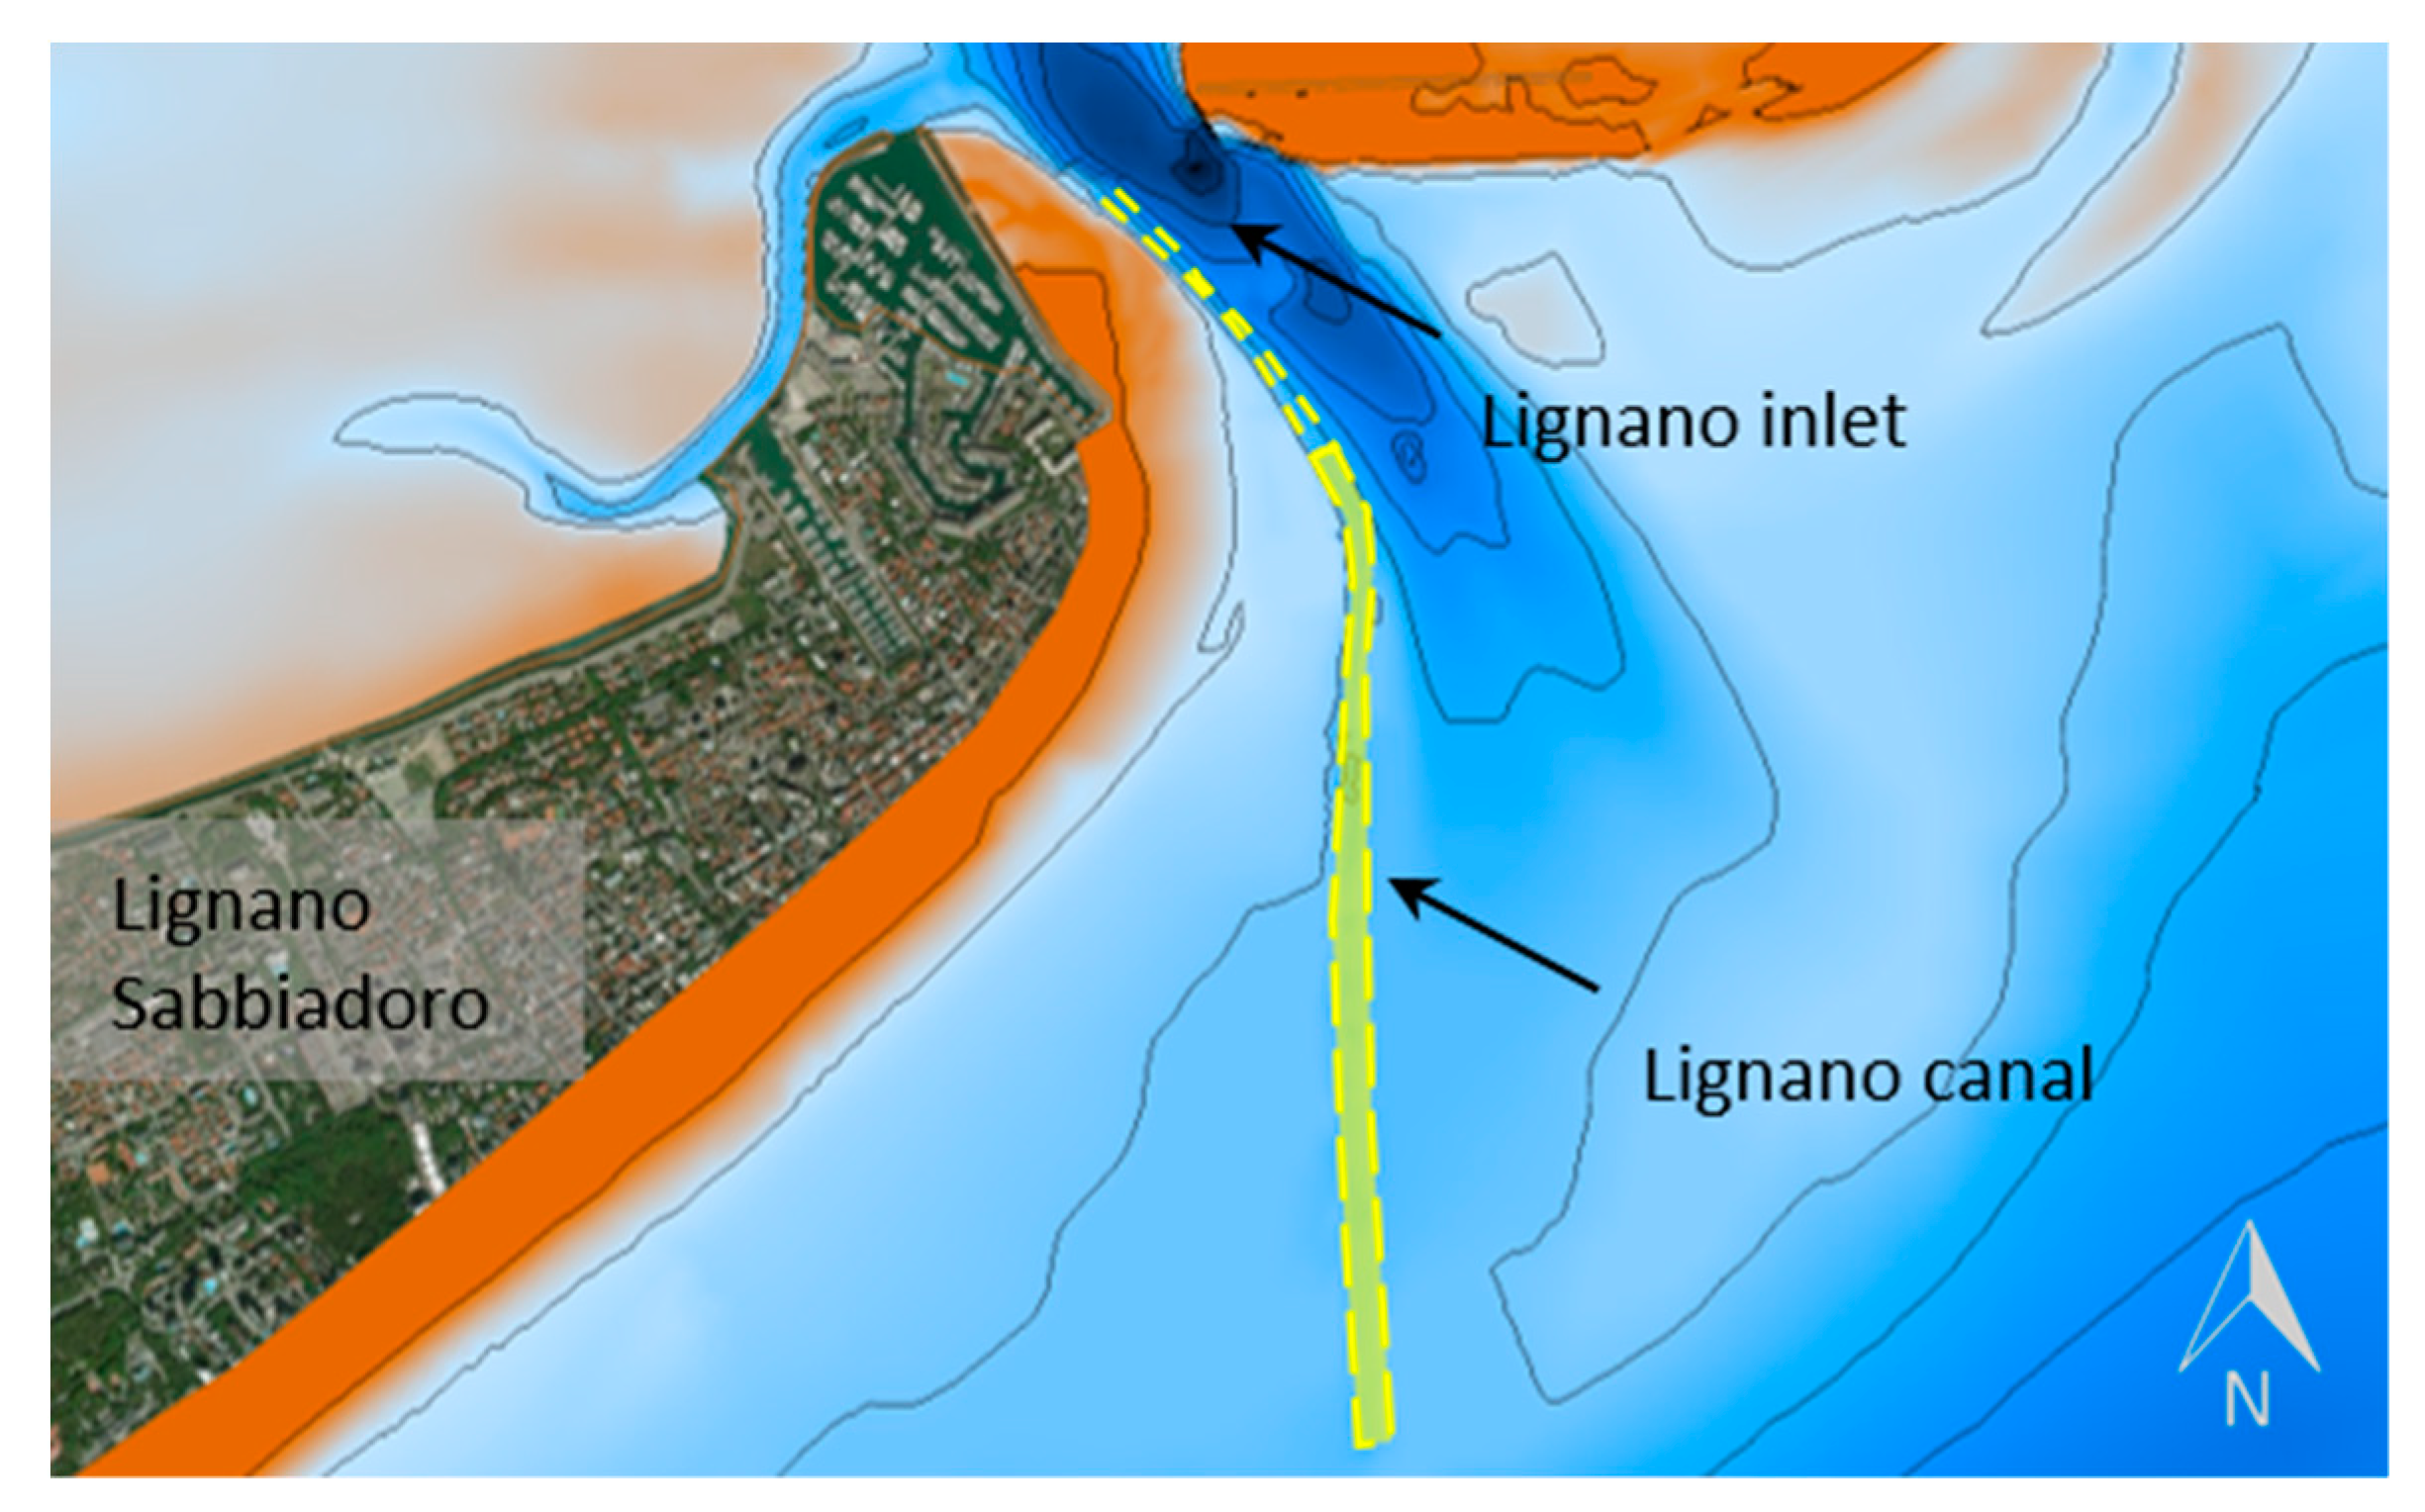
The choice of the most appropriate input data for the examined study therefore has been performed considering the volumes of sediments yearly deposited inside the Lignano canal, which is depicted with a yellow dashed line in
Figure 8.
This channel is used by vessels to move between the open sea and the harbor sites located within the lagoon. For this reason, in order to guarantee navigability, the channel undergoes annual dredging interventions, removing a volume of approximately 30,000 m
3 of sediments which deposit every year inside the terminal part of the sea side channel (the yellow fill in
Figure 8).
In a previous numerical application, Petti et al. [
20] investigated the morphological evolution of the inner part of the Marano and Grado lagoon over an average year, for which a sequence of winds and tides acting over that time was reconstructed. The predicted seabed changes matched the annual dredged volumes in the more critical branches of the lagoon. This result confirmed the validity of the approach, which linearly composes events and their induced effects to describe the morphodynamic global trend, following a criterion generally adopted in maritime hydraulics.
This approach is therefore similarly proposed to study the morphological evolution of the Lignano tidal inlet. The analysis is then extended to the northern Adriatic Sea to derive the corresponding wind and tide input data.
4.1. Wind Input
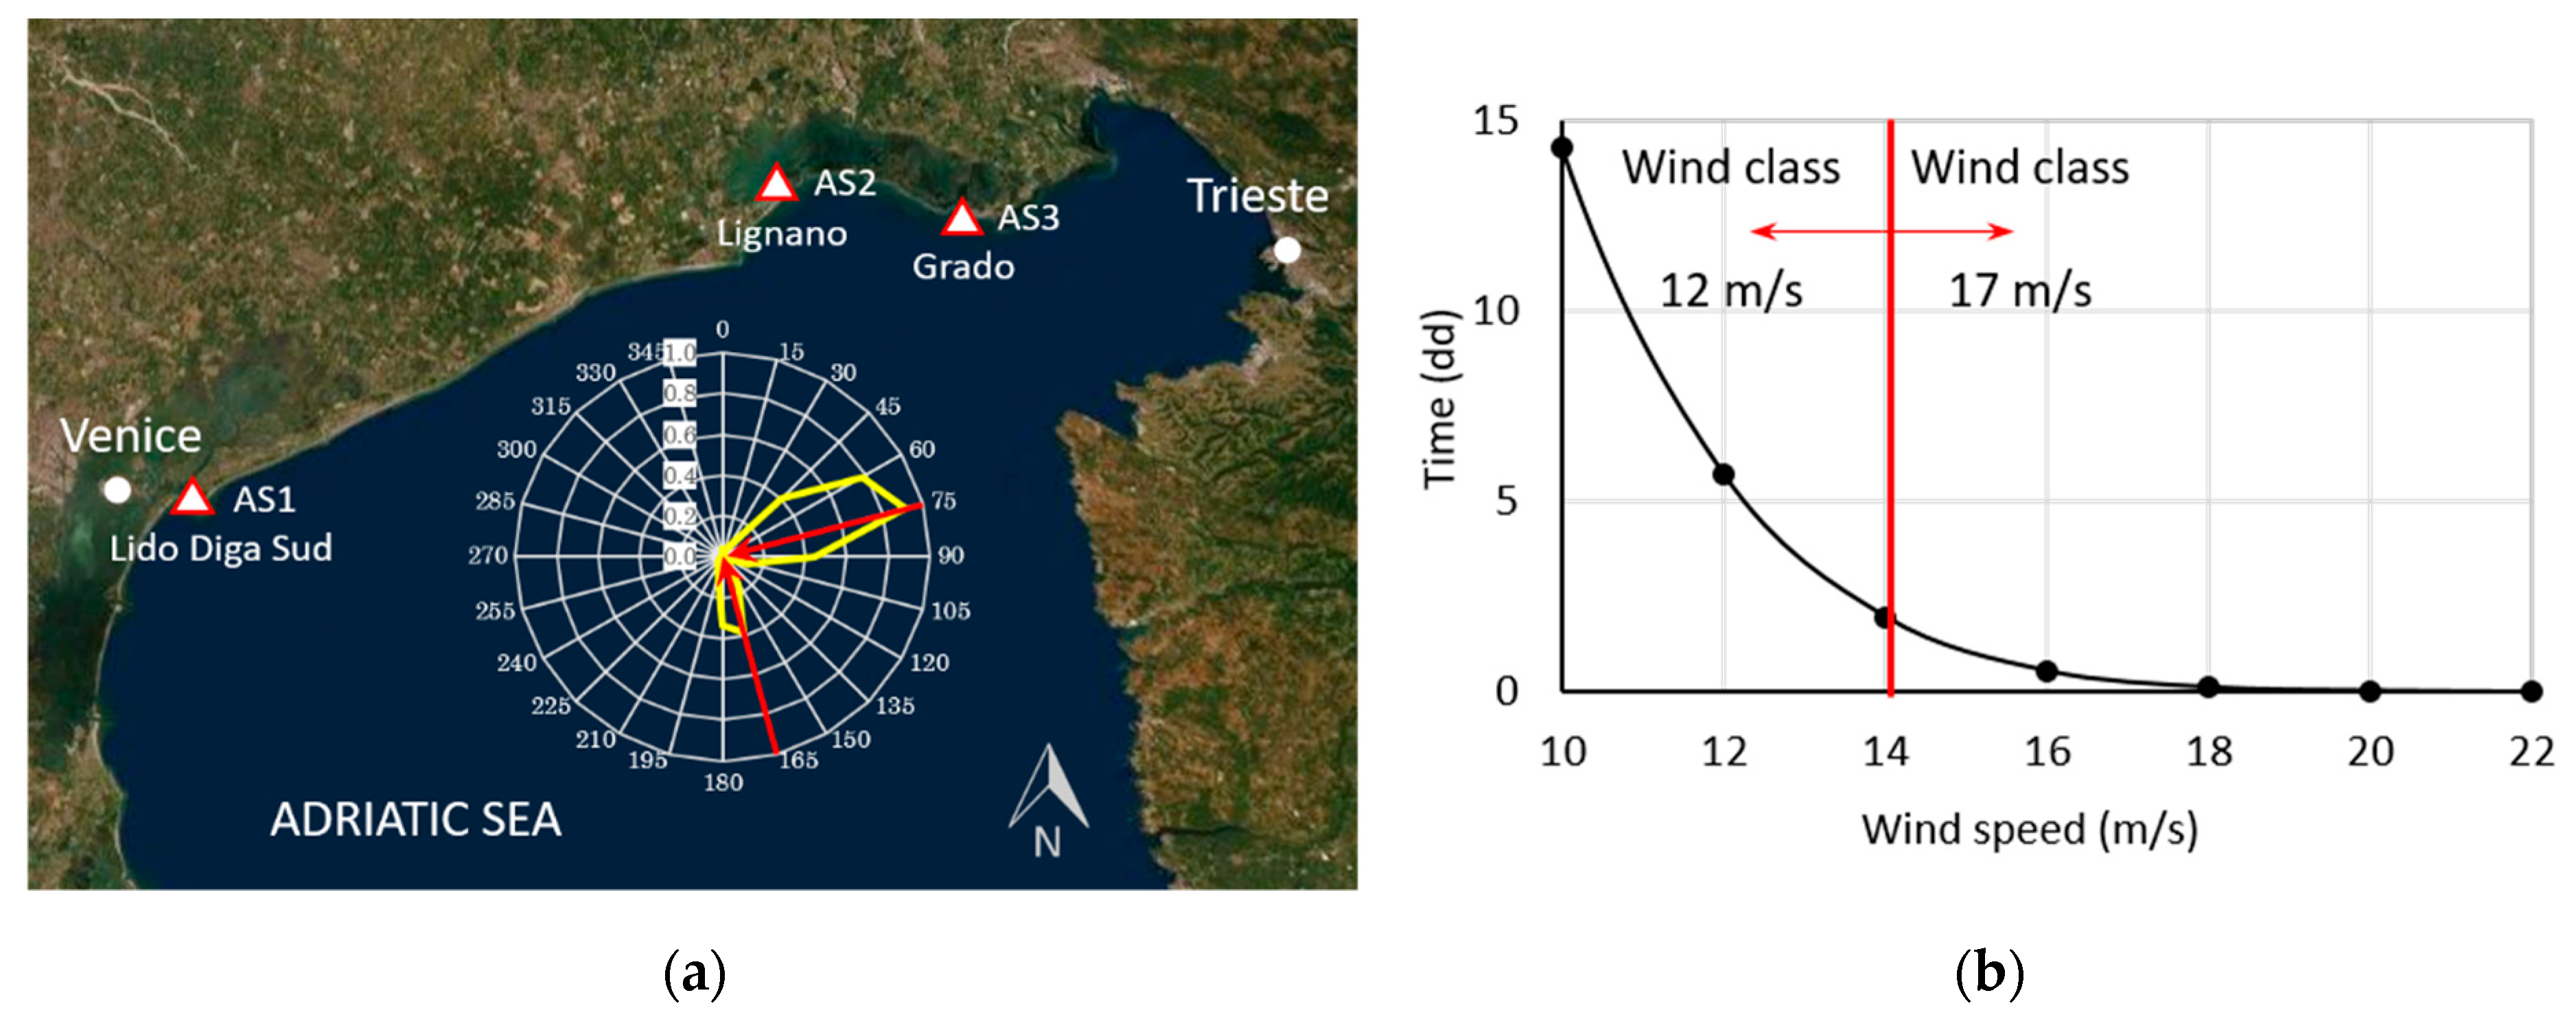
Three anemometric stations, relatively close to the study area, have been considered: Lido Diga Sud, Lignano and Grado, reported in
Figure 9a. More than one million items of data, measured from 1998 to 2017, have been analyzed in terms of wind speed and direction. Petti et al. [
22] performed preliminary simulations aimed at studying the longshore transport in the Lignano nearshore and the morphological effects induced by the groynes built close to the Tagliamento river mouth. The need to sum up the collected wind data to derive an annual average anemometric characterization, has made it necessary to identify appropriate classes of both direction and speed. The measurements of the three anemometers were summarized by Petti et al. [
22] to create a single directional frequency distribution representing the offshore annual average wind regime. This was done taking only those sectors that are not affected by the frictional interferences of buildings or dry land from each station.
The results of the performed simulations showed that the sediment transport dynamics in the Lignano nearshore is predominately influenced by high intensity and low frequent wind events instead of more frequent and lower intensity ones. The same happens inside the Marano and Grado lagoon and similar contexts [
20,
34], for which waves generated by wind speeds greater than 10 m/s play the dominant role in sediment transport mechanisms. Following these considerations and the duration curve of the higher wind velocities depicted in
Figure 9b, two classes have been defined: the first from 10 to 14 m/s and the second one from 14 to 22 m/s. The representative velocities are respectively 12 and 17 m/s, identified as barycentric ones of the areas subtended by the duration curve. The relative polar chart, reported in
Figure 9a, shows that the two main blowing directions are 75°N for the Bora-Levant wind and 165°N for the Sirocco wind.
The duration of each wind class, over an average year, has been estimated on the above-defined curve and the summary is proposed in
Table 1.
Furthermore, to avoid excessive computational times, different morphological factors have been assumed to amplify the volumes of erosion and deposition in particular during the Sirocco and Bora/Levant winds with intensity of 12 m/s. This choice is based on the linearity hypothesis of the applied methodology and on the morphological factor approach [
7,
31], which is the most common criterion to scale the calculated erosion and deposition by a constant factor. This factor can vary according to the different events considered as suggested by Walstra et al. [
27].
The sequence of wind events is interspersed with calm periods lasting a few hours in order to allow the inertial decay of the phenomena from a hydraulic point of view and the consequent deposition of suspended material [
27].
4.2. Tidal Input
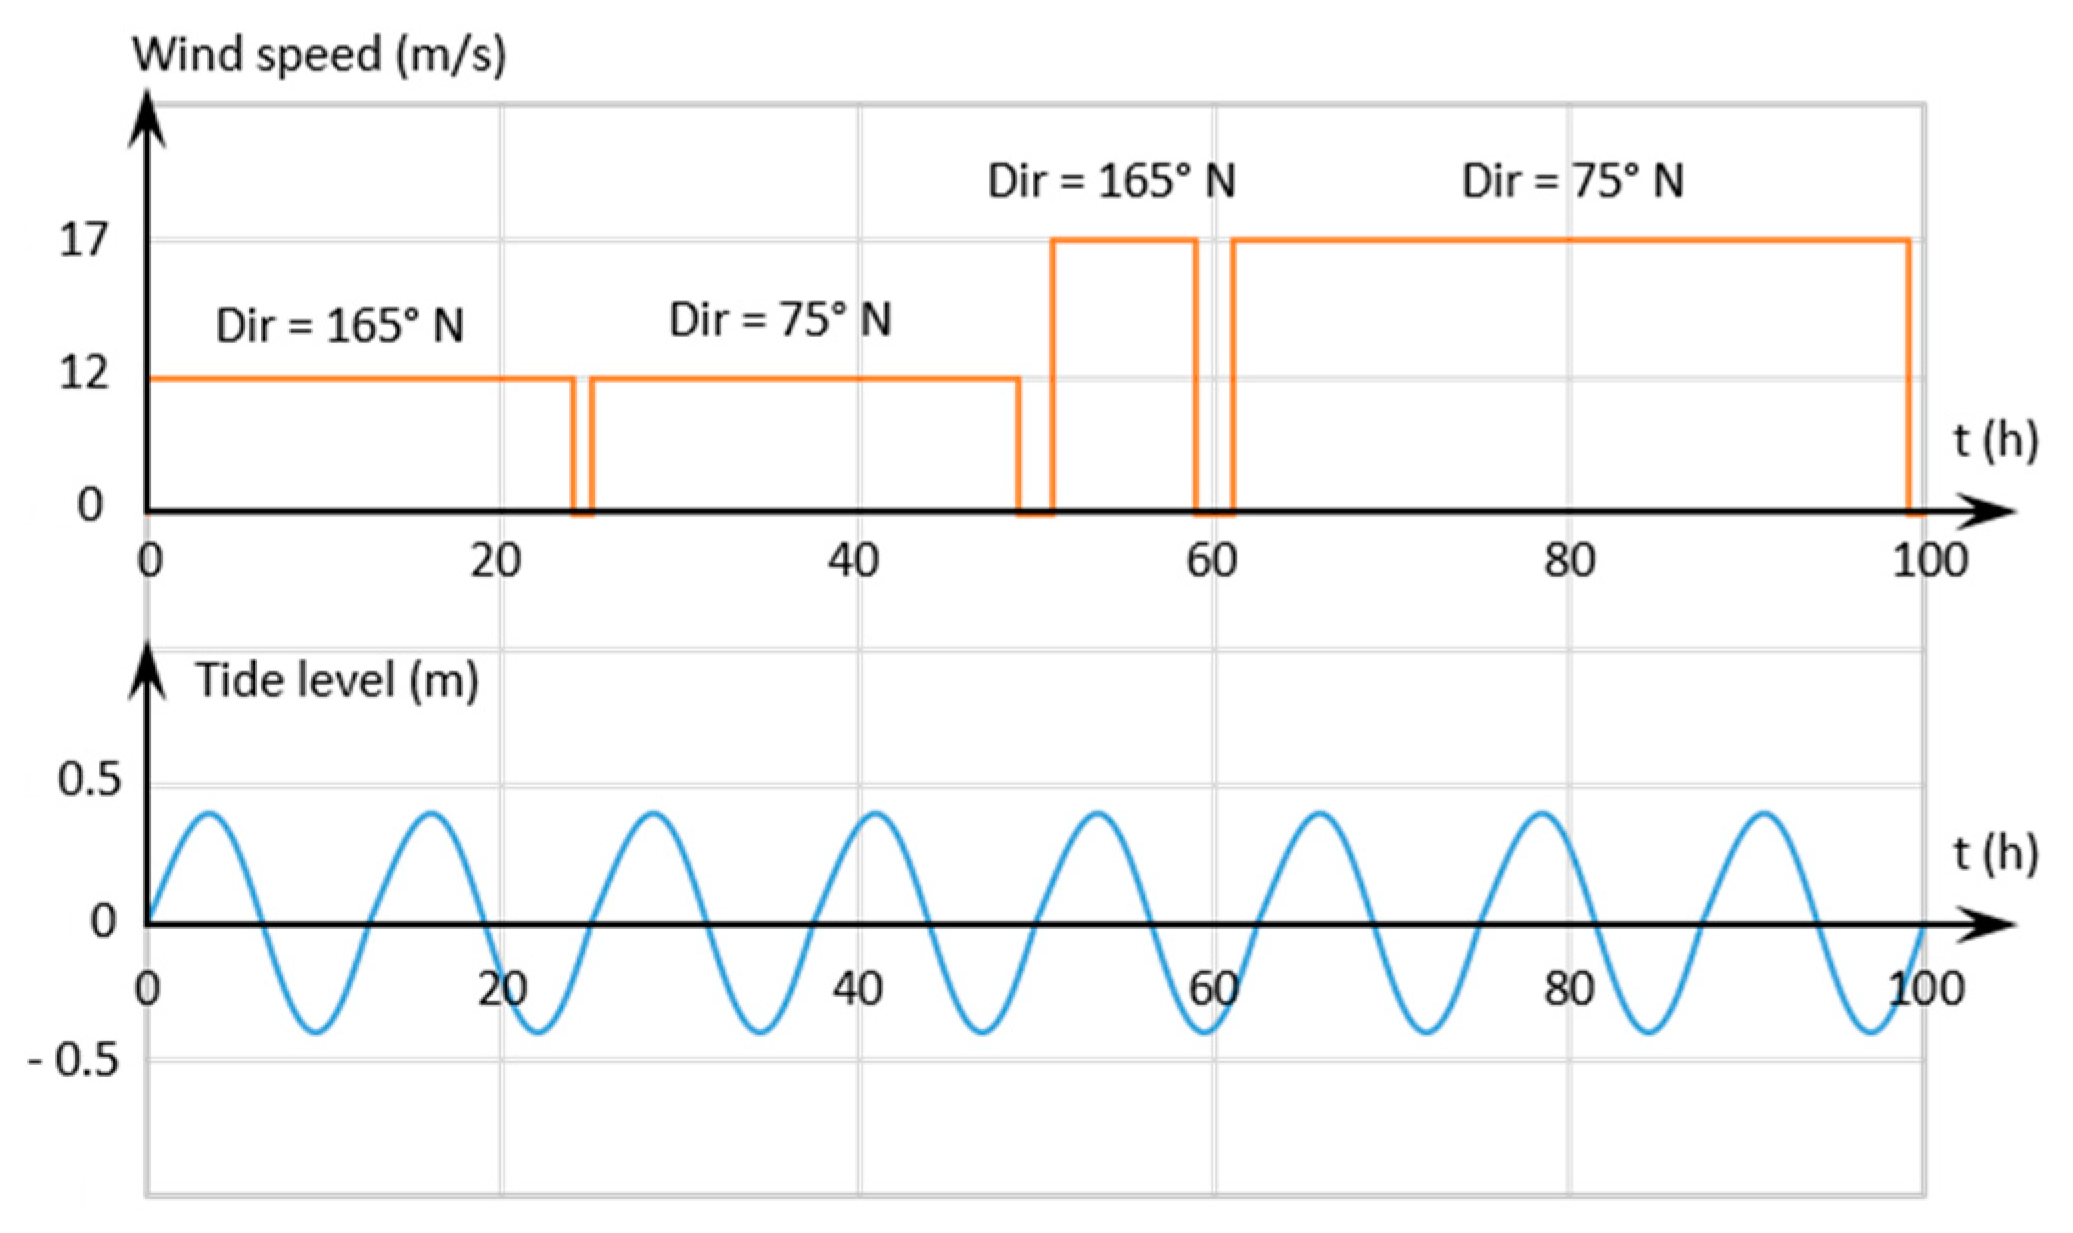
The defined wind series has to be combined with a representative tide; to study the morphodynamic processes governing the inner part of the Marano and Grado lagoon, an annual average tide was defined combining the three main harmonic components, solar semidiurnal, and lunar diurnal and semidiurnal respectively [
20]. The resulting signal has a periodicity of about 13 days which however is difficult to associate with the wind events defined in
Section 4.1.
For this reason and as an initial simple approach, a sinusoidal function with a single harmonic component has been chosen, having an amplitude equal to ± 0.40 m. This value corresponds to the average astronomical tidal range in the northern Adriatic Sea, as reported by Dorigo [
51] and confirmed by a zero-crossing analysis, carried out over 24 years of recording of the Grado tide gauge [
20,
34]. The resulting wind and tide input conditions are shown in
Figure 10.
With this synthetic input set of forcings, the simulation of the average year has led to a sand deposit in the Lignano canal of about 17000 m
3 (
Table 2). This volume is comparable with the annual dredged material, but this result is not yet sufficient to state that the phenomenon is correctly interpreted by the model.
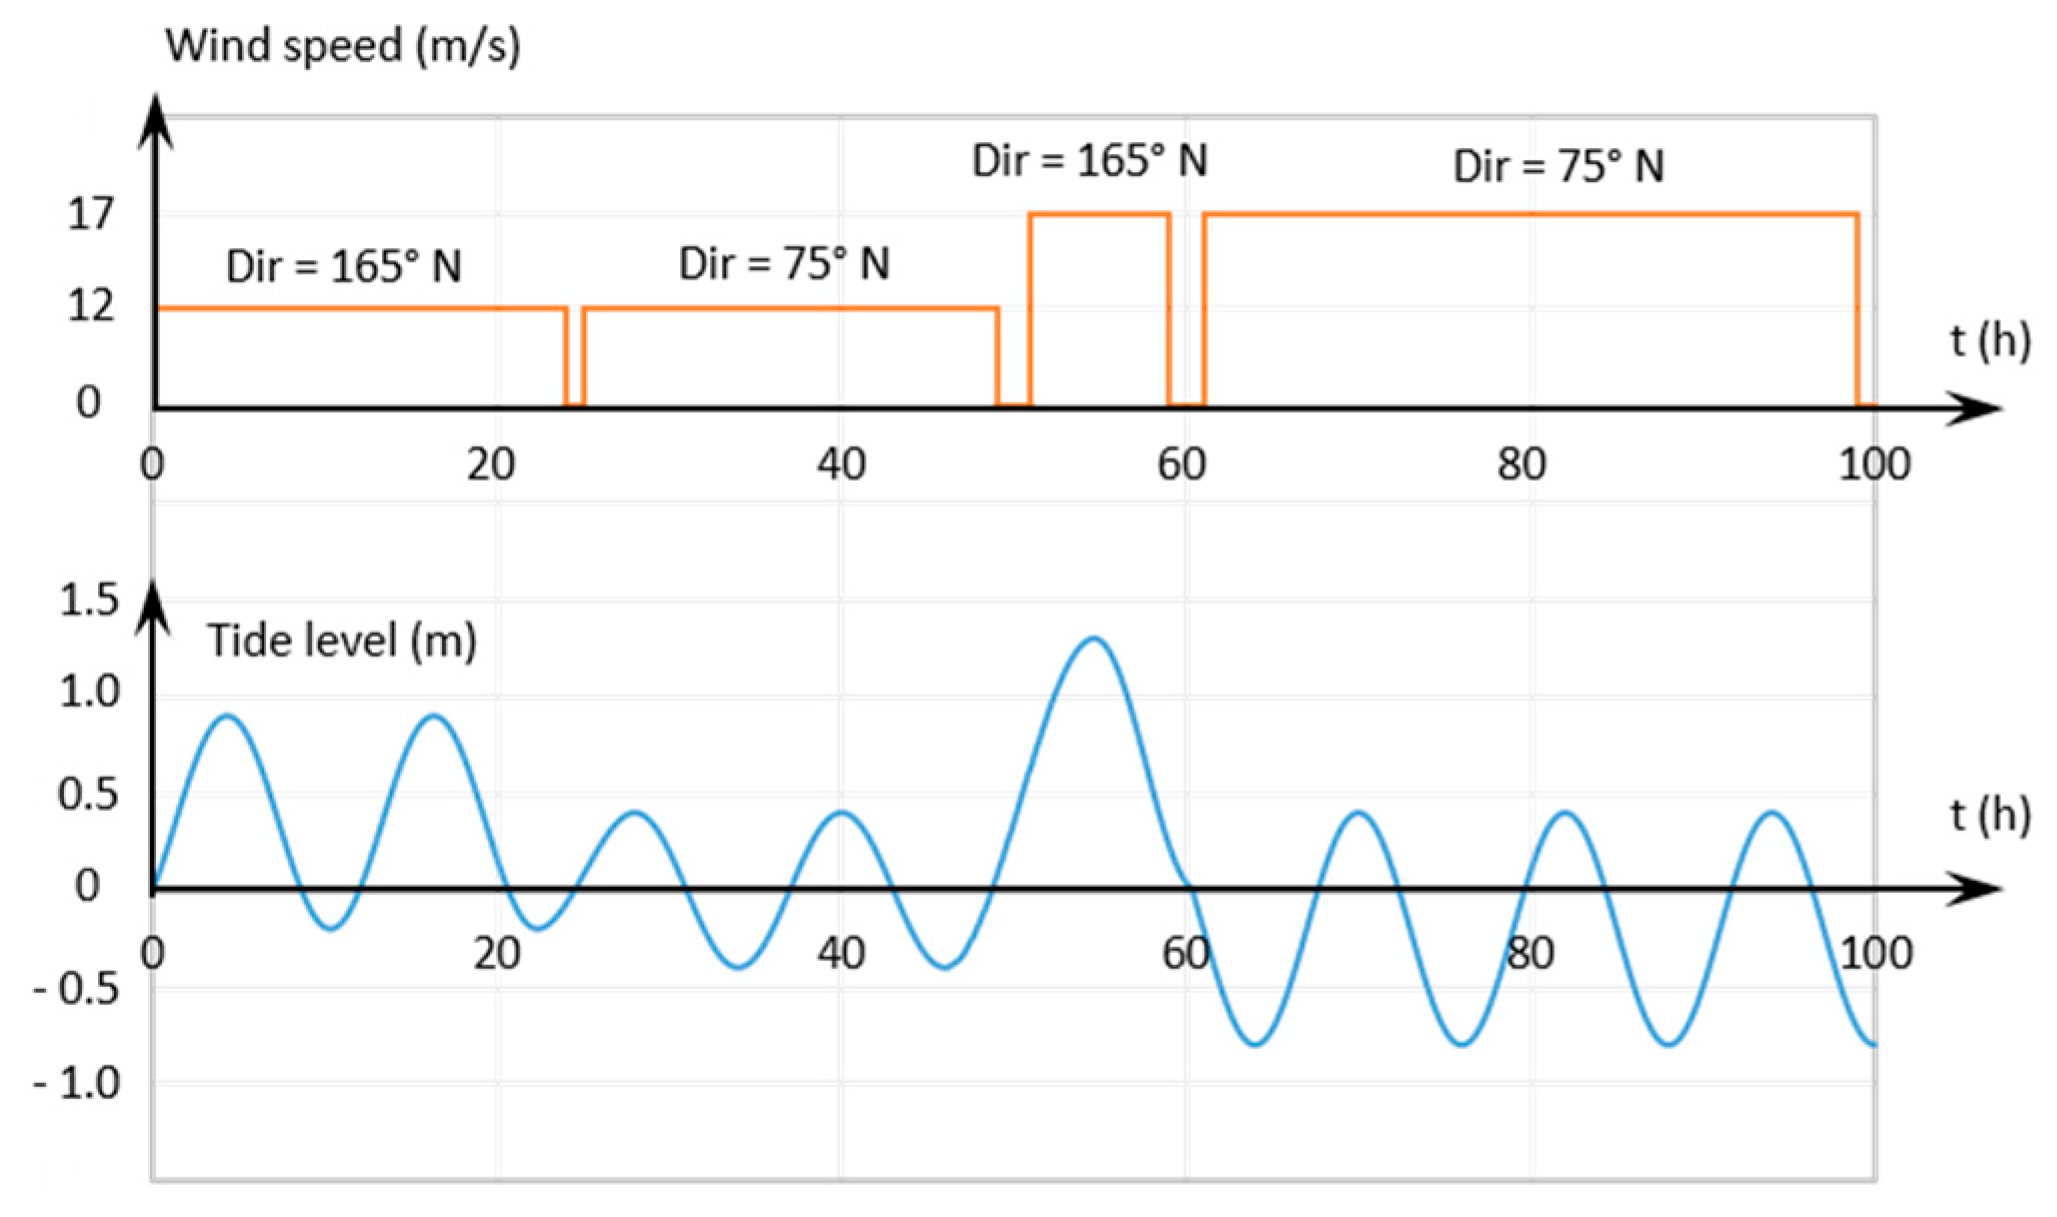
The northern Adriatic Sea is often subject to sea level rises due to the tidal meteorological component, in particular during Sirocco storms [
52], which are also often associated with low pressure conditions. Petti et al. [
9] have analyzed the water levels recorded during Sirocco and Bora/Levant events with maximum wind speeds of about 12 and 17 m/s. It has been noted that tidal oscillation undergoes strong variations: the mean water level considerably increases during Sirocco events while it decreases during Bora/Levant events.
This is realistically due to the meteorological component linked to the drag effect of wind blowing on the sea surface and to the pressure differences between the southern part and the northern part of the Adriatic Sea during the Sirocco events. In fact, winds blowing from south-east, as in the Sirocco case, have a large fetch and they induce higher mean sea levels in the northernmost part of the Adriatic Sea. On the contrary, winds from north-east tend to accumulate water towards the western Venice lagoon, lowering the mean water level in front of the Marano and Grado lagoon. Based on these considerations, Petti et al. [
9] have proposed a procedure to reconstruct tidal oscillations in conjunction with the highest wind events, thus also taking into account the meteorological component, comprehensive of both wind drag effects and pressure differences. The new sequence of winds and tides is depicted in
Figure 11.
This new input set of winds and tides, representative of the average year, provides a sand deposit of approximately 29,000 m
3 inside the Lignano canal. The comparison with the previous result in
Table 2 and the real dredged volume highlights that this sequence is more realistic than the previous one and it largely falls within the accuracy that can be achieved with this type of model. These results confirm that the effects of an average year make it necessary to impose the tidal oscillations associated with the wind events, as boundary conditions.
5. Results
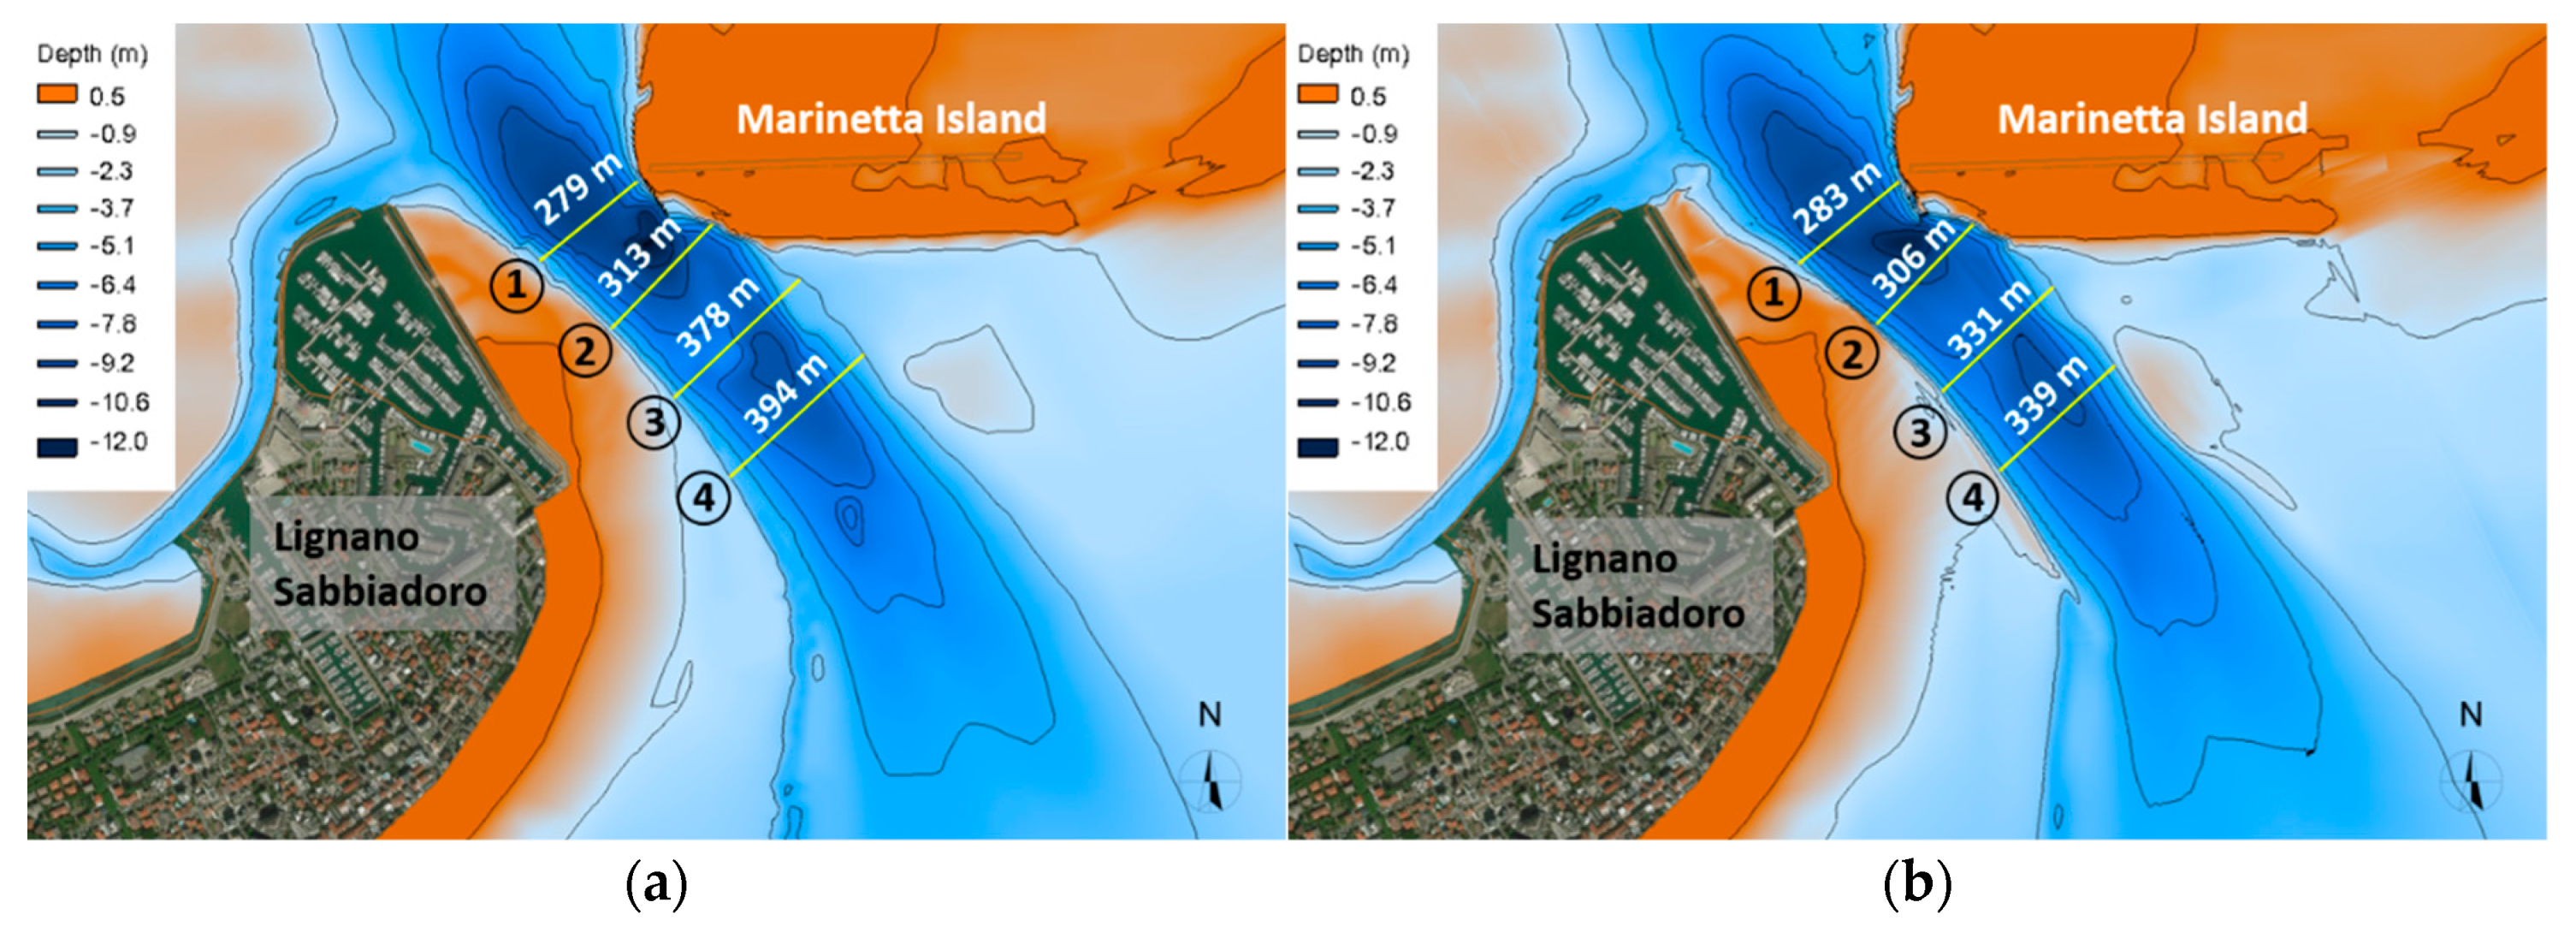
The morphological evolution over an average year of the Lignano tidal inlet has been simulated, with the aim to verify the narrowing process triggered by the construction of Marina Punta Faro port. In
Figure 12, the bathymetric comparison is reported between respectively the current configuration and the depths resulting after an average year. Four sections have been selected and the relative cross width has been computed, taking the same contour line as reference.
The narrowing effect is more evident on the sea side in correspondence with
Section 3 and
Section 4, due to the deposition of sand on both the sides of the tidal inlet, while toward the lagoon this phenomenon is more contained.
Section 1 seems to be in countertrend, with a slight enlargement which is however coherent with the temporal evolution of the horizontal surface area in recent years, as shown in
Figure 4. Moreover, the greater deposit involving the external part of the tidal inlet, i.e.,
Section 3 and
Section 4 with respect to
Section 1 and
Section 2, is confirmed by the fact that the southern branch of the port access canal is subjected to periodic dredging operations. This result suggests that most of the material comes from the sea and from the coast adjacent to the tidal inlet.
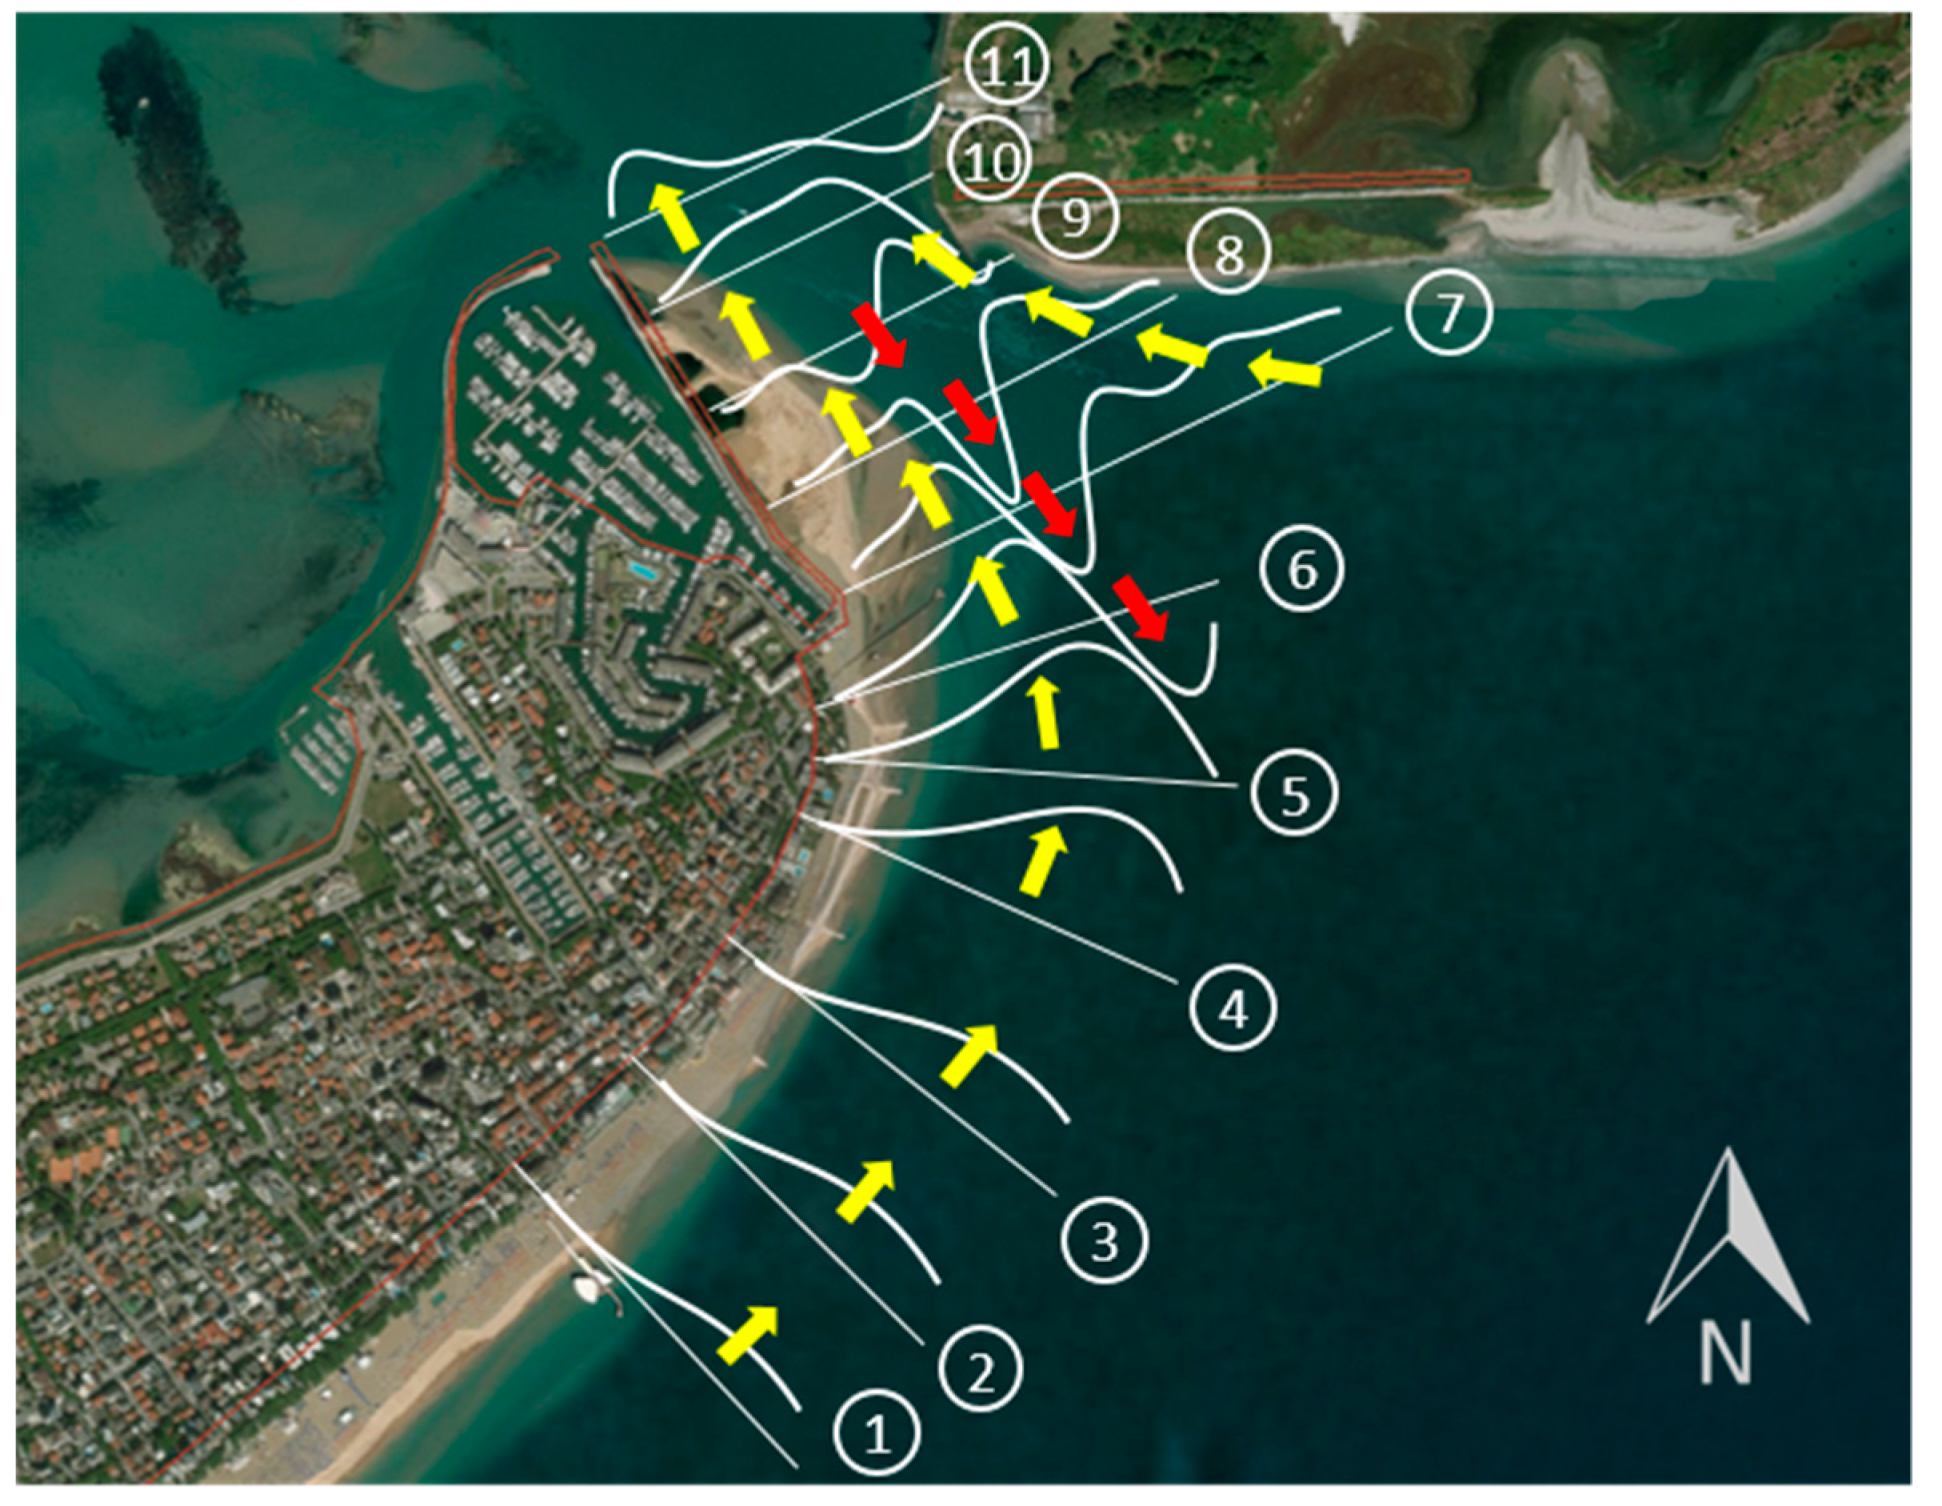
In order to better analyze this morphodynamic process, eleven sections orthogonal to the Lignano shoreline have been considered: the first six were taken up to a limit distance of about 650 m from the coast, the last five cross the inlet from shore to shore. Through these sections the net sediment fluxes over an average year have been calculated and have been represented by curves that identify positive and negative directions. These directions indicate two overall net trajectories of the qualitative sediment transport through the tidal inlet, as depicted in
Figure 13. On the external sides of the tidal inlet, the net flux of sediments is directed from the outside towards the inside of the lagoon, as indicated by the yellow arrows both near the Lignano barrier and the Marinetta island. In the deepest part of the inlet, the average direction of the net sediment flux crossing the sections is from the lagoon towards the open sea, as shown by the red arrows.
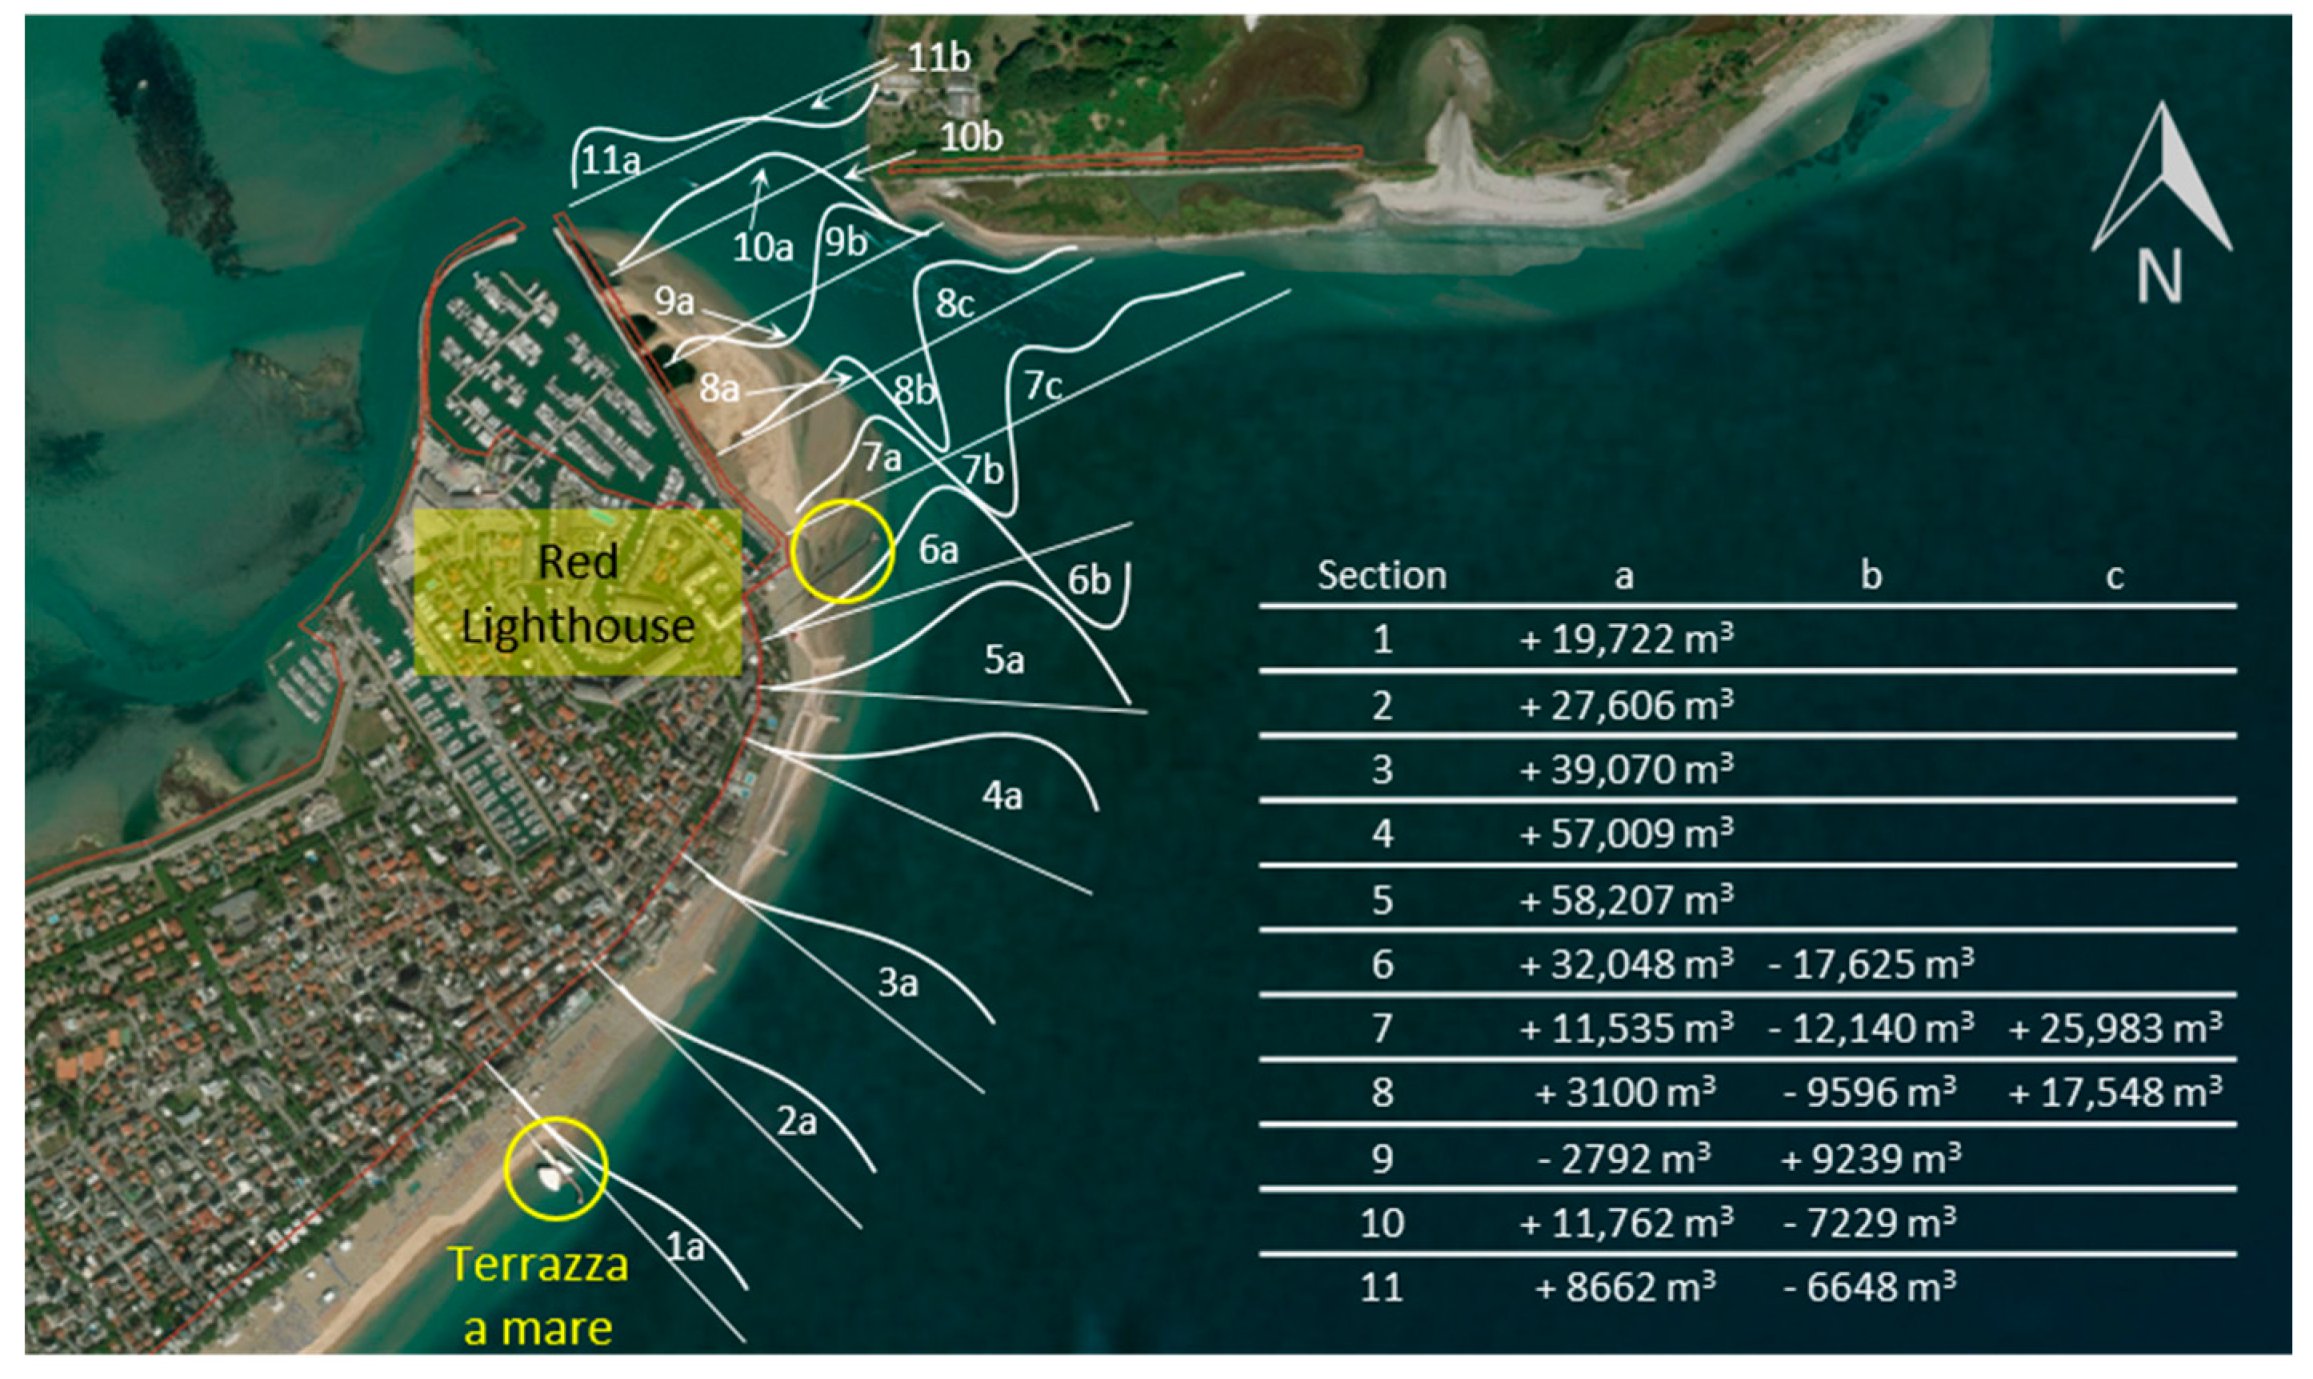
More in detail,
Figure 14 shows the numerical results regarding the net volumes of sediments crossing the selected sections over an average year.
These volumes have been calculated starting from the area subtended by each portion of the curves, identified by a number and a letter. The positive volumes refer to flood directions that move from the outside towards the inside of the lagoon and vice versa.
The difference between the volumes of one section and the next one can suggest whether there is an erosion or a deposition trend of sediments. If the difference is positive, a deposition of sediments occurs, on the contrary an erosion process is triggered within the area between the two selected sections. In this sense, it can be observed that the volume of sediments that progressively crosses the first four sections increases. The difference between Section 4 and 1 gives a total volume of about 37,000 m3 and it corresponds to the sandy material that the north-eastern part of the Lignano Sabbiadoro coast loses over an average year.
This value is consistent with the experimental evidence of the erosion trend which involves the final part of Lignano barrier spit, requiring annual sand nourishments along the coastline between the transparent pier named “Terrazza a Mare” and the Red Lighthouse, as depicted in
Figure 14. From Section 5a to Section 8a, the volumes decrease, confirming that the material tends to deposit near the Marina Punta Faro pier and that this process is triggered from the sea side towards the inside of the lagoon. This numerical result confirms the evolution of the shoreline depicted in
Figure 4.
A further analysis has been carried out to understand how each simulated wind event contributes to the total net sediment volumes over an average year, and the results are reported in
Table 3. For all the considered sections, the Sirocco wind induces a longshore current which tends to move the material from the south-west to the north-east (values with the positive sign in
Table 3) bringing it closer to the Lignano inlet. Instead, in the case of the Bora/Levant, the relative longshore currents can have different net directions.
Petti et al. [
22] verified that the sediment transport induced by Bora/Levant winds along the coast of Lignano, near the Tagliamento river mouth, mainly moves from the north-east to the south-west, reshaping the shoreline profile. This is also the case of Section 1, which in fact has a negative sign in
Table 3, while in the next four sections, the sediment transport reverses its direction contributing in this manner to the supply of the deposit at the Marina Punta Faro pier. Then, Sections 6–11 show that the direction reverses again, favoring the ebb of sandy material from the lagoon to the open sea.
The event that has the greatest influence on the total sediment volume is the Sirocco wind with a speed of 12 m/s, simulated for 24 h with a morphological factor equal to four. Also, the Sirocco with a wind speed of 17 m/s has an important effect on the total annual volume.
Compared to this total volume, the Bora/Levant contribution seems to be less significant, despite the fact that the wind speed of 12 m/s is simulated for 24 h with a morphological factor equal to eight. In this way, it can be concluded that Sirocco events seem to determine the overall handling of the sandy material in the study area, favoring its displacement from the Lignano littoral towards the Lignano inlet area.
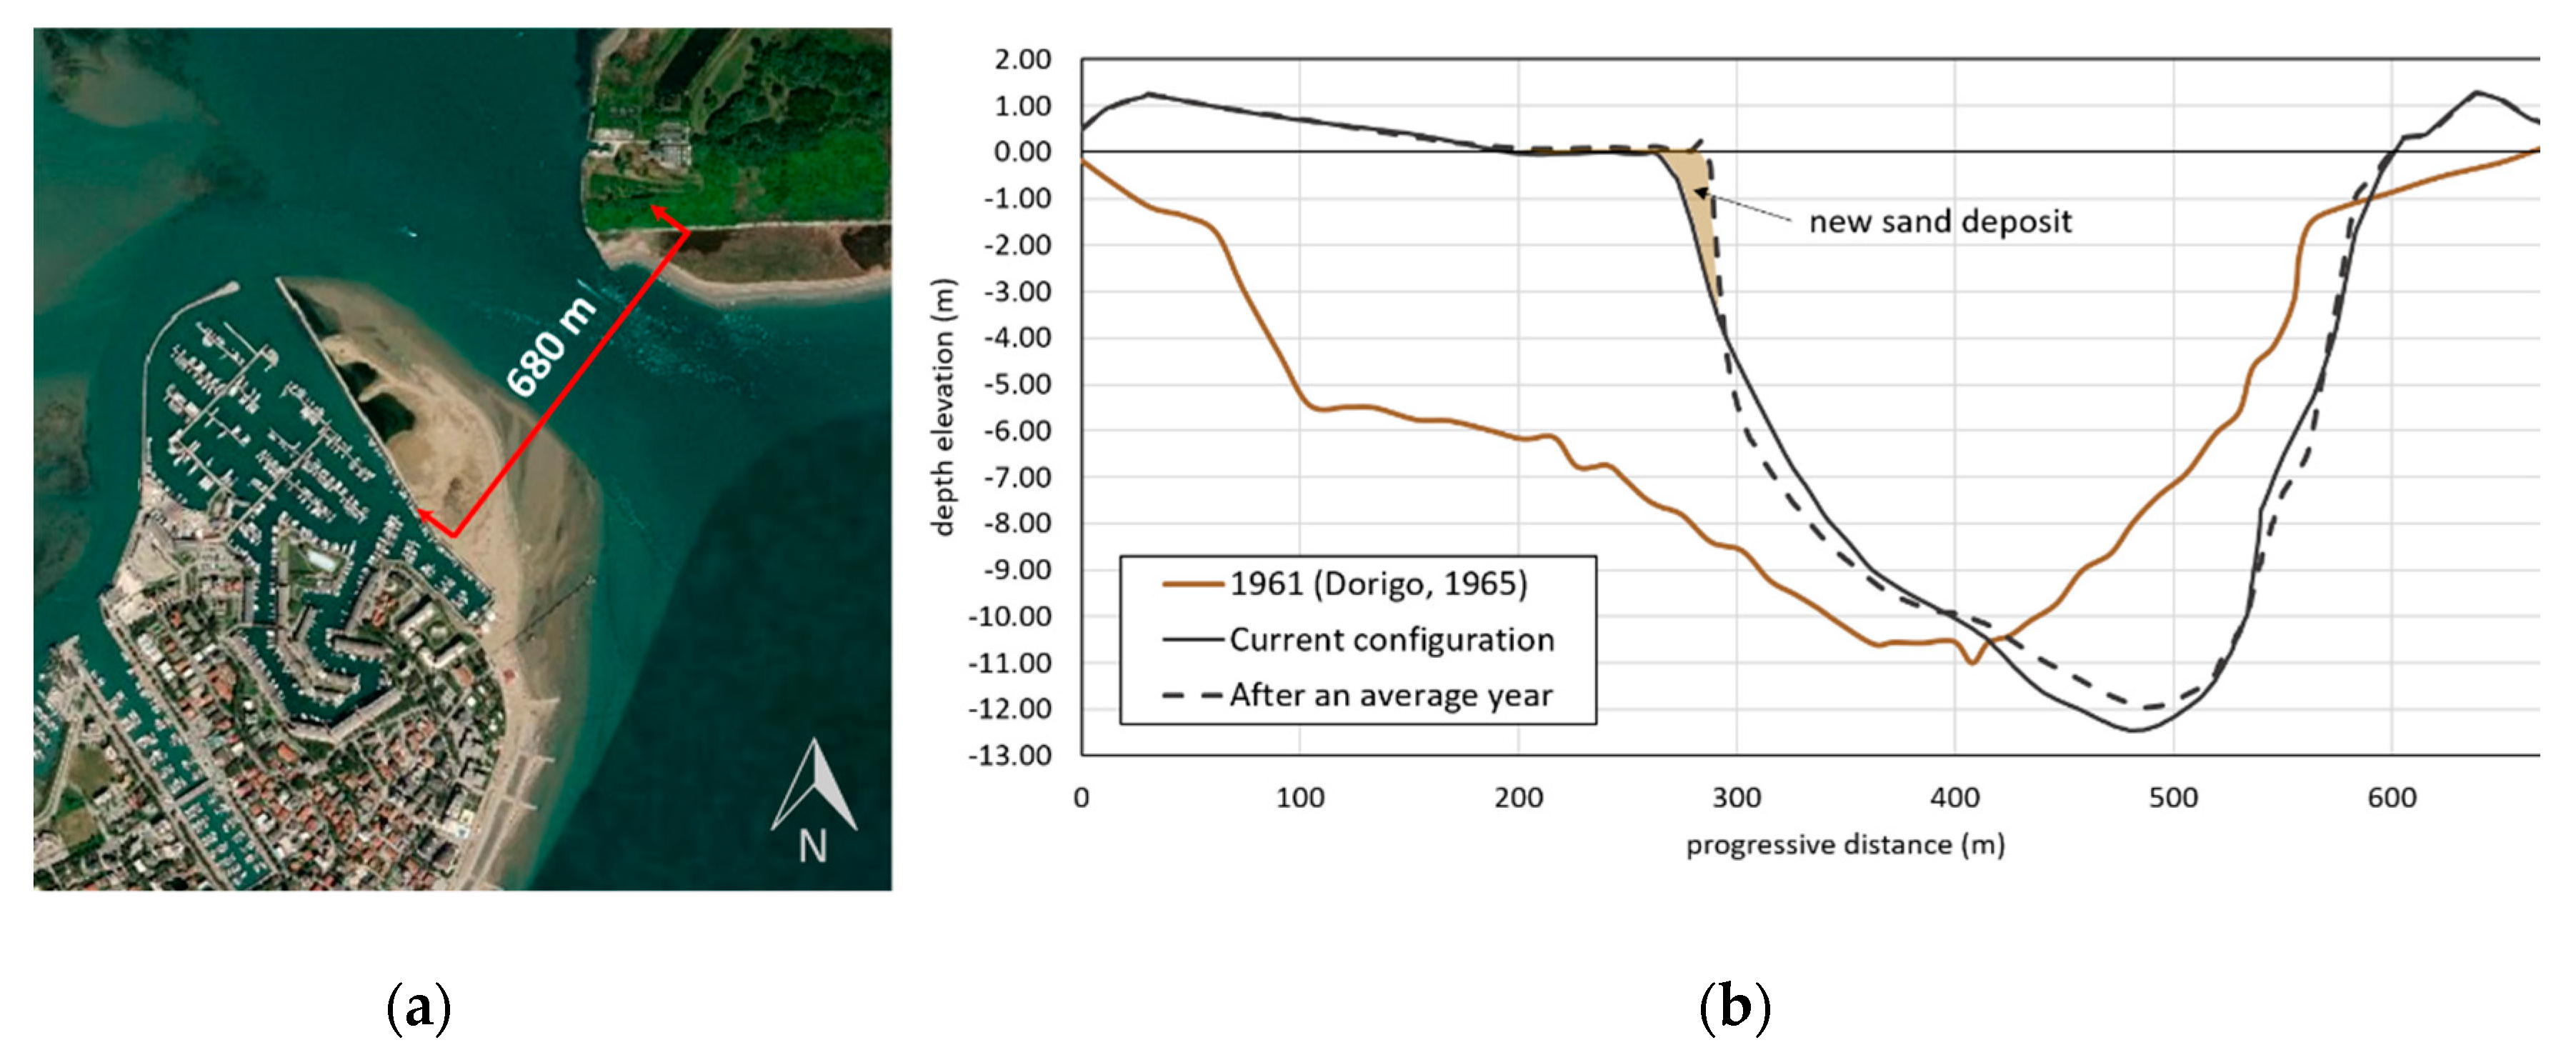
As further proof that the numerical model is correctly interpreting the narrowing phenomenon,
Figure 15 shows the profiles of the selected section (
Figure 15a) in the current configuration and that obtained after an average year.
The comparison between the two profiles, before and after the simulation of the average year, points out the presence of a new sand deposit on the Lignano side, highlighted by the colored hatching. The section tends to change its shape, showing deposits in some places and erosions in others, but overall it nevertheless maintains its own area. The current liquid section measures 2718 m3 and at the end of the simulation is equal to 2682 m3. This suggests that a dynamic equilibrium condition seems to be reached.
This occurs differently between the profile in the current configuration, in 2019, and the only available profile dating back to before the construction of the pier in a 1961 survey carried out by Dorigo [
51] in the analyzed section. In this case significant differences can be observed: on the Lignano side there were no emerging parts, and the center of the tidal channel was slightly closer to the Marinetta island but substantially equidistant between the two sides. In the current configuration the center has moved a hundred meters close to the Marinetta island and has deepened by about 2 m.
In addition to the depth data of 1961, Dorigo [
51] reported the area of the liquid section depicted in
Figure 15a and the flow velocities which were measured in 1952 and 1961 through the same section, during two tide cycles as having an average amplitude of about 105 cm. The area of the liquid section resulted equal to about 3438 m
3 and 3909 m
3 respectively, and therefore the section in the current configuration has decreased by approximately 21.9% and 31.3%.
The volumes of water exchanged during the ebb and flood phases was computed by Dorigo [
51] based on the available velocity data. The same volumes have been determined from the present simulation of an average year, considering the tidal oscillation during the Sirocco event with a wind speed of 12 m/s. In fact, this event has roughly the same minimum and maximum level as those measured in 1952 and 1961, as reported in
Table 4 with the relative water volumes.
The comparison shows that, despite the reduction of the cross section, the volume of water exchanged is very similar to that of the tidal inlet in its natural condition before the construction of the port. This further proves that the current configuration can be considered close to a new equilibrium condition.
6. Discussion
According to the qualitative classification provided by Hayes [
2] based on a representative sample of examined tidal inlets, the energy regime of the Marano and Grado lagoon can be characterized as mixed and tide-dominated. This suggests that both wind waves and tides govern the main morphodynamic processes equally and that, although the definition is not strictly binding for the morphology of barrier islands [
12], these have a drumstick shape, and rounded, large tips. This condition is very close to the one found in the Marano and Grado lagoon system, in particular in the Lignano tidal inlet, at least before the construction of the Marina Punta Faro port.
As indicated in
Section 2, it seems reasonable to state that the geometric shape of the protection piers has strongly altered the profile of the terminal part of the Lignano barrier spit, which has thus lost its natural roundness. The historical analysis of the temporal evolution of the shoreline close to the pier originally provided by Petti et al. [
9] and integrated in the present work as depicted in the new
Figure 4 and
Figure 5, shows that the construction of the Marina Punta Faro has at least accentuated the subsequent deposition of the sandy material, which was already visible from the early 1980s. The morphological considerations that emerged from Hayes empirical scheme [
2] have also made it possible to interpret the historical evolution in order to hypothesize a new conceptual form of equilibrium of the Lignano tidal inlet. Subsequent numerical investigations have been carried out to explore the phenomenon of the narrowing trend, effectively describing the direction and the source of the sediment transport.
The numerical simulation setup has been finalized to represent both the tide and wave conditions that led to this rapid morphological evolution correctly. This currently represents a critical task because the two phenomena evolve on very different time scales and their interaction is not linear. Furthermore, the need to limit computational efforts necessarily requires some simplifications which therefore have direct effects on the results that can be obtained. In this sense, the present study differs from others that have treated only one of the two components, considering either waves [
27] or tides [
25,
26,
28] relevant to the morphological processes.
Another valuable aspect is that the combination of tide, wind and their sequence have been established to simulate a morphologically significant period. Investigations on the long-term evolution are possible at the current state of art defining idealized domains [
14,
17,
19,
21,
26], with a simplified and controlled bathymetry, and nevertheless are for purely qualitative purposes [
16]. Since the aim of the present study is to examine the narrowing process of the Lignano tidal inlet from both a theoretical and a quantitative point of view, the average year has been chosen as the reference morphological period to be analyzed. This time frame is therefore very different from that of a single storm or at most a few months [
8] and it required a preliminary analysis to reduce and combine the events [
27].
The performed simulations confirmed that the selected limited number of events can accurately reproduce the overall morphodynamics governing the Lignano tidal inlet over an average year; in particular, the strongest wind conditions, and therefore the relative generated wave motion, have the greatest role in sediment transport mechanisms. This result agrees with the processes that also take place within the inner channels and tidal flats of the lagoon [
20], where winds with speeds greater than 10 m/s trigger the main morphological changes. On the other hand, a decisive contribution is linked to the tidal meteorological component which can raise or lower the mean sea level depending on the wind direction.
This phenomenon can be very significant in the Adriatic Sea, since it is an elongated and rather closed basin and it is affected by the pressure differences between north and south. In particular, the northern part is often subject to an increase in the mean sea level in conjunction with the Sirocco winds which act over a long fetch. On the other hand, the Bora wind generates a lowering of the level in the portion of the sea in front of the Marano and Grado lagoon due to the drag effect on the sea surface. These level differences, which have been reconstructed from the measured data, have proved to be decisive for transport mechanisms in the ebb tidal delta of Lignano, differently from the back-barrier basin which is mainly governed by the tidal astronomical component alone [
20,
34].
The investigation on the net sand fluxes across a series of sections located along the Lignano Sabbiadoro north-eastern coast and the relative tidal inlet, showed a trend which is very similar to real processes. In particular, two opposite directions of the dominant sediment transport have been highlighted: the first immediately nearshore, on both sides of the tidal inlet, entering the lagoon and the second at the center of the main ebb channel towards the open sea. This result is qualitatively coherent with the dominant transport directions described by Hayes [
2] and Fitzgerald et al. [
3] in the morphological model concerning mixed-energy tidal inlets, as reported in
Figure 6a. In this sense, the numerical modeling has been clearly supported and guided by the historical reconstruction combined with the empirical scheme; at the same time, it increased the value of the scheme itself, which provides a large-scale characterization of coastal environments, starting from some particular cases analyzed.
In addition to the qualitative aspect, the net volumes of sand moved by longshore currents in the terminal part of the Lignano barrier spit correspond to those actually used in the annual nourishment interventions. Furthermore, the volumes of water exchanged through the tidal inlet, result as very similar to those measured in an “ante-operam” configuration, previous to the construction of the port.
Generally, the total water volume exchanged by the lagoon with the open sea, during a characteristic tidal cycle (the tidal prism
P) is related to the size of the tidal inlet, specifically the cross section area
A, by means of the well-known equation [
53,
54]:
where
k and
α are empirical parameters obtained from observational data.
In particular, these coefficients can vary over a range of possible values depending on the morphological characteristics of the inlet, the frequency of the tidal forcing and the friction resistance to the flow [
53,
55]. The relationship (1) represents a simplified motion equation and it suggests the existence of a dynamic balance, in natural conditions, whereby the liquid area of the cross section adapts to the discharge through the section during a tide cycle. In particular, the tidal prism should not change if the tidal inlet is in a stable condition, that is, if its cross section area does not substantially change. Based on this consideration, the fact that the tidal prism computed in the current configuration results as similar to the one measured before the natural shape of the Lignano inlet was altered, suggests that a new equilibrium state seems to have been achieved.
The coefficients
k and
α have certainly been modified during the transition phase between the construction of the pier and the current one. In particular, the parameter
k is affected by the resistance to the flow, which can be affected by the pier, but it is also linked to the width of the section [
53,
55]. The great reduction of the tidal inlet width has consequently led to a reduction in the same coefficient. This explains why, even though the section area has decreased by approximately 30%, the prism has not been altered and therefore Equation (1) continues to hold. The estimation of the two parameters in the new present condition is beyond the scope of this study, therefore only qualitative assessments are provided in this regard.
All these outcomes definitively corroborate the applied procedure and it proves that the numerical approach, with the support of historical research and theoretical models, can be a useful tool, even though it does not yet reproduce reality in detail [
14,
29]. The simulated events can describe the main erosive and depositional phenomena in a global manner, which is however consistent with the natural processes. However, in order to represent the morphology and the shape of the deposit close to the pier more accurately, as well as the ebb tidal delta, it would also be necessary to consider the slow but continuous action of the average tide.
The longshore currents, generated by the drag effect of the wind and by the radiation stress forcings linked to the wave motion, transport the sediment toward the tidal inlet. This happens, as verified, during the most intense events, which occur over a couple of weeks of the year. In the remaining part of the time, the oscillating and repeated movement of the tide shapes and profiles the material deposited near the tidal inlet, leading to rounded equilibrium morphology. It is more difficult to represent this component, since it requires much greater computational times. In order to limit this effort, a high morphological factor should be applied, which can therefore result unbalanced compared to the other events. Moreover, this technique, that artificially increases the morphological changes of the bottom, might not be suitable to describe a phenomenon that occurs slowly over time.


