Abstract
Concentrated mega-nourishments, built as coastal protection measures for decadal time scales, are intended to diffuse, that is to erode and to supply sand to the nearby beaches and dunes by profiting of the natural drivers. Here, we aim to quantify the role of the wave incidence angle and initial geometry on the long-term evolution of mega-nourishments, in particular the Zandmotor (the Netherlands), using a nonlinear morphodynamic model for large-scale shoreline dynamics. Synthetic wave climates based on measurements are created to systematically vary the wave conditions. Simulations show that mega-nourishment diffusivity decreases linearly with an increasing percentage of high-angle waves (>45° incidence with respect to the global shoreline orientation in deep water). For wave climates with more than 80% of high-angle waves, erosional hotspots develop at the sides of the mega-nourishment. In unimodal high-angle wave climates, hotspot growth rates are large and alongshore migration of the nourishment can increase up to 40 m/year. The role of initial geometry is studied by creating synthetic nourishments that vary in shape, asymmetry, and volume. Slender initial shapes are less diffusive than wider shapes. The initial asymmetry influences the asymmetry in sand feeding to adjacent beaches throughout 50 years, which for symmetric nourishments is controlled by the imbalance in the wave climate. Smaller nourishments than the Zandmotor are more diffusive. This work contributes to a more general understanding of mega-nourishment evolution and may serve as guide for future mega-nourishment design.
1. Introduction
Concentrated mega-nourishments are kilometer-scale beach nourishments designed to mitigate beach erosion on decadal timescales, and therefore the effects of climate change and associated sea-level rise [1]. These mega-nourishments (hereafter MN) rely on the concept that a perturbation tends to diffuse, with erosion of the perturbation itself and accretion at the adjacent beaches due to alongshore gradients in sediment transport. A concentrated feeder nourishment named Zandmotor (hereafter ZM) was implemented at the Delfland coast, The Netherlands [1]. At the end of construction in July 2011, the ZM was a hook-shaped peninsula of sand, which protruded 1 km into the sea and measured km alongshore (Figure 1). With its m, the ZM is substantially larger than regular nourishments ( m [2]). In 2015, a beach-dune nourishment of m was built ∼100 km north of the ZM, and other mega-nourishments are being considered at several locations worldwide (e.g., Sweden, Belgium, UK, and USA).
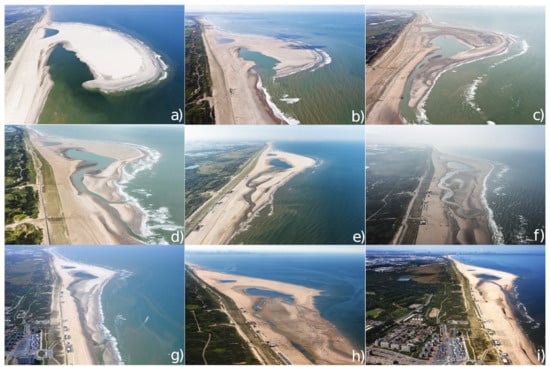
Figure 1.
Aerial pictures of the first concentrated mega-nourishment (ZM, The Netherlands), showing its morphological evolution in the initial six years. Pictures were taken in: (a) July 2011 (shortly after construction); (b) October 2011; (c) January 2012; (d) October 2012; (e) October 2013; (f) September 2014; (g) May 2015; (h) August 2016; and (i) July 2017. Courtesy: Rijkswaterstaat, Joop van der Hout.
The potential worldwide increase on the number of mega-nourishments demands a better understanding of their dynamics. Both observations and numerical models allow investigating short/medium-term dynamics [3,4,5]. Given that the mega-nourishments have been in existence for a relatively short time, their long-term dynamics (i.e., more than twenty years) can only be studied using morphodynamic models. The most suitable models are coastal Area 2DH models (herewith simply referred to as 2DH models) such as Delft3D [6], which account for the full surf-zone morphodynamics, and coastline models such as UNIBEST-LT [7], which only describe the shoreline evolution on the basis of the one-line concept from alongshore sediment transport gradients. Both types of models have advantages and disadvantages, forcing to choose between the extremely fast but less detailed coastline models and the 2DH models that might come at a too high computational cost. In fact, 2DH models are not suitable for long-term applications unless model input reduction techniques and acceleration factors are applied [8]. The gap between both types of models has been recently explored by building hybrid models with intermediate levels of simplification/resolution. An example is Q2Dmorfo [9,10], which has similarities with coastline models but, in contrast, predicts the bathymetric evolution, from which the shoreline is extracted. The bathymetric changes are induced by wave-driven alongshore transport and cross-shore transport computed directly from the wave field and the bathymetry in a parametric way without resolving the surf-zone hydrodynamics. This is the essential simplification with respect to 2DH models, while resolving approximately the bathymetry is the essential improvement with respect to coastline models.
DELFT3D, UNIBEST-LT, and Q2Dmorfo have been applied to hindcast the ZM evolution and to predict its medium- and long-term behavior [4,11,12]. Each model reproduced the observed damping in amplitude and widening of the ZM, i.e., its diffusive behavior. Luijendijk et al. [4], using DELFT3D, demonstrated that the first year morphological changes are mainly due to wave-induced processes (75%) and horizontal tides (17%). Tonnon et al. [12] also used DELFT3D to reproduce the three-year evolution and later Luijendijk et al. [8] improved the model performance and reproduced a five-year evolution using wave-input reduction and acceleration techniques. Luijendijk et al. [8] found that the eroded volumes are sensitive to the acceleration technique. For example, the observed behavior could not be reproduced using schematized wave conditions but the performance improved using the real wave series together with an acceleration factor and parallel computations. Tonnon et al. [12] also used UNIBEST-LT with reasonably good results but over-predicted the eroded sand volumes. In particular, they found that the evolution is sensitive to the “dynamic boundary”, that is, the depth up to which the shoreline affects the bathymetry. This sensitivity had already been extensively documented in the context of high-angle wave shoreline instability (HAWI) [13,14]. Arriaga et al. [11] accurately reproduced the three-year evolution of the ZM using the Q2Dmorfo model. They subsequently predicted that, after 30 years, the amplitude of the ZM would decay by a factor of 1/3 and that the sand feeding would be larger on the NE beach than on the SW beach.
Most of those previous ZM modeling studies used real conditions: the characteristic wave climate of the Dutch coast and the Zandmotor bathymetry. This specificity imposes an important limitation to the general understanding of mega-nourishment behavior (e.g., the diffusion rate or the sand feeding asymmetry to adjacent coasts). In particular, due to the manifold of wave conditions in the real wave climate, it was not possible to pinpoint the contribution of each wave type to the ZM evolution. To vary the wave conditions, synthetic wave climates need to be used. Such approach has been applied in HAWI studies to reduce the complexity of the forcing and understand more easily the associated large-scale morphological response [10,15,16]. The most extreme case considers only one wave type as representative of the real wave climate (see [17]). However, this means that there is only one wave direction, even when the wave climate is bimodal. This can result in a large artificial alongshore migration of nourishments. More realistic reductions, including four wave sectors with the same wave height and period, have often been used [15,16]. Nevertheless, the focus of these studies was theoretical and were not based on a real wave climate.
Regarding the role of the initial mega-nourishment geometry, Tonnon et al. [12] designed synthetic nourishments with a trapezoidal shape and an associated bathymetry following an equilibrium profile. However, their approach did not take the initial shape asymmetry of the mega-nourishment into account. Moreover, the incoming waves were assumed to be low-angle waves, i.e., to have an offshore angle <45° with respect to the shore-normal in deep water. This is an important limitation because the wave climate at the Dutch coast has a large frequency of high-angle waves (>45°; [18]). Besides, when taking high-angle waves into account, the alongshore wave-driven transport could initiate shoreline sand waves and erosional hotspots through HAWI [10,19,20]. Even when the frequency of high-angle waves is not enough to cause instability, it can be crucial to prolong the life time of mega-nourishments. For example, Arriaga et al. [11] showed that the life time of the ZM using realistic wave angles was about three times longer than the hypothetical case forcing those waves to have a shore-normal direction. On the whole, a systematic study of how wave conditions and the initial geometry influence the evolution of mega-nourishments is lacking.
We hypothesize that the proportion of high-angle waves controls the diffusion rate of MN and that wave transformation over the curvilinear contours linked to the shape/size of the MN strongly influences their evolution. The aim of the present work is to determine the role of the wave angle and the role of the initial geometry on the long-term evolution of mega-nourishments. To this end, the work of Arriaga et al. [11] is extended by using Q2Dmorfo (Section 2) to simulate the 50-year evolution of the ZM with different wave climates and the 50-year evolution of different nourishments with a historical wave climate of the Dutch coast. As a first step, the sensitivity of the ZM evolution to the probability of occurrence of high-angle waves is examined using synthetic wave climates (Section 3). As a second step, the sensitivity of the mega-nourishment performance to the initial geometry is explored using synthetic mega-nourishments that vary in orientation, shape and volume (Section 4). Some discussion points are raised in Section 5 and a list of conclusions is provided in Section 6. In this study, we focus on the role of wave angles and nourishments geometry. Preliminary model simulations [21] suggest that tidal sea-level variations as well as a slow global-warming-induced sea-level rise may also affect MN evolution. However, a detailed analysis of these effects is beyond the scope of the present paper and will thus be presented elsewhere.
2. Methodology
2.1. Morphology of the Zm and Prevailing Wave Conditions
The initial bathymetry and wave boundary conditions of the model predictions are based on the ZM. The ZM was implemented as a concentrated feeder nourishment in Mar-Jul 2011 along the 17-km long, southwest–northeast oriented (42°) Delfland coast. The nourishment is feeding the adjacent beaches and the dunes by profiting of the natural wave, tide and wind forces that pick up and transport the nourished sand. Figure 1 shows the observed initial morphologic change of the ZM. In the first months, a spit developed, creating a roughly Gaussian-shaped coastline perturbation of the initial hook shape. In the following years, the alongshore extension of the ZM increased and the adjacent beaches got wider, while, as intended, the cross-shore extension of the ZM decreased. In addition, the initially asymmetric planshape became nearly symmetric. We refer to the works of de Schipper et al. [3] and Rutten et al. [5] for further observations of the morphologic behavior of the ZM and its nearshore zone on week-yearly time scales.
The Delfland coast borders the semi-enclosed North Sea and is exposed to a bimodal wave climate with a yearly-averaged significant wave height of 1.3 m, a peak period of 6 s, and two directional modes from NNW and SW (measured at the Europlatform buoy, 63 km west of the ZM at 32 m depth). The corresponding averaged wave angles are 45° and 60°, with respect to the regional shoreline orientation. Summer (Apr–Sep) is characterized by mild conditions with a of 1.1 m, whereas winter (Sep–Apr) is more energetic with increasing up to 5 m during storms. The tide is semi-diurnal with a mean range of 1.7 m. A more detailed site description can be found in the works of de Schipper et al. [3] and Arriaga et al. [11].
2.2. Model Description
The behavior of mega-nourishments is here investigated using Q2Dmorfo, a morphodynamic model for large-scale shoreline dynamics that includes a wave, sediment transport and bed update module. Only a summarized description is provided here, for details see the works of van den Berg et al. [22] and Arriaga et al. [11]. Q2Dmorfo uses a Cartesian frame of reference, where the y-axis is parallel to the mean shoreline and the x-axis points offshore (Figure 2), and a rectangular domain () with cross-shore and alongshore domain lengths and . The model computes the sediment transport directly from the wave field in a parametric way without resolving the full hydrodynamics. Afterwards, the bed level is updated following the sediment mass conservation equation
where t is time, is the depth-integrated sediment flux, which includes the bed porosity factor, and is the bed level. The shoreline position, is computed from by interpolating between the last dry cell and the first wet cell.
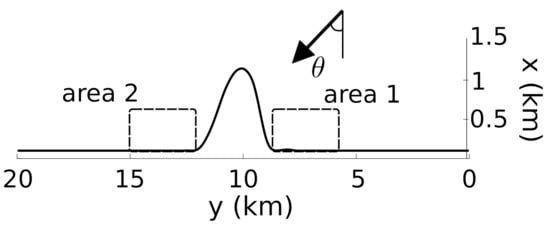
Figure 2.
Sketch of the model simulations, where the y-axis would point into the southwestern direction if this was the real Zandmotor in the Dutch coast. The wave angle indicated has a positive sign and the shown mega-nourishment has a negative orientation. The areas defined to compute the feeding to adjacent beaches are marked with a dashed rectangle.
The sediment transport computation requires the wave characteristics at breaking. The model incorporates a wave module that takes into account refraction and shoaling over the evolving curvilinear depth contours by assuming monochromatic waves with (peak period), (significant wave height) and a wave angle . From the computed wave field, the breaker wave height, , and the corresponding wave angle, , are extracted. The breaking point is the most onshore position where , is the saturation ratio of in the surf zone (here, ).
To compute the sediment transport, a smoothed bathymetry is constructed and, at each grid point, a local Cartesian basis is defined perpendicularly and along the corresponding depth contour, that is, ) and ), where is the angle with respect to the y-axis. In addition, (instead of y) and (instead of x) indicate that the variables in Equations (3) and (4) associated to each grid point correspond to the line found following the direction (instead of the global x direction). Then, the depth integrated sediment flux is decomposed as
The first term, , represents the littoral drift driven by breaking waves and is evaluated by first computing the total sediment transport rate Q using the CERC formula [23],
Here, is the angle between the wave fronts at breaking, , and the coastline, . The constant is proportional to the non-dimensional K constant of the original CERC formula. The total Q is then redistributed across the profile with a normalized shape function inspired on the typical wave-driven alongshore current profiles, . Finally, the transport is directed along ,
The second term in Equation (2), , represents the transport that drives the bathymetry to a certain cross-shore equilibrium profile by parameterizing the cross-shore transport processes,
Hence, it is proportional to the difference between the equilibrium slope , at the local depth , and the actual slope in the local shore-normal direction. The cross-shore stirring factor , accounting for the influence of orbital velocities and turbulence produced by waves on the sea bed, is estimated from the expression of momentum mixing [24] and is scaled with a power of wave height at breaking ,
where is a non-dimensional parameter, is the surfzone width, and g is gravity. The factor varies throughout the bathymetry with a shape function , which has a maximum at the shoreline () and decays landward and seaward to residual values (see [11]). In the onshore direction, the region of non-negligible spans a relatively narrow effective swash zone. In the offshore direction, it covers the whole active zone until the depth of closure, . The (instantaneous) is computed from the wave conditions and the sediment grain size as a fraction of the depth at which the sediment particles are first mobilized by the waves, (, where is a non-dimensional parameter).
The third term in Equation (2), , represents the tendency of small bumps to be flattened by breaking waves and at the same time functions to stabilize the numerical solution by diffusing small-scale morphodynamic noise,
The alongshore diffusivity factor is taken as .
2.3. Model Settings
The default size of the simulation domain is km and km in the cross-shore and the alongshore directions with the mean shoreline (before adding the perturbation) located at m. Model parameter values of the ZM calibration by Arriaga et al. [11] have here been adopted as default, including 0.04 ms (alongshore transport, Equation (3)) and 0.05 (cross-shore transport, Equation (6)), but with the exception of ( control, see Section 2.2). Subsequent tests have proven that gives a slightly better long-term performance than the value used by Arriaga et al. [11] and avoids certain numerical instabilities. Therefore, has been chosen in the present contribution. Grid sizes are m and m. The time step for simulations using real wave conditions is s. For simulations using synthetic wave conditions, it is s. The smaller time step is needed due to storms in the real wave conditions.
2.4. Metrics for Mega-Nourishment Performance
Mega-nourishment performance is inferred from the following morphological characteristics: diffusivity, feeding asymmetry to adjacent coasts, and alongshore displacement.
Typically, sandy shorelines are diffusive, that is, any perturbation of the equilibrium planform shape tends to diffuse away with time. This tendency can be easily framed in the Pelnard–Considère equation [25] that governs the behavior of the small perturbations of an otherwise rectilinear coastline under the action of the alongshore wave-driven sediment transport:
This is a diffusion equation where is the diffusivity coefficient, which depends on the wave height, the coefficient (Equation (3)), and through:
This coefficient provides the measure for the diffusivity of shoreline perturbations. This approach is strictly valid for small amplitude perturbations and assumes that wave refraction and shoaling are not affected by the shoreline perturbations [26]. Although the Q2Dmorfo model equations are by no means equivalent to a single diffusion equation, an effective diffusivity of the mega-nourishment can be inferred by comparing the numerical simulation with an analytic solution of Equation (8). By assuming an initial shoreline with a Gaussian shape,
where is the initial amplitude and L is the initial characteristic width, there is an analytical solution keeping the Gaussian shape that damps and widens with time (see [11]). The effective diffusivity between and any time t can then be inferred from the modeled amplitude change as
The feeding of the mega-nourishment to adjacent coasts is evaluated by defining fixed monitoring areas of equal length, km, located at both sides of the nourishment, starting where the perturbation initially affects the shoreline (see Figure 2). Then, the beach linear gain is computed for every survey in each area
where are the alongshore limits. The feeding asymmetry is defined by
Here, 1 and 2 refer to Areas 1 and 2, respectively. Hence, the measures the relative difference between the in Area 1 and Area 2. The is positive when Area 1 is fed more than Area 2, i.e., for the real ZM a positive value would mean that there is more feeding to the Northern beach (see Figure 2).
Evaluating the alongshore displacement of a shoreline perturbation is complicated because its shape changes continuously. Nevertheless, the displacement can be estimated by fitting a Gaussian function to the initial and consecutive shorelines and subsequently tracking the distance travelled by the Gaussian center. During the first years, the nourishment is highly sensitive to storms. Bearing in mind the present long-term focus, we display the results every 400 days in every figure below.
3. Effect of Varying the Wave Angle
To study the effect of the incident wave angle on the ZM evolution, a synthetic wave climate (SWC) is created whereof variations can be applied in a systematic manner. The SWC follows from reducing the real wave climate (RWC) to a few representative wave types defined by wave angle sectors. Simulations with different SWCs are first compared to the RWC simulation to assess its validity (Section 3.1). Subsequently, the effect of high-angle wave incidence and bimodality on mega-nourishment evolution is shown by modulating the reference SWC (Section 3.2). Throughout this section, the model is initialized with the ZM bathymetry measured in January 2012.
3.1. Design and Validation of the Synthetic Wave Climate
The RWC is created by repeating 10 times a five-year time series (March 2010 to March 2015) measured at the Europlatform and is characterized by m, m, s, s, , , and a 60.9% of highly oblique waves (the subscript indicates the statistics for either the western or northern directional mode). Arriaga et al. [11] tested different time periods of 1–20 years to build RWCs and obtained similar predictions of the ZM evolution.
The reference SWC is built from the representative wave conditions of five angle sectors: (I) −90° to −45°; (II) −45° to 0°; (III) 0° to 45°, (IV) 45° to 90°; and (V) waves propagating seaward that do not contribute to morphological changes (Figure 3). From now on, the fifth sector is not mentioned (e.g., the percentages in Table 1 sum 100%), but its probability is taken into account for building the SWC to mimic the morphological changes produced by the RWC. Then, a 50-year SWC is built by picking waves from the five sectors using a pseudorandom number generator that relies on a uniformly-distributed function, preserving the probability of occurrence of each sector. The sector duration is set to 24 h. A 30-year sensitivity analysis is then performed by varying: (i) the method to compute wave statistics for each sector; (ii) the number and duration of the sectors; and (iii) the randomness in the sector order. To select the best way to synthesize the wave climate, the root-mean-square error (RMSE) is used to quantify the deviation of shorelines predicted with a SWC from the shorelines predicted with the RWC.
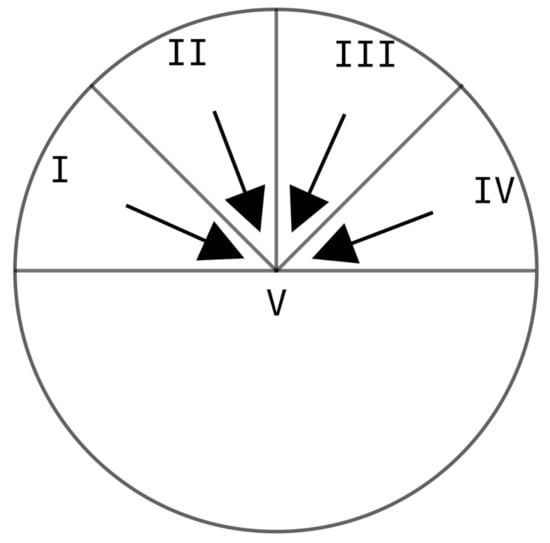
Figure 3.
Schematic sketch of wave rose with the five different wave sectors. Sector V represents seaward-directed waves and therefore time periods without morphological changes. The horizontal and vertical line represent the mean coastline and the shore-normal, respectively.

Table 1.
Sensitivity to the statistical method that synthesizes the RWC into four directional sectors, where H is the significant wave height, T is the peak wave period, and is the wave direction measured with respect to the shore normal. The frequency of occurrence of each sector is written between brackets. The last column shows the shoreline RMSE (with respect to RWC) at the end of the simulations (average over Years 25–30).
The representative wave characteristics for each sector can be extracted from the RWC with different averaging methods: (1) simple average; (2) a weighted average with , using the exponent of the sediment transport parameterization (CERC formula, Equation (3)); (3) a weighted average inferred from the wave alongshore power (proportional to , with being the wave group velocity); and (4) a weighted average with (as in [16]). Table 1 shows the sensitivity of each sector statistics and the shoreline RMSE (with respect to RWC) averaged over the last five years of simulation. The simple average clearly performs worst, highlighting the relevance of appropriate wave statistics computations when sediment transport is involved. Although the wave statistics of Methods 2–4 vary around 5%, the method that produces the lowest RMSE is the one based on the CERC formula performing at least 50% better than the rest. Using it, after five years, the RMSE decays and stabilizes at 11 m, which is in the order of the cross-shore cell size of 6 m. Given the 900-m initial ZM amplitude and the filtering of energetic events, the SWC built with Method 2 performs similar to the RWC in the medium to long term.
The assumption that four wave sectors suffice to adequately represent the RWC is now challenged. For this, SWCs with different numbers of wave sectors (1, 2, 4, 8, 16, 32, and 64) are built wherein the best weighting method (Method 2) is used. Figure 4a shows that using only one or two sectors produces large errors. Interestingly, using four wave sectors results in a similar RMSE as using 8, 16, 32, or 64 wave sectors. The simplest option without losing accuracy, i.e., four sectors, is therefore used from now on. The four sectors allow representing the bimodality of the climate together with the distinction between high-angle waves (Sectors I and IV, which induce anti-diffusive behavior) and low-angle waves (Sectors II and III, which induce a purely diffusive behavior). The sensitivity to the wave sector duration is then tested, with values ranging from 6 to 96 h, but results do not change significantly if the duration is equal to or smaller than 24 h. Finally, the effect of the randomness in the order of sector application has been checked and it is insignificant, with changes in RMSE of less than 3 m, below the cross-shore cell size.
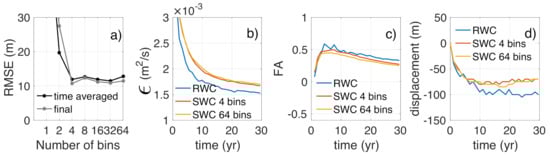
Figure 4.
Time-averaged shoreline RMSE in the first 30 years and the final 5 years (Years 25–30) for SWCs with a different number of directional sectors (a); and the time evolution of the diffusivity (b), feeding asymmetry (c), and alongshore displacement (d) for the RWC and SWCs with 4 or 64 sectors.
The previous paragraph shows that a SWC consisting of four directional sectors (plus the non-morphological change sector) with a 24-h duration and a weighting (Method 2) is the best option to reproduce the RWC in a simple manner. This is not only clear from the final shoreline error (Table 1), but it also shows up in the time evolution of the mega-nourishment characteristics. Its cross-shore amplitude decreases similarly with the RWC and the SWC and its diffusivity, which quantifies this decrease in a global way, is comparable. As shows in Figure 4b, the diffusivity decreases with time for both cases but the SWC overpredicts it by 10%. The diffusion of the nourishment produces an alongshore widening of the perturbation and feeds the adjacent beaches (increasing the dry beach area), equally in the two wave climates. The positive FA values in Figure 4c indicate that more sand is fed to Area 1 (north) than to Area 2 (south), as shown in previous studies. In both RWC and SWC, the FA increases up to 0.5 and then gradually decreases with time. The alongshore displacement of the perturbations is to the negative y-axis (i.e., to the north) during the first decade but then it halts (Figure 4d). Figure 4b–d also confirms that including 64 sectors instead of 4 hardly changes the resulting morphodynamic evolution.
3.2. Sensitivity to the Frequency of High-Angle Waves
From the previously validated SWC, two new sets of SWCs are created wherein high-angle wave occurrence is varied to study the effect on mega-nourishment evolution. In the first set, the combined probability of both high-angle sectors is varied ( in the RWC). Here, is increased from 0 to 1 with 0.1 steps, while and are decreased proportionally, keeping the ratios and constant (Figure 5a). In the second set, only is increased, so that increases from 0.6 to 1 with 0.05 steps, and , , and are decreased while keeping their ratios (Figure 5b). Set 1 represents a bimodal wave climate with a varying high-angle wave frequency, while Set 2 tends to a unimodal climate with an increasing frequency of Sector I. Notice that the wave conditions of each sector are not changed.
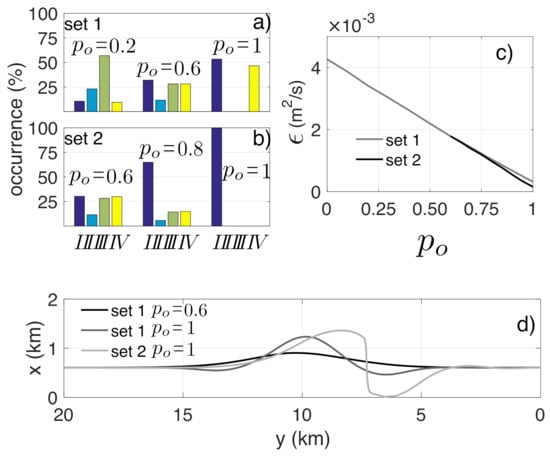
Figure 5.
Probability of occurrence of each wave sectors for varying high-angle wave frequency, , for: (a) bimodal conditions assuming that both Sectors I and IV are modified proportionally; and (b) unimodal conditions assuming that only the probability of occurrence of Sector I increases. Averaged diffusivity over the last five years of simulations as a function of high-angle wave frequency (c). Shorelines after 50 years of evolution for the indicated simulations (d).
Until 0.8, the mega-nourishment behavior keeps on being diffusive. For higher values, erosional hotspot areas develop at both sides of the mega-nourishment (Figure 5d), which is a clear signal of HAWI [10]. For Set 1 and 1, the shoreline retreats 140 m ( 6.5 km) in 50 years, with respect to the rectilinear shoreline before the nourishment. For Set 2 and 1, a more dramatic shoreline retreat of 580 m ( 6.5 km) is found. In addition, the high-angle waves produce a decrease in diffusivity, illustrated by the linear decay of the final five-year for an increasing percentage of high-angle waves (Figure 5c).
For Set 1 and 0.4 < < 0.8, the FA is similar and positive during most of the time (more sand to Area 1/north; Figure 6a). In the long term, the FA increases with the percentage of high-angle waves. For 0.8 (with hotspots forming at both sides of the nourishment), FA is initially negative due to the presence of the erosional hotspots (Figure 5d) but becomes positive and stabilizes after ten years. The long-term displacement of the mega-nourishment is also controlled by (Figure 6c). For small , Sector III is dominant (Figure 5a) and consequently the mega-nourishment migrates to the positive y-axis (southward). For larger , waves in Sector I are slightly more frequent than in Sector IV, and they are more energetic and with higher incidence angles, explaining the negative displacement (northward; see Figure 6c). However, the short term evolution is independent of (see the initial five years).
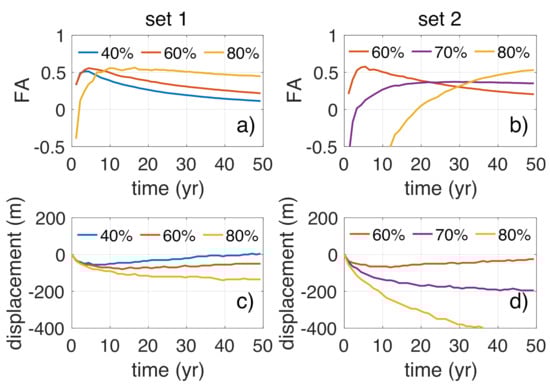
Figure 6.
Sensitivity of the long-term mega-nourishment evolution to the percentage of high-angle waves in a bimodal wave climate (Set 1 (a,c)) and in a unimodal wave climate (Set 2 (b,d)). Time evolution of: (a,b) the associated feeding asymmetry; and (c,d) the displacement during 50 years.
For Set 2, the behavior of the FA is more variable (Figure 6b). Actually, the FA for = 0.6, = 0.7 and = 0.8 differ considerably, despite a small difference in . For 0.7, the FA is initially positive, which is coherent with the presence of an observed initial downdrift erosional hotspot, but the latter diffuses with time and FA becomes positive and stabilizes. The FA for 0.8 remains negative for a long time period because the downdrift hotspot is larger and increases with time. The erosional hotspot formed at the lee of the nourishment explain the negative FA values obtained for 0.7. All scenarios in Set 2 produce a displacement to the negative y-axis (northward; Figure 6d), consistent with the dominance of Sector I waves. The displacement experiences a strong increment when increasing from = 0.8 to = 1 (not shown).
4. Effect of Varying the Mega-Nourishment Geometry
To investigate the effect of the initial geometry on nourishment evolution, a synthetic mega-nourishment, SMN, is constructed whereof variations can be created in a systematic manner. The SMN is a two-dimensional elliptical Gaussian function, best fitted to the ZM, that perturbs an alongshore uniform bathymetry. A detailed description of the design of this reference SMN is available in Appendix A, in which we also show that the SMN predicted evolution mimics the ZM one, and thereby its use is justified to further explore the role of the initial geometry on the ZM behavior. Below, three characteristics of the initial geometry are changed independently to study their effect in the long-term mega-nourishment evolution: the asymmetry, the aspect ratio, and the total volume (see Figure 7). Throughout this section, the model is forced with the RWC.
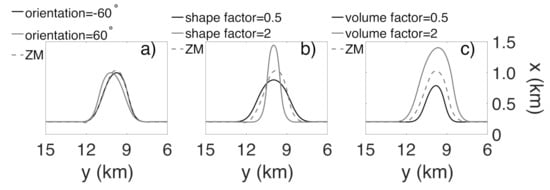
Figure 7.
Sketch of the different initial mega-nourishment geometries, including variations on: (a) the orientation or asymmetry; (b) the shape factor; and (c) the volume factor. Notice that the scaling of both axis is not the same.
4.1. Sensitivity to the Initial Asymmetry
The long-term effect of the mega-nourishment initial asymmetry is studied by changing the orientation (i.e., the rotation angle in Appendix A), while keeping the volume and aspect ratio constant (Figure 7a). Here, the orientation is varied from −60° to 60° with steps of 15° (the ZM has an orientation of −53°).
The effect of the initial asymmetry on is small, with a symmetric perturbation being about less diffusive than an asymmetric perturbation (Figure 8a). This is corroborated by the only 10-m amplitude difference between the symmetric () and most asymmetric () perturbation after 50 years. Given the scales of the perturbation and an initial amplitude of 900 m, the diffusivity can be considered insensitive to changes in the orientation of the perturbation. In contrast, FA is more sensitive to the initial orientation (Figure 8b). More specifically, FA is positive for right/northward leaning perturbations (orientation ), near-zero for the symmetric perturbation, and negative for left/southward leaning perturbations (orientation ). Moreover, the effect remains visible in the long term, e.g., FA is still negative after 50 years for positive orientation (Figure 8b). The four asymmetric perturbations gradually converge to the FA of the symmetric perturbation (yellow line). The non-zero FA of the symmetric perturbation can be explained by the RWC wherein waves from the SW slightly dominate over the NW waves. The curves in Figure 8c suggest that the displacement depends on the initial orientation for the first five years. Note that the initial displacement tendency is positive (southward) only for the perturbations with positive orientation (left/southward leaning), and that the displacement of the symmetric perturbation is negative (northwards). Afterwards, all perturbations show a negative displacement tendency (towards the north) at a similar rate, which suggests that this metric is importantly affected by the wave climate (dominated by SW waves).
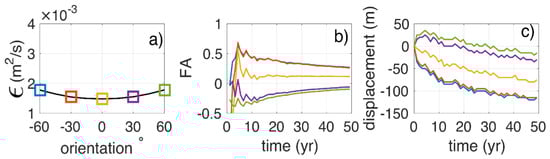
Figure 8.
Effect of the initial mega-nourishment orientation on: (a) the final five-year diffusivity, as well as on the 50-year evolution of (b) the FA and (c) the displacement.
Overall, the orientation of the mega nourishment determines which of the adjacent coasts gains more sand (FA). Furthermore, the initial leaning of the asymmetric perturbations indicate the displacement direction for the first years, which in the longer term is controlled by the wave climate.
4.2. Sensitivity to the Initial Aspect Ratio
The effect of the initial aspect ratio of the mega-nourishment (i.e., in Appendix A) is studied, by multiplying it by a factor (hereafter referred to as shape factor) ranging from 0.25 to 2 in 0.25 steps (Figure 7b, the default shape factor value of 1 corresponding to the aspect ratio of 1.27 of the ZM). Because the initial shape asymmetry is highly sensitive to the shape factor, the orientation is set to 0° (symmetric perturbation). This also allows further isolating the role of the aspect ratio. The volume is kept constant. Smaller shape factors create perturbations that are less pronounced, as they are wider and protrude not as far into the sea. For example, a shape factor of 0.25 (thus 75% smaller than the reference) gives a nourishment that protrudes 500 m into the sea instead of the 1000 m in the reference SMN.
Figure 9a shows that the more slender perturbations (with higher shape factors) are less diffusive. This striking result might seem counter-intuitive at first, but it is important to remember that the diffusivity is dependent on the width as well (Equation (11)). The initial variability in the FA is larger for the slender nourishments, indicating that they are more sensitive to the wave climate variations during the first years (Figure 9b). In the long term, the FA tends to be similar and slightly positive (more feeding to Area 1, north) for all cases (as in the initial symmetric case in the previous section). The displacement is similar and negative for every scenario and the rate is slightly larger for slender nourishments (Figure 9c).
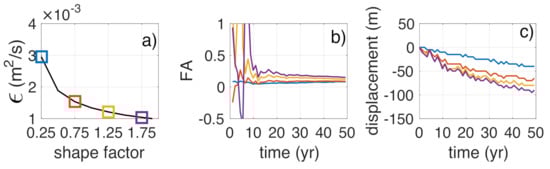
Figure 9.
Effect of the initial mega-nourishment shape factor on: (a) the final five-year diffusivity, as well as on the 50-year evolution of (b) the FA and (c) the displacement.
4.3. Sensitivity to The Volume
The effect of the initial volume (which depends on A and in Appendix A) is studied by multiplying it by a factor ranging from 0.25 to 2 in 0.25 steps (Figure 7c, the default volume ratio of 1 corresponding to that of the ZM). In these simulations, the orientation and aspect ratio are kept constant and equal to those of the ZM.
Figure 10a shows that the diffusivity is larger for smaller nourishments than the default, but when the volume increases the diffusivity is not affected. In a similar way, the FA becomes more pronounced for larger nourishments (Figure 10b). The displacement hardly changes and only the smallest nourishment shows a distinct behavior with a slower rate (Figure 10c).
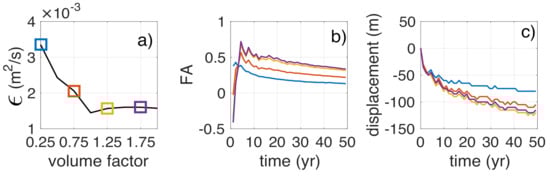
Figure 10.
Effect of the initial mega-nourishment volume ratio on: (a) the final five-year diffusivity, as well as on the 50-year evolution of (b) the FA and (c) the displacement.
5. Discussion
5.1. Physical Processes Driving Mega-Nourishment Evolution
5.1.1. Importance of High-Angle Waves
The high-angle wave instability (HAWI) is the mechanism that explains the formation and development of kilometer-scale shoreline sand waves with characteristic erosional hotspots [13,19,20,22,27]. Consistent with recent studies on the development of sandwaves [16,22], the HAWI threshold is found to be about 80% ( = 0.8). The real wave climate at the Delfland coast with 62% of high-angle waves induces diffusion of the ZM without causing erosional hotspots. Nevertheless, the frequent presence of high-angle waves reduces the nourishment diffusivity and hence reduces the feeding to adjacent beaches [11]. The diffusivity turns out to be a linearly decreasing function of the high-angle wave frequency (Figure 5c), which relates to a slower feeding rate to adjacent beaches, even though the wave energy increases due to a higher frequency of Sector I. For example, at the ZM, the diffusivity is overestimated by a 2.4 factor if high-angle waves are ignored (Figure 5c). Consequently, the feeding rate is significantly overestimated if only low-angle waves are considered, as done in some previous studies (e.g., [12]). In Figure 5c, the diffusivity is inferred from the amplitude decay by assuming a Gaussian shape (Equation (11)). However, the shoreline shape deviates considerably from a Gaussian function when erosional hotspots appear, therefore is no longer reliable for > 0.8. In fact, when the shoreline becomes unstable, theoretical analysis based on the one-line shoreline modeling allows attributing a negative diffusivity [15,26].
In the present study, even when the wave climate is prone to HAWI (0.8), a full shoreline sand wave train does not develop (Figure 5d), although it did occur in the work of van den Berg et al. [10]. The reason is that the default simulation time of 50 years in the present work is not long enough to develop such a train. Simulations up to 100 years have been performed, and, although a sand wave train started to develop (not shown), the simulation time duration is insufficient to obtain a fully-developed train. Therefore, the time scale for HAWI development in the present study is much larger than the few tens of years of the previous application of the present model [10]. Initially, we speculated that the large size of the ZM, an order of magnitude larger than the nourishment in [10], could explain the difference, but simulations with smaller volumes (not shown) reveal that the growth rate is insensitive to the initial size of the coastline perturbation. Rather, the parameter (in front of the alongshore transport, Equation (3)) has a direct control on that time scale. Here, ms, adopted from the calibration of Arriaga et al. [11], whereas in [10], ms. A simulation for the ZM with the latter value provides a much faster development of the sand wave train. Besides, the equilibrium cross-shore profile, in particular its slope, also influences the time scale of HAWI development. Thus, the parameter and the profile slope used in this study explain the slower formation of kilometer-scale shoreline sand waves in the ZM application.
Despite the many studies that have investigated the role of high-angle waves on coastal morphology (as described before), its relevance in engineering projects has been largely ignored. Tonnon et al. [12] predicted the ZM evolution during three years, but misrepresenting waves with an incidence angle above 45 degrees (i.e., forcing them to have ), which might explain their mismatch with observations. Luijendijk et al. [4] focused on modeling the first-year evolution of the ZM and concluded that 80% of its dynamics was explained by the wave energy of the 12 biggest storms and that the incoming angle was irrelevant. However, in such short time frame, and given the strongly perturbed beach profiles, cross-shore processes can dominate and the storm energy (together with the initial geometry) may indeed explain most of the changes. However, in their Figure 15c, which relates storm energy with erosion, there are clear outliers, which could be explained by the incoming wave angle.
Wave reduction is largely used for engineering purposes [28,29,30]. In Section 3.1, we investigate the best way to obtain a synthetic wave climate that would reproduce the evolution of the ZM using measured wave series. We found that high-angle waves need to be included to properly predict the mega-nourishment evolution. In particular, both the direction (positive/negative angles) and the obliquity degree (low/high angle) are needed, i.e., four directional sectors (Figure 4a). By representing the wave climate with one wave condition, and thus ignoring the bimodality, the ZM is predicted to migrate alongshore at high rates. By representing the wave climate with two wave condition, and thus misrepresenting the obliquity degree, the ZM largely deviates from the observed evolution. Furthermore, using more than four sectors does not lead to better predictions (Figure 4b–d). This confirms that including high-angle waves are critical for the correct modeling of the coastal evolution. It is important to remember that this result is valid for models that ignore the surf zone dynamics and situations dominated by alongshore sediment transport.
5.1.2. Diffusivity and Feeding Asymmetry
The diffusivity of the ZM and the subsequent feeding rate to adjacent beaches depends not only on high-angle wave frequency but also on the aspect ratio and volume of the initial mega-nourishment. The effect of initial shape asymmetry is negligible (Figure 8a). The diffusivity increases for wider nourishments that protrude less into the sea, i.e., the widest nourishment doubles the diffusivity of the most slender one (Figure 9a). A possible explanation is that processes leading to HAWI may be enhanced in slender nourishments, thereby decreasing the diffusivity. That is, the depth contours have a larger cross-shore amplitude in slender nourishments, which may induce larger perturbations in wave refraction and shoaling and thereby HAWI. However, this hypothesis has been discarded by repeating the simulations with the same wave climate except that now all the wave angles are set to 0° (normal wave incidence). These simulations predict an overall higher diffusivity (because of the change in wave angle) but the dependence on the aspect ratio remains the same, suggesting that HAWI does not explain this behavior. Another explanation can be the non-linear effects related with the large amplitudes in the shoreline perturbation produced by more slender nourishments. Indeed, if the small amplitude hypothesis is not valid, a governing equation identical to the Pelnard–Considère equation (Equation (8)) can be derived but where the diffusivity is replaced by
This is a nonlinear diffusion equation wherein the diffusivity coefficient can be considerably smaller than the coefficient () inferred from the linear equation if . Herein, also contributes to a decrease in diffusivity, although its effect is typically minor since tends to be small because of wave refraction. Then, by assuming that the ZM can be approximately described by this nonlinear equation, a more slender nourishment must have less diffusivity because is larger.
The diffusivity increases for smaller nourishments (Figure 10a). This increase could be related to cross-shore profile dynamics that would become relatively more important for small volumes. That is, such profile effects on the entire nourishment would scale with the length of the nourished coastline while the volume effects would scale with the square of this length. Thus, for small volumes and due to the cross-shore profile dynamics, which is not included in the one-line modeling, the nourishment behavior would deviate from the predictions of the nonlinear diffusion equation.
The half lifetime of a mega-nourishment, defined as the time taken for the nourishment to lose half of its volume, has been used in previous studies to characterize the diffusivity of the mega-nourishments. Under this definition, the wider is the nourishment, the larger will be the area that initially encloses the nourishment. Therefore, the half lifetime will always be higher for wider, less concentrated, mega-nourishments. The diffusivity can be used as an alternative metric that takes into account the MN initial characteristic width and amplitude. This metric shows an inverse relation with the proportion of high-angle waves. Under this metric, slender, more concentrated nourishments present smaller values than wider, less concentrated ones (Figure 9a). Furthermore, the diffusivity can also be used to derive the feeding rate and adapt it to the specific site requirements.
Another striking behavior that is clearly observed during the first years of ZM evolution [3,4] and also predicted to continue in the long term [11] is the feeding asymmetry, with the northern beaches receiving more sand than the southern beaches. Such behavior turns out to be mainly driven by the combination of two factors: the initial shape asymmetry of the mega-nourishment and the imbalance between the two directional modes in the bimodal wave climate. The initial shape asymmetry has a large influence on the feeding asymmetry, determining its sign in the short and in the long term (over 50 year, see Figure 8b). This can be understood by assuming that the nourishment is approximately governed by a diffusion equation. Then, the flank with the largest initial slope (alongshore gradient in ) diffuses more quickly than the other flank so that it feeds its adjacent beach more. This process is so dominant during the first years that its accumulated effect is still visible in the long term (i.e., after 50 years). However, a symmetric perturbation with a 0° orientation still has a positive FA value of 0.1, which can be attributed to the wave climate that is slightly dominated by waves from the SW. Such influence of the wave climate is confirmed by the increase of FA when the frequency of waves from Sector I increases, meaning that northern beaches tend to receive more sand if there is more percentage of wave energy from the SW (Figure 6b). In the case of a high-angle wave frequency equal to or greater than 80%, the feeding asymmetry has an irregular behavior at the initial stages due to the erosional hotspots that develop at the sides of the nourishment.
According to the present results, mega-nourishments can migrate due to two different factors. During the first five years, the displacement is controlled by the initial shape asymmetry (Figure 8c) because it again results from the strong diffusion occurring in the side with the largest shoreline slope. However, in the long term, once both shoreline slopes become similar, the alongshore displacement is controlled by the wave climate. In fact, the migration rate is constant after the first five years, indicated by the approximately constant slope in the displacement curves. The simulations with a higher percentage of waves from Sector I (SW waves in Set 2) show a clear increase of the migration (Figure 6c,d) and the displacement can reach up to 2 km within 50 years in the case of 100% high-angle waves (unimodal). The obtained downdrift migration of the mega-nourishment is coherent with the downdrift migration of shoreline sand waves [22]. In addition, the shoreline of that downdrift side has a larger slope (planform) than the updrift side, which is also seen in shoreline sand waves [27].
5.2. Design Recommendations
The present results allow extracting some recommendations for future mega-nourishment projects. First, much attention must be paid to the directional regime of the wave climate. The red line is an 80% frequency of high-angle waves. For this frequency or above, the feeding to adjacent beaches will turn into erosion, with hotspots next to the nourishment that will become more pronounced with slight increments of that frequency. This effect will be stronger for unimodal wave climates, in which case the mega-nourishment will also shift alongshore dramatically by distances comparable to its width. In the long term, the nourishment will trigger a wave train of shoreline sand waves featuring alternating erosion/accretion spots. For wave climates with 70% of high-angle waves, erosion hotspots can temporally appear due to shadowing effects related to the size of the MN but they disappear after some years. The mega-nourishment timescale (lifetime) will also be heavily affected by the wave climate. It is obvious that more energetic wave climates will be more diffusive but the frequency of high-angle waves will also play an important role. The diffusivity and the feeding rate will be greatly reduced in oblique wave climates, such as the one on the Dutch coast, in comparison with shore-normal wave climates.
According to the obtained results, the initial aspect ratio also affects the nourishment diffusivity: narrow mega-nourishments will be less diffusive than wide ones. The feeding asymmetry to adjacent beaches can also be partially controlled. Although the component of the FA related to the directional wave energy imbalance cannot be modified in a particular coast, the FA can be strongly influenced by the initial shape asymmetry of the mega-nourishment. In particular, the nourishment side with the initial largest shoreline gradient will erode more quickly and the downdrift beach will be fed more. This effect will decrease with time.
6. Conclusions
The role of the wave angle and the initial mega-nourishment geometry on its decadal dynamics was confirmed with a morphodynamic numerical model based on the wave-driven alongshore sediment transport, which also includes the cross-shore transport in a simplified way. Design aspects are highlighted to better predict its diffusivity and the feeding rate to adjacent beaches.
The wave incidence angle is proved to considerably affect the long-term mega-nourishment evolution, in contrast with previous studies. In particular, the diffusivity is a linearly decreasing function of the high-angle wave (>45° in deep water) frequency. The 62% of high-angle waves of the wave climate at the ZM contributes to a slow diffusion rate, with a 2.4 factor reduction of the nourishment diffusivity with respect to shore-normal wave incidence. Wave climates with more than 80% of high-angle waves trigger HAWI, with the development of erosional hotspots (instead of beach growth) next to the mega-nourishment. The importance of the wave incidence angle is also reflected in the synthetization of the wave climate, as nourishment evolution is only adequately predicted when using four directional sectors (low- and high-angle waves from both sides). Interestingly, using more sectors does not improve model performance.
The initial mega-nourishment geometry influences both its annual and decadal evolution. The diffusion is faster for wider and smaller nourishments. The initial shape asymmetry strongly influences the feeding asymmetry in the short term, and this influence slowly decays with time as the shoreline slopes become similar. The directional wave energy imbalance also contributes to the feeding asymmetry, since the more energetic directional mode transports more sand to the downdrift beach of the nourishment. The alongshore displacement of the nourishment is initially driven by the initial shape asymmetry, but, in the long-term, it depends on the imbalance between waves from both sides and the frequency of high-angle waves.
Author Contributions
Conceptualization, J.A., F.R., and A.F.; methodology, J.A., F.R., A.F., J.R., and G.R.; simulations, J.A.; validation, J.A., F.R., A.F., J.R., and G.R.; formal analysis, J.A., F.R., and A.F.; writing—original draft preparation, J.A. and F.R.; writing—review and editing, J.A., F.R., A.F., J.R., and G.R.; visualization, J.A. and F.R.; project administration, F.R. and A.F.; and funding acquisition, F.R., A.F., and G.R. All authors have read and agreed to the published version of the manuscript.
Funding
This research was partly funded by the Spanish Government projects CTM2015-66225-C2-1-P and RTI2018-093941-B-C33 (MCIU/AEI/FEDER). The first author is funded by the Catedras CONACYT project 1146 and received support from the project PAPIIT IN101218 (DGAPA-UNAM). Jantien Rutten is funded through CONACYT Project CB 2016/284430. Gerben Ruessink acknowledges funding by the Dutch Technology Foundation STW, which is part of the Dutch Organisation for Scientific Research (NWO) and is partly funded by the Ministry of Economic Affairs, under contract 12686 (NatureCoast).
Conflicts of Interest
The authors declare no conflict of interest.
Appendix A. Design of the Synthetic Mega-Nourishment
The perturbation induced by the ZM is first obtained by subtracting the measured ZM bathymetry (17 January 2012) from an idealized alongshore-uniform bathymetry with a straight shoreline and parallel depth contours. The alongshore-uniform bathymetry is based on the profile of Yu and Slinn [31] that is adjusted to the measured profile before construction of the ZM. Then, the real ZM perturbation (Figure A1c) is used to adjust a 2D-Gaussian function of the form
where
Here, and determine the center position, () is the standard deviation of the alongshore (cross-shore) decay of the perturbation, is the rotation angle, controlling the initial shape asymmetry, and A determines the amplitude of the Gaussian perturbation and therefore modulates the perturbation in the alongshore and in the cross-shore direction. To reduce the number of variables in the optimization process, is fixed to the shoreline. The remaining Gaussian parameters are optimized to minimize depth differences (wet area only) between the synthetic perturbation (Figure A1d) and the perturbation extracted from measurements (Figure A1c).

Figure A1.
Simplified Zandmotor bathymetry (SZM) obtained from measurements (17 January 2012) (a) and synthetic mega-nourishment bathymetry (SMN) adjusted from a Gaussian-shape function (b), both with the dry beach set to 2 m; and (c,d) their respective associated bed level perturbations.
Once the best parameter values are obtained, the corresponding perturbation is added to the idealized alongshore-uniform bathymetry. Herein, the dry beach is set to 2 m (averaged dry-beach height of the ZM) to ensure a similar order dry-sand volume for the ZM and the synthetic bathymetry. The depth RMSE of this first approximation is 0.41 m, whereas the dry and wet volume differences with the ZM are 5.7% and −7%, respectively. A second approximation is obtained, wherein the dry and wet volume differences are diminished by slightly changing the Gaussian parameters. In particular, the amplitude (A) and both shape variables () are varied while the aspect ratio () is maintained. This second approximation has a slightly higher depth RMSE of 0.44 m, but a dry and wet volume differences of only 0.1% and −0.01%, respectively. We consider this a reasonable compromise between the depth RMSE and the discrepancy in volume. The Gaussian parameter values of the second approximation (hereinafter referred to as synthetic mega-nourishment, SMN; Figure A1b,d) are m, , m, and m (hence, ). To further investigate the implications of assuming a uniform berm, the initial dry beach of the measured ZM is simplified. The inner lagoon and dune height variations in the ZM (not shown) are ignored by forcing a uniform berm height of 2 m (hereinafter referred to as simplified Zandmotor, SZM; Figure A1a,c). The SZM and the SMN bathymetric contours present similar amplitudes and reach similar offshore distances, while the SZM/SMN most offshore dry point is located at 1080/1070 m (Figure A1a,b).

Figure A2.
The 50-year evolution of: (a) diffusivity; (b) feeding asymmetry; and (c) displacement for the Zandmotor (blue lines), simplified Zandmotor (red lines) and synthetic mega-nourishment (yellow lines) predictions.
The three bathymetries (ZM, SZM, and SMN) are forced with the 50-year RWC to ensure that the proposed SMN design mimics the evolution of the ZM. The diffusivity in the ZM and the SZM prediction are similar and slightly smaller than in the SMN prediction (Figure A2a). After five years, the diffusivity curve of the SZM prediction collapses into the SMN curve, both being slightly above the ZM curve. The FA is very similar in the three cases (Figure A2b). Initially, the three perturbations migrate in the same direction (to the negative y-axis; see Figure A2c), but after 15 years the perturbation in the ZM prediction halts.
These results indicate that the short-term differences between the SMN and ZM predictions can be attributed to the discrepancies in the initial bathymetry but the long-term differences are clearly due to the assumption of a uniform dry beach height in the SMN and SZM bathymetries. These findings show that the dry beach design is relevant for the long-term behavior of mega-nourishments. However, given the small differences, SMN is assumed to correctly represent the real ZM.
References
- Stive, M.J.F.; de Schipper, M.A.; Luijendijk, A.P.; Aarninkhof, S.G.J.; van Gelder-Maas, C.; van Thiel de Vries, J.S.M.; de Vries, S.; Henriquez, M.; Marx, S.; Ranasinghe, R. A new alternative to saving our beaches from sea-level rise: The Sand Engine. Coast. Eng. 2013, 29, 1001–1008. [Google Scholar] [CrossRef]
- Hamm, L.; Capobianco, M.; Dette, H.H.; Lechuga, A.; Spanhoff, R.; Stive, M.J.F. A summary of European experience with shore nourishment. Coast. Eng. 2002, 47, 237–264. [Google Scholar] [CrossRef]
- de Schipper, M.A.; De Vries, S.; Ruessink, B.G.; De Zeeuw, R.C.; Rutten, J.; Van Gelder-Maas, C.; Stive, M.J.F. Initial spreading of a mega feeder nourishment: Observations of the Sand Engine pilot project. Coast. Eng. 2016, 111, 23–38. [Google Scholar] [CrossRef]
- Luijendijk, A.P.; Ranasinghe, R.; de Schipper, M.A.; Huisman, B.A.; Swinkels, C.M.; Walstra, D.J.R.; Stive, M.J.F. The initial morphological response of the Sand Engine: A process-based modelling study. Coast. Eng. 2017, 119, 1–14. [Google Scholar] [CrossRef]
- Rutten, J.; Ruessink, B.G.; Price, T.D. Observations on sandbar behaviour along a man-made curved coast. Earth Surf. Process. Landforms 2018, 43, 134–149. [Google Scholar] [CrossRef]
- Lesser, G.R.; Roelvink, J.A.; van Kester, J.A.T.M.; Stelling, G.S. Development and validation of a three-dimensional morphological model. Coastal Eng. 2004, 51, 883–915. [Google Scholar] [CrossRef]
- Ruggiero, P.; Buijsman, M.; Kaminsky, G.M.; Gelfenbaum, G. Modeling the effects of wave climate and sediment supply variability on large-scale shoreline change. Mar. Geol. 2010, 273, 127–140. [Google Scholar] [CrossRef]
- Luijendijk, A.P.; de Schipper, M.A.; Ranasinghe, R. Morphodynamic Acceleration Techniques for Multi-Timescale Predictions of Complex Sandy Interventions. J. Mar. Sci. Eng. 2019, 7, 78. [Google Scholar] [CrossRef]
- Falqués, A.; Garnier, R.; Ojeda, E.; Ribas, F.; Guillén, J. Q2D-morfo: A medium to long term model for beach morphodynamics. In River, Coastal and Estuarine Morphodynamics: RCEM 2007; Dohmen-Jansen, C.M., Hulscher, S.J.M.H., Eds.; Taylor and Francis Group: London, UK, 2008; Volume 1, pp. 71–78. [Google Scholar]
- van den Berg, N.; Falqués, A.; Ribas, F. Long-term evolution of nourished beaches under high angle wave conditions. J. Mar. Syst. 2011, 88, 102–112. [Google Scholar] [CrossRef]
- Arriaga, J.; Rutten, J.; Ribas, F.; Ruessink, B.; Falqués, A. Modeling the longterm diffusion and feeding capability of a mega-nourishment. Coast. Eng. 2017, 121, 1–13. [Google Scholar] [CrossRef]
- Tonnon, P.K.; Huisman, B.J.A.; Stam, G.N.; van Rijn, L.C. Numerical modelling of erosion rates, life span and maintenance volume of mega nourishments. Coast. Eng. 2018, 131, 51–69. [Google Scholar] [CrossRef]
- Falqués, A.; Calvete, D. Large scale dynamics of sandy coastlines. Diffusivity and instability. J. Geophys. Res. 2005, 110. [Google Scholar] [CrossRef]
- Idier, D.; Falqués, A.; Rohmer, J.; Arriaga, J. Self-organized kilometre-scale shoreline sandwave generation: Sensitivity to model and physical parameters. J. Geophys. Res. 2017, 122. [Google Scholar] [CrossRef]
- Ashton, A.; Murray, A.B. High-angle wave instability and emergent shoreline shapes: 1. Modeling of sand waves, flying spits, and capes. J. Geophys. Res. 2006, 111, F04011. [Google Scholar] [CrossRef]
- Kaergaard, K.; Fredsoe, J. Numerical modeling of shoreline undulations part 2: Varying wave climate and comparison with observations. Coastal Eng. 2013, 75, 77–90. [Google Scholar] [CrossRef]
- Kaergaard, K.; Fredsoe, J. Numerical modeling of shoreline undulations part 1: Constant wave climate. Coastal Eng. 2013, 75, 64–76. [Google Scholar] [CrossRef]
- Falqués, A. Wave driven alongshore sediment transport and stability of the Dutch coastline. Coast. Eng. 2006, 53, 243–254. [Google Scholar] [CrossRef]
- Ashton, A.; Murray, A.B.; Arnault, O. Formation of coastline features by large-scale instabilities induced by high-angle waves. Nature 2001, 414, 296–300. [Google Scholar] [CrossRef]
- Falqués, A.; Ribas, F.; Idier, D.; Arriaga, J. Formation mechanisms for self-organized kilometer-scale shoreline sand waves. J. Geophys. Res. Earth Surf. 2017, 122, 10.1002/2016JF003964. [Google Scholar] [CrossRef]
- Portos, L. Effect of Sea Level Variations in the Long-Term Dynamics of the Zandmotor Meganourishment. Bachelor’s Thesis, Universitat Politècnica de Catalunya, Barcelona, Spain, 2020. [Google Scholar]
- van den Berg, N.; Falqués, A.; Ribas, F. Modelling large scale shoreline sand waves under oblique wave incidence. J. Geophys. Res. 2012, 117. [Google Scholar] [CrossRef]
- Komar, P.D. Beach Processes and Sedimentation, 2nd ed.; Prentice Hall: Englewood Cliffs, NJ, USA, 1998. [Google Scholar]
- Battjes, J.A. Modeling of turbulence in the surfzone. Symp. Model. Tech. 1975, 2, 1050–1061. [Google Scholar]
- Pelnard-Considère, R. Essai de theorie de l’Evolution des Formes de Rivage en Plages de Sable et de Galets. Journees L’Hydraulique 1956, 3, 289–298. [Google Scholar]
- Falqués, A. On the diffusivity in coastline dynamics. Geophys. Res. Lett. 2003, 30, 2119. [Google Scholar] [CrossRef]
- Ashton, A.; Murray, A.B. High-angle wave instability and emergent shoreline shapes: 2. Wave climate analysis and comparisons to nature. J. Geophys. Res. 2006, 111, F04012. [Google Scholar] [CrossRef]
- Roelvink, J.A.; Reniers, A.J.H.M. A guide to modeling coastal morphology. In Advances in Coastal and Ocean Engineering; World Scientific: Singapore, 2011. [Google Scholar] [CrossRef]
- Walstra, D.J.R.; Hoekstra, R.; Tonnon, P.K.; Ruessink, B.G. Input reduction for long-term morphodynamic simulations in wave-dominated coastal settings. Coast. Eng. 2013, 77, 57–70. [Google Scholar] [CrossRef]
- Benedet, L.; Dobrochinski, J.P.F.; Walstra, D.J.R.; Klein, A.H.F.; Ranasinghe, R. A morphological modeling study to compare different methods of wave climate schematization and evaluate strategies to reduce erosion losses from a beach nourishment project. Coast. Eng. 2016, 112, 69–86. [Google Scholar] [CrossRef]
- Yu, J.; Slinn, D.N. Effects of wave-current interaction on rip currents. J. Geophys. Res. 2003, 108. [Google Scholar] [CrossRef]
Publisher’s Note: MDPI stays neutral with regard to jurisdictional claims in published maps and institutional affiliations. |
© 2020 by the authors. Licensee MDPI, Basel, Switzerland. This article is an open access article distributed under the terms and conditions of the Creative Commons Attribution (CC BY) license (http://creativecommons.org/licenses/by/4.0/).