Review of Estimating Trophic Relationships by Quantitative Fatty Acid Signature Analysis


Abstract
1. Introduction
2. Fundamental Requirements of QFASA
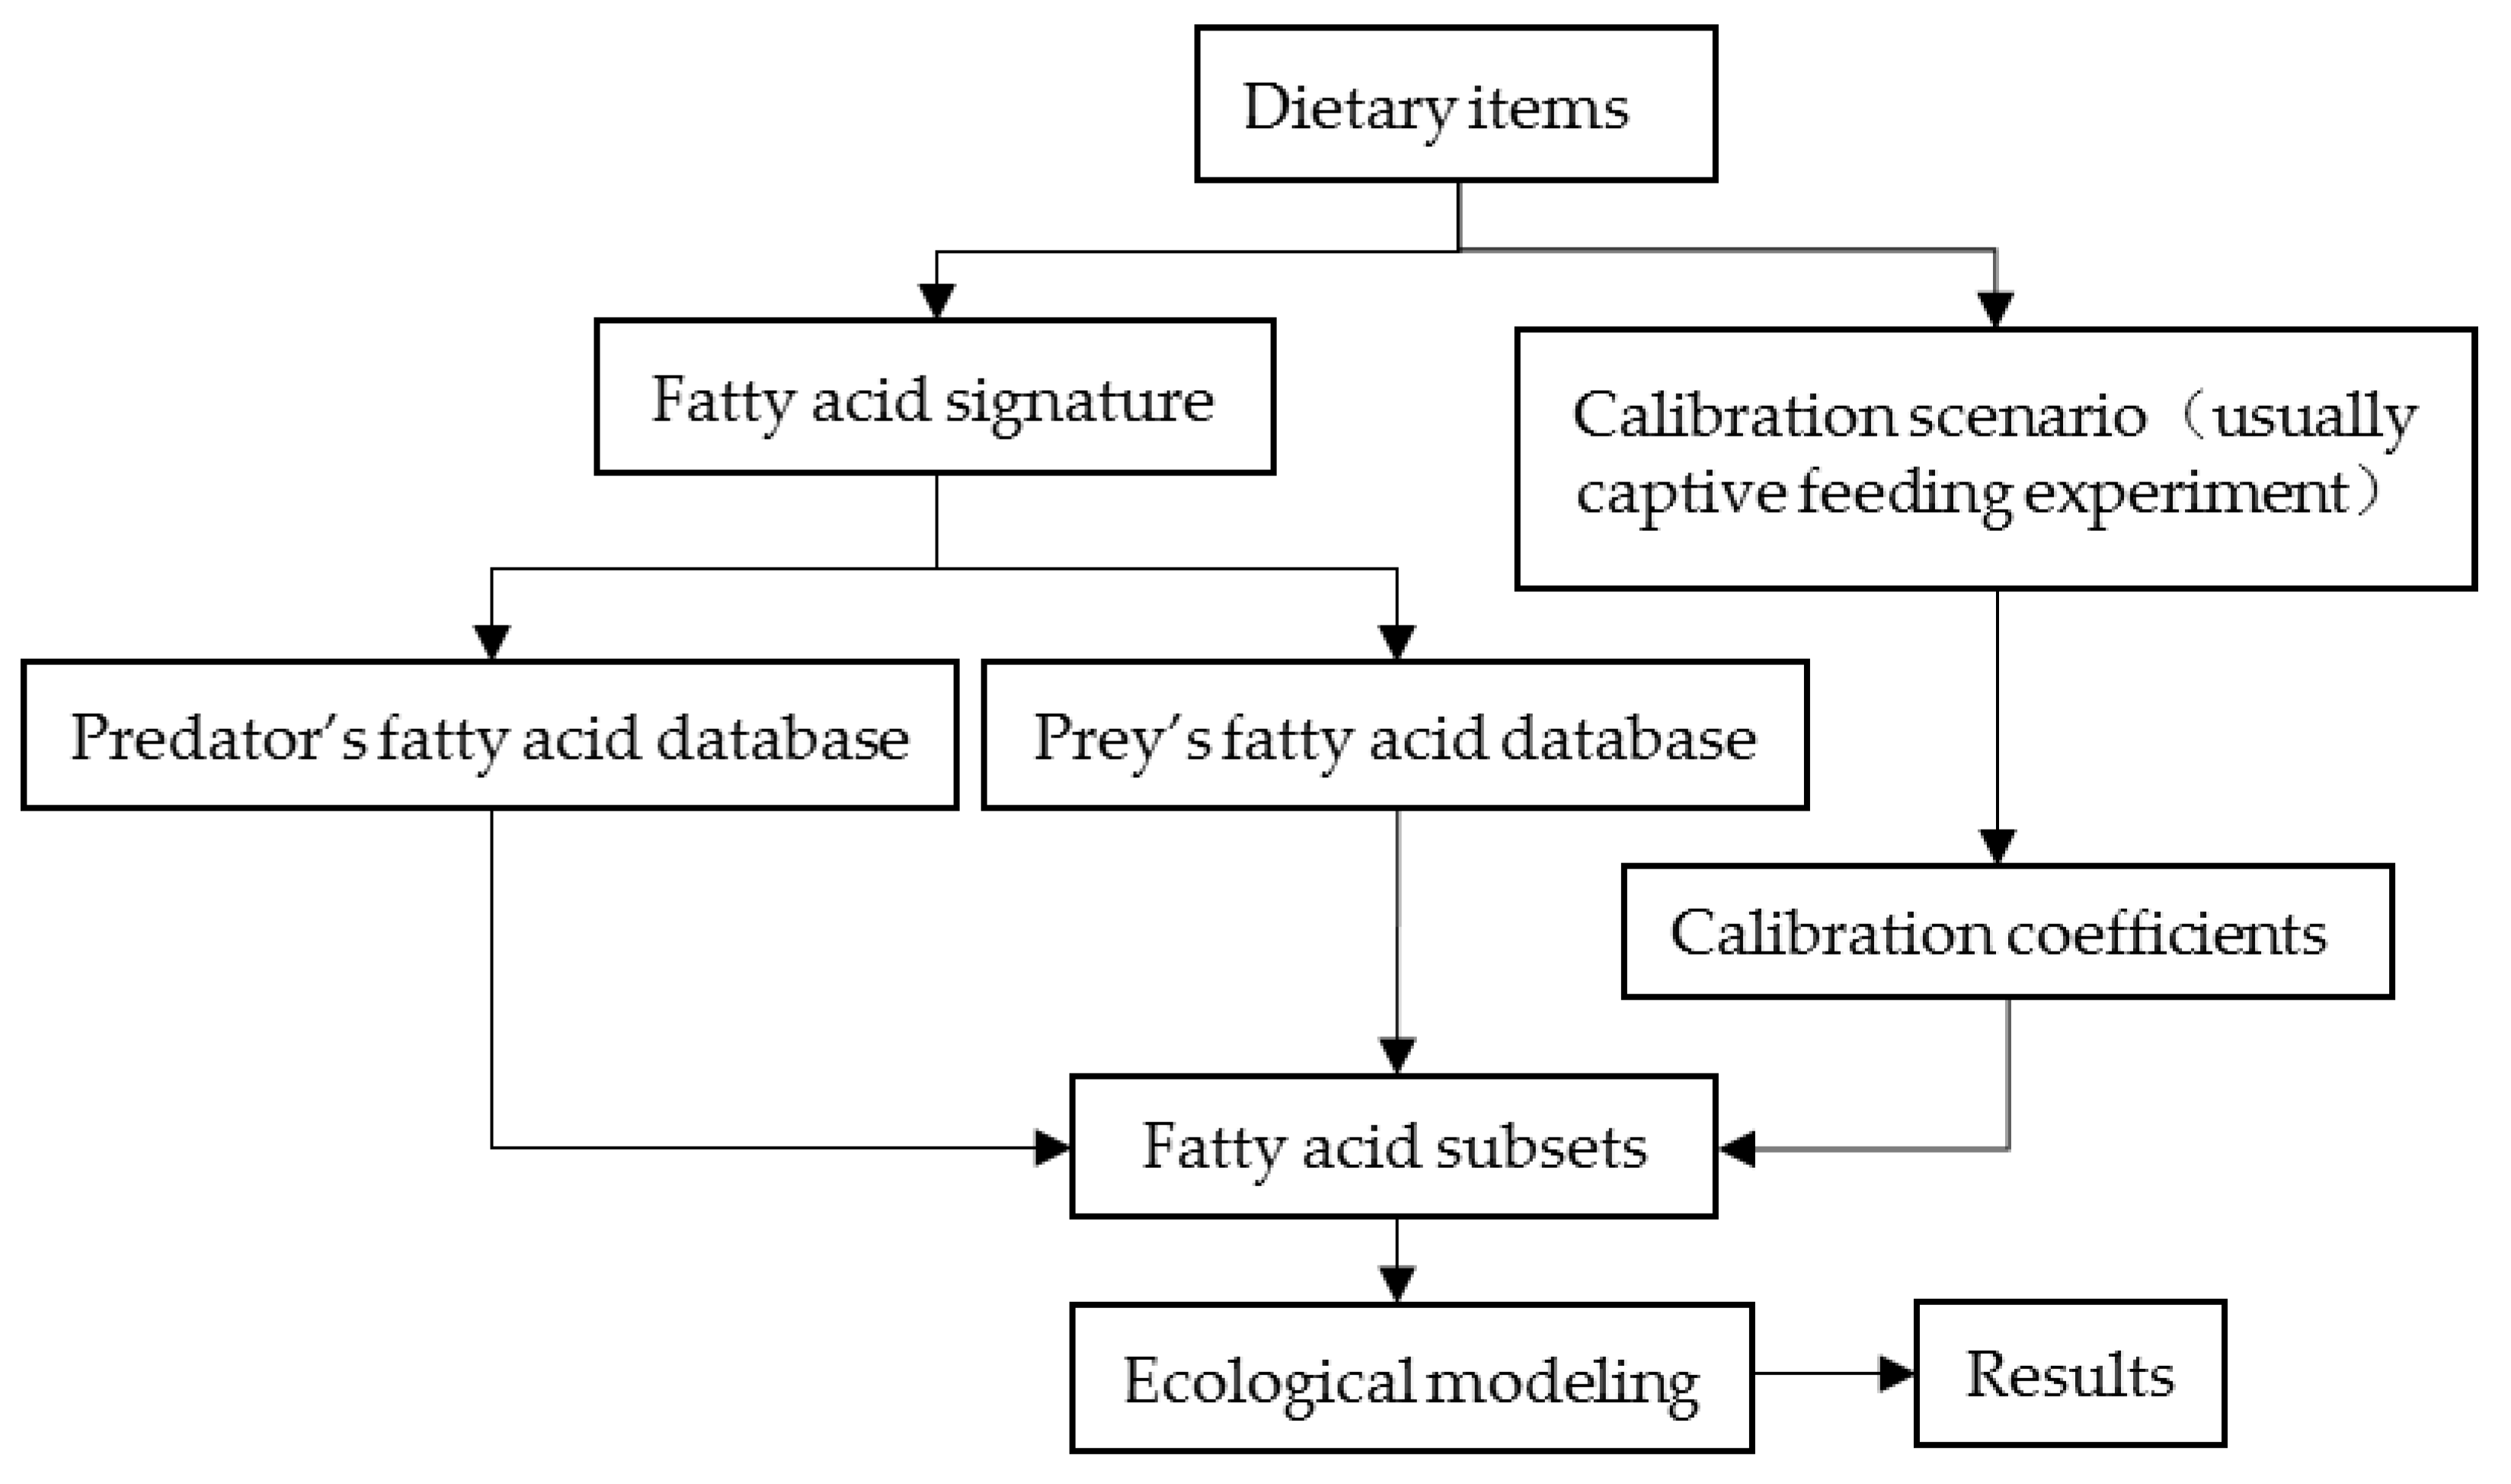
Ecological Modeling
3. The Research Progress of QFASA
3.1. The Improvement of QFASA
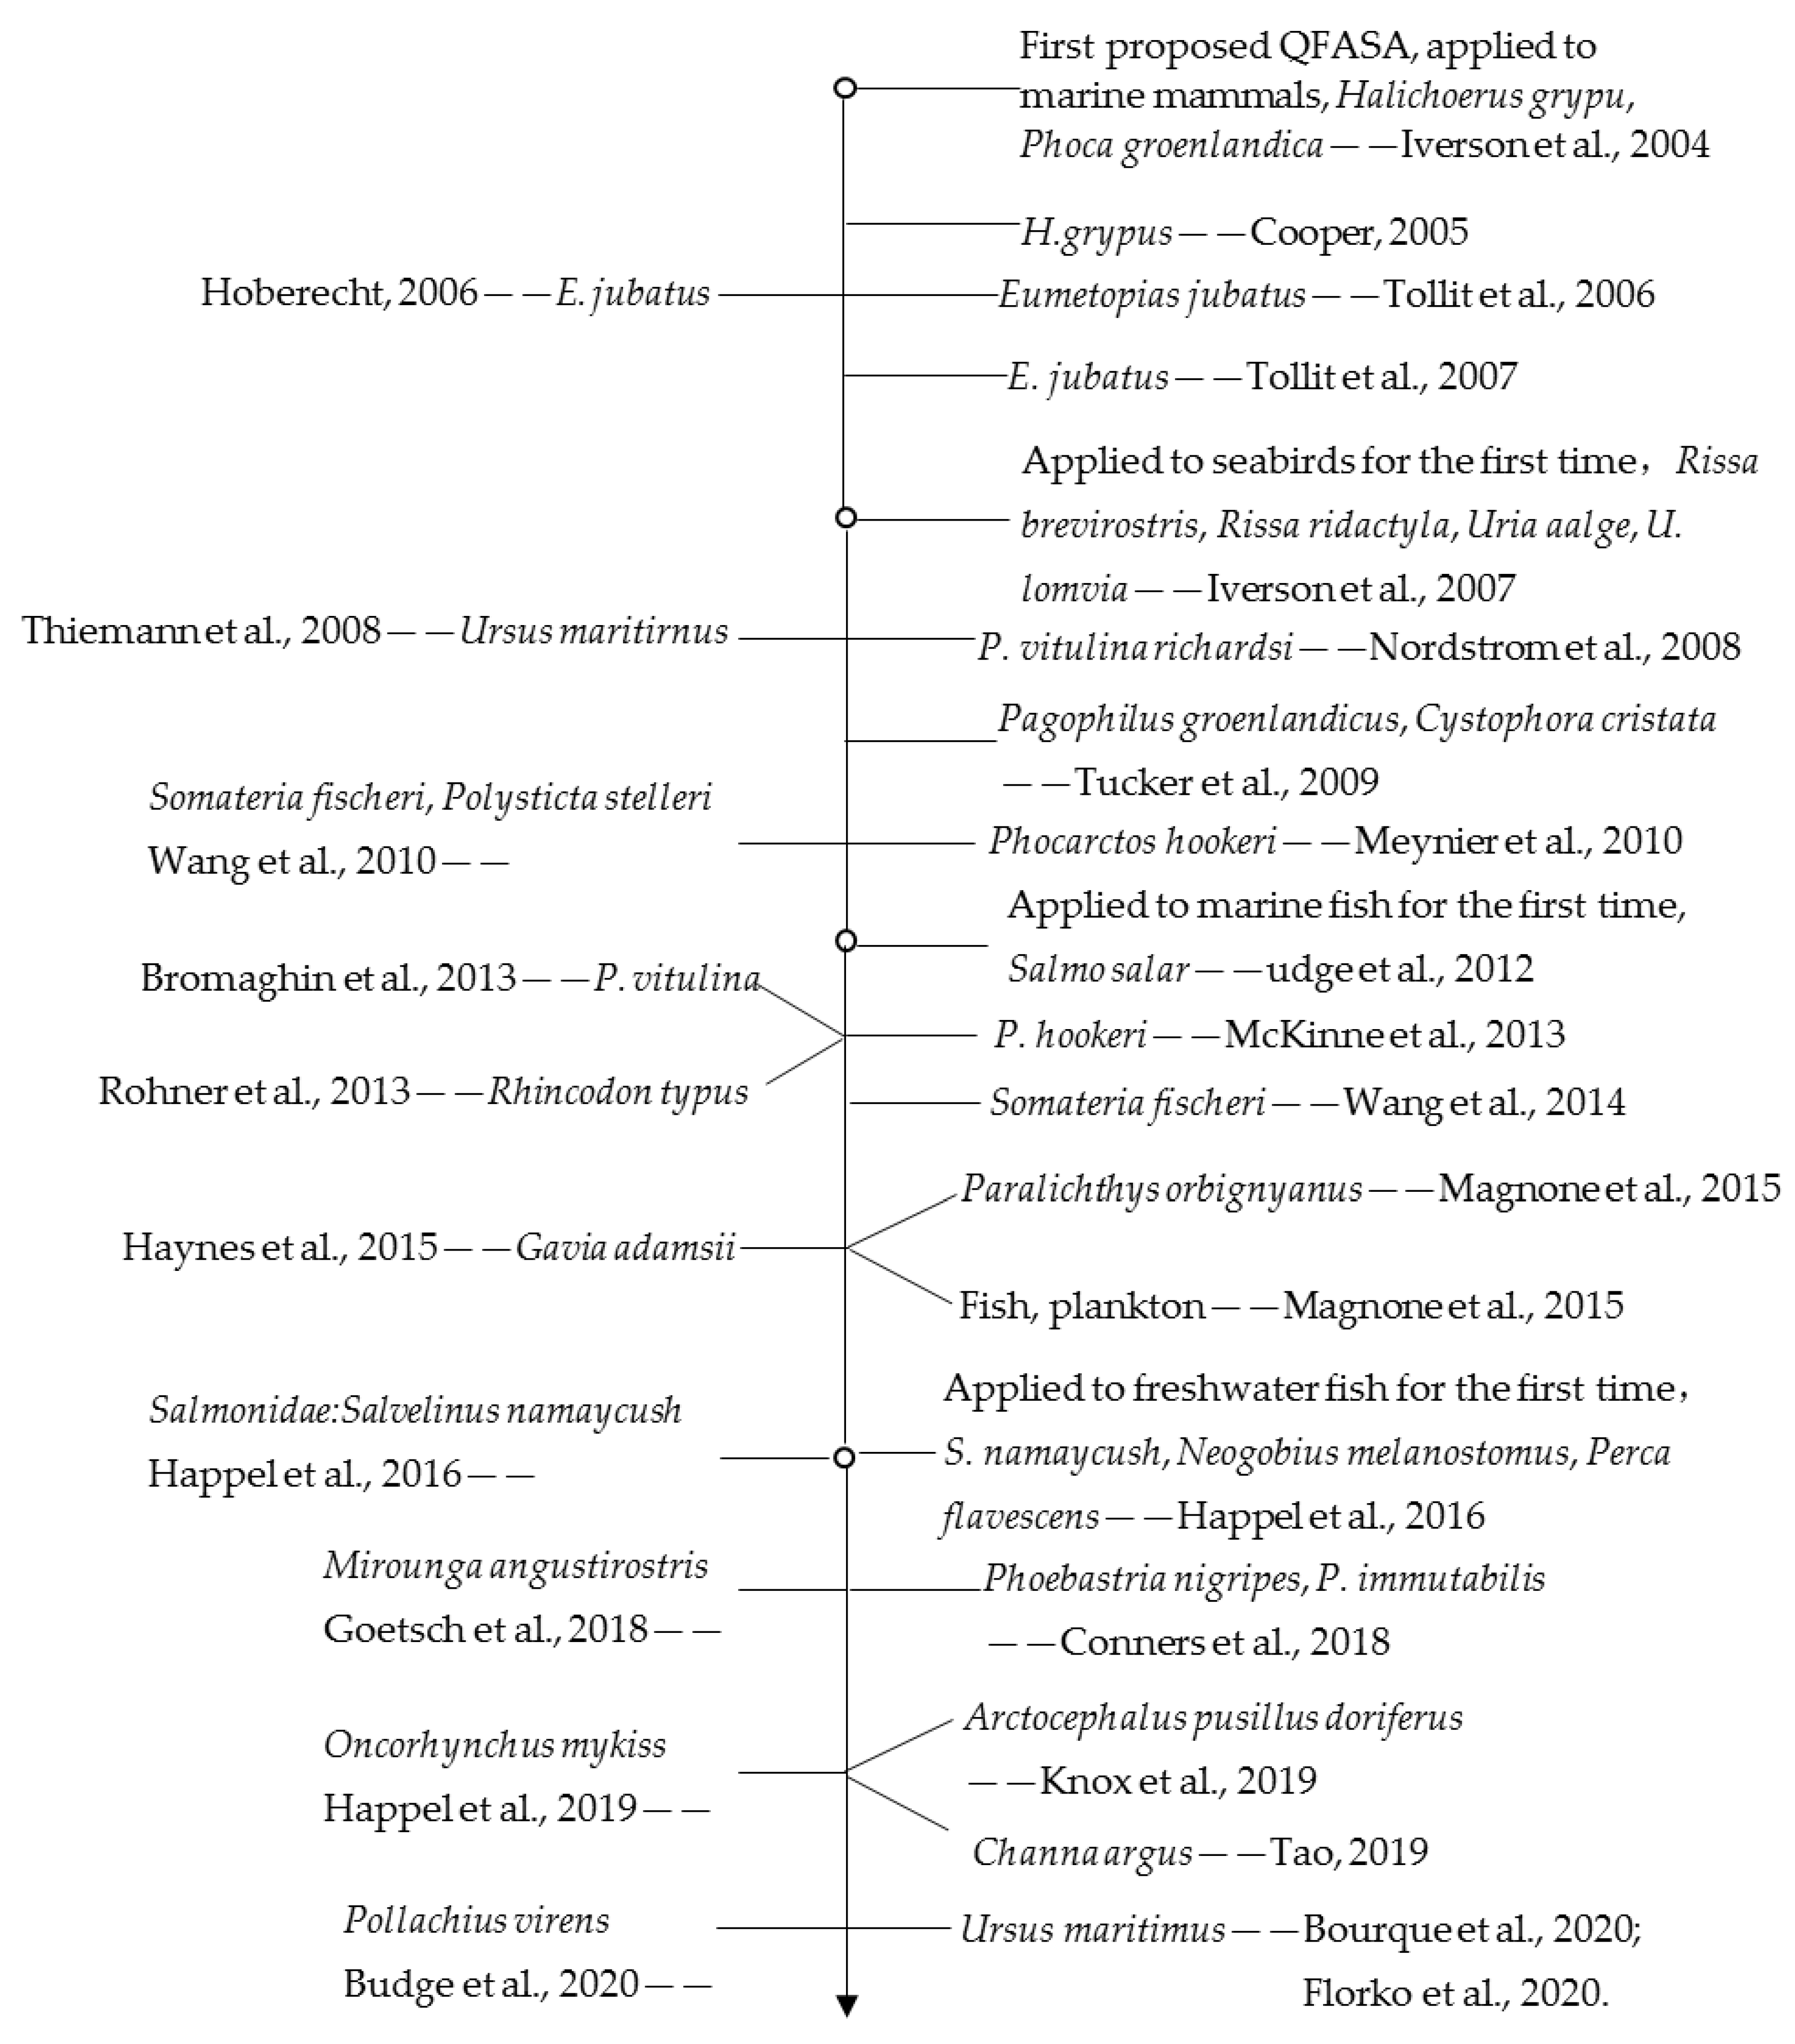
3.1.1. The Testing of the Method in New Taxa
3.1.2. The Selection and Refinement of Prey Library
3.1.3. The Calculation of CCs

| Species | Captive Feeding Trials | References |
|---|---|---|
| Halichoerus grypus, Phoca groenlandica | The CCs were originated from seals that fed herring for five months. | [5] |
| H. grypus | The CCs were obtained by replacing the mixed wild types with a homogeneous test diet via gastric cannula. | [8] |
| Eumetopias jubatus | The CCs were derived from the FA signature of blubber that has been fed only herring for a long time. | [34] |
| E. jubatus | Simulated ephemeral feeding events of E. jubatus. | [35] |
| Uria aalge | The CCs were obtained from silverside which had been raised in captivity since birth. | [9] |
| E. jubatus | Three CCs sets derived from constant diet respectively of Clupea pallasii, Thaleichthys pacificus or the mixture of them. | [31] |
| P. vitulina richardsi | The CCs were estimated from four seals fed herring. | [36] |
| Somateria fischeri, Polysticta stelleri | The female birds were grouped by type and kept in outdoor natural saline habitats respectively, and offered different proportions for each experimental diet, then proceed biopsy sampling. | [10] |
| Salmo salar | The changes of CCs with the FA signatures in the diet were investigated by feeding salmon with diet of different FA compositions. | [21] |
| S. fischeri | Developed CCs for individual FA for eggs. | [11] |
| Paralichthys orbignyanus | The CCs used for P. orbignyanus was obtained through the controlled feeding experiments of feeding on silverside and menhaden for 20 weeks. | [15] |
| Salmonidae: Salvelinus namaycush, | The juvenile lake trout was fed with invertebrates with diverse FA signatures to obtain CCs. | [22] |
| Mirounga angustirostris | The CCs were calculated from known dietary data derived from an adult female elephant seal in captivity. | [19] |
| Pollachius virens | The CCs were obtained by feeding P. virens on three formulated dietary. | [37] |
3.1.4. The Selection of FA Subsets
3.1.5. The Optimization of the Statistical Model
3.2. Research Status of QFASA
4. Conclusions and Suggestions
Author Contributions
Funding
Acknowledgments
Conflicts of Interest
References
- Kelly, J.R.; Scheibling, R.E. Fatty acids as dietary tracers in benthic food webs. Mar. Ecol. Prog. Ser. 2012, 446, 1–22. [Google Scholar] [CrossRef]
- Scott, T. Some further observations on the food of fishes, with a note on the food observed in the stomach of a common porpoise. Annu. Rep. Fish. Board Scotl. Sci. Investig. 1903, 21, 218–227. [Google Scholar]
- Fry, B.; Sherr, E.B. δ13C measurements as indicators of carbon flow in marine and freshwater ecosystems. In Stable Isotopes in Ecological Research, 2nd ed.; Springer: New York, NY, USA, 1989; pp. 196–229. [Google Scholar]
- Sargent, J.R.; Falkpetersen, S. The lipid biochemistry of calanoid copepods. Hydrobiologia 1988, 167, 101–114. [Google Scholar] [CrossRef]
- Iverson, S.J.; Field, C.; Bowen, W.D.; Blanchard, W. Quantitative fatty acid signature analysis: A new method of estimating predator diets. Ecol. Monogr. 2004, 74, 211–235. [Google Scholar] [CrossRef]
- Olsen, Y. Lipids and essential fatty acids in aquatic food webs: What can freshwater ecologists learn from mariculture. In Lipids in Freshwater Ecosystems, 2nd ed.; Springer: New York, NY, USA, 1999; Volume 8, pp. 161–202. [Google Scholar]
- Iverson, S.J. Tracing aquatic food webs using fatty acids: From qualitative indicators to quantitative determination. In Lipids in Aquatic Ecosystems, 2nd ed.; Springer: New York, NY, USA, 2009; Volume 12, pp. 281–308. [Google Scholar]
- Cooper, M.H. Fatty Acid Metabolism in Marine Carnivores: Implications for Quantitative Estimation of Predator Diets. Ph.D. Thesis, Dalhousie University, Halifax, NS, Canada, 2004. [Google Scholar]
- Iverson, S.J.; Springer, A.M.; Kitaysky, A.S. Seabirds as indicators of food web structure and ecosystem variability: Qualitative and quantitative diet analyses using fatty acids. Mar. Ecol. Prog. Ser. 2007, 352, 235–244. [Google Scholar] [CrossRef]
- Wang, S.W.; Hollmén, T.E.; Iverson, S.J. Validating quantitative fatty acid signature analysis to estimate diets of spectacled and Steller’s eiders (Somateria fischeri and Polysticta stelleri). J. Comp. Physiol. B Biochem. Syst. Environ. Physiol. 2010, 180, 125–139. [Google Scholar] [CrossRef]
- Wang, S.W.; Hollmén, T.E.; Iverson, S.J. Egg yolk fatty acids as a proxy to quantify diets of female spectacled eiders (Somateria fischeri). Can. J. Zool. 2014, 92, 453–461. [Google Scholar] [CrossRef]
- Budge, S.M.; Iverson, S.J.; Koopman, H.N. Studying trophic ecology in marine ecosystems using fatty acids: A primer on analysis and interpretation. Mar. Mammal Sci. 2006, 22, 759–801. [Google Scholar] [CrossRef]
- Bromaghin, J.F.; Budge, S.M.; Thiemann, G.W. Should fatty acid signature proportions sum to 1 for diet estimation? Ecol. Res. 2016, 31, 597–606. [Google Scholar] [CrossRef]
- Magnone, L.; Bessonart, M.; Gadea, J.; Salhi, M. Trophic relationships in an estuarine environment: A quantitative fatty acid analysis signature approach. Estuar. Coast. Shelf Sci. 2015, 166, 24–33. [Google Scholar] [CrossRef]
- Magnone, L.; Bessonart, M.; Rocamora, M.; Gadea, J.; Salhi, M. Diet estimation of Paralichthys orbignyanus in a coastal lagoon via quantitative fatty acid signature analysis. J. Exp. Mar. Biol. Ecol. 2015, 462, 36–49. [Google Scholar] [CrossRef]
- Thiemann, G.W.; Iverson, S.J.; Stirling, I. Polar bear diets and arctic marine food webs: Insights from fatty acid analysis. Ecol. Monogr. 2008, 78, 591–613. [Google Scholar] [CrossRef]
- Meynier, L.; Morel, P.C.H.; Chilvers, B.L.; Mackenzie, D.D.S.; Duignan, P.J. Quantitative fatty acid signature analysis on New Zealand sea lions: Model sensitivity and diet estimates. J. Mammal 2010, 91, 1484–1495. [Google Scholar] [CrossRef][Green Version]
- Bromaghin, J.F.; Lance, M.M.; Elliott, E.W.; Jeffries, S.J.; Acevedo-Gutiérrez, A.; Kennish, J.M. New insights into the diets of harbor seals (Phoca vitulina) in the Salish Sea revealed by analysis of fatty acid signatures. Fish. Bull. 2013, 111, 13–26. [Google Scholar] [CrossRef]
- Goetsch, C.; Conners, M.G.; Budge, S.M.; Mitani, Y.; Walker, W.A.; Bromaghin, J.F. Energy-Rich mesopelagic fishes revealed as a critical prey resource for a deep-diving predator using quantitative fatty acid signature analysis. Front. Mar. Sci. 2018, 5, 1–19. [Google Scholar] [CrossRef]
- Conners, M.G.; Chandra, G.; Budge, S.M.; Walker, W.A.; Yoko, M.; Costa, D.P. Fisheries Exploitation by Albatross Quantified With Lipid Analysis. Front. Mar. Sci. 2018, 5, 1–17. [Google Scholar] [CrossRef]
- Budge, S.M.; Penney, S.N.; Lall, S.P.; Trudel, M. Estimating diets of Atlantic salmon (Salmo salar) using fatty acid signature analyses; validation with controlled feeding studies. Can. J. Fish. Aquat. Sci. 2012, 69, 1033–1046. [Google Scholar] [CrossRef]
- Happel, A.; Stratton, L.; Kolb, C.; Hays, C.; Rinchard, J.; Czesny, S. Evaluating quantitative fatty acid signature analysis (QFASA) in fish using controlled feeding experiments. Can. J. Fish. Aquat. Sci. 2016, 73, 1222–1229. [Google Scholar] [CrossRef]
- Happel, A.; Stratton, L.; Pattridge, R.; Rinchard, J.; Czesny, S. Fatty-acid profiles of juvenile lake trout reflect experimental diets consisting of natural prey. Freshw. Biol. 2016, 61, 1466–1476. [Google Scholar] [CrossRef]
- Knox, T.C.; Callahan, D.L.; Kernaléguen, L.; Baylis, A.M.M.; Arnould, J.P.Y. Blubber fatty acids reveal variation in the diet of male Australian fur seals. Mar. Biol. 2019, 166, 117. [Google Scholar] [CrossRef]
- Happel, A.; Maier, C.; Farese, N.V.; Czesny, S.; Rinchard, J. Fatty acids differentiate consumers despite variation within prey fatty acid profiles. Freshw. Biol. 2019, 64, 1416–1426. [Google Scholar] [CrossRef]
- Tao, L. Bioaccumulation Characteristics and Trophic Magnification of Alternative Halogenated Flame Retardants. Ph.D. Thesis, University of Chinese Academy of Sciences (Guangzhou Institute of Geochemistry Chinese Academy of Sciences), Guangzhou, China, 2019. [Google Scholar]
- Keinänen, M.; Käkelä, R.; Ritvanen, T.; Pönni, J.; Harjunpää, H.; Myllylä, T.; Vuorinen, P.J. Fatty acid signatures connect thiamine deficiency with the diet of the Atlantic salmon (Salmo salar) feeding in the Baltic Sea. Mar. Biol. 2018, 165, 161. [Google Scholar] [CrossRef] [PubMed]
- Phillips, D.L.; Inger, R.; Bearhop, S.; Jackson, A.L.; Moore, J.W.; Parnell, A.C. Best practices for use of stable isotope mixing models in food-web studies. Can. J. Zool. 2014, 92, 823–835. [Google Scholar] [CrossRef]
- Piché, J.; Iverson, S.J.; Parrish, F.A.; Dollar, R. Characterization of forage fish and invertebrates in the Northwestern Hawaiian Islands using fatty acid signatures: Species and ecological groups. Mar. Ecol. Prog. Ser. 2010, 418, 1–15. [Google Scholar] [CrossRef]
- Haynes, T.B.; Schmut, J.A.; Bromaghin, J.F.; Iverson, S.J.; Padula, V.M.; Rosenberger, A.E. Diet of yellow-billed loons (Gavia adamsii) in Arctic lakes during the nesting season inferred from fatty acid analysis. Polar Biol. 2015, 38, 1239–1247. [Google Scholar] [CrossRef]
- Tollit, D.J.; Rosen, D.A.S.; Iverson, S.J.; Trites, A.W. Stellar sea lion QFASA captive feeding studies. National Oceanic and Atmospheric Administration. Final Rep. North Pac. Univ. Mar. Mammal Res. Consort. 2007, 9, 1–35. [Google Scholar]
- Rosen, D.; Tollit, D. Effects of phylogeny and prey type on fatty acid calibration coefficients in three pinniped species: Implications for the QFASA dietary quantification technique. Mar. Ecol. Prog. 2012, 467, 263–276. [Google Scholar] [CrossRef]
- Bromaghin, J.F.; Budge, S.M.; Thiemann, G.W.; Rode, K.D. Simultaneous estimation of diet composition and calibration coefficients with fatty acid signature data. Ecol. Evol. 2017, 7, 6103–6113. [Google Scholar] [CrossRef]
- Tollit, D.J.; Heaslip, S.G.; Deagle, B.E.; Iverson, S.I.; Joy, R.; Rosen, D.A.S.; Trites, A.W. Estimating diet composition in sea lions: Which technique to choose. In Sea Lions of the World; Trites, A.W., Atkinson, S.K., DeMaster, D.P., Fritz, L.W., Gelatt, T.S., Rea, L.D., Wynne, K.M., Eds.; Alaska Sea Grant College Program, University of Alaska Fairbanks: Fairbanks, AL, USA, 2006; pp. 293–308. [Google Scholar]
- Hoberecht, L.K. Investigating the Use of Blubber Fatty Acids to Detect Steller Sealion (Eumetopias jubatus) Foraging on Ephemeral High-Quality Prey. Ph.D. Thesis, University of Washington, Seattle, WA, USA, 2006. [Google Scholar]
- Nordstrom, C.A.; Wilson, L.J.; Iverson, S.J.; Tollit, D.J. Evaluating quantitative fatty acid signature analysis (QFASA) using harbour seals Phoca vitulina richardsi in captive feeding studies. Mar. Ecol. Prog. Ser. 2008, 360, 245–263. [Google Scholar] [CrossRef]
- Budge, S.M.; Townsend, K.; Lall, S.P.; Bromaghin, J.F. Dietary fat concentrations influence fatty acid assimilation patterns in Atlantic pollock (Pollachius virens). Philos. Trans. R. Soc. B 2020, 375, 20190649. [Google Scholar] [CrossRef]
- Iverson, S.J.; Bowen, W.D.; Boness, D.J.; Oftedal, O.T. The effect of maternal size and milk energy output on pup growth in grey seals (Halichoerus grypus). Physiol. Biochem. Zool. 1993, 66, 61–88. [Google Scholar] [CrossRef]
- Stewart, C.; Iverson, S.J.; Field, C. Testing for a change in diet using fatty acid signatures. Environ. Ecol. Stat. 2014, 21, 775–792. [Google Scholar] [CrossRef]
- Bromaghin, J.F.; Budge, S.M.; Thiemann, G.W.; Rode, K.D. Assessing the robustness of quantitative fatty acid signature analysis to assumption violations. Methods Ecol. Evol. 2016, 7, 51–59. [Google Scholar] [CrossRef]
- Bromaghin, J.F.; Rode, K.D.; Budge, S.M.; Thiemann, G.W. Distance measures and optimization spaces in quantitative fatty acid signature analysis. Ecol. Evol. 2015, 5, 1249–1262. [Google Scholar] [CrossRef] [PubMed]
- Bromaghin, J.F. Simulating realistic predator signatures in quantitative fatty acid signature analysis. Ecol. Inform. 2015, 30, 68–71. [Google Scholar] [CrossRef]
- Litmanen, J.J.; Perälä, T.A.; Taipale, S.J. Comparison of Bayesian and numerical optimization-based diet estimation on herbivorous zooplankton. Philos. Trans. R. Soc. B 2020, 375, 20190651. [Google Scholar] [CrossRef] [PubMed]
- Bromaghin, J.F. QFASAR: Quantitative fatty acid signature analysis with R. Methods Ecol. Evol. 2017, 8, 1158–1162. [Google Scholar] [CrossRef]
- Bromaghin, J.F.; Budge, S.M.; Thiemann, G.W. Detect and exploit hidden structure in fatty acid signature data. Ecosphere 2017, 8, 1–13. [Google Scholar] [CrossRef]
- Tucker, S.; Bowen, W.D.; Iverson, S.J.; Blanchard, W.; Stenson, G.B. Sources of variation in diets of harp and hooded seals estimated from quantitative fatty acid signature analysis (QFASA). Mar. Ecol. Prog. Ser. 2009, 384, 287–302. [Google Scholar] [CrossRef]
- Mckinney, M.A.; Iverson, S.J.; Fisk, A.T.; Sonne, C.; Rigét, F.F.; Letcher, R.J. Global change effects on the long-term feeding ecology and contaminant exposures of East Greenland polar bears. Glob. Chang. Biol. 2013, 19, 2360–2372. [Google Scholar] [CrossRef]
- Rohner, C.A.; Couturier, L.I.E.; Richardson, A.J.; Pierce, S.J.; Prebble, C.E.M.; Gibbons, M.J.; Nichols, P.D. Diet of whale sharks Rhincodon typus inferred from stomach content and signature fatty acid analyses. Mar. Ecol. Prog. Ser. 2013, 493, 219–235. [Google Scholar] [CrossRef]
- Bourque, J.; Atwood, T.C.; Divoky, G.J.; Stewart, C.; McKinney, M.A. Fatty acid-based diet estimates suggest ringed seal remain the main prey of southern Beaufort Sea polar bears despite recent use of onshore food resources. Ecol. Evol. 2020, 10, 2093–2103. [Google Scholar] [CrossRef] [PubMed]
- Florko, K.R.N.; Thiemann, G.W.; Bromaghin, J.F. Drivers and consequences of apex predator diet composition in the Canadian Beaufort Sea. Oecologia 2020, 19, 51–63. [Google Scholar] [CrossRef]
- Stewart, C.; Field, C. Managing the essential zeros in quantitative fatty acid signature analysis. J. Agric. Biol. Environ. Stat. 2011, 16, 45–69. [Google Scholar] [CrossRef]
- Stewart, C. Zero-inflated beta distribution for modeling the proportions in quantitative fatty acid signature analysis. J. Appl. Stat. 2013, 40, 985–992. [Google Scholar] [CrossRef]
- Neubauer, P.; Jensen, O.P. Bayesian estimation of predator diet composition from fatty acids and stable isotopes. PeerJ 2015, 3, 1–19. [Google Scholar] [CrossRef] [PubMed]
- Bowen, W.D.; Iverson, S.J. Methods of estimating marine mammal diets: A review of validation experiments and sources of bias and uncertainty. Mar. Mammal Sci. 2013, 29, 719–754. [Google Scholar] [CrossRef]
- Brush, J.M.; Fisk, A.T.; Hussey, N.E.; Johnson, T.B. Spatial and seasonal variability in the diet of round goby (Neogobius melanostomus): Stable isotopes indicate that stomach contents overestimate the importance of dreissenids. Can. J. Fish. Aquat. Sci. 2012, 69, 573–586. [Google Scholar] [CrossRef]
- Phillips, D.L. Mixing models in analyses of diet using multiple stable isotopes: A critique. Oecologia 2001, 127, 166–170. [Google Scholar] [CrossRef]
- Galloway, A.W.E.; Eisenlord, M.E.; Dethier, M.N.; Holtgrieve, G.; Brett, M.T. Quantitative estimates of resource utilization by an herbivorous isopod using a Bayesian fatty acid mixing model. Mar. Ecol. Prog. Ser. 2014, 507, 219–232. [Google Scholar] [CrossRef]
- Galloway, A.W.E.; Taipale, S.J.; Hiltunen, M.; Peltomaa, E.; Strandberg, U.; Brett, M.T.; Kankaala, P. Diet specific biomarkers show that high quality phytoplankton fuel herbivorous zooplankton in large boreal lakes. Freshw. Biol. 2014, 59, 1902–1915. [Google Scholar] [CrossRef]
- Jankowska, E.; Troch, M.D.; Michel, L.N.; Lepoint, G.; Wodarska-Kowalczuk, M. Modification of benthic food web structure by recovering seagrass meadows, as revealed by trophic markers and mixing models. Ecol. Indic. 2018, 90, 28–37. [Google Scholar] [CrossRef]
- Kang, J.X.; Wang, J.A. Simplified method for analysis of polyunsaturated fatty acids. BMC Biochem. 2005, 6, 5. [Google Scholar] [CrossRef] [PubMed]
- Kühn, J.; Tobias, K.; Jähngen, A.; Ruess, L. Shifting systems: Prerequisites for the application of quantitative fatty acid signature analysis in soil food webs. Philos. Trans. R. Soc. B 2020, 375, 20190650. [Google Scholar]
- Goetz, F.; Jasonowicz, A.; Johnson, R.; Biga, P.; Fischer, G.; Sitar, S. Physiological differences between lean and siscowet lake trout morphotypes: Are these metabolotypes? Can. J. Fish. Aquat. Sci. 2014, 71, 427–435. [Google Scholar] [CrossRef]
- Ballester-Lozano, G.F.; Benedito-Palos, L.; Estensoro, I.; Sitjà-Bobadilla, A.; Kaushik, S.; Pérez-Sánchez, J. Comprehensive biometric, biochemical and histopathological assessment of nutrient deficiencies in gilthead sea bream fed semi-purified diets. Br. J. Nutr. 2015, 114, 713–726. [Google Scholar] [CrossRef]
- Kyneb, A.; Toft, S. Effects of maternal diet quality on offspring performance in the rove beetle tachyporus hypnorum. Ecol. Entomol. 2006, 31, 322–330. [Google Scholar] [CrossRef]


| Species | Species Type | Research Contents | References |
|---|---|---|---|
| H. grypus, P. groenlandica | Marine mammals | Proposed the QFASA model, which was the first time FAs has been used to quantitatively estimate the diet of predators. | [5] |
| H. grypus | Marine mammals | Conducted controlled feeding experiments designed to investigate some of the issues relating to CC, optimization of FA sets and validation of QFASA. | [8] |
| E. jubatus | Marine mammals | Captive feeding experiments were conducted on juvenile female E. jubatus to estimate the ability of QFASA to recognize known mixed dietary. | [34] |
| E. jubatus | Marine mammals | Simulated ephemeral feeding events of E. jubatus and investigated the use of QFASA to evaluate diet. | [35] |
| Rissa brevirostris, Rissa ridactyla, U. aalge, U. lomvia | Seabirds | Using four species of captive and wild birds to verify the application of QFASA in seabird dietary estimation. | [9] |
| P. vitulina richardsi | Marine mammals | Tested the QFASA model with newly weaned P. vitulina richardsi, obtained species-specific CCs, and compared the credibility of QFASA with previous studies. | [36] |
| Ursus maritirnus | Marine mammals | Examined the internal and external factors that affect the prey selection of U. maritirnus. | [16] |
| Pagophilus groenlandicus, Cystophora cristata | Marine mammals | Studied the effects of demographic, time and space differences on the diet of P. groenlandicus and C. cristata. | [46] |
| Phocarctos hookeri | Marine mammals | Optimized the QFASA model for bycaught P. hookeri by changing some parameters (such as the CC subsets used in previous studies [5,17,30]); and estimated the diet of P. hookeri by optimization model. | [17] |
| S. fischeri, P. stelleri | Seabirds | Developed CCs to explain the lipid metabolism of eider and verified the reliability of QFASA through captive experiments. | [10] |
| S. salar | Marine fish | Investigated the application of QFASA to S. salar. | [21] |
| Ursus maritimus | Marine mammals | Used QFASA and δ13C-FA to estimate the variations in the diet of U. maritimus from 1984 to 2011, which reflected the massive shifts in the ecosystem of East Greenland. | [47] |
| P. vitulina | Marine mammals | Used QFASA to investigate the diets of P. vitulina. | [18] |
| Rhincodon typus | Marine fish | Used QFASA and stomach content analysis to identify the main prey of R. typus. | [48] |
| S. fischeri | Seabirds | Examined the diversity of FA signatures between fertilized and unfertilized eggs of feeding female S. fischeri, developed CC for individual to explain the modification of yolk on FAs derived from the dietary, and verified that the QFASA model could use yolk to estimate the diet of maternal. | [11] |
| P. orbignyanus | Marine fish | Estimated the quantitative diet of P. orbignyanus, determined CC and validated the model by controlled trials. | [15] |
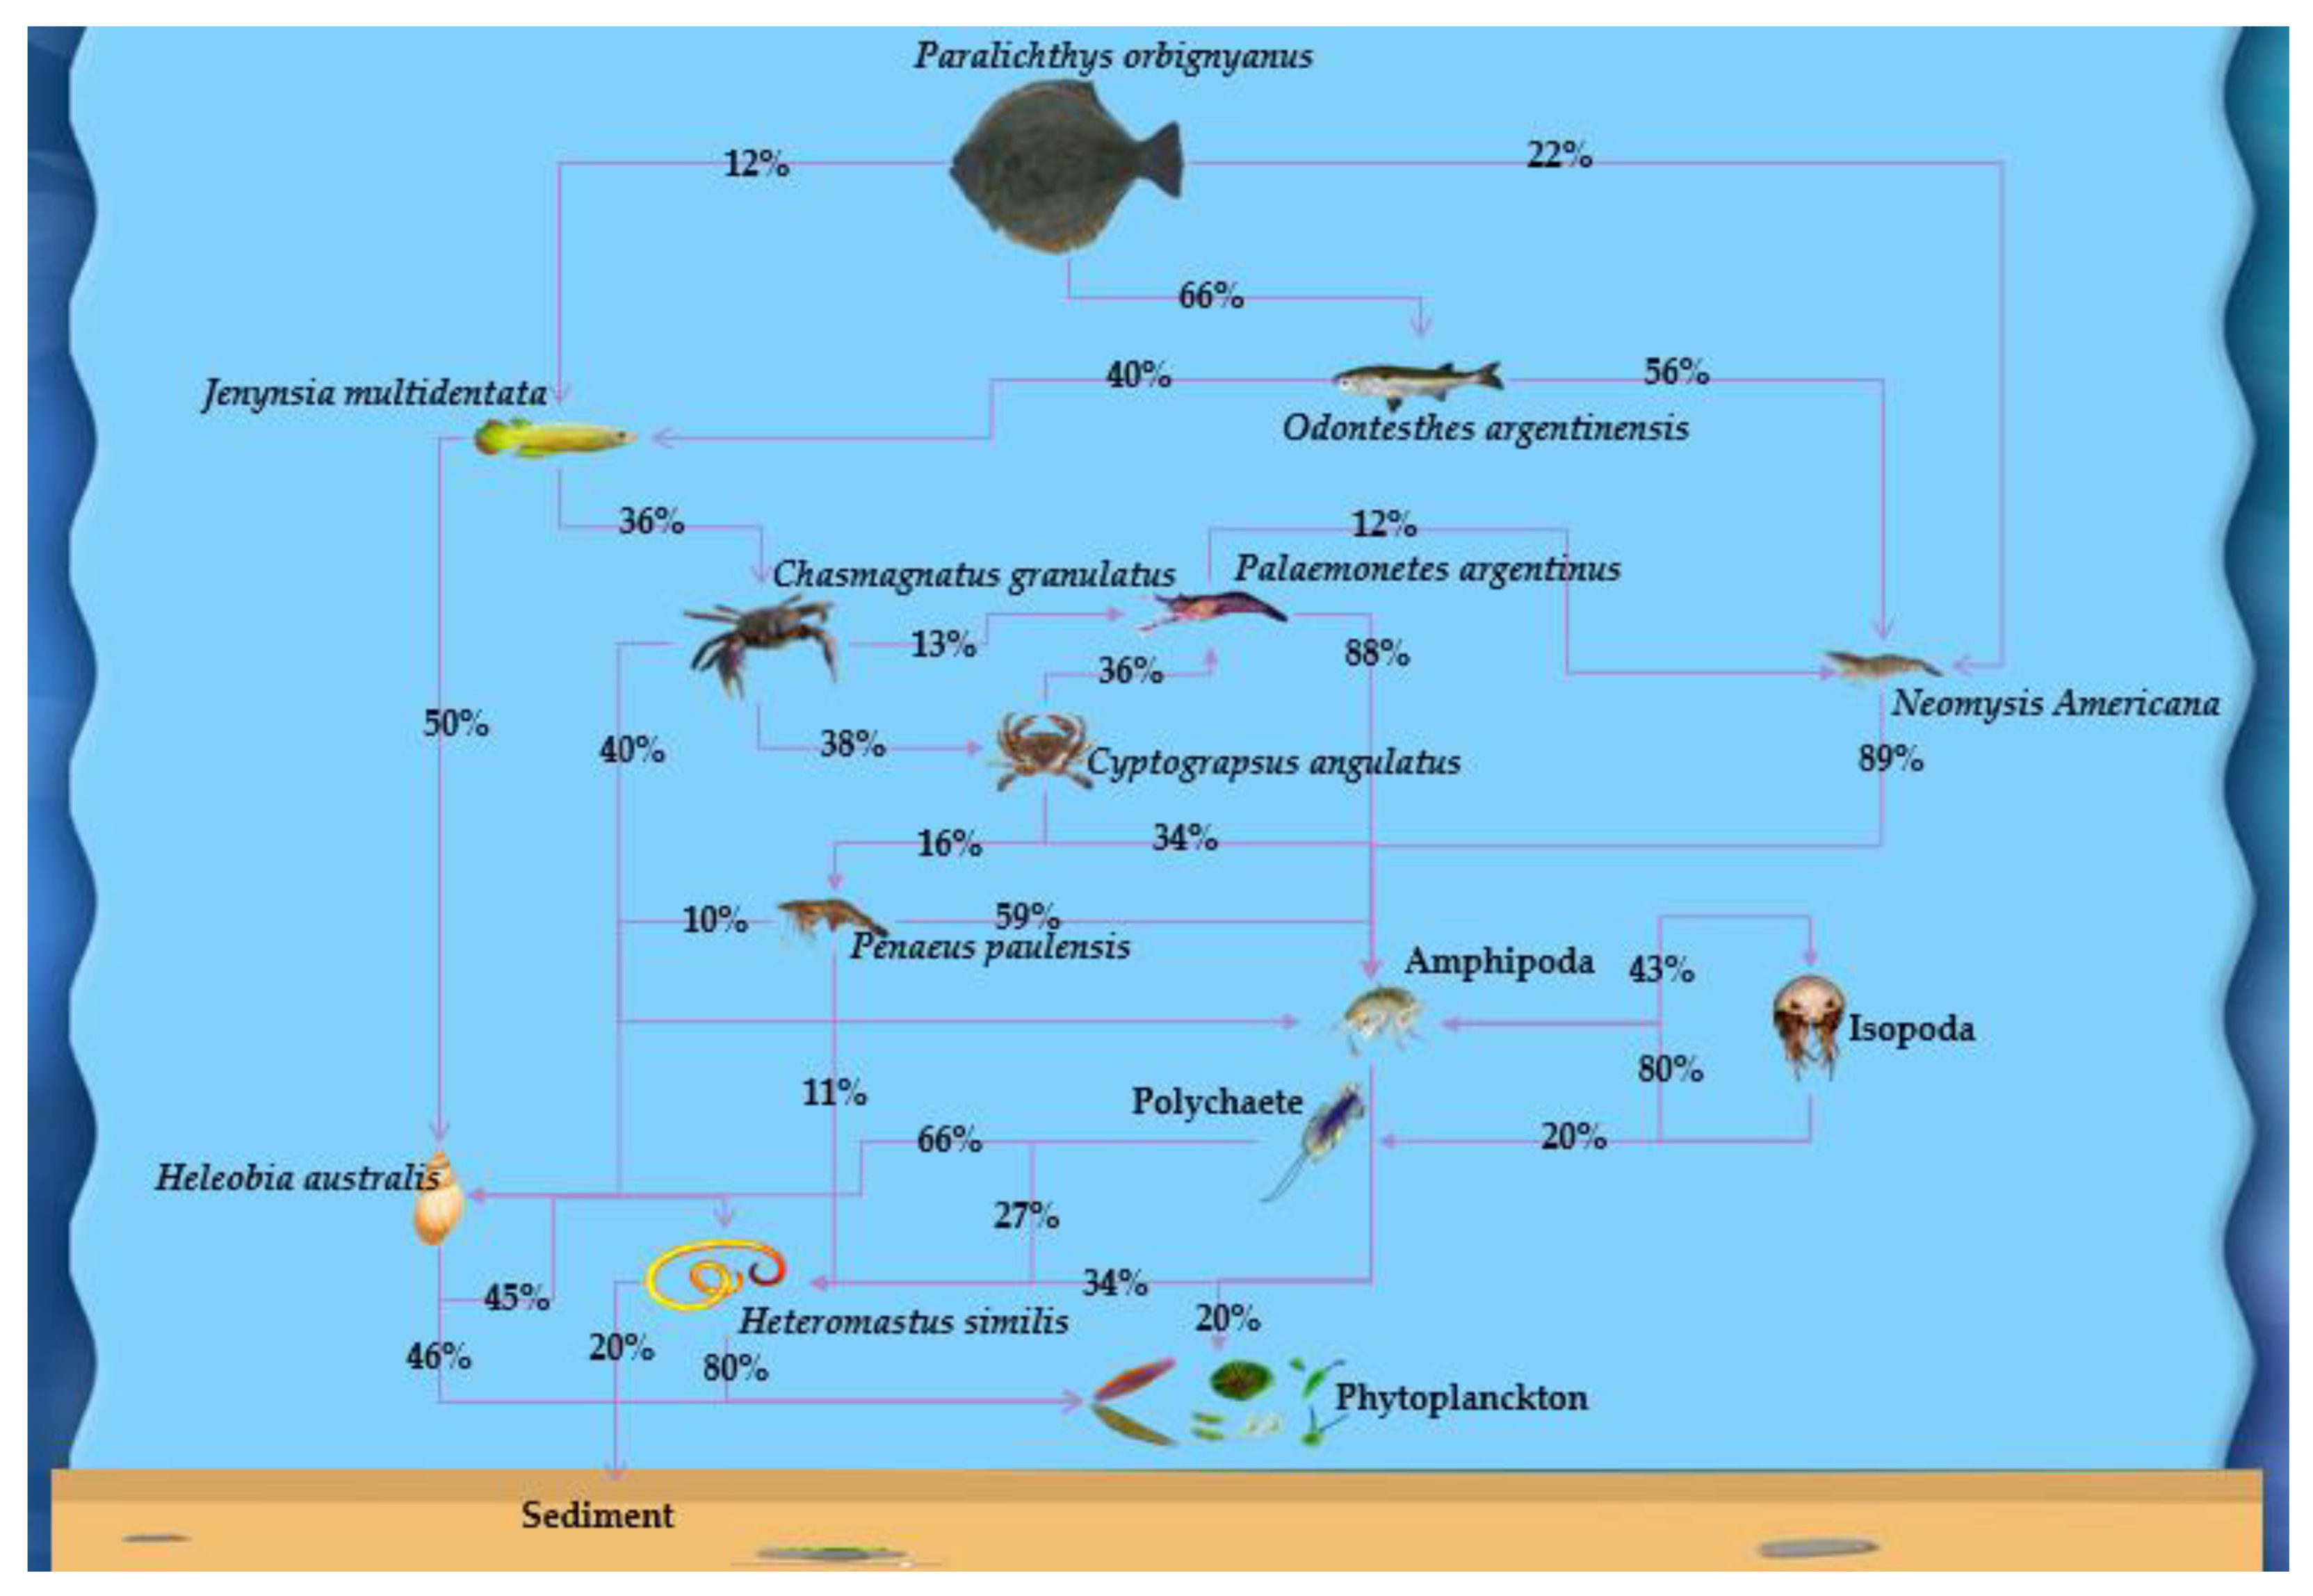
| P. orbignyanus and other 21 species | Marine fish, plankton etc. | Used QFASA to generate a food web model in the aquatic environment to find out the trophic relationships among the species and compared the consequences with previous researches. | [14] |
| Gavia adamsii | Seabirds | Estimated the diet of G. adamsii breeding on the Arctic Coastal Plain using QFASA. | [30] |
| Salmonidae: S. namaycush | Marine mammals | Determined the time it takes to make the FA signatures of the S. namaycush similar to its dietary, and evaluated the difference in CC among different diets. | [22] |
| S. namaycush, Neogobius melanostomus, Perca flavescens | Marine mammals | Established a model for estimating diet and evaluated its ability in freshwater predator. | [23] |
| Phoebastria nigripes, Phoebastria immutabilis | Seabirds | Estimated two albatross types by QFASA, and adapted the QFASA model, which introduced a combination of FAs and fatty alcohols. | [20] |
| M. angustirostris | Marine mammals | Proposed a new approach to optimize prey library, then evaluated the diet of M. angustirostris with the optimized prey library. | [19] |
| Arctocephalus pusillus doriferus | Marine mammals | Investigated the diet composition of male A. pusillus doriferus, and dietary differences among males and seasonal changes in diet. | [24] |
| Oncorhynchus mykiss | Freshwater fish | The effect of intraspecific difference in the FASs of preys on QFASA was verified by controlled captive trial. | [25] |
| Channa argus | Freshwater fish | Estimated the diet composition of C. argus using QFASA model. | [26] |
| P. virens | Marine fish | Estimated the effects of diet fat concentrations on assimilation patterns of FAs in P. virens. | [37] |
| Ursus maritimus | Marine mammals | Estimated the diet composition of U. maritimus by QFASA. | [49,50] |
Publisher’s Note: MDPI stays neutral with regard to jurisdictional claims in published maps and institutional affiliations. |
© 2020 by the authors. Licensee MDPI, Basel, Switzerland. This article is an open access article distributed under the terms and conditions of the Creative Commons Attribution (CC BY) license (http://creativecommons.org/licenses/by/4.0/).
Share and Cite
Zhang, J.; Ren, C.; Zhang, H.; Yin, F.; Zhang, S.; Wan, R.; Kitazawa, D. Review of Estimating Trophic Relationships by Quantitative Fatty Acid Signature Analysis. J. Mar. Sci. Eng. 2020, 8, 1030. https://doi.org/10.3390/jmse8121030
Zhang J, Ren C, Zhang H, Yin F, Zhang S, Wan R, Kitazawa D. Review of Estimating Trophic Relationships by Quantitative Fatty Acid Signature Analysis. Journal of Marine Science and Engineering. 2020; 8(12):1030. https://doi.org/10.3390/jmse8121030
Chicago/Turabian StyleZhang, Junbo, Chonglan Ren, Hu Zhang, Fang Yin, Shuo Zhang, Rong Wan, and Daisuke Kitazawa. 2020. "Review of Estimating Trophic Relationships by Quantitative Fatty Acid Signature Analysis" Journal of Marine Science and Engineering 8, no. 12: 1030. https://doi.org/10.3390/jmse8121030
APA StyleZhang, J., Ren, C., Zhang, H., Yin, F., Zhang, S., Wan, R., & Kitazawa, D. (2020). Review of Estimating Trophic Relationships by Quantitative Fatty Acid Signature Analysis. Journal of Marine Science and Engineering, 8(12), 1030. https://doi.org/10.3390/jmse8121030