Abstract
Gobies (Gobiiformes: Gobiidae) are the most species-rich family of fishes in general, and the most abundant fish group in the European seas. Nonetheless, our knowledge on many aspects of their biology, including the population genetic diversity, is poor. Although barriers to gene flow are less apparent in the marine environment, the ocean is not a continuous habitat, as has been shown by studies on population genetics of various marine biota. For the first time, European marine goby species which cannot be collected by common fishery techniques were studied. The population genetic structure of two epibenthic species, Gobius geniporus and Gobius cruentatus, from seven localities across their distribution ranges was assessed, using one mitochondrial (cytochrome b) and one nuclear gene (first intron of ribosomal protein gene S7). Our results showed that there is a great diversity of haplotypes of mitochondrial gene cytochrome b in both species at all localities. Global fixation indices (FST) indicated a great differentiation of populations in both studied gobies. Our results did not show a geographic subdivision to individual populations. Instead, the data correspond with the model of migration which allow divergence and recurrent migration from the ancestral population. The estimated migration routes coincide with the main currents in the studied area. This matches well the biology of the studied species, with adults exhibiting only short-distance movements and planktonic larval stages.
1. Introduction
Despite the fact that the seas and oceans are interconnected, marine organisms can show a strong genetic differentiation [1]. Several phylogeographical studies have shown that even the ocean is a fragmented environment. A spatial genetic structure has been discovered in different marine organisms, e.g., in sea-grasses [2], sponges [3], mollusks [4], sea cucumbers [5], sea urchins [6], crustaceans [7,8,9] or fishes [10,11,12]. However, in contrast to terrestrial and freshwater ecosystems, the delimitation of individual populations in the ocean is not an easy task because barriers to gene flow are far less apparent in the marine environment [13]. Some of the driving forces of the genetic variability of marine species are oceanographic barriers (e.g., direction of currents, presence of straits, extent of different type of habitats, temperature and salinity zonation), limited dispersal capabilities of species, isolation by distance and geological history of the area. On the other hand, factors such as hydrodynamics, long duration of the larval pelagic stage, or migratory behaviour of adults are most commonly responsible for the genetic homogenization of the population [1,14]. Final scenario of genetic partitioning can thus be a consequence of interaction of more factors. Understanding these processes is crucial for marine phylogeographical investigations, for species conservation and management of marine resources [15].
The Mediterranean Sea is a small enclosed basin, connected with the Atlantic Ocean by the Strait of Gibraltar and with the Black Sea through the Bosporus. It is subdivided into several deep subbasins separated by shallow sills. The major water exchange occurs with the Atlantic Ocean, and is strongly affected by climate [16]. Cool surface water inflows from the Atlantic Ocean to the Mediterranean Sea, while warm and more saline subsurface Mediterranean water outflows to the Atlantic Ocean [16].
Although they are adjacent and were connected during most of their past, the Mediterranean Sea and the Atlantic Ocean had partly dissimilar geological histories. Driven by a combination of climatic and tectonic forces, the Messinian Salinity Crisis (MSC, 5.97 to 5.33 million years ago, Mya) was one of the major events, which impacted geological history, and consequently the biota of the Mediterranean Sea [17,18]. It is widely accepted that at the onset of the MSC, the Mediterranean Sea became disconnected from the world ocean, and, as a consequence of evaporation, suffered a great water level drawdown [18,19]. This led to a severe change of environmental conditions in the Mediterranean Sea. However, the scenarios of the fate of the Mediterranean Sea at that time greatly differ (from almost complete desiccation of the sea to the existence of the deepwater marine environment in the first phase of the MSC [17,18,20]). The second phase of the MSC was characterized by fluctuations of environmental conditions due to the repeated connection with the Paratethys [17,21]. Accordingly with the various scenarios about the form of the Mediterranean Sea during the MSC, various scenarios about the fate of the ichthyofauna in the Mediterranean Sea were proposed, ranging from the extinction [22] to survival, possibly in refugia; the latter was corroborated by the findings of fossils of marine fishes [21,23]. The MSC ended by the opening of Gibraltar and refilling of the Mediterranean Sea by Atlantic waters in an event known as the Zanclean flooding [24] and by the onset of stable marine conditions [17].
Another event with a strong impact on the diversity and distribution of the extant species in the Mediterranean Sea and the Atlantic was the Pleistocene glaciation (2.6 Mya to 11,600 before present, BP) [25]. During the most recent ice ages the growth and decay of ice masses drove the world sea-level fluctuations in the order of 10’s to over 100 m on the time scales of 100’s to 10,000 years, and ranging from the sea level several meters higher than present to more than 100 m below the present level [26]. The coastline of the Atlantic Ocean and the Mediterranean Sea and its size changed accordingly, huge areas, e.g., the North Adriatic Sea, were repeatedly desiccated and reflooded. During the Last Glacial Maximum (24,000–18,000 years BP), the sea level was about 125 m lower than today, with the most intensive sea level rise between 17,000–7000 years BP, after which it reached more or less the present coastline [27]. Glacial and interglacial phases resulted in the sea temperature alterations, with the reconstructed cooling amplitude in the Mediterranean during the Last Glacial Maximum reaching up to 6–7 °C [28], which should have had a severe impact on the diversity and distribution of the living organisms in the Mediterranean Sea. However, the Mediterranean waters remained warmer that those of the adjacent Atlantic Ocean during glacial peaks, thus many species now present in the warm temperate Atlantic likely survived the cold phases of the glacial cycles in the Mediterranean Sea, recolonizing the Atlantic when more favourable temperatures were re-established during interglacial phases like the present one [29].
The studied area concerns the Mediterranean Sea province and the South European Atlantic Shelf ecoregion. The Mediterranean Sea is classified as a specific, well defined biogeographic province within the Temperate Northern Atlantic realm [30]. It is further divided into seven ecoregions (Adriatic Sea, Aegean Sea, Levantine Sea, Tunisian Plateau/Gulf of Sidra, Ionian Sea, Western Mediterranean, and Alboran Sea). Its neighbouring marine provinces are the Black Sea in the east and the Lusitanian province in the Atlantic Ocean in the west. The Mediterranean Sea is connected with the South European Atlantic Shelf and Saharan Upwelling ecoregions (both belonging to the Lusitanian province and having the boundary in the Gibraltar Strait area).
Circulation of water in the studied area, and especially in the Mediterranean Sea, is very complex. The main currents and gyres are depicted in Figure 1. Within the studied region, multiple biogeographical barriers have been identified, of which the Almeria-Oran front, the Strait of Sicily and the Otranto Strait (see Figure 1) are considered to be the major ones influencing genetic diversity of various marine organisms [1,13]. However, dissimilar influence of biogeographic barriers has been found even for the closely related taxa with the same biology and ecology [31,32,33,34].
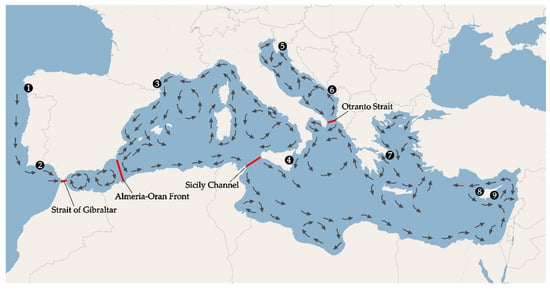
Figure 1.
Map of the studied area, with sampling sites (black dots), main oceanographic barriers (red lines) and circulation of the main currents in the Mediterranean Sea (arrows). 1—Spain, 2—Portugal, 3—France, 4—Sicily, 5—Croatia, 6—Montenegro, 7—Greece, 8—Cyprus W (west), 9—Cyprus E (east).
Gobies (Gobiiformes: Gobiidae), with currently recognized 1915 valid species, are the most species-rich family of fishes in the world [35]. It is also the most speciose family of fishes of the European seas and, in particular, of the Mediterranean Sea. The majority of gobies are benthic fishes with planktonic larval stages. Marine gobies predominantly occupy shallow shelf bottoms, with limited number of species extending to deeper shelf, and only a few of them reaching bathyal depths [36,37]. In total, there are more than 90 marine species of gobies in European seas listed in the last review [38]. However, new species are still being discovered, e.g., [36,37,39,40], and the knowledge about the distribution of many species is still quite limited e.g., [41,42,43]. The information about the population genetic diversity and phylogeography of European marine gobies is very poor too. Population genetic studies have been done so far in only a few species, which are easy to collect by the common fishery techniques. Nevertheless, on the basis of limited information, it is evident that for some studied goby species there is a clear genetic differentiation between distant populations [44,45,46,47,48,49,50], but not for the others [51]. Within the genus Gobius, the population genetic structure was studied so far in the only species, Gobius niger, where the mitochondrial marker nicotinamide adenine dinucleotide dehydrogenase (NADH) was analysed by restriction fragment length polymorphism (RFLP) [51]. The results suggested the existence of population subdivision in this species.
In this work we studied the population genetic diversity of Gobius geniporus and Gobius cruentatus (Gobius-lineage, gobiine-like clade sensu Agorreta et al. [52]), two bottom dwelling (epibenthic) species. Gobius cruentatus occurs in the north-eastern Atlantic Ocean, from south-western Ireland to the coasts of Senegal, and in the Mediterranean and the Black Seas [53,54], while G. geniporus is a Mediterranean endemic [53]. Gobius cruentatus is typically detected on mixed bottom habitats dominated by stones, boulders or seagrass [55]. It can grow up to 18 cm and occurs in depths between 1.5 and 40 m [53,54]. Gobius geniporus prefers sandy bottoms mixed with gravel, cobbles and boulders, with at least some amount of rocky formations present scattered over sand. It reaches a size of 16 cm and the depth at which it was observed ranges from 1 to 30 m [53,56,57]. These species are restricted to shallow shelf bottoms, so their real area of occupancy is only a narrow stripe of bottom along the coastline. Being small, epibenthic, territorial and non-migratory in adulthood, these species are expected to have only a limited dispersal capability [53].
The aim of this study was to assess the genetic diversity of seven geographically distant populations of two species of European marine gobies, G. geniporus and G. cruentatus, across their distribution ranges, using mitochondrial and nuclear markers, in order to reveal a possible population subdivision and a potential existence of biogeographical barriers which would affect the connectivity of the populations.
2. Materials and Methods
2.1. Samples
It is very difficult to collect benthic marine gobies in general, unless they live on sandy or muddy bottoms. They are usually not commercially used, so it is not possible to purchase them or to obtain them from fishermen even as a bycatch. As both species investigated in this study typically occupy mixed bottom habitats it is not possible to use common fishery techniques, such as trawl nets or push-nets, to collect them, even though these two species belong to the largest ones among gobies from the north-eastern Atlantic and the Mediterranean Sea. For research purposes, these two species are being collected individually, during scuba-diving and using hand nets and anaesthetic, which is very time consuming. They do not occur in shoals and it can be difficult to spot them. A total of 74 specimens of G. geniporus from seven localities in the Mediterranean Sea and 41 specimens of G. cruentatus from two localities in the Atlantic Ocean and five localities in the Mediterranean Sea were included in this study (see Figure 1 and Table 1). Tissue samples and voucher specimens are deposited in the ichthyological collection of the National Museum, Prague, Czech Republic.

Table 1.
Sampling sites and number of analysed specimens of Gobius geniporus and G. cruentatus for cytochrome b and S7.
2.2. DNA Extraction, Amplification, Sequencing
Total genomic DNA was extracted from the finclips using Geneaid® DNA Isolation Kit following the manufacturer’s protocol. The samples were analysed for two genes, one mitochondrial, cytochrome b (cyt b), and one nuclear, first intron of the ribosomal protein gene S7 (S7). For the amplification of cyt b, the primers GluF and ThrR [58] were used. S7 was amplified with the primers S7RPEX1F and S7RPEX2R [59]. The polymerase chain reaction (PCR) was performed in 25 μL total volume containing 12.5 μL of PPP Master Mix (TopBio), 9.7 μL of Ultrapure H2O, 0.65 μL of each primer and 2 μL of DNA isolate. Amplification of cyt b followed the protocol described in Šanda et al. [60]. For S7, a specific touch-down protocol was used with the following steps: initial denaturation at 95 °C for 5 min, followed by 5 cycles of denaturation, annealing, and elongation: 94 °C for 40 s, 60 °C for 1 min, 72 °C for 2 min, followed by 35 cycles of denaturation, annealing, and elongation: 95 °C for 30 s, 56 °C for 1 min, 72 °C for 2 min, and the final elongation at 72 °C for 20 min. PCR products were purified with the use of ExoSAP-IT and sequenced at Macrogen Europe. For the sequencing of cyt b, the specific internal primers were designed: GcruF1 (5′-GGT GCA ACC GTC ATC ACT AA-3′) and GcruR1 (5′-AGT GGG TTG GCA GGA ATG-3′) for G. cruentatus and GgenF1 (5′-GTA GGC TAT GTC CTG CCC TG AG-3′) and GgenR1 (5′-TTG GAG CCT GTC TCG TG GA-3′) for G. geniporus. Nuclear gene S7 was sequenced using the amplification primers. Sequences were deposited in GenBank under accession numbers MT774412-MT774485 (cyt b) and MT893746—MT893891 (S7) for G. geniporus and MT684467—MT684507 (cyt b) and MT684508—MT684585 (S7) for G. cruentatus.
2.3. Data Analyses
Obtained cyt b and S7 sequences were checked manually in Chromas v2.6.4 and aligned in Bioedit v7.2.6.1 [61]. The appropriate model of nucleotide substitution was determined using jModelTest v2.1.9 [62], based on Akaike Information Criterion (AIC) [63]. DnaSP v6.11.01 [64] was used to assess the haplotype diversity (Hd) and nucleotide diversity (π), as well as to perform Fu and Li’s F and Tajima’s D neutrality tests. The results of these tests can point to possible selection or a change in population demography. To evaluate the amount of genetic variance within and between populations, analysis of molecular variance (AMOVA) was performed using ARLEQUIN v3.5 [65]. It estimates population differentiation with the use of individual haplotypes and their frequency in the studied populations. This further enables calculation of fixation indices, a global FST and pairwise FSTs. FST expresses a degree of genetic differentiation between the individual populations. The two populations from Cyprus were grouped together, as well as the two populations from the Adriatic Sea (Montenegrin and Croatian); the grouping was made based on location, proximity and the water circulation. The remaining populations represented individual groups. The statistical significance of the FST values was tested by executing 16,000 permutations. For pairwise FSTs, a Bonferroni correction was subsequently applied to correct for multiple tests. Further, genetic distances (uncorrected p-distances) between and within populations of each species were calculated in MEGA 6 [66]. The datasets of S7 were phased by the program PHASE v2.1.1 [67]. All sequences were phased with a probability of 0.9 and the final datasets with inferred phased sequences consisted of 146 sequences for G. geniporus and 78 for G. cruentatus. The phased S7 data were then used for calculating diversity measures and constructing haplotype networks. The rest of the analyses were not performed on S7 due to a very low polymorphism of S7 datasets. A detailed reconstruction of relationships of the haplotypes of populations was performed by a statistical parsimony method under a 95% connection limit [68], using PopART [69].
Isolation by distance hypothesis was tested by Mantel test [70] using R v3.5 software (package adegenet), executing 1000 permutations. Mantel test compares genetic distances estimated by pairwise FSTs with geographical distances between locations. The matrices of geographical distances were derived from the coordinates of the individual localities. Another approach was applied using ARLEQUIN v3.5 [65], where the shortest marine paths between each pair of localities, estimated from the GoogleEarth, were used in matrices of geographical distances. Statistical significance of the Mantel test was estimated by executing 1000 permutations.
We estimated migration routes between pairs of populations using Migrate-n software v4.4. [71]. Five demographic scenarios were tested for each population pair: (1) model assuming full migration between populations, (2) model assuming migration from the population A to the population B, (3) model assuming migration from B to A, (4) model allowing divergence, where A splits off from B, with migration from B to A after the split, (5) model allowing divergence, where B splits off from A, with migration from A to B after the split. For each scenario, the migration rate and population sizes were estimated; for the scenarios (4) and (5) also the time of divergence between the two populations. Pairs of populations are listed in the Table S1. Migrate-n analyses were conducted using a static heating strategy with four short chains with temperature values of 1.0, 1.5, 3.0, and 1.0 × 10⁶ and a single long chain. 1,000,000 steps were recorded every 100 generations with 200,000 steps discarded as burn-in to ensure the convergence of the analyses. Appropriate mutation model was assessed using jModelTest [62] resulting in Hasegawa-Kishino-Yano (HKY). Priors were set as follows: Bayes-priors = THETA * * UNIFORMPRIOR: 0.001, 0.000 0.0100, Bayes-priors = MIG * * UNIFORMPRIOR: 0.000, 100000.000, 10000.000.
Past population demography of each species was inferred using the linear Bayesian skyline plot model [72], implemented in BEAST v1.8.4 [73]. It allows observing fluctuations of effective population sizes from the present, backwards in time, to the coalescence in the most recent common ancestor, and is expressed graphically. Analyses were conducted under the Bayesian coalescent method, with corresponding nucleotide substitution model for each species and using a strict molecular clock. The x-axis of the plot shows the time in mutation units per nucleotide position and y-axis scaled effective population size. Simulations ran for 100 million Markov chain Monte Carlo (MCMC) steps with sampling every 10,000th generation. Results from three independent runs were combined using LogCombiner and burn-in was set to 20 million iterations in each run. Finally, TRACER v1.7.0 [74] was used to check the parameter estimates and visualize Bayesian skyline plots.
3. Results
3.1. Gobius geniporus
In G. geniporus, 74 specimens were analysed (Table 1). The alignment of cyt b had a length of 1113 bp and contained 56 polymorphic sites, while there were only two variable sites in the 594 bp long alignment of 146 sequences of S7 (Table 2). A total of 45 haplotypes were found for cyt b and only three haplotypes for S7 within seven Mediterranean populations. The best-fit substitution model selected for cyt b was general time reversible with proportion of invariable sites (GTR+I). Haplotype diversity of cyt b was high, while nucleotide diversity low (Hd = 0.969; π = 0.004) and for S7 both haplotype and nucleotide diversity were extremely low (Hd = 0.054; π = 0.0001) (Table 2). Diversity measures calculated per each locality are listed in Table S2. The values of neutrality tests (Tajima’s D, Fu and Li’s F) for cyt b were negative and significant, indicating a recent population expansion or purifying selection (Table 2). The Bayesian skyline plot of G. geniporus depicts a gradual population size growth since the coalescence and its stabilization in the present (Figure 2a).
Table 2.
Diversity measures and results of neutrality tests for Gobius geniporus and G. cruentatus based on cytochrome b and S7 sequences. N—number of sequences, S—number of segregating sites, Nh—number of haplotypes, Hd—haplotype diversity, π—nucleotide diversity. Significant values (at α = 0.05) indicated by asterisk.
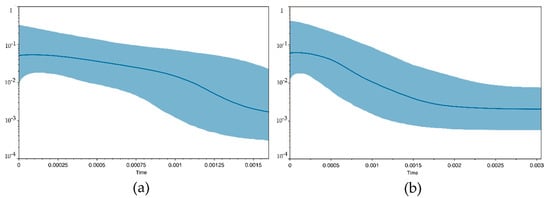
Figure 2.
Bayesian skyline plot for Gobius geniporus (a) and G. cruentatus (b) based on cytochrome b sequence data. The graph illustrates fluctuation of the population size from recent to the coalescence (from left to right). Y-axis stands for scaled effective population size and x-axis for time scale in units of mutation per nucleotide position. Blue middle line shows the median estimate, 95% confidence interval is indicated in blue.
In the haplotype network of G. geniporus based on cyt b, there was an indication of a certain geographical pattern: there were two major haplotype groups. In one of them there was one more frequent haplotype shared between the central Mediterranean populations (Montenegrin, Croatian and Sicilian), while in the other one, there were two more frequent haplotypes, shared between Cypriot and Greek populations (Figure 3a and Figure S1a). Most haplotypes from Cypriot populations grouped together, as well as the majority of the haplotypes from the Sicilian one. Unique haplotypes prevailed in the network. Practically all sequences of S7 in G. geniporus were of the same haplotype (142 out of 146, Figure 3a) and due to this low polymorphism, all following analyses were performed only on the cyt b dataset. AMOVA for G. geniporus based on the cyt b showed that most of the genetic variance is distributed within populations (76%). FST index indicated a high level of genetic differentiation (FST = 0.237, p < 0.01). Pairwise FSTs showed in most cases a pronounced or high level of genetic differentiation between the pairs of populations, but several values were low (Table 3); however, only a half of values were significant. Statistically significant values indicating high or pronounced differentiation were for most comparisons for Sicilian and both Cypriot populations. Mean p-distances between the populations were low and ranged between 0.2 and 0.6% (Table 3). Mean p-distances within populations were of a similar range (0.1–0.5%), while the maximum intraspecific p-distance for G. geniporus was 1.08%.
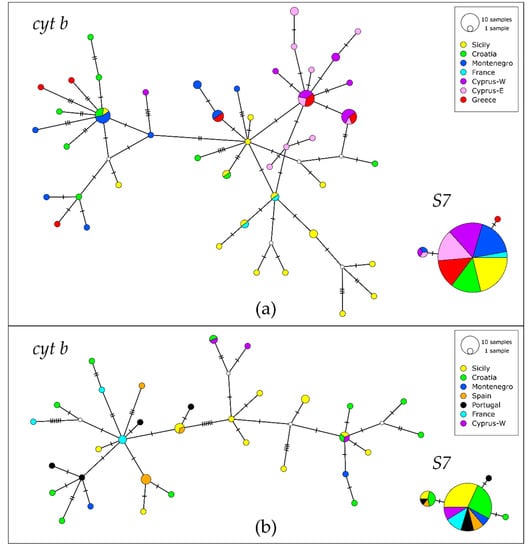
Figure 3.
Haplotype networks of Gobius geniporus (a) and G. cruentatus (b) based on cytochrome b and S7 sequences. Size of circle is proportional to haplotype frequency. The number of mutational steps between closest haplotypes is indicated by hatch marks. Missing intermediate haplotypes are shown as small white circles.
Table 3.
Mean genetic distances between Gobius geniporus populations for cytochrome b (uncorrected p-distances, in %, above the diagonal), intrapopulation distances (on diagonal), and pairwise FSTs (below diagonal). Significant values of FSTs (at α = 0.05/number of pairs) indicated by asterisk.
Mantel test was significant using both approaches (adegenet: observation 0.299, expectation 10−5, p-value < 0.001; ARLEQUIN: correlation coefficient 0.69, p-value < 0.001), indicating a possible pattern of isolation by distance (see Figure 4a). Among the modelled migration scenarios, for each pair of populations, the model which allows divergence and the recurrent immigration from the ancestral population after the split was the one with the highest probability. The divergence directions and the migration routes are schematically depicted in the Figure 5a, while the estimates of immigration rates, divergence times and population sizes are listed in the Table S3. The system of migration routes is rather circular, anticlockwise, with a large circle between Sicily, western Cyprus, eastern Cyprus, Greece, Montenegro, Croatia and Sicily, and two smaller ones: Sicily, Greece, Montenegro, Croatia, Sicily, and Sicily, Montenegro, Croatia, Sicily. All the routes, with the exception of the one between Sicily and Greece eastwards, can be well explained by the prevailing currents (see Figure 5a). The highest rate of migration among the modelled pairs of populations was estimated between the western and eastern Cyprus, correspondingly with their proximity and the prevailing eastward current.
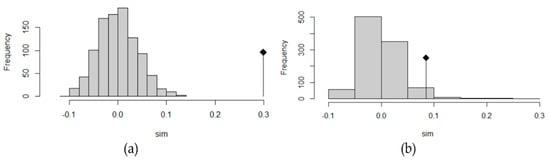
Figure 4.
Histograms of the Mantel test assessing the relationship between genetic and geographic distance for Gobius geniporus (a) and G. cruentatus (b).
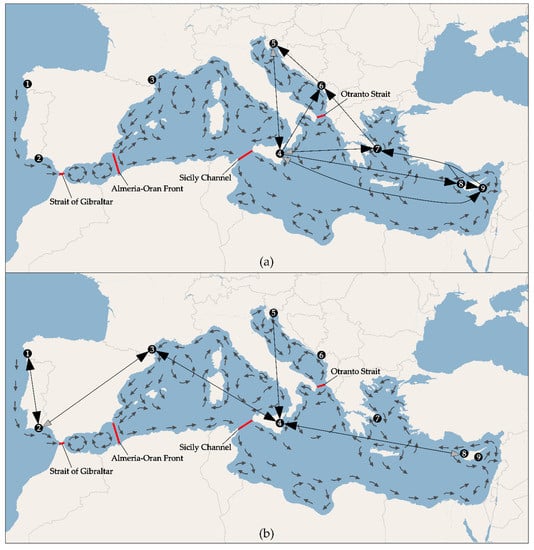
Figure 5.
Migration routes of Gobius geniporus (a) and G. cruentatus (b) estimated by Migrate-n. Grey tips of arrows indicate less probable directions.
3.2. Gobius cruentatus
Mitochondrial marker cyt b was analysed in 41 specimens of G. cruentatus, and nuclear marker S7 in 39 specimens (Table 1). The alignment length of cyt b was 1117 bp and contained 47 polymorphic sites, while that of S7 had a length of 555 bp and contained only three segregating sites (Table 2). There were 32 haplotypes of cyt b and only four of S7. The best-fit substitution model selected for cyt b was general time reversible with proportion of invariable sites (GTR + I). An overall haplotype diversity of cyt b was high, while nucleotide diversity low (Hd = 0.985; π = 0.006), which can indicate a recent population expansion. This was also suggested by negative values of neutrality tests (see Table 2). On the other hand, for nuclear gene S7, values of haplotype and nucleotide diversity were markedly lower (Hd = 0.212; π = 0.0004). Diversity measures calculated per each locality are listed in Table S2. The Bayesian skyline plot showed a constant population size in the past, followed by a gradual population expansion and a stable population in the present (Figure 2b).
In G. cruentatus, cyt b haplotype network reconstruction did not reveal any well-defined spatial structure (Figure 3b). The network consisted mostly of unique haplotypes, very diverse for each locality (Figure S1b). Three haplotypes were shared between two or three distant populations (Spain/Sicily, Sicily/Croatia/Cyprus, Cyprus/Croatia). The network displayed two highly variable haplogroups separated by six mutational steps. Interestingly, there was a particular geographic pattern: while haplotypes from the central Mediterranean populations (Croatia, Sicily and Montenegro) were in both haplogroups, the haplotypes from the westernmost populations (Portugal, Spain and France) were placed only in one haplogroup, and haplotypes from the easternmost population, Cyprus, occurred only in the other haplogroup. On the contrary, there was nearly no polymorphism in S7. The network was formed by one dominant haplotype which included 69 alleles (out of 78) and was shared among all populations, one less frequent shared haplotype, which included only 7 alleles, and two unique ones. All haplotypes were very similar (Figure 3b). The remaining analyses were performed only on the cyt b dataset due to the low polymorphism in S7.
Similarly to the results of haplotype network, AMOVA performed on the cyt b showed that most of the genetic variance is distributed within the populations, with a ratio of approximately 1:4 between the variability among and within populations. Computed FST index indicated a high level of genetic differentiation (FST = 0.216, p < 0.01). Some values of pairwise FSTs performed on G. cruentatus indicated a pronounced differentiation (the highest values were between the easternmost population, Cyprus, and three westernmost populations—Spain, Portugal and France), but the majority were low or moderate; however, none of the values was significant (Table 4). The mean p-distances between the populations ranged between 0.3 and 1%, and the range of intrapopulation p-distances was similar (0.2–1.1%) (Table 4). The highest interpopulation divergences were between the westernmost and easternmost populations (0.9–1%, see Table 4). The highest overall intraspecific p-distance for G. cruentatus was 1.52%.
Table 4.
Mean genetic distances between Gobius cruentatus populations for cytochrome b (uncorrected p-distances, in %, above diagonal), intrapopulation distances (on diagonal), and pairwise FSTs (below diagonal). None of the values of FSTs was significant at α = 0.05/number of pairs.
The result of the Mantel test was significant using both approaches (adegenet: observation 0.085, expectation 0.002, p-value 0.03; ARLEQUIN: correlation coefficient 0.81, p-value < 0.01), indicating a possible pattern of isolation by distance (see Figure 4b). According to our results, the most probable scenario of migration of G. cruentatus between the studied localities was also the one allowing divergence and the migration from the ancestral population after the split. The divergence and migration routes are schematically depicted in the Figure 5b, while the estimates of immigration rates, divergence times and population sizes are listed in the Table S3. The results were not unequivocal, as can be seen from the Figure 5b, in several cases models proposing the opposite direction of divergence and migration between two populations had almost the same probability. This might be due to the low number of samples.
4. Discussion
Many previous phylogeographic studies have shown the existence of the geographical structure in populations of zoobiota within the north-eastern Atlantic and Mediterranean (i.e., Northern European Seas, Lusitanian and Mediterranean Sea provinces of Temperate Northern Atlantic realm sensu Spalding et al. [30]), e.g., [7,8,10,11,12]. In this term, however, the European marine gobies, despite being the most speciose and abundant fish family in this area, have been little studied so far.
Our results on two epibenthic goby species (G. geniporus and G. cruentatus) showed that the most plausible model which can explain the genetic structure of populations of both species is a model of divergence and recurrent migration from the ancestral population after the split. In the case of G. geniporus, the direction of divergence and the migration routes match well the prevailing currents between the studied localities (Figure 5a). The main feature of the migration route is anticlockwise circulation from Sicily towards east and then turning westwardly back to Sicily, and making a smaller circle from Sicily to the Adriatic Sea, following the Montenegrin and Croatian coast and subsequently the Italian coast, and back to Sicily. More dense sampling would be useful to confirm these findings, as also smaller gyres can substantially influence the genetic structure of epibenthic fishes [75]. The directions of divergence and migration between the pairs of populations of G. cruentatus were ambiguous. The observed pattern may be an outcome of a low number of individuals used to infer the migration routes in this species. Alternatively, it might be a consequence of higher complexity of water circulation in the species range, and/or biology of this species (see later discussion on hyperbenthic juveniles).
The lifestyle of the two studied species matches the model of divergence and recurrent migration. Being epibenthic and territorial, G. geniporus and G. cruentatus most probably exhibit only short-distance movements in adulthood, which allow the divergence between populations. Their main dispersal route is thus via a transport of planktonic larval stages, which can be dispersed by currents. The distance which a larva can reach depends mainly on the hydrodynamics and on the duration and behaviour of the larval stage, but the dispersal of planktonic larvae is much more complex and still not well understood [76]. The high multiscale variability of topography, temperature and salinity in the Mediterranean Sea generates free and boundary currents, bifurcating jets, meander and ring vortices, permanent or temporary cyclonic and anticyclonic gyres and eddies [77]. Recently, computer simulations that integrate a high number of biological and marine physical information have been successfully used in several works focused on the role of marine currents on the dispersion and genetic structure of marine organisms [75,78,79,80].
The influence of currents on genetic structure of the populations of epibenthic marine fish species was found for Tripterygion tripteronotum [75], where the population structure matched well the gyres in the Adriatic Sea, and also for other marine organisms [78,79,80,81,82].
Where known, the planktonic life stages in different European goby species have a variable duration, with a minimum of 13 days in Zosterisessor ophiocephalus to 51 days in Gobius paganellus [83]. However, in many Mediterranean gobies, nothing is known about their larvae, the duration of this stage, nor about their dispersion routes or distances. A similar range of planktonic larval duration (PLD) was observed in other Mediterranean fish species. In epibenthic Mediterranean littoral fish species of the genus Tripterygion, the PLD is estimated to be two to three weeks [84], while blennies (Blenniidae) have a PLD between 22 and 71 days. In species of both these fish groups a population genetic subdivision was observed [75,85,86,87].
The dispersal capability of fish larvae can broadly differ, while it is around 120 km during 80–170 days of PLD in Sebastes melanops [76,88], it is only 100–500 m during 30–50 days in Chaetodon vagabundus [76,89]. This underlines the complexity of the dispersion process of fish larval stages.
Apart from having mobile larval stages, G. cruentatus has hyperbenthic juveniles, swimming in shoals within 1 m above the sea bottom. It is not known which distances this stage can cover and whether the dispersion during this stage has any influence on the gene flow. In the aquarium, this stage lasted two months [90]. It is not known whether other European gobies have hyperbenthic juveniles. Also other biological traits, such as reproduction strategy (European benthic gobies are iteroparous [53]) and timing of spawning, can influence the genetic structure of populations [75].
Our results showed that there was a high diversity of haplotypes of cyt b at each sampled locality. As discussed above, no clear population subdivision was found in two studied species, as it was disturbed by the recurrent migrations between the populations. There was a certain structuring in both species, as two haplogroups are observable in the networks (Figure 3). In G. geniporus, in the most frequent haplotypes of each haplogroup, specimens from different areas dominate: in one, the specimens from the eastern (Cyprus and Greece), while in the other, the specimens from the central Mediterranean Sea (Italy, Montenegro and Croatia). However, haplotypes of specimens from the Sicilian population are prevailing in the haplogroup with the eastern Mediterranean Sea haplotypes. In G. cruentatus, one haplogroup includes all specimens from the western part of the species range, from the Atlantic coast of Spain and Portugal, as well as from the western Mediterranean French coast, while the other haplogroup includes all samples from the eastern Mediterranean Sea (Cyprus). However, the central Mediterranean samples (Sicily, Montenegro and Croatia) are present in both haplogroups. Similar situation, where haplotypes from different haplogroups were found at the same geographic locality, with no clear geographical pattern, was observed also in other fish species in the Mediterranean Sea [91,92]. It was attributed to the secondary contact between the isolated populations which diverged in allopatry and came to a contact again after the removal of the migration barrier [91]. Additionally, our migration scheme for G. cruentatus shows convergence of the routes from the eastern and western Mediterranean Sea and the Adriatic Sea near Sicily, corresponding to the situation in the haplotype network.
Most of the research on population genetic structure of marine gobies from Europe have been conducted on epibenthic species of the genus Pomatoschistus (gobionelline-like gobies [52]), usually inhabiting lagoons and shallow coastal waters with fine substrates. Population genetic differentiation was observed in all four studied Pomatoschistus species [44,45,46,47,48,49,50,93]. Population genetic diversity of species from the gobiine-like gobies [52] has been studied in only two European marine species [51], epibenthic goby G. niger, living on the muddy substrates, and Aphia minuta, a pelagic shoal species. Giovannotti et al. [51] found a spatial genetic structure in epibenthic G. niger, while no structure in the pelagic A. minuta.
There are several recognised biogeographic breaks in the Mediterranean Sea and the north-eastern Atlantic Ocean. Our data did not point to the existence of any biogeographic boundary preventing a gene flow between the studied populations for neither of the two species. However, the effect of a small sample size cannot be excluded. The Strait of Gibraltar, or rather the Almeria-Oran front, which is an important biogeographic barrier for some marine organisms [4,8,10,33,94], did not have any influence on the gene flow between Atlantic and western Mediterranean populations of G. cruentatus. Similarly, this break does not present a barrier to gene flow of the various fish species, neither pelagic, e.g., Sardina pilchardus (nDNA microsatellite loci) [95], Thunnus thynnus (mtDNA d-loop) [34], Scomber colias (mtDNA d-loop) [31], Diplodus sargus (mtDNA d-loop, nDNA S7 first intron) [96], nor benthic ones, ranging from widespread eurybathic Lophius piscatorius (mtDNA d-loop), able to reach depths down to 500 m [33] to Parablennius sanguinolentus (mtDNA d-loop, nDNA S7 first intron), which is restricted to very shallow littoral of 0–1 m depth [86,87]. Neither did the Sicily Channel influence the genetic structure of the two studied goby species, unlike is the case of some other fish species, e.g., Dicentrarchus labrax (nDNA microsatellite loci) [97], Sprattus sprattus (mtDNA d-loop) [11], and P. tortonesei (mtDNA 16S, COI) [48], where the Sicily Channel presents an important breakpoint. Although many studies showed a genetic differentiation between populations of the biota of the Adriatic and the Mediterranean Seas, separated by the Otranto strait, e.g., in P. minutus (mtDNA d-loop, cyt b, allozymes) [44,45,46,50], Platichthys flesus (allozymes) [98], Gouania willdenowi (mtDNA COI and 9 nDNA markers) [99] and Sparus aurata (allozymes) [100], neither was the Otranto Strait a biogeographic barrier for G. cruentatus and G. geniporus.
5. Conclusions
Our data revealed that the population genetic structure of the two studied epibenthic goby species (G. geniporus and G. cruentatus) can be well explained by the model of migration, allowing divergence between each pair of populations, with the ongoing migration from the ancestral population. This corresponds well with the biology of these gobies, having poorly mobile adults on one hand, and planktonic larval stages, which can be dispersed by currents, on the other hand. The population genetic structure of G. geniporus is influenced by currents: the estimated migration routes between the studied populations follow the main current directions in the study area.
Supplementary Materials
The following are available online at https://www.mdpi.com/2077-1312/8/10/792/s1, Figure S1: List of pairs of populations modelled in Migrate-n, Table S2: Diversity measures for Gobius geniporus and G. cruentatus calculated per each locality based on cytochrome b and S7 sequences, Table S3: Posterior distribution table of Migrate-n analyses, Figure S1: Cytochrome b haplotype frequencies at each locality, Gobius geniporus (a), G. cruentatus (b).
Author Contributions
Conceptualization, J.V. and R.Š.; methodology, K.Č., J.V., K.E., R.Š.; software, K.Č., K.E., J.V.; validation, J.V., A.M.P.; formal analysis, K.Č., J.V., K.E.; investigation, K.Č., J.V., R.Š., T.S.; resources, J.V., R.Š., M.K., S.Z., A.M.P.; data curation, K.Č.; writing—original draft preparation, K.Č.; writing—review and editing, J.V., R.Š., M.K., K.E., S.Z., A.M.P., T.S.; visualization, K.Č., J.V.; supervision, J.V.; project administration, J.V.; funding acquisition, J.V., R.Š., T.S., K.Č. All authors have read and agreed to the published version of the manuscript.
Funding
This research was funded by the Grant Agency of the Charles University (GAUK), grant number 1192217. Stay of K.Č. at the University of Catania was supported by Erasmus program. RŠ received support by the Ministry of Culture of the Czech Republic (DKRVO 2019–2023/6.III.b National Museum, 00023272).
Acknowledgments
We are very grateful to two anonymous reviewers for their constructive comments, which helped us to improve our manuscript. We wish to thank David Villegas Rios (Spain), Konstantinos Moustakas and Ioulianos Pantelides (DFMR, Cyprus) and the Dikelas Dive Center (Karystos, Greece) for the help in the field. Sampling in Greece and Cyprus was conducted under permission of the Hellenic Ministry of Environment (through collecting licence to HCMR, no. 220965/2583/22-8-2011) and the Cyprus Ministry of Agriculture, Rural Development and Environment, through the Department of Fisheries and Marine Research (no. IΠ2921ΙΠ/10-11-2017) respectively. Collection of a part of the material was supported by the EU FP7 project ASSEMBLE at CCMar/Centre of Marine Sciences of Algarve, Faro, Portugal, and Observatoire oceanologique de Banyuls/Mer, Laboratoire Arago, Banyuls/Mer.
Conflicts of Interest
The authors declare no conflict of interest.
References
- Pascual, M.; Rives, B.; Schunter, C.; Macpherson, E. Impact of life history traits on gene flow: A multispecies systematic review across oceanographic barriers in the Mediterranean Sea. PLoS ONE 2017, 12, e0176419. [Google Scholar] [CrossRef] [PubMed]
- Coyer, J.A.; Diekmann, O.E.; Serrão, E.A.; Procaccini, G.; Milchakova, N.; Pearson, G.A.; Stam, W.T.; Olsen, J.L. Population genetics of dwarf eelgrass Zostera noltii throughout its biogeographic range. Mar. Ecol. Prog. Ser. 2004, 281, 51–62. [Google Scholar] [CrossRef]
- Riesgo, A.; Taboada, S.; Pérez-Portela, R.; Melis, P.; Xavier, J.R.; Blasco, G.; López-Legentil, S. Genetic diversity, connectivity and gene flow along the distribution of the emblematic Atlanto-Mediterranean sponge Petrosia ficiformis (Haplosclerida, Demospongiae). BMC Evol. Biol. 2019, 19, 24. [Google Scholar] [CrossRef] [PubMed]
- Sá-Pinto, A.; Branco, M.S.; Alexandrino, P.B.; Fontaine, M.C.; Baird, S.J.E. Barriers to gene flow in the marine environment: Insights from two common intertidal limpet species of the Atlantic and Mediterranean. PLoS ONE 2012, 7, e50330. [Google Scholar] [CrossRef]
- Borrero-Pérez, G.H.; González-Wangüemert, M.; Marcos, C.; Pérez-Ruzafa, A. Phylogeography of the Atlanto-Mediterranean sea cucumber Holothuria (Holothuria) mammata: The combined effects of historical processes and current oceanographical pattern. Mol. Ecol. 2011, 20, 1964–1975. [Google Scholar] [CrossRef]
- Penant, G.; Aurelle, D.; Feral, J.P.; Chenuil, A. Planktonic larvae do not ensure gene flow in the edible sea urchin Paracentrotus lividus. Mar. Ecol. Prog. Ser. 2013, 480, 155–170. [Google Scholar] [CrossRef]
- Palero, F.; Abelló, P.; Macpherson, E.; Gristina, M.; Pascual, M. Phylogeography of the European spiny lobster (Palinurus elephas): Influence of current oceanographical features and historical processes. Mol. Phylogenet. Evol. 2008, 48, 708–717. [Google Scholar] [CrossRef]
- Reuschel, S.; Cuesta, J.A.; Schubart, C.D. Marine biogeographic boundaries and human introduction along the European coast revealed by phylogeography of the prawn Palaemon elegans. Mol. Phylogenet. Evol. 2010, 55, 765–775. [Google Scholar] [CrossRef]
- Liu, H.; Li, S.; Ugolini, A.; Momtazi, F.; Hou, Z. Tethyan closure drove tropical marine biodiversity: Vicariant diversification of intertidal crustaceans. J. Biogeogr. 2018, 45, 941–951. [Google Scholar] [CrossRef]
- Cimmaruta, R.; Bondanelli, P.; Nascetti, G. Genetic structure and environmental heterogeneity in the European hake (Merluccius merluccius). Mol. Ecol. 2005, 14, 2577–2591. [Google Scholar] [CrossRef]
- Debes, P.V.; Zachos, F.E.; Hanel, R. Mitochondrial phylogeography of the European sprat (Sprattus sprattus L., Clupeidae) reveals isolated climatically vulnerable populations in the Mediterranean Sea and range expansion in the northeast Atlantic. Mol. Ecol. 2008, 17, 3873–3888. [Google Scholar] [CrossRef] [PubMed]
- Magoulas, A.; Castilho, R.; Caetano, S.; Marcato, S.; Patarnello, T. Mitochondrial DNA reveals a mosaic pattern of phylogeographical structure in Atlantic and Mediterranean populations of anchovy (Engraulis encrasicolus). Mol. Phylogenet. Evol. 2006, 39, 734–746. [Google Scholar] [CrossRef] [PubMed]
- Patarnello, T.; Volckaert, F.A.M.J.; Castilho, R. Pillars of Hercules: Is the Atlantic-Mediterranean transition a phylogeographical break? Mol. Ecol. 2007, 16, 4426–4444. [Google Scholar] [CrossRef] [PubMed]
- Palumbi, S.R. Genetic divergence, reproductive isolation, and marine speciation. Annu. Rev. Ecol. Syst. 1994, 25, 547–572. [Google Scholar] [CrossRef]
- Palumbi, S.R. Marine reserves and ocean neighborhoods: The spatial scale of marine populations and their management. Annu. Rev. Environ. Resour. 2004, 29, 31–68. [Google Scholar] [CrossRef]
- Thiede, J. A Glacial Mediterranean. Nature 1978, 276, 680–683. [Google Scholar] [CrossRef]
- Roveri, M.; Flecker, R.; Krijgsman, W.; Lofi, J.; Lugli, S.; Manzi, V.; Sierro, F.J.; Bertini, A.; Camerlenghi, A.; De Lange, G.; et al. The Messinian Salinity Crisis: Past and future of a great challenge for marine sciences. Mar. Geol. 2014, 352, 25–58. [Google Scholar] [CrossRef]
- Hsü, K.J.; Ryan, W.B.F.; Cita, M.B. Late miocene desiccation of the Mediterranean. Nature 1973, 242, 240–244. [Google Scholar] [CrossRef]
- Hsü, K.J.; Montadert, L.; Bernoulli, D.; Cita, M.B.; Erickson, A.; Garrison, R.E.; Kidd, R.B.; Mèlierés, F.; Müller, C.; Wright, R. History of the Mediterranean salinity crisis. Nature 1977, 267, 1053–1078. [Google Scholar] [CrossRef]
- Garcia-Castellanos, D.; Villaseñor, A. Messinian salinity crisis regulated by competing tectonics and erosion at the Gibraltar arc. Nature 2011, 480, 359–363. [Google Scholar] [CrossRef]
- Carnevale, G.; Longinelli, A.; Caputo, D.; Barbieri, M.; Landini, W. Did the Mediterranean marine reflooding precede the Mio-Pliocene boundary? Paleontological and geochemical evidence from upper Messinian sequences of Tuscany, Italy. Palaeogeogr. Palaeoclimatol. Palaeoecol. 2008, 257, 81–105. [Google Scholar] [CrossRef]
- Domingues, V.S.; Bucciarelli, G.; Almada, V.C.; Bernardi, G. Historical colonization and demography of the Mediterranean damselfish, Chromis chromis. Mol. Ecol. 2005, 14, 4051–4063. [Google Scholar] [CrossRef] [PubMed]
- Carnevale, G.; Landini, W.; Sarti, G. Mare versus Largo-mare: Marine fishes and the Mediterranean environment at the end of the Messinian Salinity Crisis. J. Geol. Soc. London. 2006, 163, 75–80. [Google Scholar] [CrossRef]
- Garcia-Castellanos, D.; Estrada, F.; Jiménez-Munt, I.; Gorini, C.; Fernández, M.; Vergés, J.; De Vicente, R. Catastrophic flood of the Mediterranean after the Messinian salinity crisis. Nature 2009, 462, 778–781. [Google Scholar] [CrossRef] [PubMed]
- Wilson, A.B.; Veraguth, I.E. The impact of Pleistocene glaciation across the range of a widespread European coastal species. Mol. Ecol. 2010, 19, 4535–4553. [Google Scholar] [CrossRef] [PubMed]
- Rohling, E.J.; Grant, K.; Bolshaw, M.; Roberts, A.P.; Siddall, M.; Hemleben, C.; Kucera, M. Antarctic temperature and global sea level closely coupled over the past five glacial cycles. Nat. Geosci. 2009, 2, 500–504. [Google Scholar] [CrossRef]
- Fleming, K.; Johnston, P.; Zwartz, D.; Yokoyama, Y.; Lambeck, K.; Chappell, J. Refining the eustatic sea-level curve since the Last Glacial Maximum using far- and intermediate-field sites. Earth Planet. Sci. Lett. 1998, 163, 327–342. [Google Scholar] [CrossRef]
- Essallami, L.; Sicre, M.A.; Kallel, N.; Labeyrie, L.; Siani, G. Hydrological changes in the Mediterranean Sea over the last 30,000 years. Geochem. Geophys. Geosyst. 2007, 8. [Google Scholar] [CrossRef]
- Almada, V.C.; Oliveira, R.F.; Goncalves, E.J.; Almeida, J.; Santos, R.S.; Wirtz, P. Patterns of diversity of the north-eastern Atlantic blenniid fish fauna (Pisces: Blenniidae). Glob. Ecol. Biogeogr. 2001, 10, 411–422. [Google Scholar] [CrossRef]
- Spalding, M.D.; Fox, H.E.; Allen, G.R.; Davidson, N.; Ferdaña, Z.A.; Finlayson, M.; Halpern, B.S.; Jorge, M.A.; Lombana, A.; Lourie, S.A.; et al. Marine ecoregions of the world: A bioregionalization of coastal and shelf areas. Bioscience 2007, 57, 573–583. [Google Scholar] [CrossRef]
- Zardoya, R.; Castilho, R.; Grande, C.; Favre-Krey, L.; Caetano, S.; Marcato, S.; Krey, G.; Patarnello, T. Differential population structuring of two closely related fish species, the mackerel (Scomber scombrus) and the chub mackerel (Scomber japonicus), in the Mediterranean Sea. Mol. Ecol. 2004, 13, 1785–1798. [Google Scholar] [CrossRef] [PubMed]
- Bargelloni, L.; Alarcon, J.A.; Alvarez, M.C.; Penzo, E.; Magoulas, A.; Palma, J.; Patarnello, T. The Atlantic-Mediterranean transition: Discordant genetic patterns in two seabream species, Diplodus puntazzo (Cetti) and Diplodus sargus (L.). Mol. Phylogenet. Evol. 2005, 36, 523–535. [Google Scholar] [CrossRef] [PubMed]
- Charrier, G.; Chenel, T.; Durand, J.D.; Girard, M.; Quiniou, L.; Laroche, J. Discrepancies in phylogeographical patterns of two European anglerfishes (Lophius budegassa and Lophius piscatorius). Mol. Phylogenet. Evol. 2006, 38, 742–754. [Google Scholar] [CrossRef] [PubMed]
- Alvarado Bremer, J.R.; Viñas, J.; Mejuto, J.; Ely, B.; Pla, C. Comparative phylogeography of Atlantic bluefin tuna and swordfish: The combined effects of vicariance, secondary contact, introgression, and population expansion on the regional phylogenies of two highly migratory pelagic fishes. Mol. Phylogenet. Evol. 2005, 36, 169–187. [Google Scholar] [CrossRef] [PubMed]
- Fricke, R.; Eschmeyer, W.N.; Fong, J.D. Eschemeyer’s Catalog of Fishes. Available online: https://www.researchgate.net/project/Eschmeyers-Catalog-of-Fishes-online (accessed on 12 October 2020).
- Kovačić, M.; Ordines, F.; Schliewen, U.K. A new species of Buenia (Perciformes: Gobiidae) from the Western Mediterranean slope bottoms, the redescription of Buenia jeffreysi and the first Balearic record of Buenia affinis. Zootaxa 2018, 4392, 267–288. [Google Scholar] [CrossRef] [PubMed]
- Kovačić, M.; Ordines, F.; Ramirez-Amaro, S.; Schliewen, U.K. Gymnesigobius medits (Teleostei: Gobiidae), a new gobiid genus and species from the western Mediterranean slope bottoms. Zootaxa 2019, 4651, 513–530. [Google Scholar] [CrossRef] [PubMed]
- Patzner, R.A.; Van Tassell, J.L.; Kovačić, M.; Kapoor, B.G. The Biology of Gobies; Science Publishers: New York, NY, USA; CRC Press: New York, NY, USA; Taylor & Francis Group: New York, NY, USA, 2011; ISBN 9781578084364. [Google Scholar]
- Kovačić, M.; Šanda, R. A new species of Gobius (Perciformes: Gobiidae) from the Mediterranean Sea and the redescription of Gobius bucchichi. J. Fish Biol. 2016, 88, 1104–1124. [Google Scholar] [CrossRef]
- Engin, S.; Seyhan, D. A new species of Pomatoschistus (Teleostei, Gobiidae): The Mediterranean’s smallest marine fish. J. Fish Biol. 2017, 91, 1208–1223. [Google Scholar] [CrossRef]
- Kovačić, M.; Šanda, R.; Kirinčić, M.; Zanella, D. Geographic distribution of gobies (Gobiidae) in the Adriatic Sea with thirteen new records for its southern part. Cybium 2012, 36, 435–445. [Google Scholar]
- Engin, S.; Irmak, E.; Seyhan, D.; Akdemir, T.; Keskin, A.C. Gobiid fishes of the coastal zone of the Northeastern Aegean Sea. Mar. Biodivers. 2018, 48, 1073–1084. [Google Scholar] [CrossRef]
- Kovačić, M.; Schembri, P.J. Twelve new records of gobies and clingfishes (Pisces: Teleostei) significantly increase small benthic fish diversity of Maltese waters. Mediterr. Mar. Sci. 2019, 20, 287–296. [Google Scholar] [CrossRef]
- Stefanni, S.; Gysels, E.S.; Volckaert, F.A.M.; Miller, P.J. Allozyme variation and genetic divergence in the sand goby, Pomatoschistus minutus (Teleostei: Gobiidae). J. Mar. Biol. Assoc. UK 2003, 83, 1143–1149. [Google Scholar] [CrossRef]
- Stefanni, S.; Thorley, J.L. Mitochondrial DNA phylogeography reveals the existence of an Evolutionarily Significant Unit of the sand goby Pomatoschistus minutus in the Adriatic (Eastern Mediterranean). Mol. Phylogenet. Evol. 2003, 28, 601–609. [Google Scholar] [CrossRef]
- Gysels, E.S.; Hellemans, B.; Patarnello, T.; Volckaert, F.A.M. Current and historic gene flow of the sand goby Pomatoschitus minutus on the European Continental Shelf and in the Mediterranean Sea. Biol. J. Linn. Soc. 2004, 83, 561–576. [Google Scholar] [CrossRef][Green Version]
- Gysels, E.S.; Hellemans, B.; Pampoulie, C.; Volckaert, F.A.M. Phylogeography of the common goby, Pomatoschistus microps, with particular emphasis on the colonization of the Mediterranean and the North Sea. Mol. Ecol. 2004, 13, 403–417. [Google Scholar] [CrossRef] [PubMed]
- Mejri, R.; Lo Brutto, S.; Hassine, O.K.B.; Arculeo, M. A study on Pomatoschistus tortonesei Miller 1968 (Perciformes, Gobiidae) reveals the Siculo-Tunisian Strait (STS) as a breakpoint to gene flow in the Mediterranean basin. Mol. Phylogenet. Evol. 2009, 53, 596–601. [Google Scholar] [CrossRef] [PubMed]
- Mejri, R.; Arculeo, M.; Ben Hassine, O.K.; Lo Brutto, S. Genetic architecture of the marbled goby Pomatoschistus marmoratus (Perciformes, Gobiidae) in the Mediterranean Sea. Mol. Phylogenet. Evol. 2011, 58, 395–403. [Google Scholar] [CrossRef]
- Boissin, E.; Hoareau, T.B.; Berrebi, P. Effects of current and historic habitat fragmentation on the genetic structure of the sand goby Pomatoschistus minutus (Osteichthys, Gobiidae). Biol. J. Linn. Soc. 2011, 102, 175–198. [Google Scholar] [CrossRef]
- Giovannotti, M.; La Mesa, M.; Caputo, V. Life style and genetic variation in teleosts: The case of pelagic (Aphia minuta) and benthic (Gobius niger) gobies (Perciformes: Gobiidae). Mar. Biol. 2009, 156, 239–252. [Google Scholar] [CrossRef]
- Agorreta, A.; San Mauro, D.; Schliewen, U.; Van Tassell, J.L.; Kovačić, M.; Zardoya, R.; Rüber, L. Molecular phylogenetics of Gobioidei and phylogenetic placement of European gobies. Mol. Phylogenet. Evol. 2013, 69, 619–633. [Google Scholar] [CrossRef]
- Miller, P.J. Fishes of the North-eastern Atlantic and the Mediterranean. In Gobiidae; Whitehead, P.J.P., Bauchot, M.-L., Hureau, J.-C., Nielsen, J., Tortonese, E., Eds.; Unesco: Paris, France, 1986; pp. 1019–1085. ISBN 92-3-002309-4. [Google Scholar]
- Engin, S.; Turan, D.; Kovačić, M. First record of the red-mouthed goby, Gobius cruentatus (Gobiidae), in the Black Sea. Cybium 2007, 31, 87–88. [Google Scholar]
- Wilkins, H.K.A.; Myers, A.A. Shelter utilization by Gobius cruentatus and Thorogobius ephippiatus (Teleostei: Gobiidae). J. Fish Biol. 1993, 43, 763–773. [Google Scholar] [CrossRef]
- Kovačić, M.; Golani, D. First record of three gobiid species in the Levant. Cybium 2007, 31, 89–91. [Google Scholar]
- Kovačić, M.; Miletić, M.; Papageorgiou, N. A first checklist of gobies from Crete with ten new records. Cybium 2011, 35, 245–253. [Google Scholar]
- Machordom, A.; Doadrio, I. Evidence of a cenozoic Betic-Kabilian connection based on freshwater fish phylogeography (Luciobarbus, Cyprinidae). Mol. Phylogenet. Evol. 2001, 18, 252–263. [Google Scholar] [CrossRef] [PubMed]
- Chow, S.; Hazama, K. Universal PCR primers for S7 ribosomal protein gene introns in fish. Mol. Ecol. 1998, 7, 1255–1256. [Google Scholar] [PubMed]
- Šanda, R.; Vukić, J.; Choleva, L.; Křížek, J.; Šedivá, A.; Shumka, S.; Wilson, I.F. Distribution of loach fishes (Cobitidae, Nemacheilidae) in Albania, with genetic analysis of populations of Cobitis ohridana. Folia Zool. 2008, 57, 42–50. [Google Scholar]
- Hall, T.A. BioEdit: A user-friendly biological sequence alignment editor and analysis program for Windows 95/98/NT. Nucleic Acids Symp. Ser. 1999, 41, 95–98. [Google Scholar]
- Darriba, D.; Taboada, G.L.; Doallo, R.; Posada, D. jModelTest 2: More models, new heuristics and high-performance computing. Nat. Methods 2015, 9, 6–9. [Google Scholar]
- Nei, M.; Kumar, S. Molecular Evolution and Phylogenetics; Oxford University Press: Oxford, UK, 2000. [Google Scholar]
- Rozas, J.; Ferrer-Mata, A.; Sánchez-DelBarrio, J.C.; Guirao-Rico, S.; Librado, P.; Ramos-Onsins, S.E.; Sánchez-Gracia, A. DnaSP 6: DNA sequence polymorphism analysis of large data sets. Mol. Biol. Evol. 2017, 34, 3299–3302. [Google Scholar] [CrossRef]
- Excoffier, L.; Lischer, H.E.L. Arlequin suite ver 3.5: A new series of programs to perform population genetics analyses under Linux and Windows. Mol. Ecol. Resour. 2010, 10, 564–567. [Google Scholar] [CrossRef] [PubMed]
- Tamura, K.; Stecher, G.; Peterson, D.; Filipski, A.; Kumar, S. MEGA6: Molecular evolutionary genetics analysis version 6.0. Mol. Biol. Evol. 2013, 30, 2725–2729. [Google Scholar] [CrossRef] [PubMed]
- Stephens, M.; Smith, N.J.; Donnelly, P. A new statistical method for haplotype reconstruction from population data. Am. J. Hum. Genet. 2001, 68, 978–989. [Google Scholar] [CrossRef] [PubMed]
- Clement, M.; Snell, Q.; Walker, P.; Posada, D.; Crandall, K. TCS: Estimating gene genealogies. In Proceedings of the 16th International Parallel and Distributed Processing Symposium (IPDPS 2002), Fort Lauderdale, FL, USA, 15–19 April 2002; Volume 2, p. 0184. [Google Scholar]
- Leigh, J.W.; Bryant, D. POPART: Full-feature software for haplotype network construction. Methods Ecol. Evol. 2015, 6, 1110–1116. [Google Scholar] [CrossRef]
- Mantel, N. The detection of disease clustering and a generalized regression approach. Cancer Res. 1967, 27, 209–220. [Google Scholar] [PubMed]
- Beerli, P.; Felsenstein, J. Maximum likelihood estimation of a migration matrix and effective population sizes in n subpopulations by using a coalescent approach. Proc. Natl. Acad. Sci. USA 2001, 98, 4563–4568. [Google Scholar] [CrossRef]
- Drummond, A.J.; Rambaut, A.; Shapiro, B.; Pybus, O.G. Bayesian coalescent inference of past population dynamics from molecular sequences. Mol. Biol. Evol. 2005, 22, 1185–1192. [Google Scholar] [CrossRef]
- Drummond, A.J.; Suchard, M.A.; Xie, D.; Rambaut, A. Bayesian phylogenetics with BEAUti and the BEAST 1.7. Mol. Biol. Evol. 2012, 29, 1969–1973. [Google Scholar] [CrossRef]
- Rambaut, A.; Drummond, A.J.; Xie, D.; Baele, G.; Suchard, M.A. Posterior summarisation in Bayesian phylogenetics using Tracer 1.7. Syst. Biol. 2018, 67, 901–904. [Google Scholar] [CrossRef]
- Sefc, K.M.; Wagner, M.; Zangl, L.; Weiß, S.; Steinwender, B.; Arminger, P.; Weinmaier, T.; Balkic, N.; Kohler, T.; Inthal, S.; et al. Phylogeographic structure and population connectivity of a small benthic fish (Tripterygion tripteronotum) in the Adriatic Sea. J. Biogeogr. 2020. [Google Scholar] [CrossRef]
- Shanks, A.L. Pelagic larval duration and dispersal distance revisited. Biol. Bull. 2009, 216, 373–385. [Google Scholar] [CrossRef] [PubMed]
- Robinson, R.A.; Leslie, W.G.; Theocharis, A. Mediterranean Sea Circulation. In Encyclopedia of Ocean Sciences, 1st ed.; Steele, J.H., Thorpe, S.A., Turekian, K.K., Eds.; Academic Press: San Diego, USA, 2001; pp. 1689–1705. [Google Scholar]
- Serra, I.A.; Innocenti, A.M.; Di Maida, G.; Calvo, S.; Migliaccio, M.; Zambianchi, E.; Pizzigalli, C.; Arnaud-Haond, S.; Duarte, C.M.; Serrao, E.A.; et al. Genetic structure in the Mediterranean seagrass Posidonia oceanica: Disentangling past vicariance events from contemporary patterns of gene flow. Mol. Ecol. 2010, 19, 557–568. [Google Scholar] [CrossRef] [PubMed]
- Thomas, L.; Jason Kennington, W.; Stat, M.; Wilkinson, S.P.; Kool, J.T.; Kendrick, G.A. Isolation by resistance across a complex coral reef seascape. Proc. R. Soc. B Biol. Sci. 2015, 282, 50–59. [Google Scholar] [CrossRef] [PubMed]
- Munguia-Vega, A.; Marinone, S.G.; Paz-Garcia, D.A.; Giron-Nava, A.; Plomozo-Lugo, T.; Gonzalez-Cuellar, O.; Weaver, A.H.; García-Rodriguez, F.J.; Reyes-Bonilla, H. Anisotropic larval connectivity and metapopulation structure driven by directional oceanic currents in a marine fish targeted by small-scale fisheries. Mar. Biol. 2018, 165, 1–16. [Google Scholar] [CrossRef]
- Banks, S.C.; Piggott, M.P.; Williamson, J.E.; Bové, U.; Holbrook, N.J.; Beheregaray, L.B. Oceanic variability and coastal topography shape genetic structure in a long-dispersing sea urchin. Ecology 2007, 88, 3055–3064. [Google Scholar] [CrossRef] [PubMed]
- Benestan, L.; Quinn, B.K.; Maaroufi, H.; Laporte, M.; Clark, F.K.; Greenwood, S.J.; Rochette, R.; Bernatchez, L. Seascape genomics provides evidence for thermal adaptation and current-mediated population structure in American lobster (Homarus americanus). Mol. Ecol. 2016, 25, 5073–5092. [Google Scholar] [CrossRef]
- Borges, R.; Faria, C.; Gil, F.; Gonçalves, E.J. Early Development of Gobies. In The Biology of Gobies; Patzner, R., Van Tassell, J.L., Kovačić, M., Kapoor, B.G., Eds.; CRC Press: Enfield, NH, USA; Taylor and Francis Group: Enfield, NH, USA; Science Publishers: Enfield, NH, USA, 2006; pp. 401–455. [Google Scholar]
- Raventós, N.; Macpherson, E. Planktonic larval duration and settlement marks on the otoliths of Mediterranean littoral fishes. Mar. Biol. 2001, 138, 1115–1120. [Google Scholar]
- Koblmüller, S.; Steinwender, B.; Weiß, S.; Sefc, K.M. Gene flow, population growth and a novel substitution rate estimate in a subtidal rock specialist, the black-faced blenny Tripterygion delaisi (Perciformes, Blennioidei, Tripterygiidae) from the Adriatic Sea. J. Zool. Syst. Evol. Res. 2015, 53, 291–299. [Google Scholar] [CrossRef]
- Pappalardo, A.M.; Francisco, S.M.; Fruciano, C.; S Lima, C.; Pulvirenti, V.; Tigano, C.; Robalo, J.I.; Ferrito, V. Mitochondrial and nuclear intraspecific variation in the rusty blenny (Parablennius sanguinolentus, Blenniidae). Hydrobiologia 2017, 802, 141–154. [Google Scholar] [CrossRef]
- Domingues, V.S.; Stefanni, S.; Brito, A.; Santos, R.S.; Almada, V.C. Phylogeography and demography of the Blenniid Parablennius parvicornis and its sister species P. sanguinolentus from the northeastern Atlantic Ocean and the western Mediterranean Sea. Mol. Phylogenet. Evol. 2008, 46, 397–402. [Google Scholar] [CrossRef] [PubMed]
- Miller, J.A.; Shanks, A.L. Evidence for limited larval dispersal in black rockfish (Sebastes melanops): Implications for population structure and marine-reserve design. Can. J. Fish. Aquat. Sci. 2004, 61, 1723–1735. [Google Scholar] [CrossRef]
- Almany, G.R.; Berumen, M.L.; Thorrold, S.R.; Planes, S.; Jones, G.P. Local replenishment of coral reef fish populations in a marine reserve. Science 2007, 316, 742–744. [Google Scholar] [CrossRef] [PubMed]
- Kovačić, M. Unusual morphological and ecological characteristics of hyperbenthic juveniles of Gobius cruentatus. J. Fish Biol. 2004, 65, 545–558. [Google Scholar] [CrossRef]
- Šegvić-Bubić, T.; Marrone, F.; Grubišić, L.; Izquierdo-Gomez, D.; Katavić, I.; Arculeo, M.; Lo Brutto, S. Two seas, two lineages: How genetic diversity is structured in Atlantic and Mediterranean greater amberjack Seriola dumerili Risso, 1810 (Perciformes, Carangidae). Fish. Res. 2016, 179, 271–279. [Google Scholar] [CrossRef]
- Viñas, J.; Bremer, J.A.; Pla, C. Phylogeography of the Atlantic bonito (Sarda sarda) in the northern Mediterranean: The combined effects of historical vicariance, population expansion, secondary invasion, and isolation by distance. Mol. Phylogenet. Evol. 2004, 33, 32–42. [Google Scholar] [CrossRef]
- Tougard, C.; Folly, J.; Berrebi, P. New light on the evolutionary history of the common goby (Pomatoschistus microps) with an emphasis on colonization processes in the Mediterranean Sea. PLoS ONE 2014, 9, e91576. [Google Scholar] [CrossRef]
- Durand, J.D.; Blel, H.; Shen, K.N.; Koutrakis, E.T.; Guinand, B. Population genetic structure of Mugil cephalus in the Mediterranean and Black Seas: A single mitochondrial clade and many nuclear barriers. Mar. Ecol. Prog. Ser. 2013, 474, e91576. [Google Scholar] [CrossRef]
- Gonzalez, E.G.; Zardoya, R. Relative role of life-history traits and historical factors in shaping genetic population structure of sardines (Sardina pilchardus). BMC Evol. Biol. 2007, 7, 197. [Google Scholar] [CrossRef]
- Domingues, V.S.; Santos, R.S.; Brito, A.; Alexandrou, M.; Almada, V.C. Mitochondrial and nuclear markers reveal isolation by distance and effects of Pleistocene glaciations in the northeastern Atlantic and Mediterranean populations of the white seabream (Diplodus sargus, L.). J. Exp. Mar. Bio. Ecol. 2007, 346, 102–113. [Google Scholar] [CrossRef]
- Bahri-Sfar, L.; Lemaire, C.; Ben Hassine, O.K.; Bonhomme, F. Fragmentation of sea bass populations in the western and eastern Mediterranean as revealed by microsatellite polymorphism. Proc. R. Soc. London Ser. B, Biol. Sci. 2000, 267, 929–935. [Google Scholar] [CrossRef] [PubMed]
- Borsa, P.; Blanquer, A.; Berrebi, P. Genetic structure of the flounders Platichthys flesus and P. stellatus at different geographic scales. Mar. Biol. 1997, 129, 233–246. [Google Scholar] [CrossRef]
- Wagner, M.; Bračun, S.; Skofitsch, G.; Kovačić, M.; Zogaris, S.; Iglésias, S.P.; Sefc, K.M.; Koblmüller, S. Diversification in gravel beaches: A radiation of interstitial clingfish (Gouania, Gobiesocidae) in the Mediterranean Sea. Mol. Phylogenet. Evol. 2019, 139, 106525. [Google Scholar] [CrossRef] [PubMed]
- Rossi, A.R.; Perrone, E.; Sola, L. Genetic structure of gilthead seabream, Sparus aurata, in the central Mediterranean sea. Cent. Eur. J. Biol. 2006, 1, 636–647. [Google Scholar] [CrossRef]
© 2020 by the authors. Licensee MDPI, Basel, Switzerland. This article is an open access article distributed under the terms and conditions of the Creative Commons Attribution (CC BY) license (http://creativecommons.org/licenses/by/4.0/).