1. Introduction
Planing trimaran is an increasingly widespread typology with a range of commercial and military applications. Unlike other planing craft such as stepped and stern flap, the planing trimaran mainly uses air cushions formed by tunnels to reduce total resistance. The tunnels are made of a central drainage body and two elongated sheets. During forward movement, the hydrodynamic force and aerodynamic lift generated in the tunnel causes the hull to rise, significantly reducing its resistance. The double-tunnel design gives improves hull speeds, stability, and air cushion drag reduction. It is evident that this design has become a research focus in recent years.
Planing trimaran is a type of planing craft that creates complex free-surface flows near the hull during navigation. These flows cause nonlinear phenomena, resulting from insert jets and irregular waves. This makes the hydrodynamic performance evaluation of planing trimaran more complex. In order to predict the hydrodynamic performance of the new planing trimaran model, one or more methods need to be selected for testing.
In recent years, experimental testing, empirical estimation methods, and numerical simulations have been used assess the hydrodynamic performance of new hull types. Yousefi et al. [
1] presented a comparison of several hydrodynamic analysis techniques for the planing hulls. The results indicated that Finite Volume Method (FVM) is capable of solving complex, free-surface flows, and estimate hydrodynamic performance of the hulls with complex geometries. Lotfi et al. [
2] used ANSYS CFX software to predict the steady state two phase flow field around a stepped planing. The k-ε turbulent model is used in this simulation. The results revealed the numerical results are more accuracy and reliable than the Svahn′s empirical method [
3]. Azcueta [
4] presented steady and unsteady free-surface RANSE simulations for the planing craft model. The numerical simulation method is based on the Navier–Stokes solver. Where, a onetime simulation from zero to the maximum speed was carried out greatly improving the hydrodynamic performance analysis efficiency. Panahi et al. [
5] used Numerical Marine Engineering Laboratory Software (NUMELS). Six-degree-of-freedom (6-DOF) rigid body motion equations are solved in the software. The results showed good capabilities in simulation of high-speed complex hydrodynamic problems. De Marco et al. [
6] combined the numerical simulation and experimental methods to analyze the hydrodynamic characteristics of a stepped planing hull at different speeds. The experiments were conducted in towing tank. The numerical simulation method is based on the k-ω SST turbulence model and STAR-CCM+ software. The results showed the global parameters such as total resistance, sinkage and trim angle can be calculated. The details of the water flow phenomenon around the hull and wet surface was also consistent with experimental test. Moreover, Bi Xiaosheng et al. [
7] used similar methods to analyze the hydrodynamic performance of a planing craft with fixed hydrofoil. The results showed that two methods are in good agreement. Yuan and Wang [
8] presented the heaving and rolling motion of the planing craft under different speeds and centers of gravity. The numerical simulation method is based on an N-S equation and STAR-CCM+ software. Ghadimi et al. [
9] carried out experimental methods for three different wedge types of planing craft. Towing tests were conducted in the calm water to study the effects of a wedge on the performance of planing craft. Najafi and Nowruzi [
10], and Kazemi et al. [
11] used an unsteady solver based on FVM in STAR-CCM+ toolbox to investigate hydrodynamic performance of stepped planing hull.
Ghassabzadeh and Ghassemi [
12] developed a new mathematical procedure to generate the hull form of planing tunnel vessels. Ghassabzadeh and Ghassemi [
13,
14] applied a user define function (UDF) code in FLUENT software and the Volume of Fluid (VOF) model is used to consider free surface conditions. This numerical simulation method was accurately evaluated the hydrodynamic performance of the multi-hull tunnel vessel. Chaney and Matveev [
15] presented simulating vertical-plane motions of a tunnel hull. This numerical model is based on the fully unsteady aerodynamic extreme ground effect theory and the hydrodynamic added-mass strip theory. Moghadam et al. [
16] used k-ε model and the volume of fluid two phase model for examining the performance of tunneled planing hull. The tunnel hull is changed from a mono-hull. The results showed that forming a tunnel in the mono-hull could cause a drag reduction in high-speed. Kim et al. [
17] investigated the performances of asymmetric catamaran. The numerical simulation method is based on all Y+ treatment model and STAR-CCM+ software. Najafi et al. [
18] used appropriate artificial neural networks (ANNs) to predicate total resistance, effective power, sinkage and trim of hydrofoil supported catamaran. Moreover, Roshan et al. [
19] presented pressure distribution and stream lines around the tunneled planing hull by STAR-CCM+ software. Two phases of fluid around the hull were defined by using VOF method in conjunction with k-ε turbulence model. The results indicated that tunnel has a good effect on planing hull performance.
Planing trimaran is a variant of tunnel boat. Planing trimarans are characterized by superb high-speed maneuverability and longitudinal stability. Ma Weijia et al. [
20] performed planing trimaran resistance model tests at eight (8) different displacements and center of gravity positions. The results showed that the presence of the tunnel increase aerodynamic lift and obstruct splashing at high-speed motion. Ma Weijia et al. [
21] installed an air jet device and bilge keels in both tunnels of the planing trimaran. It was noted that the bilge keels improve the longitudinal stability while the air jets decreased the trim angle. Jiang Yi et al. [
22] presented five (5) planing trimarans with different height and beam tunnel. The numerical simulation method is based on the k-ω SST turbulence model and VOF model. The results revealed lower tunnel height get the maximum resistance reduction of 6%. In another study, Jiang Yi et al. [
23] investigated planing trimarans of different tunnel lengths by the same numerical method. It was shown that enlarging the straight section length by 0.05 L could bring an average resistance reduction of 6.9% and increase the tunnel lift by 9.1%. Du et al. [
24] used unsteady RANS solver (ANSYS-CFX software) and 6-DOF motion equation to analyze the drag-reducing effect for four (4) planing trimarans with different air intake shape.
From the literature presented above, the influence of tunnel parameters on planing trimaran in terms of hydrodynamic performance was comprehensively described. However, the investigation on the parameters and shape of the central drainage body is relatively few. It is imperative therefore to establish the effect of the central drainage body on the hydrodynamic performance of the planing trimaran. Considering the unique structure of the new planing trimaran and the complex free surface viscous flow around the hull, the experimental test in towing tank and numerical simulation method based on STAR-CCM+ software are adopted for the research.
Kim et al. [
25] presented the hydrodynamic characteristics of a wave-piercing planing craft through numerical simulation. Khoob and Ketabdari [
26] studied wave-induced loads of wave-piercing planing trimarans. However, hydrodynamic performance characteristics for a wave-piercing planing trimaran have not been investigated. In this paper, a planing trimaran model and a modified form with wave-piercing bow are designed. The main purpose of this research is to compare the hydrodynamic performance of different central drainage body shape.
The organization of this paper is as follows.
Section 2 presents the geometric description of planing trimaran and experimental tests in still water are given. The test results of total resistance, sinkage, and trim angle are analyzed.
Section 3 gives a brief introduction of the numerical methods, including governing equations, VOF, computational domain settings, and sensitivity analysis of free surface mesh. Subsequently, the numerical simulation results are compared with the experimental test results, and the streamline and pressure distribution at the bottom of the planing trimaran are analyzed. In
Section 4, a new planing trimaran hull type is obtained by optimizing the profile design of the central drainage body based on the results of the pressure analysis and using the experimental model as the parent model. Through numerical simulation, the hydrodynamic performance of the new hull type is predicted. Comparison with the total resistance, sinkage and trim angle of the original hull is presented.
2. Experimental Tests
2.1. Geometrical Description of Planing Trimaran Model
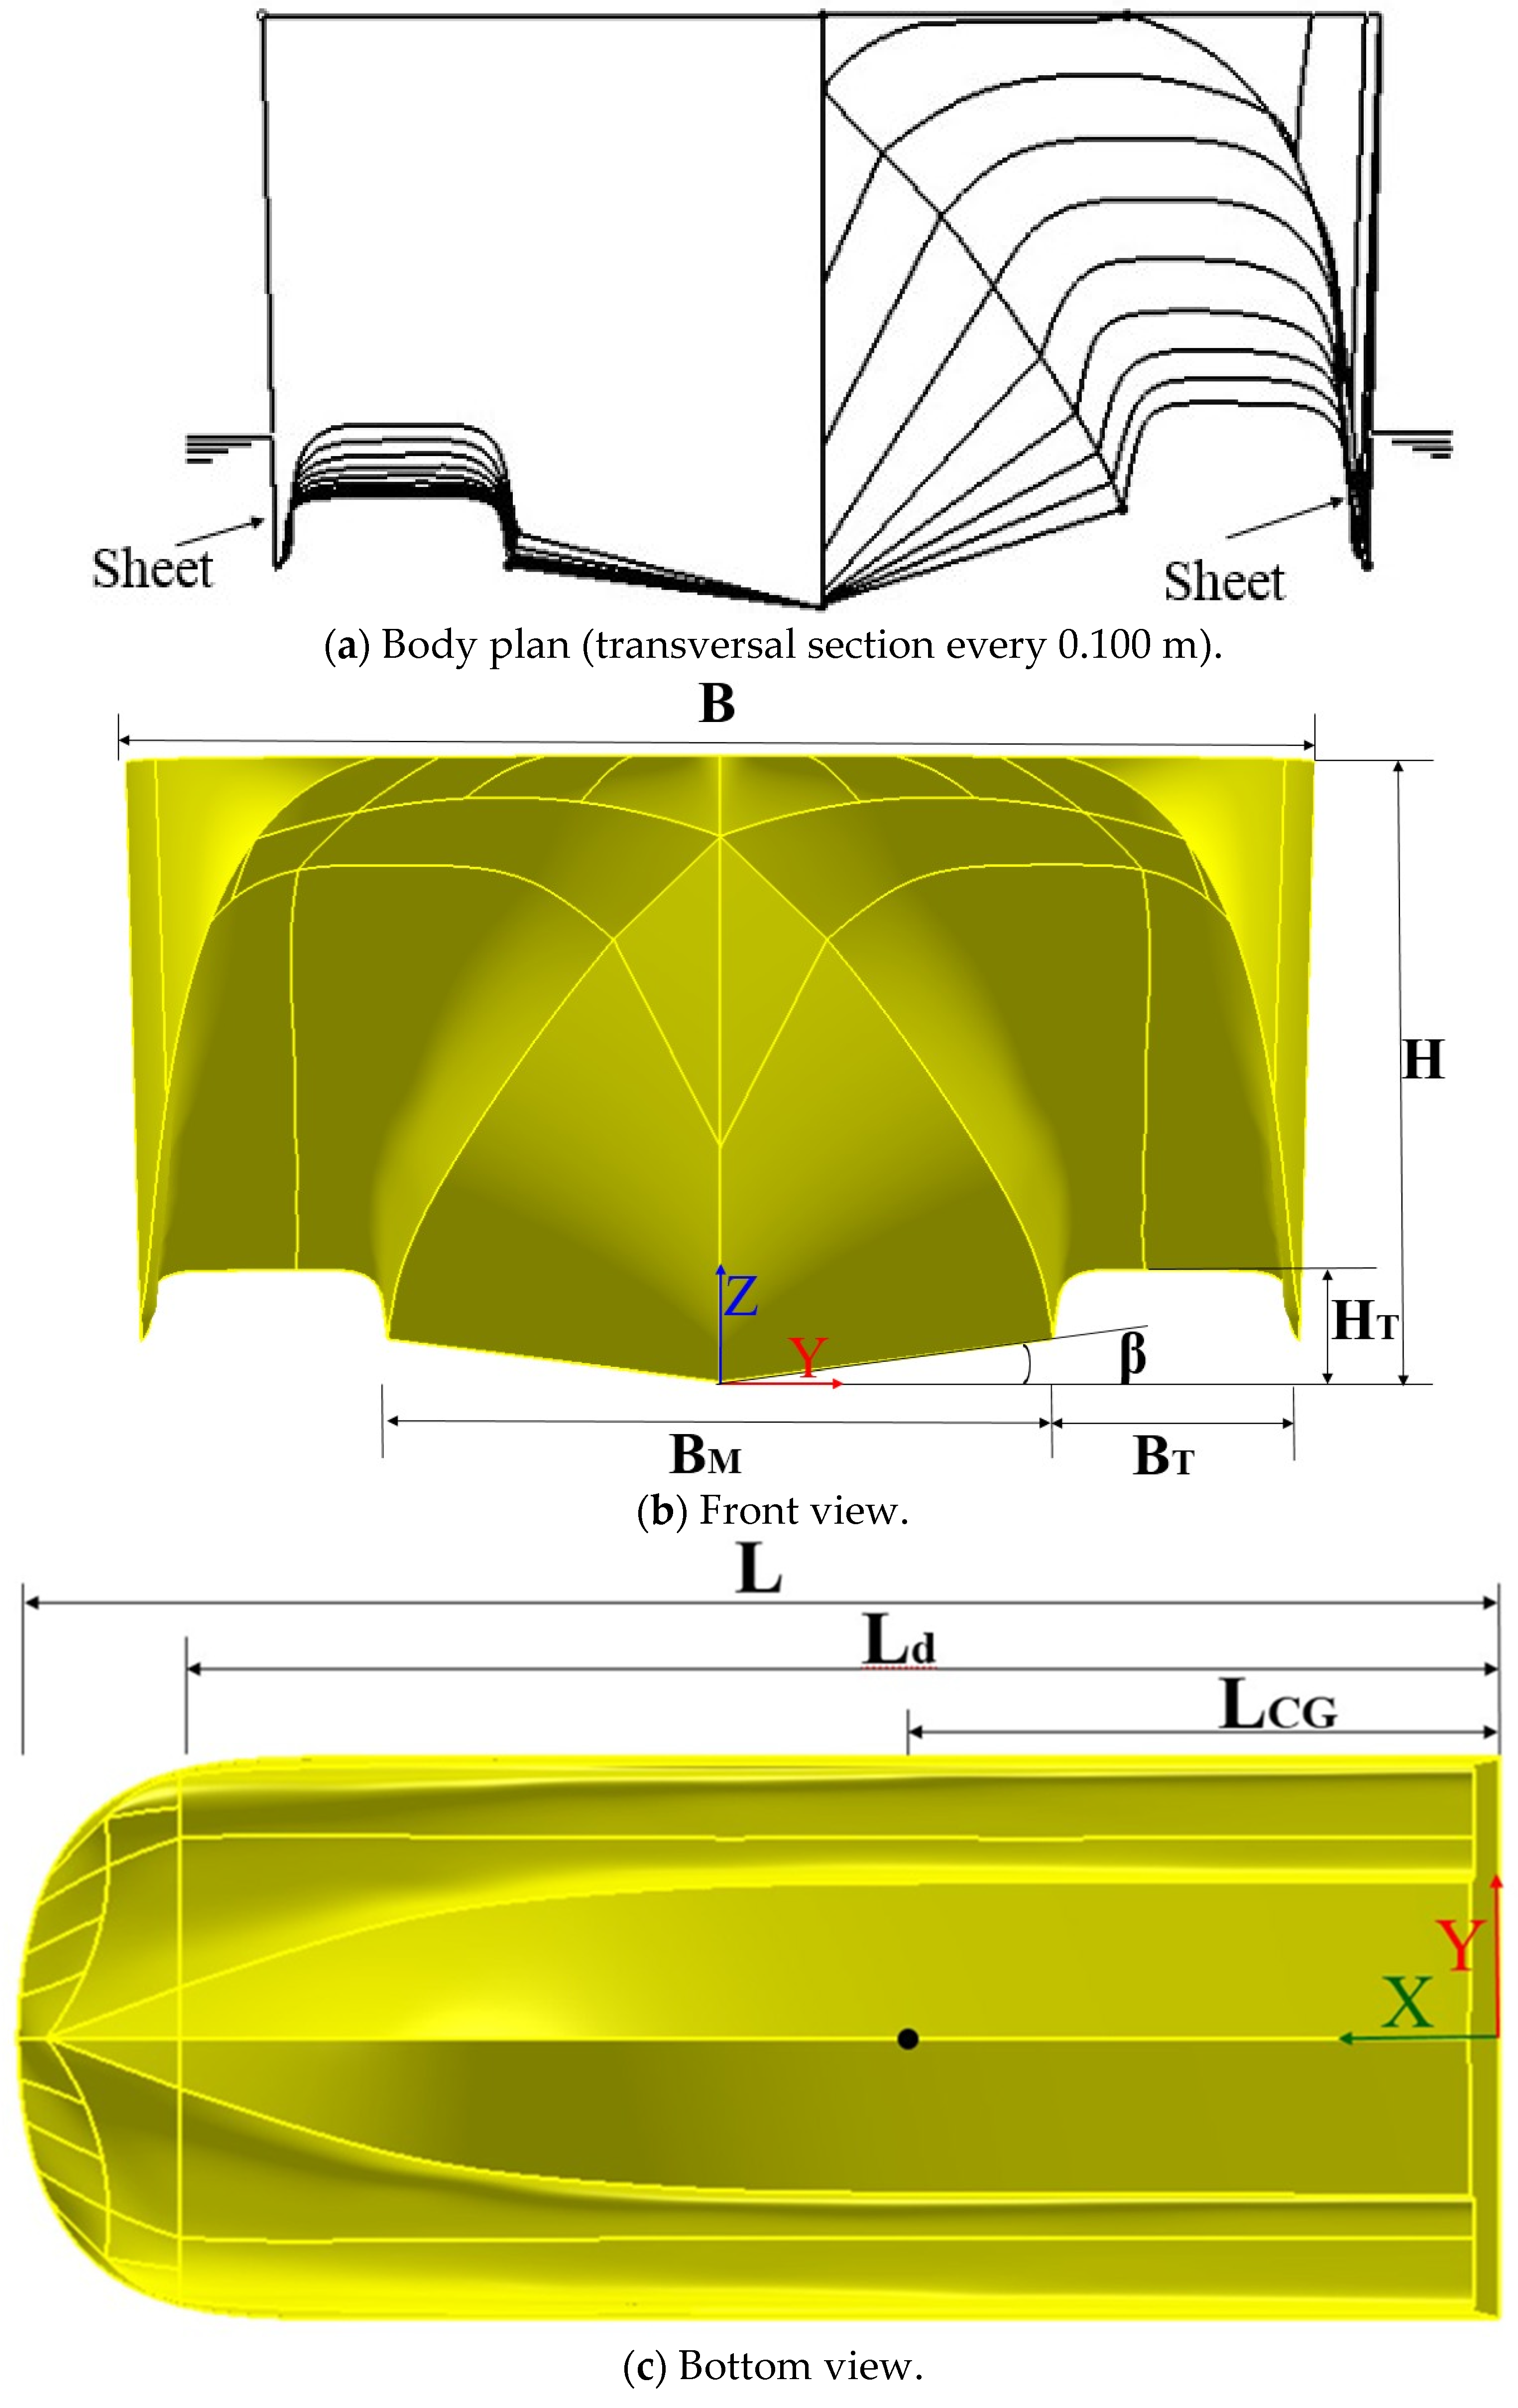
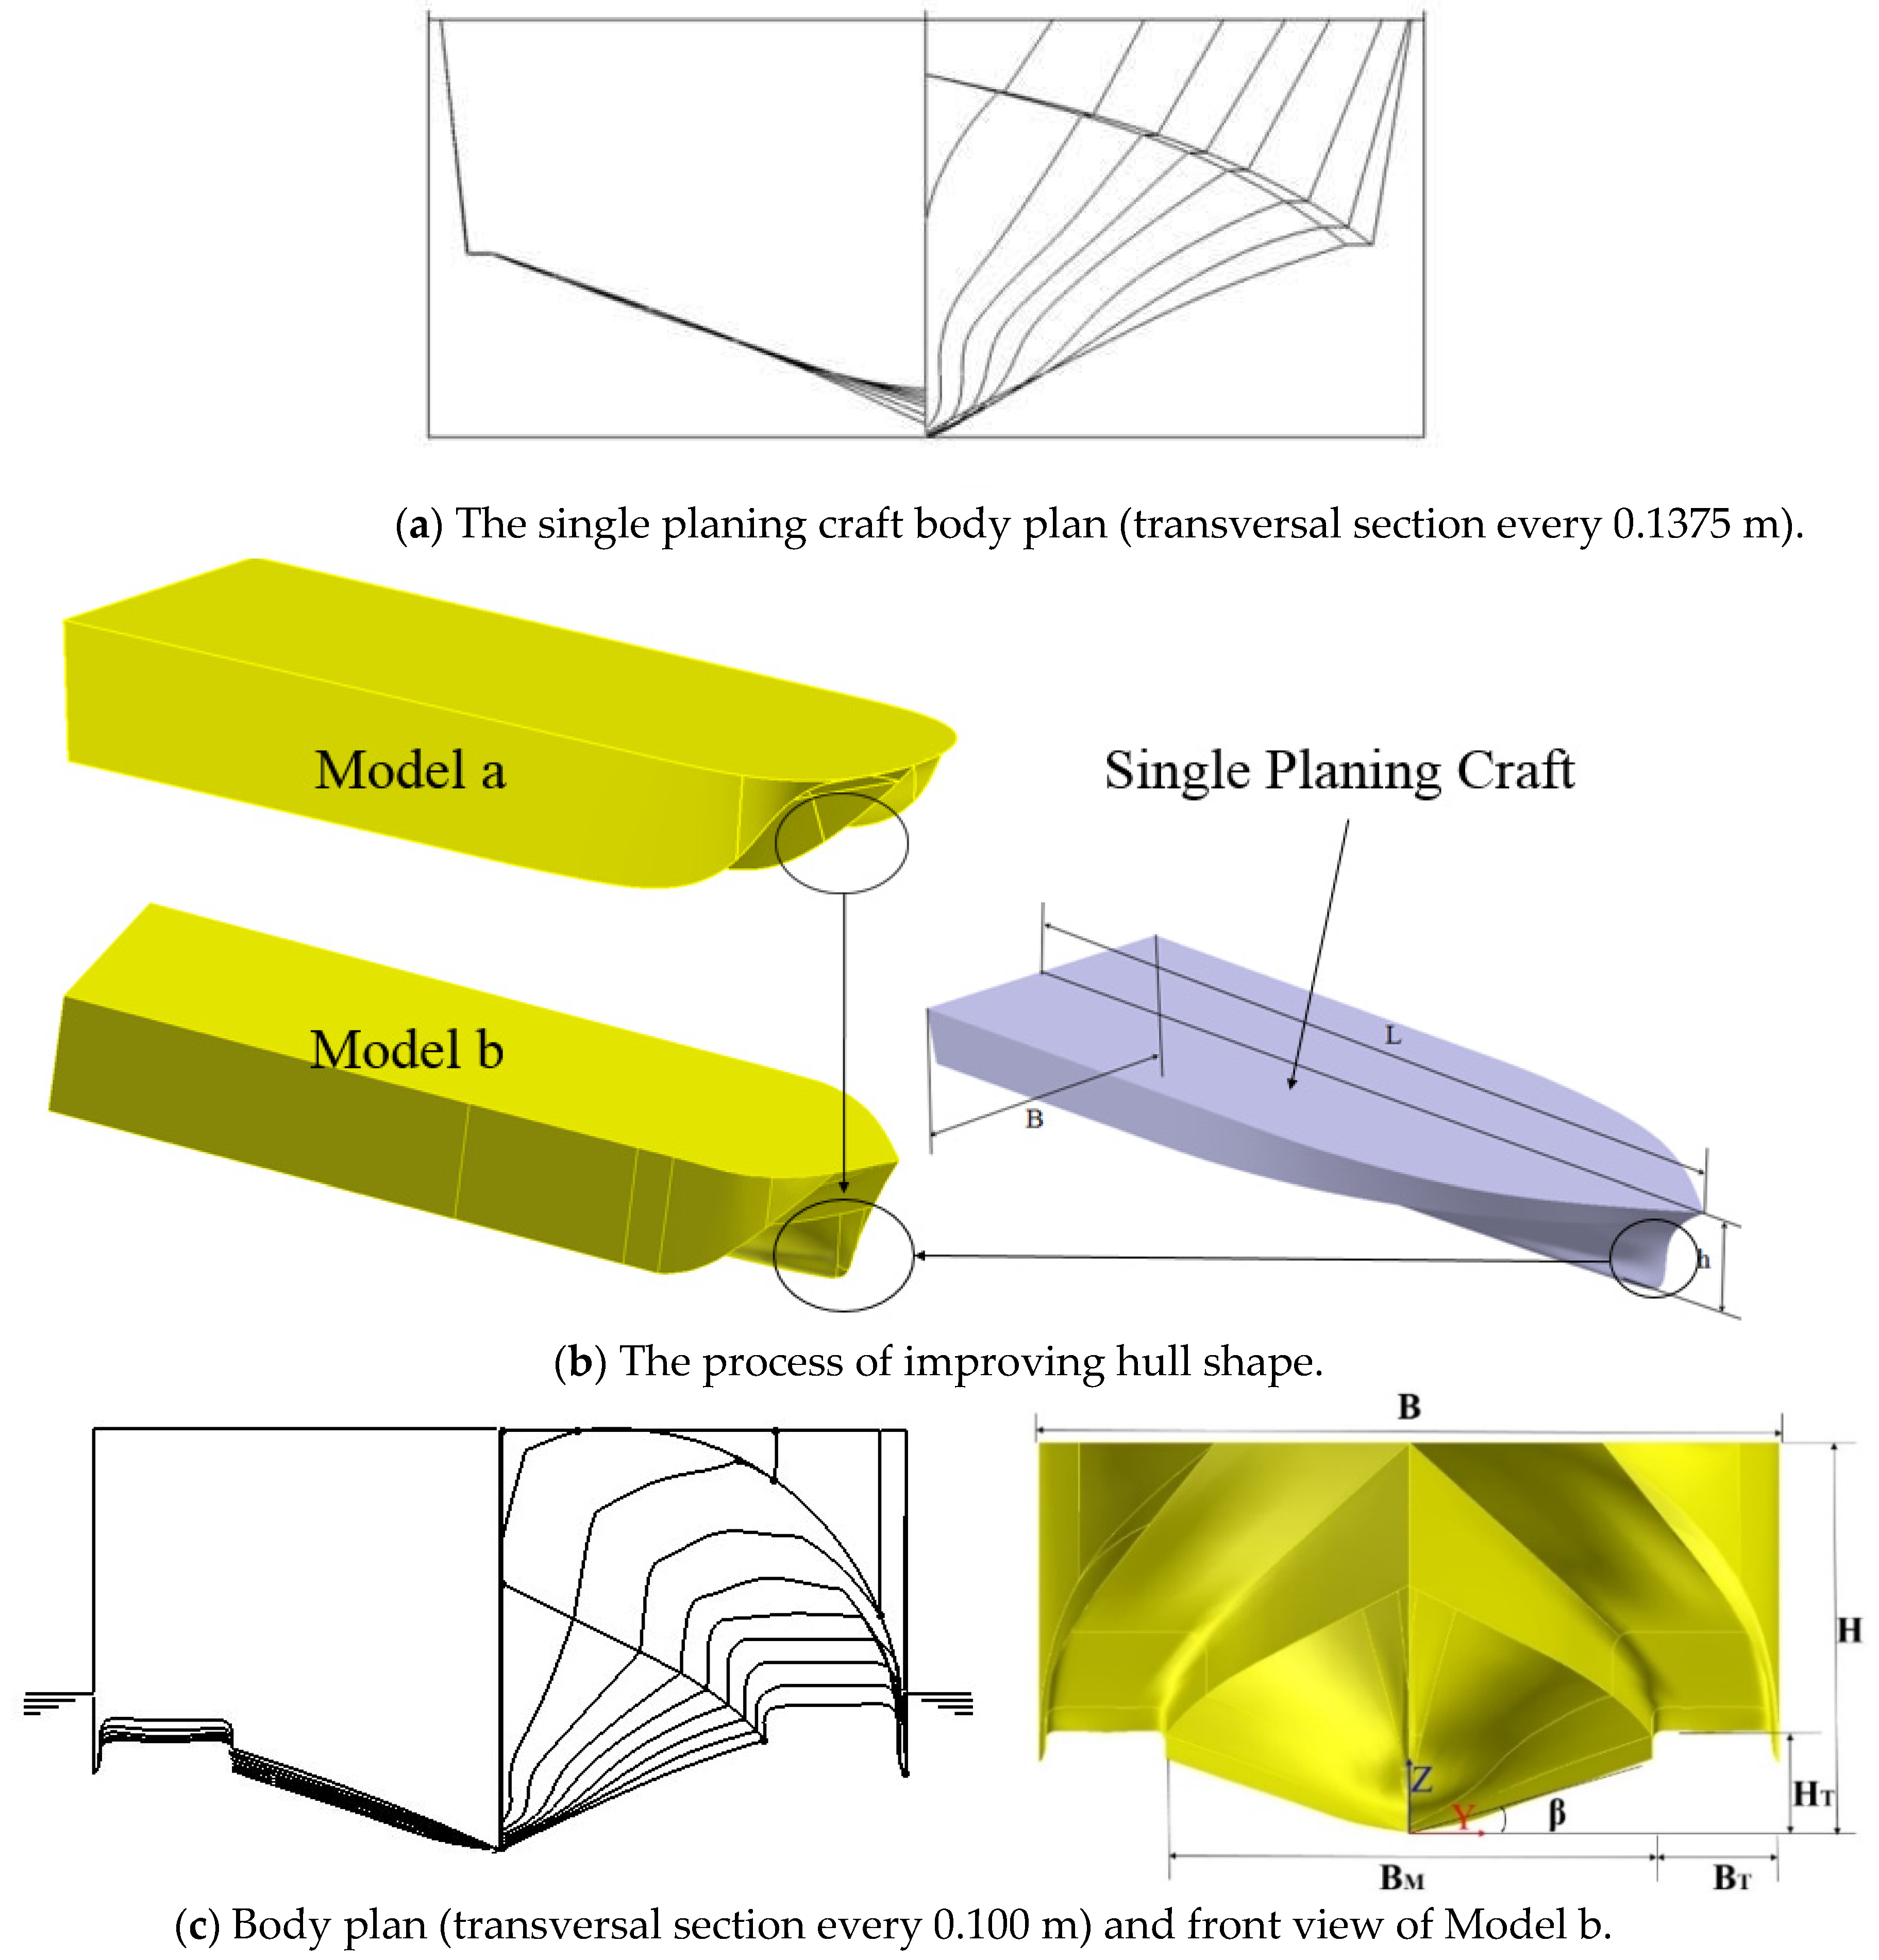
Table 1 presents the main characteristics of the planing trimaran. The main hull is a single planing craft with a bottom sail shape and a large displacement as illustrated in
Figure 1a–c. In order to improve its transverse stability, two sheets are arranged on both sides. The sheets are long and provide less buoyancy. The tunnel starts almost at the bow and extends to the stern. The roof of the tunnel is a straight line, and arcs at both ends are smoothly blended with the main hull and sheets. Viewed longitudinally, the opening at the front of each tunnel is large, and it rapidly narrows into a straight tube, resembling a long horn. Such a shape deemed advantageous for forming an air cushion and reducing the total resistance.
2.2. Experimental Set-Up and Measurement
The experiments were conducted at the High-speed Hydrodynamic Laboratory of Special Aircraft Research Institute of China (No. 605 Institute). The towing tank measures 510 m × 6.5 m × 6.8 m in length, width and depth, respectively. Carriage speed is in the range of 0.1 m/s~22 m/s, which can adequately meet the needs of high-speed planing craft test requirements. The parameters of the tank are presented in
Table 2. Additional information on the experimental apparatus is also presented in
Table 3.
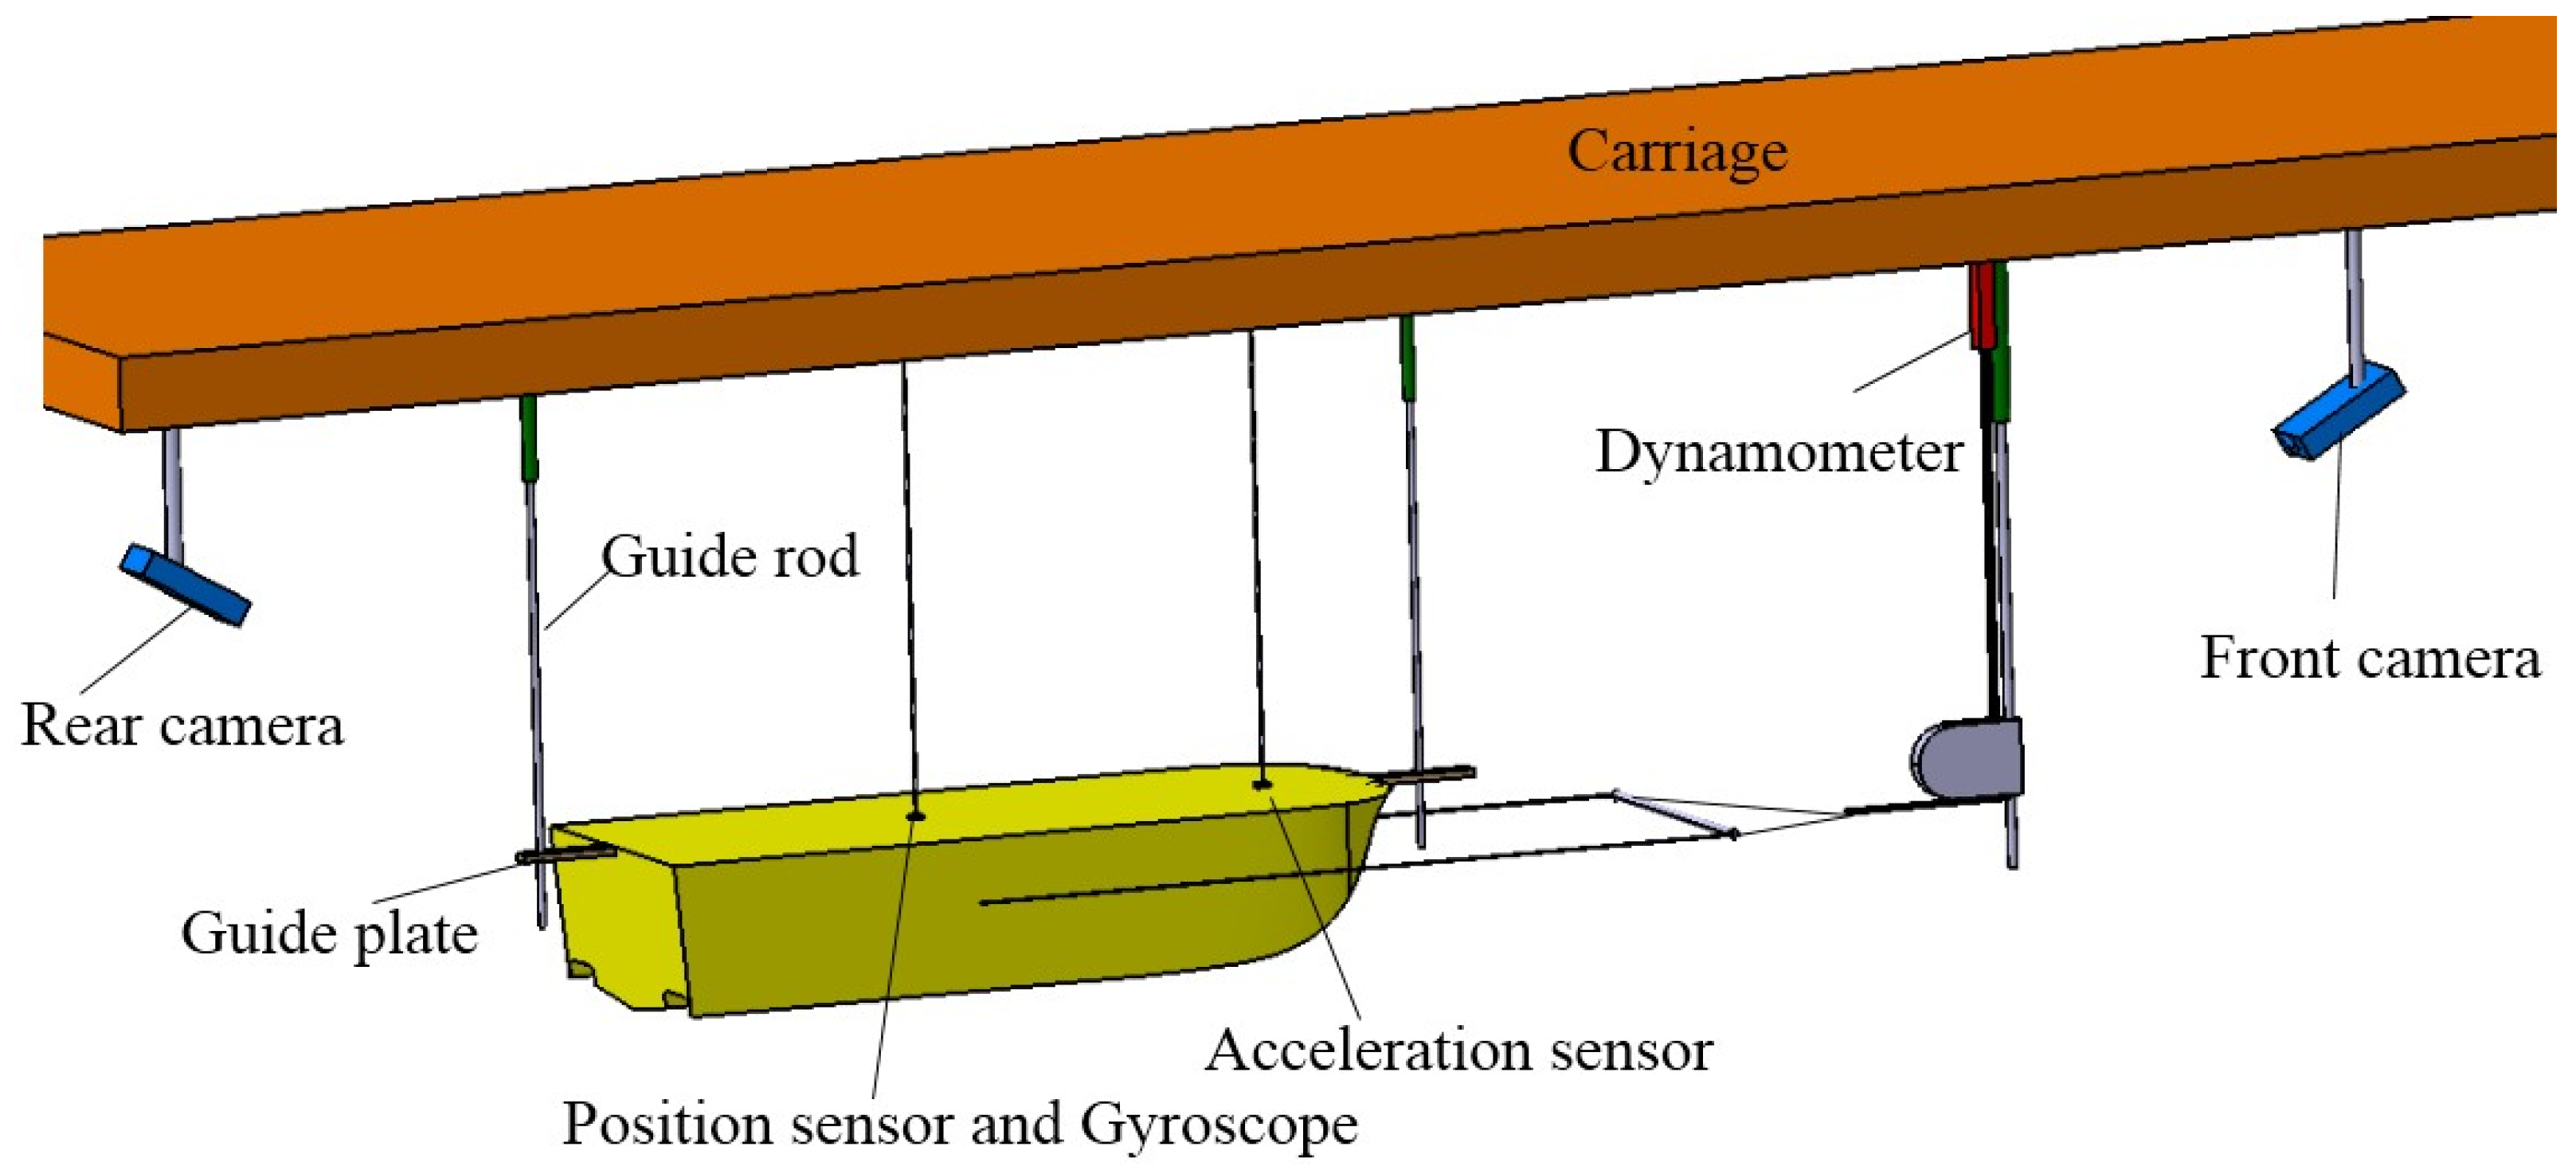
The main purpose of experimental test is to obtain the resistance and navigation attitude of a planing trimaran in calm water.
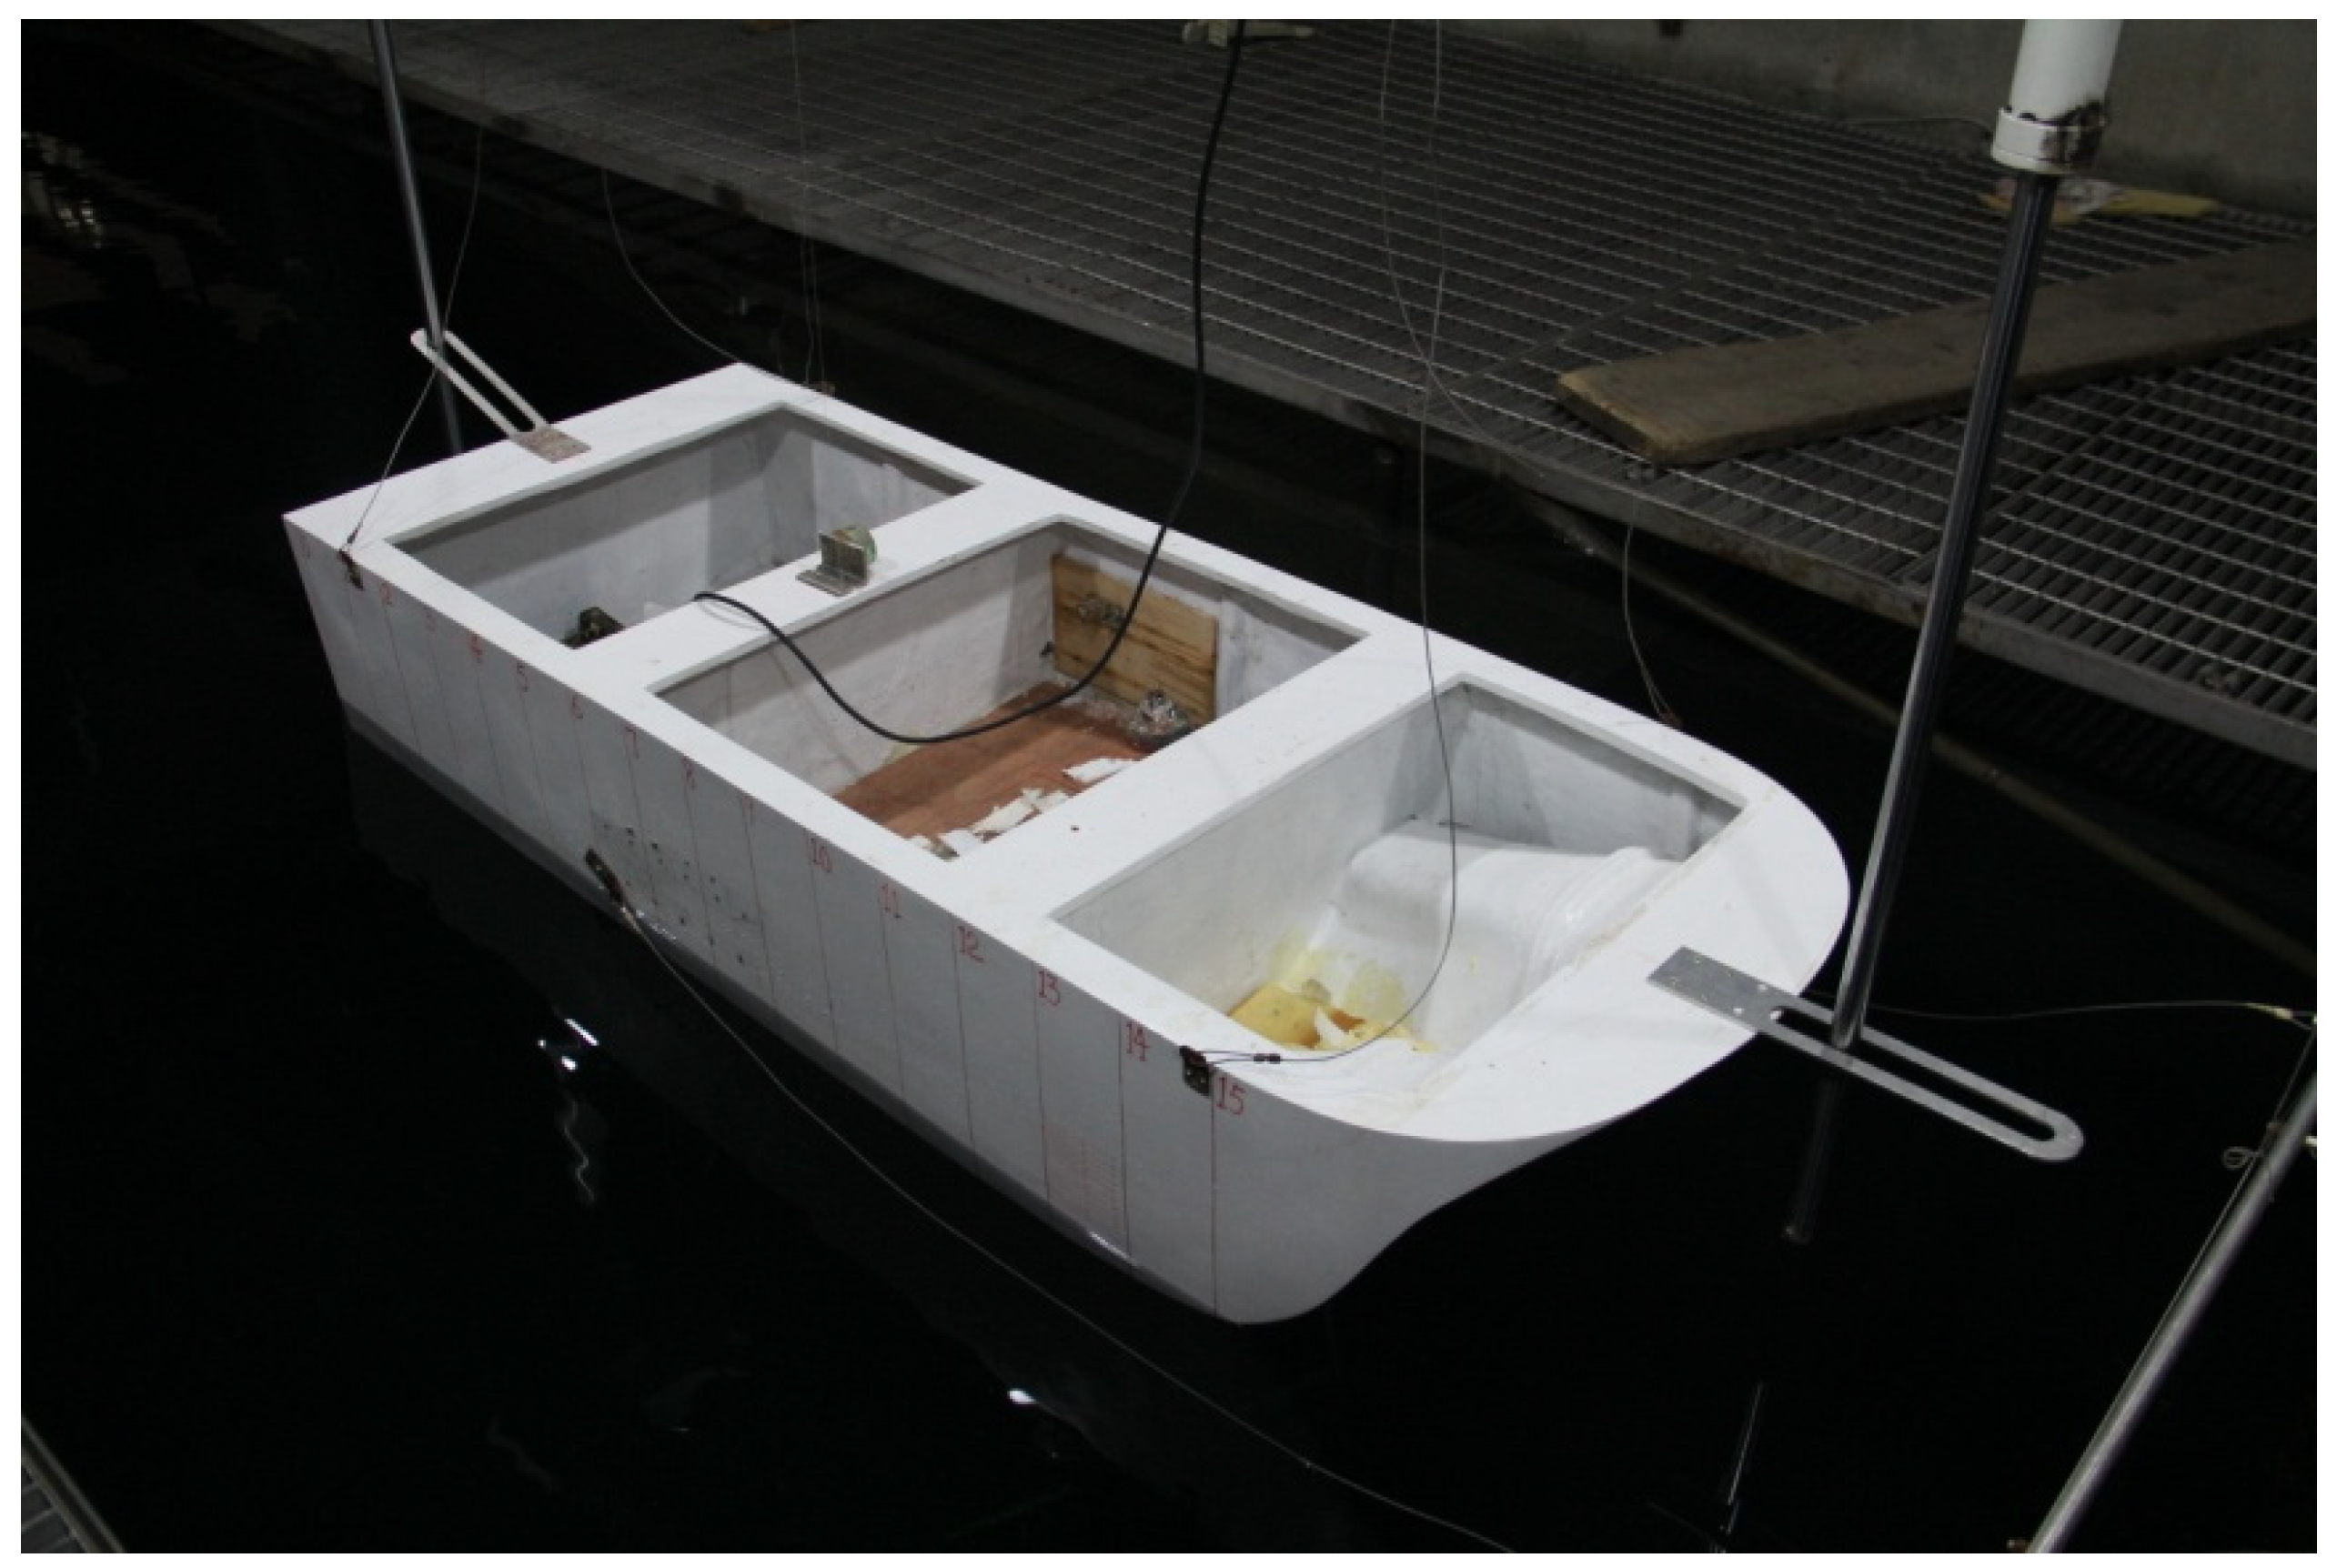
Figure 2 is the schematic view of the experimental set-up. The hull model is free in heaving and pitching. The planing trimaran model is installed in the towing tank as shown in
Figure 3.
A pair of navigation rods is installed at the front and rear ends of the hull model. The main function of rods is to restrict the lateral movement of the planing trimaran model, and they do not affect its forward, dynamic sinkage, and trim movements. The towing point is located on the wide side and is aligned with the trimaran center of gravity. The towing line is connected to the dynamometer via a fixed pulley and it can record the resistance of the hull during navigation. In order to measure the navigation attitude of the planing trimaran model, the position sensor and gyroscope are installed at the center of gravity of the hull, which can accurately measure the trim and sinkage of the hull. To record the flow of water into and out of the tunnel, two high-speed cameras are arranged before and after the model.
The model tests were conducted in still water condition, in accordance to ITTC [
27]. The minimum time between two consecutive towing processes was set at 10 min to ensure that the water level of the tank remains calm every time. It should be noted that the zero level of the sensor was initialized before each operation.
Experimental tests were performed at zero trim and 15 different speeds: 2.5, 3, 3.5, 4, 4.5, 5, 5.5, 6, 6.5, 7, 7.5, 8, 8.5, 9, and 9.5 m/s. The collected physical quantities include: total resistance, sinkage, and trim angle.
2.3. Experimental Results and Uncertainty Analysis
In this paper, the volume Froude number is used as the dimensionless velocity , where U is the velocity of the model, g is the gravitational acceleration, and is the volumetric displacement of the underwater part of the hull. Dimensionless resistance is the ratio of total resistance RT to the overall weight in Newtons . Dimensionless dynamic sinkage is defined as the ratio of sinkage value Z to one-third power of volumetric displacement .
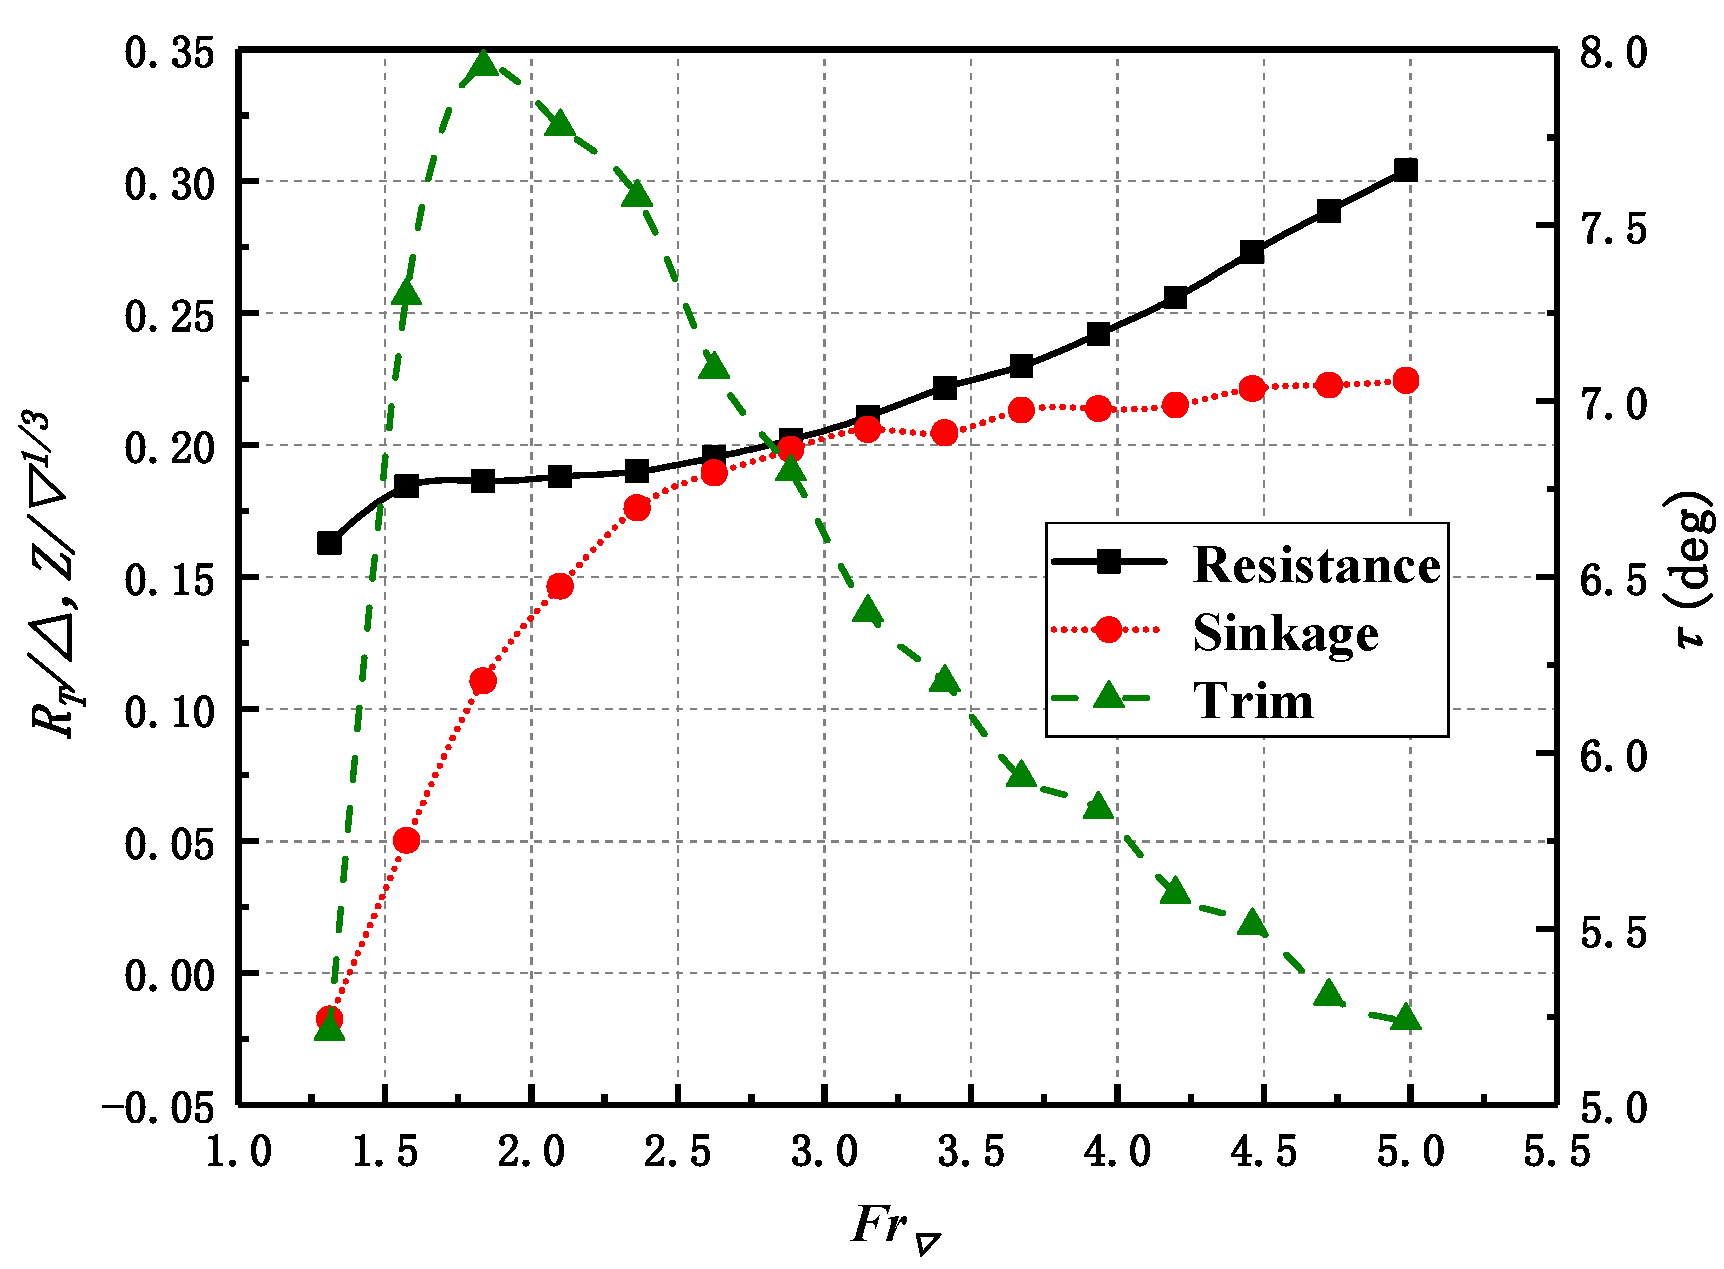
The experimental test results are shown in
Figure 4. The following observations are made from the figure. The total resistance curve has a resistance peak at around
FrΔ = 1.57, then appears to go up as
FrΔ increases. The dynamic sinkage curve records a rapid increase at lower Froude numbers and then seams to stabilize for
FrΔ > 3.0. In relation to the dynamic trim angle curve, a sharply increases to a large maximum value is noted, and then decreases gradually. When
FrΔ < 1.57, the tunnel of the planing trimaran model did not penetrate, with a large amount of air inflow turned back at the bell mouth of the tunnel. This caused the model′s dynamic trim angle to increase rapidly and the hull to be quickly lifted. With the combination of air resistance and hydrodynamic force, total resistance also rises rapidly. The largest trim angle is realized at
FrΔ = 1.83. At this point, the resistance of the water flow to the hull decreased due to the rise of the hull; therefore, the total resistance leveled off and did not rise rapidly. After
FrΔ = 1.83, as the model is lifted, there is a little space in the roof of the tunnel, which penetrates forward and backward, which could be attributed to the gradual decrease in dynamic trim angle. The air flow passing through the tunnel creates lift and further rises the hull leading to a much slower increase in total resistance. At
FrΔ = 2.89, the model is lifted to a certain height, the roof of the tunnel is penetrated, the lift force generated by the air tends to be the maximum, and dynamic sinkage of the model will also be flattened. As a result, dynamic trim angle slowly decreases. As the volume Froude number increases, the lift on the hull is insignificant and the total resistance of the model mainly due to the resistance of the water inflow.
Based on the above analysis, as the volume Froude number increases, the model is rapidly lifted. Due to the tunnel, the air cushion is formed earlier. This makes dynamic trim angle of the planing trimaran drop rapidly. Among high-speed conditions, only the total resistance increases.
An Uncertainty Analysis (UA) of the experimental results has been also performed according to Taunton et al. [
28,
29] and ITTC [
30], as reported in
Appendix A.
3. Numerical Simulation and Verification
The above experimental test results show that the planing trimaran has outstanding hydrodynamic performance. Based on the result data, the numerical simulation method was used to evaluate its hydrodynamic performance. The applicability and accuracy of the numerical simulation method was verified based on the experimental test results.
In this section, the governing equations, the governing equations of free motion, VOF, coordinate system, and computational domain analysis are discussed. Due to the complex flow field near the free surface, the sensitivity of the mesh near the free surface was studied.
3.1. Governing Equations
Planing trimaran navigation in still water can be considered as a problem of flow around an object; therefore, the continuity equation and N-S equation are taken as governing equations. For viscous and incompressible flow, the continuity and momentum equations can be described as
where
is the density of the fluid,
is the velocity vector, and
is the pressure. Equation (2) last two terms belonging to the viscous stress tensor.
is the kinematic viscosity. Velocity
can be derived as the mean velocity and the fluctuating velocity components, respectively.
3.2. Governing Equations of Free Motion
The equation (DFBI formulation) for the translation of the center of mass of the body as noted in the global inertial coordinate system is given by the expression
where
represents the mass of the body,
is the resultant force acting on the body, and
is the velocity of the center of mass. In the paper,
. The equation of rotation of the body is formulated in the Body Local Coordinate System with the origin in the center of mass of the body:
where
is the tensor of the moments of inertia,
is the angular velocity of the rigid body, and
is the resultant moment acting on the body. In this paper,
. The tensor of the moments of inertia is expanded as
As this tensor is a symmetric, it is defined by two vectors: one specifying the principal components, along the diagonal, and the other specifying the off-diagonal components, .
3.3. Free Surface Treatment
How to accurately trace the location of the interface between two fluids is an important research direction for two-phase flow problem. There are two methods commonly used to model and position the free surfaces: front capturing and front tracking. In the present work, the finite volume method is used to discretize the governing equation and the most common method of free fluid surface following is the VOF method (Nichols and Hirt [
31]).
If there is no specified fluid in the cell,
F = 0; if there is a boundary between the specified fluid and another fluid in the grid cell, 0 <
F < 1; if the grid cell is full of the specified fluid,
F = 1. The function
F satisfies the following differential equation (Scardovelli and Zaleski [
32]).
3.4. Coordinate System and Computational Domain Analysis
When the planing trimaran is sailing in still water, the earth is used as the reference system, and the planing trimaran moves relative to the geodetic coordinate system. However, in the STAR-CCM+ numerical simulation, the coordinate system is reversed. In the numerical simulation, the model is stationary, and the current interacts with the hull. When the DFBI six-degree-of-freedom model considered, two freedoms of motion were activated: dynamic sinkage and trim. After the calculation results converge, the results of the resistance and navigation attitude of the planing trimaran were obtained. The coordinates of the model are specified in the calculation, where the forward of the hull is the positive direction of the X axis, the port side is the positive direction of the Y axis, and the bottom up of the hull is the positive direction of the Z axis.
The planing trimaran model in the present work is a symmetric structure. According to the calculation experience of Jiang Yi et al. [
23], by setting the mid-section as a plane of symmetry, the calculated fluid domain can be reduced by half in the numerical calculation. This reduces the total mesh amount by half. During the simulation, the mass and longitudinal mass moment of inertia are set to half of the original hull, and then the resistance calculation result is correspondingly half of the experimental result. This method greatly improves the calculation speed without affecting the numerical calculation result.
According to Jiang Yi et al. [
22] and Menter et al. [
33], the turbulence model used in this paper is the k-
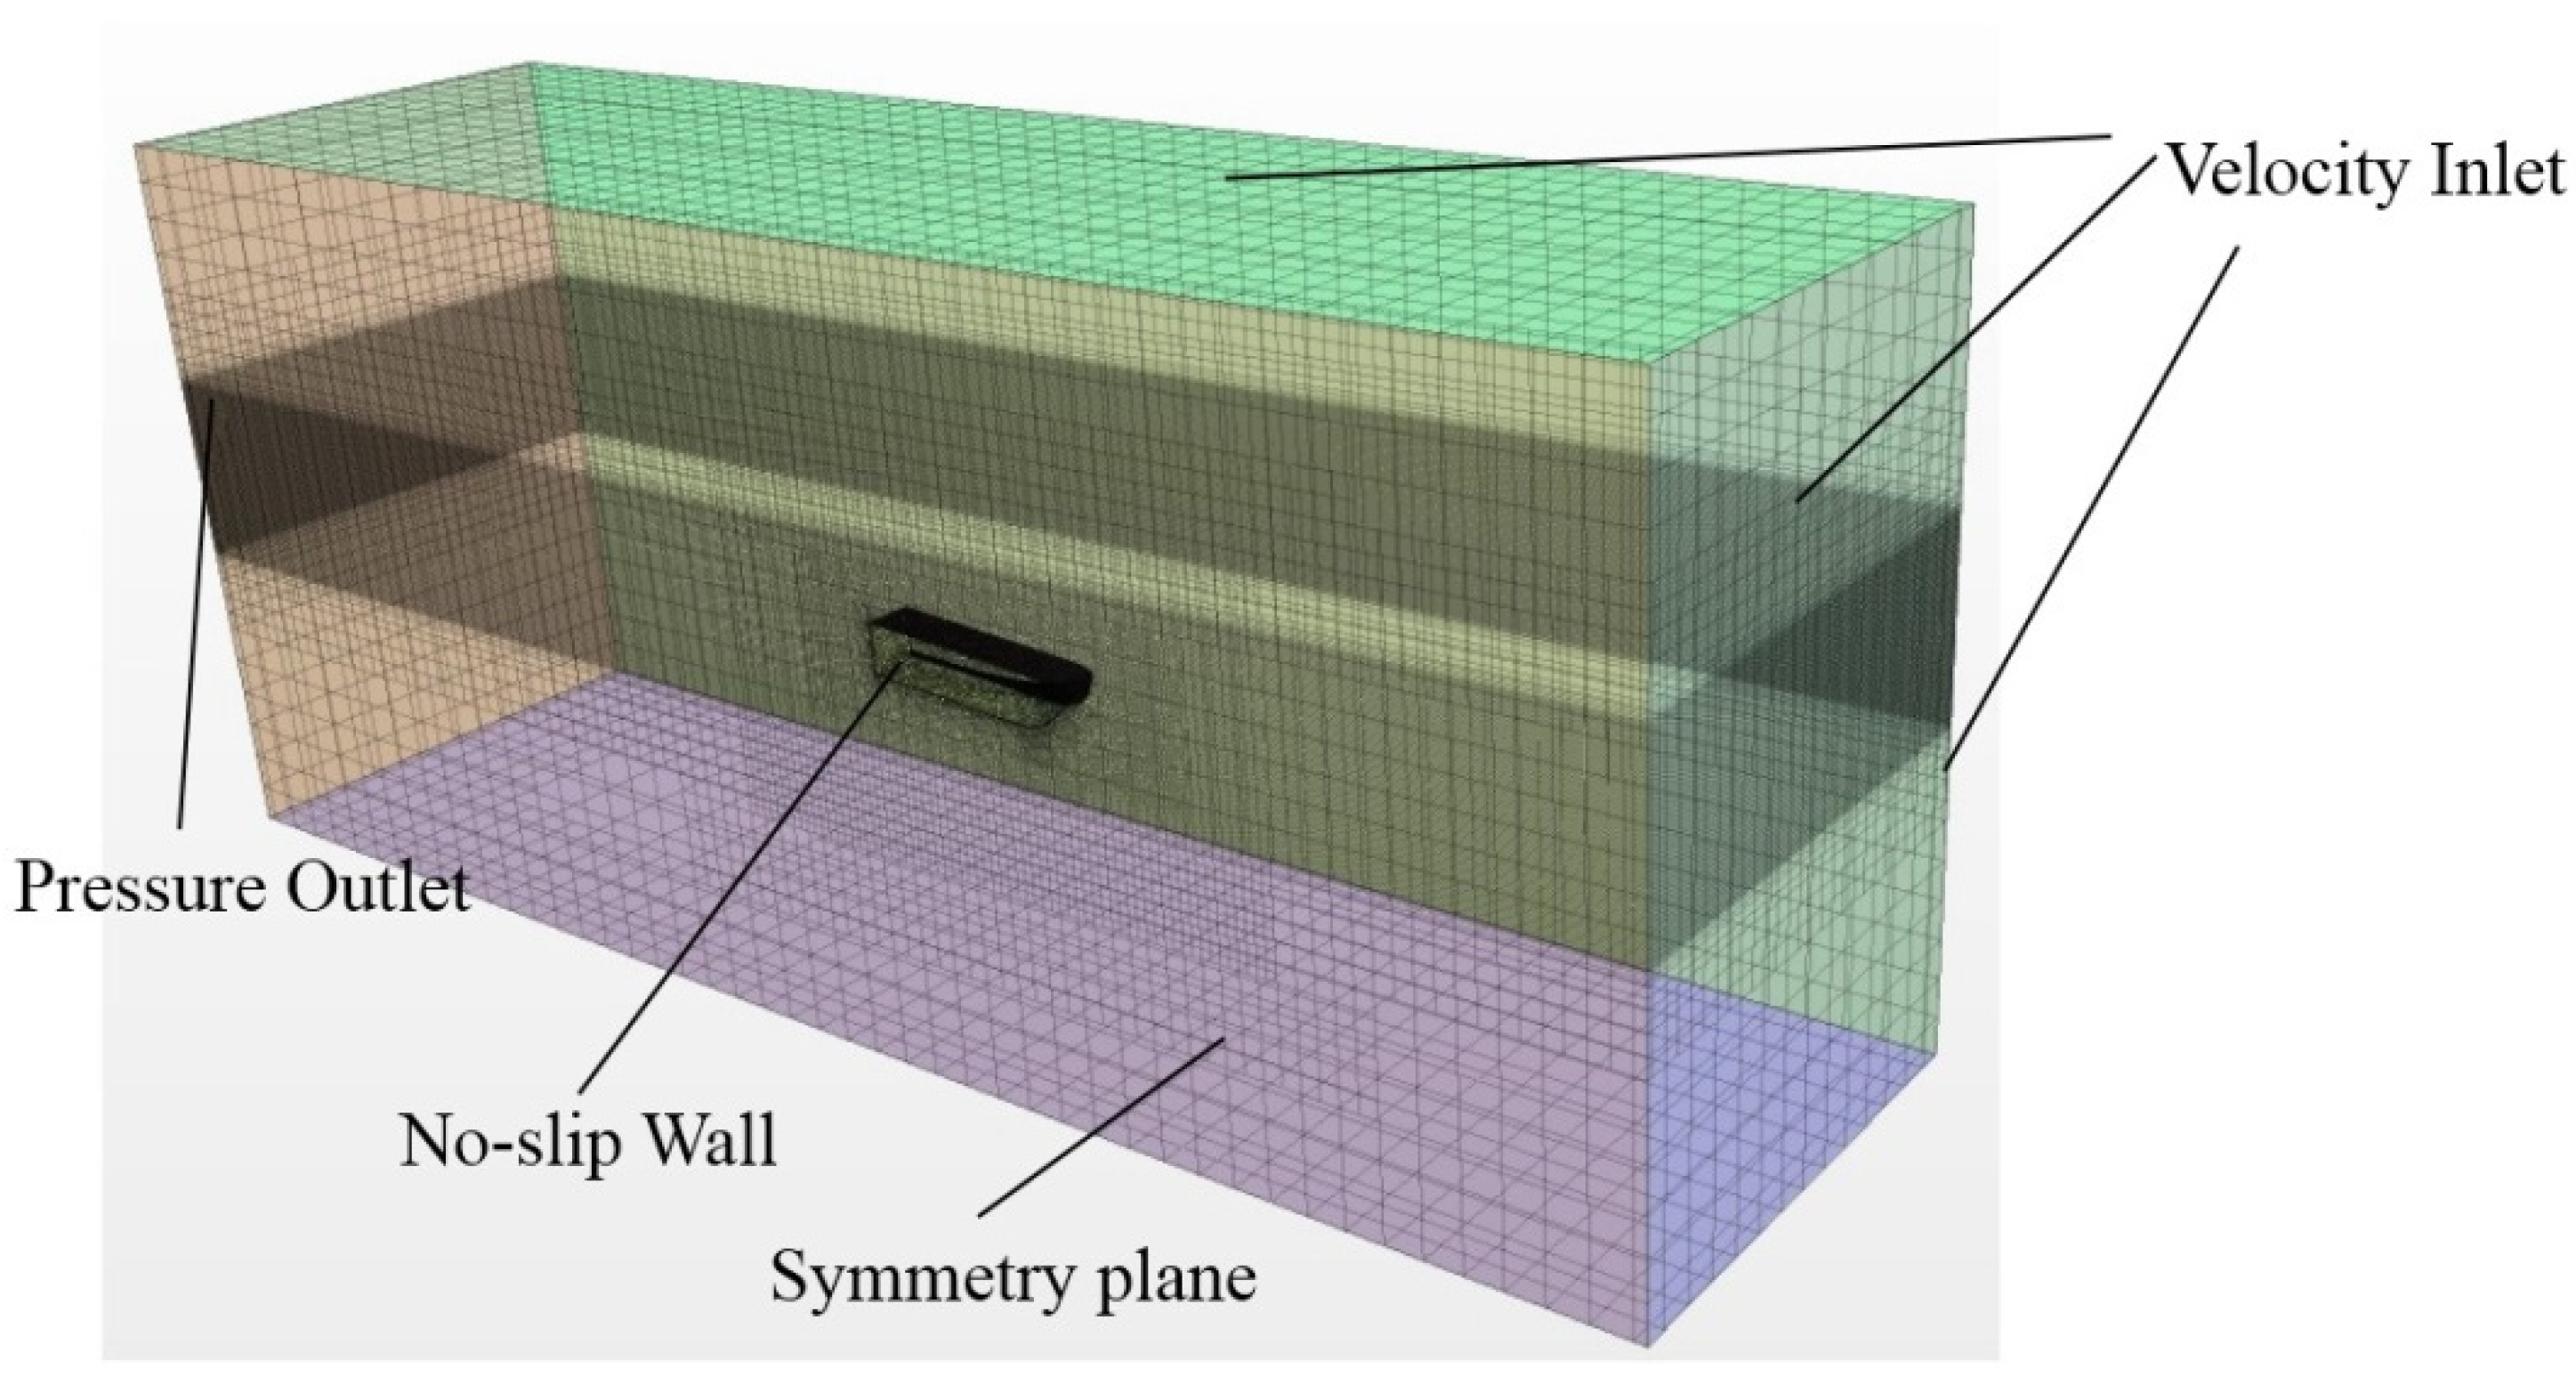
shear stress transport (SST), the time step is set to 0.001 s. The virtual tank dimensions are 2 L in front the boat, 4 L after the boat, the side is 2 L away from the middle section, and the top and bottom are 1.5 L away from the boat base plane as shown in
Figure 5. Due to the large range of waves and wakes generated by the higher speed of the planing trimaran, the model is far from the side and the rear of the virtual towing tank.
The boundary conditions are set as follows. The surface of the planing trimaran model is set as the non-slip wall; the front, top, bottom, and side boundaries of the virtual towing tank are set as the velocity inlet; and the outflow boundary of the flow field is set as the pressure outlet. As only half of the domain is calculated, the right boundary is set as symmetry planes, see
Figure 6.
The shape of the bottom of the planing trimaran model is complex, due to the presence of two tunnels. In order to better capture the details of the model, the mesh on the surface of the hull is set to 1% L. This results in a large total grid amount. To reduce the total grid amount, a large mesh size is used for the general solution of the virtual tank boundary. In this paper, the mesh size of the virtual tank boundary is set to 32% L.
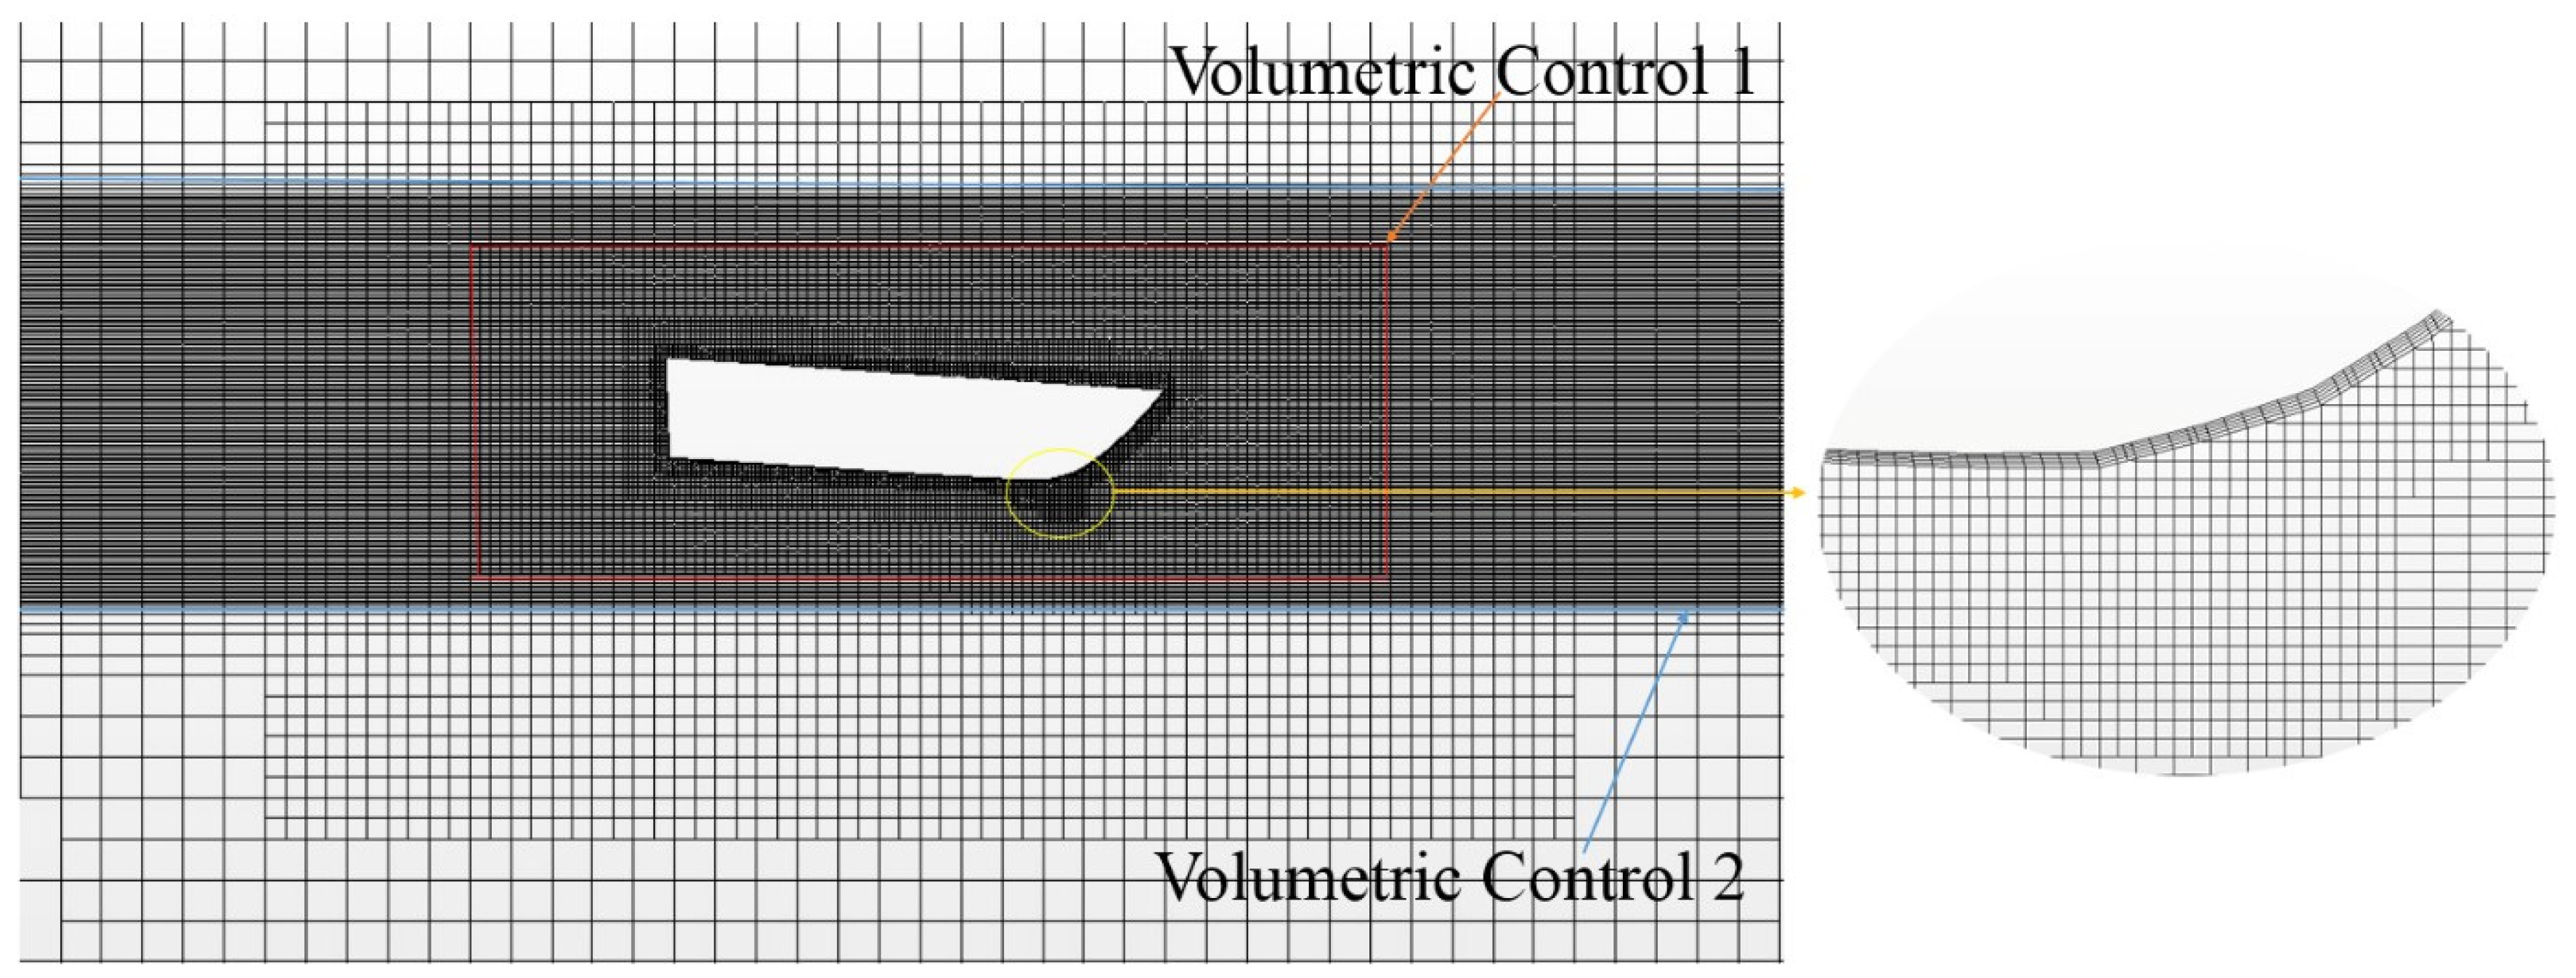
Numerical simulation in the present work mainly uses the trimmer mesh. The size of mesh between the virtual tank boundary and the hull surface is very different. In order to smoothly transition the size of the model mesh and the boundary mesh, a fine mesh control domain (Volumetric Control 1) is set around the model, as shown in
Figure 7. The refinement range of the fine mesh control domain (Volumetric Control 1) is 1.4 L × 0.3 L × 0.45 L, with the mesh target size of 2% L. As can be seen from
Figure 6, the outer mesh size is expanded outward at a ratio to obtain the mesh of the computational domain.
To capture flow features near the wall, five (5) prism layers are used. The size of the prism layer mesh is expanded outward at a ratio of 1.1. On the right side of
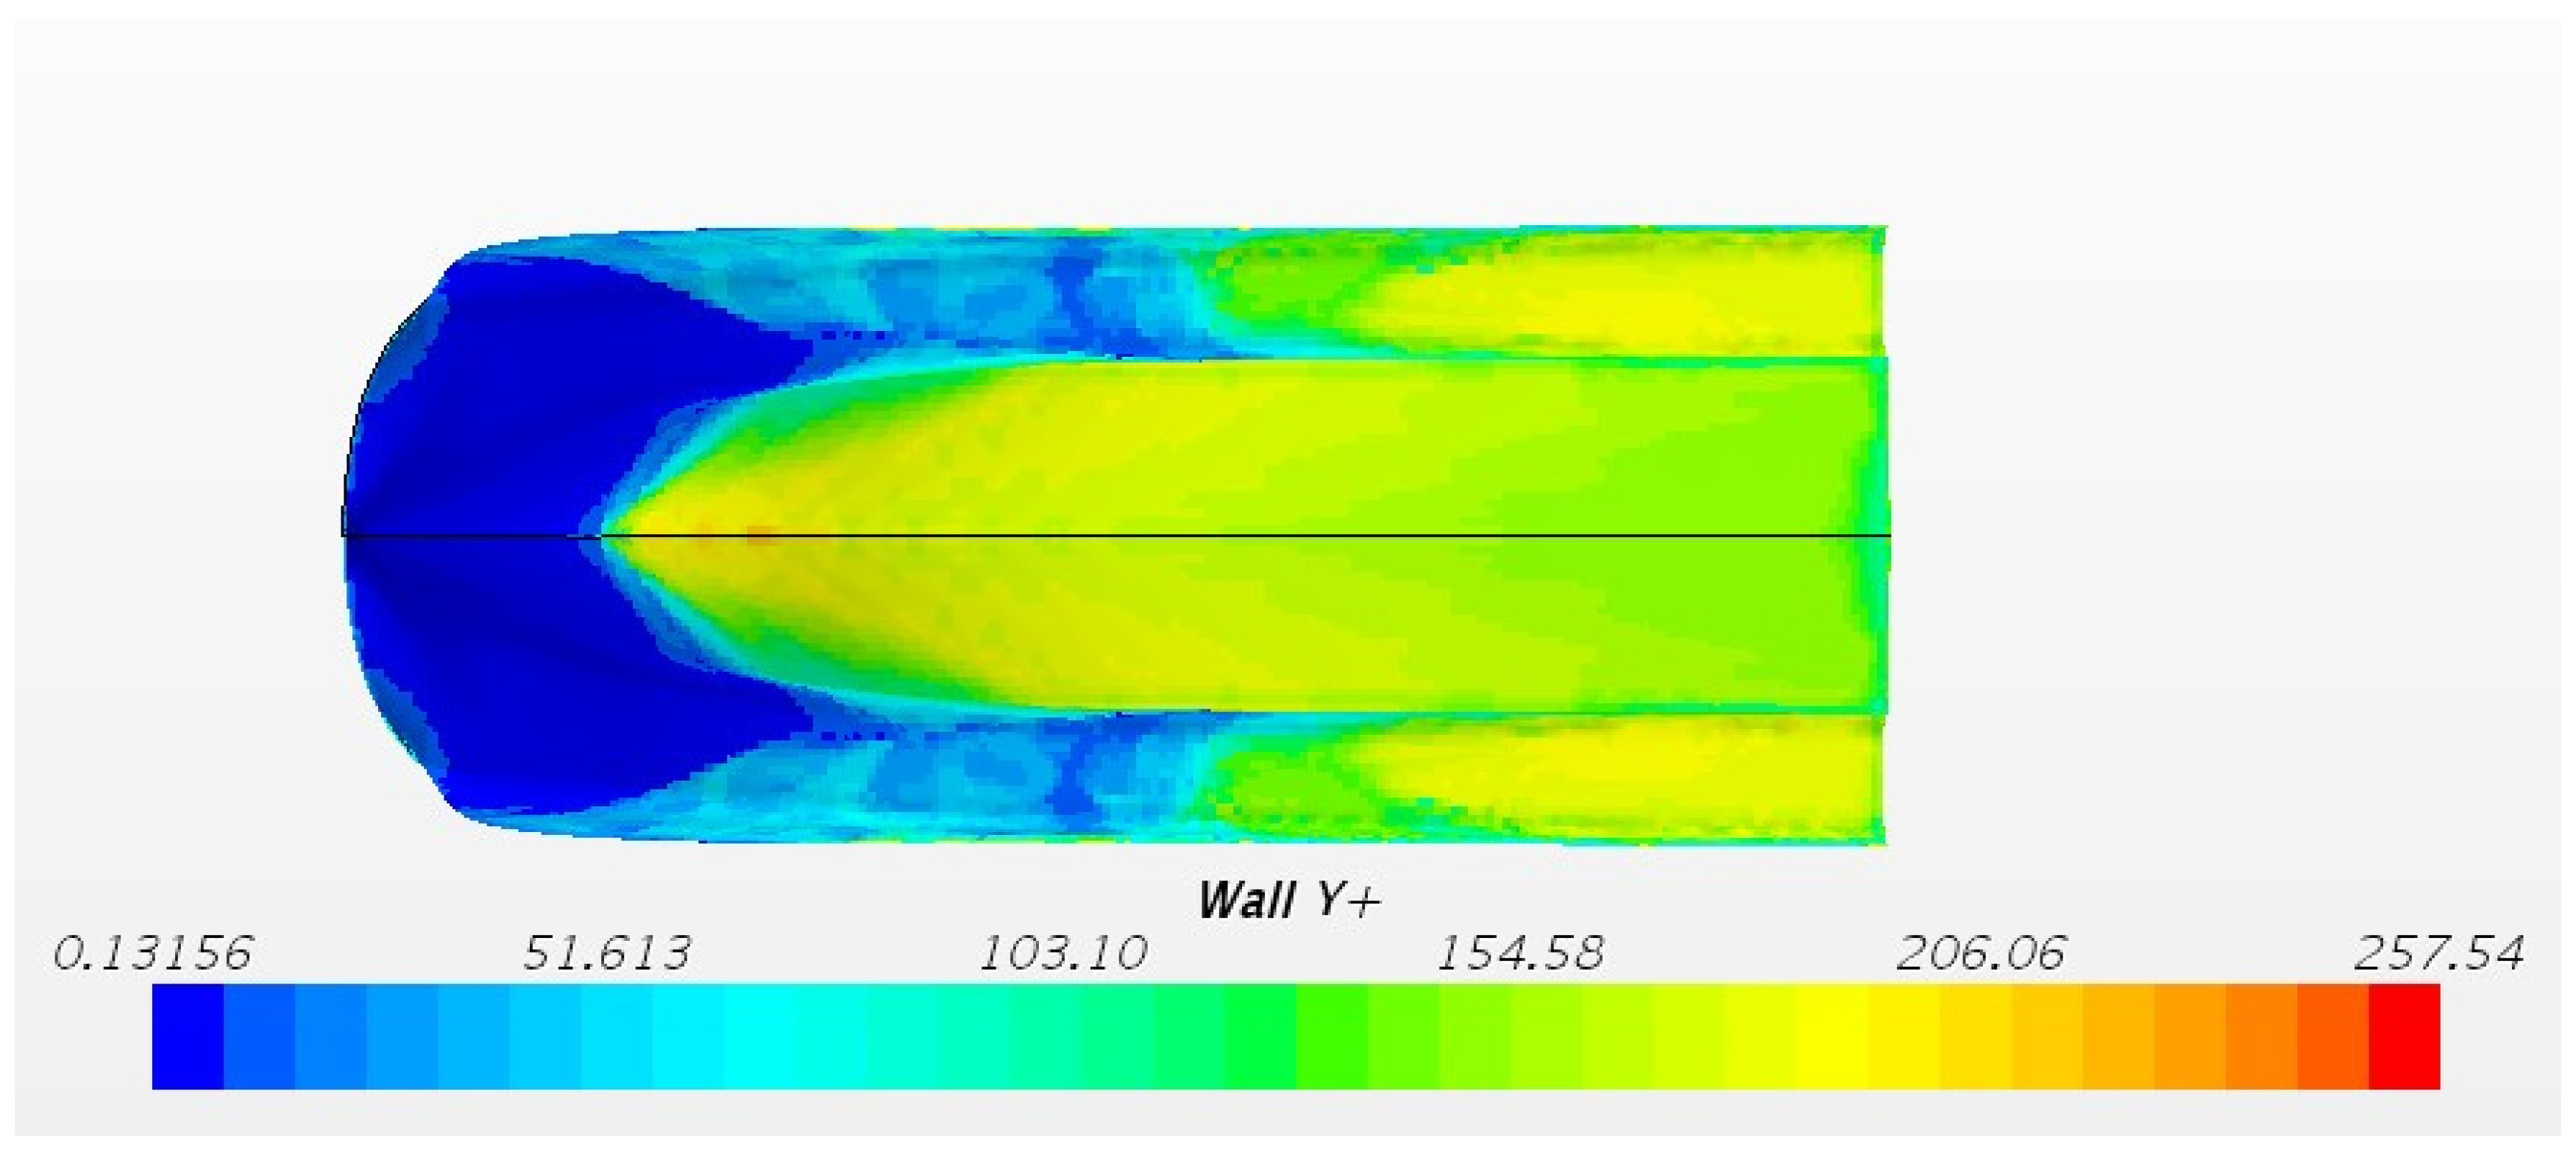
Figure 7, the prism layer mesh of the model can fit the hull well. All y+ wall treatment model is used for wall surface, which is a hybrid model that simulate high y+ wall processing for coarse meshes (y+ > 30) and y+ wall processing for fine meshes (y+ ≈ 1). This method is a reasonable compromise between the acceptable quality of the boundary layer description and the computation time. The value of y+ near the hull at
FrΔ = 4.72 is shown in
Figure 8.
In order to capture the non-linear phenomenon of the free surface, a large-scale mesh control domain (Volumetric Control 2) is set on the free surface. In the X and Y directions, Volumetric Control 2 is spread throughout the fluid domain. In the Z-axis direction, the length of the mesh control domain (Volumetric Control 2) is 82%L. It is imperative to note that the interaction between the planing trimaran model and fluid mainly occurs on the free surface. The mesh quality at the free surface has a direct influence on the accuracy of the hydrodynamic performance prediction of the planing trimaran model. In the next section, the size of the mesh near the free surface will be researched.
3.5. Sensitivity Analysis of Mesh near the Free Surface
The planing trimaran model generates waves at the free surface in calm water test. The free surface therefore poses a greater impact on the hydrodynamic performance of the planing trimaran model. The planing trimaran is characterized by high-speed attack and the air–liquid mixing in the tunnel. In this section, the main focus is on the influence of free surface mesh size on the hydrodynamic performance prediction of the planing trimaran.
Investigation are carried out at experimental conditions for planing trimaran at FrΔ = 4.72. In the computational fluid dynamics software STAR-CCM+, it is necessary to refine the free surface mesh. Since the free surface is a projection surface of the entire computational domain, its range is large, and the mesh size directly determines the total mesh amount. However, a fine mesh around the model is also needed to capture the details of the flow field around the hull. Generally, for the sensitivity verification of the mesh, several mesh schemes are designed in order from sparse to dense and calculated separately. The calculation error is correlated to changes in mesh size where smaller size of the mesh yields smaller calculation error. Finally, a mesh scheme in which the calculation error is within the range of engineering error and the amount of mesh can be bore by the computer is selected.
Next, the sensitivity of the free surface mesh is studied. The horizontal, longitudinal and vertical dimensions of the free surface mesh are mainly investigated. The mesh scheme settings are shown in
Table 4. The free surface mesh size XYZ refers to the mesh size in the X (longitudinal), Y (transverse), and Z (vertical) directions in the computational domain (the mesh size is expressed as a percentage relative to the length of the planing trimaran model).
Based on the mesh sizes in
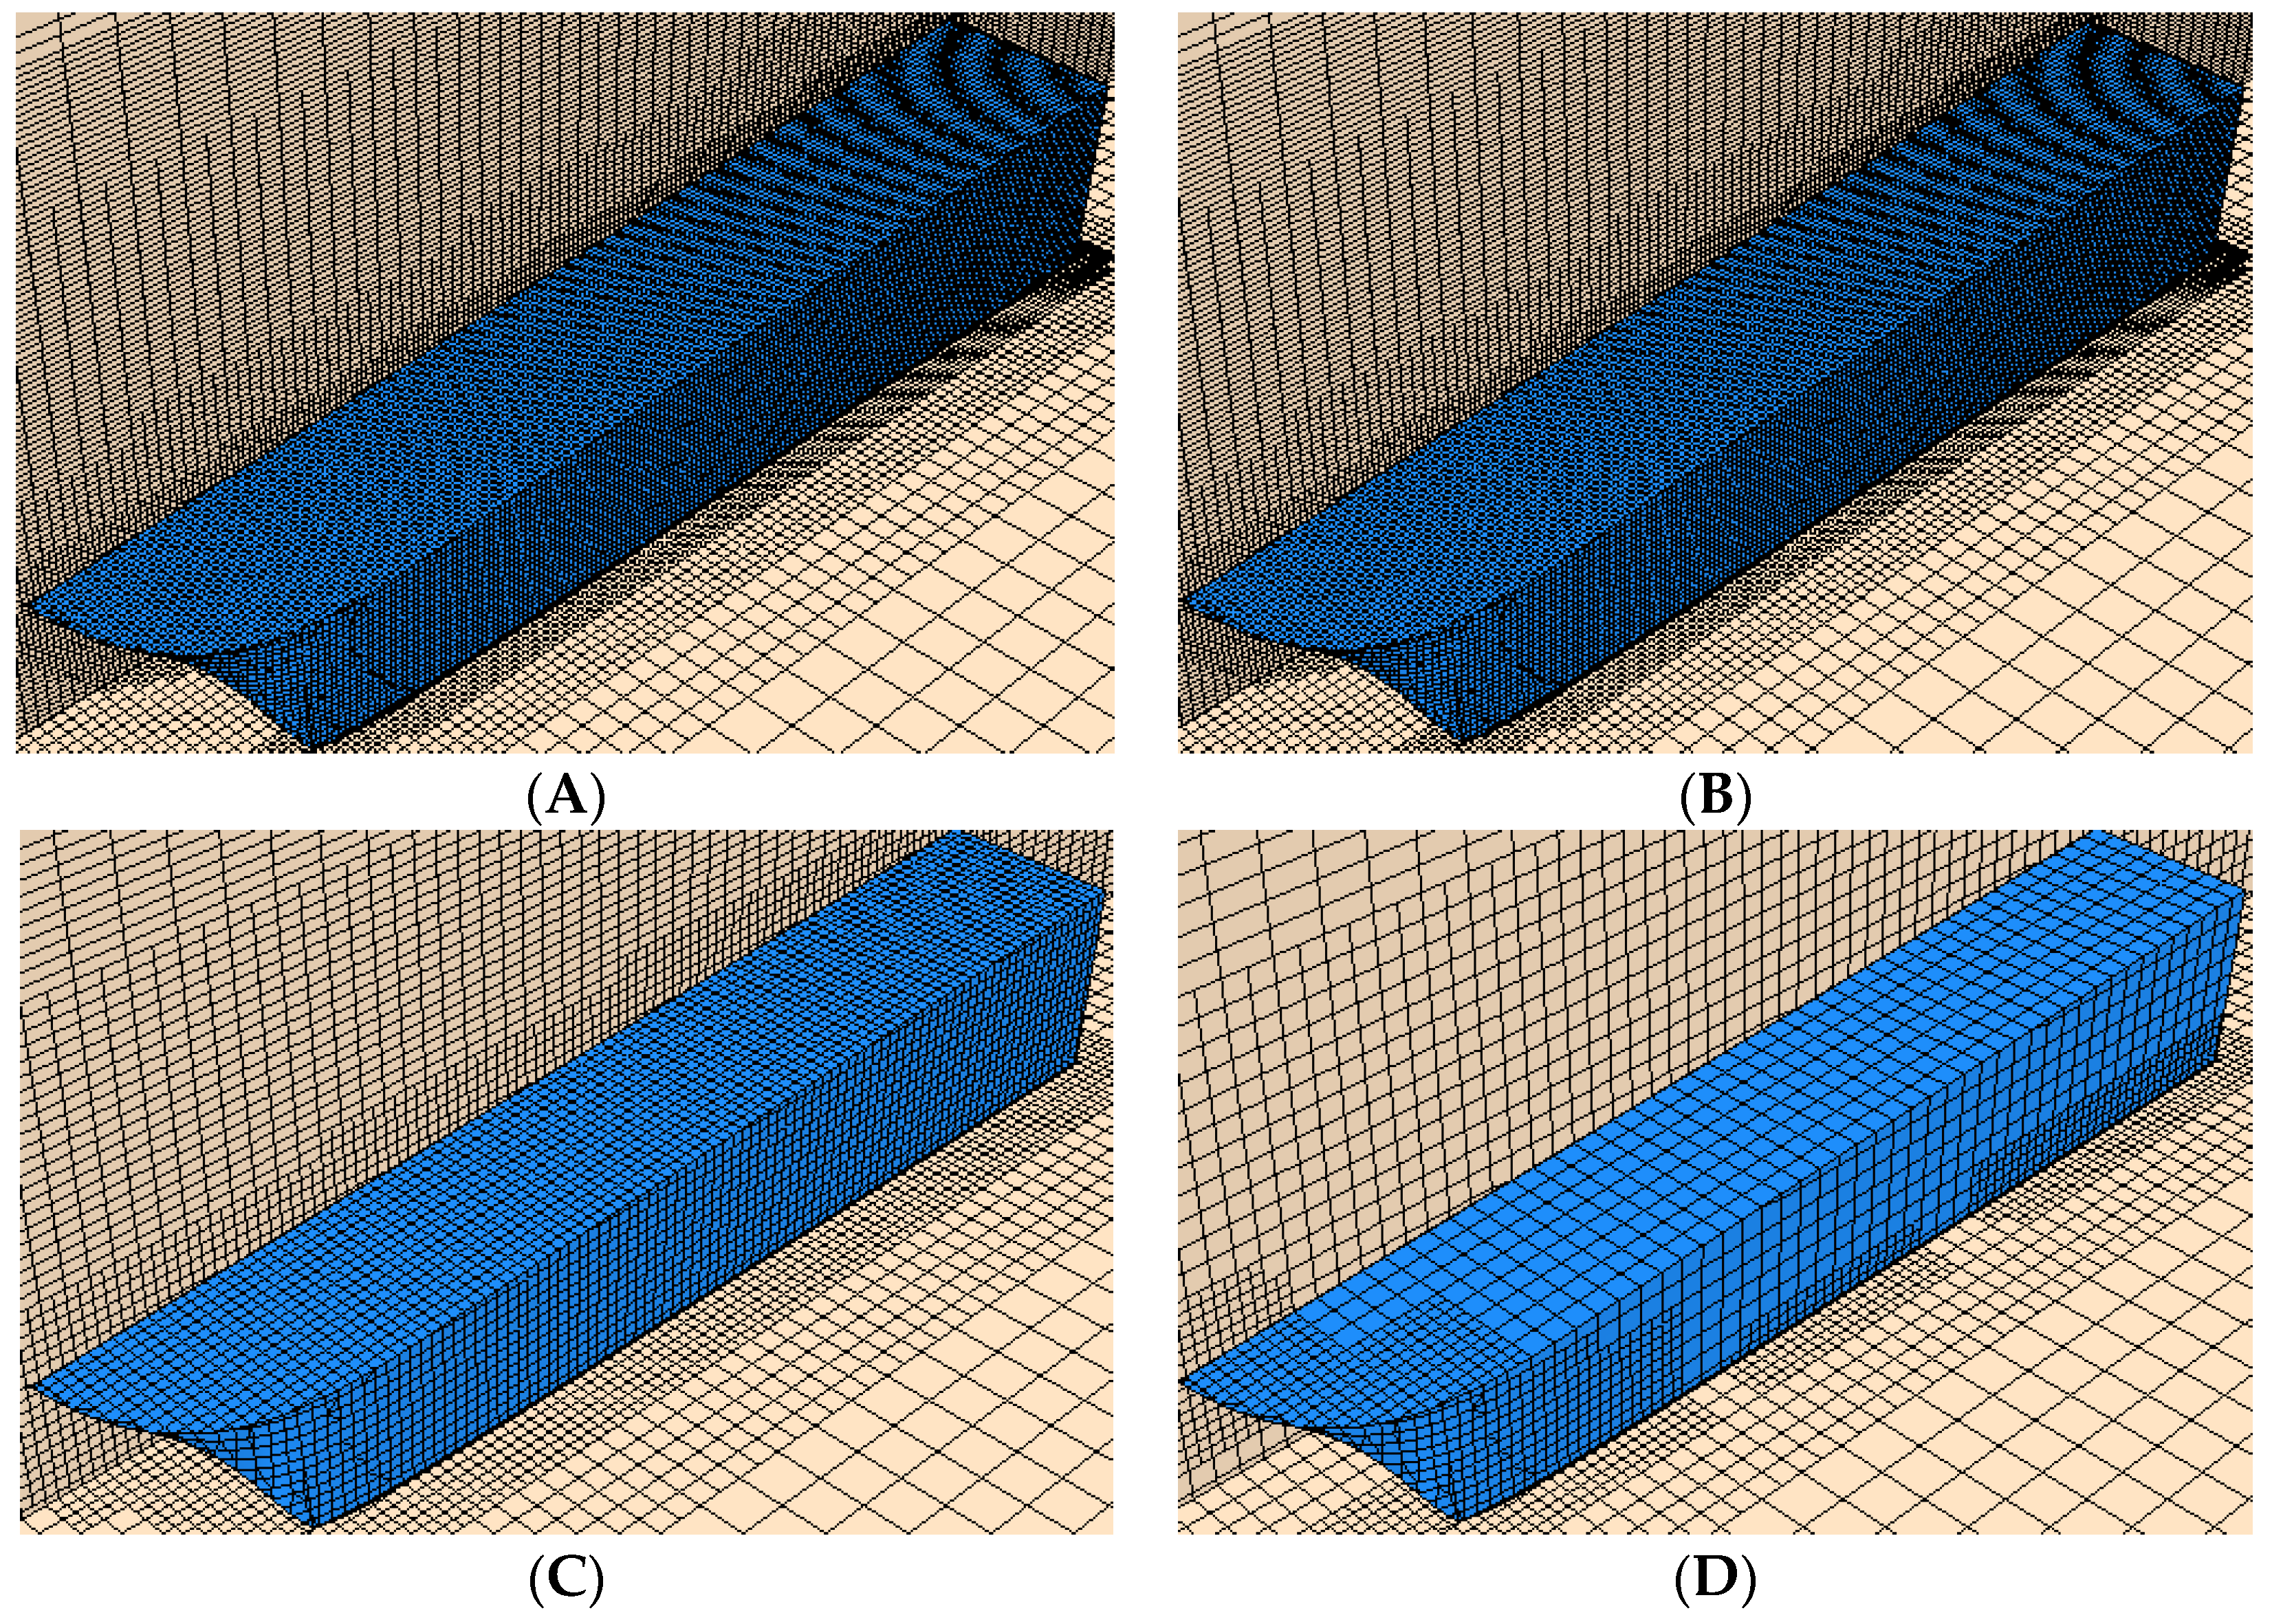
Table 4, the generated the trimmer mesh is shown in
Figure 9. It should be noted that as the size of the mesh becomes smaller, the mesh around the model becomes denser. The mesh distribution on the surface of the hull exhibits similar trend.
Figure 9B is a half of the mesh size in the
X-axis and
Y-axis directions of
Figure 9A.
Figure 9B–D display a mesh size increase in the
Z-axis direction at a ratio of 2. It is observed that the size of the
Z-axis grid relatively affects the sparseness of the mesh.
In
Table 5, “Exp” represents the experimental value of planing trimaran at
Fr∇ = 4.72, while “Num” represents the numerical simulation value at same speed.
.
From
Table 5, with a comparison between scheme A and B, where the mesh size in the X and Y directions of the free surface is reduced by half at the same time, translates to 1% reduction in the total resistance error. The Z axis mesh size variation strategy is implemented in mesh schemes presented in C and D. From the presented data, the Z direction sizes of 1.1%L and 2.2%L, the calculated total resistance error is not consistent with the experimental test value, and both deviate from the experimental test value by more than 20%. When a 0.55%L mesh size is applied on the Z direction in schemes A and B, the error between the calculated value and the experimental test value of the total resistance is less than 10%, which is within the engineering error range. Near the free surface, the mesh size on the Z axis (vertical) has a great influence on the accuracy of the calculation. When the dimensions of the free surface X axis and Y axis are 8.18%L, and the vertical dimension is 0.55%L, the amount of mesh is about one million, and the mesh amount is suitable for calculation by ordinary computers.
Based on the analysis of the sensitivity of the free surface mesh, the mesh schemes of the free surface mesh size in XYZ directions are 8.18%L, 8.18%L, and 0.55%L. It can be used for the numerical simulation of the planing trimaran model hydrostatic resistance and navigation attitude with high efficiency and accuracy.
3.6. Results and Discussions
In this section, the experimental test and numerical simulation results for 15 test conditions are compared and discussed. Numerical simulation results in still water are presented for Fr∇ = 2.1, 3.15, 4.2, 4.72, in terms of free surface, streamline and pressure distribution. These are crucial in the analysis of the state of the planing trimaran model. Finally, suggestions are given to further improve the hydrodynamic performance of planing trimaran.
3.6.1. Total resistance, dynamic sinkage, and trim angle
This section uses the mesh scheme verified in the previous section to conduct numerical simulation. The total resistance and navigation attitude of the planing trimaran model at
Fr∇ = 1.31, 1.57, 1.84, 2.1, 2.36, 2.62, 2.89, 3.15, 3.41, 3.67, 3.94, 4.2, 4.46, 4.72, 4.98 (conditions corresponding to the experimental test) are obtained. The numerical simulation and experimental test results of the dimensionless total resistance, the dimensionless dynamic sinkage, and trim angle against
Fr∇ are shown in
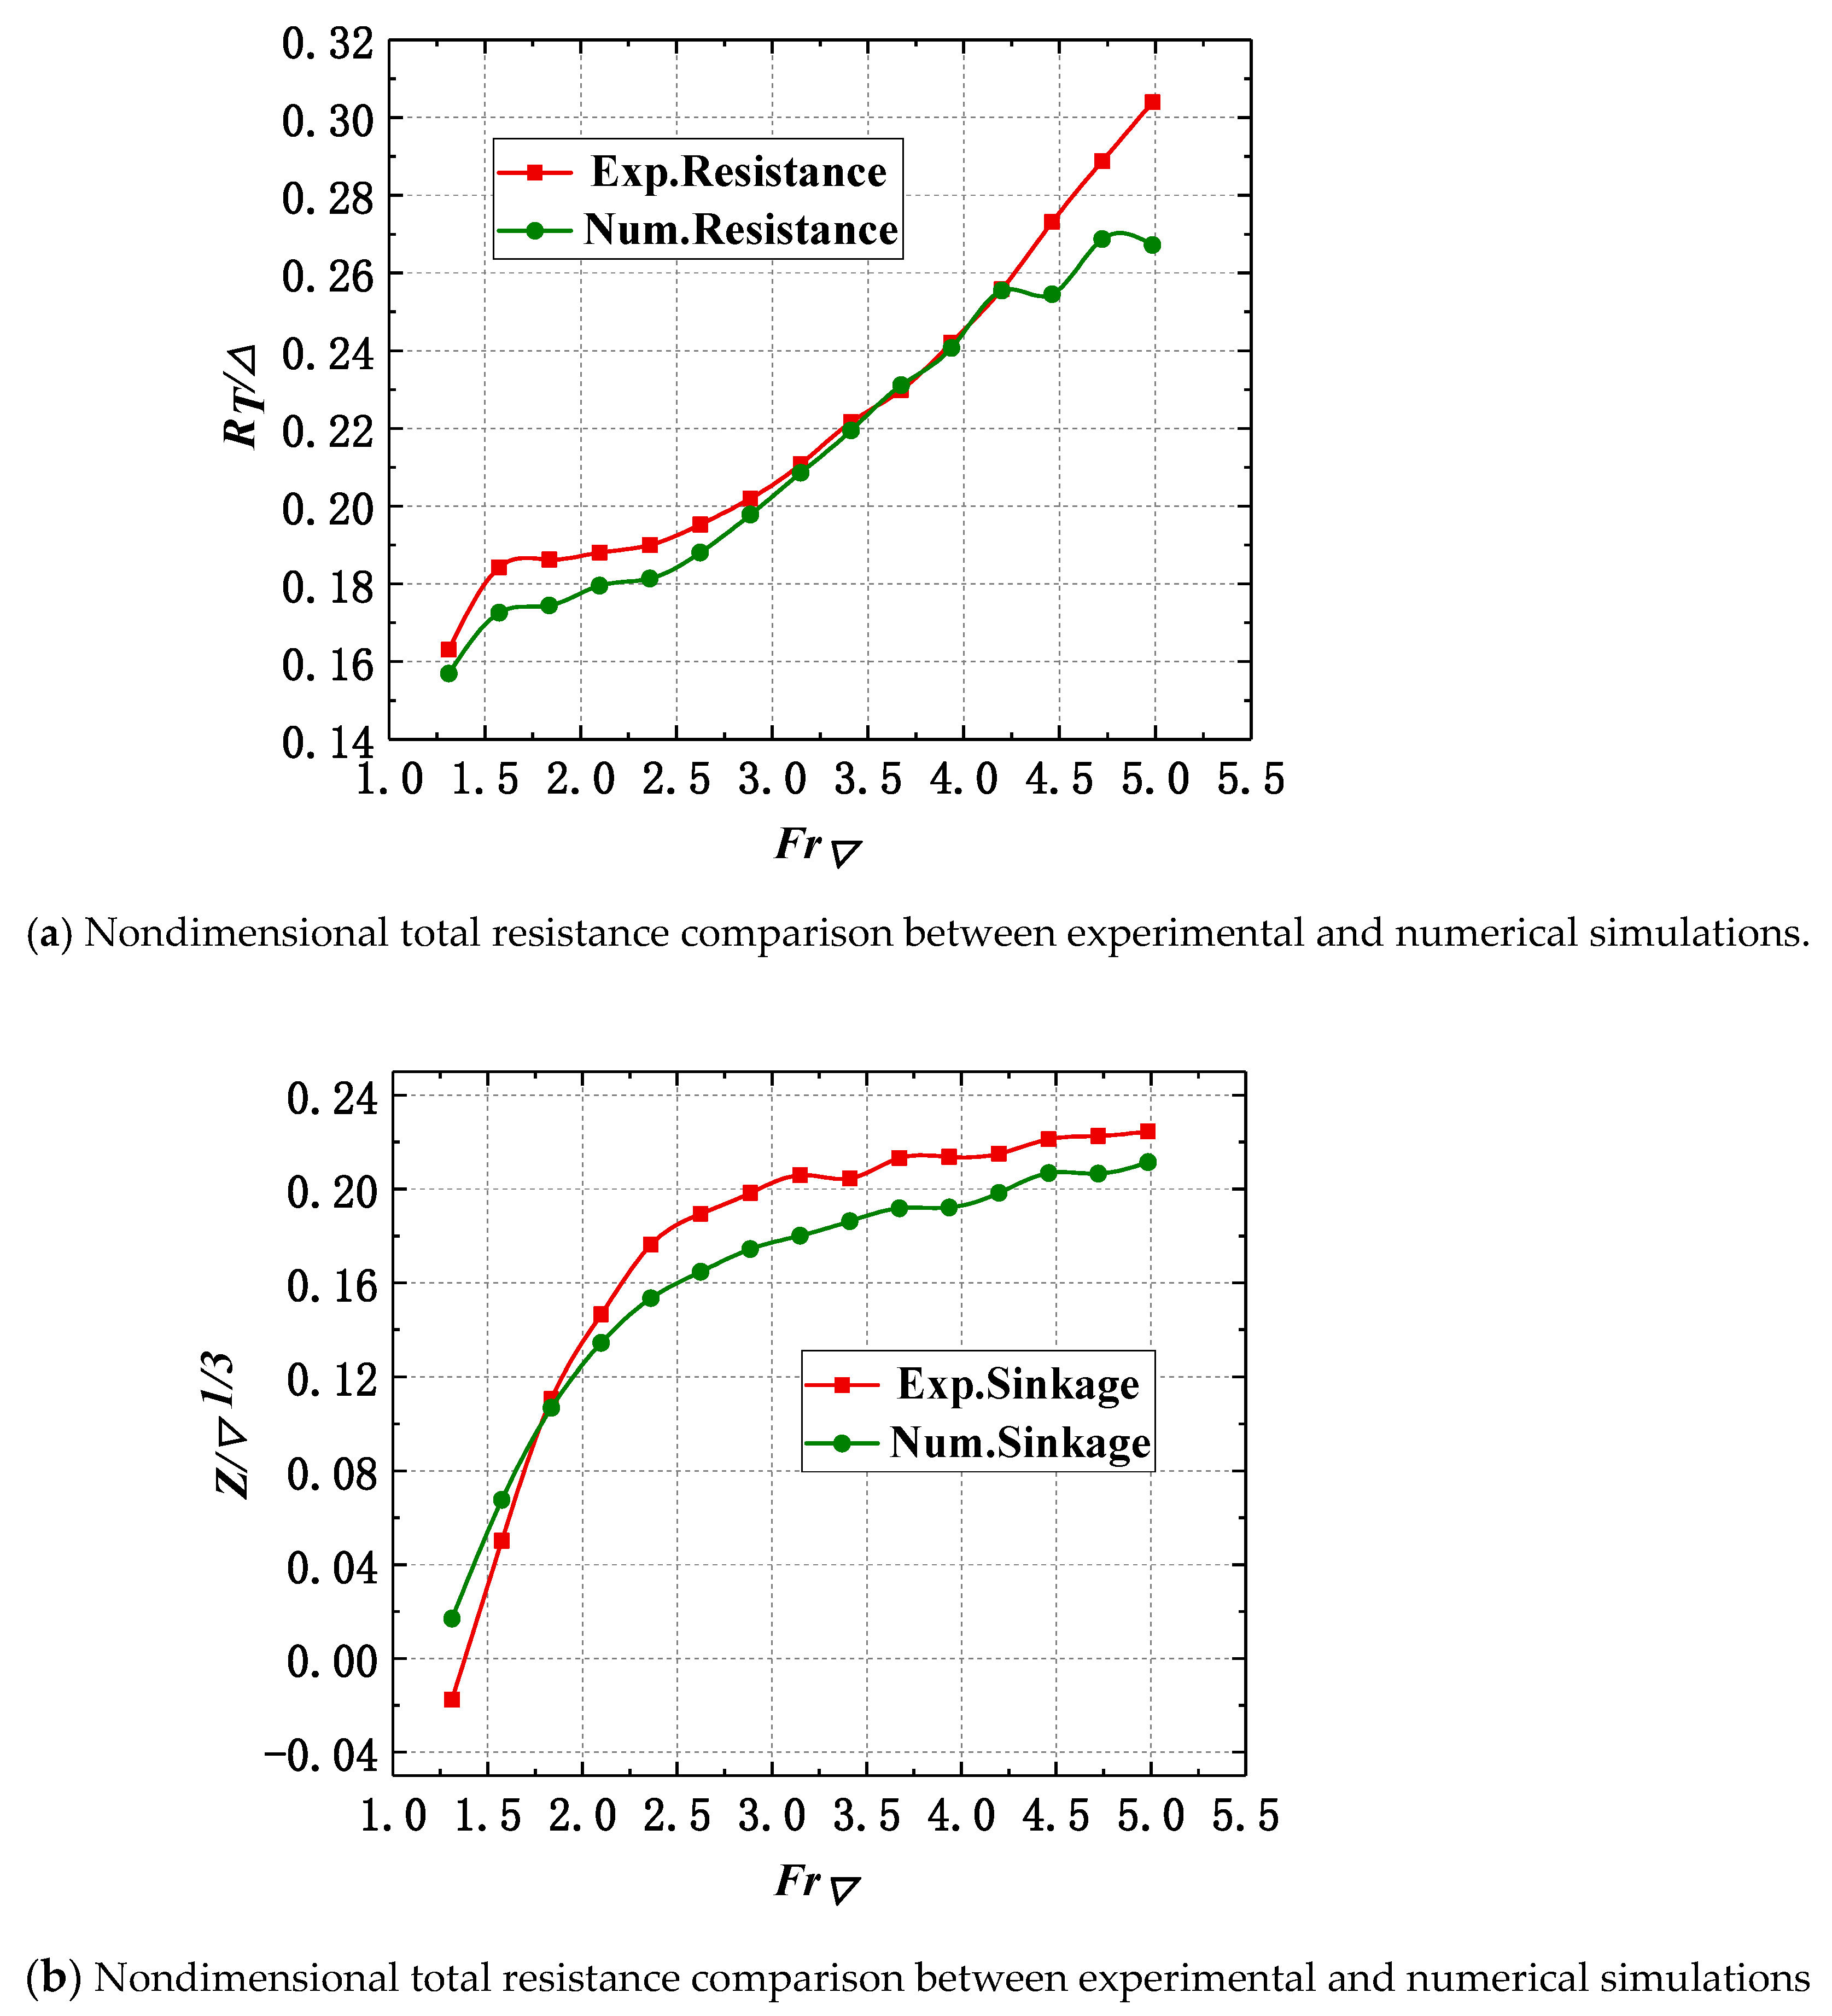
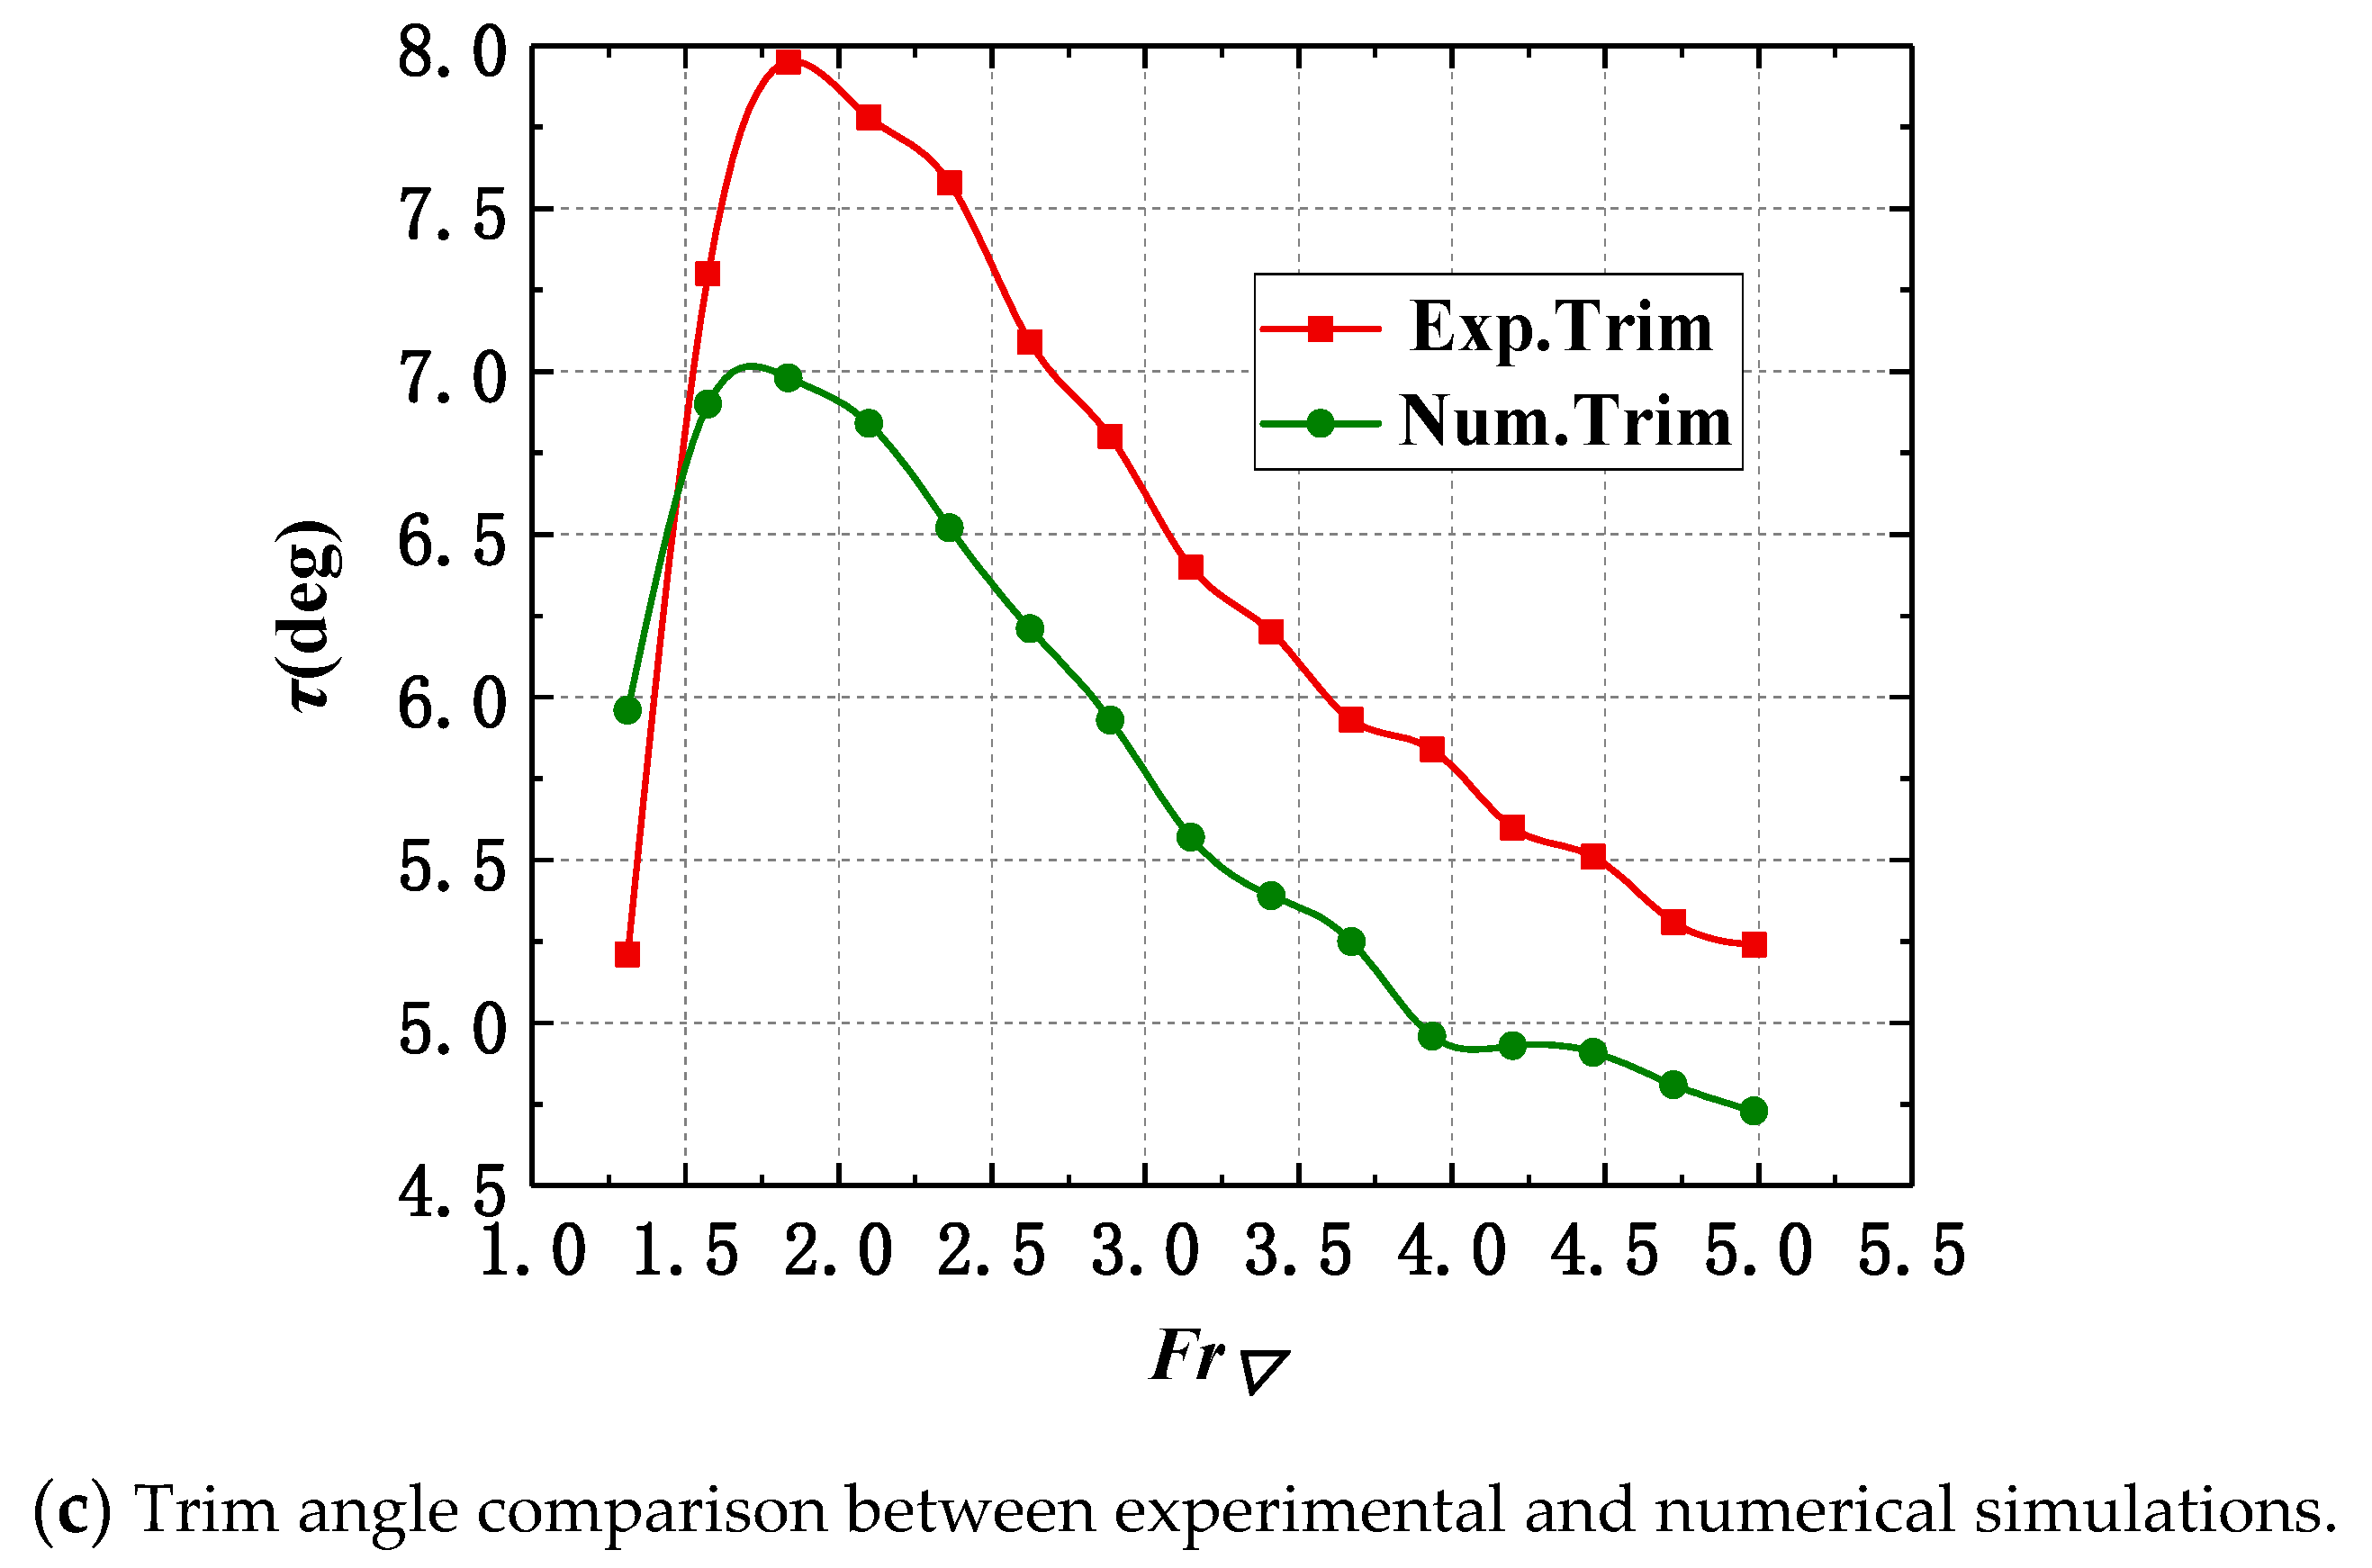
Figure 10.
It can be seen from
Figure 10a that the trend of numerical simulation results is consistent with the experimental test results. Moreover, the overall deviations of numerical simulation results and experimental results are generally small. The numerical simulation accurately predicted the resistance peak at the volume Froude number 1.57. For
Fr∇ < 4.5, the trend of the calculated value and the experimental test value remains highly consistent, and the error between the two methods decreases uniformly as the speed increases. In this interval, the largest error is 6.35% at the position of the resistance peak. However, for volume Froude number is greater than 4.46, compared with the experimental tests, the numerical results show significant distortion. Although the maximum error in this interval is 12.09% at
Fr∇ = 4.98, it can be considered that the calculated results are not accurate. In view of this phenomenon, the subsequent section will analyze the free surface and the pressure distribution on the bottom of the hull.
Firstly, the dynamic sinkage of the navigation attitude rises rapidly with
Fr∇ in numerical simulation. When
Fr∇ is greater than 2.5, the numerical value increases at a slower rate, and the numerical simulation results are almost the same as the experimental value (
Figure 10b). The calculated values of dynamic trim angle are in the same trend as the experimental test values, in which they increase sharply and then decrease slowly. However, the numerical simulation results are smaller than the experimental test values (
Figure 10c).
3.6.2. Analysis of Free Surface and Bottom Pressure
The wave pattern in the tunnel has a great influence on the hydrodynamic performance of the planing trimaran [
23]. The higher the speed, the more the interaction between the water flow in the tunnel and the hull is obvious. Next, this paper shows the free surface, the streamline, and pressure distribution around the planing trimaran model in numerical simulation when
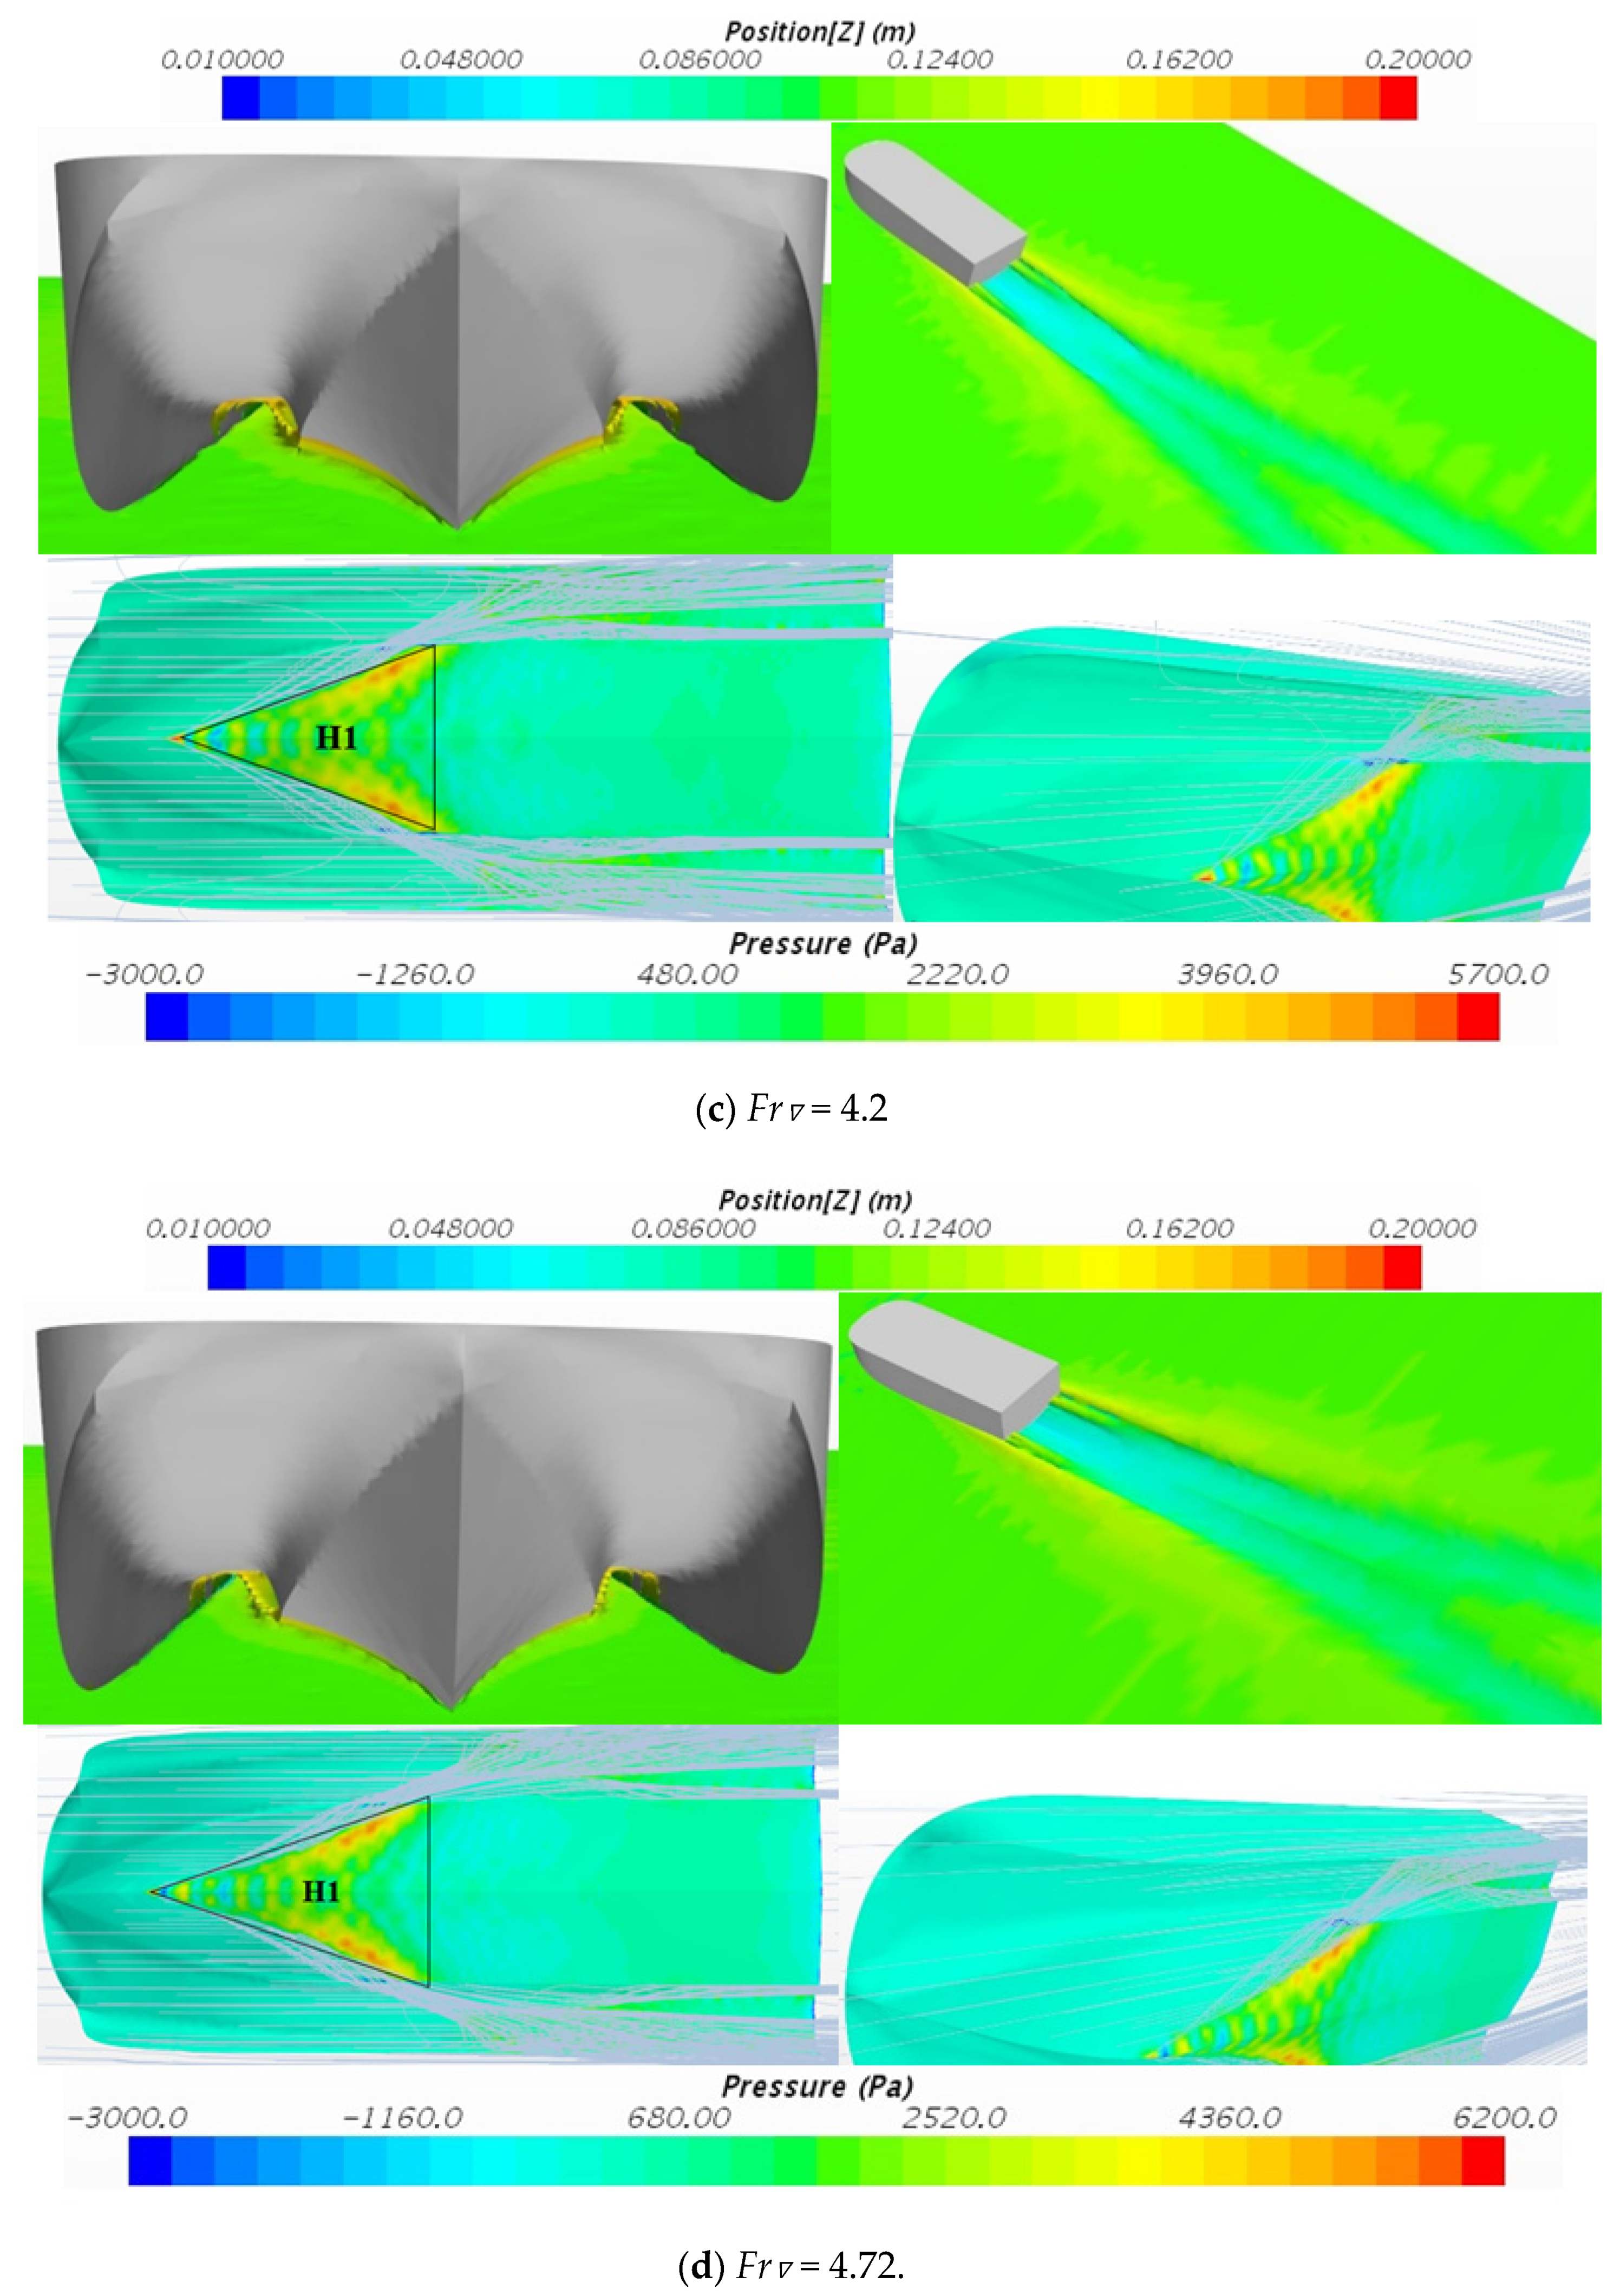
Fr∇ = 2.1, 3.15, 4.2, 4.72. This is done to explore the intrinsic mechanism of the hydrodynamic performance of the planing trimaran. Further, suggestions are given to improve the hydrodynamic performance of planing trimaran.
When
Fr∇ = 2.1 at the front end of the tunnel around the bell mouth, the free surface rolls along the bottom surface of the hull and a nonlinear phenomenon occurs. The current hits the main hull resulting in a triangular high-pressure area H1 at the front end of the bottom of the main hull. At the same time, due to the large trim angle of the model, the flow directly hits the front end of the straight section of the tunnel after passing through the bell mouth. This causes a high-pressure area H2, as shown in
Figure 11a. There is a little streamline at the roof of the tunnel and a little air passes through the tunnel. However, most of the air flow enters the bell mouth of the tunnel and then turns back, as shown by streamline A in
Figure 11a. A small amount of air passing through the tunnel will provide aerodynamic lift causing the hull to rise further.
When
Fr∇ = 3.15, the trim angle is further reduced. As can be seen from
Figure 11b, the high-pressure area H1 of the main hull moves forward, and the high-pressure area H2 of the straight section in the tunnel goes backward temporarily. At this time, the roof of the tunnel has been completely penetrated. Compared with
Fr∇ = 2.1, more streamlines pass through the tunnel and the roof of the tunnel is filled with air. However, air aerodynamic lift is no longer significant for lifting the hull. Under the action of gravity, the front structure of the model approaches the water surface causing the trim angle to decrease further.
When Fr∇ = 4.2, the trim angle is about 5 degrees currently. The triangle high-pressure area H1 of the main hull does not change significantly, but the high-pressure area H2 of the straight section of the tunnel completely disappears. The streamlines in the tunnel further increases and the air can pass smoothly. The model has been lifted to a certain height and would not rise any further. The navigation attitude of the model becomes stable. The air resistance of the hull tends to a fixed value. The resistance of the model is mainly derived from the resistance of the water flow, so the dimensionless resistance increases linearly with the volume Froude number.
When Fr∇ = 4.72, the free surface around the planing trimaran, the bottom streamline and pressure distribution are consistent with Fr∇ = 4.2. However, the pressure value of the model is further increased. The triangular high-pressure area H1 of the main hull still exists. Under this volume Froude number, the numerical dynamic sinkage is consistent with the experimental test value. However, the trim angle value is quite different and the numerical result is smaller than the experimental test value. In the process of numerical simulation, the interaction between the bottom of the main hull and the water flow decreases. The result indicates that the pressure value is less than the actual value. Finally, the total resistance value differs from the experimental test value.
Pressure distribution around the hull surface is a very intuitive way to observe the resistance performance of the hull. Yousefi et al. [
34] numerically studied the Cougar hull and modified hull form with two tunnels. The comparison of the modified hull with pressure distribution of the original hull, showed a drop in resistance by 14% at the speed of 60 knots. It should be noted that the modified hull has a smaller area for high pressure in this case. The pressure distribution analysis can benefit the planing trimaran design.
The triangular high-pressure area H1 in the front of the main hull exists and has a large area for all Fr∇. If the shape of the bottom of the model is changed, the resistance performance of the model may be improved. Next, the shape of the bottom of the model was changed according to the above analysis. Numerical simulation scheme introduced in this earlier was used to predict the hydrodynamic performance of the improved model.
4. Improved Hull and Hydrodynamic Performance Prediction
The planing trimaran is composed of a central drainage body and two sheets on both sides, and the central drainage body and the sheet form two tunnels. The central drainage body of the planing trimaran provides the main buoyancy for the model when the hull is stationary or in the navigation state. In the sailing state, the tail of the central drainage body, which is a wedge-shaped surface, becomes the main sliding surface of the planing trimaran model. This provides most of the lift for the hull. The hydrodynamic performance of planing trimaran is affected by the shape of the central drainage body.
Based on the analysis in the previous section, and in accordance with the design idea of reducing the triangular high-pressure area H1, the deadrise angle of the central drainage body was increased and a wave-piercing bow was also introduced. Then a numerical simulation method was utilized in predicting its hydrodynamic performance.
4.1. Improved Hull
The central drainage body of the planing trimaran model uses the single planing craft model in Wang Shuo et al. [
35] as the mother-type and improve the design in reference to its body plan. The single planing craft body plan is shown in
Figure 12a. It can be seen from the figure that the front part of the single planing craft model is thin and has a wave-piercing bow. The deadrise angle of the bottom of the central drainage body gradually decreases from the forward to the stern.
The process of improving hull shape is shown in
Figure 12b. At the top left of
Figure 12b is Model a, which is used for the experiments and numerical simulations described in
Section 2.1. The three-dimensional single planing craft is shown in the right of
Figure 12b. First, the hull line of each station of the central drainage body of Model a is modified to the hull line of the single planing craft. Then circular arcs and straight lines were used to connect the central drainage body and the two side sheets. Finally, the height and beam of the tunnel were slightly adjusted to ensure that the main dimensions of the hull remain unchanged. Model b at the bottom left of
Figure 12b is the final model.
The body plan and front view of Model b is shown in
Figure 12c. As can be seen in
Figure 12c, the front end of the center drainage body of Model b was thin. The central drainage body is changed into the wave-piercing shape. The deadrise angle of the bottom of the planing trimaran model was increased from the original 13 deg to 21 deg. In order to ensure that other main dimensions such as the total displacement and the length overall remains unchanged, the beam overall has been reduced. The differences between the main dimensions of Model a and Model b are shown in
Table 6.
4.2. Mesh and Time-Step Sensitivity Analysis
Mesh and time-step sensitivity analysis plays an important role in the numerical simulation. A fine mesh can always bring credible results in STARCCM+, but, at the same time, increases the computational cost and time consumption due to the large element number. Small time-step makes the results more accurate but also increase the calculation time. In the current investigation, three hull surface mesh sizes were used to mesh sensitivity analysis. The time-step used in the sensitivity analysis is a function of the hull speed, according to the following ITTC equation [
36].
, L is the length overall of Model b, U is 9 m/s at
Fr∇ = 4.72. Mesh and time-step sensitivity analysis results in the
Table 7.
In the
Table 7, compared to the results of medium mesh, the deviation of total resistance, sinkage and trim angle at other mesh size does not exceed 3.7%, 1.3%, and 4%, respectively. Using the same comparison method at time-step sensitivity study, the deviation of total resistance, sinkage and trim angle does not more than 4.4%, 1.7%, and 2.8%, respectively. The study shows that under the medium mesh and the 0.001 s time-step, the results obtained in this numerical scheme meet the mesh and time-step independence requirements.
4.3. Numerical Results and Analysis of Hydrostatic Performance of Improved Hull Type
This section uses the above numerical simulation scheme to predict the hydrodynamic performance of the improved hull Model b at seven (7) operating conditions of Fr∇ = 1.57, 2.1, 2.62, 3.15, 3.67, 4.2, and 4.72.
Figure 13 shows a plot of the numerical simulation results of Model a and Model b against
Fr∇. Model b and Model a in this section represents the improved hull and the original hull, respectively. It can be seen from
Figure 13 that the trend of Model a and Model b in regards to total resistance dimensionless number, dynamic sinkage dimensionless number, and dynamic trim angle change with
Fr∇ is consistent. The resistance peak of Model b is more obvious in the dimensionless number of total resistance with
Fr∇. To volume Froude numbers ranging from 1.57 to 4.72, the total resistance of Model b decreases in comparison to Model a. The minimum value is 6.33%, and the maximum value is 22.78%. The total resistance reduction is small at low speed. When Froude numbers are greater than 2.62, the total resistance reduction effect is obvious. In the navigation attitude, the dynamic sinkage and trim angle have also been reduced. At low speeds, the maximum reduction is 32.21%. However, the dynamic sinkage is reduced generally by around 5% at high speeds. The reduction of dynamic trim angle is about 50%.
It can be seen from the above that when Fr∇ > 2.1, especially in the high-speed sailing state, the hydrodynamic performance is significantly improved. In Model a, due to the existence of two tunnels, the air cushion for planing trimaran is formed in advance. This reduces its total resistance. The central drainage body of Model b adopts wave-piercing shape, further reducing its resistance and improving the navigation attitude. This could be attributed to the reduction in the interaction between the current and the main hull.
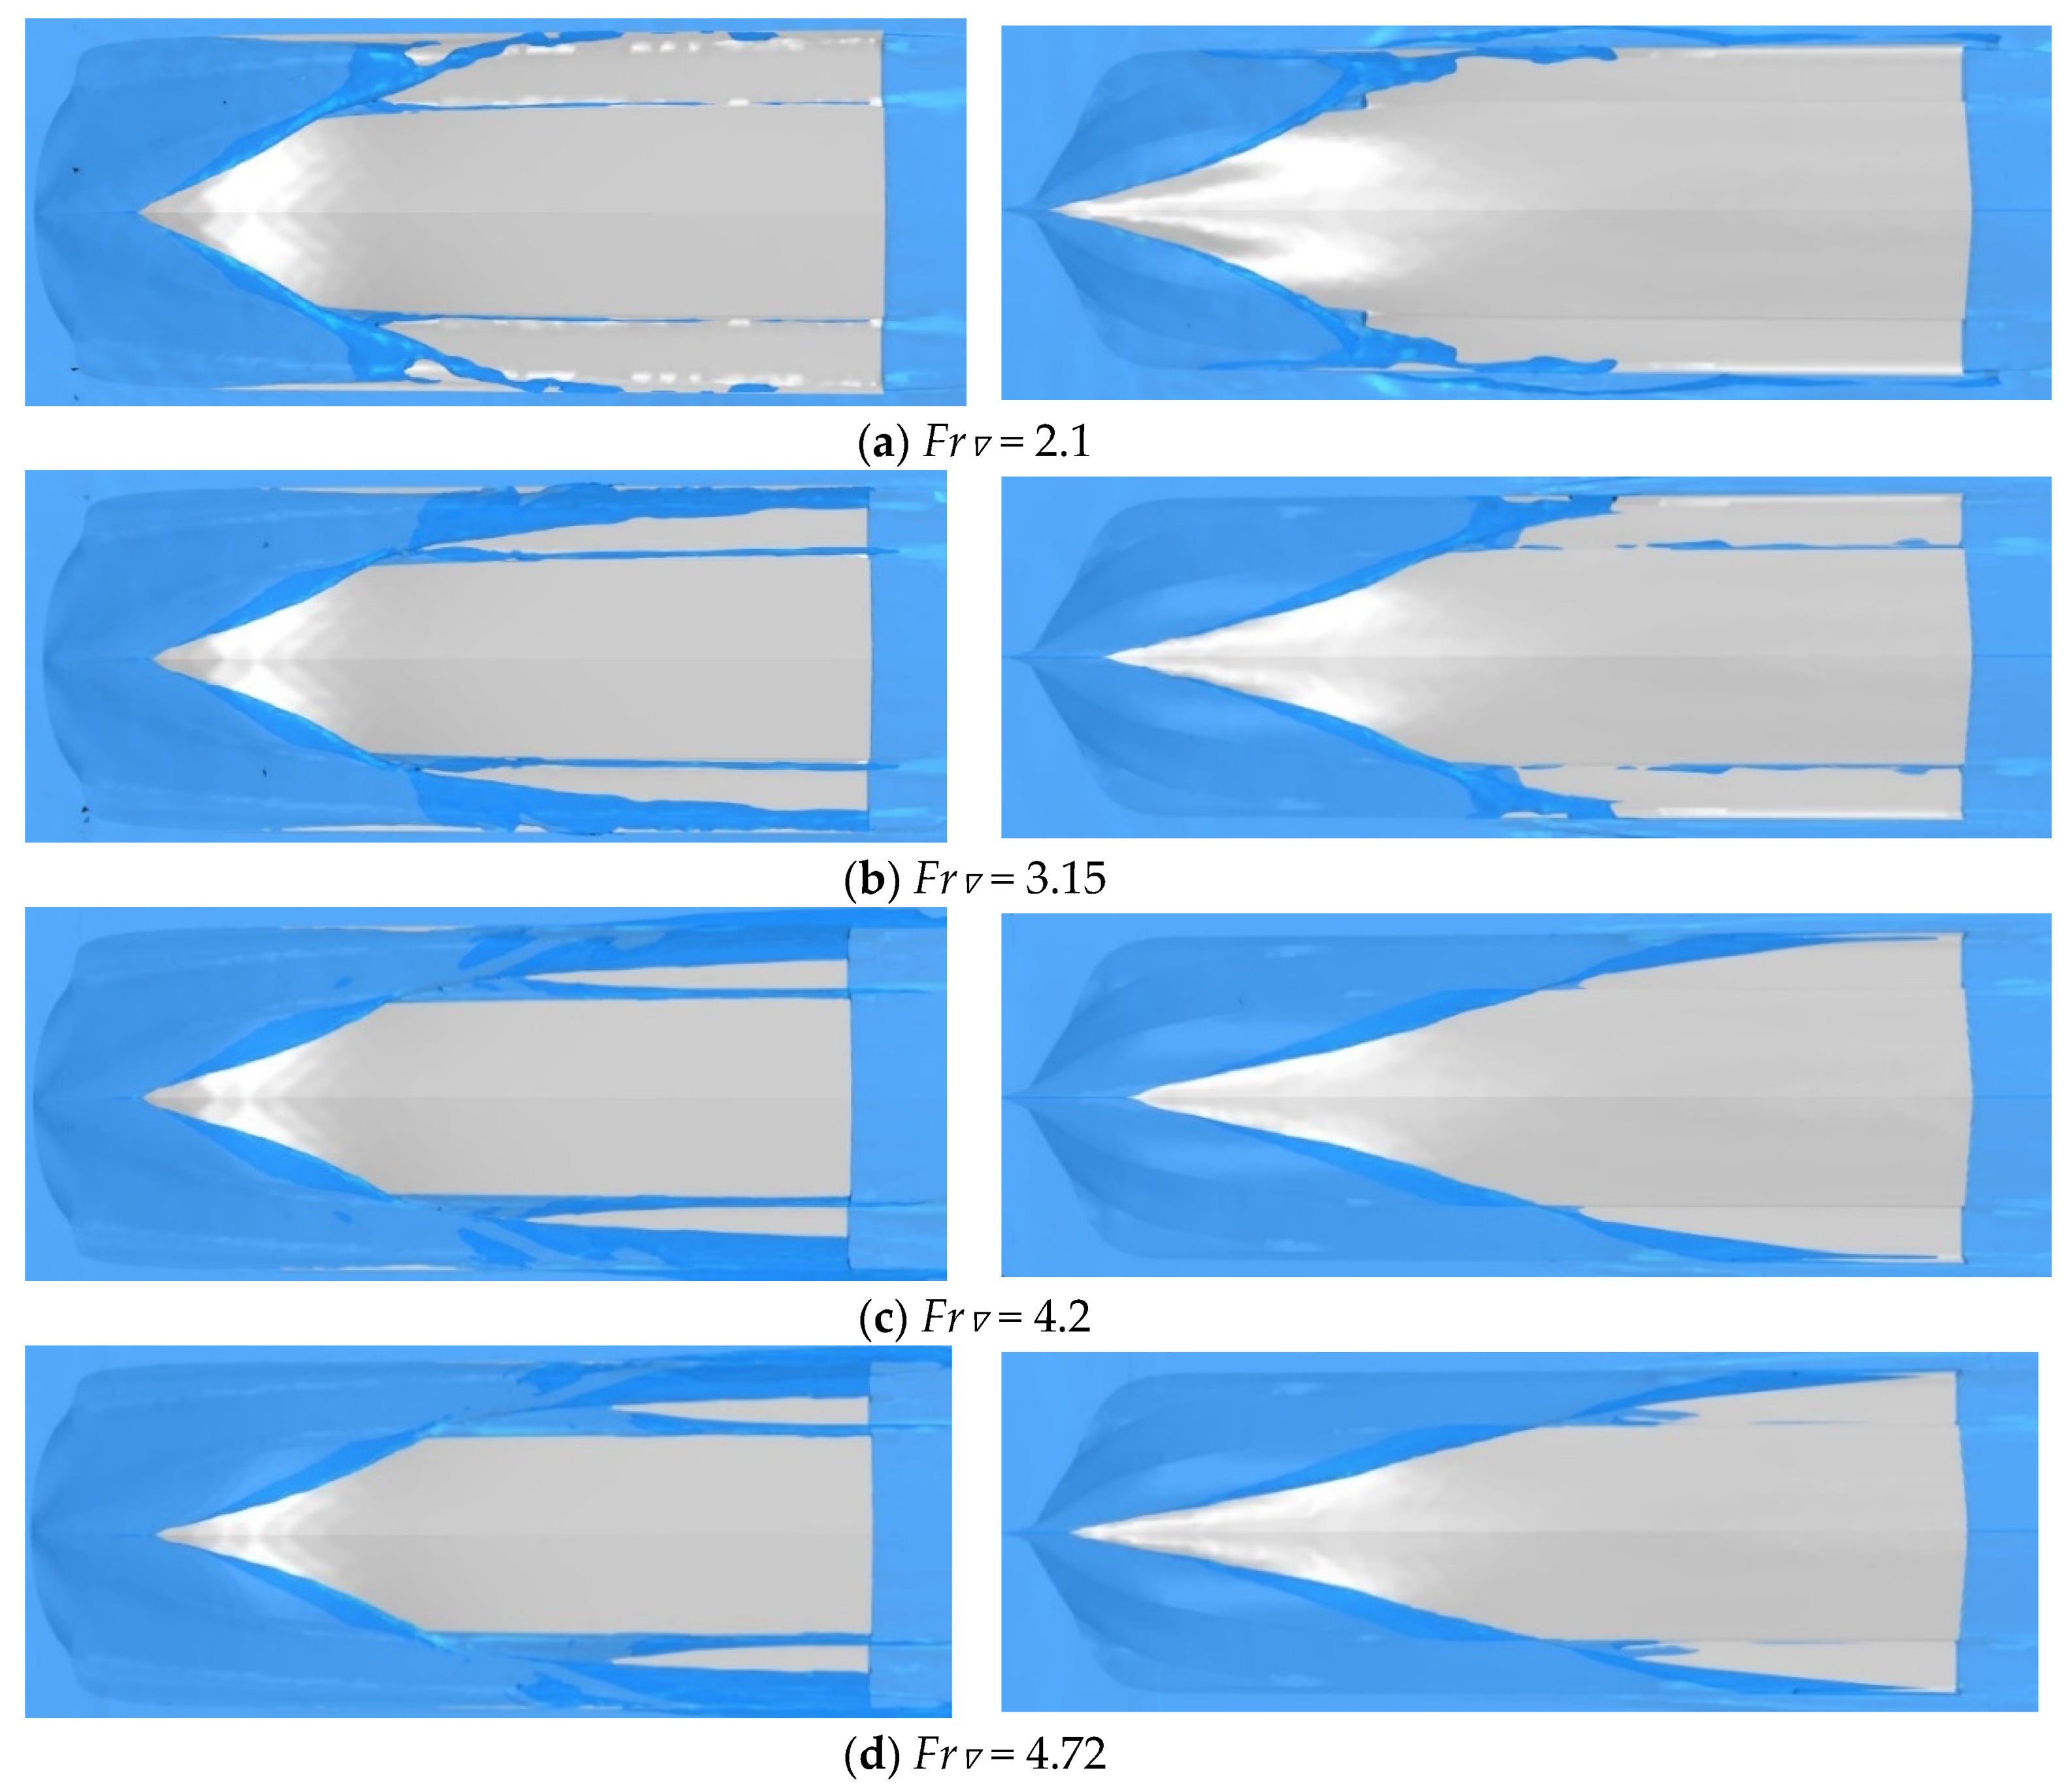
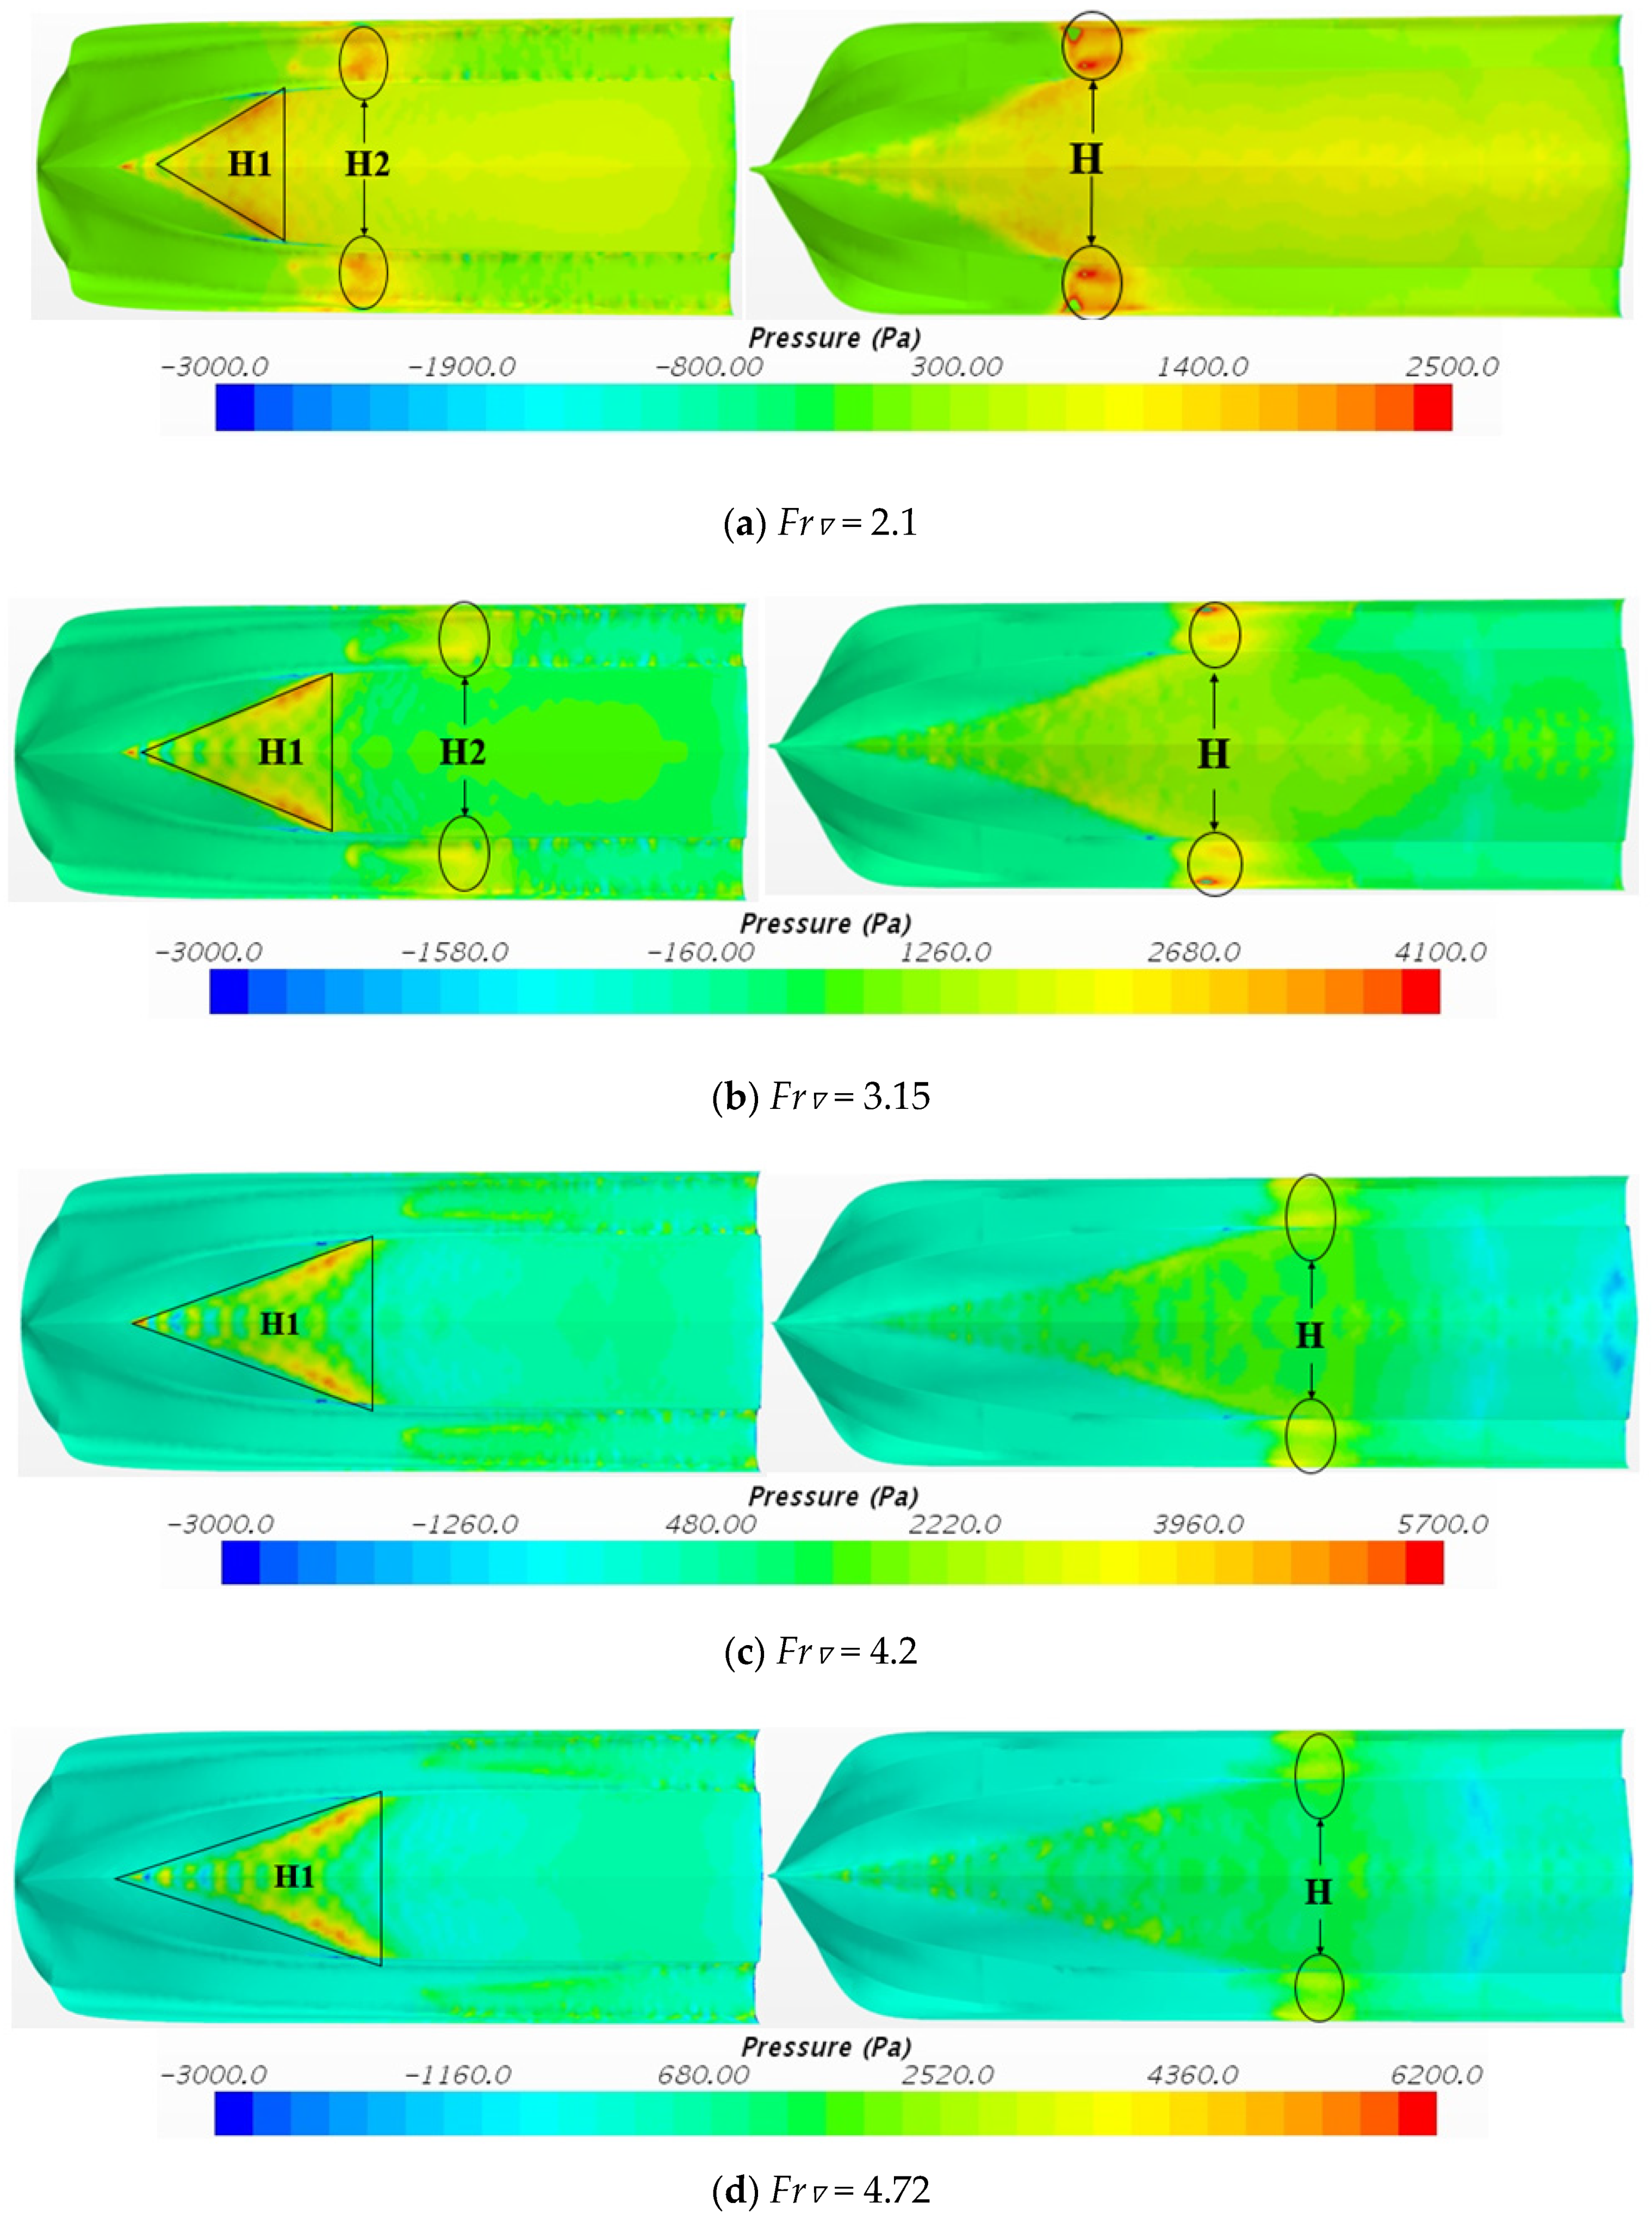
4.4. Bottom Wetted Area and Pressure Distribution Analysis
Bottom wetted area and pressure distribution are important parameters to evaluate the performance of hull shape changes. In numerical simulation, these parameters can be obtained through the postprocessing technology of STARCCM+ software. Here, the bottom wetted area (
Figure 14) and pressure distribution (
Figure 15) of Model a and Model b will be analyzed in the numerical simulation results when
Fr∇ = 2.1, 3.15, 4.2, 4.72.
Figure 14 shows the bottom wetted area of Model a (left) and Model b (right). In
Figure 14, the blue free surface and gray hull are viewed from the bottom of the hull, and the bright part of the hull in the picture is the wetted surface area. It can be observed from the figure that the position where Model b cuts the free surface is more forward than that of Model a. The main reason is that model b has a wave-piercing bow. However, as the speed increases, the wet bottom wetted area of model b is almost the same size as Model a or slightly increases.
Figure 15 shows the bottom pressure distribution of Model a (left) and Model b (right). In
Figure 15, the bottom pressure distribution of two hull types at the same speed were observed under the same pressure scale. As the speed increases, the high-pressure area H1 marked in
Figure 15 at the front of the central drainage body of Model a reduces or even disappears in Model b. In the straight section of the tunnel, the high-pressure area H marked in
Figure 15 in Model b always exists at different speeds. At high speed, pressure and area of H of Model b are much smaller than that of H1 of Model a. It can be analyzed that Model b uses a wave-piercing bow to reduce the front high-pressure area of the central drainage body, which in turn causes the total resistance of model b to drop. This verifies the design ideas in the previous section.
4.5. Relationship between Main Hull Shape and Hydrostatic Performance
In the previous studies on the planing trimaran, the research focus was to improve the hydrodynamic performance by improving the design parameters of the tunnel. In Jiang Yi et al. [
22], five (5) different planing trimaran models were obtained by modifying the tunnel height and tunnel width. The comparison of the resistance shows that the tunnel lifting force has a direct impact on the total resistance performance. The more the tunnel lifting force is generated, the greater the reduction in total resistance. The average total resistance reduction is 6%. In literature Jiang Yi et al. [
23], designed three planing trimaran models with different tunnel lengths. The results show that increasing the length of a straight segment by 0.05 L can reduce the average total resistance of the model by up to 6.9%. However, another research idea for the planing trimaran is adopted in the present work. The front shape of the central drainage body was changed from the original flat shape to a wave-piercing bow. And the deadrise angle of the bottom of the main hull is increased to 21 deg. In the numerical simulation results of the pressure distributions for each volume Froude number, the triangular high-pressure region becomes smaller or even disappears. This area is located at the front end of the central drainage body of the original hull Model a. The numerical simulation results showed that the average total resistance is reduced by 16.43%, and the navigation attitude is also improved.
Based on the above analysis, we can see that the parameters and shape of the central drainage body have an enormous influence on the hydrodynamic performance of the planing trimaran.
5. Conclusions
In this study, the effects of introducing a wave-piercing bow to the planing trimaran are investigated. The focus was on the hydrodynamic characteristics of the center drainage body and its influence on the hydrodynamic performance of the planing trimaran. The combination of experiments test and numerical simulations methods for the planing trimaran were carried out. In the towing tank, the total resistance, dynamic sinkage, and trim angle of planing trimaran were measured. The dynamic trim angle rapidly increased to the maximum value at low-volume Froude number of the experimental test result of the model. However, due to the influence of the tunnel, the dynamic trim angle rapidly decreased for high volume Froude numbers. The planing trimaran model was lifted to a stable state by the air cushion.
The complex flow around the planing trimaran model is simulated. The RANSE solver and the DFBI six-degree-of-freedom motion solver free to dynamic sinkage and trim are used in combination. A validation study on the applicability of this numerical simulation method is conducted via comparison with experimental data. The average deviations of total resistance, sinkage, trim angle between experiments and numerical simulation methods were 3.96%, 5.61%, and 9.94%, respectively. The free surface, bottom streamlines and pressure distribution around the hull were obtained from the numerical simulations. An analysis on the interaction between the current and the model is also presented. It is important to note that at the front of the center drainage body there is always a triangular high-pressure area.
In the present work, numerical simulation methods have also been used to analyze the hydrodynamic performance of the planing trimaran of wave-piercing shaped central drainage body. Both experimental tests and numerical simulations were performed for Model a, whereas only numerical simulations were conducted for the redesigned Model b. The numerical simulation results of the total resistance, sinkage and trim angle of Model b are compared with Model a. The pressure information obtained in the postprocessing procedure reveals that the triangular high-pressure area presented in Model a became smaller or even disappears. The minimum total resistance reduction is 6.33% and the maximum is 22.78%. The dynamic trim angle reduction is about 50%. These results indicate that the shape of the central drainage body has an effect on the hydrodynamic performance of the planing trimaran model. Changing the shape of the central drainage body of the planing trimaran is a feasible way to significantly improve its hydrodynamic performance.


