Long-Term Observations of Beach Variability at Hasaki, Japan

 ,
, 
Abstract
1. Introduction
2. Materials and Methods
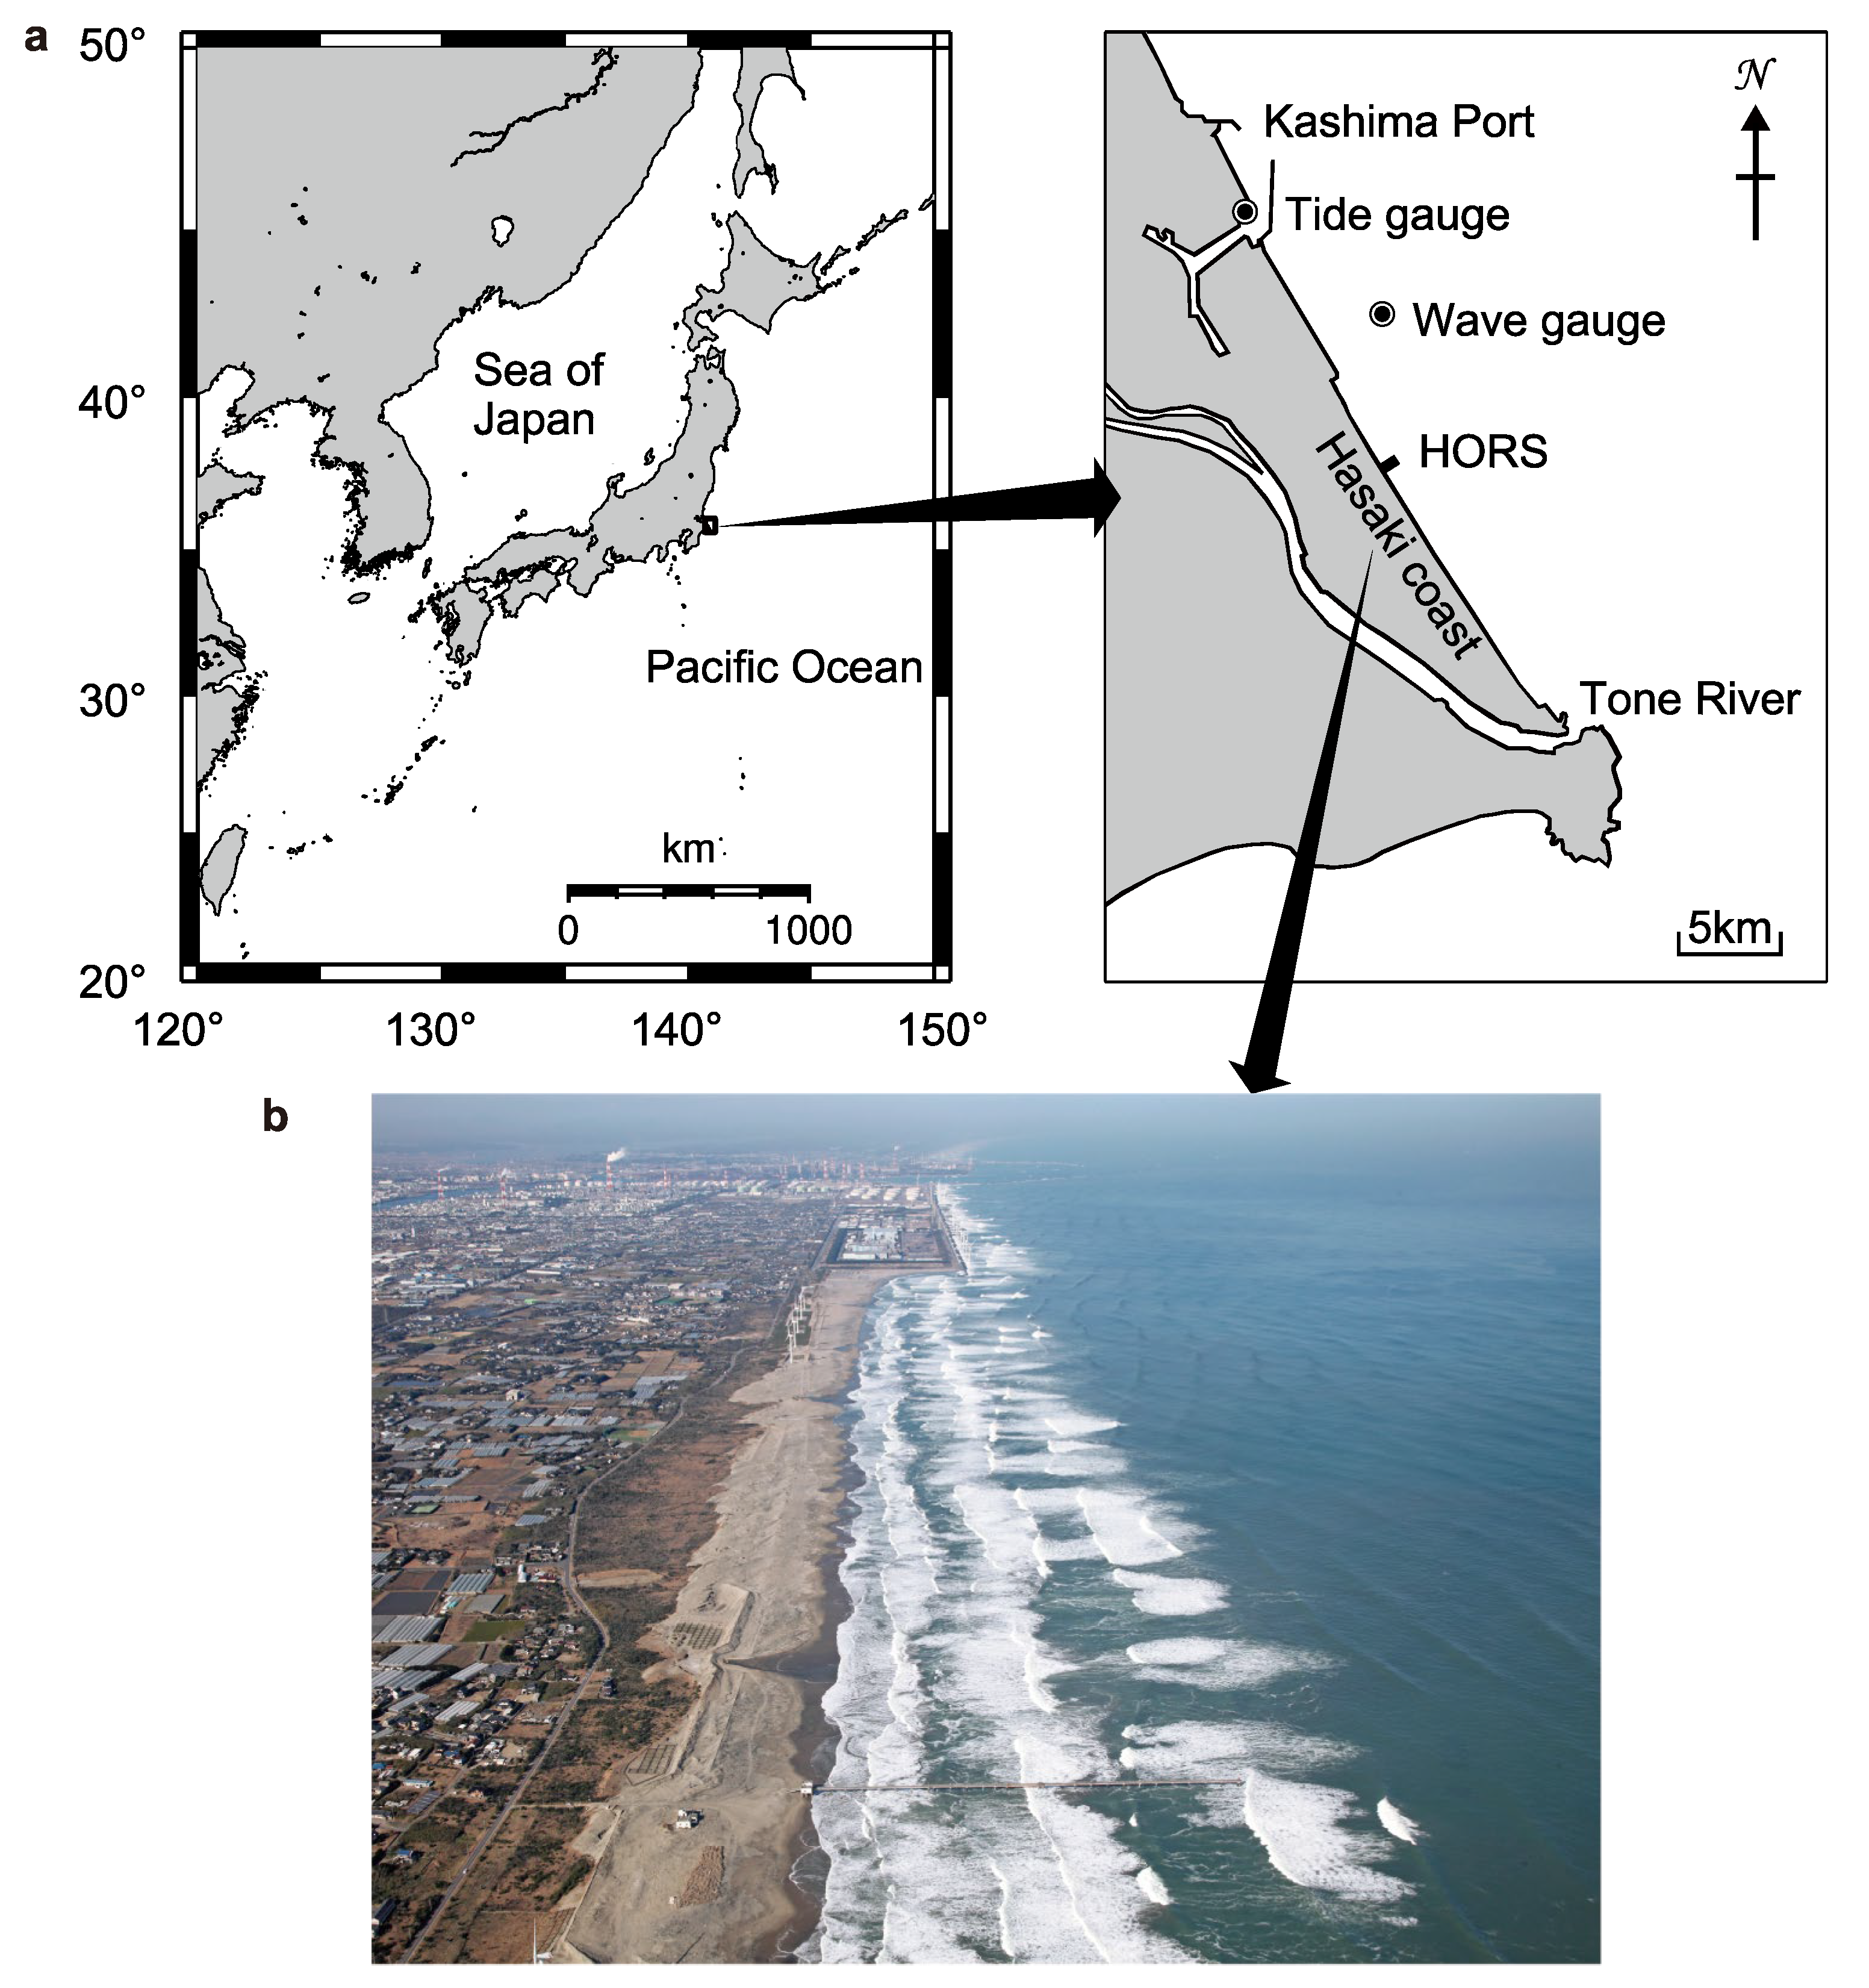
2.1. Study Site
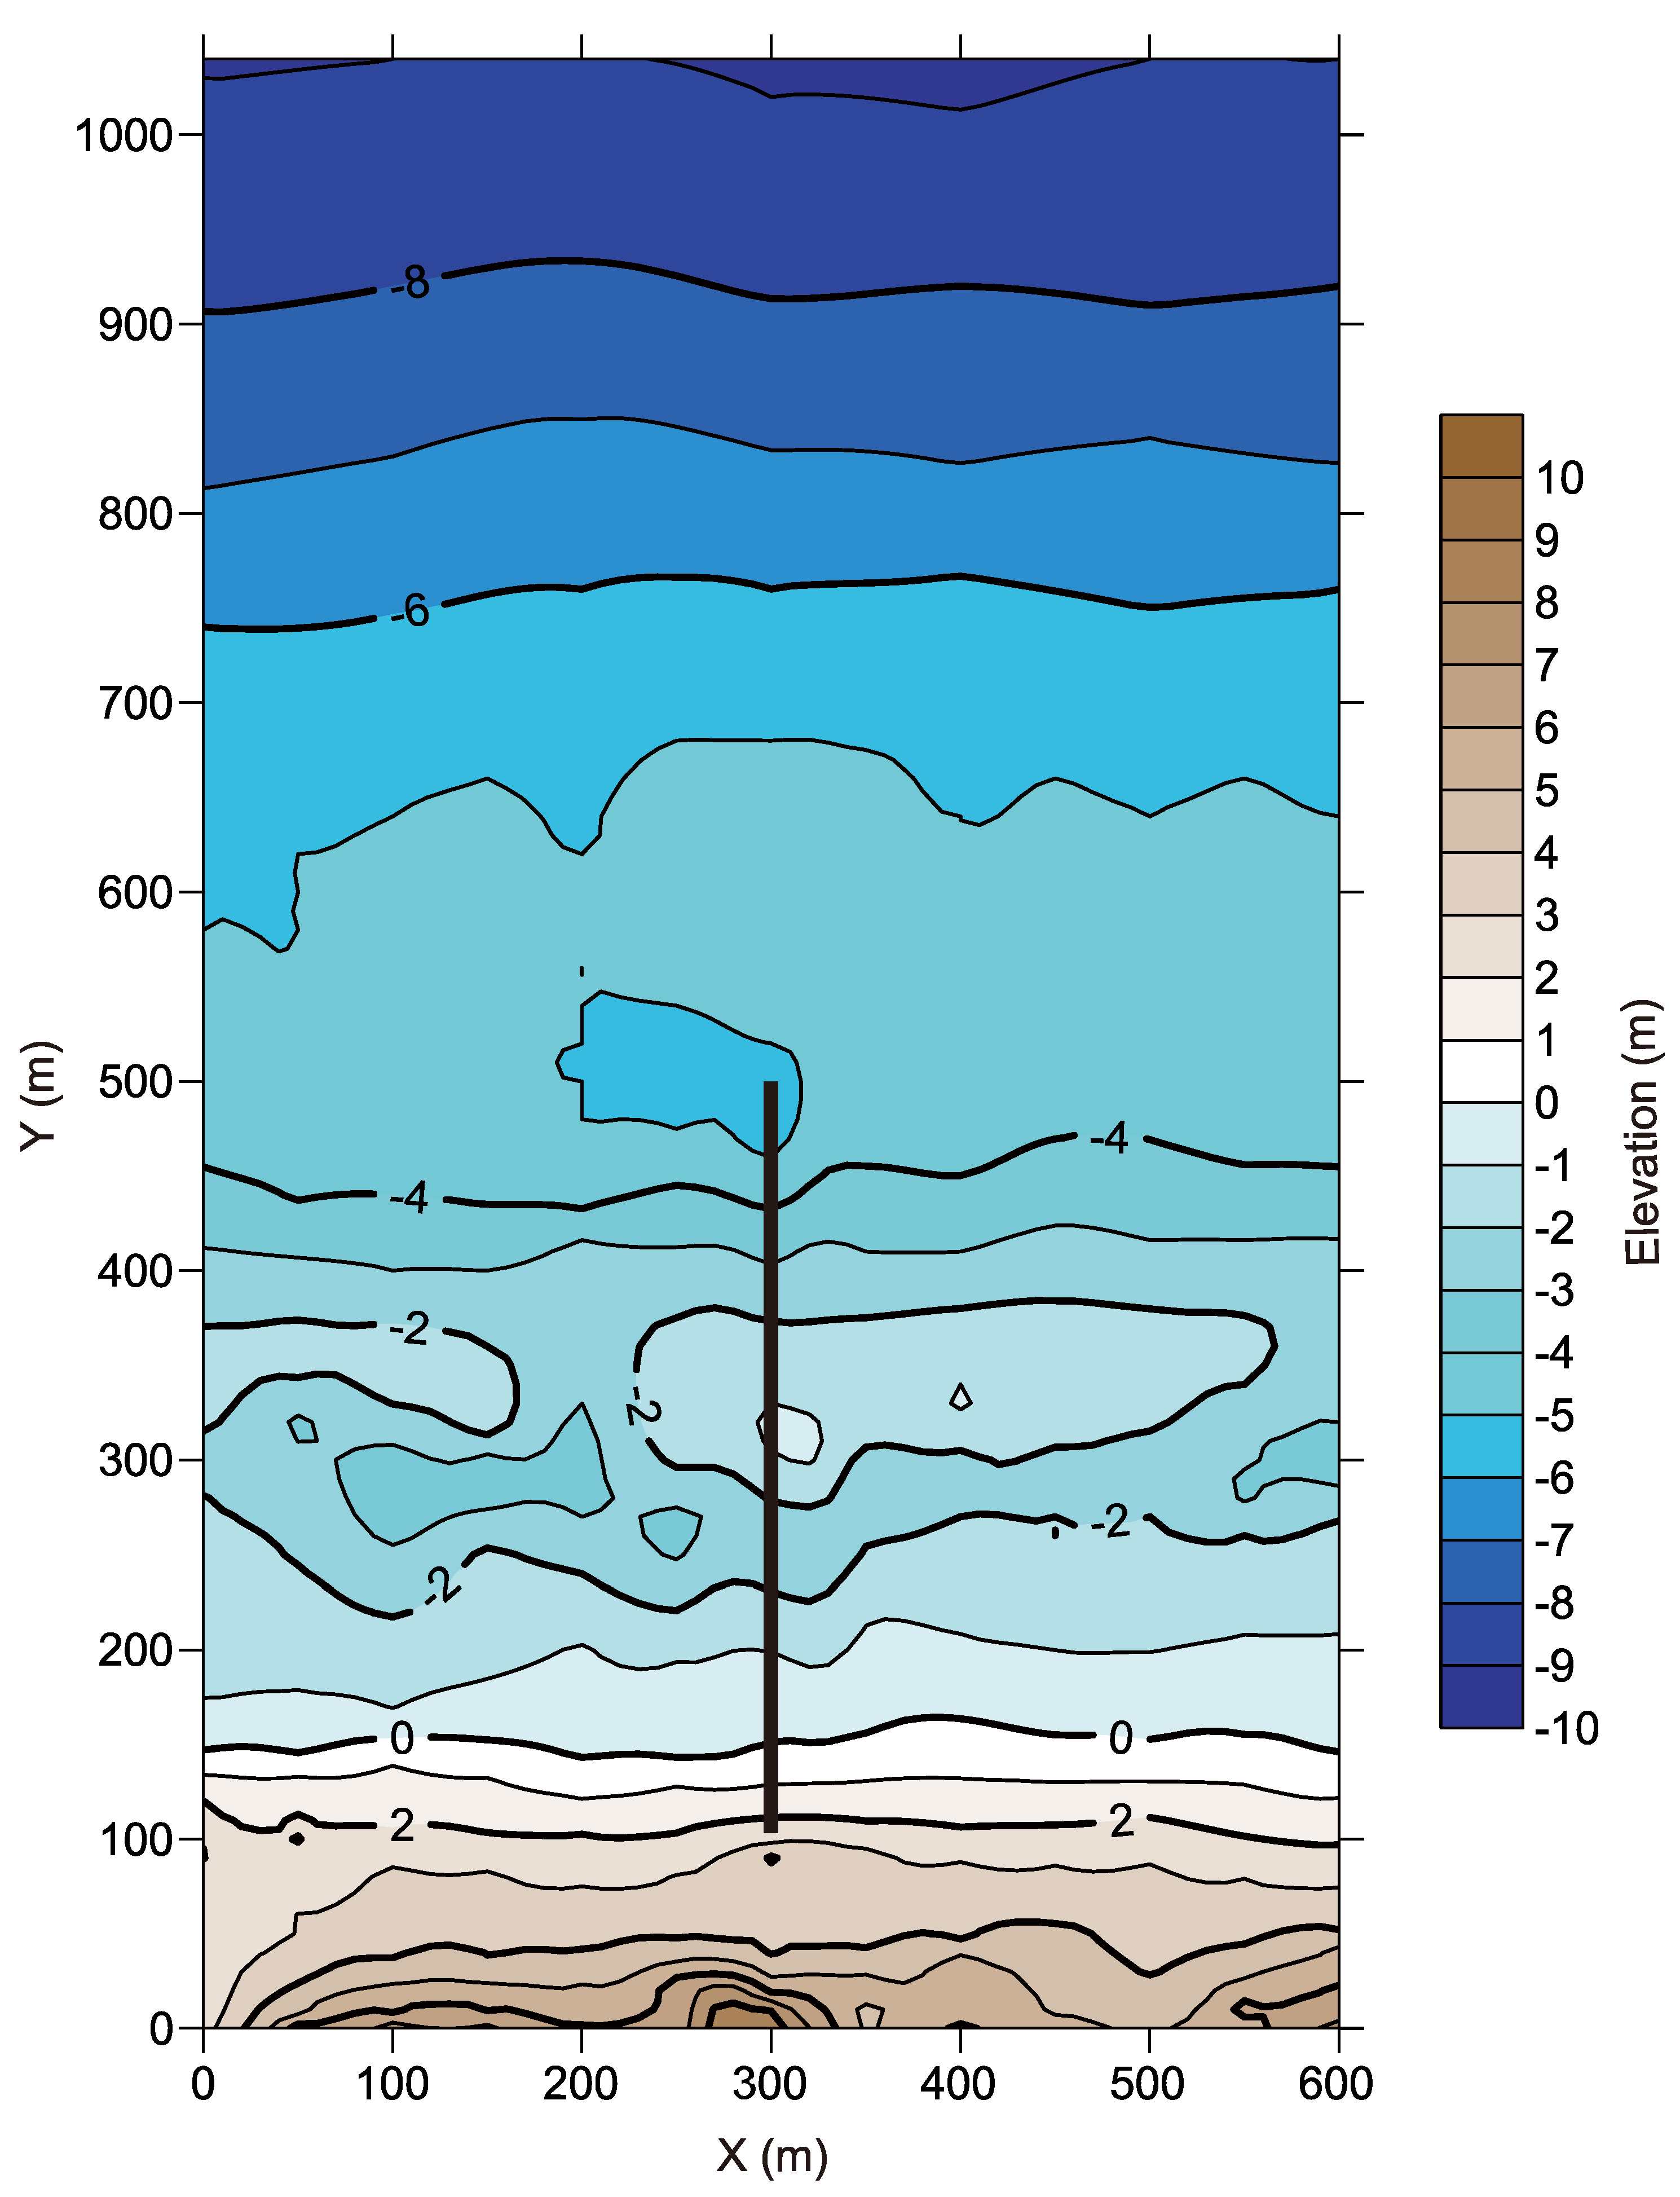
2.2. The Pier
2.3. Method of Beach Profile Measurement
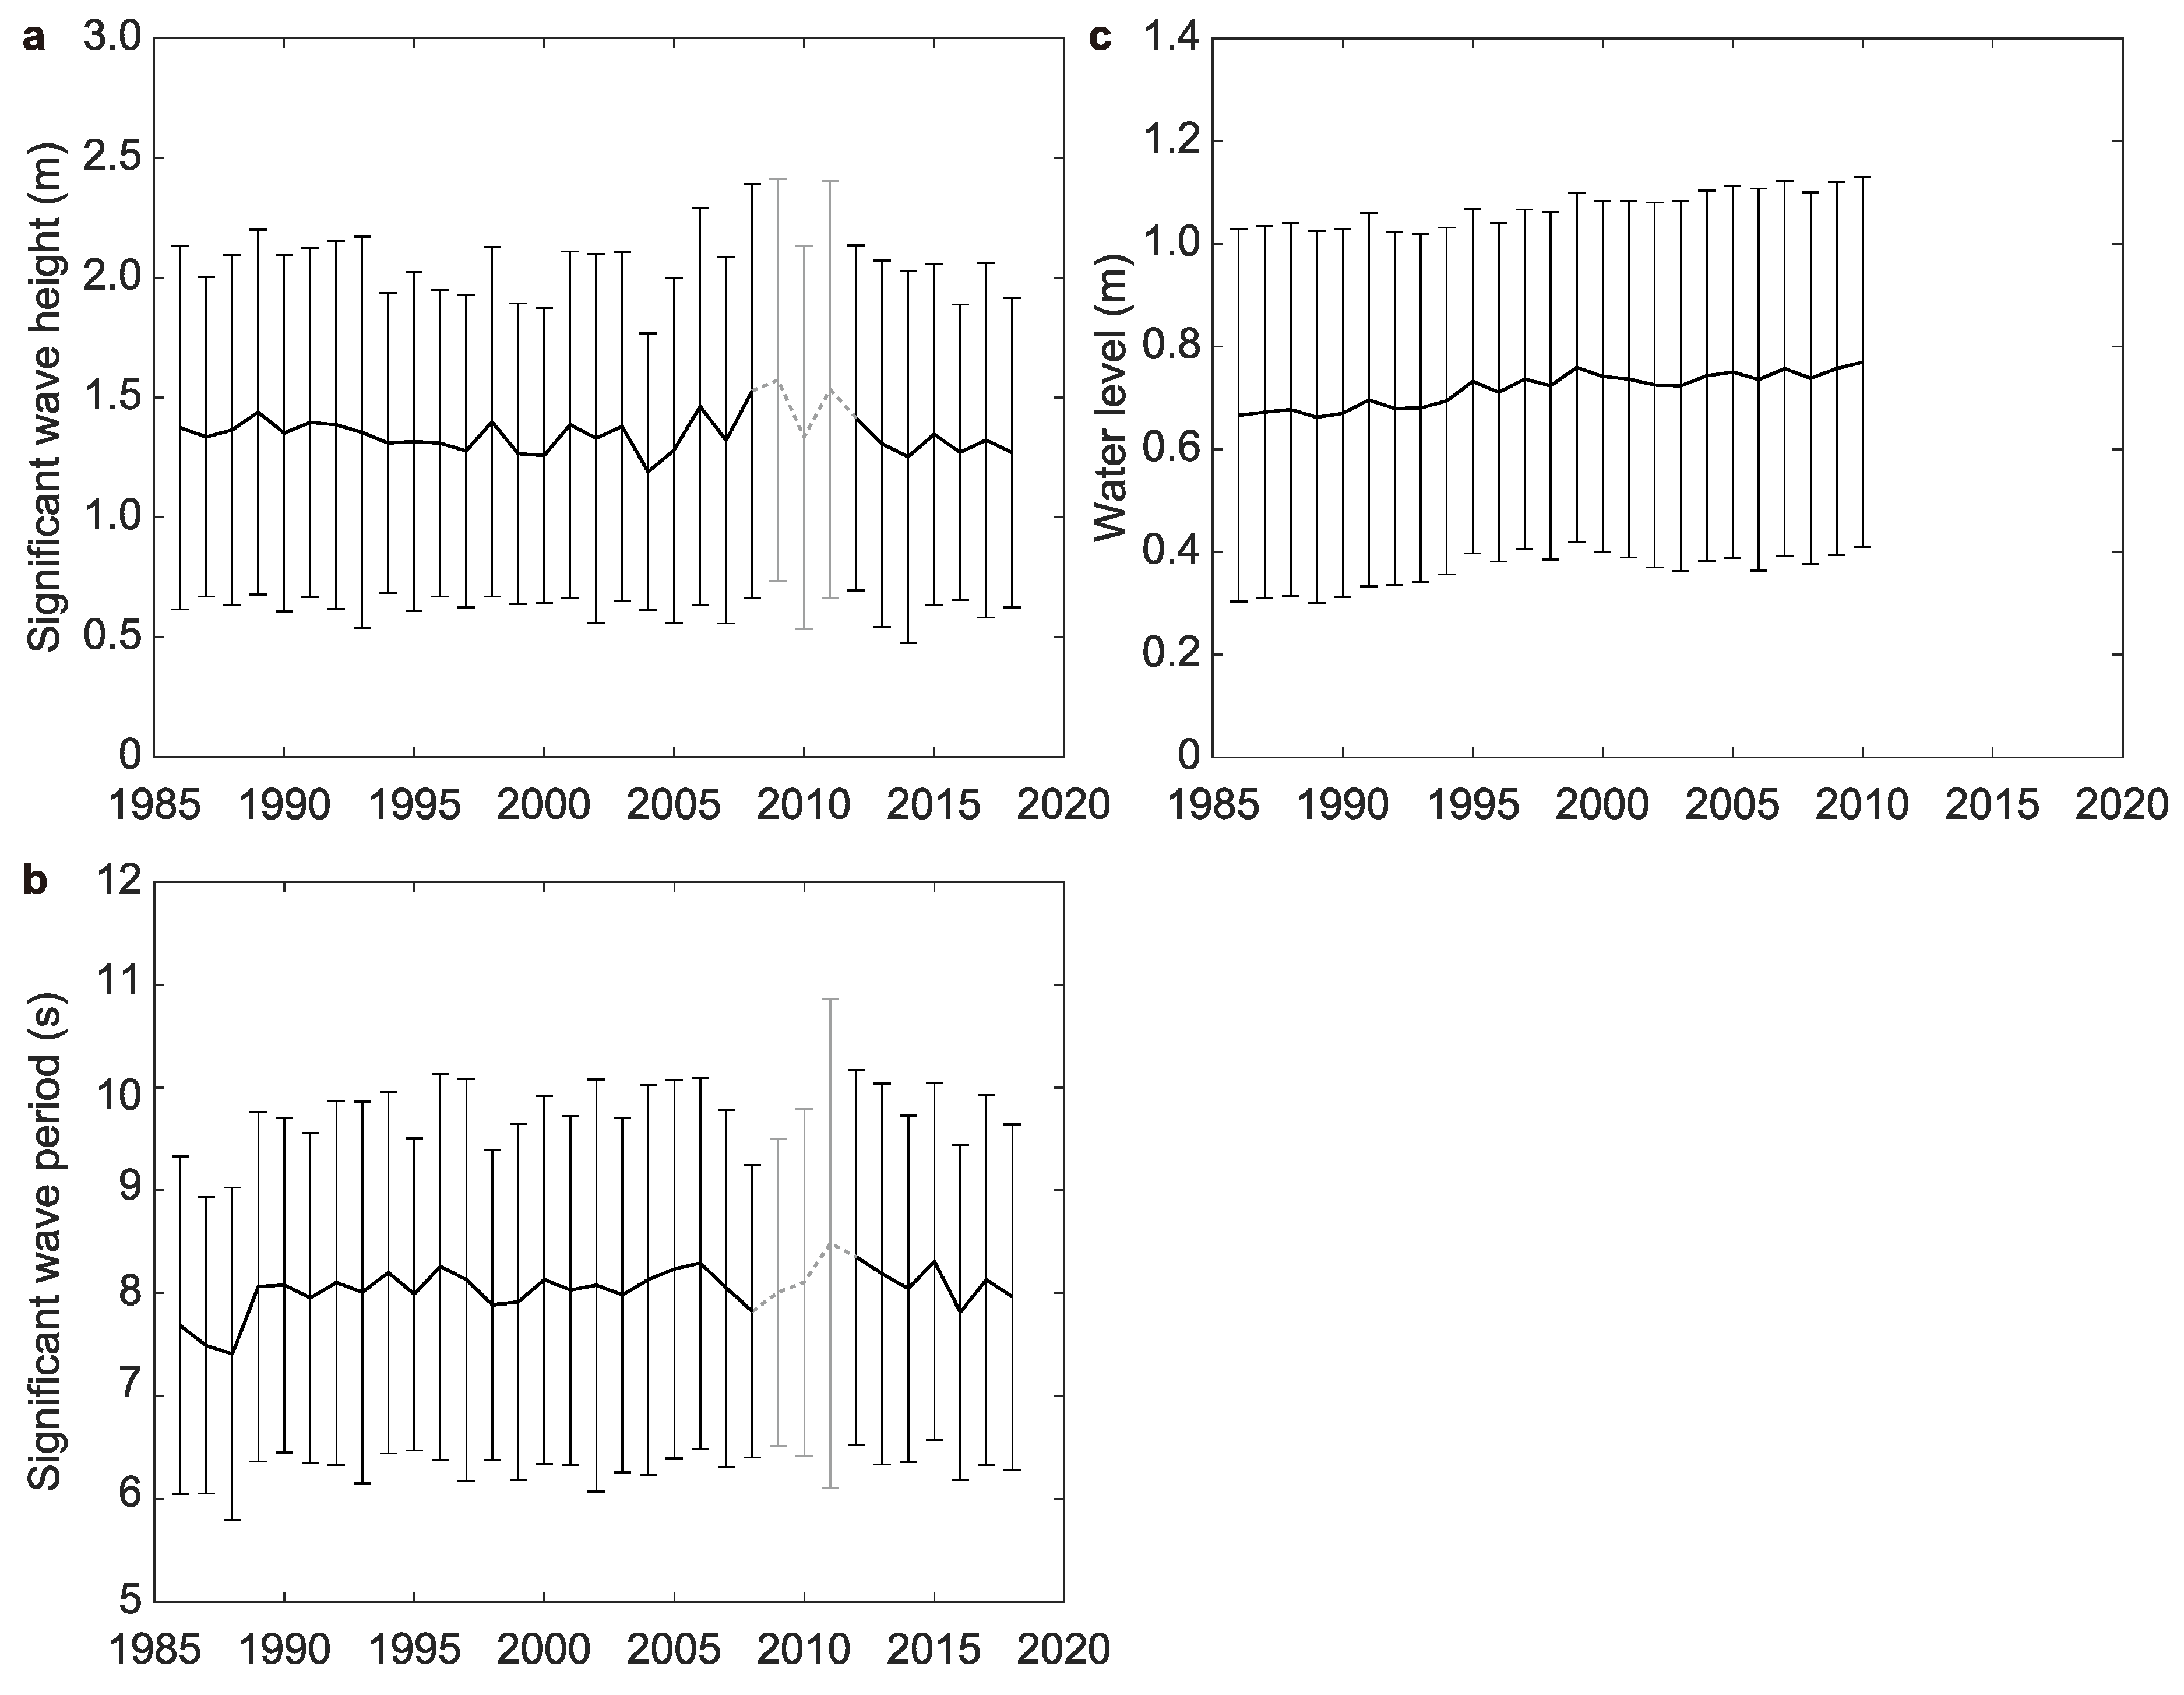
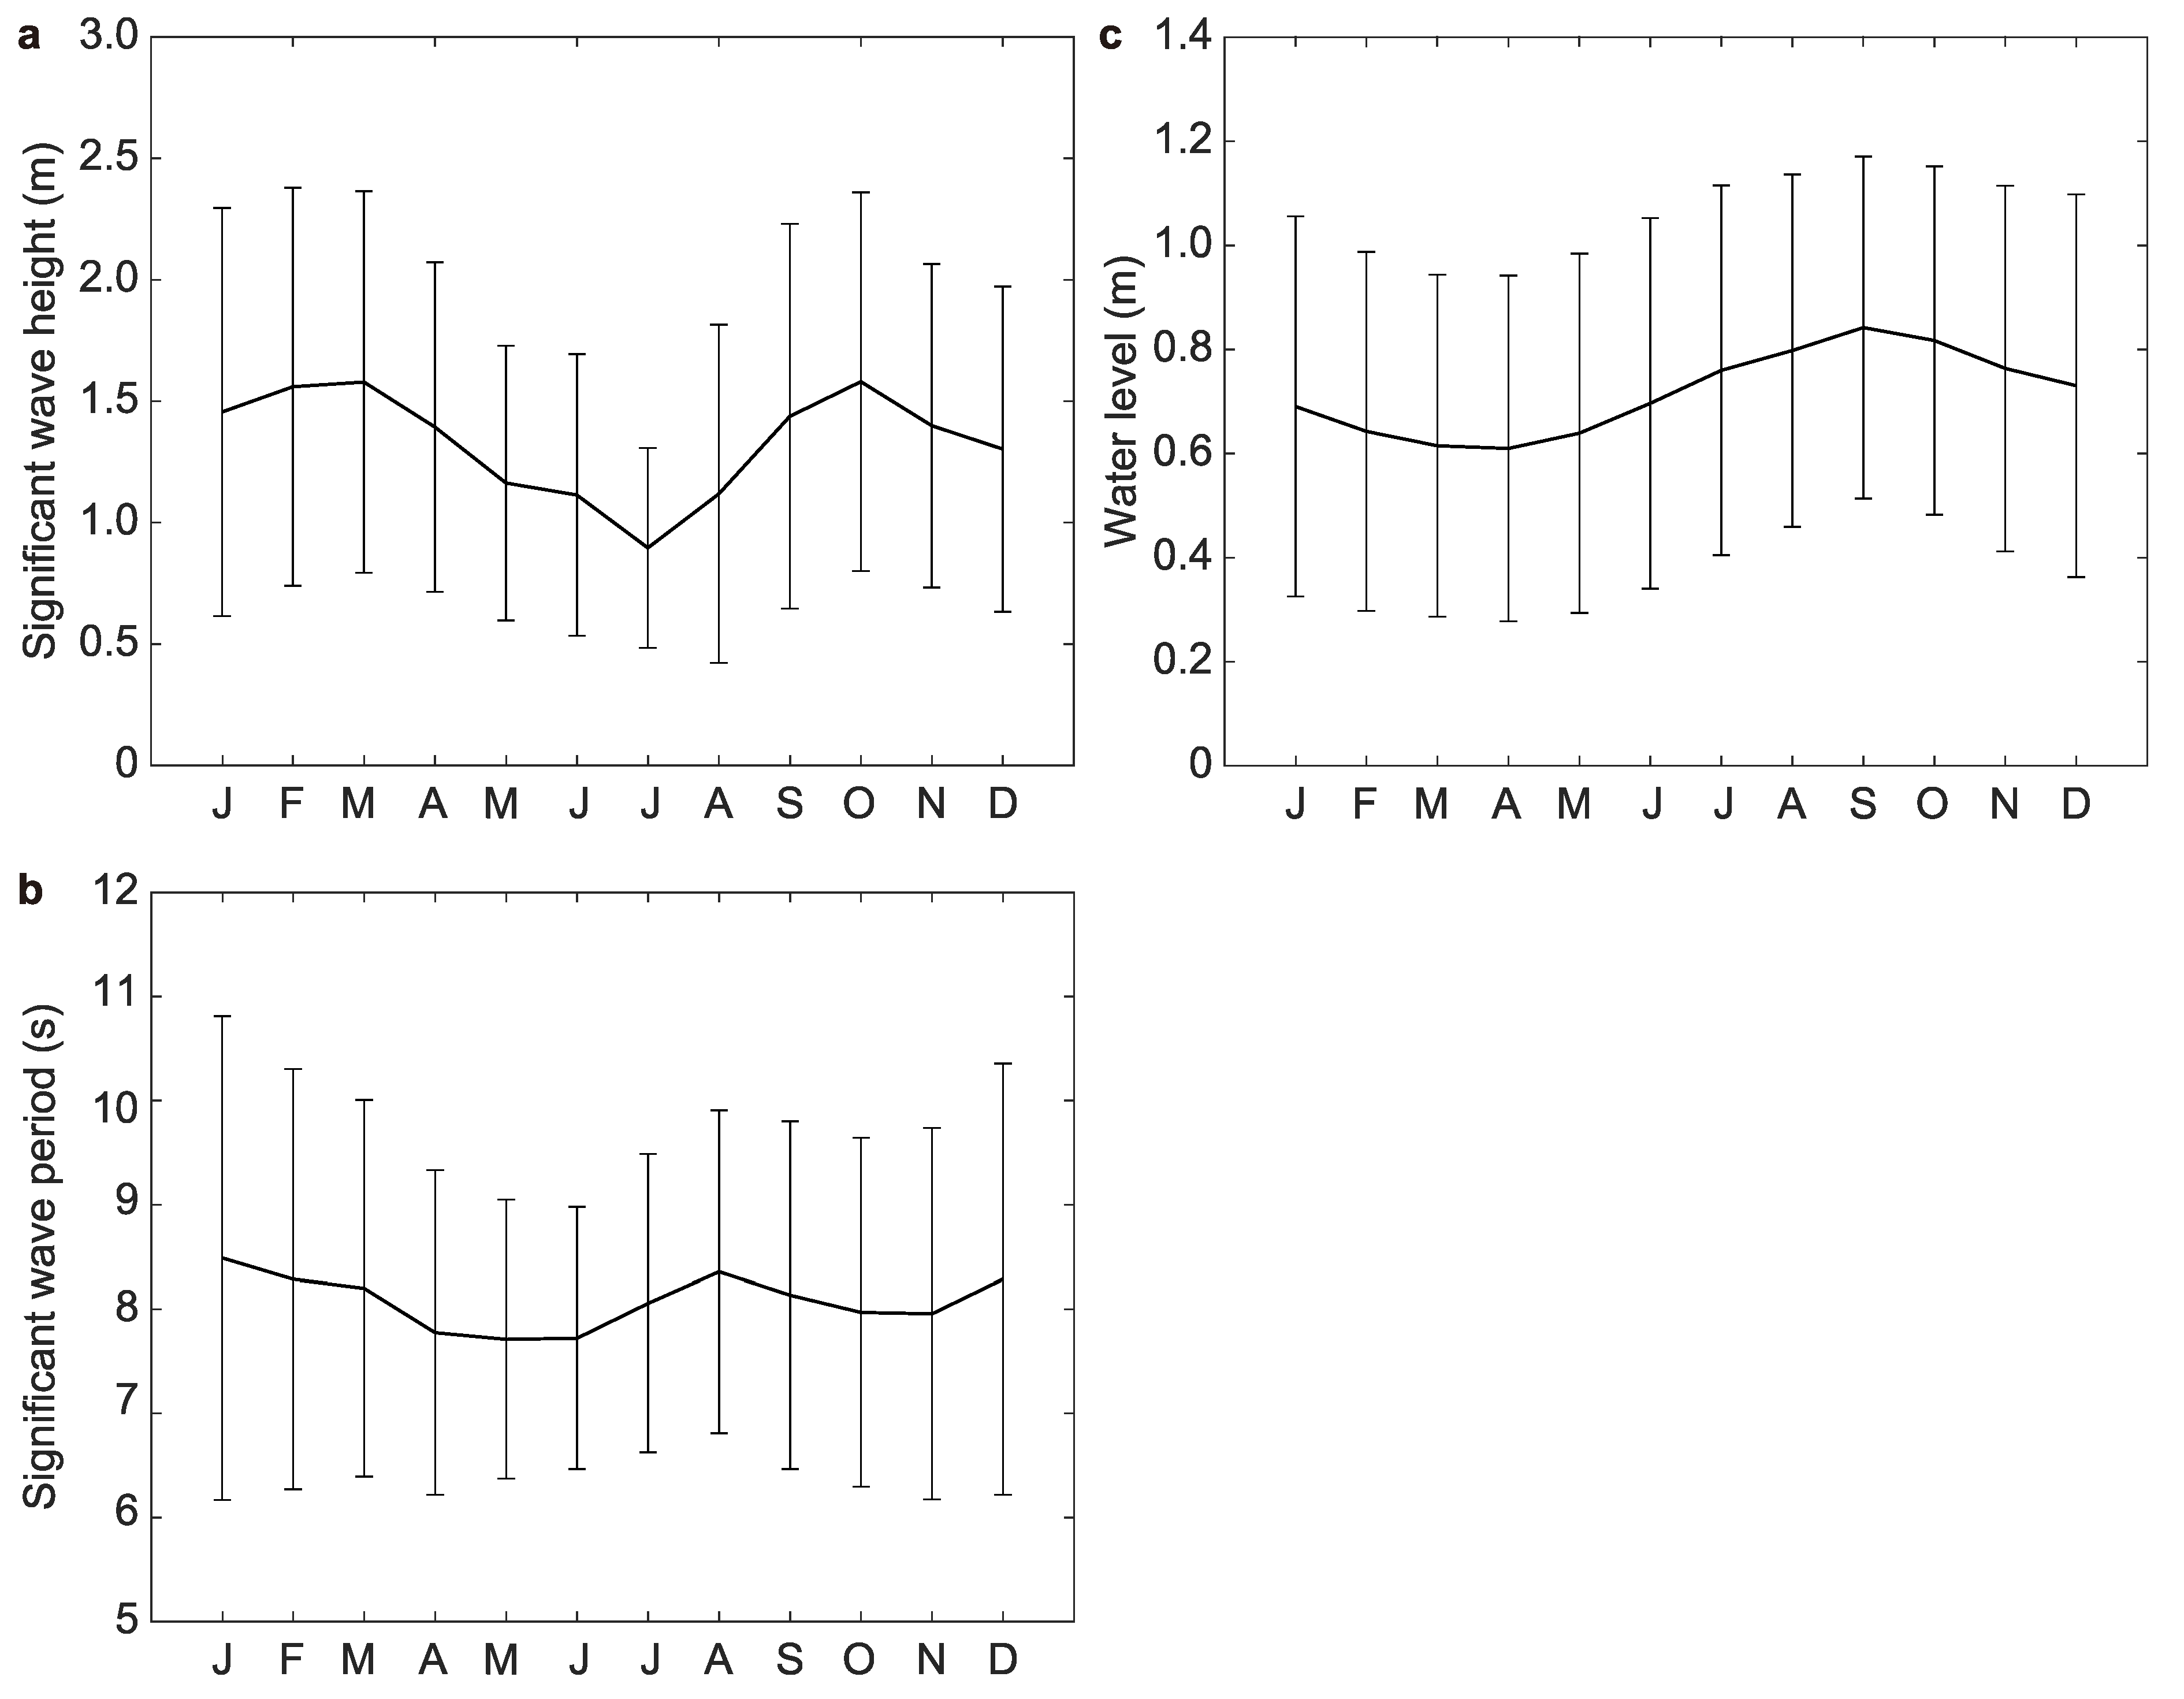
2.4. Wave and Water Level Measurement
2.5. Statistical Analysis
3. Results and Discussion
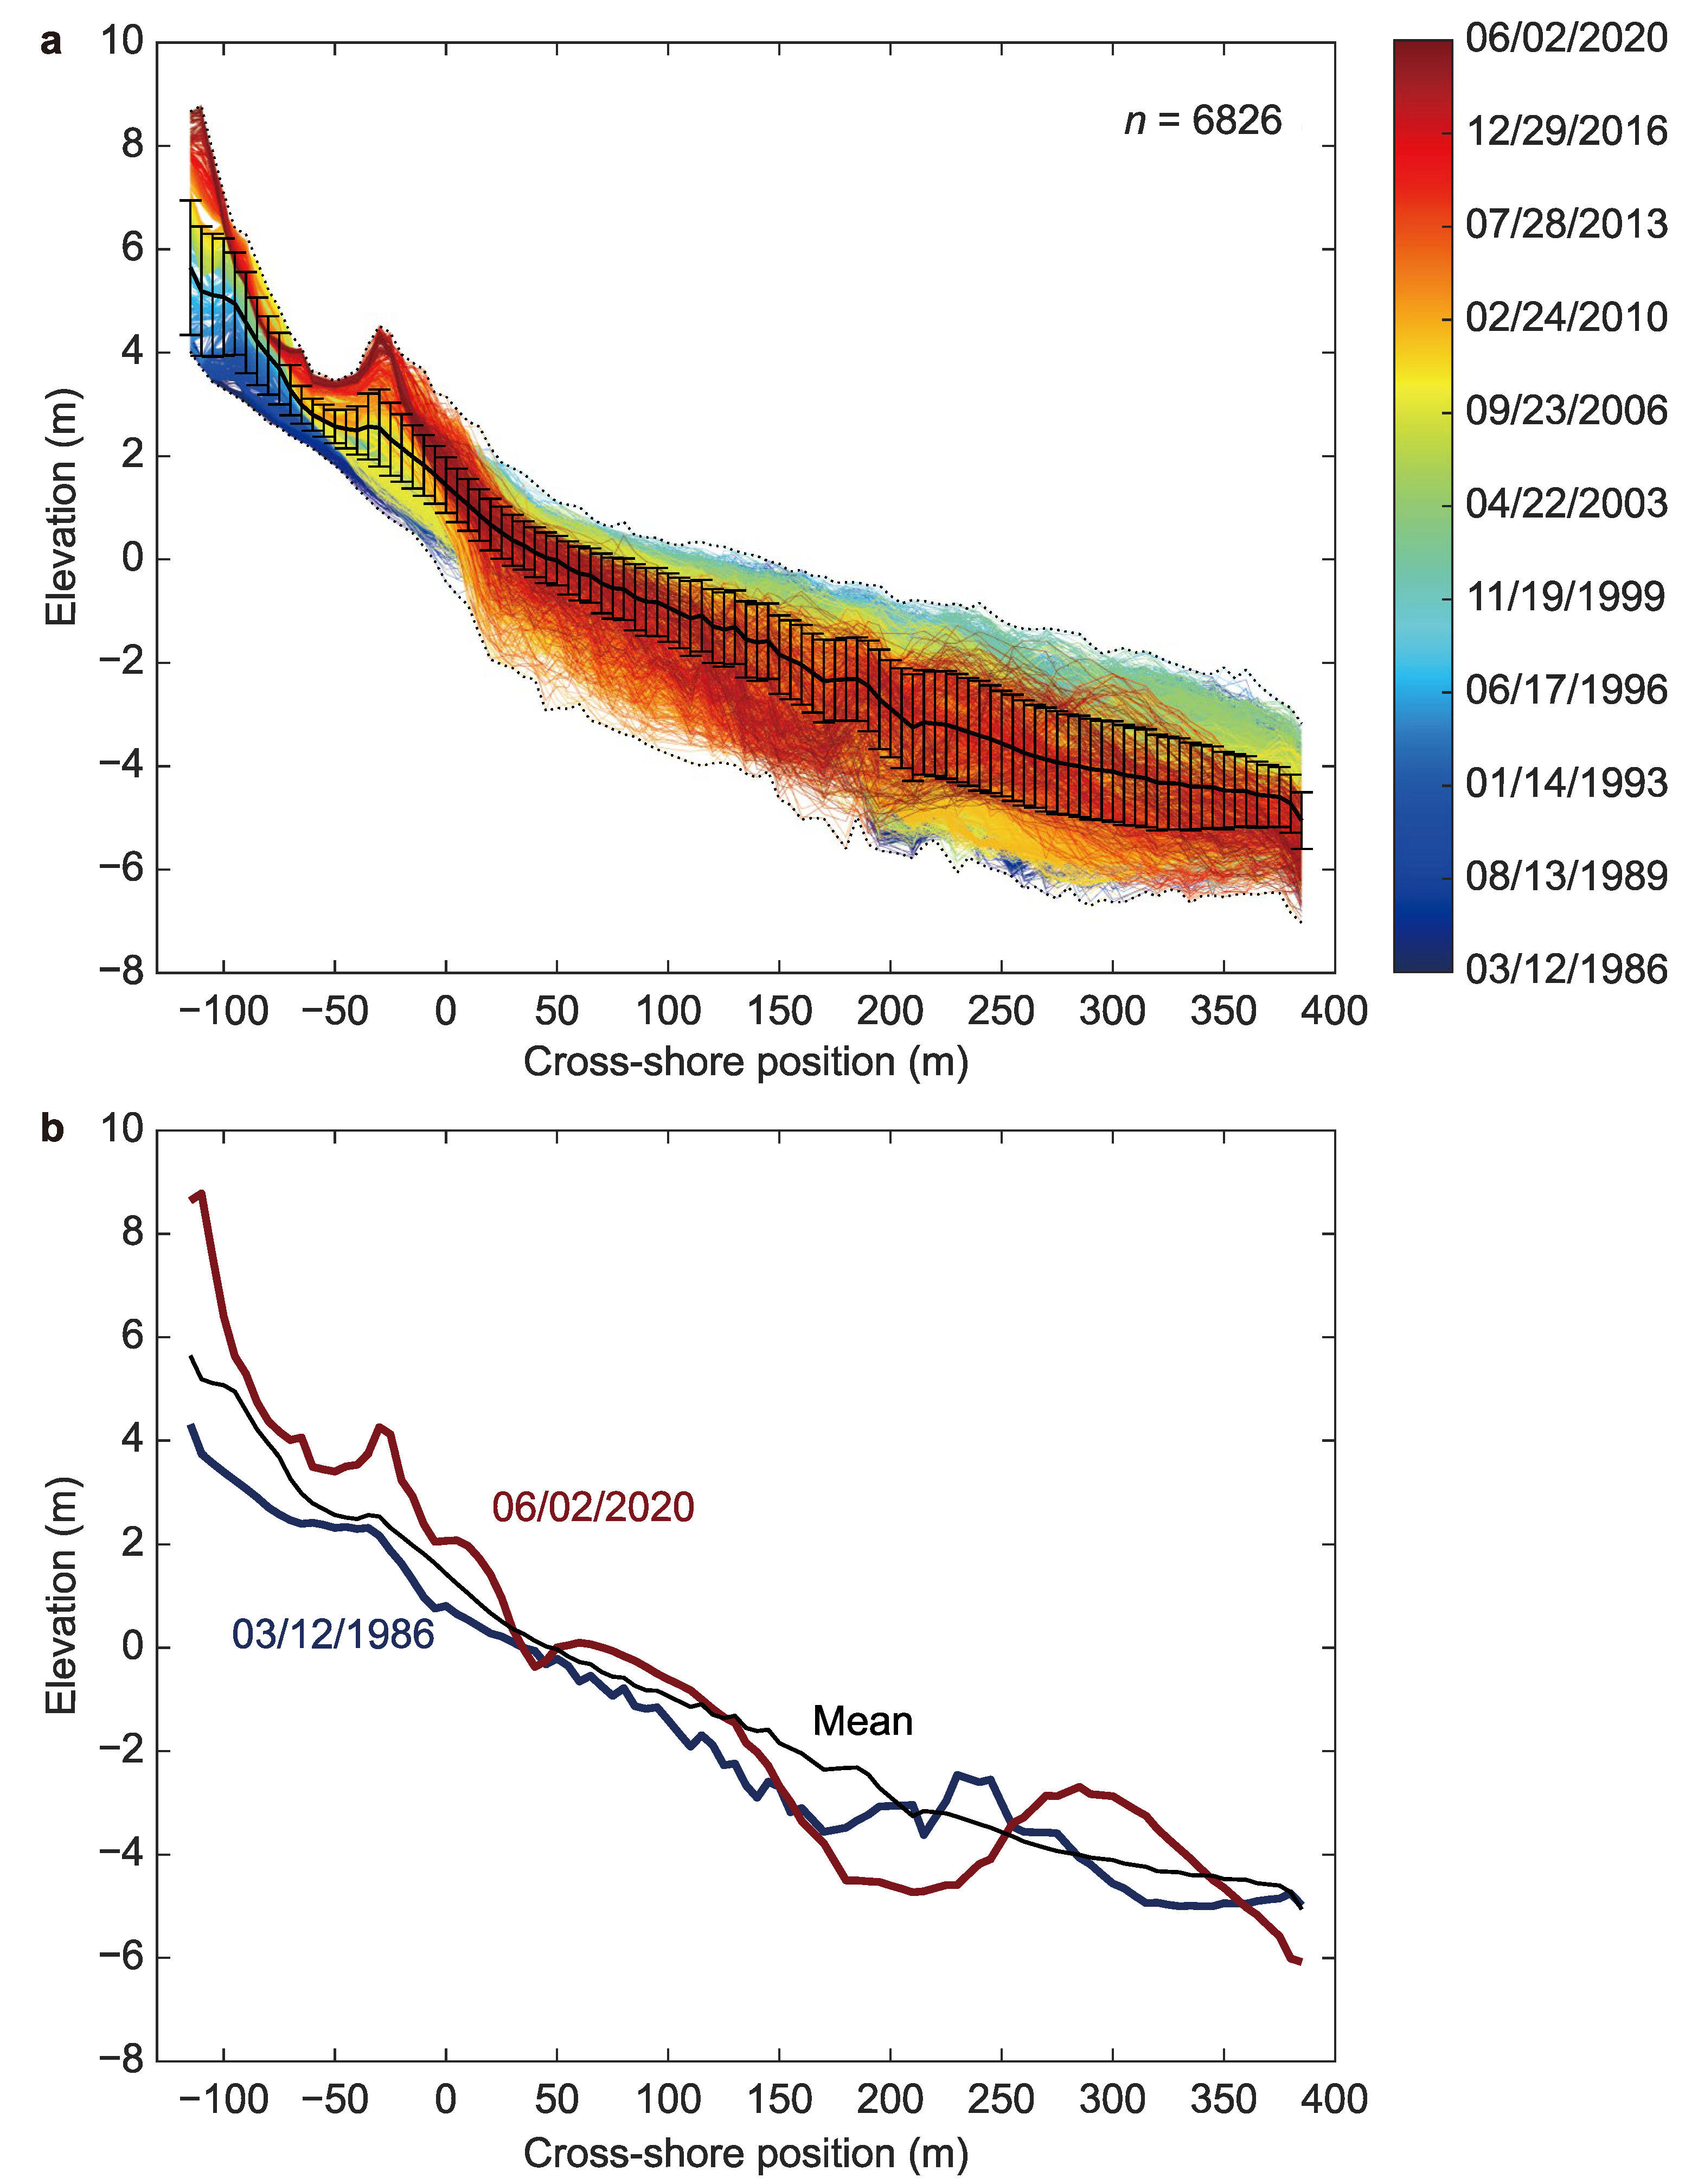
3.1. Measured Beach Profile Summary
3.2. Statistical Results for All the Observations
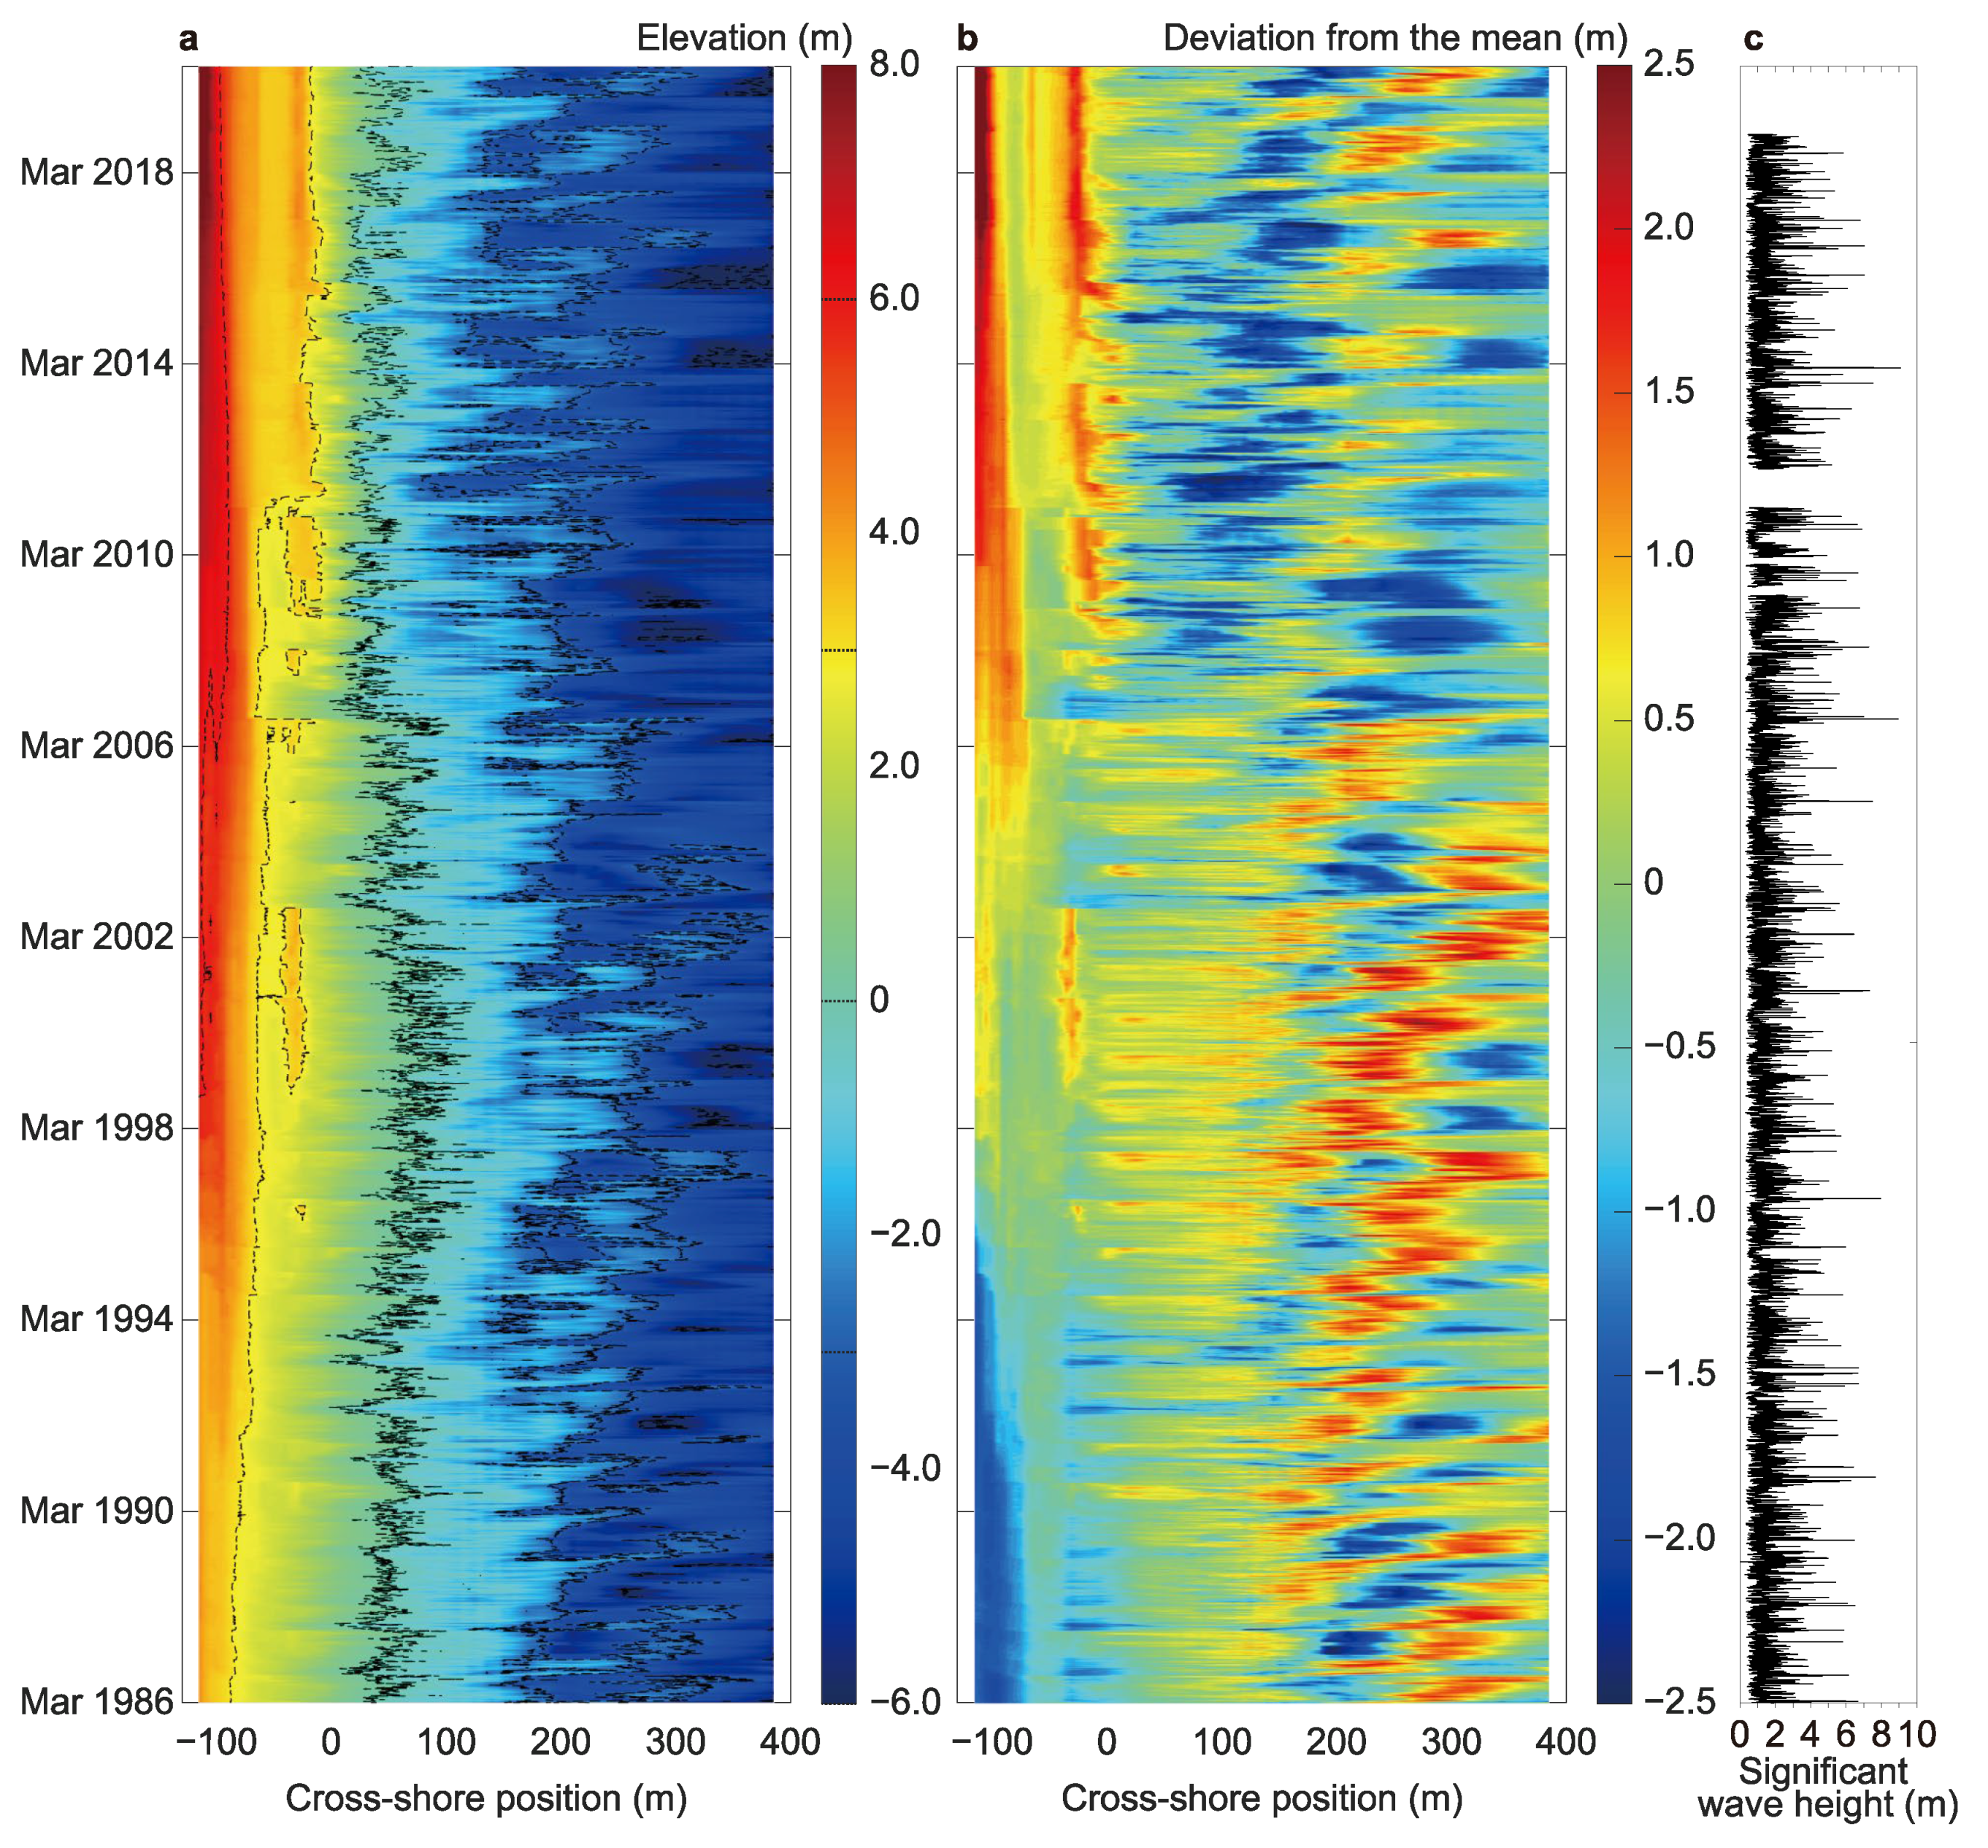
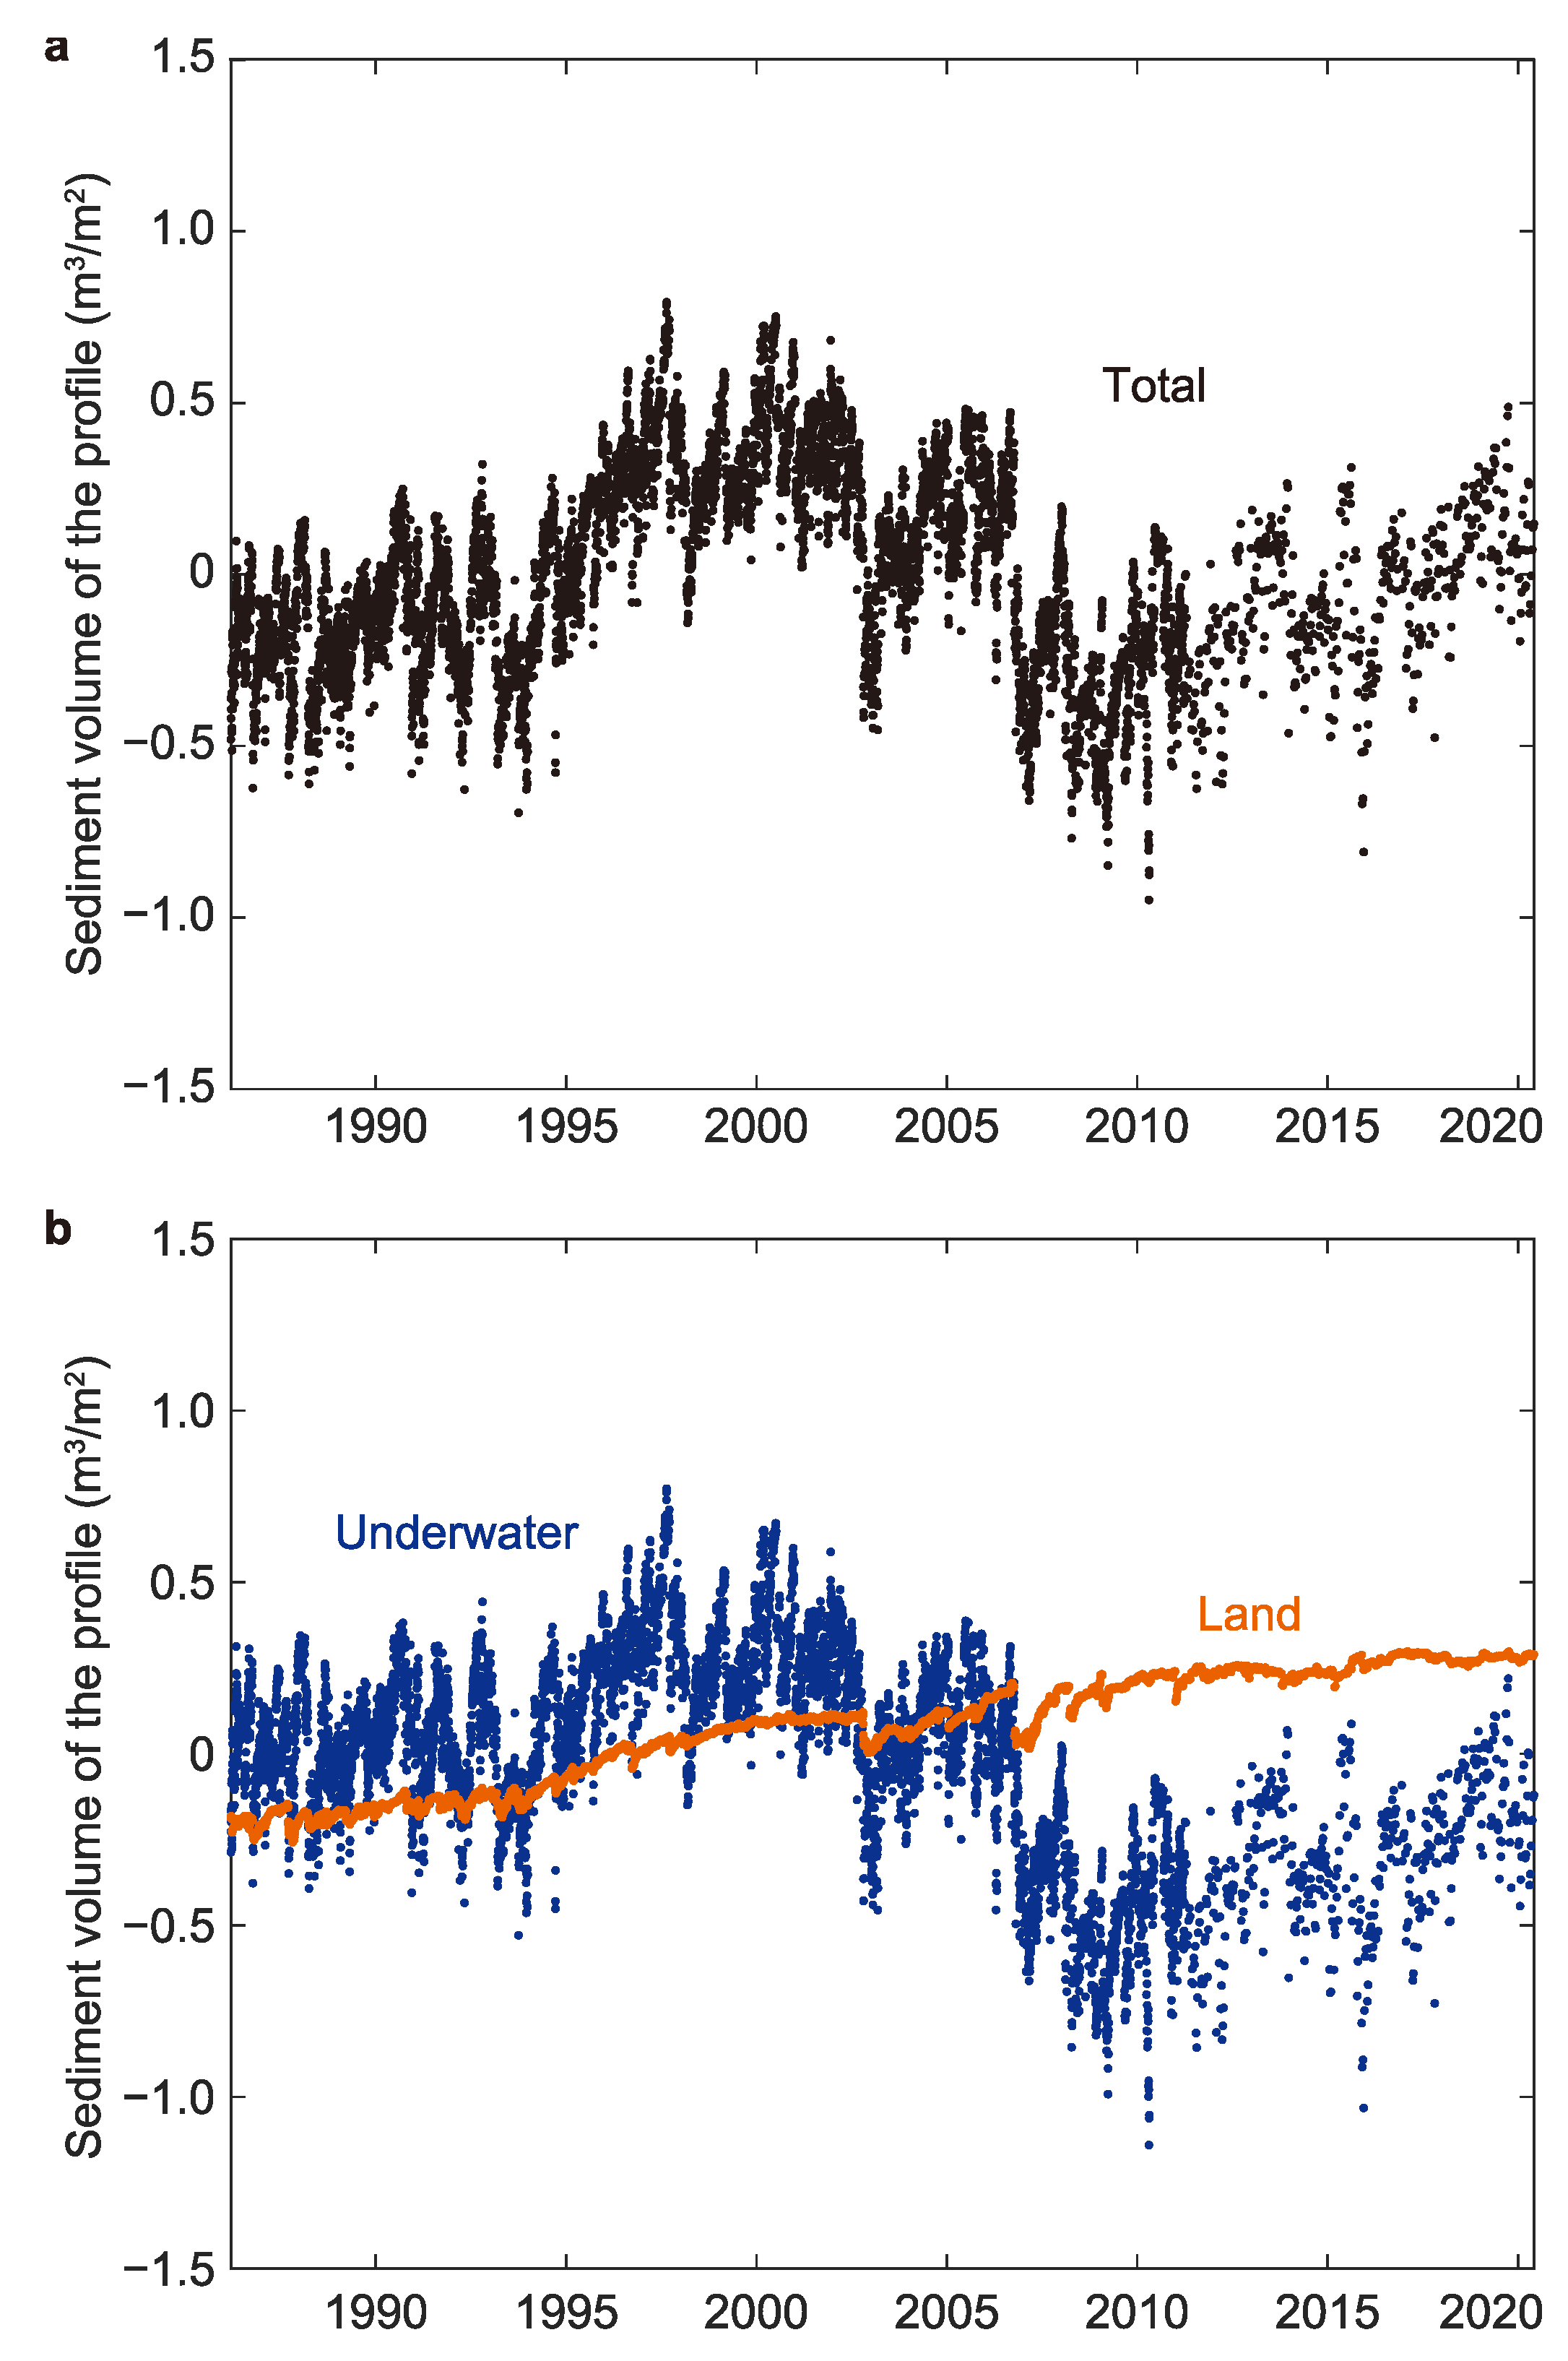
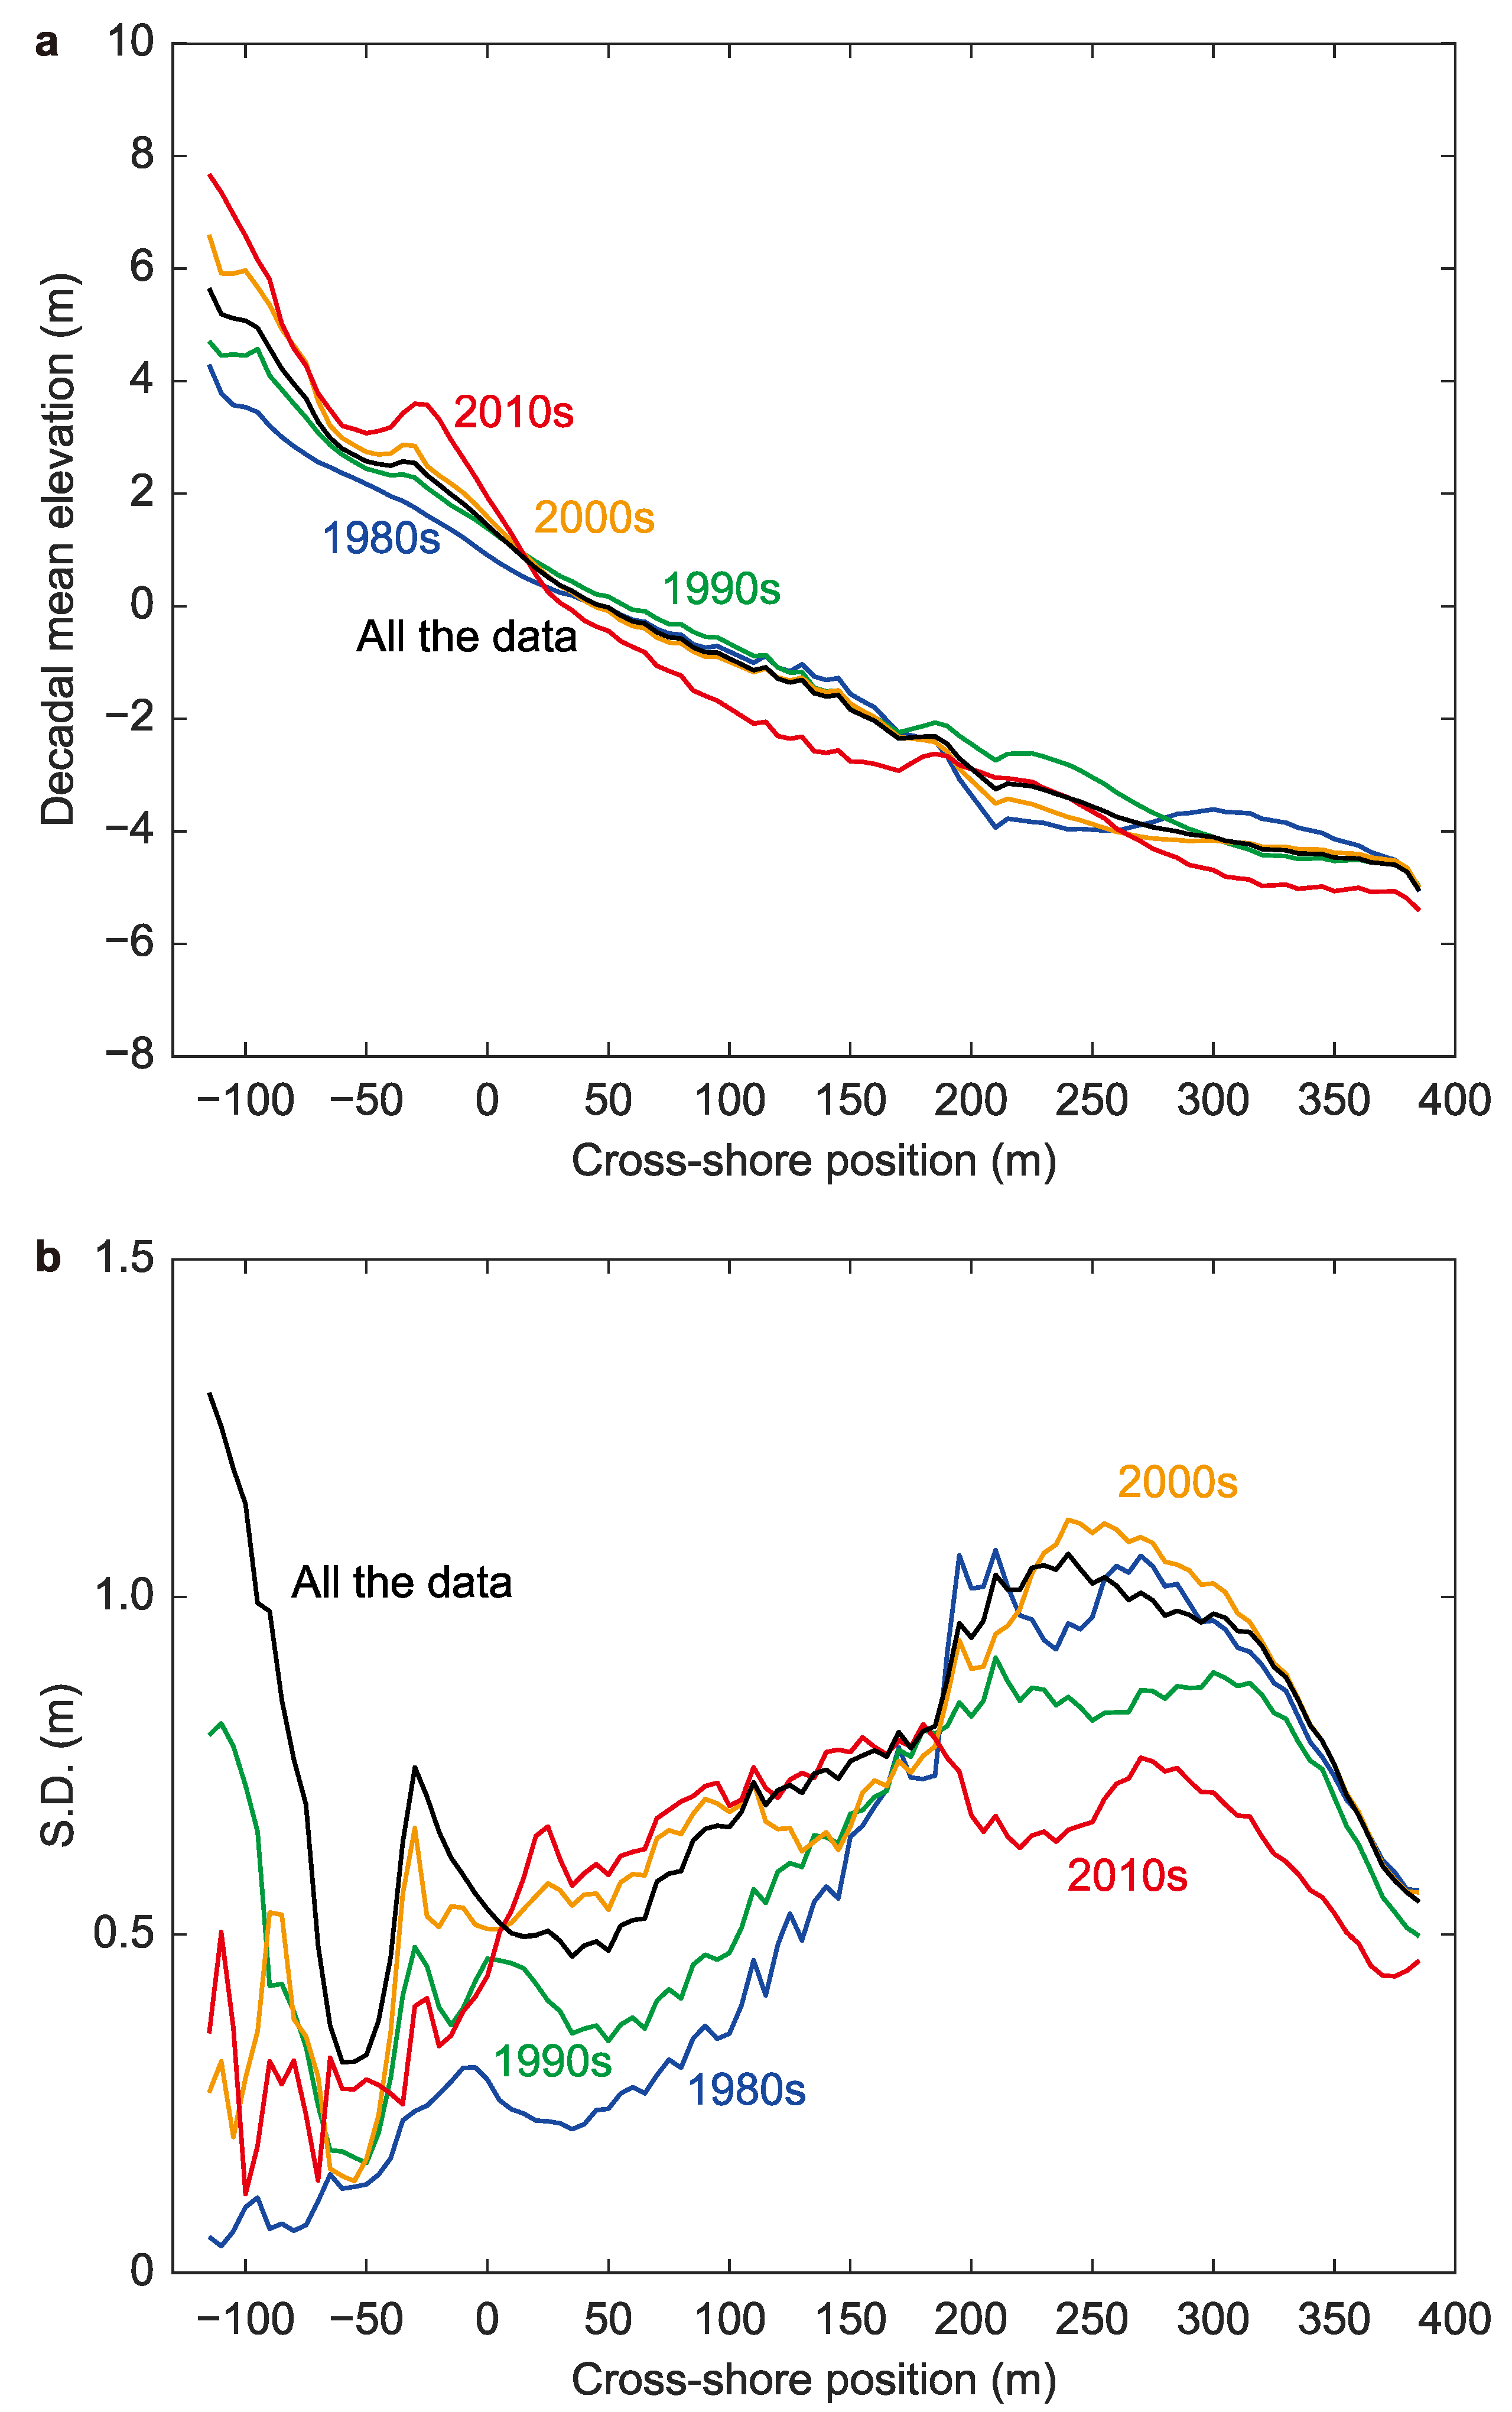
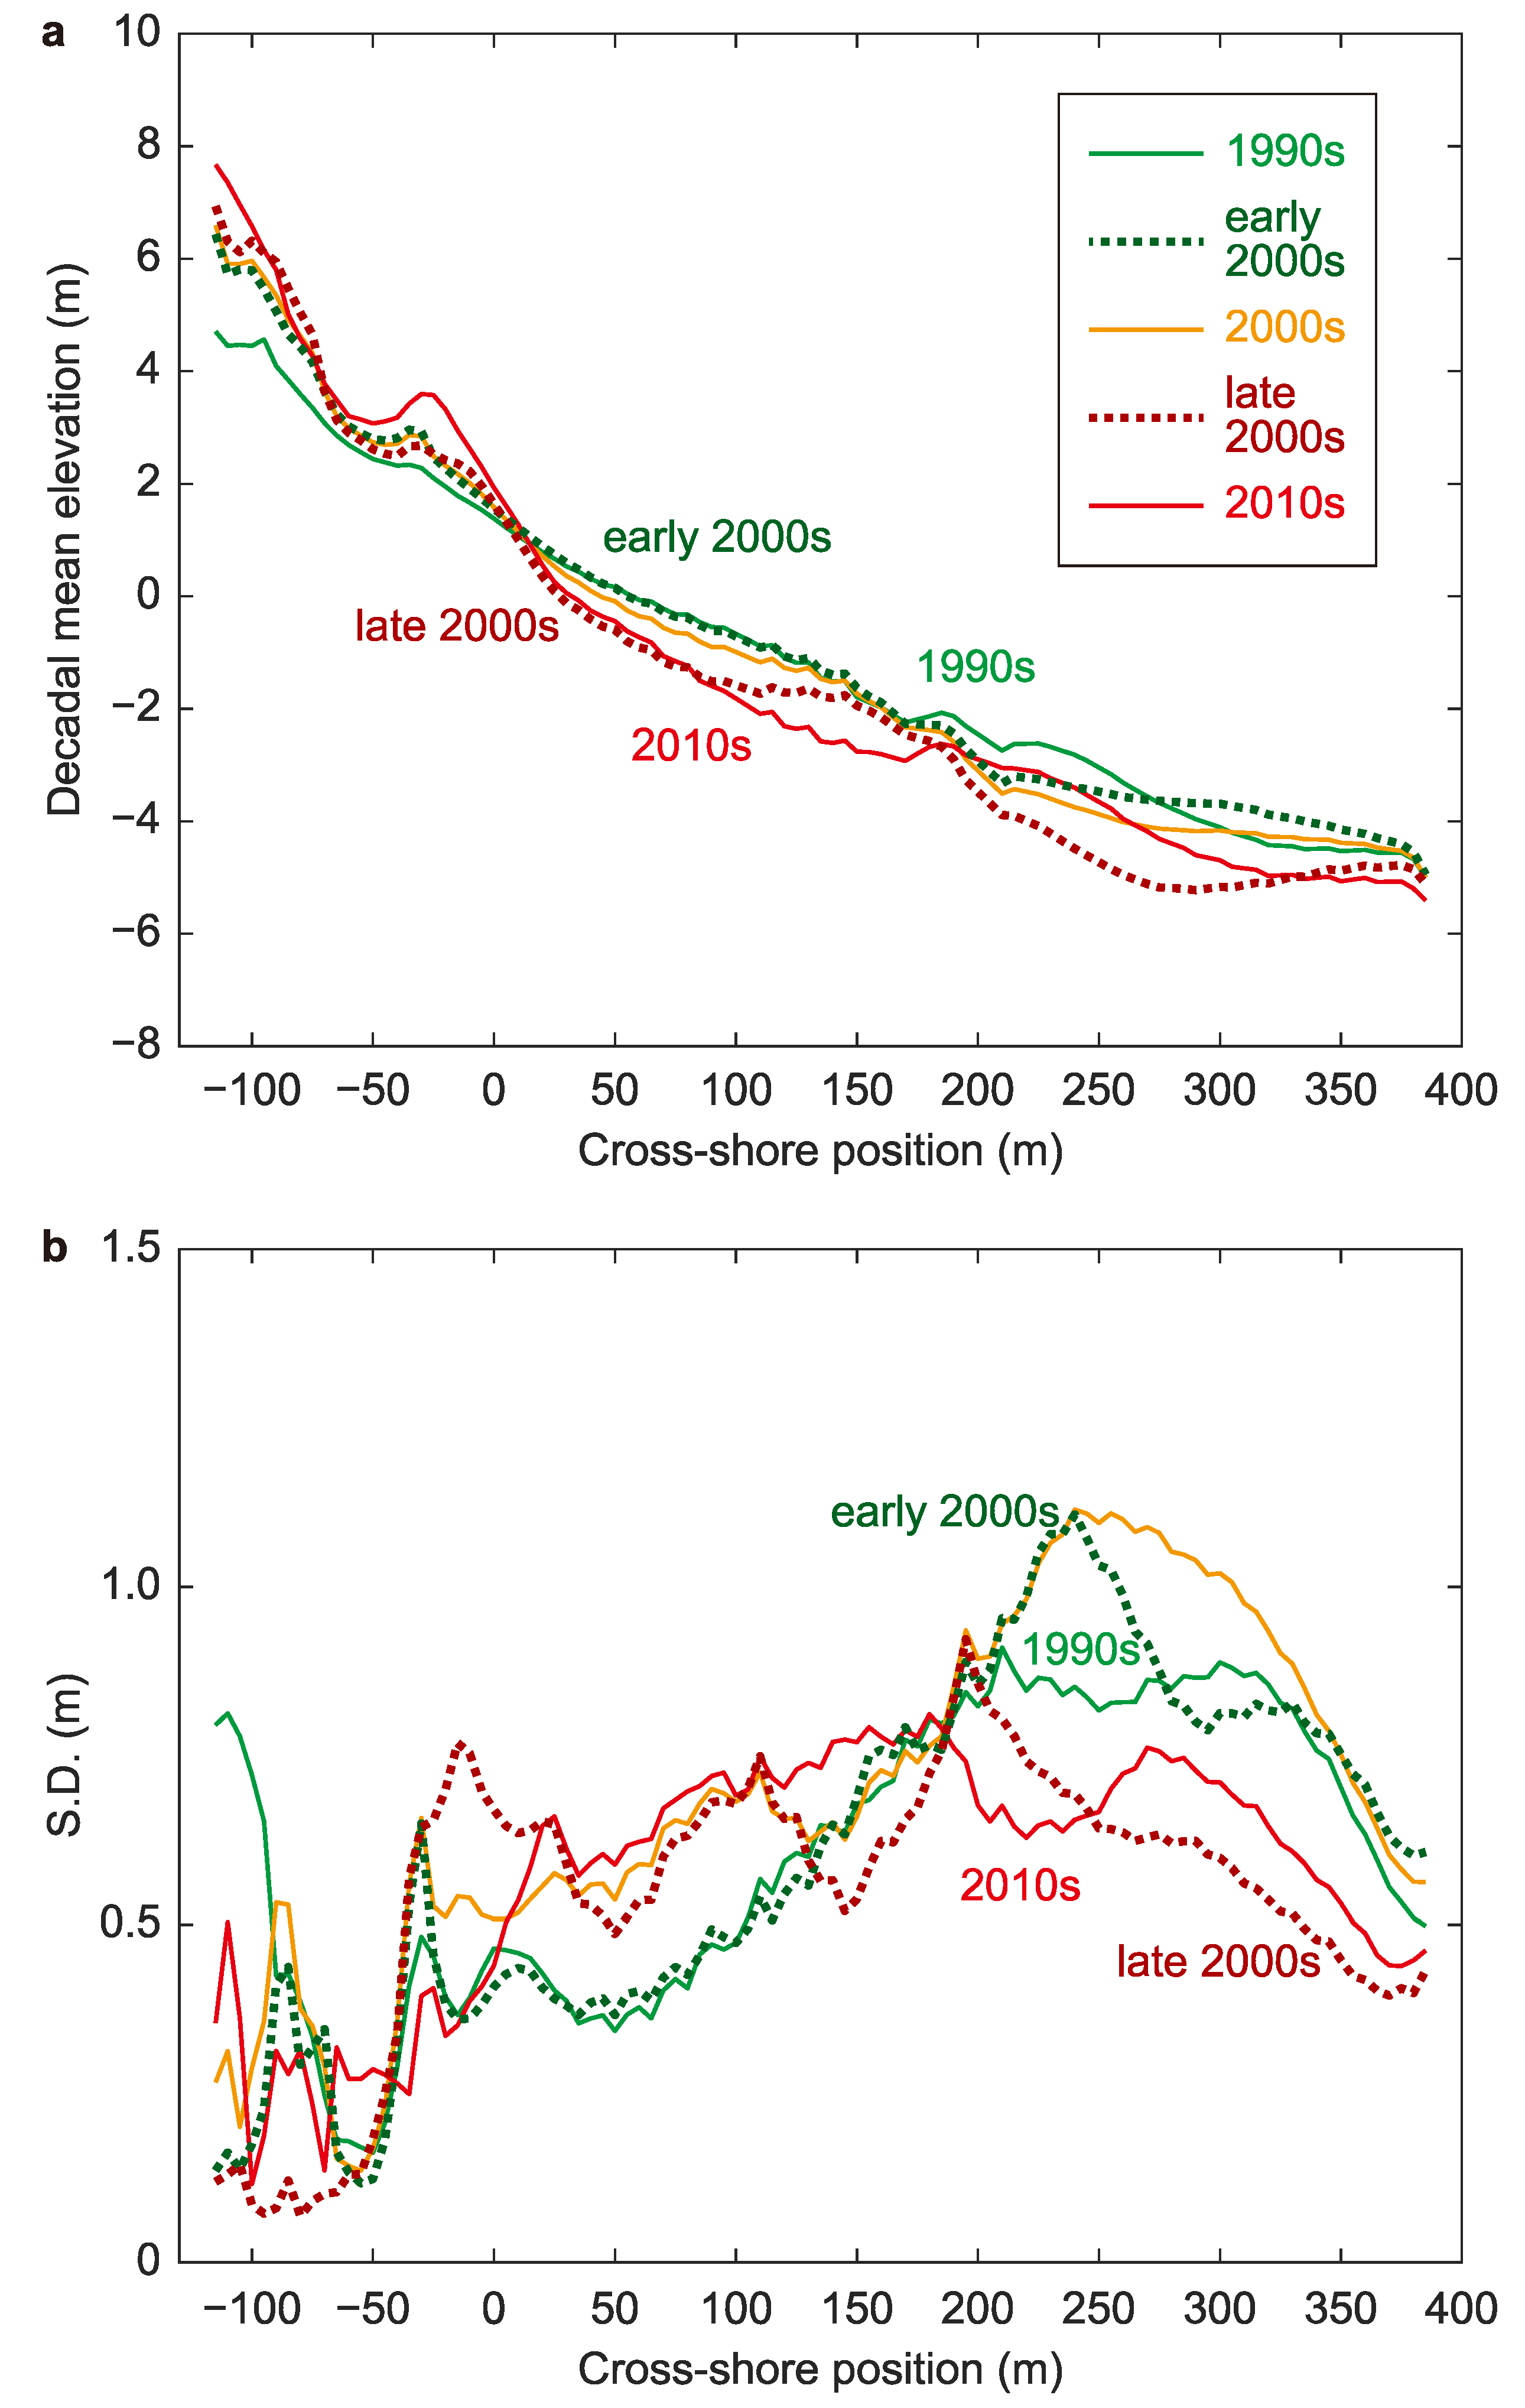
3.3. Long-Term Variability of the Beach Profile
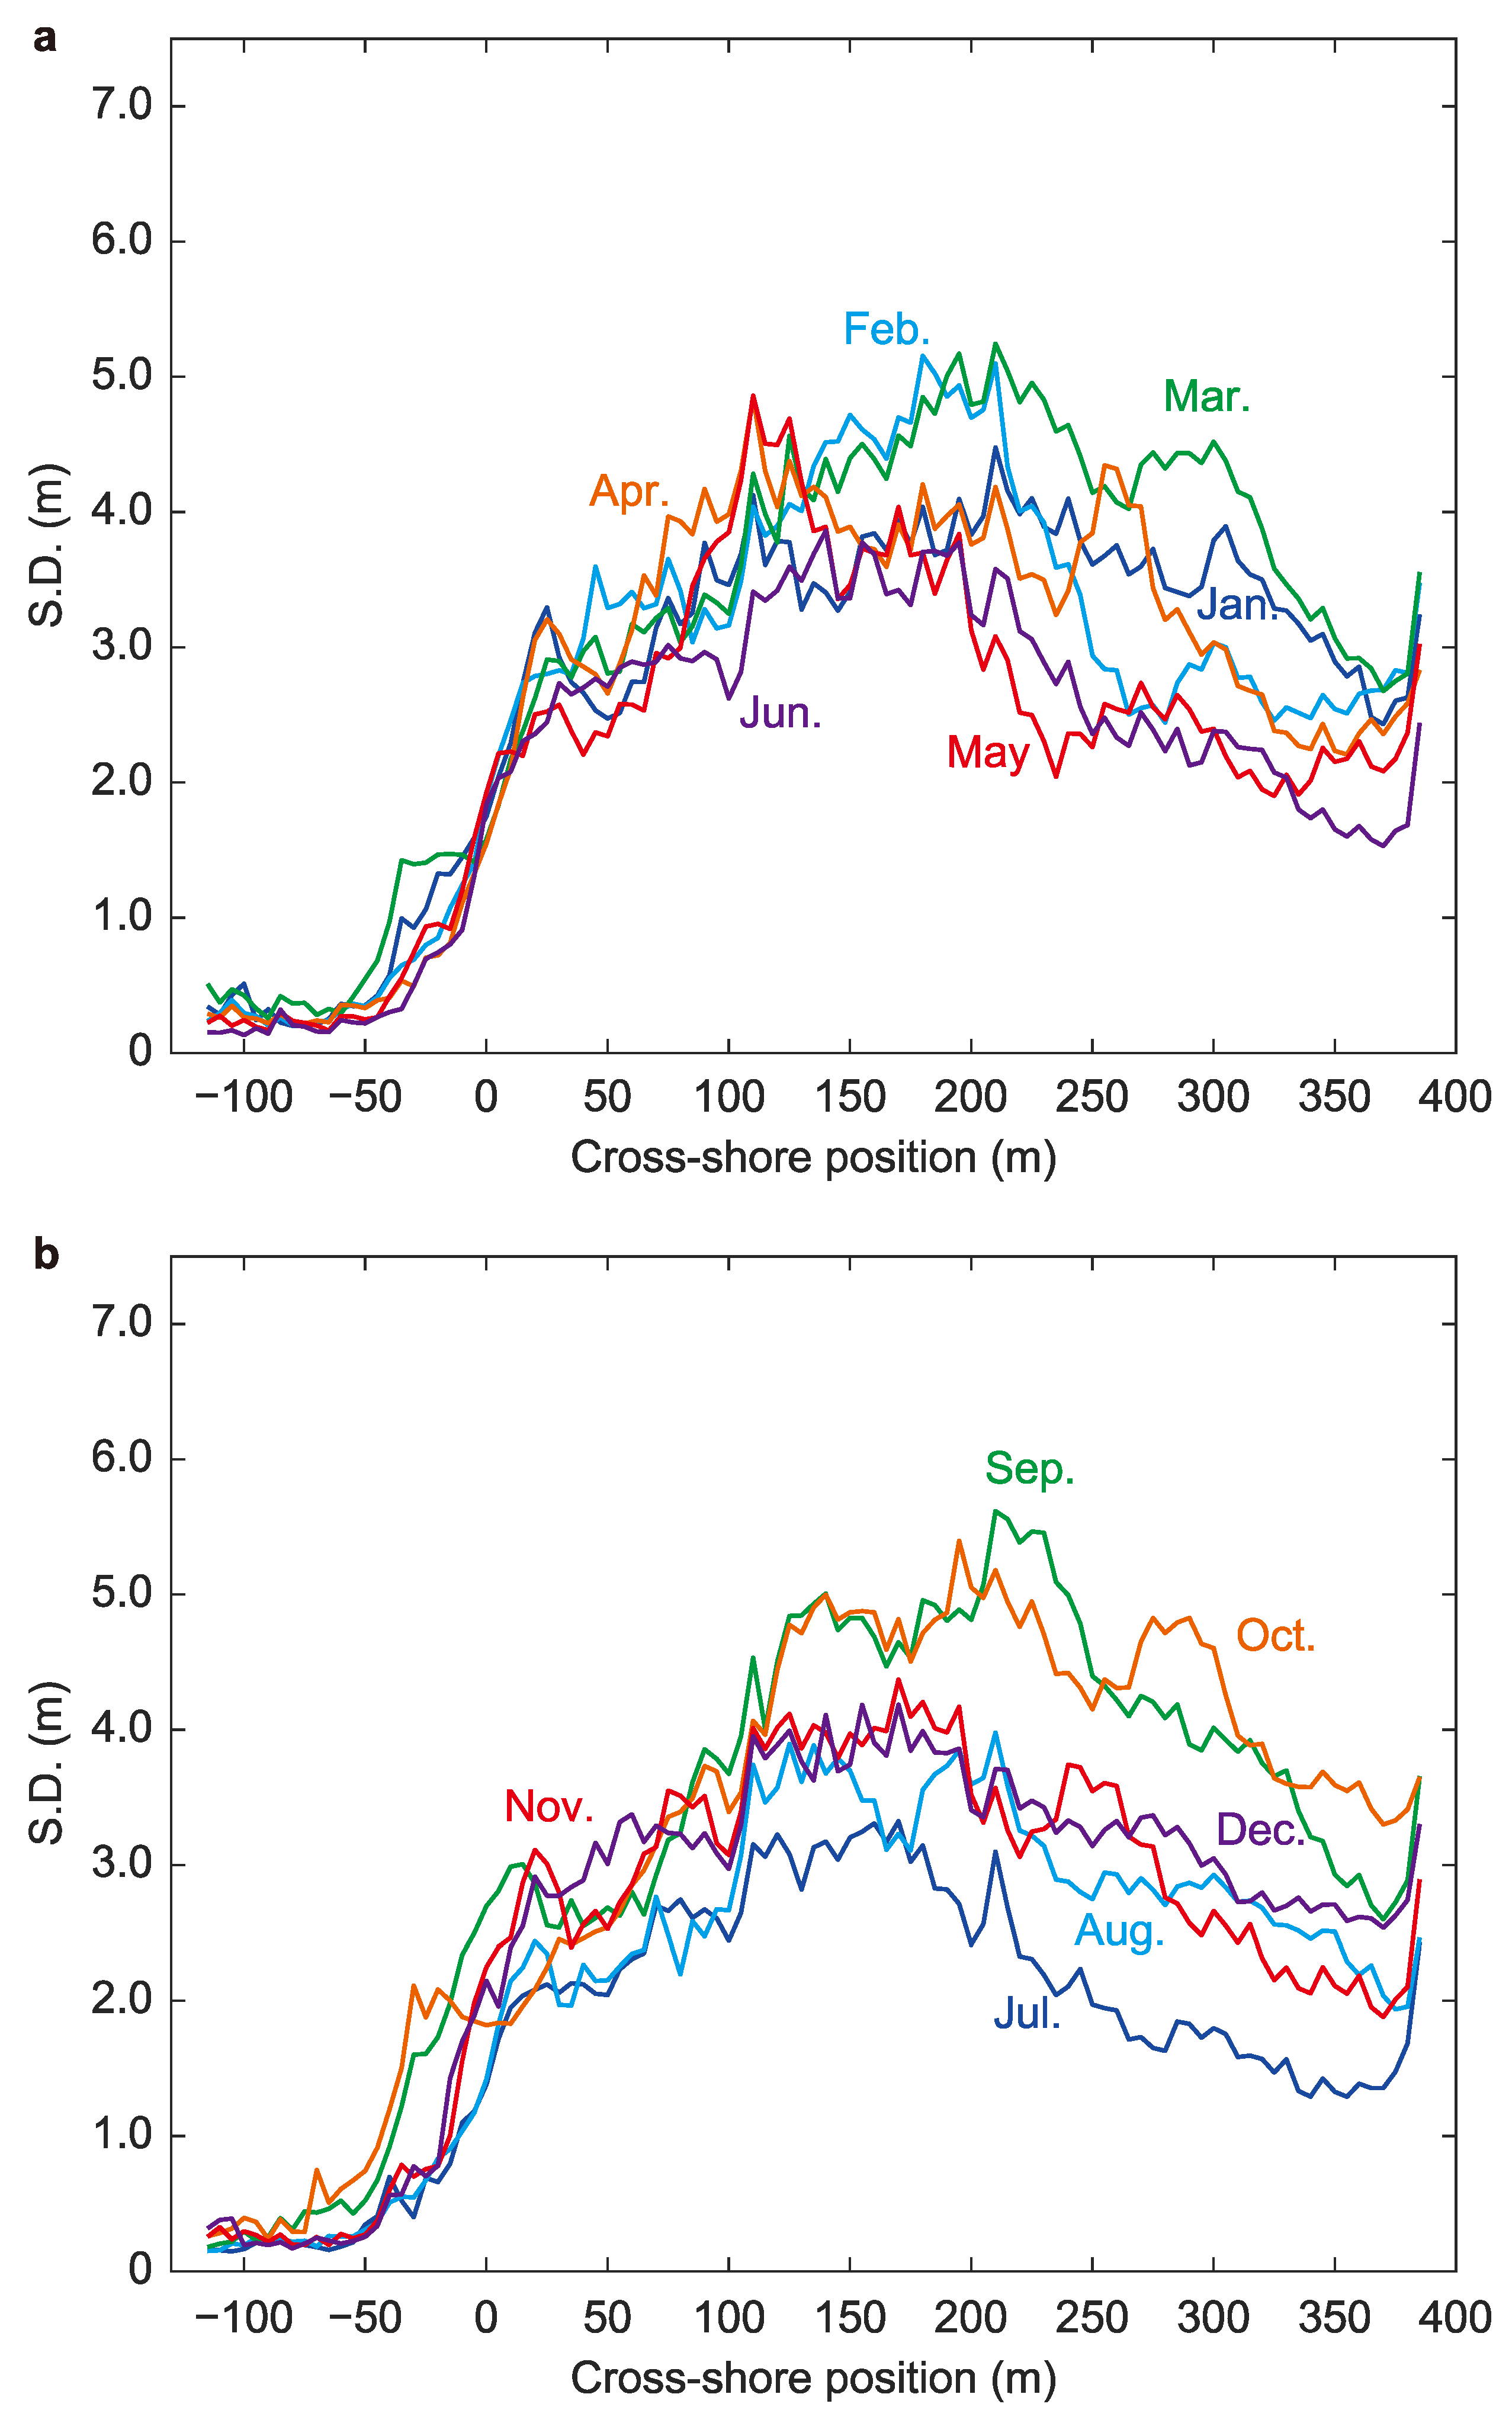
3.4. Seasonal Variability of the Beach Profile
4. Conclusions
Author Contributions
Funding
Acknowledgments
Conflicts of Interest
References
- Stronge, W.B. Economic Value of Beaches. In Encyclopedia of Earth Science Series; Schwartz, M.L., Ed.; Springer: Dordrecht, The Netherlands, 2005; pp. 401–403. [Google Scholar]
- Roelvink, J.A.; Reniers, A.; van Dongeren, A.R.; van Thiel de Vries, J.S.M.; McCall, R.; Lescinski, J. Modeling storm impacts on beaches, dunes and barrier islands. Coast. Eng. 2009, 56, 1133–1152. [Google Scholar] [CrossRef]
- Pape, L.; Kuriyama, Y.; Ruessink, B.G. Models and scales for cross-shore sandbar migration. J. Geophys. Res. 2010, 115, F03043. [Google Scholar] [CrossRef]
- Yates, M.L.; Guza, R.T.; O’Reilly, W.C. Equilibrium shoreline response: Observations and modeling. J. Geophys. Res. 2009, 114, C09014. [Google Scholar] [CrossRef]
- Larson, M.; Hanson, H.; Kraus, N.C. Analytical solutions of one-line model for shoreline change near coastal structures. J. Waterw. Port Coast. Ocean Eng. 1997, 123, 180–191. [Google Scholar] [CrossRef]
- Vitousek, S.; Barnard, P.L.; Limber, P.; Erikson, L.; Cole, B. A model integrating longshore and cross-shore processes for predicting long-term shoreline response to climate change. J. Geophys. Res. Earth Surf. 2017, 122, 782–806. [Google Scholar] [CrossRef]
- Banno, M.; Kuriyama, Y. Supermoon drives beach morphological changes in the swash zone. Geophys. Res. Lett. 2020, in press. [Google Scholar]
- Ruessink, B.G.; Wijnberg, K.M.; Holman, R.A.; Kuriyama, Y.; van Enckevort, I.M.J. Intersite comparison of interannual nearshore bar behavior. J. Geophys. Res. 2003, 108, 3249. [Google Scholar] [CrossRef]
- Ruessink, B.G.; Kuriyama, Y.; Reniers, A.J.H.M.; Roelvink, J.A.; Walstra, D.J.R. Modeling cross-shore sandbar behavior on the timescale of weeks. J. Geophys. Res. 2007, 112, F03010. [Google Scholar] [CrossRef]
- Matsumoto, H.; Young, A.; Guza, R.T. Observations of surface cobbles at two southern California beaches. Mar. Geol. 2020, 419, 106049. [Google Scholar] [CrossRef]
- Barnard, P.; Short, A.; Harley, M.; Splinter, K.D.; Vitousek, S.; Turner, I.L.; Allan, J.; Banno, M.; Bryan, K.R.; Doria, A.; et al. Coastal vulnerability across the Pacific dominated by El Niño/Southern Oscillation. Nat. Geosci. 2015, 8, 801–807. [Google Scholar] [CrossRef]
- Vitousek, S.; Barnard, P.L.; Limber, P. Can beaches survive climate change? J. Geophys. Res. Earth Surf. 2017, 122, 1060–1067. [Google Scholar] [CrossRef]
- Lippmann, T.C.; Holman, R.A. The spatial and temporal variability of sandbar morphology. J. Geophys. Res.-Oceans 1990, 95, 11575–11590. [Google Scholar] [CrossRef]
- Larson, M.; Kraus, N.C. Temporal and spatial scales of beach profile change, Duck, North Carolina. Mar. Geol. 1994, 117, 75–94. [Google Scholar] [CrossRef]
- Nicholls, R.J.; Birkemeier, W.A.; Lee, G. Evaluation of depth of closure using data from Duck, NC, USA. Mar. Geol. 1998, 148, 179–201. [Google Scholar] [CrossRef]
- Harley, M.D.; Turner, I.L.; Short, A.D.; Ranasinghe, R. Assessment and integration of conventional, RTK-GPS and image-derived beach survey methods for daily to decadal coastal monitoring. Coast. Eng. 2011, 58, 194–205. [Google Scholar] [CrossRef]
- Turner, I.L.; Harley, M.; Short, A.D.; Simmons, J.A.; Bracs, M.A.; Phillips, M.S.; Splinter, K.D. A multi-decade dataset of monthly beach profile surveys and inshore wave forcing at Narrabeen, Australia. Sci. Data 2016, 3, 160024. [Google Scholar] [CrossRef]
- Short, A.; Trenbanis, A.C. Decadal scale patterns in beach oscillation and rotation Narrabeen Beach, Australia time series, PCA and wavelet analysis. J. Coast. Res. 2004, 20, 523–532. [Google Scholar] [CrossRef]
- Tsuchiya, Y.; Shirai, T.; Yamashita, T. Long-term changes in beach profiles at Ogata Coast. Bull. Disaster Prev. Res. Inst. 1982, 32, 171–187. [Google Scholar]
- Hashimoto, H.; Uda, T. Field investigation of beach profile changes and the analysis using empirical eigenfunction. Proc. 18th Int. Conf. Coast. Eng. 1982, 1369–1384. [Google Scholar]
- Katoh, K.; Yanagishima, S. Berm erosion due to long period waves. In Proceedings of the 22nd International Conference on Coastal Engineering, Delft, The Netherlands, 2–6 July 1990; pp. 2073–2086. [Google Scholar]
- Kuriyama, Y.; Banno, M.; Suzuki, T. Linkages among interannual variations of shoreline, wave and climate at Hasaki, Japan. Geophys. Res. Lett. 2012, 39, L06604. [Google Scholar] [CrossRef]
- Kuriyama, Y.; Yanagishima, S. Investigation of medium-term barred beach behavior using 28-year beach profile data and Rotated Empirical Orthogonal Function analysis. Geomorphology 2016, 261, 236–243. [Google Scholar] [CrossRef]
- Thom, B.; Hall, W. Behaviour of beach profiles during accretion and erosion dominated periods. Earth Surf. Process. Landf. 1991, 16, 113–127. [Google Scholar] [CrossRef]
- McLean, R.; Shen, J.S. From foreshore to foredune: Foredune development over the last 30 years at Moruya Beach, New South Wales, Australia. J. Coast. Res. 2006, 22, 28–36. [Google Scholar] [CrossRef]
- Tamura, T.; Oliver, T.S.N.; Cunningham, A.C.; Woodroffe, C.D. Recurrence of extreme coastal erosion in SE Australia beyond historical timescales inferred from beach ridge morphostratigraphy. Geophys. Res. Lett. 2019, 46, 4705–4714. [Google Scholar] [CrossRef]
- Katoh, K.; Yanagishima, S. Changes of sand grain distribution in the surf zone. Proc. Coast. Dyn. 1995, 355–364. [Google Scholar]
- Banno, M.; Takewaka, S.; Kuriyama, Y. Multidecadal shoreline evolution due to large-scale beach nourishment -Japanese Sand Engine? Proc. Coast. Dyn. 2017, 820–829. [Google Scholar]
- Katoh, K. Hazaki Oceanographical Research Station (HORS). Mar. Technol. Soc. J. 1997, 31, 49–56. [Google Scholar]
- Kuriyama, Y. Medium-term bar behavior and associated sediment transport at Hasaki, Japan. J. Geophys. Res.-Oceans 2002, 107, 12. [Google Scholar] [CrossRef]
- Katoh, K.; Yanagishima, S.; Isogami, T.; Murakami, H. Wave set-up near the shoreline—Field observation at HORF. Rep. Port Harbour Res. Inst. 1989, 28, 1–41. [Google Scholar]
- Galal, E.M.; Takewaka, S. The influence of alongshore and cross-shore wave energy flux on large- and small-scale coastal erosion patterns. Earth Surf. Process. Landf. 2011, 36, 953–966. [Google Scholar] [CrossRef]
- Kuriyama, Y.; Takahashi, K.; Yanagishima, S.; Tomita, T. Beach profile change at Hasaki, Japan, caused by 5-m-high tsunami due to the 2011 off the Pacific coast of Tohoku Earthquake. Mar. Geol. 2014, 355, 234–243. [Google Scholar] [CrossRef]
- Kuriyama, Y.; Mochizuki, N.; Nakashima, T. Influence of vegetation on aeolian sand transport rate from a backshore to a foredune at Hasaki, Japan. Sedimentology 2005, 52, 1123–1132. [Google Scholar] [CrossRef]
- Yokobori, M.; Kuriyama, Y.; Shimozono, T.; Tajima, Y. Numerical simulation of volume change of the backshore induced by cross-shore aeolian sediment transport. J. Mar. Sci. Eng. 2020, 8, 438. [Google Scholar] [CrossRef]
- Ruessink, B.G.; Kroon, A. The behavior of a multiple bar system in the nearshore zone of Terschelling, The Netherlands: 1965–1993. Mar. Geol. 1994, 121, 187–197. [Google Scholar] [CrossRef]
- Kuriyama, Y.; Ito, Y.; Yanagishima, S. Medium-term variations of bar properties and their linkages with environmental factors at Hasaki, Japan. Mar. Geol. 2008, 248, 1–10. [Google Scholar] [CrossRef]
- Hemer, M.; Fan, Y.; Mori, N.; Semedo, A.; Wang, X.L. Projected changes in wave climate from a multi-model ensemble. Nat. Clim. Chang. 2013, 3, 471–476. [Google Scholar] [CrossRef]
- Bruun, P. SLR as a cause of shore erosion. J. Waterw. Harbors Div. 1962, 88, 117–132. [Google Scholar]
- Kuriyama, Y.; Yanagishima, S. Regime shifts in the multi-annual evolution of a sandy beach profile. Earth Surf. Process. Landf. 2018, 43, 3133–3141. [Google Scholar] [CrossRef]
- Yanagishima, S. Characteristic of grain size change at the Hasaki Coast. Tech. Note Port Airport Res. Inst. 2016, 1317, 1–42. [Google Scholar]


| Site | Country | Obs. Start | Obs. End | Obs. Frequency | # of Profile | Refs. |
|---|---|---|---|---|---|---|
| Hasaki | Japan | 1986 | Continuing | Daily/weekly | 1 | text |
| Duck | USA | 1981 | Continuing | Biweekly | 1 | [13,14,15] |
| Narrabeen-Collaroy | Australia | 1976 | Continuing | Monthly | 5 | [16,17,18] |
| Moruya | Australia | 1972 | Continuing | Monthly | 4 | [24,25,26] |
| Ogata | Japan | 1973 | 2008 | Monthly | 1 | [19] |
| Ajigaura | Japan | 1976 | 1998 | Weekly | 1 | [20] |
Publisher’s Note: MDPI stays neutral with regard to jurisdictional claims in published maps and institutional affiliations. |
© 2020 by the authors. Licensee MDPI, Basel, Switzerland. This article is an open access article distributed under the terms and conditions of the Creative Commons Attribution (CC BY) license (http://creativecommons.org/licenses/by/4.0/).
Share and Cite
Banno, M.; Nakamura, S.; Kosako, T.; Nakagawa, Y.; Yanagishima, S.-i.; Kuriyama, Y. Long-Term Observations of Beach Variability at Hasaki, Japan. J. Mar. Sci. Eng. 2020, 8, 871. https://doi.org/10.3390/jmse8110871
Banno M, Nakamura S, Kosako T, Nakagawa Y, Yanagishima S-i, Kuriyama Y. Long-Term Observations of Beach Variability at Hasaki, Japan. Journal of Marine Science and Engineering. 2020; 8(11):871. https://doi.org/10.3390/jmse8110871
Chicago/Turabian StyleBanno, Masayuki, Satoshi Nakamura, Taichi Kosako, Yasuyuki Nakagawa, Shin-ichi Yanagishima, and Yoshiaki Kuriyama. 2020. "Long-Term Observations of Beach Variability at Hasaki, Japan" Journal of Marine Science and Engineering 8, no. 11: 871. https://doi.org/10.3390/jmse8110871
APA StyleBanno, M., Nakamura, S., Kosako, T., Nakagawa, Y., Yanagishima, S.-i., & Kuriyama, Y. (2020). Long-Term Observations of Beach Variability at Hasaki, Japan. Journal of Marine Science and Engineering, 8(11), 871. https://doi.org/10.3390/jmse8110871