Article

Investigation on the Emission Characteristics with a Wet-Type Exhaust Gas Cleaning System for Marine Diesel Engine Application

1
Division of Marine Mechatronics, Mokpo National Maritime University, Mokpo 58628, Korea
2
Techwin Co., Ltd., Cheongju 28580, Korea
3
Division of Marine Engineering, Mokpo National Maritime University, Mokpo 58628, Korea
*
Author to whom correspondence should be addressed.
J. Mar. Sci. Eng. 2020, 8(11), 850; https://doi.org/10.3390/jmse8110850
Submission received: 22 September 2020 / Revised: 10 October 2020 / Accepted: 23 October 2020 / Published: 28 October 2020
(This article belongs to the Section Ocean Engineering)

Abstract

:
Global air pollution regulations are becoming stricter for large diesel engines powering automobiles and ships. In the automotive sector, Euro 4 regulations came into force in January 2013 in accordance with European Union (EU) emission standards for heavy-duty diesel engines and are based on steady-state testing. In the marine sector, the International Maritime Organization (IMO) Maritime Environment Protection Committee (MEPC) is a group of experts who discuss all problems related to the prevention and control of marine pollution from ships, such as efforts to reduce ozone-depleting substances and greenhouse gas emissions. To reduce the harmful emissions from marine diesel engines, a wet-type exhaust gas cleaning system was developed in this study. As a test, seawater, electrolyzed water, and sodium hydroxide were sequentially injected into the exhaust gas. SO2 was reduced by 98.7–99.6% with seawater injection, NOx by 43.2–48.9% with electrolyzed water injection, and CO2 by 28.0–33.3% with sodium hydroxide injection.

1. Introduction

Global air pollution regulations for large diesel engines powering automobiles and ships are becoming stricter [1]. In the automotive sector, Euro 4 regulations came into force in January 2013 in accordance with European Union (EU) emission standards for heavy-duty diesel engines based on steady-state testing [1]. EU regulations for exhaust gas emissions have continually become more stringent starting from Euro 1 in 1992 to Euro 4 in 2013 [1]. In the marine sector, Tier 3 regulations enacted by the Marine Environment Protection Committee (MEPC) of the International Maritime Organization (IMO) entered into force on 1 January 2016 [2]. The MEPC is a group of experts who discuss all problems related to the prevention and control of marine pollution from ships, such as efforts to reduce ozone-depleting substances and greenhouse gas (GHGs) emissions [2]. In particular, they review the prevention and regulation of marine pollution by ships and carry out functions related to the adoption and amendment of related international conventions [2]. The IMO headquarters in London, UK, holds the MEPC international conference once or twice a year [2,3,4]. Many researchers and stakeholders such as marine engine manufacturers, shipbuilding companies, and shipping companies are striving to reduce emissions from marine diesel engines. Marine diesel engines use the lowest-grade fuel and discharge more harmful exhaust gases than other transport diesel engines [5]. Therefore, studies have been conducted to improve the combustion process by modifying the fuel to reduce emissions from marine diesel engines. Ryu et al. [6,7,8] attempted to improve the performance and lower the emissions of a diesel engine by mixing dimethyl ether with heavy fuel oil (HFO). Ryu et al. [9,10,11] also applied two types of fuel additives based on Ca and Fe to reduce the fuel consumption and emissions of marine diesel engines. Geng et al. [12] applied waste cooking oil to a marine diesel engine. Katayama et al. [13] applied Jatropha oil, which is a biofuel, to marine diesel engines. Hashimoto et al. [14] mixed palm oil, which is a biofuel, with gas oil and MDO (marine diesel oil) and investigated the combustion characteristics. Nam et al. [15] applied an emulsion fuel, which is a mixture of fuel and water, to a diesel engine and examined the combustion and emission characteristics. Panomsuwan et al. [16] reduced pollutant emissions by applying non-thermal plasma technology to a marine diesel engine. Exhaust gas recirculation (EGR) is widely used to reduce the NOx emissions of diesel and commercial vehicles [17,18]. There have also been many studies on using EGR in ships. Selective catalytic reduction (SCR) is being applied to large vehicles such as diesel engine trucks and in onshore power plants to reduce NOx [19]. It has also been installed in many ships. Ryu et al. [20] reported the installation of SCR to reduce NOx emissions from ships to meet the IMO MEPC Tier 3 regulations. Although there are regulations on the particulate matter (PM) emissions of automotive diesel engines, there are no such regulations for marine diesel engines yet. However, it is expected that PM regulations will be enacted in the future. Ntziachristos et al. [21] researched the reduction in PM emissions from marine diesel engines. In addition, there have been many discussions on regulations to reduce SOx emissions from ships. Ships operating in a sulfur environmental control area (SECA) are obligated to use fuel with low sulfur content. The use of 1.0% m/m low-sulfur fuel was enforced in 2010, and the regulation was strengthened in 2015 to the use of 0.1% m/m low-sulfur fuel. In other areas outside an SECA, the use of 3.5% m/m low-sulfur fuel has been enforced since 2012. According to Regulation 14.8 of the International Convention for the Prevention of Marine Pollution from Ships (MARPOL) Annex 6, the use of marine fuel oil with 0.5% m/m or less sulfur content was enforced for ships operating anywhere in the world from 1 January 2020 (Regulation 14.1.3 of MARPOL Annex 6) [4].
Many measures are being suggested to reduce SOx emissions, such as scrubbers. Table 1 lists the sulfur content in fuel oil required by the IMO. The IMO also controls improvements in energy efficiency and GHGs emissions through various regulations. Table 2 lists the regulations for CO2 reduction. CO2 is a GHG that is cited as the main cause of global warming. Table 2 lists the CO2 emission factors by the type of fuel used in ships [4].
Various technologies are available for reducing NOx, SOx, and CO2. This study applied the wet-type exhaust gas cleaning system to diesel engines. This system is an after-treatment technology that can reduce the three harmful exhaust gas components simultaneously. Ryu et al. [22] suggested reducing NOx by injecting electrolyzed water to exhaust gas. In this study, however, seawater, electrolyzed seawater, and sodium hydroxide were sprayed sequentially onto exhaust gas from a diesel engine to reduce NOx, SOx, and CO2. The NOx emitted from a marine diesel engine contains 90–95% NO, which is insoluble. NO2, which is generated from the oxidation of NO, is known to have 20 times higher solubility in water compared to NO [23,24]. Therefore, NO was oxidized to NO2 through the gas–liquid contact of electrolyzed seawater (electrolyzed water) and exhaust gas to reduce NOx generation. An et al. [25] oxidized NO and absorbed NO2 in exhaust gas by spraying a negative strong acidic solution and positive strong basic solution sequentially. These solutions were obtained through membrane electrolysis, which is easily applicable to ships because of the ready supply of seawater. However, membrane electrolysis of seawater has the disadvantage of needing a strong acid with pH 2–3 and generating a large volume of chlorine gas. To address this disadvantage, Kim et al. [23,24] tried to reduce NOx through non-membrane seawater electrolysis. In Ryu et al. [22], Kim et al. [23,24] and An et al. [25], only NOx reduction was presented, but in this paper, NOx, SOx and CO2 reduction were also presented.
An experimental apparatus was planned, designed, and installed for research on NOx and SOx reduction using real seawater in an indirect injection type diesel engine. Reducing CO2 with sodium hydroxide was also researched. This apparatus for reducing exhaust gas with seawater can be used not only on ships but also in thermal power plants by the sea.

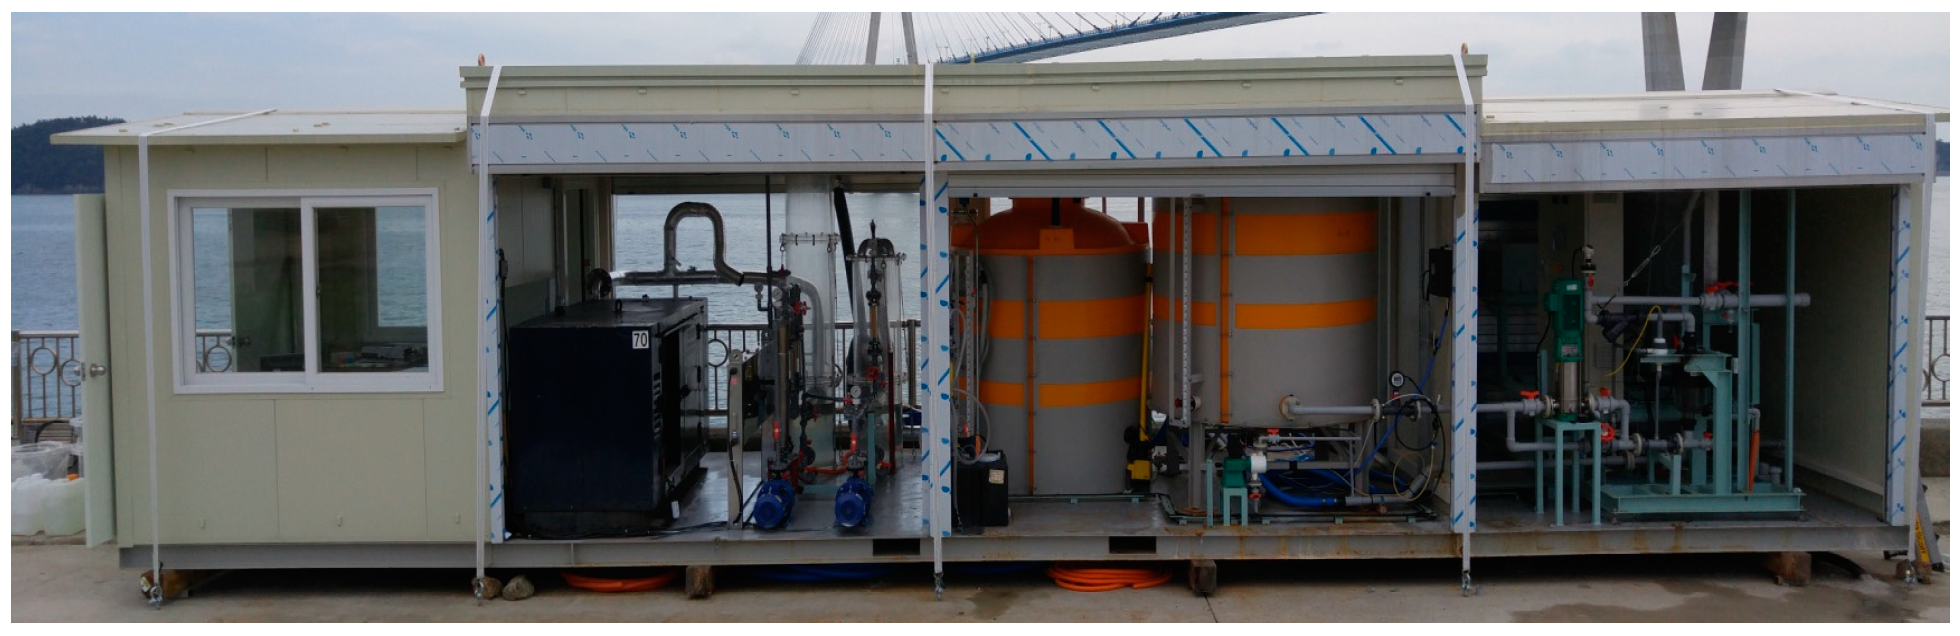
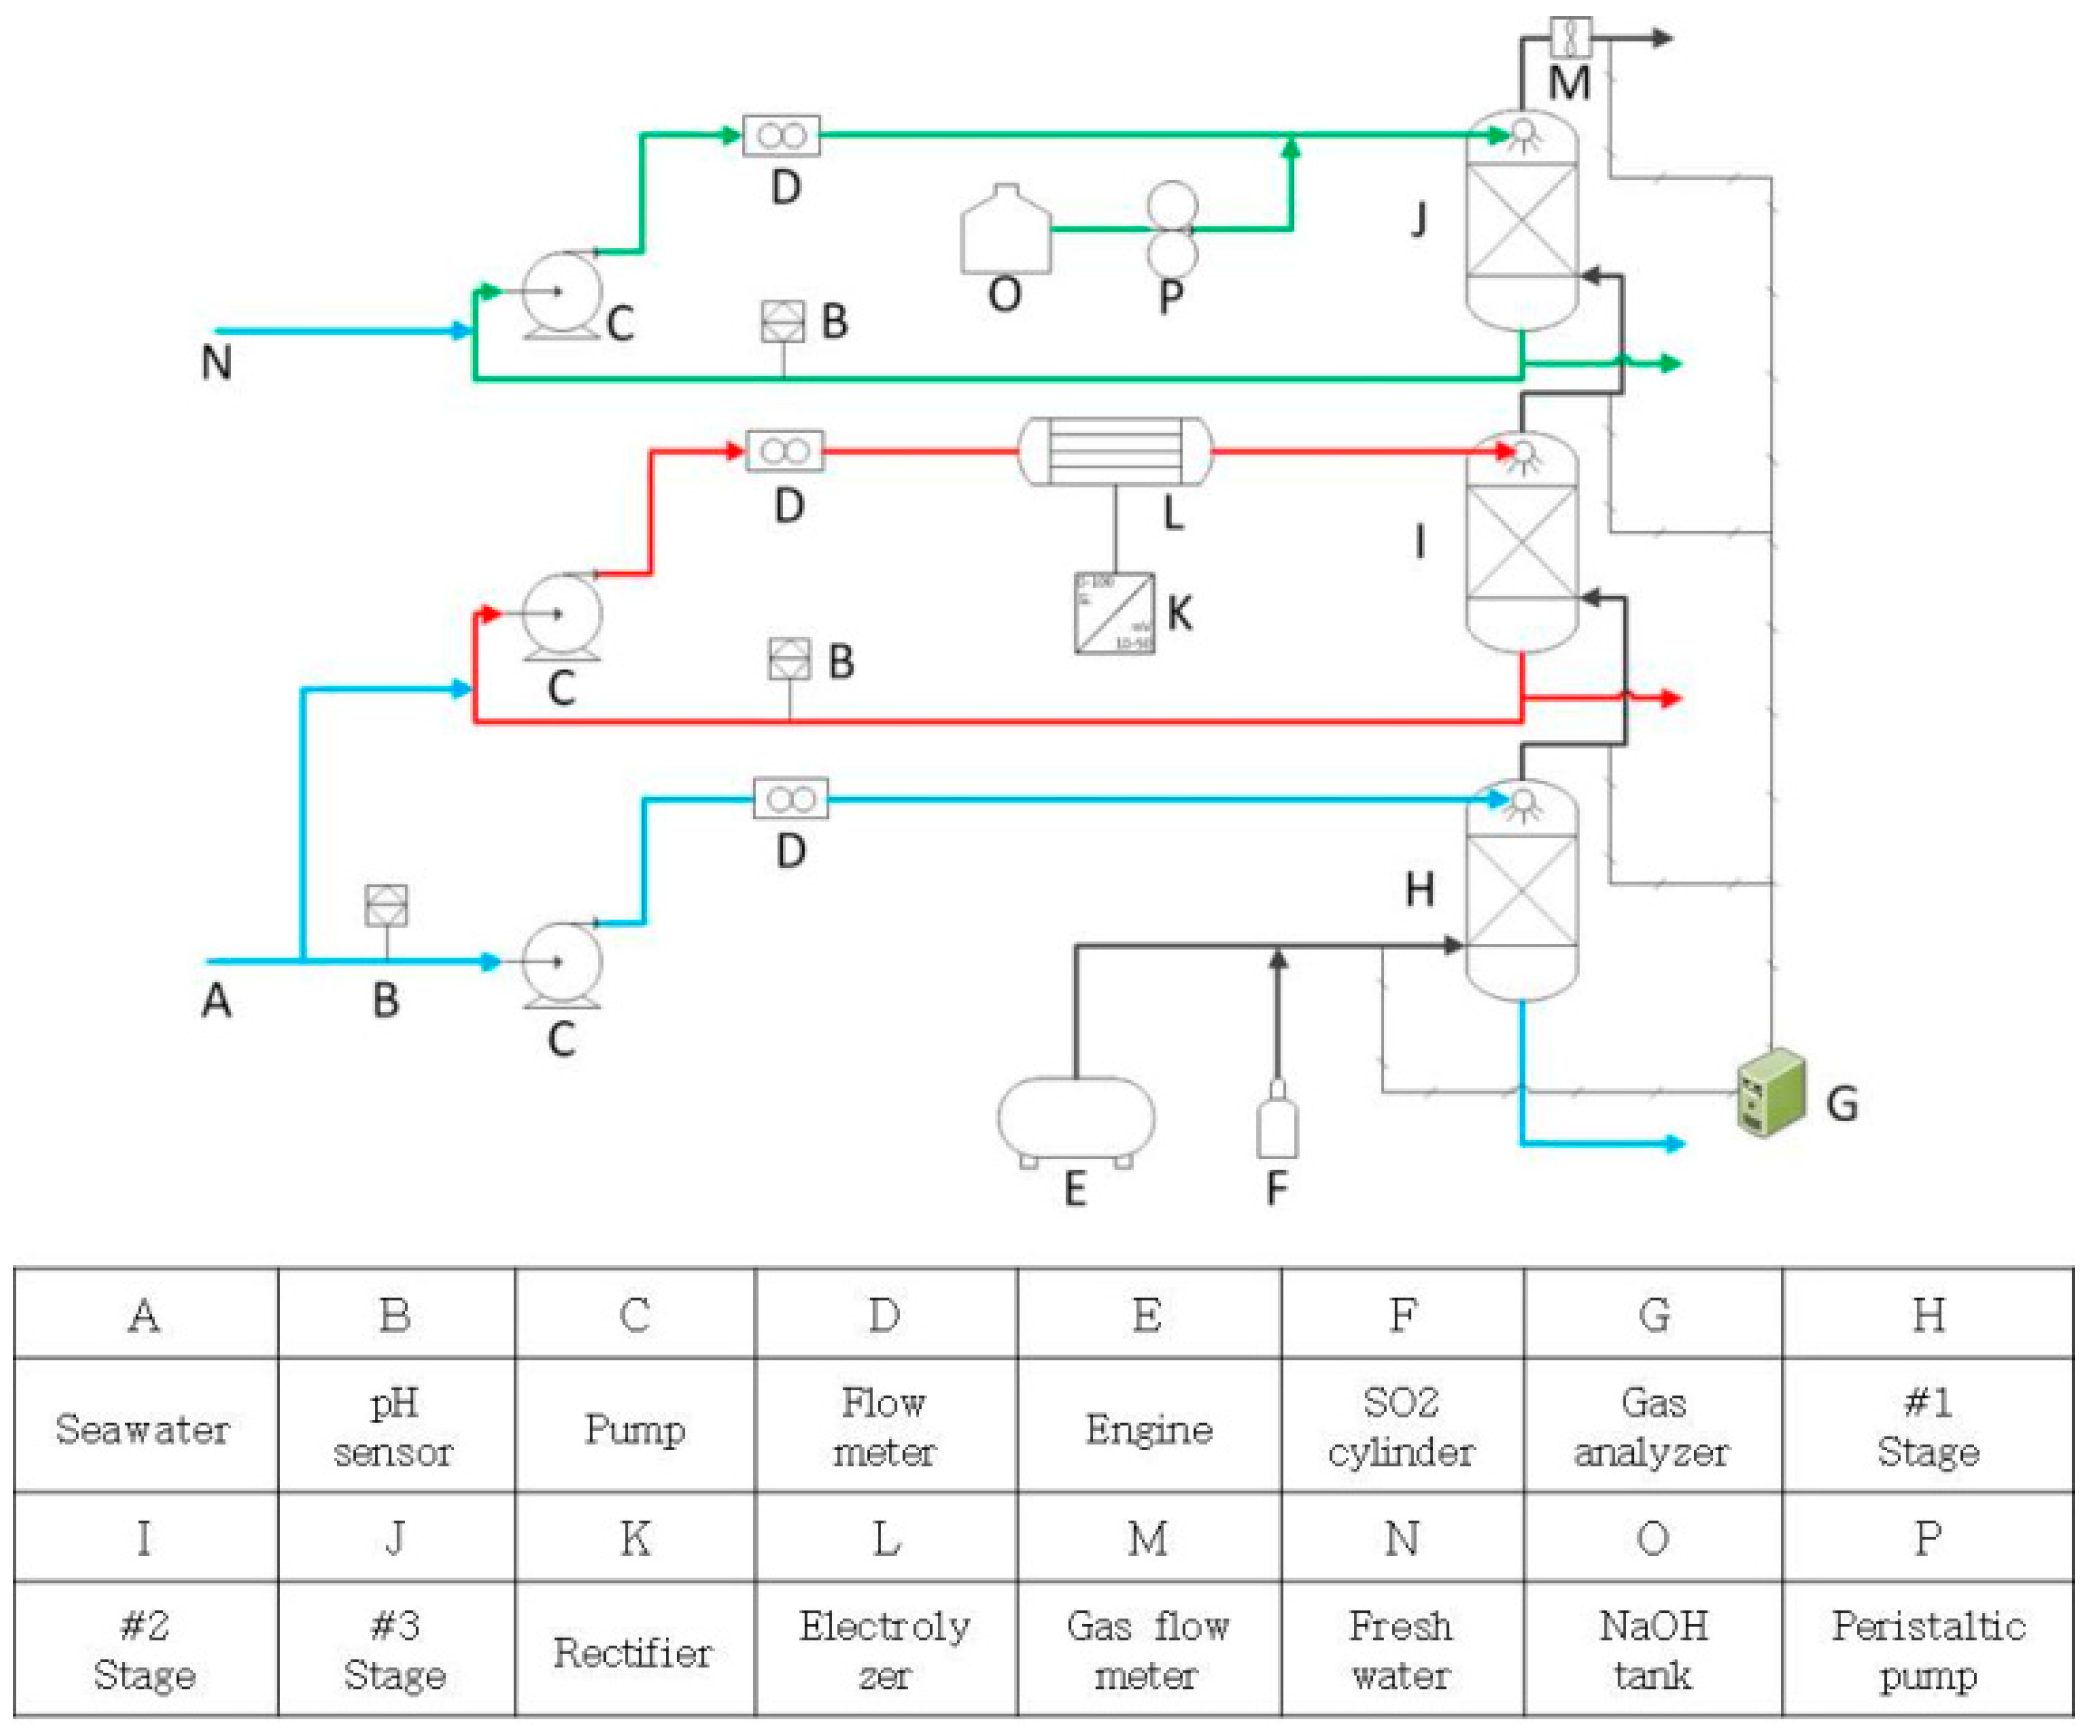
2. Experimental Apparatus and Method

2.1. Engine Test

In this study, a four-stroke diesel engine of the indirect injection (IDI) type was used. This is a small engine with four cylinders that has a compression ratio of 22:1. Table 3 outlines the engine specifications.
Figure 1 shows the entire experimental apparatus used in this study. To remove NOx, SOx, and CO2 generated from engine combustion, real seawater that had not been electrolyzed, electrolyzed seawater (electrolyzed water), and a sodium hydroxide (NaOH) solution diluted to a certain concentration were sprayed sequentially onto exhaust gas discharged from a diesel engine. In general, nitrogen compounds refer to the combination of NO and NO2 [26]. The nitrogen compounds were measured by using 350-Maritime from TESTO. This model can measure the concentrations of NO, NO2, SO2, and CO2 separately with electrochemical cells. The removal rates in the reactor were calculated as follows [22]:
Y a = c a , i c a , o c a , i × 100 %
where a denotes a chemical species such as NO, NO2, or NOx and Ci and Co denote the concentrations at the inlet and outlet, respectively, of the corresponding chemical species. After the electrolyzed water was sprayed, the inlet and outlet concentrations of NO/NO2/NOx were analyzed. Figure 2 shows a schematic diagram of the experimental apparatus. The pH/OPR/temperature sensors were installed in the pipe for electrolyzed water to examine the effects of operating variables such as the temperature and pH of the electrolyzed water on the NOx removal performance. The VSTAR12 model of Orion was used as the sensor. A magnet-type pump (Yusung, NH-3024PH-CV-5HP) was used to spray the electrolyzed water, and an area-type flowmeter (COREA flow, HGF-1-P) was used to measure the flow of the sprayed electrolyzed water. To produce an oxidant through the electrolysis of seawater, which was one of the purposes of this study, a non-membrane electrolysis tank with a capacity of 1.25 kg Cl2/day, produced by T company, was used, and a three-phase 380 V AC was applied through a rectifier (MK power, MK-50200G). This electrolysis tank was designed for the electrolysis of seawater and circulation of electrolyzed water with a structure that prevents the accumulation of scaling or particulate contaminants.
A scrubber for spraying electrolyzed water was produced as a packed tower with a residence time of 6.5 s, which is given in Equation (2). The filling material for improved gas–liquid contact efficiency was 1-in Tripack made of polypropylene material, and a spiral-type nozzle was used to spray the cleaning solution. Figure 3 shows the cleaning solution spray nozzle and packing. Table 4 lists the test conditions of the experimental apparatus.
R e s i d e n c e   t i m e   s   =   V o l u m e   o f   P a c k i n g   m 3 F l o w   r a t e   o f   g a s   Nm 3 / s
Table 5 presents the solubility of gases used in this study based on the data provided by Haynes [27].

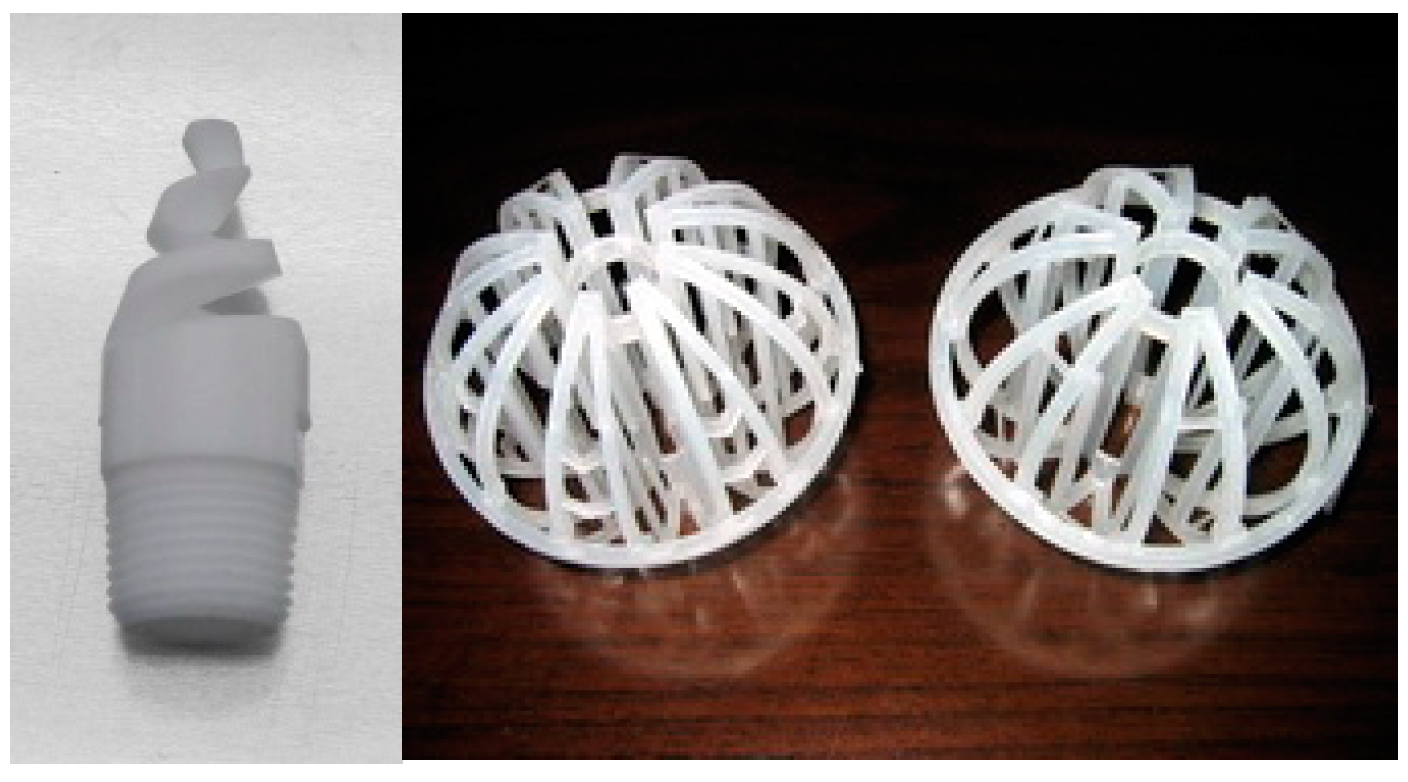
2.2. Oxidation and Reduction Agent

In this study, the oxidant was produced in real time through the electrolysis of seawater. The quantity of oxidant can be converted to the effective chlorine concentration (g Cl2/L), which is the quantities of chlorine (Cl2), hypochlorite ions, and hypochlorous acid (HOCl) converted to the equivalent amount of Cl2. This was measured with the following titration method:
(1)
Inject 1 mL of the sample into 25 mL of ultrapure water.
(2)
Add 1 g of potassium iodide and 1 mL of acetic acid.
(3)
Add two to three drops of 1% starch solution. The solution then turns reddish brown.
(4)
Add 0.1 N sodium thiosulfate to the reddish-brown solution and measure the amount added until it becomes colorless.
(5)
Determine the effective chlorine concentration as follows:
Available   chlorine g   C l 2 / L   =   C mL   × 3.545 S mL
where C is the titration amount of 0.1 N sodium thiosulfate and S is the sample injection amount.
In the No. 3 tower, sodium hydroxide diluted in water was sprayed as absorbent, and the concentration was measured according to the following procedure:
(1)
Add 1 mL of sample to 25 mL of ultrapure water.
(2)
Add two to three drops of phenolphthalein. The solution turns red.
(3)
Add 0.1 M hydrochloric acid to the red solution and measure the amount injected until it becomes colorless.
(4)
Determine the concentration of sodium hydroxide as follows:
Sodium   hydroxide g   NaOH / L = C mL   × 4 S mL
where C is the titration amount of 0.1 M hydrochloric acid and S is the sample injection amount.
Figure 4 shows the calculated concentrations of the oxidant and absorbent according to the operation time.

3. Results and Discussion

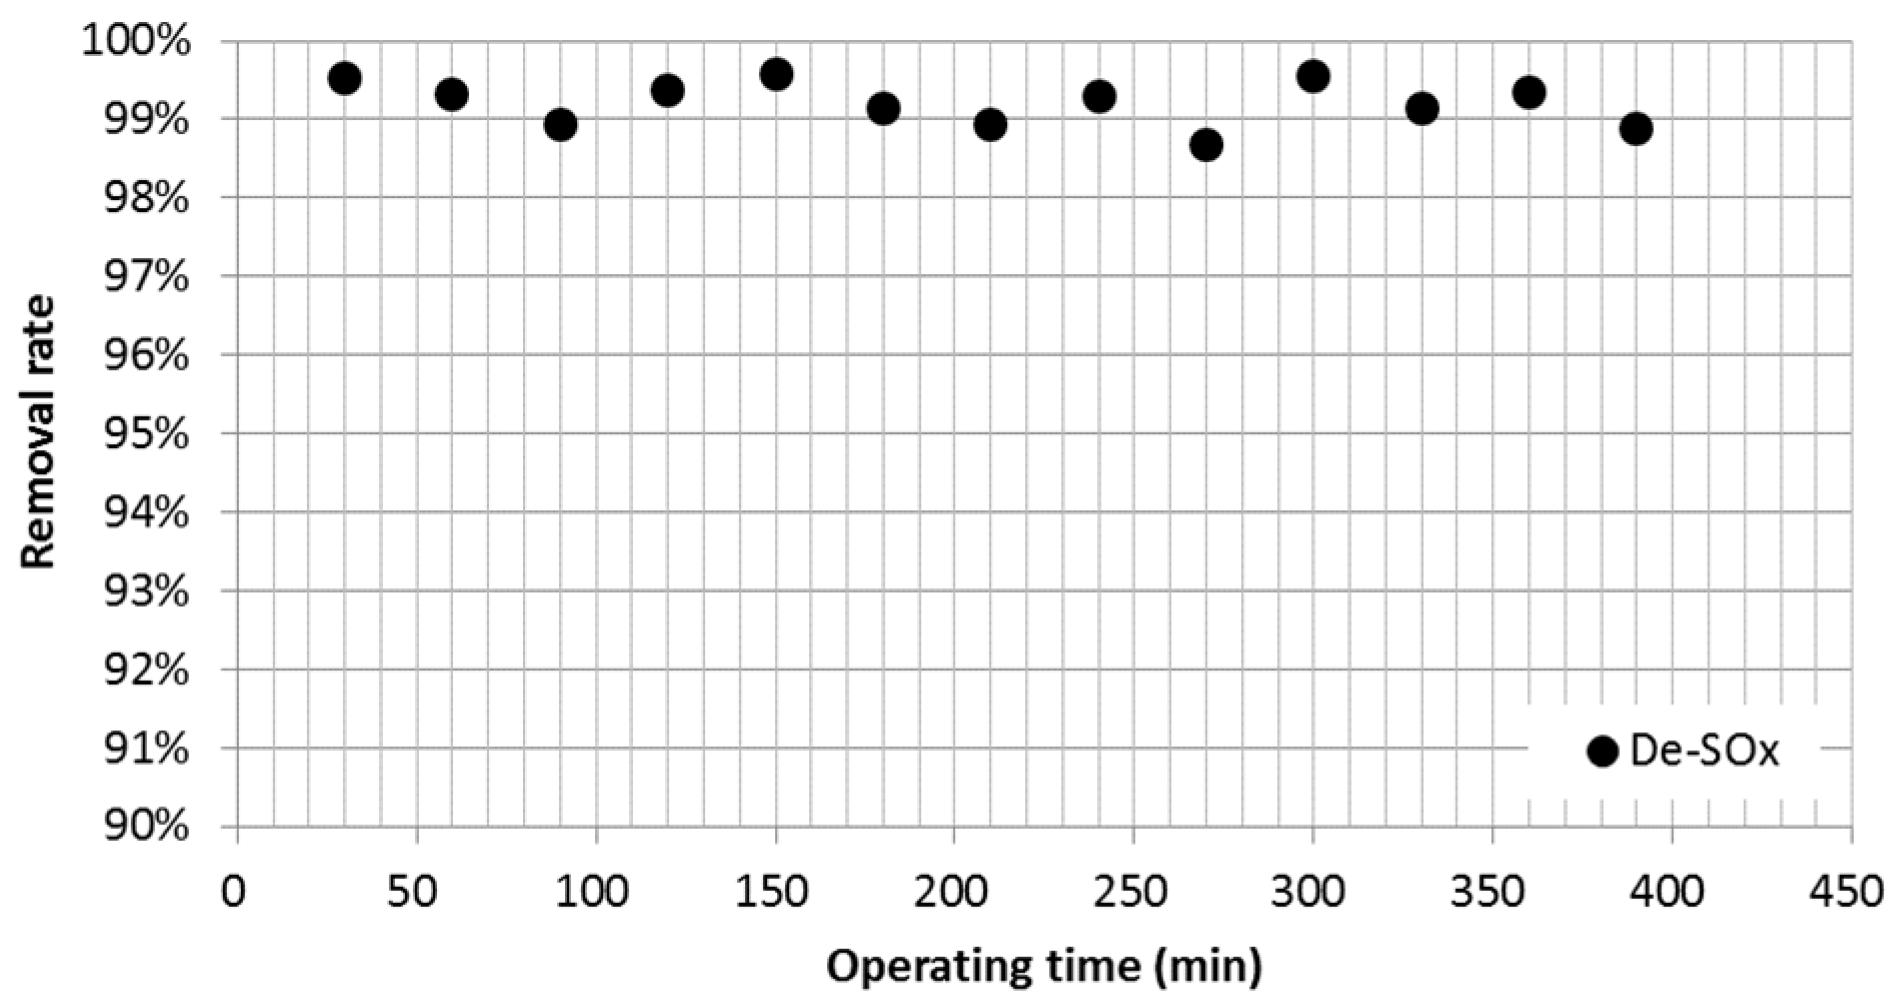
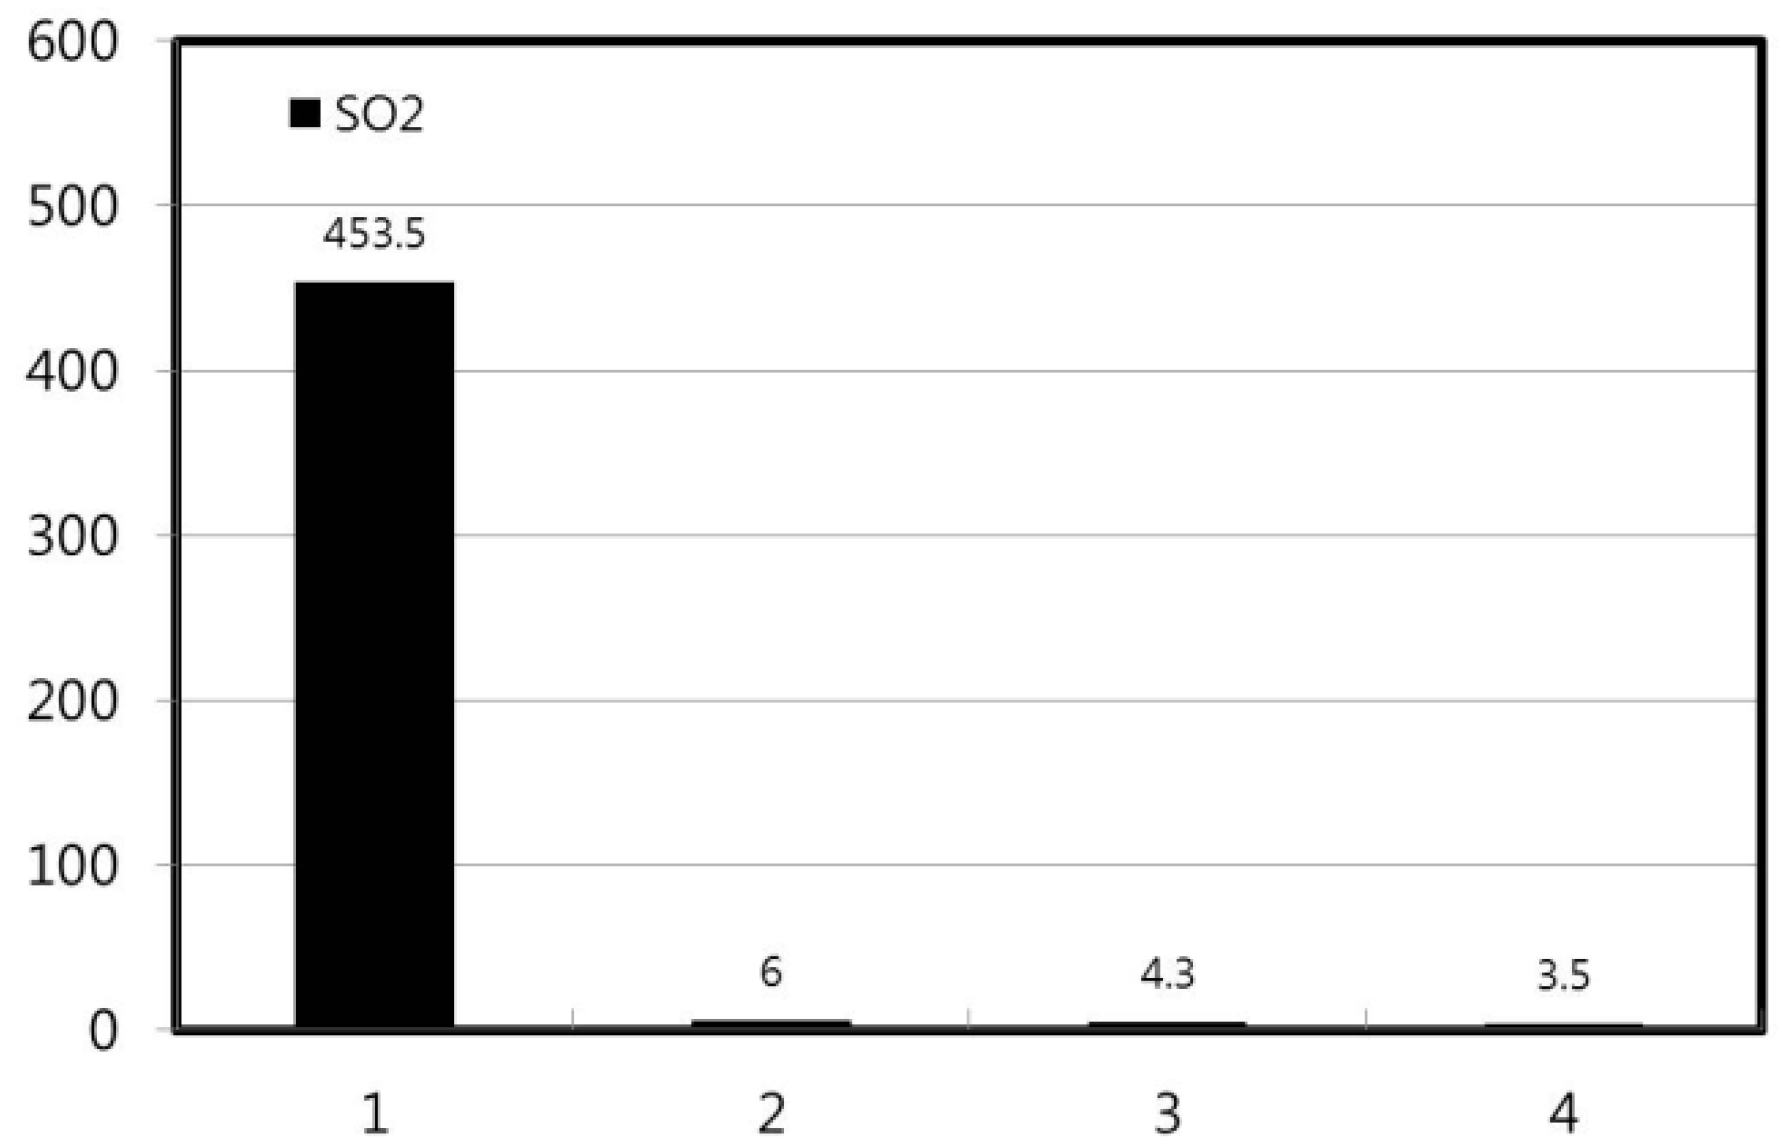
3.1. Sulfur Oxide (SOx) Emissions

SO2 gas was removed by using the alkalinity of seawater, as suggested by Andreasen et al. [28]. After SO2 dissolves in water, it exists as bisulfate ions (HSO3) and sulfate ions (SO32). As a result, the solution reaches equilibrium because of the decreased pH, and the dissolved CO2 is discharged. In this study, the diluted solutions of seawater, electrolyzed water, and sodium hydroxide were sequentially sprayed in each stage. The main purpose of the No. 1 tower, in which seawater was sprayed, was to remove SO2 and particulate contaminants. When a large amount of particulate contaminants in the exhaust gas flows into the No. 2 tower, which operates in a closed loop, this can negatively influence the efficiency of the electrolysis tank. When SO2 is absorbed, it decreases the pH of the cleaning water. When the pH of the electrolyzed water decreases to neutral or lower, the dissolved Cl2 can be discharged. This implies the loss of oxidant by energy input. Therefore, prior removal of and particulate contaminants in the No. 1 tower can minimize the above adverse effects. Figure 5 illustrates the SO2 removal rate of this system. The SO2 removal rate was 98.7–99.6%, which indicates relatively stable operation. This confirms that at least 98% of SO2, which has high solubility in water, was removed with the No. 1 tower, as shown in Figure 6.
SO2 removal mechanism:
S O 2 g S O 2 a q
S O 2 a q   +   H 2 O l H S O 3 a q   +   H a q   +  
H S O 3 a q   +   H 2 O l S O 3 a q 2   +   H a q   +  
H C O 3 a q   +   H a q   +   C O 2 a q   +   H 2 O l
C O 2 a q C O 2 g

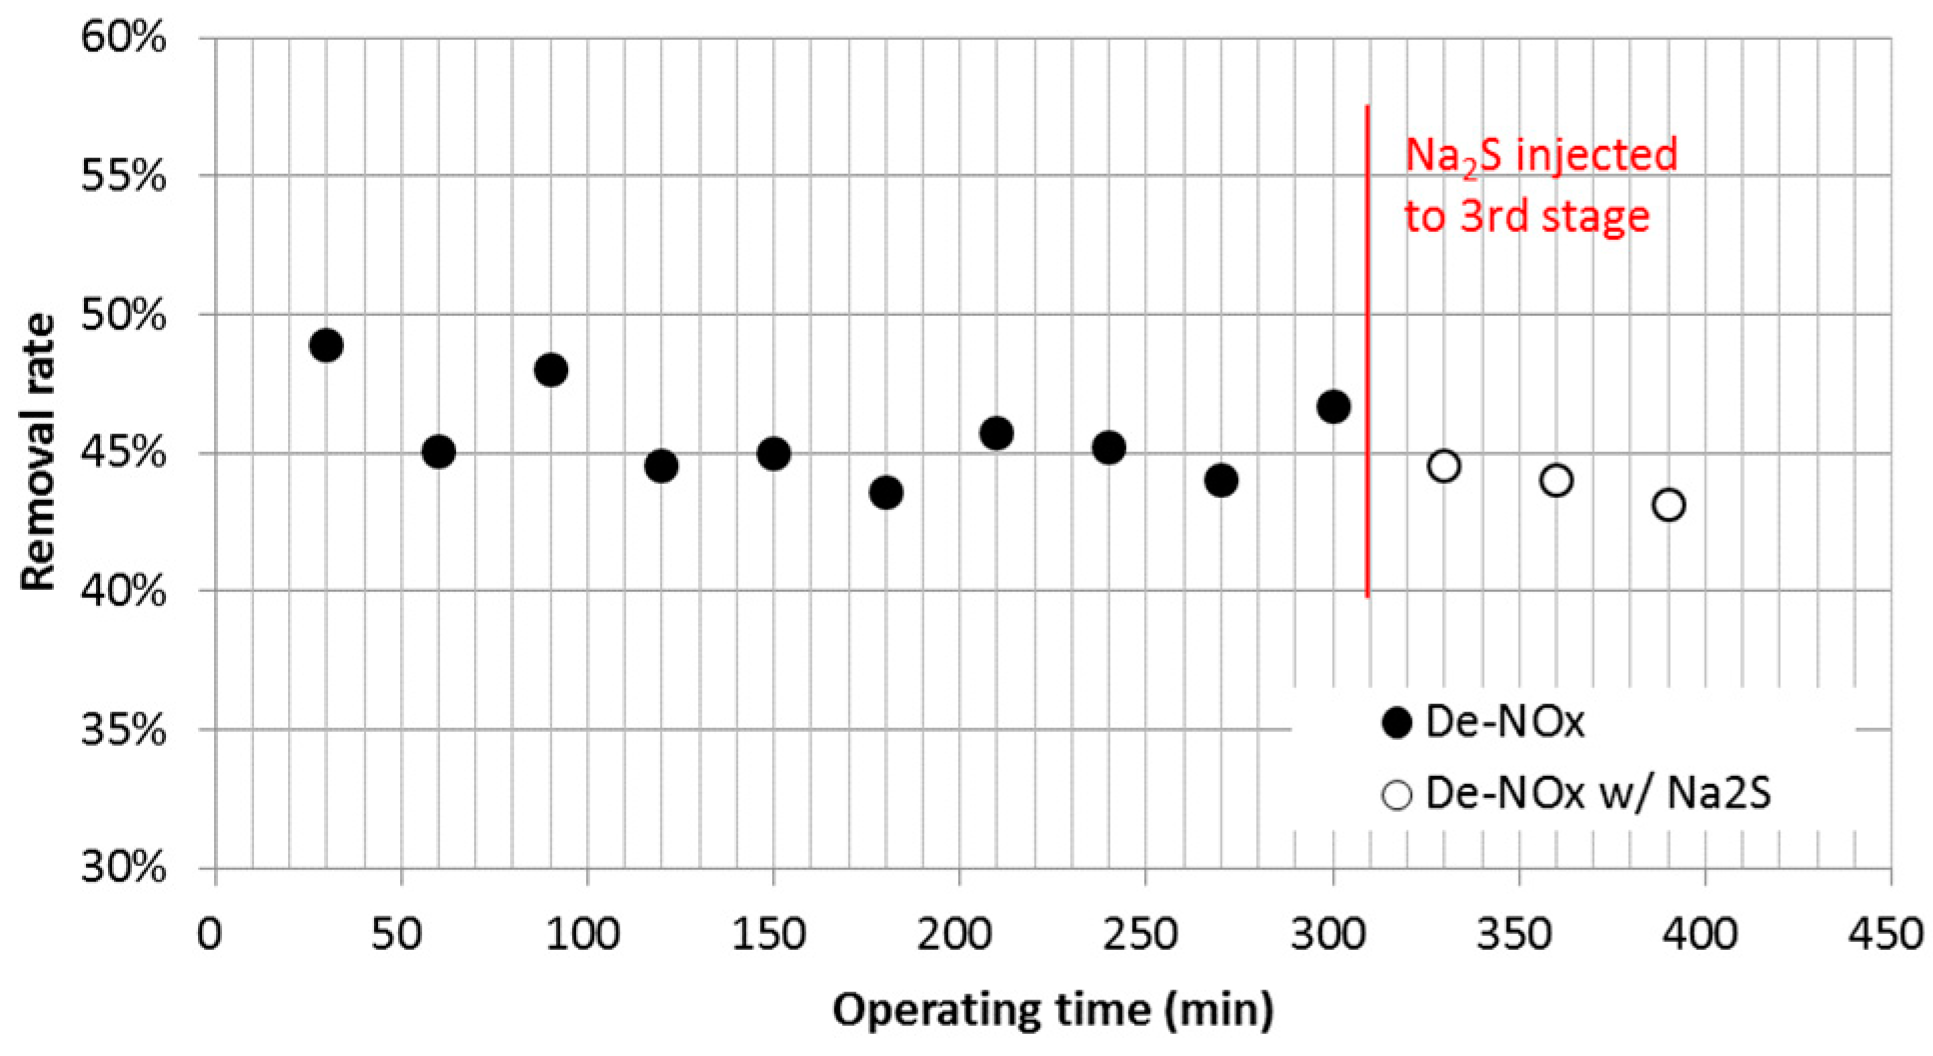
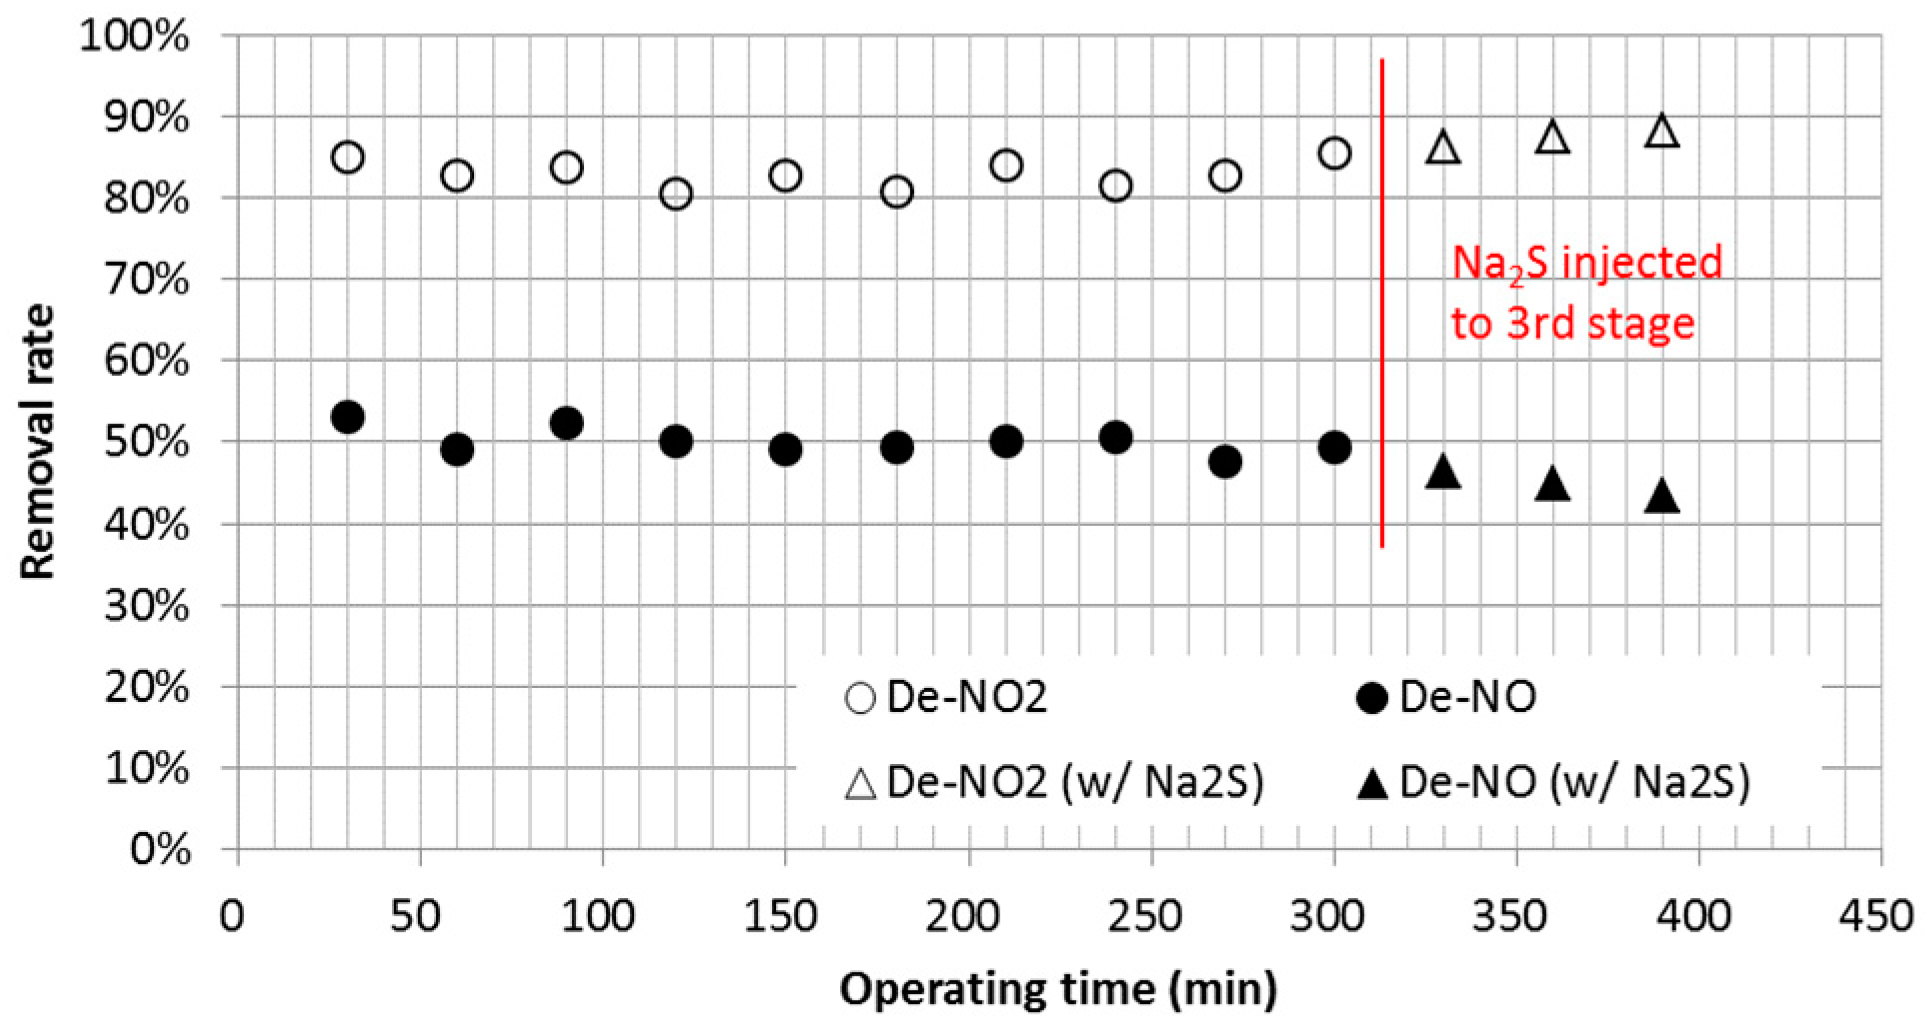
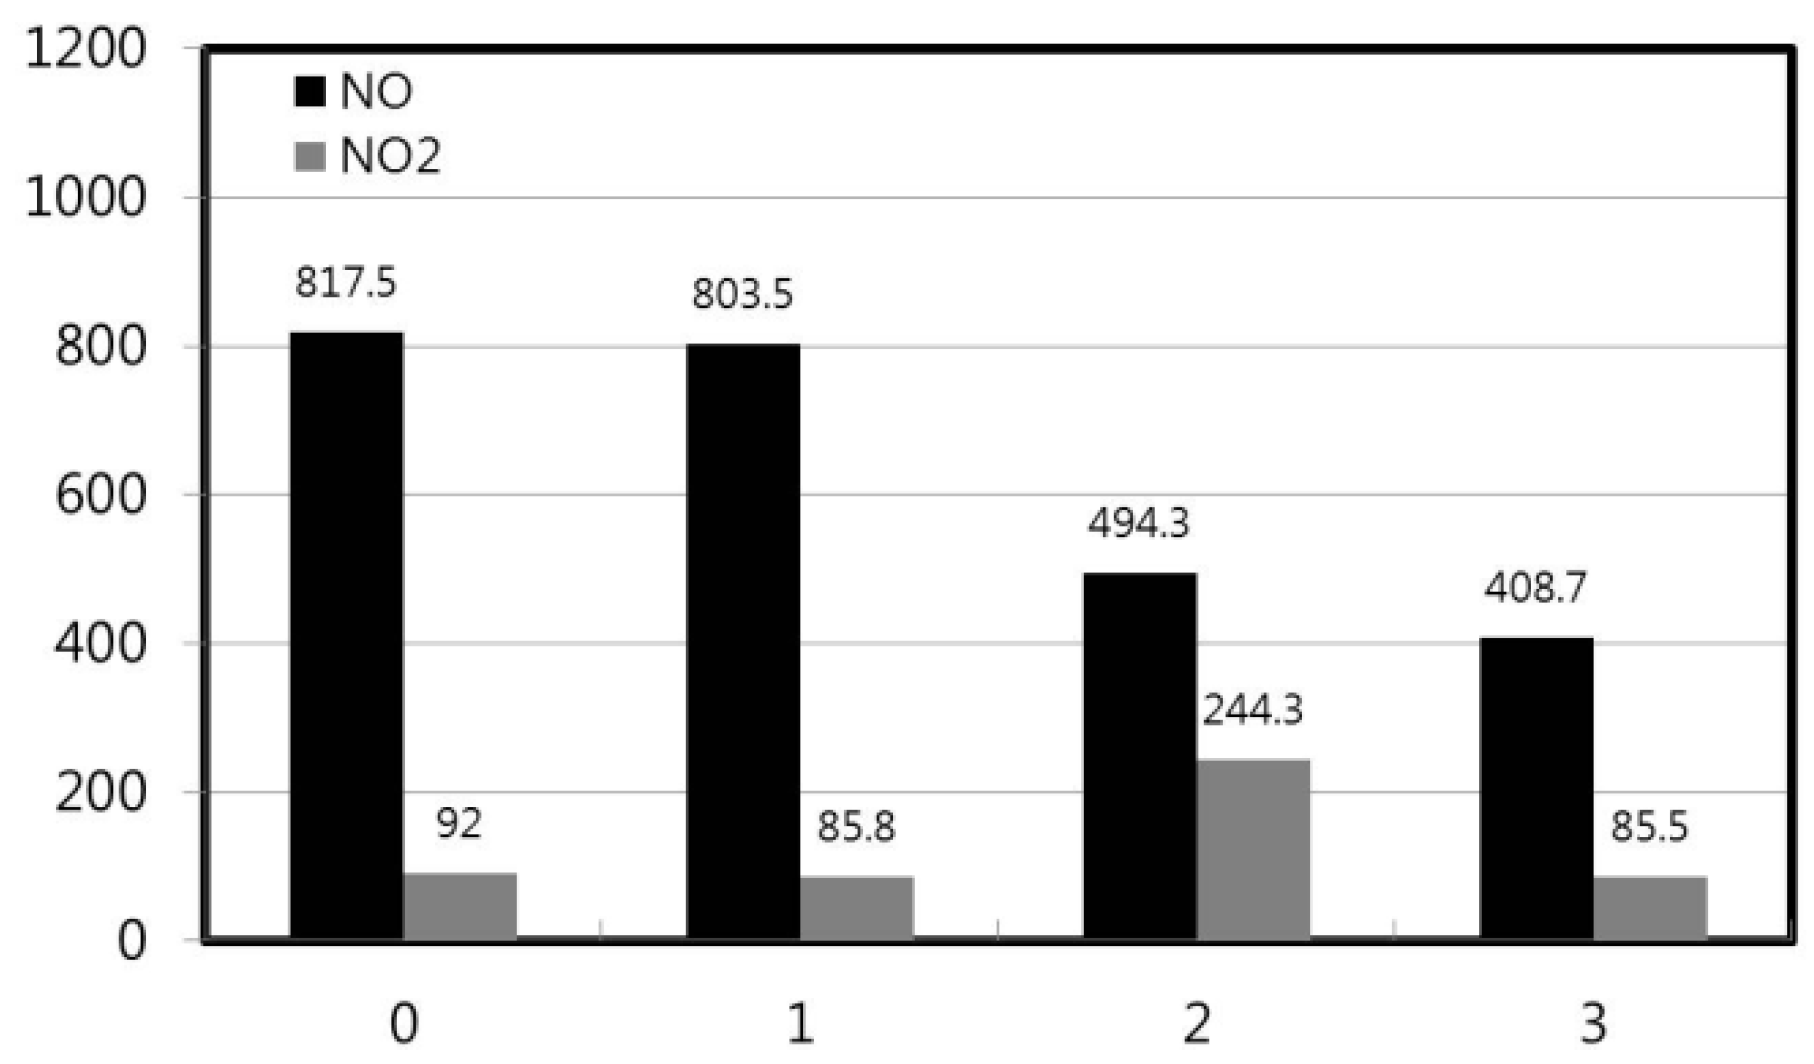
3.2. Nitric Oxide (NOx) Emissions

Wet-type NOx removal involves the oxidation of NO, which accounts for 90–95 vol% of NOx. Cl2 was used as the oxidant of NO in this study; it was produced by non-membrane electrolysis of NaCl in water. The Cl2 gas produced from the electrode surface quickly dissolves and exists as three chemical species. As shown in Figure 7, each chemical species reaches equilibrium according to the pH. When the pH is lower, the condition becomes more unstable, and gases can be discharged. HOCl, which is predominant in the weak acid domain, has an oxidizing power at least 80 times higher than that of OCl [29]. In this study, therefore, the condition of pH 6–7 was maintained so that HOCl would not be discharged as gas while maintaining the oxidizing power of the electrolyzed water, which was the cleaning solution for the No. 2 tower. The reducing agent sodium sulfide (Na2S) was injected in the No. 3 tower to improve the NOx removal performance, and its effect was observed.
The results indicated that the total NOx removal rate was 43.2–48.9%, as shown in Figure 8, and the injection of the reducing agent in the No. 3 tower showed a negative effect. To express the NO and NO2 removal rates separately, as shown in Figure 9, the NO removal rate decreased after injection of the reducing agent. This can be interpreted that the strong reducing agent Na2S reduced NO2 or NO3 to NO. Figure 10 shows the average concentrations of NO and NO2 at the outlet of each stage. The oxidation reaction of NO was dominant in the No. 2 tower, whereas the absorption of NO2 was dominant in the No. 3 tower. In the case of the No. 3 tower, in which the NaOH solution was sprayed, the NO oxidation rate was around 17%, unlike the No. 1 tower. This appears to be because both NO and NO2 were removed by reaction with NaOH.
NO/NO2 removal mechanism by electrolyzed seawater [25,30,31,32,33]:
N O g N O a q
N O a q   +     O C l a q N O 2 a q   +     C l a q
4 N O 2 a q   +   2 H 2 O l   +     O 2 g 4 H N O 3 a q
2 N O g   +   O 2 g N 2 O 4 g
N 2 O 4 g N 2 O 4 a q
N 2 O 4 a q   +   H 2 O l H N O 3 a q   +   H N O 3 a q
NO/NO2 removal mechanism by NaOH [25,30,31,32,33]:
N O a q   +   N O 2 a q   +   2 N a O H l N a N O 2 a q     +   N a N O 3 a q   +   H 2 O l
N O a q   +   N O 2 a q   +   2 N a O H l 2 N a N O 2 a q     +   H 2 O l
2 N O 2 a q   +   2 N a O H l N a N O 2 a q     +   N a N O 3 a q     +   H 2 O l
NO/NO2 removal mechanism by Na2S [34,35,36]:
S a q 2   +   H 2 O l H S a q   +   O H
N O 2 a q   +   H S a q N O 2 a q   +   H S
2 N O 2 a q   +   N a 2 S s   N 2 g   +   N a 2 S O 4 a q
3 Na 2 S s   +   8 HNO 3 aq 6 NaNO 3 aq   +   3 S s   +   2 NO g   +   H 2 O l

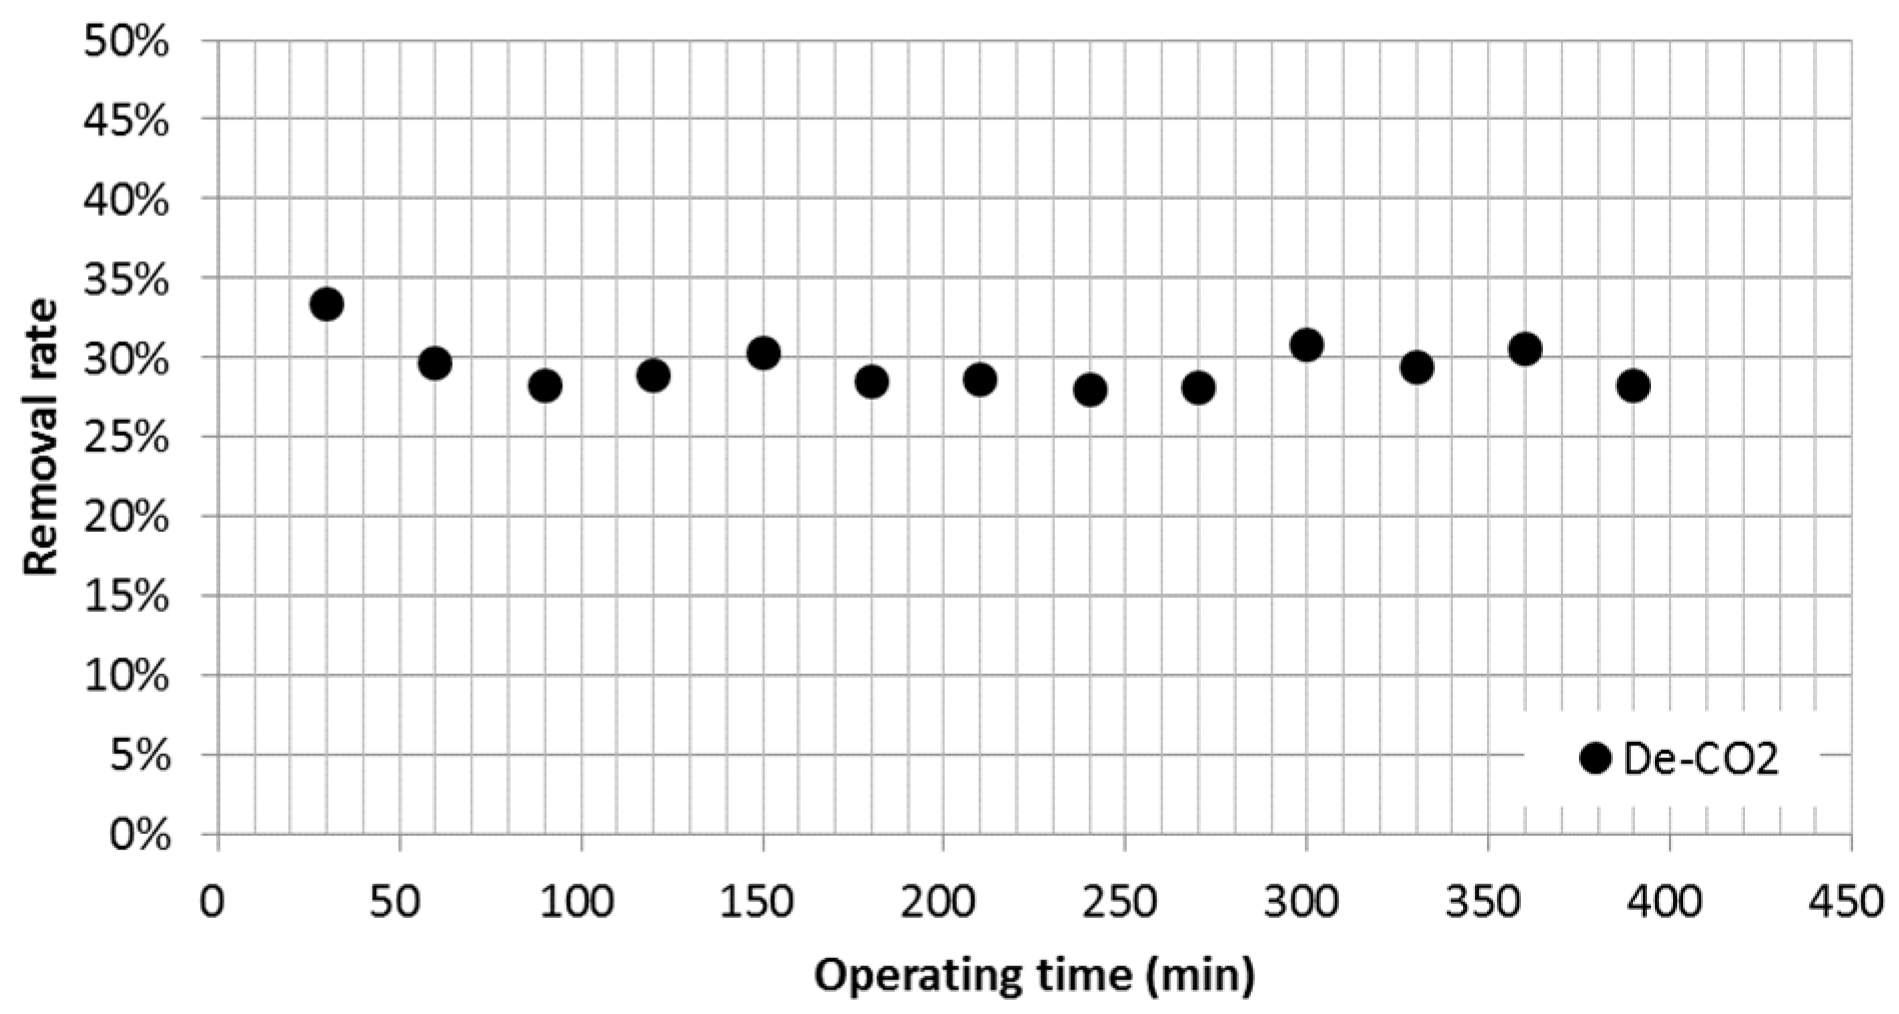
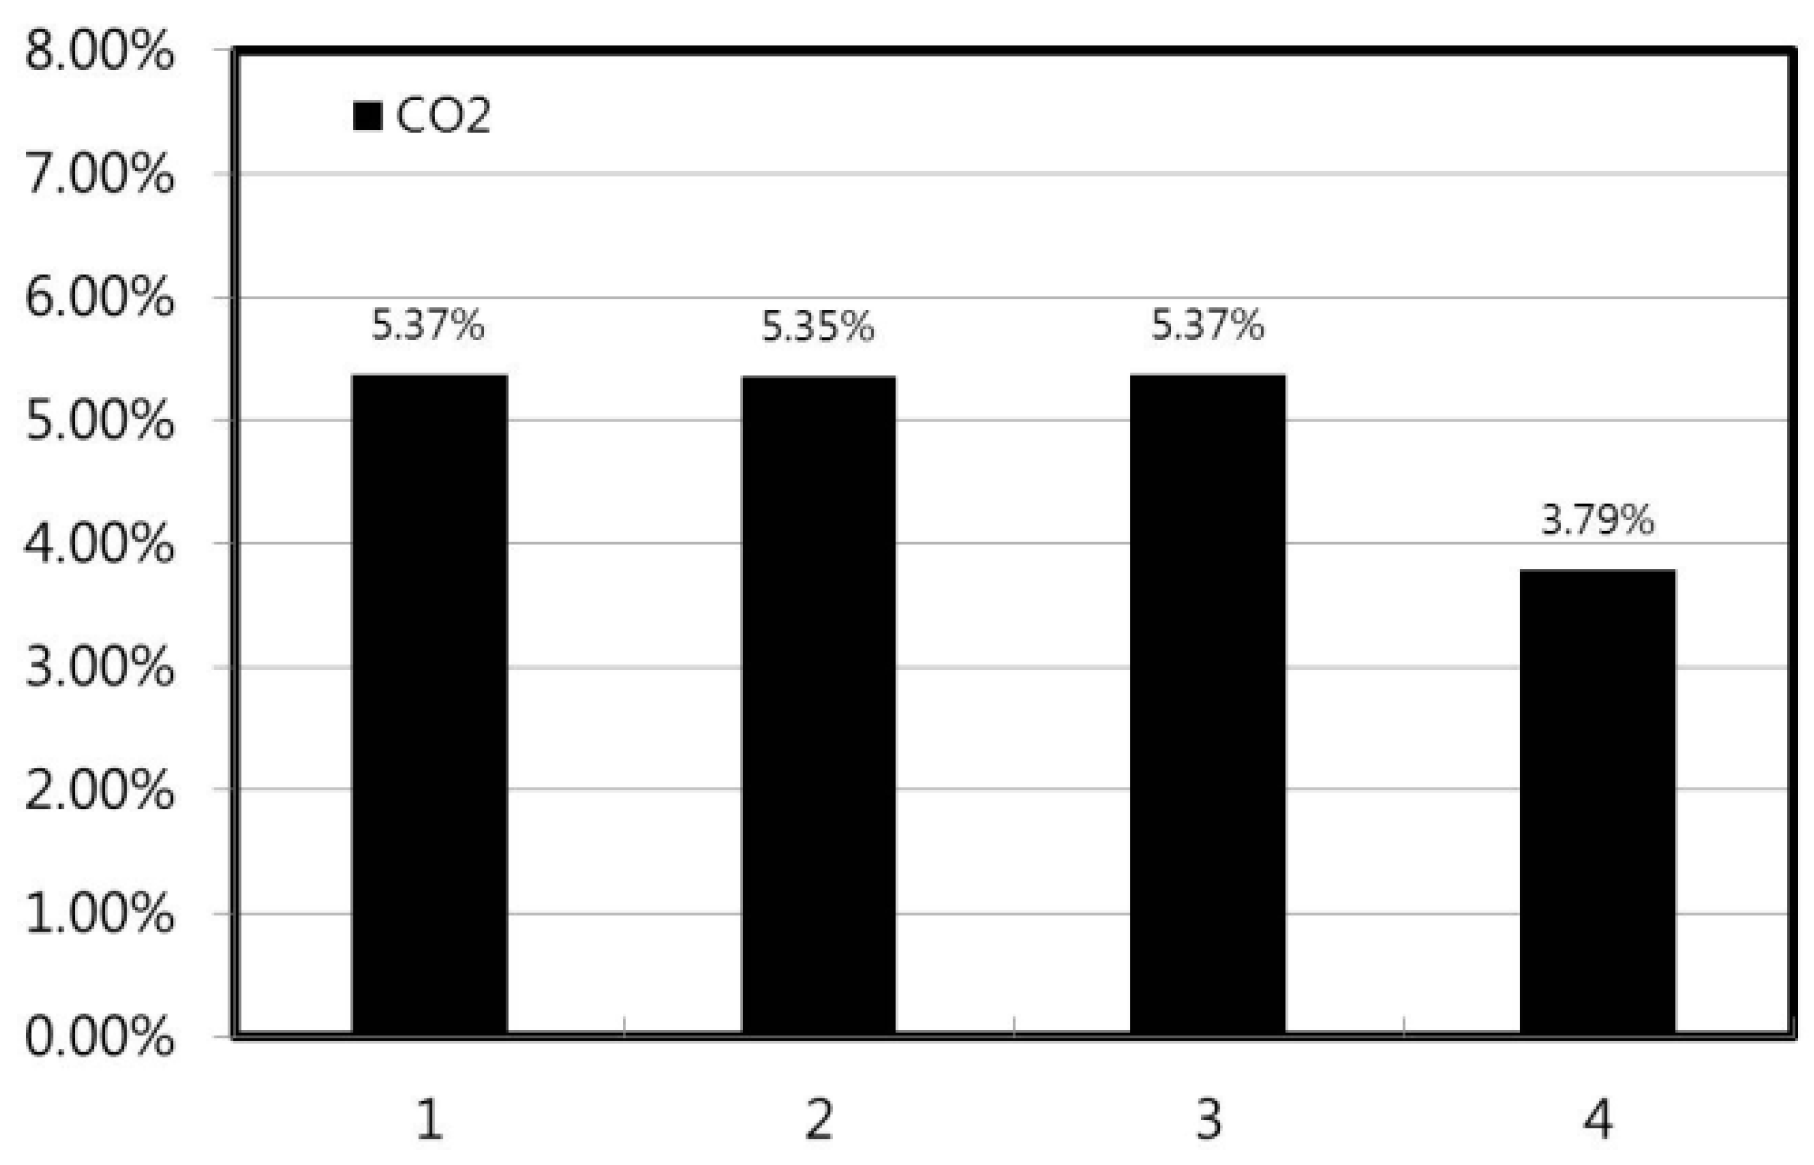
3.3. Carbon Dioxide (CO2) Emissions

CO2 dissociates into bicarbonate ions (HCO3) and carbonate ions (CO32−) after being dissolved in water in the carbonate system, and they reach equilibrium according to the concentration of hydrogen ions. The hydrogen ion concentration of the cleaning solution was increased by the sodium hydroxide used to remove NO and NO2. As a result, the equilibrium of the carbonate system moved in the direction of dissolving, and CO2 was converted to CO32− [37,38]. Consequently, a CO2 removal rate of 28.0–33.3% was achieved, as shown in Figure 11. As shown by the average CO2 concentration at each stage in Figure 12, the CO2 concentration did not change in the No. 1 and No. 2 towers but decreased in the No. 3 tower. O2 absorption did not occur in the seawater spray tower and electrolyzed seawater spray tower because HCO3 and CO32− exist in general seawater from the hydrogen ions reaching equilibrium with CO2 in the atmosphere.
CO2 removal mechanism:
C O 2 g C O 2 a q
C O 2 a q   +     H 2 O l H C O 3 a q   +   H a q   +  
C O 2 a q   +     O H a q H C O 3 a q
C O 3 a q 2   +     H a q   +   H C O 3 a q
H C O 3 a q   +     O H a q C O 3 a q 2   +   H 2 O l

4. Conclusions

In this study, a wet-type exhaust gas cleaning system, which is an after-treatment device for reducing exhaust gases from a marine diesel engine, was developed and evaluated. An experiment was performed in which seawater, electrolyzed seawater, and sodium hydroxide were sequentially sprayed onto the exhaust gas. The following results were obtained:
(1) Electrolyzed water was sprayed into the second tower with NOx as the oxidizer, and the oxidizer concentration stayed within the range of 4.8–5.3 g Cl2/L during the operating period. Sodium hydroxide was injected into the third tower with NOx as the absorbent, and the concentration of the absorbent during the operation stayed within the range of 6.1–7.7 g/L.
(2) SO2 in the exhaust gas from the diesel engine was decreased by 98.7–99.6%. Among the three towers, the first tower spraying seawater was confirmed to remove 98.7% of the SO2.
(3) NOx decreased by 43.2–48.9%. The oxidation rate of NO was higher in the second tower spraying electrolyzed water, and NO2 was absorbed in the third tower spraying sodium hydroxide. Sodium hydroxide was found to be involved not only in NO2 absorption but also in direct absorption of NO. Na2S, used to improve the NOx removal rate, was found to have a negative effect.
(4) CO2 was reduced by 28.0–33.3%, and the third tower spraying sodium hydroxide was confirmed to have an average removal rate of 29.3%. In the future, additional research on scrubbing technology using seawater will be conducted to increase the NOx reduction rate.

Author Contributions

Conceptualization, Y.R.; Methodology, Y.R., T.K., J.K. and J.N.; Validation, Y.R.; Formal Analysis, T.K., J.K. and J.N.; Investigation, Y.R., T.K. and J.K.; Writing—Original Draft Preparation, Y.R.; Writing—Review and Editing, T.K., J.K. and J.N.; Visualization, Y.R.; Supervision, J.N.; Project Administration, J.N. All authors have read and agreed to the published version of the manuscript.

Funding

This study did not receive external funding.

Conflicts of Interest

The authors declare that there is no conflict of interest.

References

  1. DieselNet. Available online: https://www.dieselnet.com (accessed on 21 September 2020).
  2. IMO (International Maritime Organization). Available online: http://www.imo.org/ (accessed on 21 September 2020).
  3. MEPC 65/4/3. Air Pollution and Energy Deficiency; Report of the Correspondence Group: London, UK, 2013.
  4. IMO. Third IMO GHG Study 2014; IMO: London, UK, 2014. [Google Scholar]
  5. Petroleum Products–Fuels (class F)–Specifications of Marine Fuels. In ISO 8217; International Organization for Standards: Geneva, Switzerland, 2012.
  6. Ryu, Y.; Dan, T.; Asano, I. Measurement of bunker oil/DME blended fuel viscosity for diesel engine application. J. Jpn. Inst. Mar. Eng. 2012, 47, 95–100. [Google Scholar] [CrossRef] [Green Version]
  7. Ryu, Y.; Dan, T. Combustion and emission characteristics of diesel engine by mixing DME and bunker oil. J. Korean Soc. Mar. Eng. 2012, 36, 117–122. [Google Scholar] [CrossRef]
  8. Ryu, Y.; Dan, T. Investigation on the effects of dimethyl ether blending to bunker oil for marine diesel engine use. SAE Tech. Pap. 2013. [Google Scholar] [CrossRef]
  9. Ryu, Y.; Lee, Y.; Nam, J. An experimental study of the fuel additive to improve the performance of a 2-stroke large diesel engine. J. Korean Soc. Mar. Eng. 2015, 39, 620–625. (In Korean) [Google Scholar] [CrossRef] [Green Version]
  10. Ryu, Y.; Lee, Y.; Nam, J. Performance and emission characteristics of additives-enhanced heavy fuel oil in large two-stroke marine diesel engine. Fuel 2016, 182, 850–856. [Google Scholar] [CrossRef]
  11. Ryu, Y.; Lee, Y.; Nam, J. Improvement of the performance and emission in a four-stroke diesel engine using fuel additive. J. Korean Soc. Mar. Eng. 2016, 40, 762–767. [Google Scholar] [CrossRef]
  12. Geng, P.; Mao, H.; Zhang, Y.; Wei, L.; You, K.; Ju, J.; Chen, T. Combustion characteristics and NOx emissions of a waste cooking oil biodiesel blend in a marine auxiliary diesel engine. Appl. Therm. Eng. 2017, 115, 947–954. [Google Scholar] [CrossRef]
  13. Katayama, N.; Dan, T.; Asano, I.; Kori, Y.; Kanno, K. Combustion analysis of Jatropha oil/marine diesel oil mixed fuel in direct injection diesel engine. In Proceedings of the 6th Pan Asian Association of Maritime Engineering Societies/Advanced Maritime Engineering Conference 2014, PAAMES, Hangzhou, China, 28–30 October 2014; NTMI-01. pp. 1–6. [Google Scholar]
  14. Hashimoto, M.; Dan, T.; Asano, I.; Otani, T. Combustion characteristics of palm oil in pre-combustion chamber type diesel engine by mixing with gas oil and marine diesel oil. J. Jpn. Inst. Mar. Eng. 2009, 44, 456–462. [Google Scholar] [CrossRef] [Green Version]
  15. Ogunkoya, D.; Li, S.; Rojas, O.; Fang, T. Performance, combustion, and emissions in a diesel engine operated with fuel-in-water emulsions based on lignin. J. Appl. Energy 2015, 154, 851–861. [Google Scholar] [CrossRef]
  16. Panomsuwan, G.; Rujiravanit, R.; Ueno, T.; Saito, N. Non-thermal plasma technology for abatement of pollutant emission from marine diesel engine. J. Korean Soc. Mar. Eng. 2016, 40, 929–934. [Google Scholar] [CrossRef]
  17. Raptotasios, S.I.; Sakellaridis, N.F.; Papagiannakis, R.G.; Hountalas, D.T. Application of a multi-zone combustion model to investigate the NOx reduction potential of two-stroke marine diesel engines using EGR. Appl. Energy 2015, 157, 814–823. [Google Scholar] [CrossRef]
  18. Verschaeren, R.; Schaepdryver, W.; Serruys, T.; Bastiaen, M.; Vervaeke, L.; Verhelst, S. Experimental study of NOx reduction on a medium speed heavy duty diesel engine by the application of EGR (exhaust gas recirculation) and Miller timing. Energy 2014, 76, 614–621. [Google Scholar] [CrossRef] [Green Version]
  19. Camarillo, M.K.; Stringfellow, W.T.; Hanlon, J.S.; Watson, K.A. Investigation of selective catalytic reduction for control of nitrogen oxides in full-scale dairy energy production. Appl. Energy 2013, 106, 328–336. [Google Scholar] [CrossRef]
  20. Ryu, Y.; Kim, H.; Cho, G.; Kim, H.; Nam, J. A study on the installation of SCR system for generator diesel engine of existing ship. J. Korean Soc. Mar. Eng. 2015, 39, 412–417. (In Korean) [Google Scholar] [CrossRef]
  21. Ntziachristos, L.; Saukko, E.; Lehtoranta, K.; Ronkko, T.; Timonen, H.; Simone, P.; Keskinen, J. Particle emissions characterization from a medium-speed marine diesel engine with two fuels at different sampling conditions. Fuel 2016, 186, 456–465. [Google Scholar] [CrossRef]
  22. Ryu, Y.; Kim, T.; Kim, J.; Nam, J. Experimental study on the De-NOx by using wet-type exhaust gas cleaning system for marine diesel engines. J. Korean Soc. Mar. Eng. 2017, 41, 412–417. (In Korean) [Google Scholar] [CrossRef]
  23. Kim, T.; Choi, S.; Kim, J.; Song, J. A study on the NOx reduction of flue gas using un-divided electrolysis of seawater. Korean Chem. Eng. Res. 2012, 50, 825–829. (In Korean) [Google Scholar] [CrossRef]
  24. Kim, T.W.; Kim, J.H.; Song, J.Y. A study on the NOx reduction of flue gas using seawater electrolysis. J. Korean Oil Chem. Soc. 2012, 29, 570–576. [Google Scholar] [CrossRef]
  25. An, S. Air pollution protection onboard by seawater and electrolyte. J. Korean Soc. Mar. Eng. 2006, 30, 93–101. [Google Scholar]
  26. Heywood, J.B. Internal Combustion Engine Fundamentals; McGraw-Hill, Inc.: New York, NY, USA, 1988. [Google Scholar]
  27. Haynes, W.M. Handbook of Chemistry and Physics, 97th ed.; CRC Press: Boca Raton, FL, USA, 2016; pp. 134–135. [Google Scholar]
  28. Andreasen, A.; Mayer, S. Use of seawater scrubbing for SO2 removal from marine engine exhaust gas. Energy Fuels 2007, 21, 3274–3279. [Google Scholar] [CrossRef]
  29. Henze, M.; Mark, C.M.; Loosdrecht, V.; Ekama, G.A.; Brdjanovic, D. Biological Wastement Treatment. IWA Publishing Books, 2008; p. 236. [Google Scholar]
  30. Wang, L.; Bassiri, M.; Najafi, R.; Robson, M. Hypochlorous acis as a potential wound care agent. J. Burns Wounds 2007, 6, 65–79. [Google Scholar]
  31. Kuropka, J. Removal of nitrogen oxides from flue gases in a packed column. Environ. Prot. Eng. 2011, 37, 13–22. [Google Scholar]
  32. Guo, R.; Pan, W.; Zhang, X.; Xu, H.; Jin, Q.; Ding, C.; Guo, S. The absorption kinetics of NO into weakly acidic NaClO Solution. Sep. Sci. Technol. 2013, 48, 2871–2875. [Google Scholar] [CrossRef]
  33. Mondal, M.K.; Chelluboyana, V.R. New experimental results of combined SO2 and NO removal from simulated gas stream by NaClO as low-cost absorbent. Chem. Eng. J. 2013, 217, 48–53. [Google Scholar] [CrossRef]
  34. Chang, M.; Lee, H.; Wu, F.; Lai, C.R. Simultaneous removal of nitrogen oxide/nitrogen dioxide/sulfur dioxide from gas streams by combined plasma scrubbing technology. J. Air Waste MGMT Assoc. 2004, 54, 941–949. [Google Scholar] [CrossRef]
  35. Mok, Y. Absorption-reduction technique assisted by ozone injection and sodium sulfide for NOx removal from exhaust gas. Chem. Engi. J. 2006, 118, 63–67. [Google Scholar] [CrossRef]
  36. Shen, C.H.; Rochelle, G.T. Nitrogen dioxide absorption and sulfide oxidation in aqueous sulfide. J. Air Waste MGMT Assoc. 2011, 49, 332–338. [Google Scholar] [CrossRef]
  37. Schulz, K.; Riebesell, U.; Rost, B.; Thomas, S.; Zeebe, R.E. Determination of the rate constants for the carbon dioxide to bicarbonate inter-conversion in pH-buffered seawater systems. Mar. Chem. 2006, 100, 53–65. [Google Scholar] [CrossRef] [Green Version]
  38. Stolaroff, J.K.; Keith, D.W.; Lowry, G.V. Carbon dioxide capture from atmospheric air using sodium hydroxide spray. Environ. Sci. Tech. 2008, 42, 2728–2735. [Google Scholar] [CrossRef]
Figure 1. Photograph of test facility.
Jmse 08 00850 g001
Figure 2. Schematic diagram of experimental apparatus.
Jmse 08 00850 g002
Figure 3. Photograph of spray nozzle and packing.
Jmse 08 00850 g003
Figure 4. Concentrations of oxidant and absorbent against the operating time.
Jmse 08 00850 g004
Figure 5. Removal rate of SO2.
Jmse 08 00850 g005
Figure 6. Average concentration of SO2 at each stage.
Jmse 08 00850 g006
Figure 7. Chlorine speciation profile as a function of pH.
Jmse 08 00850 g007
Figure 8. Removal rate of NOx.
Jmse 08 00850 g008
Figure 9. Removal rate of NO/NO2.
Jmse 08 00850 g009
Figure 10. Average concentration of NO/NO2 at each stage (without Na2S).
Jmse 08 00850 g010
Figure 11. Removal rate of CO2.
Jmse 08 00850 g011
Figure 12. Average concentration of CO2 at each stage.
Jmse 08 00850 g012
Table 1. IMO sulfur requirements [4].
Outside ECA
(Global Requirement)
Inside ECA
4.5% m/m prior to 1 January 20121.5% m/m prior to 1 July 2010
3.5% m/m on and after 1 January 20121.0% m/m on and after 1 July 2010
0.5% m/m on and after 1 January 20200.1% m/m on and after 1 January 2015
Emission Control Areas (ECA).
Table 2. CO2 emission factors (g/g fuel) [4].
RegionFuel TypeYear
201220302050
GlobalHFO311431143114
LSFO311431143114
MGO320632063206
LNG275027502750
Heavy Fuel Oil (HFO), Low Sulphur Fuel Oil (LSFO), Marine Gas Oil (MGO), Liquefied Natural Gas (LNG).
Table 3. Test engine specifications.
ItemDescription
Engine typeD4BB-G3, four-stroke diesel engine
Bore × stroke91.1 × 100 mm
Combustion typeIndirect injection
No. of cylinders4 inline
Displacement volume2607 cm3
MCR output45 PS @ 1800 rpm
Compression ratio22:1
FuelDiesel oil
Maximum Continuous Rating (MCR); Pferde-Starke (PS).
Table 4. Test conditions.
ItemDescription
Spraying order1st stage: seawater
2nd stage: electrolyzed seawater
3rd stage: NaOH (+Na2S)
Absorber typePacked bed
Packing1” Tripack (polypropylene)
Exhaust gas flow130 ± 10 Nm3/h
Retention time6.3–6.9 s
Liquid–gas ratio43–50 L/m3
CNOx,i887–942 ppmv
CSO2,i430–470 ppmv
CCO2,i5.30–5.45 vol.%
Cl2 concentration4.8–5.3 g Cl2/L
NaOH concentration6.1–7.7 g NaOH/L
Table 5. Solubility of selected gases in water.
GasSolubility in Water [mol/L]
NO1.51 × 10−6
NO22.44 × 10−5
SO21.25 × 10−3
CO23.48 × 10−5
Cl28.20 × 10−5 scientific notion
Publisher’s Note: MDPI stays neutral with regard to jurisdictional claims in published maps and institutional affiliations.

