1. Introduction
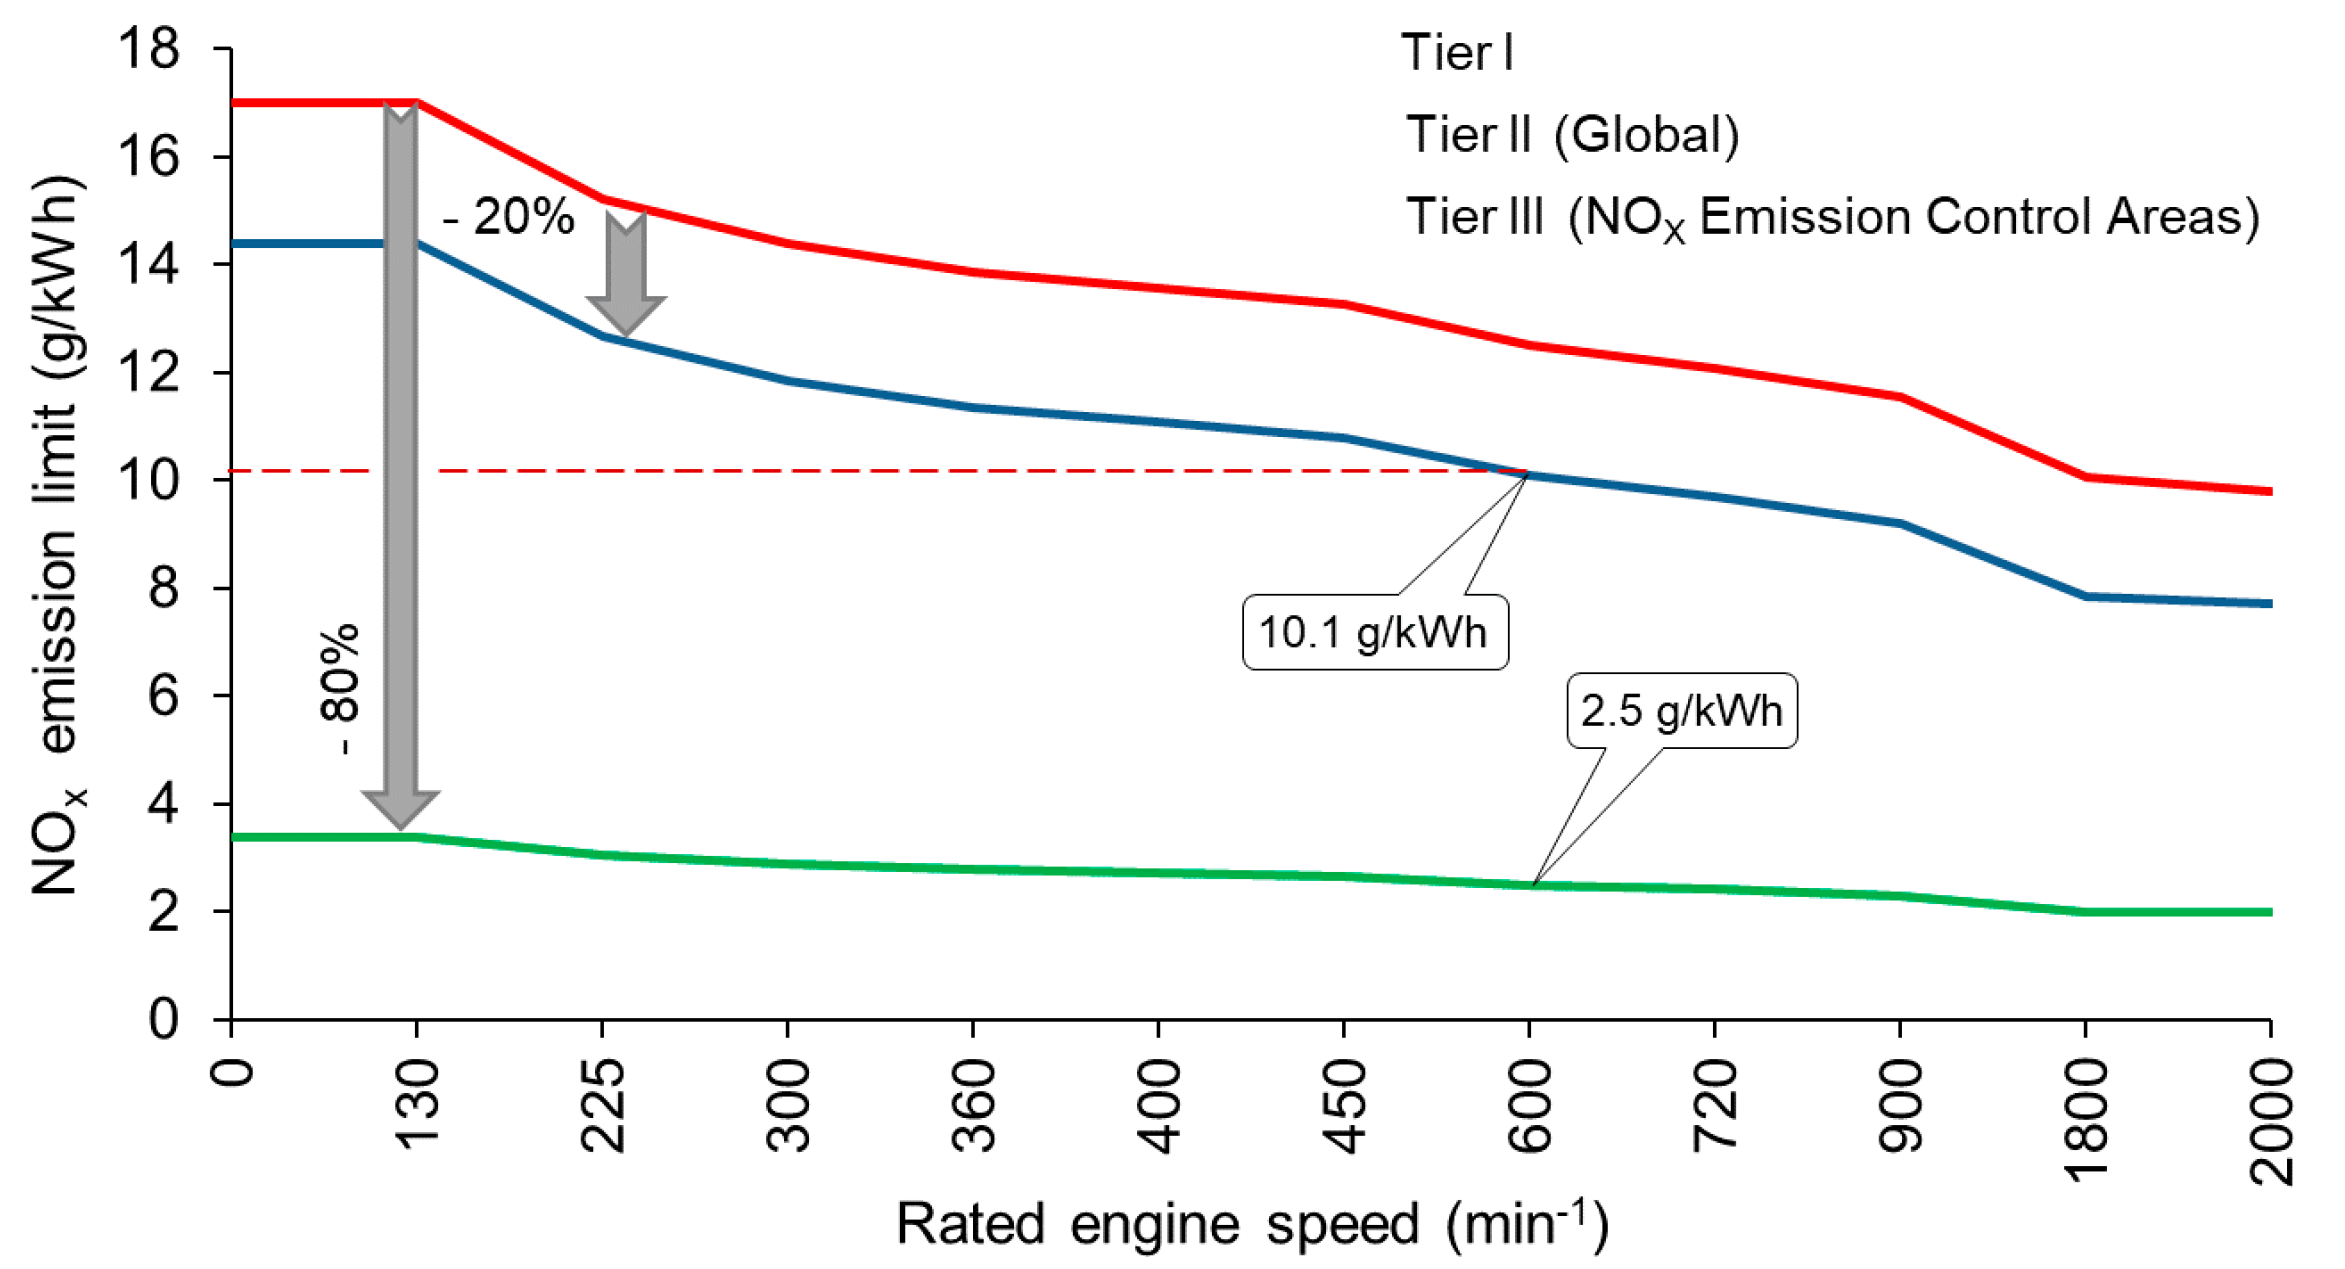
Energy efficiency and environmental friendliness are the basic criteria when choosing the optimal technology in any industry, so this is also the case with the transport of goods. It is known that the transport of goods by sea is the most efficient mode of transport. Nevertheless, maritime transport is facing increasing demands on energy efficiency and the lowest possible environmental impact. The requirements for reducing air pollution with pollutants from marine power plants are defined in MARPOL 73/78 (International Convention for the Prevention of Pollution from Ships), Annex VI (Prevention of Air Pollution from Ships, enforced since 19 May 2005). For marine diesel engines with a rated power of more than 130 kW the NOx emission limits are divided into Tier I, Tier II and Tier III according to the IMO (International Maritime Organization). The limit values are applied depending on engine power and speed, the date of construction and the area of navigation, as shown in
Figure 1.
Tier I refers to all ships built since 2000. Tier II is enforced since 2011. Due to the Tier II, the NO
x emission limits are reduced approximately 20% compared to Tier I. The Tier III requires approximately 80% reduction in emissions for ships operating in ECA (Emission Control Areas). Depending on their operating area of navigation, many ships are affected by Tiers II and III. It is therefore necessary to optimize the emissions of marine diesel engines. An example of determining the permissible NO
x emission for a marine diesel engine with a speed of 600 rpm is shown in
Figure 1 by dashed red lines.
Most merchant ships are powered by a two-stroke low-speed diesel engine whose overall efficiency exceeds 50% under certain operating conditions. Marine medium-speed four-stroke diesel engines have approximately 3–5% lower efficiency than marine low-speed engines. Medium-speed diesel engines are half the size at the same rated power and NOx emissions are considerably lower. The advantages of marine medium-speed diesel engines are especially pronounced if they are used in diesel-electric and hybrid propulsion systems. Slightly lower energy efficiency of four-stroke engines can be compensated by utilizing waste heat of the engine. This is supported by the fact that due to significantly higher exhaust gas temperatures of four-stroke engines, their exergy is significantly higher than that of two-stroke engines.
In marine diesel engines, various technologies are used to reduce emissions of harmful substances and in particular NO
x emissions, to the level required by regulations. These technologies usually are divided into primary and secondary measures. Primary measures involve modifying the process in the engine cylinder. Secondary measures include exhaust after treatment. Fuel type and quality also have a significant influence on emissions. Technologies for reducing NO
x emissions are listed in
Table 1.
NO
x emission reduction technologies, which are marked 1, 2, 7 and 8 in
Table 1, have the most favourable impact on energy efficiency and specific fuel oil consumption (SFOC). The implementation of other listed technologies leads to an increase in specific fuel consumption.
The adjustment of the combustion process in the engine cylinder by increasing the compression ratio while simultaneously reducing the amount of fuel injected per crankshaft revolution theoretically enables the approximately constant pressure of the combustion process. This leads to a lower maximum pressure and a lower maximum temperature, which is beneficial because NOx emissions are largely temperature-dependent. By using modern electronically controlled fuel injection systems, this technology does not lead to a significant increase in specific fuel consumption.
Numerical modelling of internal combustion engines is today an indispensable tool that speeds up the development of the engine while reducing development costs. The available literature offers different approaches to numerical modelling internal combustion engines. The target area of research, the required accuracy and the time available for calculations are the basic parameters for model selection [
3,
4,
5]. Zero-dimensional single-zone models are an efficient tool for predicting motor performance in stationary and dynamic operating conditions using modest computing resources and fast performance of simulations [
6,
7,
8,
9,
10]. Multi-zone combustion models [
11,
12,
13,
14,
15,
16] allow the prediction of emissions of NO
x and other pollutants such as soot. In addition to the mentioned advantage of multi-zone models, a longer calculation time is associated. These models are usually not suitable for determining the overall performance of engines and their energy balances but are mostly adapted to predict emissions. Rakopoulus et al. [
17] described in detail the development and verification of a numerical model of a direct fuel injection diesel engine. The described model implies the division of the combustion space inside the cylinder into two zones. The chemical equilibrium method was used to calculate the concentration of individual pollutants in the exhaust gas. The development and application of a complex multi-zone model to simulate the operation of turbocharged diesel engines is described in Reference [
18]. This model divides the fuel jet injected into the engine cylinder into a number of zones. The interaction of the jet with the cylinder walls, the influence of the injection angle and the conditions of fuel evaporation for each zone are taken into account. Scappin et al. [
19] have successfully applied a zero-dimensional model with two zones for predicting NO
x emissions in electronically controlled low speed two-stroke marine diesel engine. A study of the impact of split fuel injection on diesel engines using the FIRE computer program is presented in Reference [
20]. The paper investigates the influence of split fuel injection on the emission of solid particles and nitrogen oxides, using three different injection schemes. In Reference [
21], the development and application of a zero-dimensional model with three zones for the analysis of the operating parameters of a high-speed diesel engine are presented. In Reference [
22], a three-zone model is described that is applicable in real-time applications. Compared to other similar models, this study uses a procedure that does not require iterative resolution thus significantly shortening the computational time. Baldi et al. [
23] presented a numerical model of a marine medium-speed diesel engine in which a zero-dimensional model is used to model the high-pressure part of the process while the mean value model is applied for the rest of process in the engine cylinder. More recently [
24], the impact of multiple fuel injections on NO
x emissions has been investigated. Simulations show that by applying split injection it is possible to achieve a reduction in NO
x emissions without a significant increase in fuel consumption. The paper [
25] describes the development of a semi-empirical multi-zone model for predicting nitrogen oxide emissions in high-speed diesel engines with direct fuel injection. As in most other papers, the extended Zeldovich mechanism of NO
x formation is applied here as well. The development of another semi-empirical model that allows good prediction of NO
x emissions under stationary operating conditions and engine loads is presented in Reference [
26]. Model testing was performed on several diesel engines under different operating conditions and with simultaneous application of different methods to reduce NO
x emissions. While the research in these papers describes in detail different models of internal combustion engines to simulate nitrogen oxide emissions, few or no investigate the impact of split fuel injection with application to marine medium-speed diesel engines of 5000 kW and more.
The aim of this paper is to examine the impact of different split fuel injection schemes on the specific fuel consumption and nitrogen oxide emissions of a marine medium-speed diesel engine using a two zone combustion numerical model.
2. Numerical Model of a Four-Stroke Diesel Engine
The numerical model is based on the laws of conservation of energy and mass and solving the resulting differential equations described in References [
6,
27]. A one-zone, zero-dimensional model of the four-stroke diesel engine presented in Reference [
28] was upgraded to two-zone model with possibility to predict NO
x emissions. The model has additional features such as variable integration step selection, variable inlet valve closing angle, adjustment of the turbocharger air mass flow and graphic display of the results.
The main advantages of the applied model compared to multidimensional and multi-zone models are lower complexity, higher execution speed, adaptability and satisfactory accuracy of the obtained results, which are comparable to more complex models.
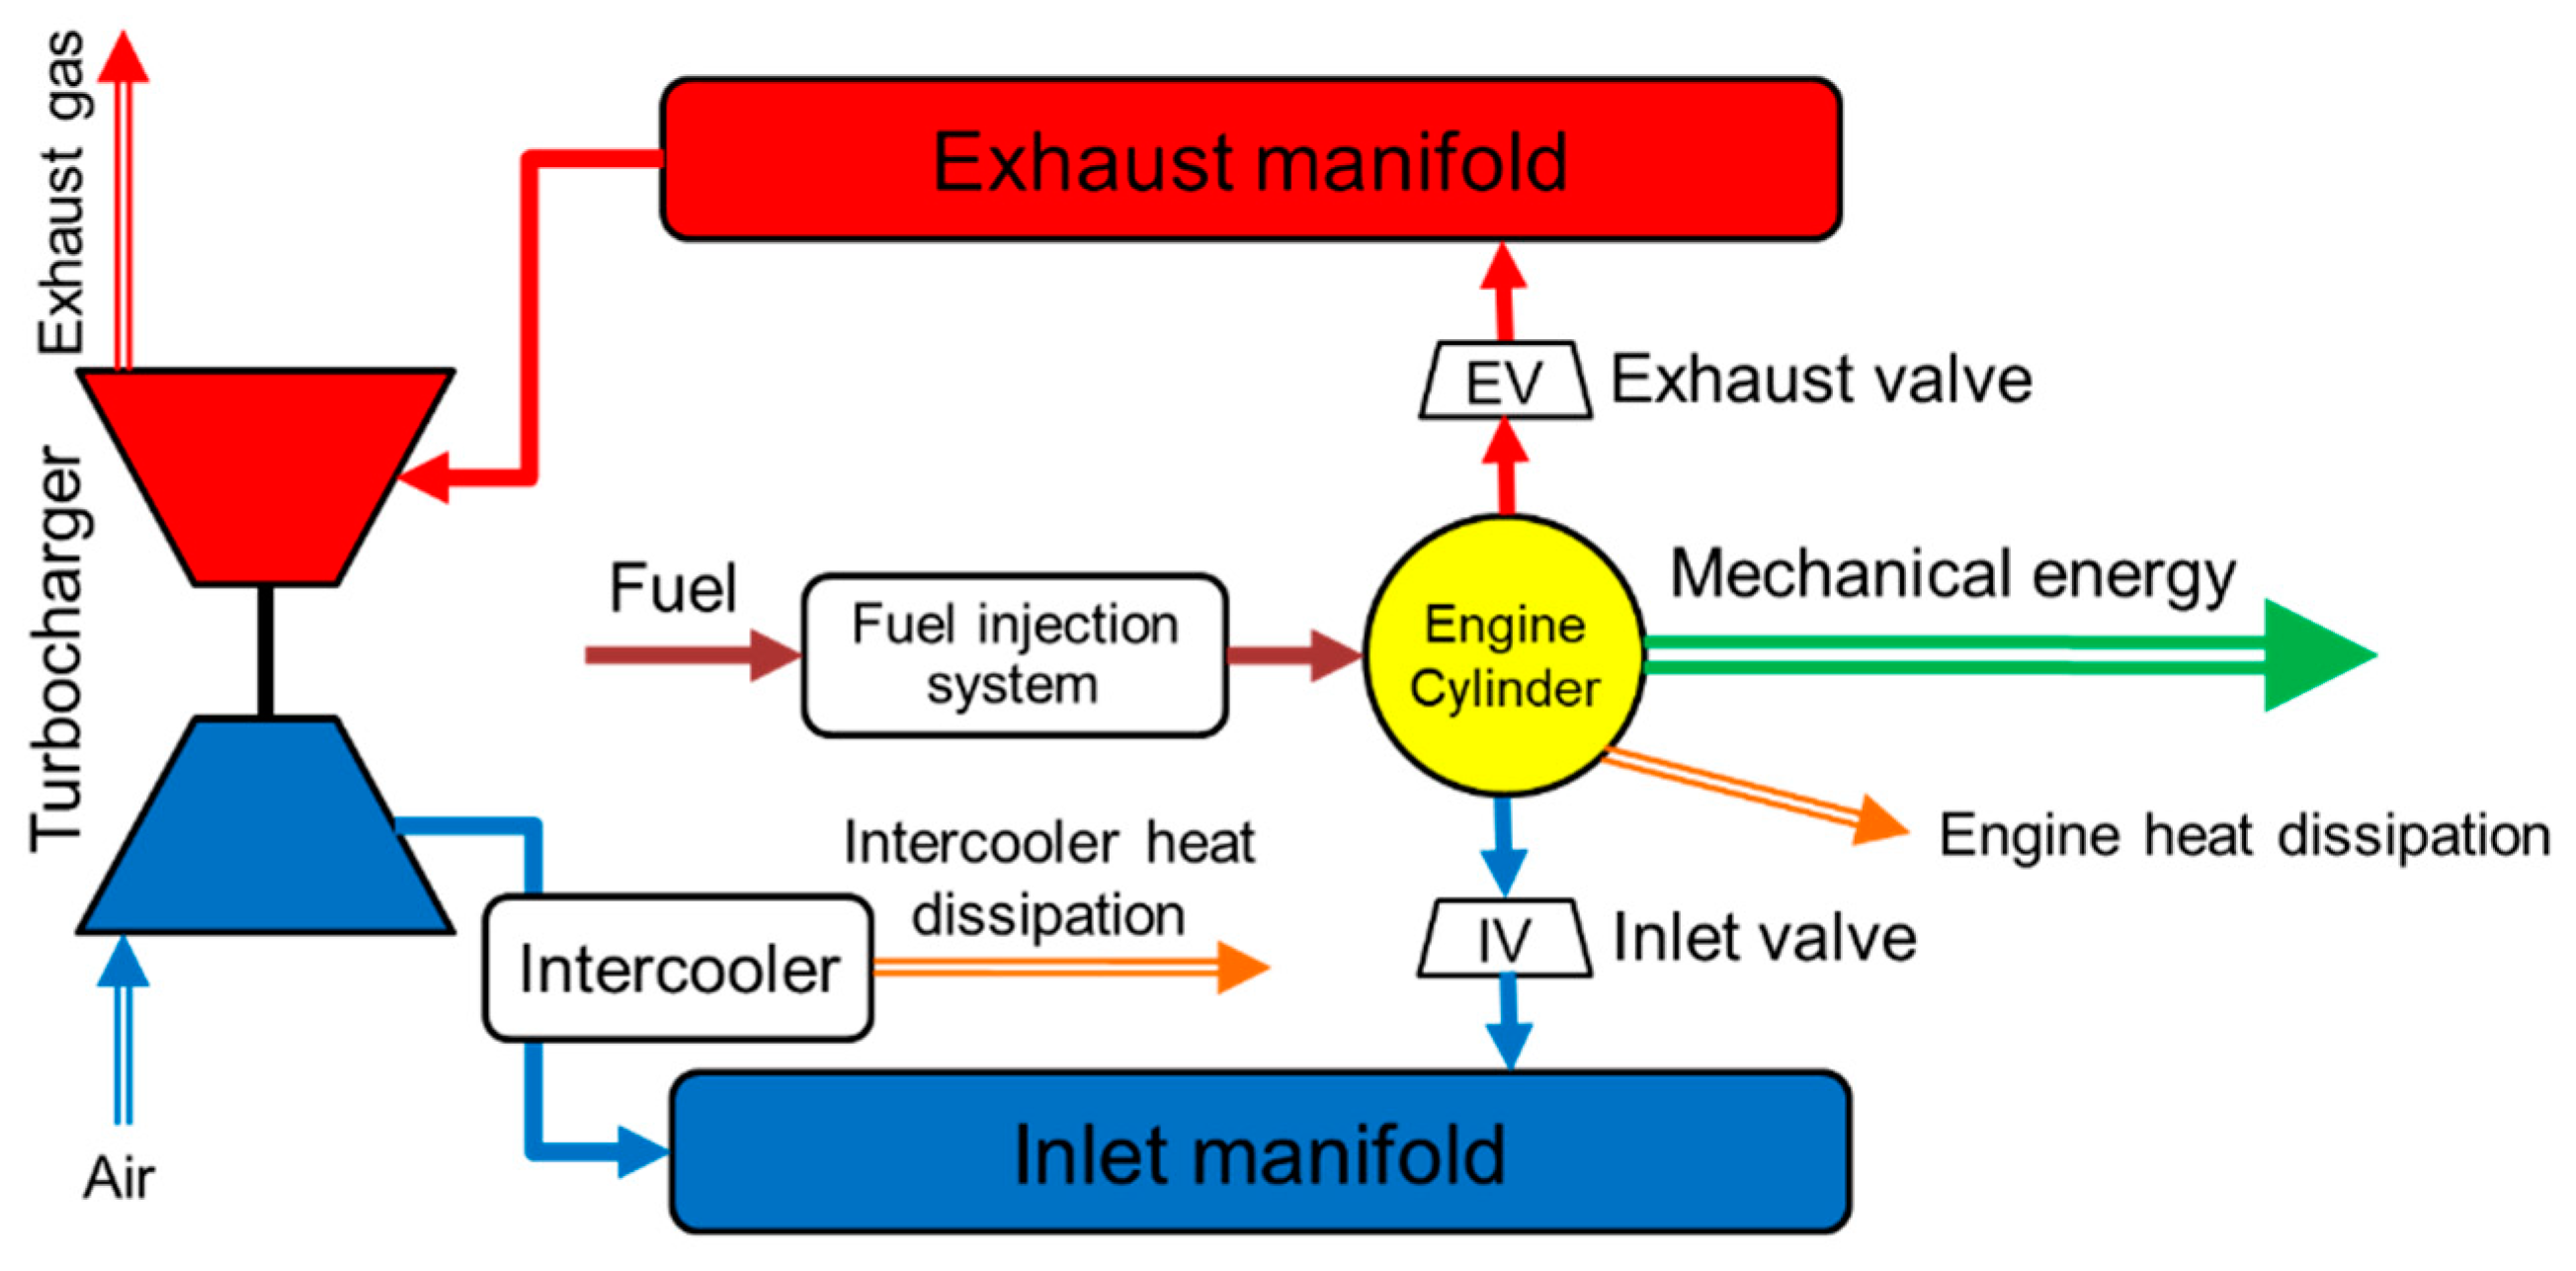
An four-stroke diesel engine consists of the following interconnected subsystems (
Figure 2): engine cylinder, inlet manifold, exhaust manifold, turbocharger, intercooler, fuel injection subsystem, piston mechanism and valve timing mechanism.
The control volumes are interconnected by appropriate connections, which allow the exchange of the working medium. In the cylinder control volume, the heat is exchanged through the walls between the working medium and the cooling water. The heat is also exchanged with the ambient air through the walls of the inlet and outlet manifold. The heat generated by friction in the bearings is taken into account via the mechanical losses mean pressure, while the heat dissipated by radiation is neglected as it does not exceed 1% of the total heat input. Pressure and temperature in the control volumes are determined by solving differential equations derived from the laws of conservation of energy and mass. The properties of the working medium are determined according to References [
29,
30].
The software was developed in the C programming language. The model has been validated using data provided by the engine manufacturer and sea trial data. The data obtained from the operation of Wärtsilä 12V50DF engine on LNG ships with diesel-electric propulsion power systems. Rated power of one engine is 11.7 MW.
2.1. Mass Conservation Law
The mass change d
m in the engine cylinder, inlet and exhaust manifold during the angle of rotation of the crankshaft d
φ is caused by the flow of the working medium through the inlet and exhaust valves, the mass of the injected fuel and the mass loss due to leakage can be expressed as:
where
min is the mass of the medium entering the control volume and
mex is the mass of the medium exiting the volume,
mf is the mass of fuel supplied,
mleak is the mass of the medium exiting the volume and subscript “i” denote control volume. If the engine is properly maintained the leaked mass from cylinder may be neglected.
2.2. Energy Conservation Law
Energy balance of the medium in the control volume is given by:
where d
Qi,f denotes heat released through fuel combustion and d
Qi,w heat exchanged through the walls. The variables
hin and
hex represents the enthalpy of the medium entering or leaving the control volume and
hf is enthalpy of the fuel.
Assuming that the internal energy of the gas depends solely of temperature, the equation of the temperature change is given by
where
ui denotes internal energy and
λ is the equivalent ratio of air to fuel.
In previous equations, all variables containing the mass or enthalpy of the fuel refer only to the control volume in which the fuel burns or to the cylinder. The same applies to variables describing a change in volume. When the fuel burns in the cylinder, the chemical energy of the fuel is converted into heat, which increases pressure and temperature. The increased pressure acts on the piston, where the thermal energy is converted into mechanical work.
2.3. Indicated Work
Indicated mechanical work is determined by:
The pressure
pc in the cylinder is determined using the equation of state for a gas:
Current cylinder volume
Vc is derived from the crankshaft mechanism geometry:
where
Vs is the cylinder swept volume,
ε is compression ratio and
λm denotes ratio between crank radius and piston stroke.
2.4. Heat Exchange
Heat transfer through the cylinder walls can be expressed as:
According to References [
31,
32], there are no significant temperature changes under stationary operating conditions, therefore a mean cylinder wall temperature is assumed. Furthermore, relatively small deviations in the heat transfer coefficient can be neglected, so that the mean heat transfer coefficient can be applied in the calculations. For the calculation of the heat transfer coefficient an empirical expression [
33] is used in this paper:
where
C1 and
C2 are the empirical coefficients and
cmps is the mean piston speed.
2.5. Heat Release
Numerical models that describe the complex process of fuel combustion inside the cylinder is divided according to References [
34,
35] into zero-dimensional, quasi-dimensional and multidimensional models.
Vibe [
36] provided the heat release rate by the following expression:
where
xf is the relative portion of fuel burned,
C is the constant that depends on the efficiency of fuel combustion. The subscript IS refers to the crankshaft angle at which ignition starts, while the subscript CD represents the duration of combustion. The exponent m is determined according to Reference [
37] and the change in combustion duration Δ
φCD is determined according to Reference [
38].
The expressions for determining the ignition delay for diesel fuel are given in Reference [
39]. Adjusted expression for heavy fuel are given in Reference [
40].
It is assumed that the rate of injected fuel mass follows the heat release rate and that the combustion products are immediately mixed with the medium in the cylinder to form a homogeneous mixture. The total mass within the cylinder increases during combustion due to the injected fuel. The excess air in the engine cylinder is calculated from the mass of the gases in the engine cylinder and the mass of the injected fuel.
In the numerical sub-model of split fuel injection, a double Vibe function was used for pilot injection and a single Vibe function for main injection.
2.6. Change in Mass And Excess Air in The Cylinder
The change in mass in the engine cylinder due to fuel injection is expressed by:
Also, fuel injection affects the change in excess air ratio which is calculated as follows:
When the working medium flows out of the control volume, there is no change in the excess air ratio and there is no change in the gas composition. If gases flowing into the control volume have a different composition, there is also a change in the excess air ratio. The change in excess ratio as a function of the crankshaft angle is determined by the expression:
where
SAFR is stoichiometric mass of air in mixture with fuel.
2.7. Working Medium Exchange in A 4-Stroke Engine Cylinder
The working fluid flows between the cylinder and the inlet and exhaust manifolds. The flow of the working fluid from one control volume to the other is determined by valves timing, the effective flow area and the pressure difference:
In the previous equation, the geometric flow areas
Ap,geo of the inlet and exhaust valves are determined according to the camshaft cam geometry. The flow coefficient α
p is determined according to Reference [
41]. The flow function
ψ for the subcritical pressure ratio is determined according to Reference [
42]
and flow function
ψ for supercritical pressure is:
Subscript 1 refers to the state in the upstream control volume, while subscript 2 refers to the state in the downstream control volume.
2.8. Turbocharger
For modelling the operation of a diesel engine under stationary operating conditions, the numerical model of the turbocharger does not require the use of suitable compressor map data. Instead, it is acceptable to assume that the air mass flow is known for a given engine load. Engine manufacturers typically provide inlet manifold pressure and air mass flow data for different engine loads in range between the 50% to 100% of engine MCR (Maximum Continuous Rating). The exhaust gases mass flow through the turbine is determined by the following expression:
where
αT is the flow coefficient,
AT,geo denotes the cross-sectional area of the turbine,
ψ is the flow function and
pEM is exhaust manifold pressure.
The temperature of the exhaust gases after the turbine is calculated according to:
2.9. Effective Engine Power
The indicated engine power is determined by integration of the total work of all cylinders during one duty cycle:
where
z denotes number of cylinders and
nM is crankshaft speed in rpm.
Effective engine power is calculated by the following equation:
where
Pmep is the mean effective pressure and
Pind is the mean indicated pressure. The mean effective pressure is determined by subtracting the mean pressure of the mechanical losses from the mean indicated pressure. The mean pressure of mechanical losses takes into account losses caused by friction and operation of oil and water pumps. In the developed numerical model, the mean pressure of mechanical losses is calculated using empirical expressions according to Reference [
43].
For easier understanding and tracking of the interconnections between individual equations and submodels, the block diagram of the engine numerical model is shown in
Figure 3.
3. Two-Zone Numerical Sub-Model
The formation of nitrogen oxides in the engine cylinder is exponentially dependent on the temperature at the boundary between the flame and the fresh medium in the cylinder. The formation of NOx is exactly proportional to the available time in which the chemical reactions of formation and decomposition take place. Since the time in which the chemical reactions on which the formation of NOx depends takes place is relatively short (depending on the engine speed), the process does not take place in conditions of chemical equilibrium.
The single-zone model only allows monitoring of the mean medium temperature in the engine cylinder. To predict the rate of NO
x formation with satisfactory accuracy, it is necessary to know the temperature at the boundary between the flame and the fresh medium in the engine cylinder. The following is a model in which during the part of the process in which the combustion and expansion of the working medium takes place, the control volume of the cylinder is divided into two zones. Such a model is also known in the literature as a quasi-dimensional combustion model and a detailed description of the two-zone model is presented in References [
16,
44,
45].
In models with two or more zones, the formation of zones begins with the start of fuel combustion. After opening the exhaust valve, the process is observed as in models with single zone. Typically, a two-zone model divides the combustion space into a fresh medium zone and a zone made up of combustion products. The simplified model of the combustion process applied in this paper implies the division of the control volume of the engine cylinder into two zones:
Zone 1—fresh mixture consisting of air, residual gases from the previous process and recirculated exhaust gases (only in case EGR is used), and
Zone 2—combustion gases consisting of gaseous products of fuel combustion during stoichiometric combustion.
The model of the combustion process with two zones implies the following simplifications and assumptions:
division of the working medium in the combustion space into two zones: the zone of fresh medium and the zone of combustion gases,
the actual geometric shape of the zones is neglected and only their volume is taken into account,
at the observed position of the crankshaft, the pressure in all zones is the same and does not depend on the position within the zone,
at the observed position of the crankshaft, the temperature does not depend on the position within the zone and the same applies to the excess air,
the working medium in each of the zones is a homogeneous mixture whose chemical composition and mass fractions of individual participants within the zone do not depend on the position within the zone,
the formation of zones begins with the injection and combustion of fuel and until then there is only one zone,
combustion in the combustion gas zone or in the edge layer (“flame front”) takes place in the conditions of a slightly “poor” mixture,
there is no heat exchange between zones,
heat exchange takes place only between Zone 2 (combustion gas zone) and the environment,
at the moment of opening the exhaust valve, both zones are instantly mixed into a homogeneous mixture.
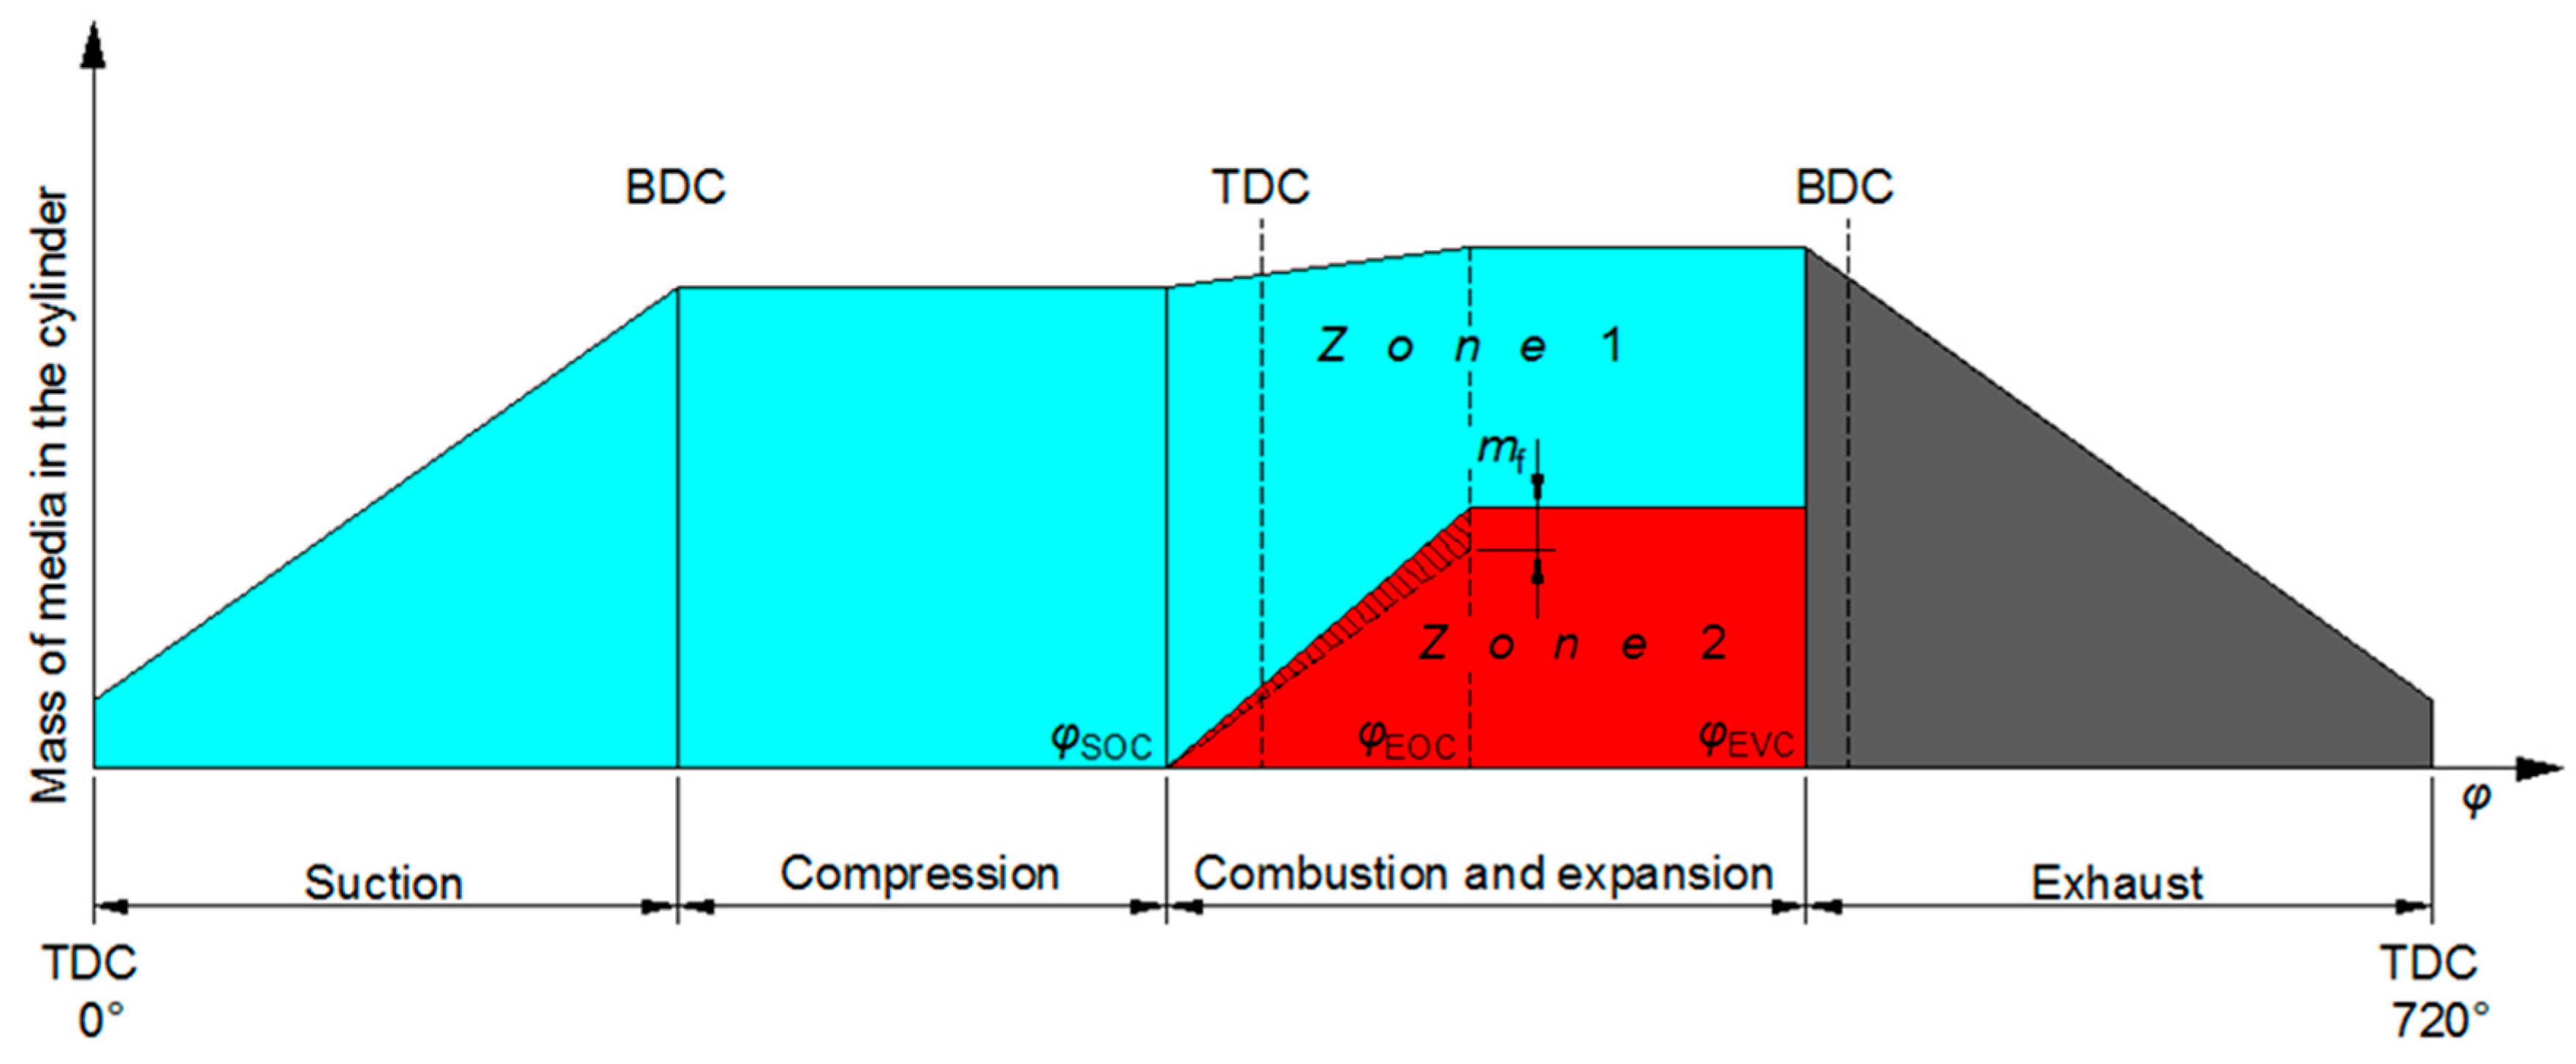
A schematic representation of the formation of zones and changes in the mass of the medium depending on the crankshaft angle
φ for the process in a four-stroke diesel engine is given in
Figure 4. The process begins with the suction stroke, whereby the mass of the medium in the cylinder increases. After closing the inlet valve, the mass of the medium in the cylinder does not change during the compression stroke until the moment of fuel injection into the engine cylinder.
The applied numerical model assumes that the pressure in individual zones is equal to the pressure in the cylinder and that it forms a homogeneous pressure field. Therefore, the values for the pressure are obtained by the calculation using the single-zone model.
Subscript “1” refers to Zone 1 (fresh medium zone) and subscript “2” to Zone 2 (combustion gas zone).
The mass of the medium in the cylinder is calculated according to:
After closing the inlet valve, the mass of the medium in the cylinder does not change until the fuel injection begins. The total mass of fresh medium in the cylinder is the sum of the masses: clean air, residual combustion gases and recirculated combustion gases.
Assuming that the combustion of fuel in the marginal layer (boundary between the zones) takes place with the prior mixing of the medium from Zone 1 with the injected fuel in a stoichiometric ratio, according to the expression:
The mass of the medium in Zone 2 is determined from the known mass of burned fuel (data obtained from the single-zone model) and the stoichiometric ratio for Zone 1, according to the expression:
and the mass of the media in Zone 1 is calculated according to:
At any time or position of the crankshaft, the sum of the volumes of both zones is equal to the volume of the cylinder.
The volume of the zones is calculated using the equation of state of the ideal gas according to the expression:
Subscript “i” refers to the zone.
The temperature of the gases in Zone 1 is calculated according to the expression for the adiabatic change of state:
The subscript “k − 1” indicates the values of pressure and temperature from the previous calculation step.
The change in temperature in Zone 2 depending on the angle of the crankshaft is determined by applying the expression:
where subscript 1 correspond to Zone 1 and subscript 2 to Zone 2, f represents fuel and w denote cylinder walls.
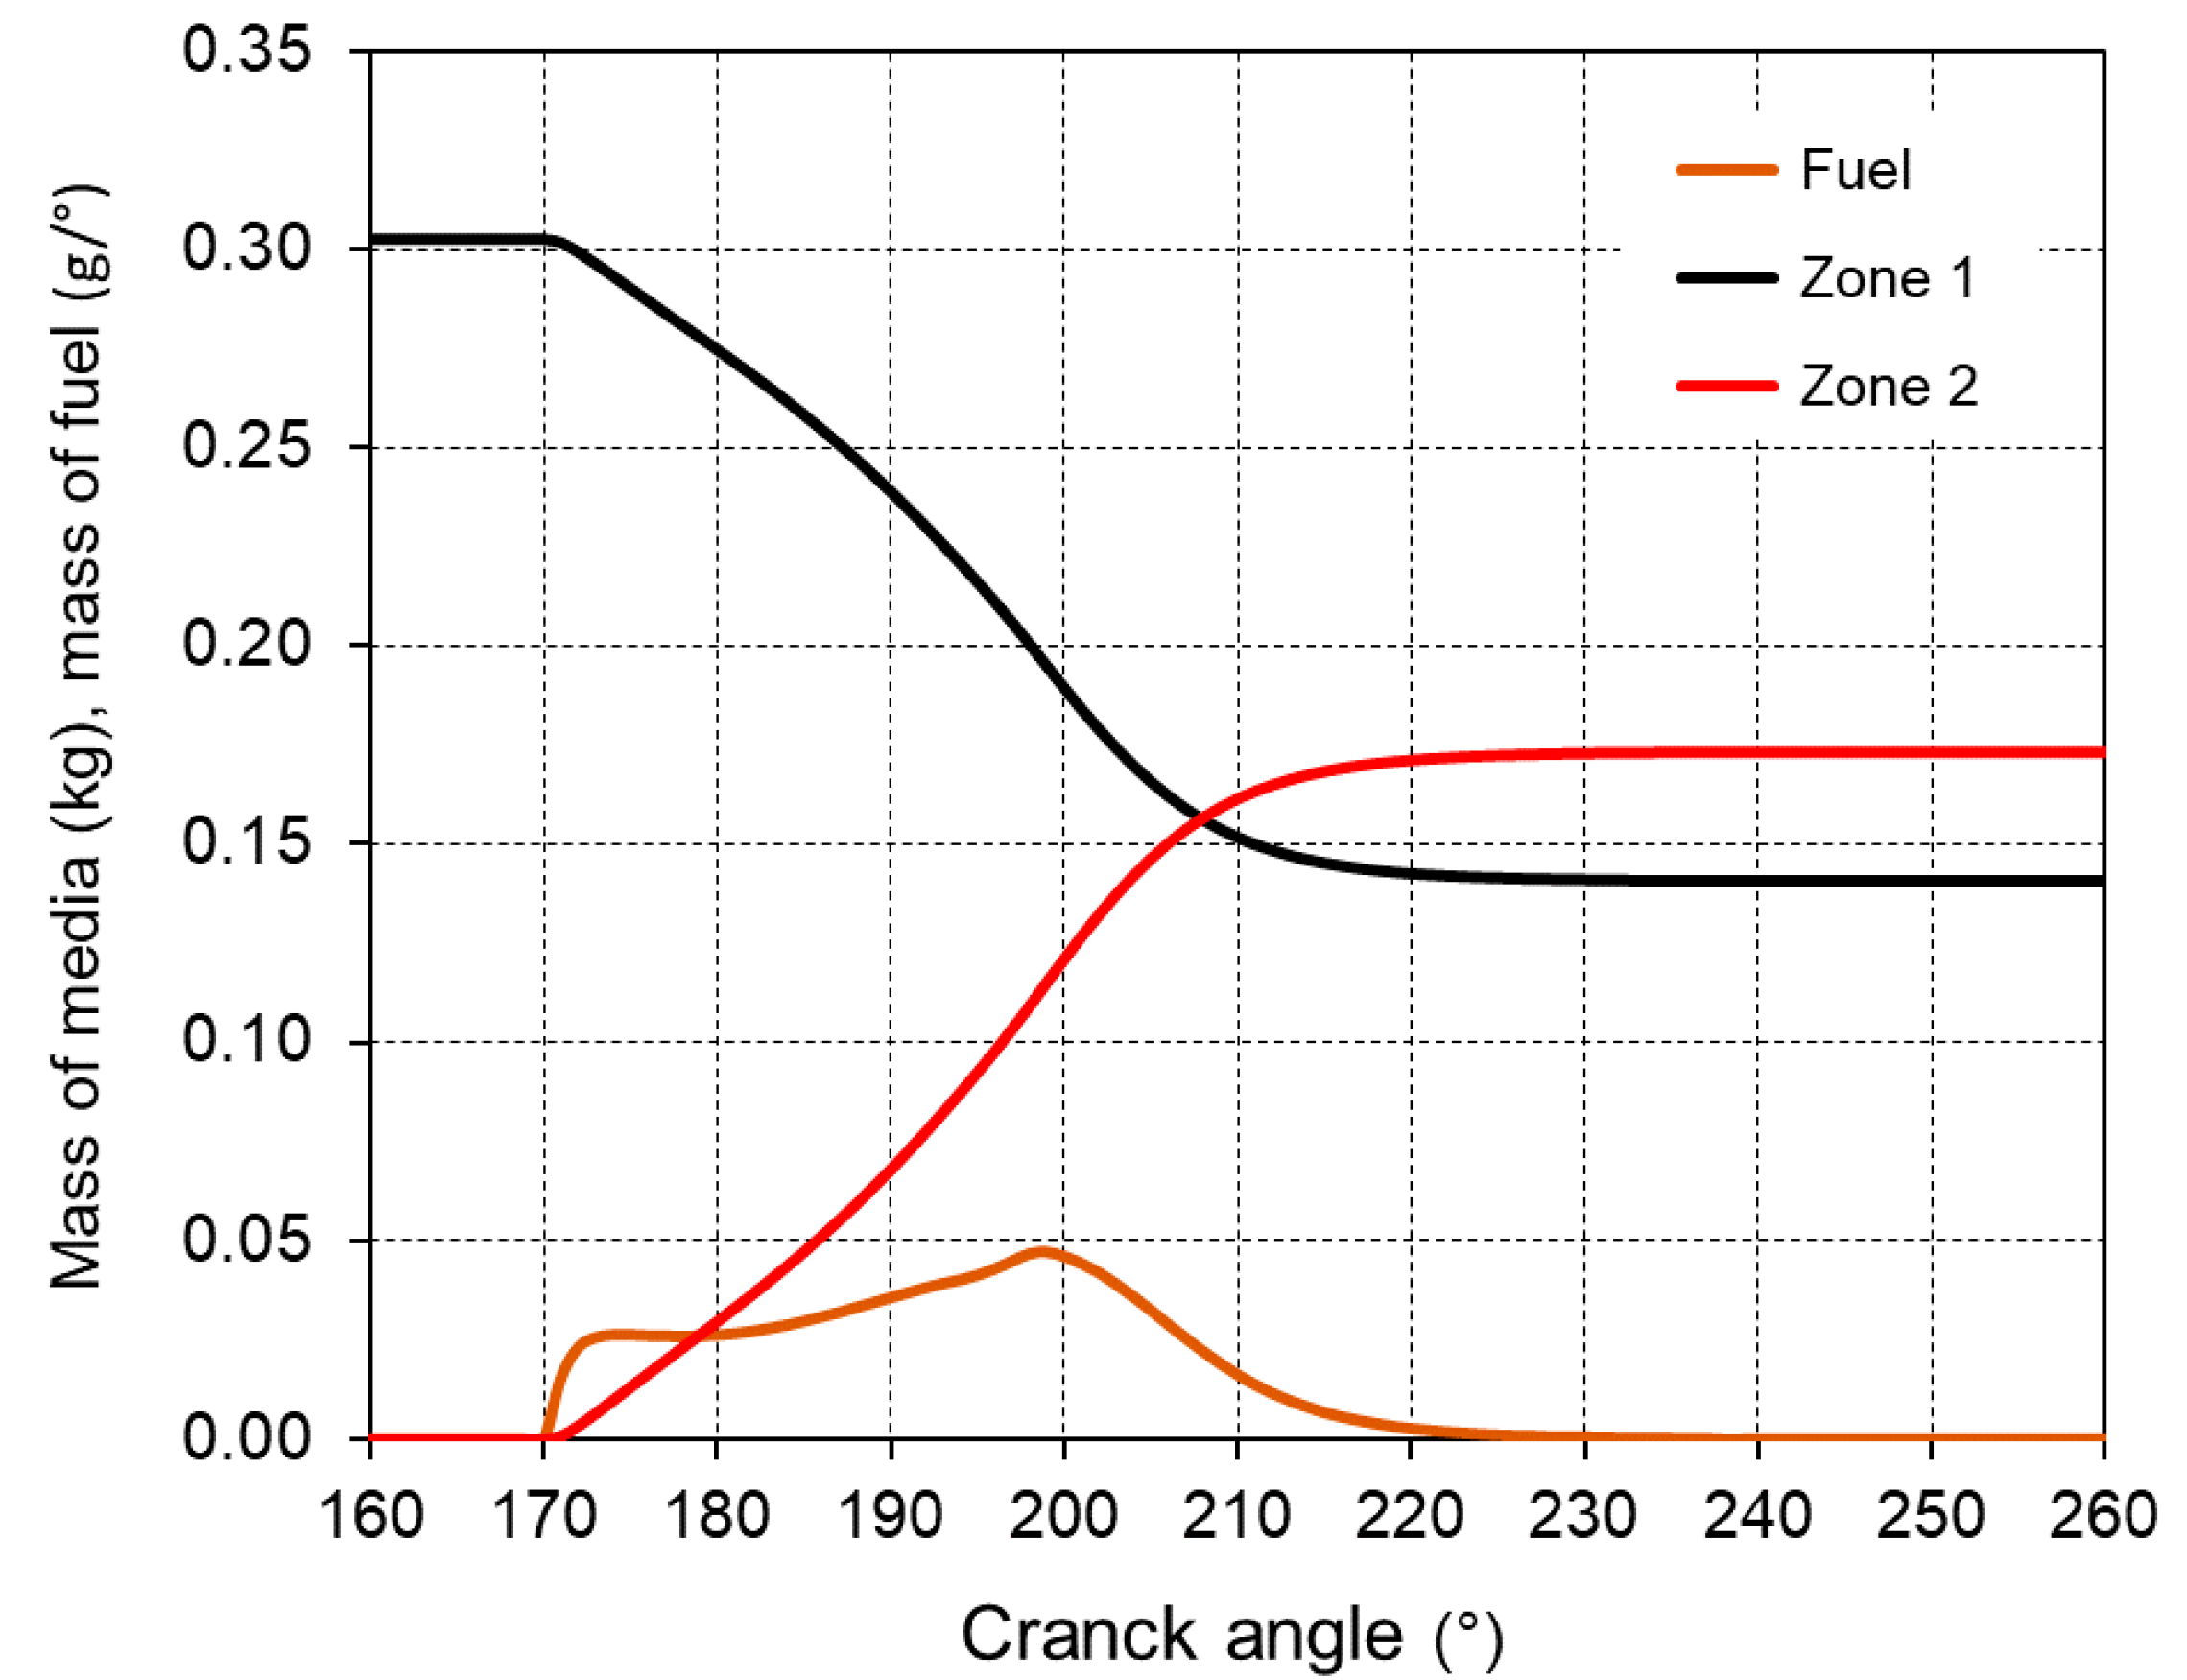
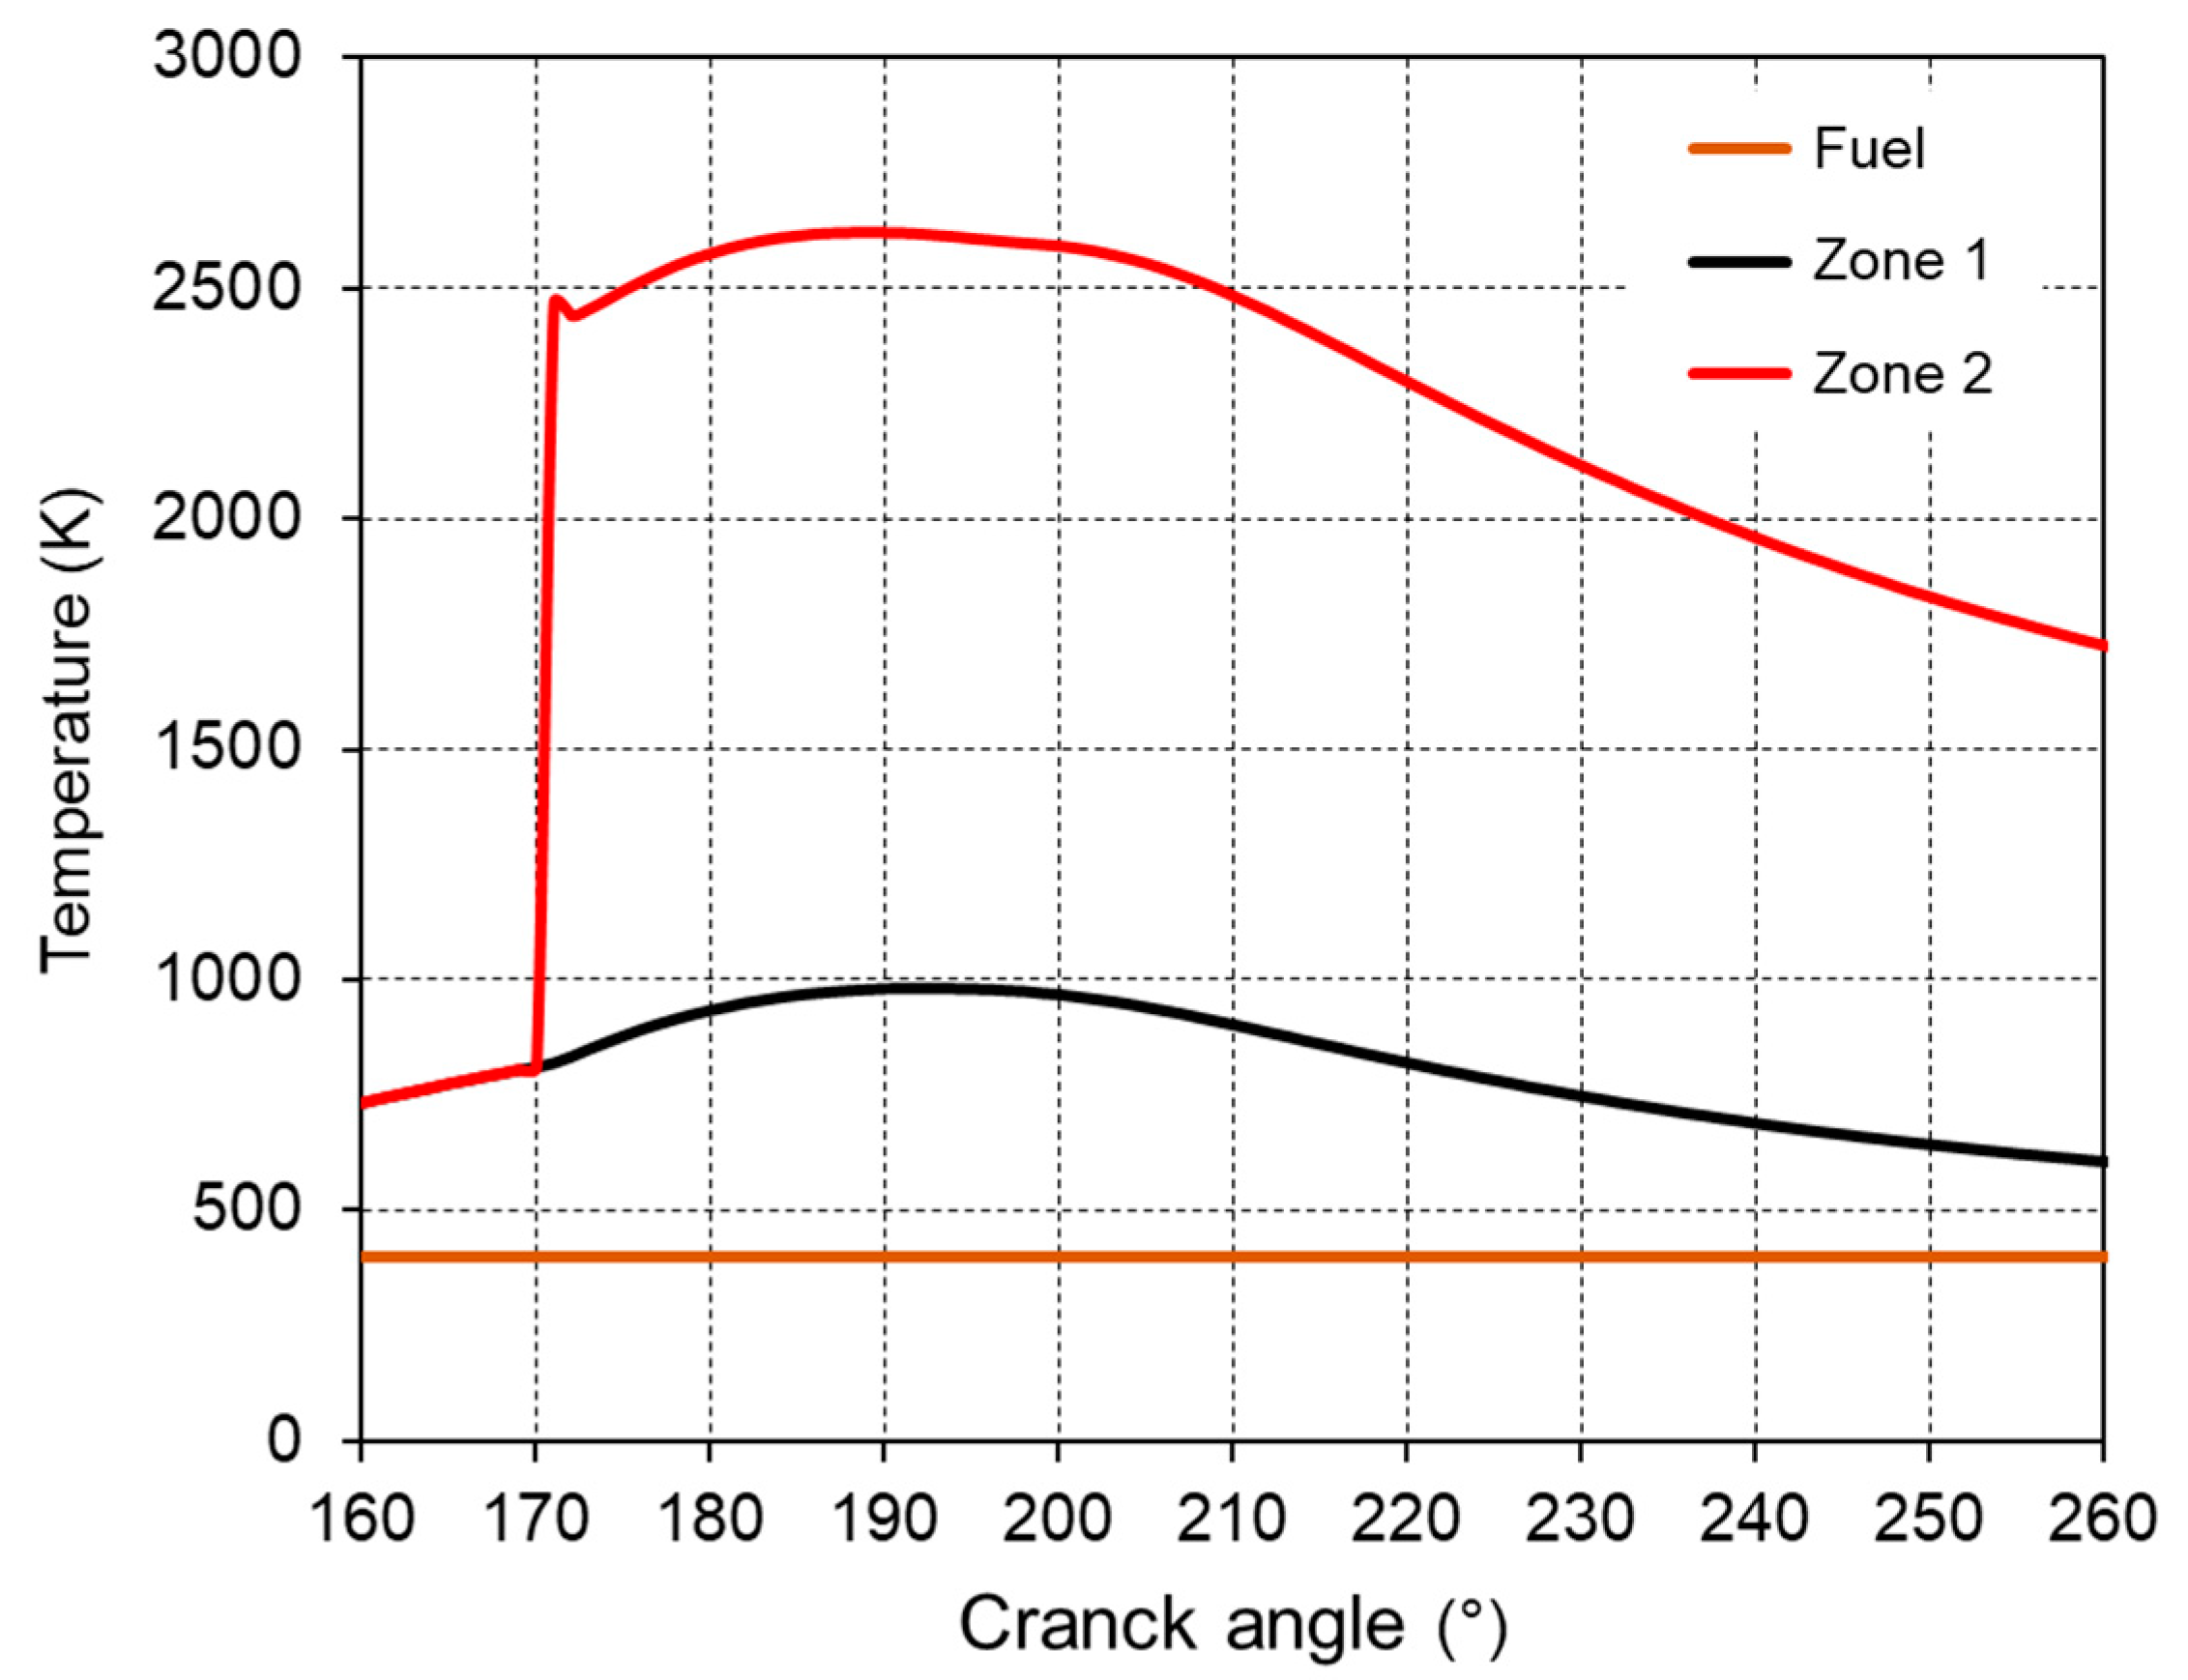
The changes in the mass and temperature of the medium in the zones depending on the position of the crankshaft obtained by applying the described numerical model are shown in
Figure 5 and
Figure 6.
4. Nitrogen Oxide Formation Submodel
The applied model of “thermal” nitrogen oxide formation is based on the extended Zeldovic mechanism. Models in which the formation of NO is described with three chemical reactions as in papers [
19,
22,
46] are most often used in the literature. Chemical reactions of formation and decomposition of nitrogen monoxide are:
In the conditions prevailing during combustion and due to the short time due to the relatively high speed of the combustion process, equilibrium concentrations of NO do not occur. All other chemical reactions that take place in the combustion space are assumed to take place at high speed and that the concentration of chemical elements and compounds (O2, H, H2, OH, N, N2, CO, CO2 and H2O) is in a state of chemical equilibrium.
Changes in the concentration of NO in the chamber in which the combustion process takes place are calculated according to the expression:
The concentrations of all elements in square brackets marked with the subscript “e” are calculated from the chemical equilibrium conditions. The coefficients of formation rate
ki,f and decomposition rates
ki,d are calculated using the expressions from Reference [
47].
Concentrations of individual components under the condition of chemical equilibrium, depending on pressure, temperature and equivalent ratio of fuel and air
Φ are calculated using the model described in Reference [
48]. In this model, diesel fuel was replaced by a hydrocarbon C
12H
26.
5. Validation of Numerical Model of the Engine
The developed numerical model of the engine was validated using the engine manufacturer data and measurements acquired during sea trial of LNG ships with diesel-electric propulsion.
Validation of numerical model of the engine was based on the Wärtsilä 12V50DF engine data (
Table 2). All presented data refers to engine performance running on heavy fuel oil (HFO).
Manufacturer’s records at different loads (
Table 3) and sea trial records LNG carrier (
Table 4) were compared with the results obtained by numerical simulations.
The simulation of engine operation under steady-state conditions was performed for five operating points in the range of 40% to 100% of the engine rated power. Model validation was performed by comparing data from
Table 3 and
Table 4 with data obtained by simulating specific fuel consumption, maximum cylinder pressure, exhaust gas temperature and exhaust gas mass flow.
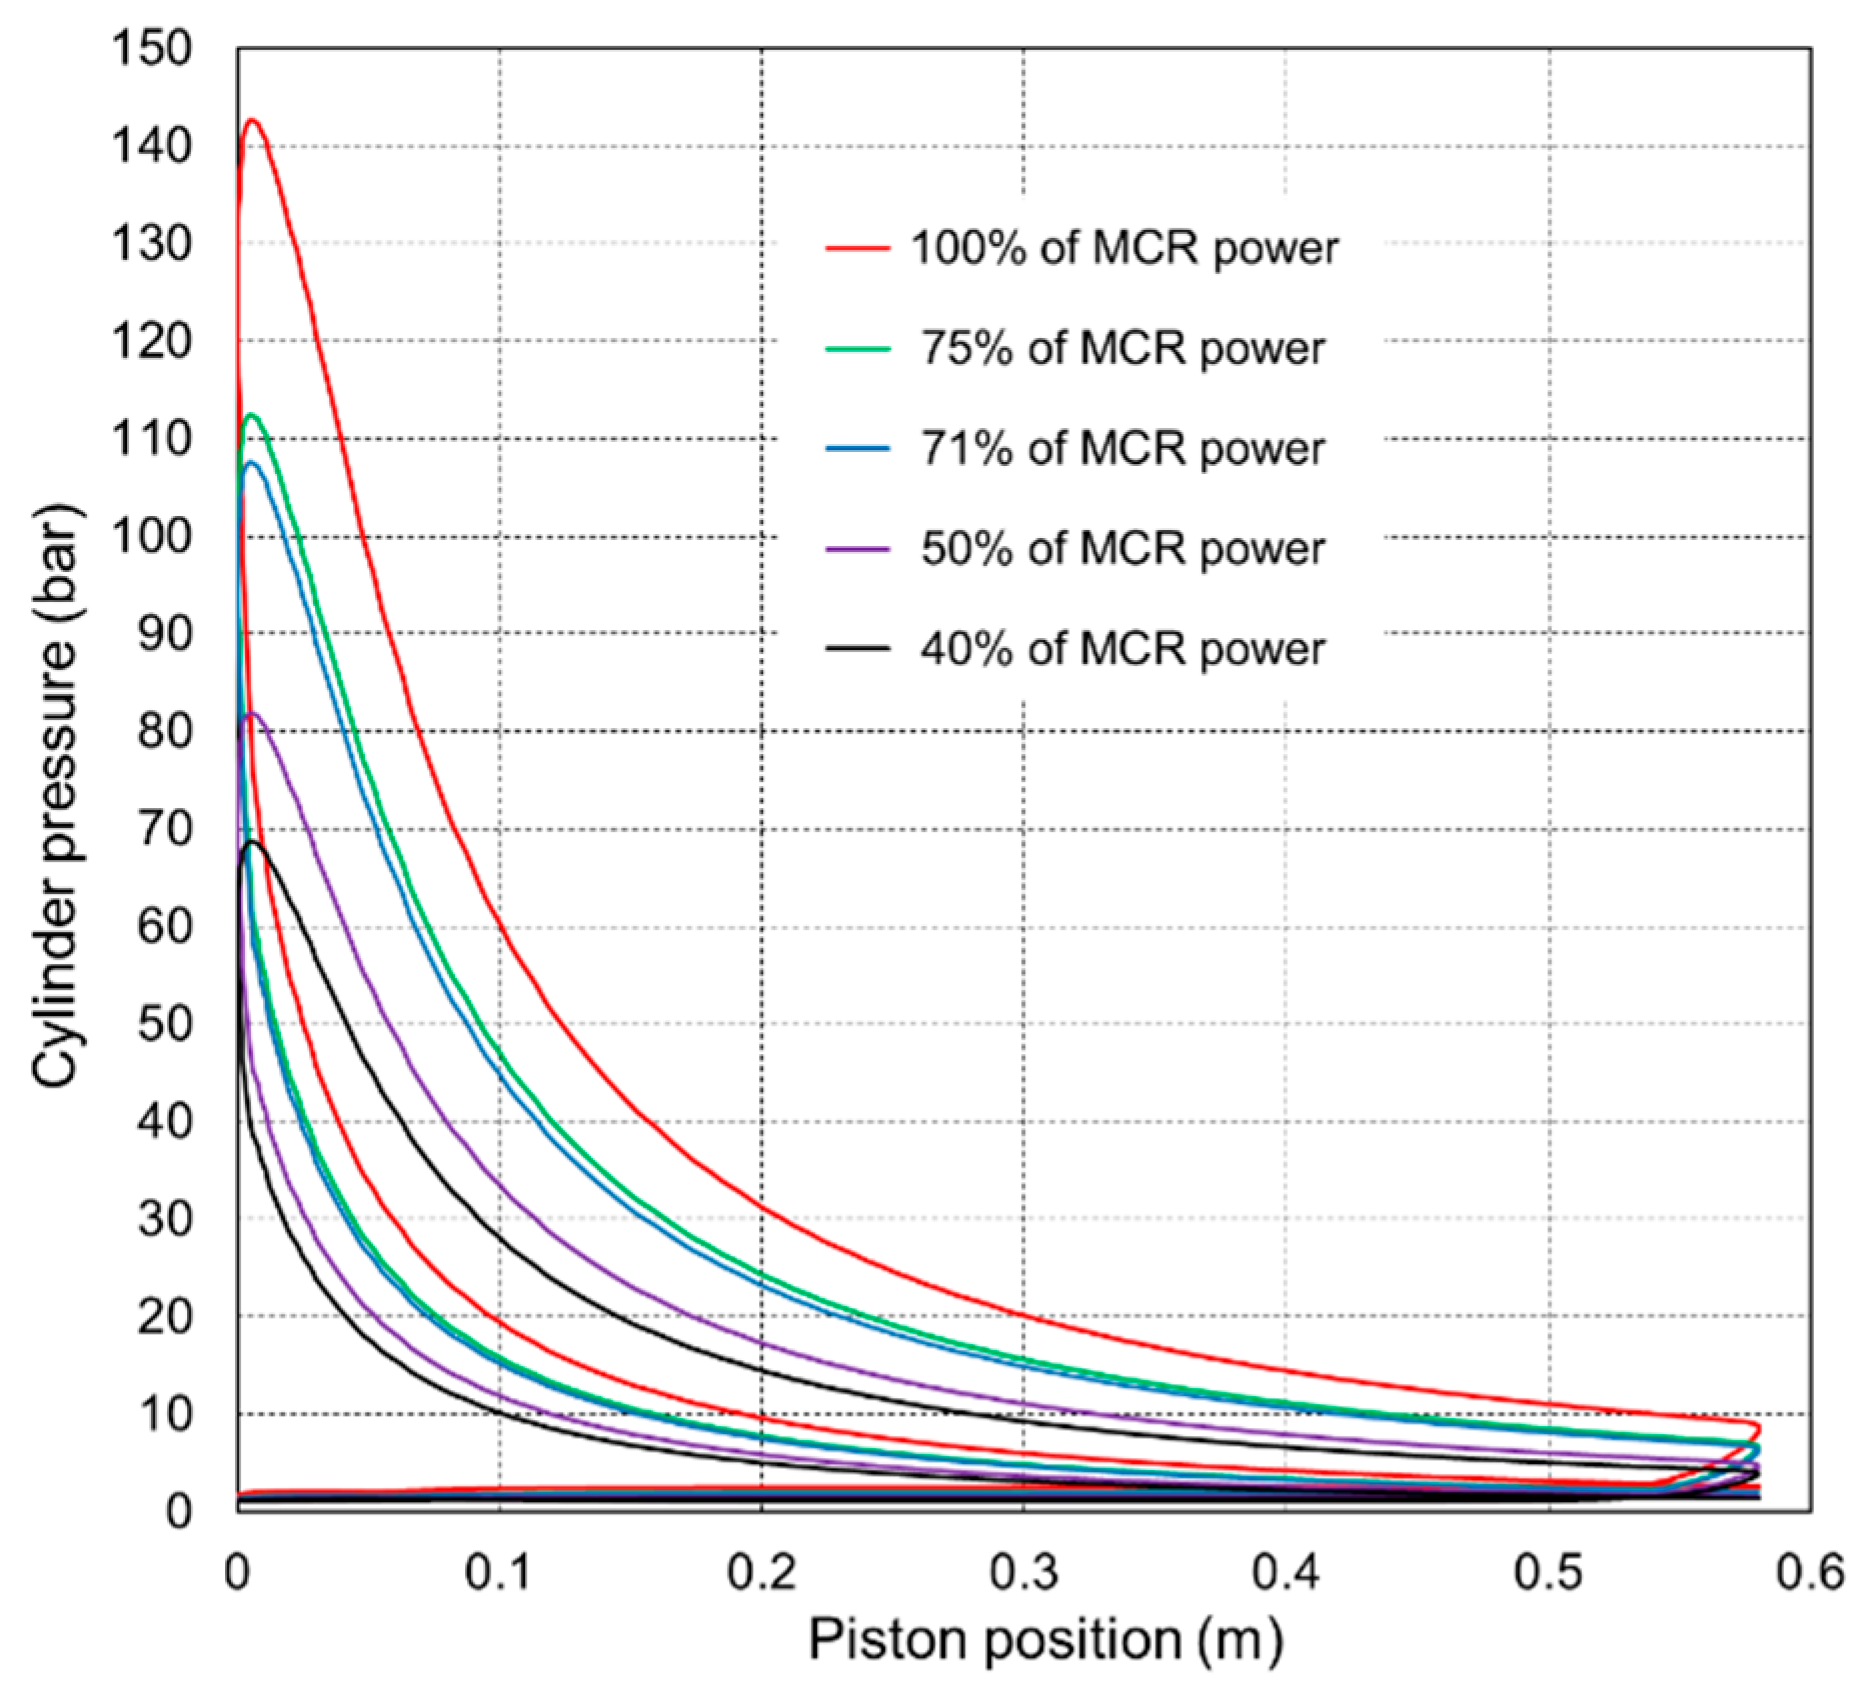
Figure 7 shows closed indicating diagrams for five engine operating regimes obtained by developed engine operation simulation software.
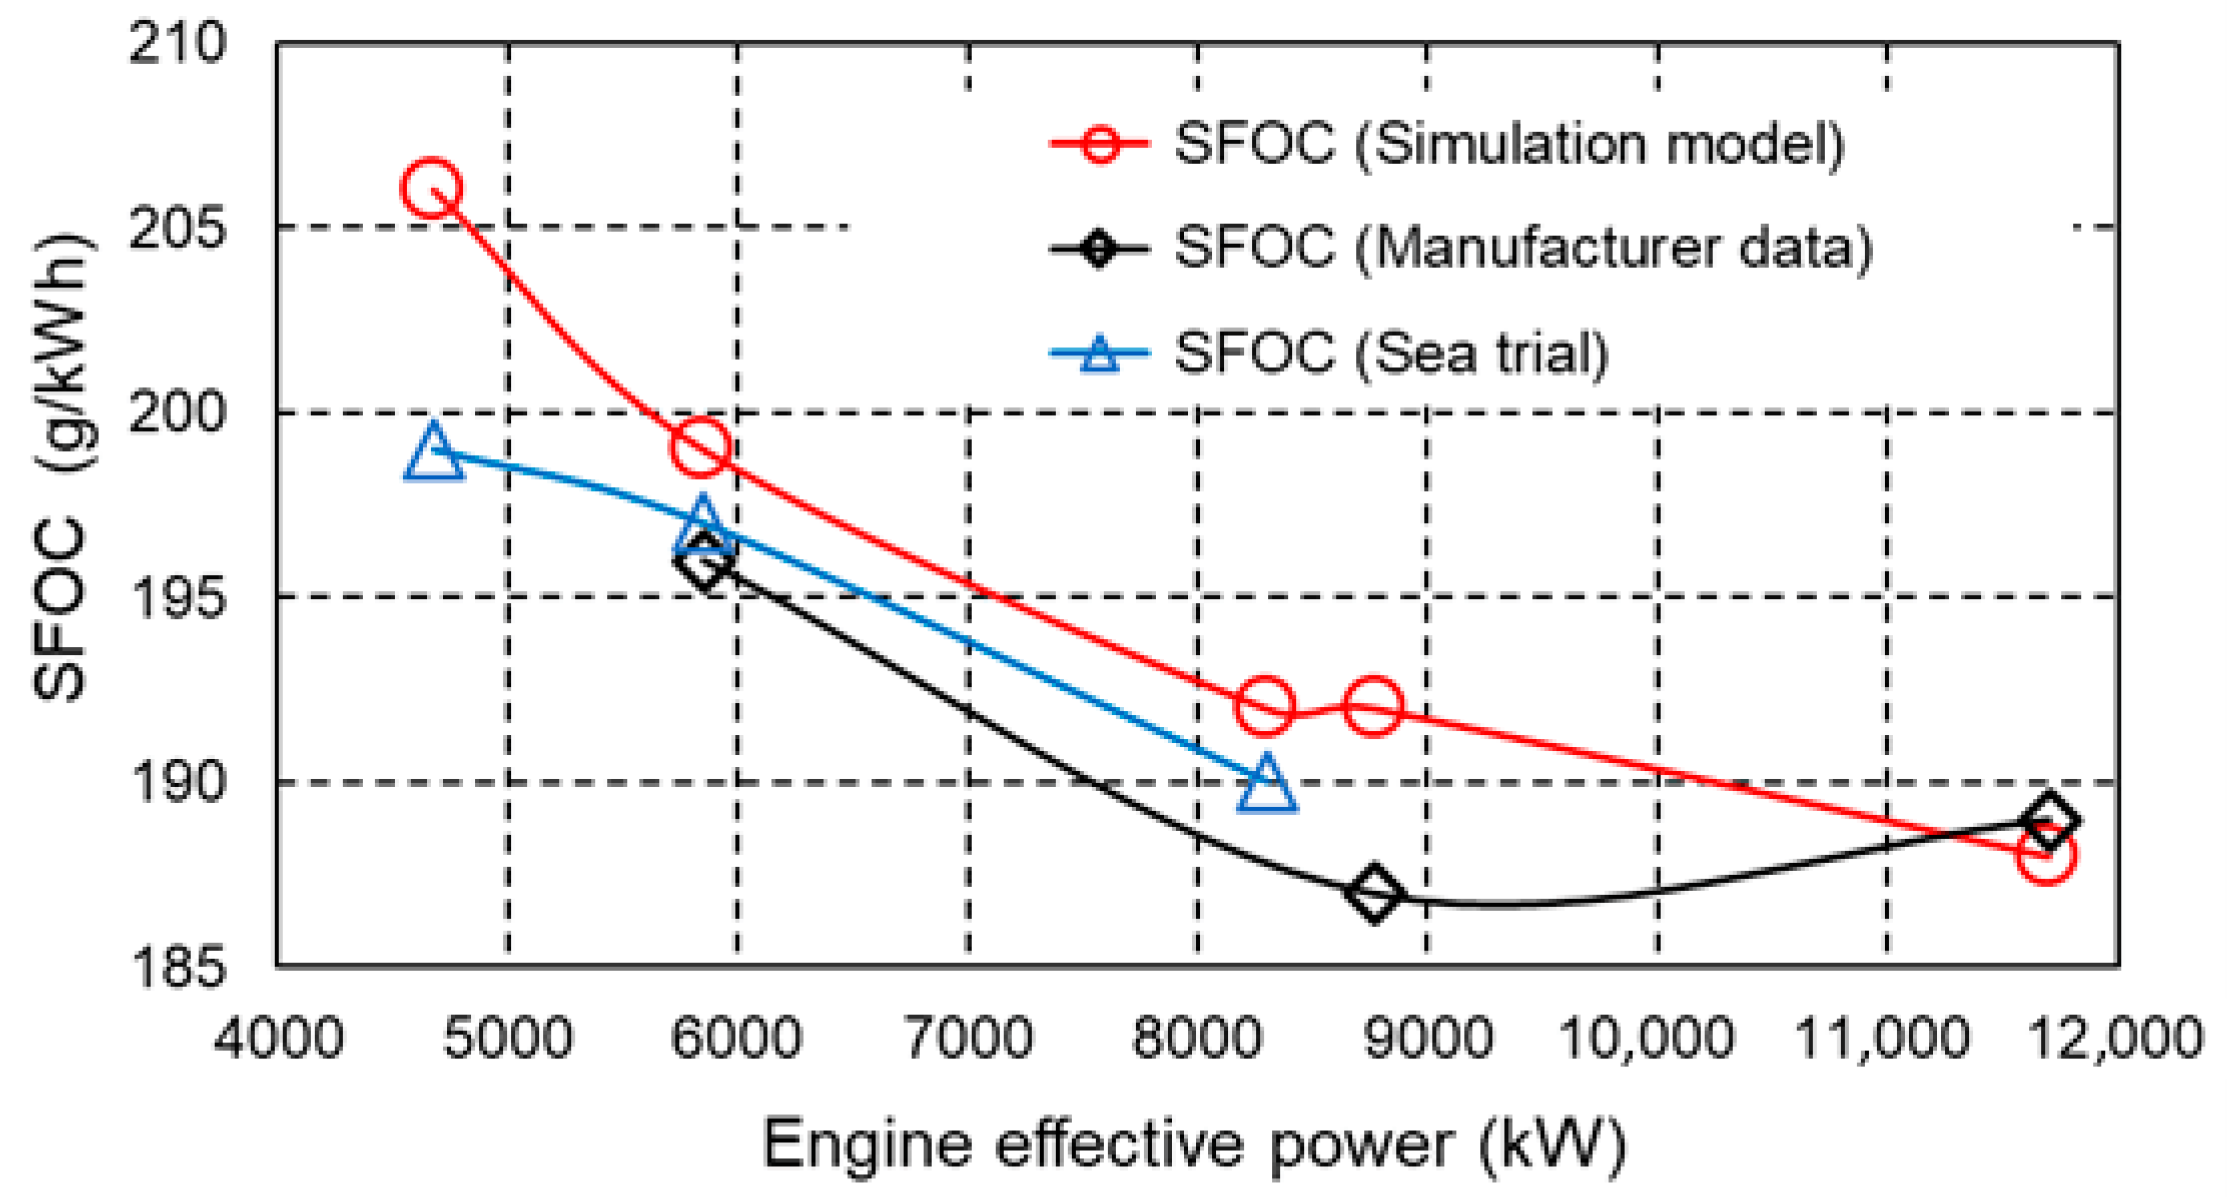
Figure 8 shows the comparison of the specific fuel oil consumption measured on the test bed and during the sea trial with the values obtained by the engine simulation model. The largest deviation occurs at 40% of the engine load, which is approximately 3.5%, that is, 7 g/kWh. The smallest deviation from the measured data occurs between 50% and 71% of the maximum engine load and is less than 1%, that is, 2 g/kWh.
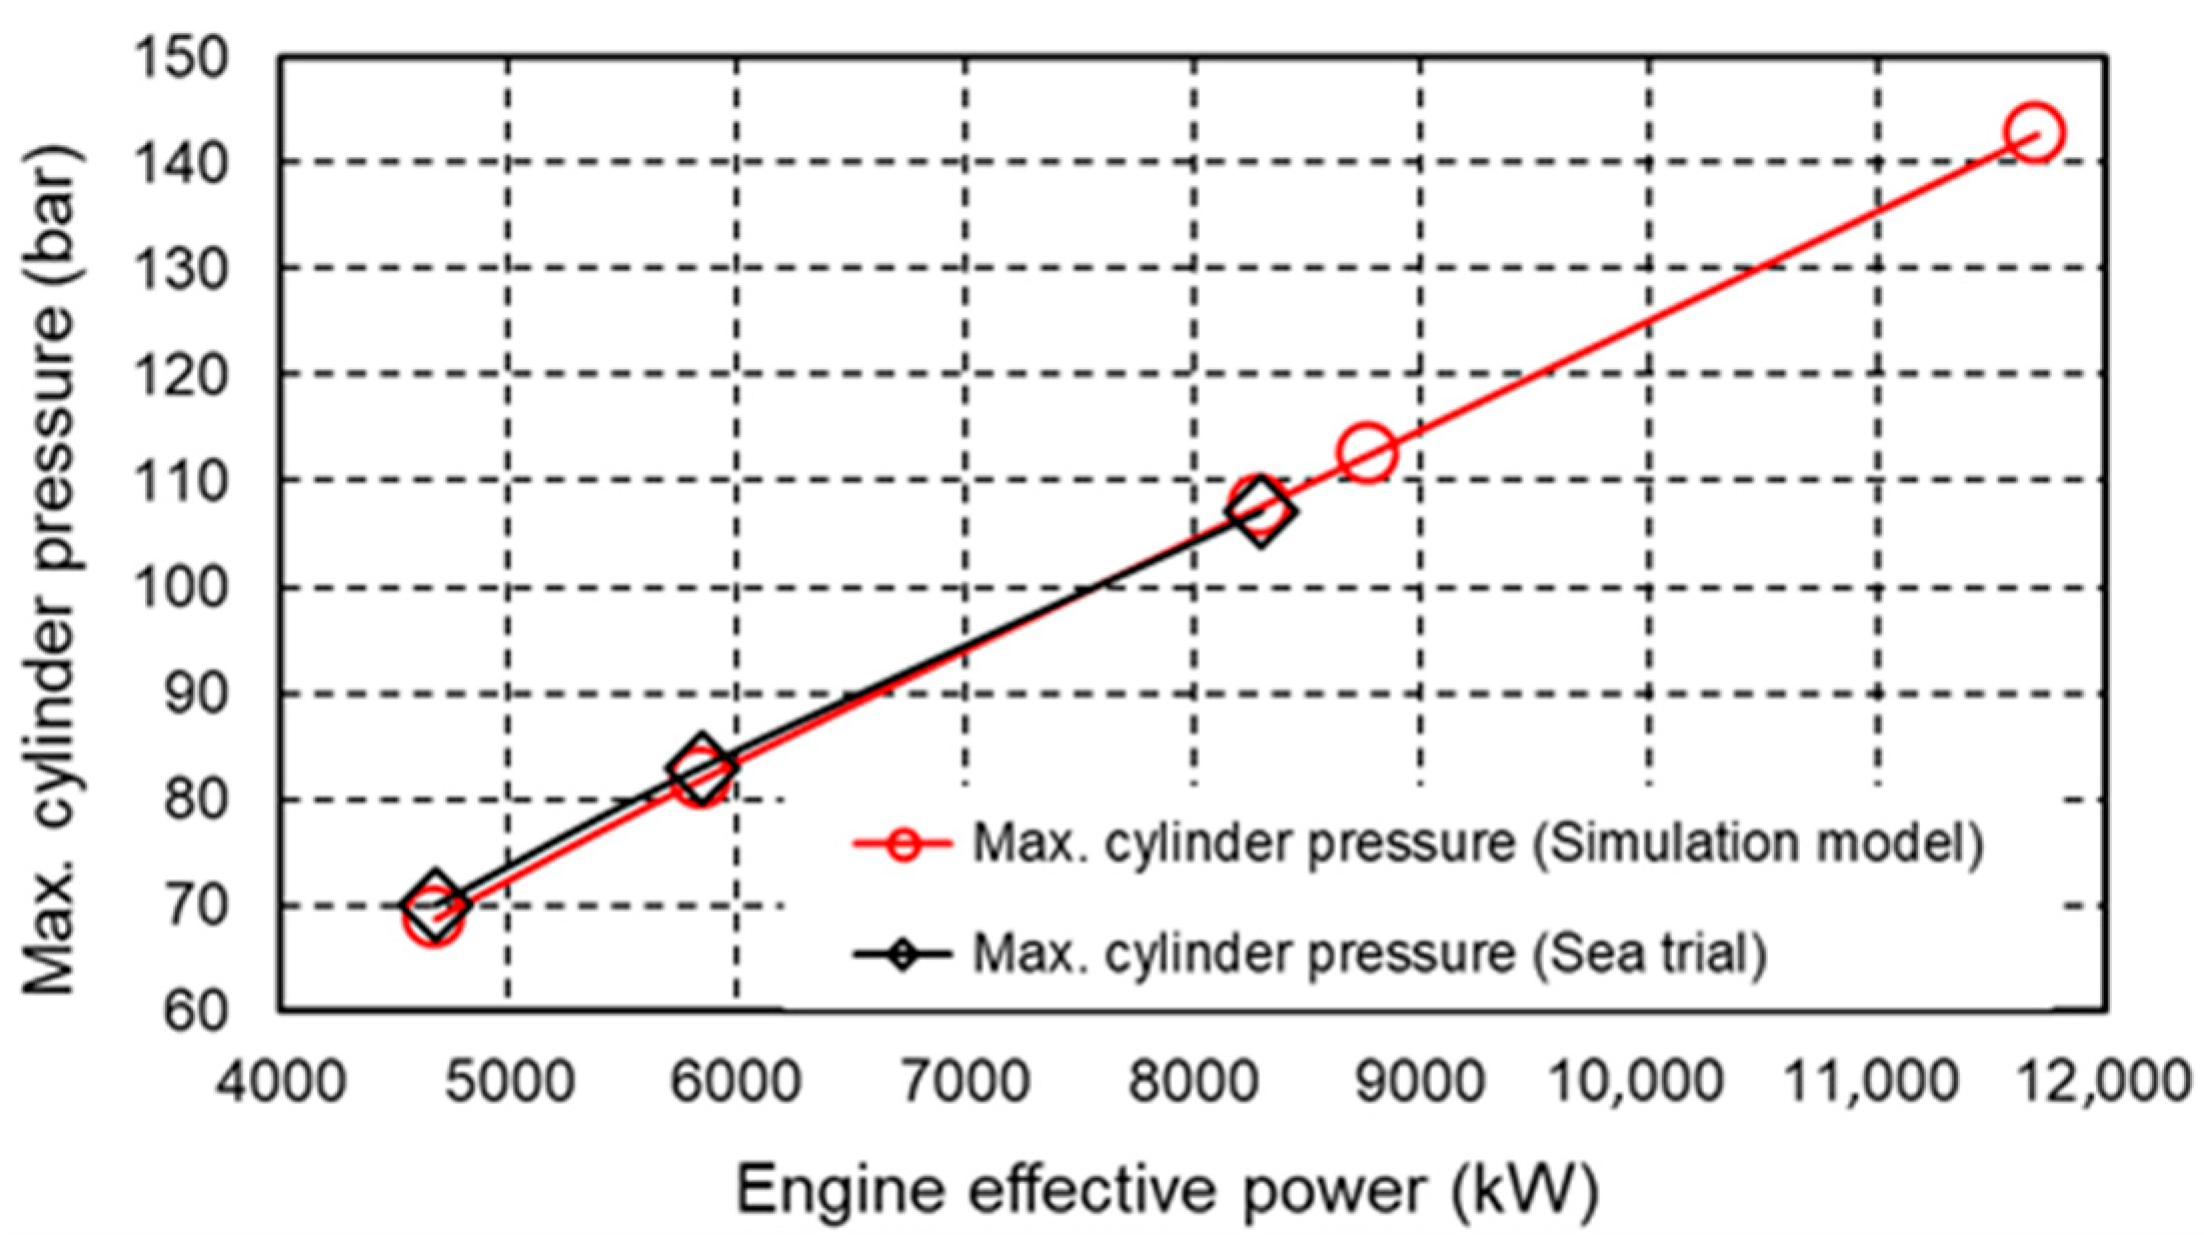
Figure 9 shows a comparison of the maximum pressures in the engine cylinder. The absolute pressure deviations are less than 1 bar at all observed operating regimes. The maximum pressure in the engine cylinder measured during the sea trial is presented as an average value of all 12 cylinders.
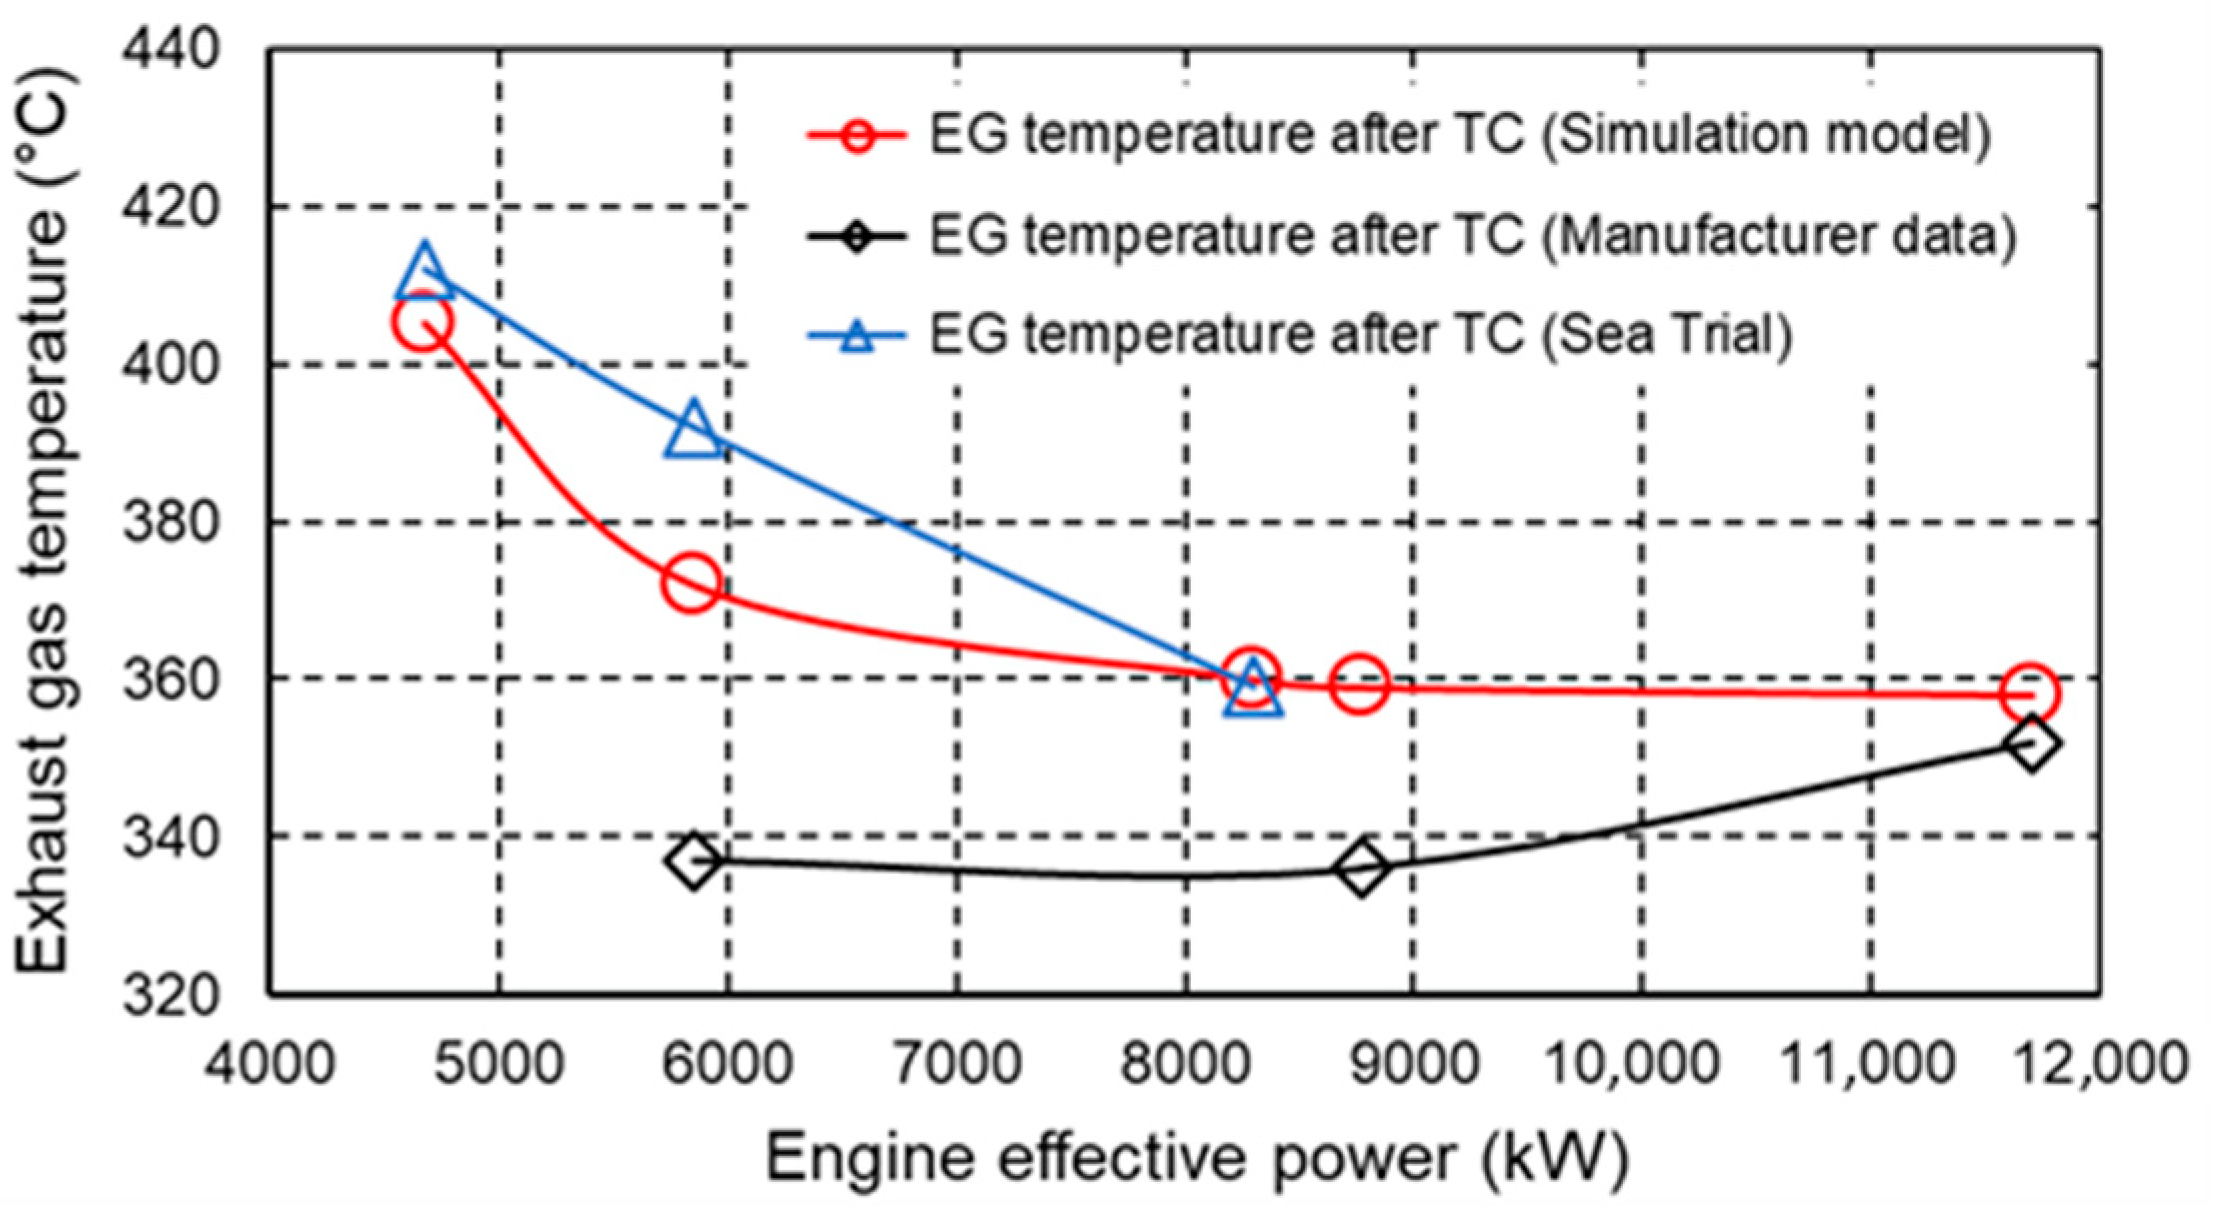
Figure 10 shows the comparison of exhaust gas temperatures after the turbocharger. The biggest difference occurs at 50% of the engine load and its value is 10.4%, that is, 35 °C. The deviation at the same operating point compared to the sea trial data is 6.8%, that is, 20 °C. The difference between the exhaust gas temperatures after the turbocharger is only 1.7%, that is, 6 °C at full engine load.
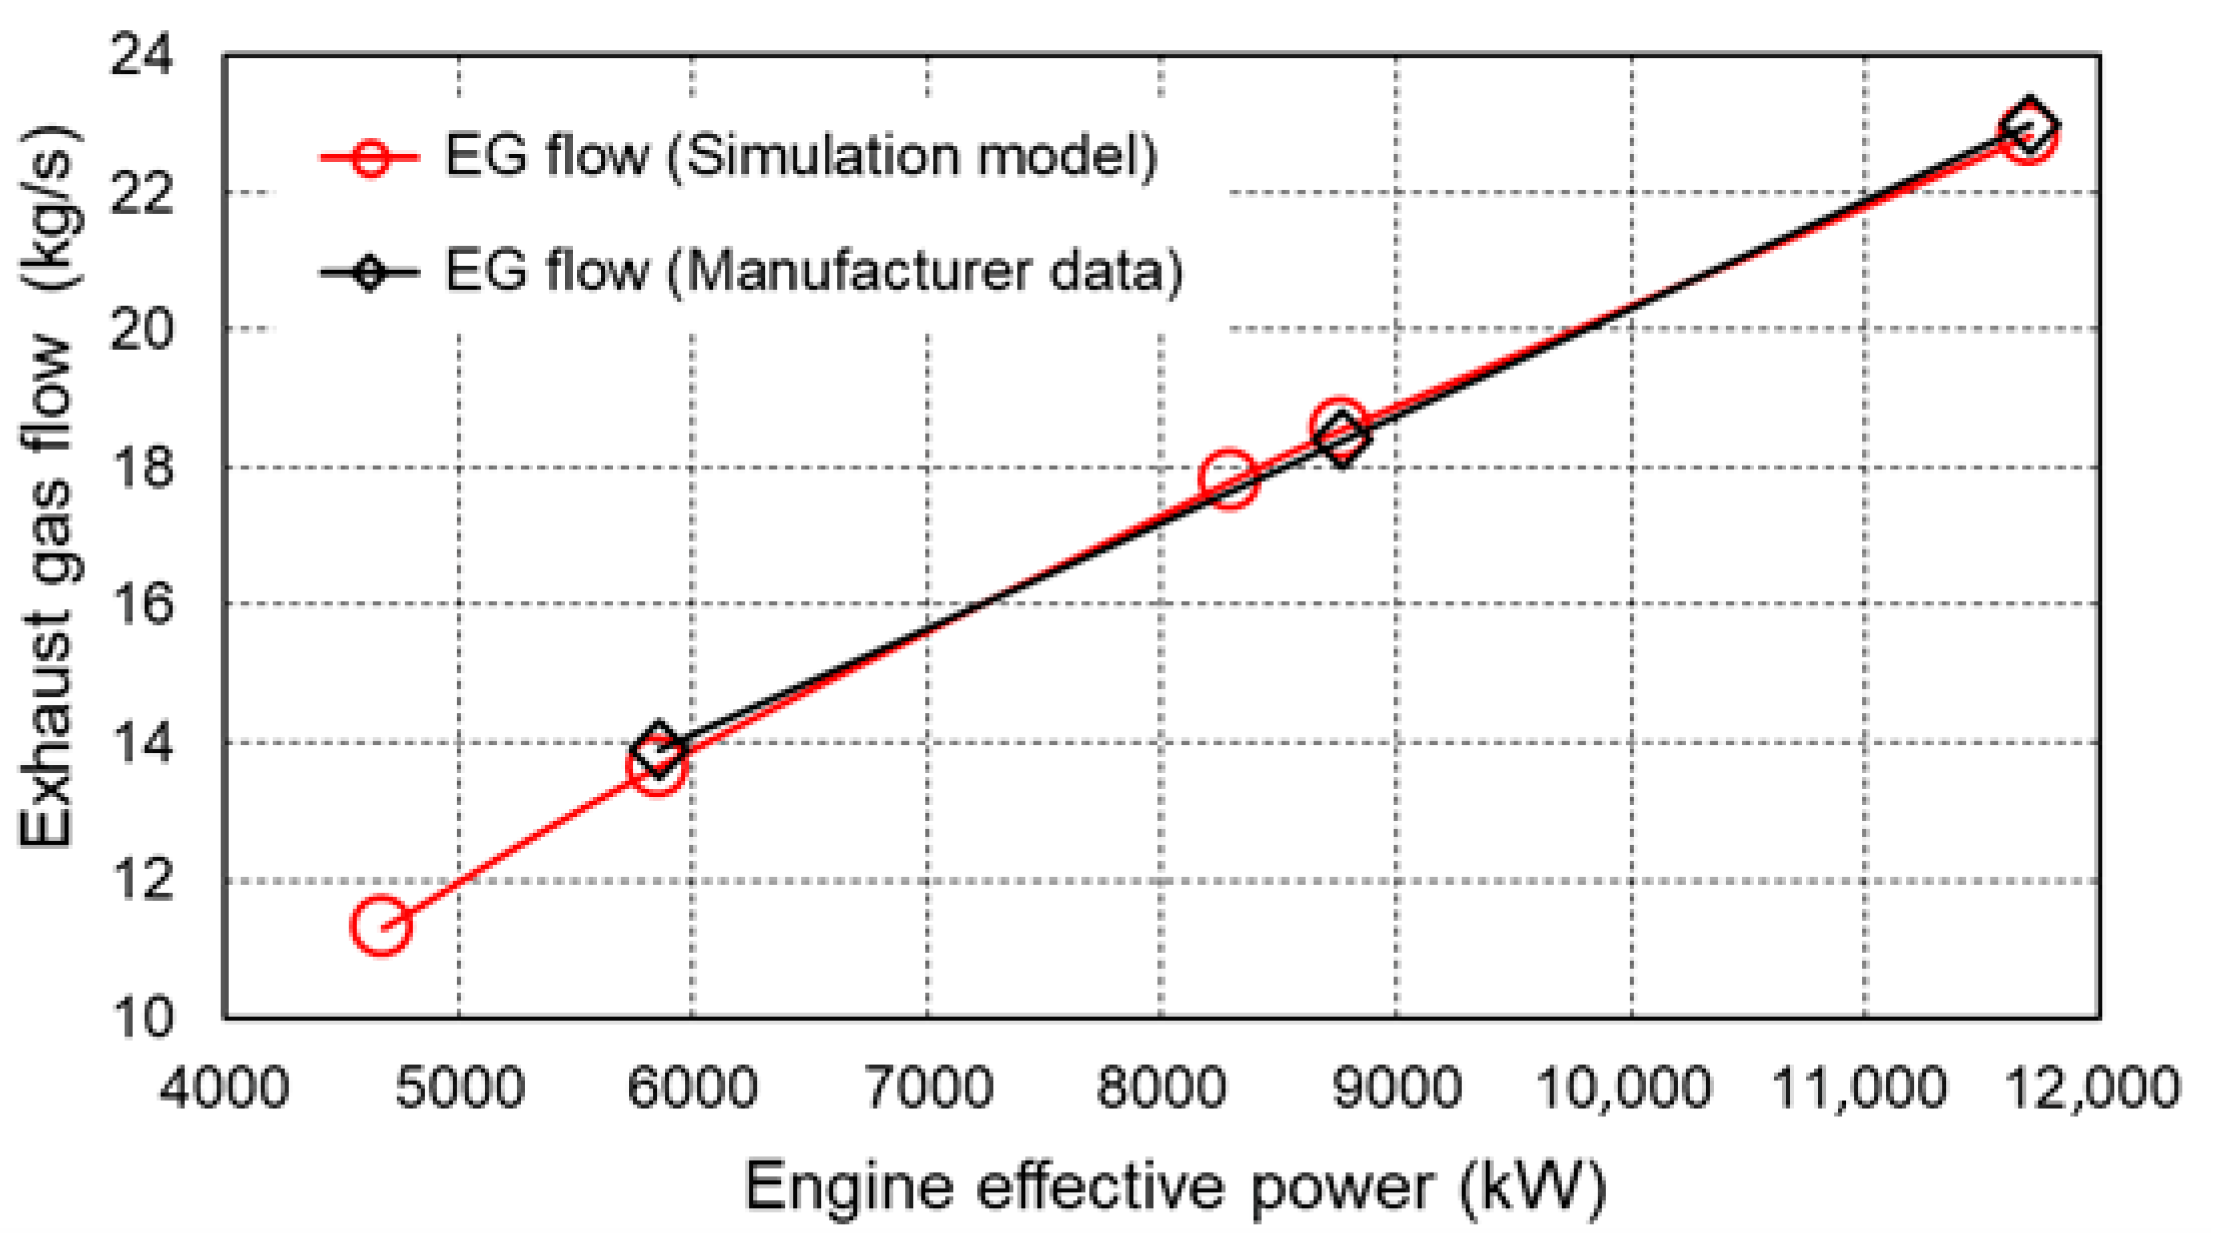
Comparison of the exhaust gas mass flows shown in
Figure 11 indicate on very small deviations between manufacturer’s data and results obtained by numerical model of the engine.
6. Split Fuel Injection Impact on SFOC and NOx Emission
Split fuel injection can be used as a method to reduce NO
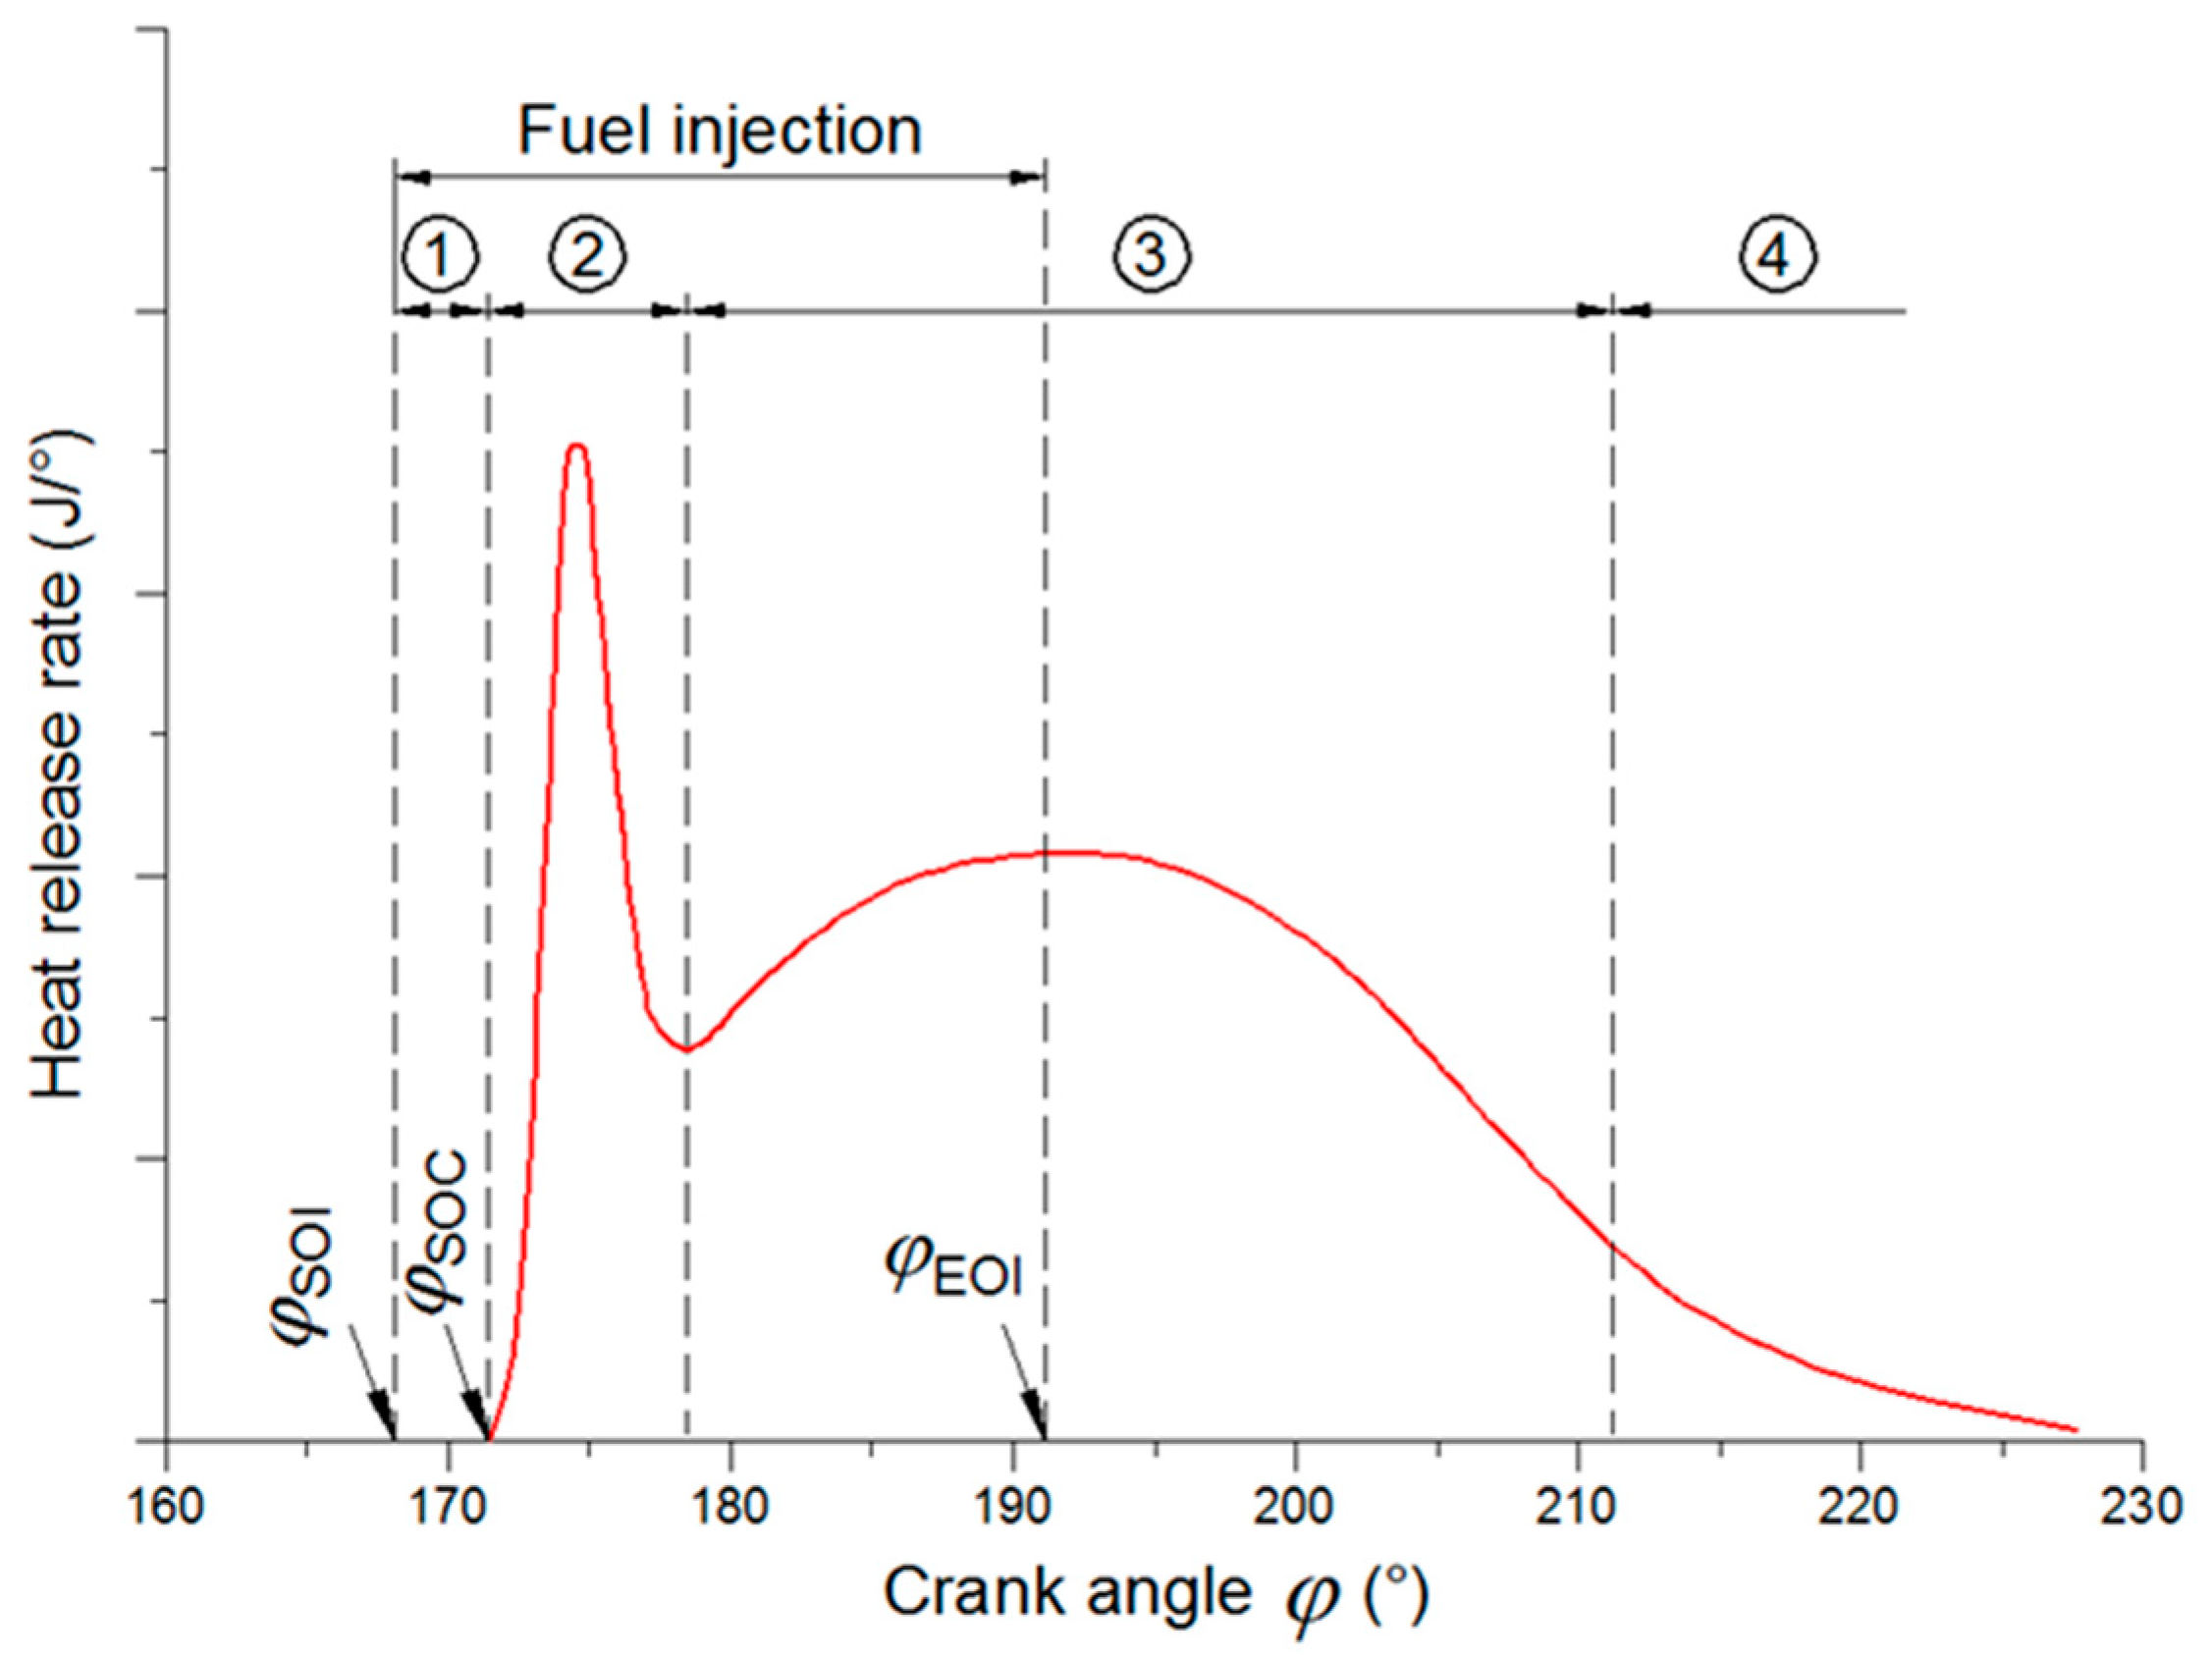
x emissions during combustion due to decreasing of temperature and pressure in the cylinder. The process in the diesel engine cylinder from the beginning of the fuel injection to the end of the fuel combustion takes place in four phases, as shown in
Figure 12. The first phase (1) is called the ignition delay and it involves the evaporation and mixing of the fuel until the conditions for ignition of the resulting fuel mixture are met. The second phase (2) is characterized by the relatively intensive combustion of the fuel mixture formed during the ignition delay period. The second phase is called the combustion of the previously formed mixture (premixed burning) and there is an intense release of heat which causes a sudden rise in temperature and pressure in the cylinder. After the initial sharp increase in the heat release rate, a third phase (3) follows in which the combustion rate is controlled by the rate of mixing of the remaining fuel with the fresh medium. In the third phase, called mixing controlled combustion, the heat release rate is lower than in the previous phase. During the fourth phase (4) of combustion, the remaining fuel burns out and this phase is called late combustion.
The use of split injection can significantly affect the course of the combustion process or the amount of harmful substances in the exhaust gases of diesel engines. Pilot injection has a significant impact on the reduction of NO
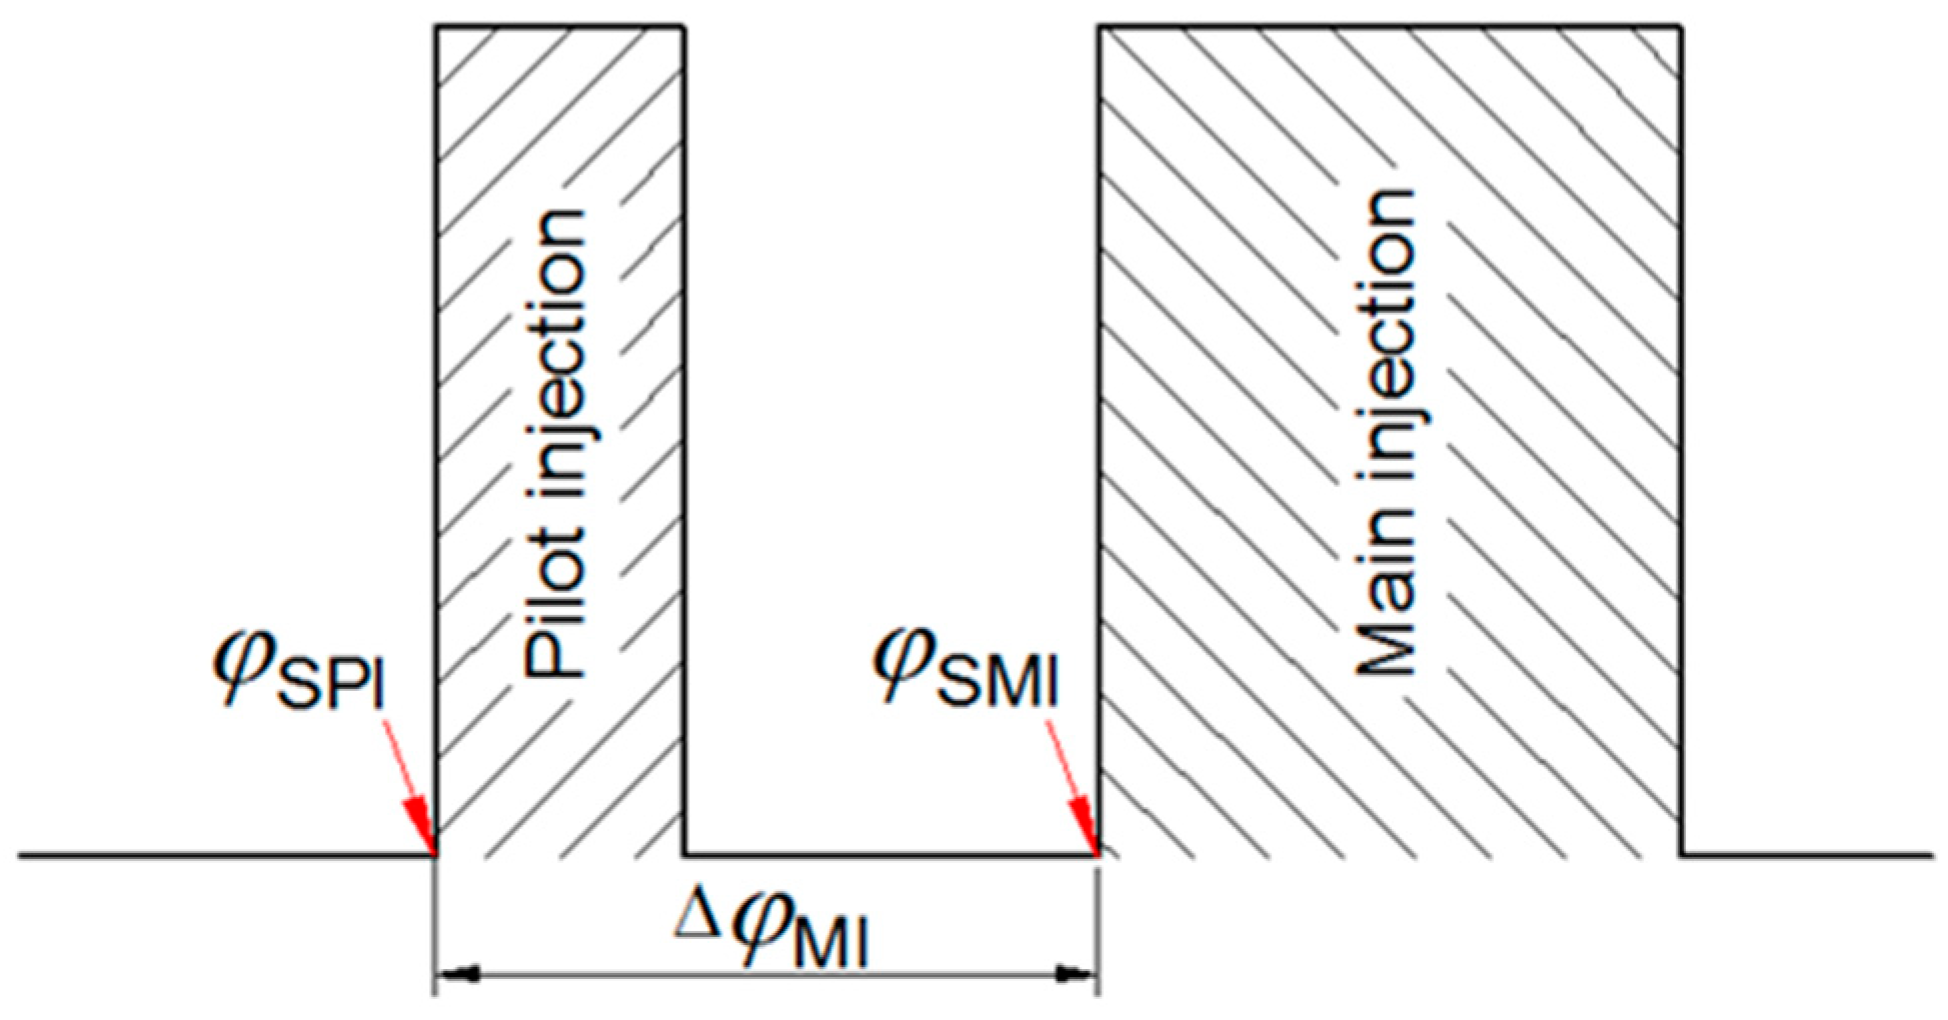
x emissions as well as noise generated during the combustion. While subsequent fuel injection can achieve a reduction in soot emissions, as well as an increase in the exhaust gas temperature required when applying secondary exhaust aftertreatment measures. The basic principle of split fuel injection into the engine cylinder is shown in
Figure 13.
In
Figure 13, the following labels were used:
φSPI—start of pilot injection,
φSMI—start of the main injection,
ΔφMI = φSMI − φSPU.
If applying an appropriate split injection scheme, it is possible to effectively control emissions. However, the attention has to be paid to the specific fuel consumption. It is necessary to choose an injection scheme in which a compromise will be reached between reducing emissions and increasing specific fuel consumption.
The results of experimental research [
50,
51,
52] have shown that increasing the amount of pilot injected fuel increases NO
x emissions, while increasing the difference Δ
φMI between the pilot and the main injection leads to an increase in specific fuel consumption.
In this study, the analysis of split injection was performed for stationary engine operating conditions at 50%, 75% and 100% of the rated engine power. For research purpose, nine schemes of fuel injection were selected.
For all three load cases, engine operation was simulated with 10%, 20% and 30% of pilot injection for total amount of fuel injected. Difference ΔφMI was varied as 3, 6 and 9 degrees of crankshaft angle for each pilot injection.
The corresponding injection schemes (Schemes 1–9) are marked as xx(y)zz, with “xx” and “zz” respectively giving the amount of fuel injected in the first pilot or second main injection phase. While “y” represents the angle of rotation of the crankshaft between the pilot and the main injection. Fuel quantities are expressed as percentages of the total amount of fuel injected into the cylinder per process.
The results obtained by computer simulation are presented and compared with the “basic” motor in the form of a diagram.
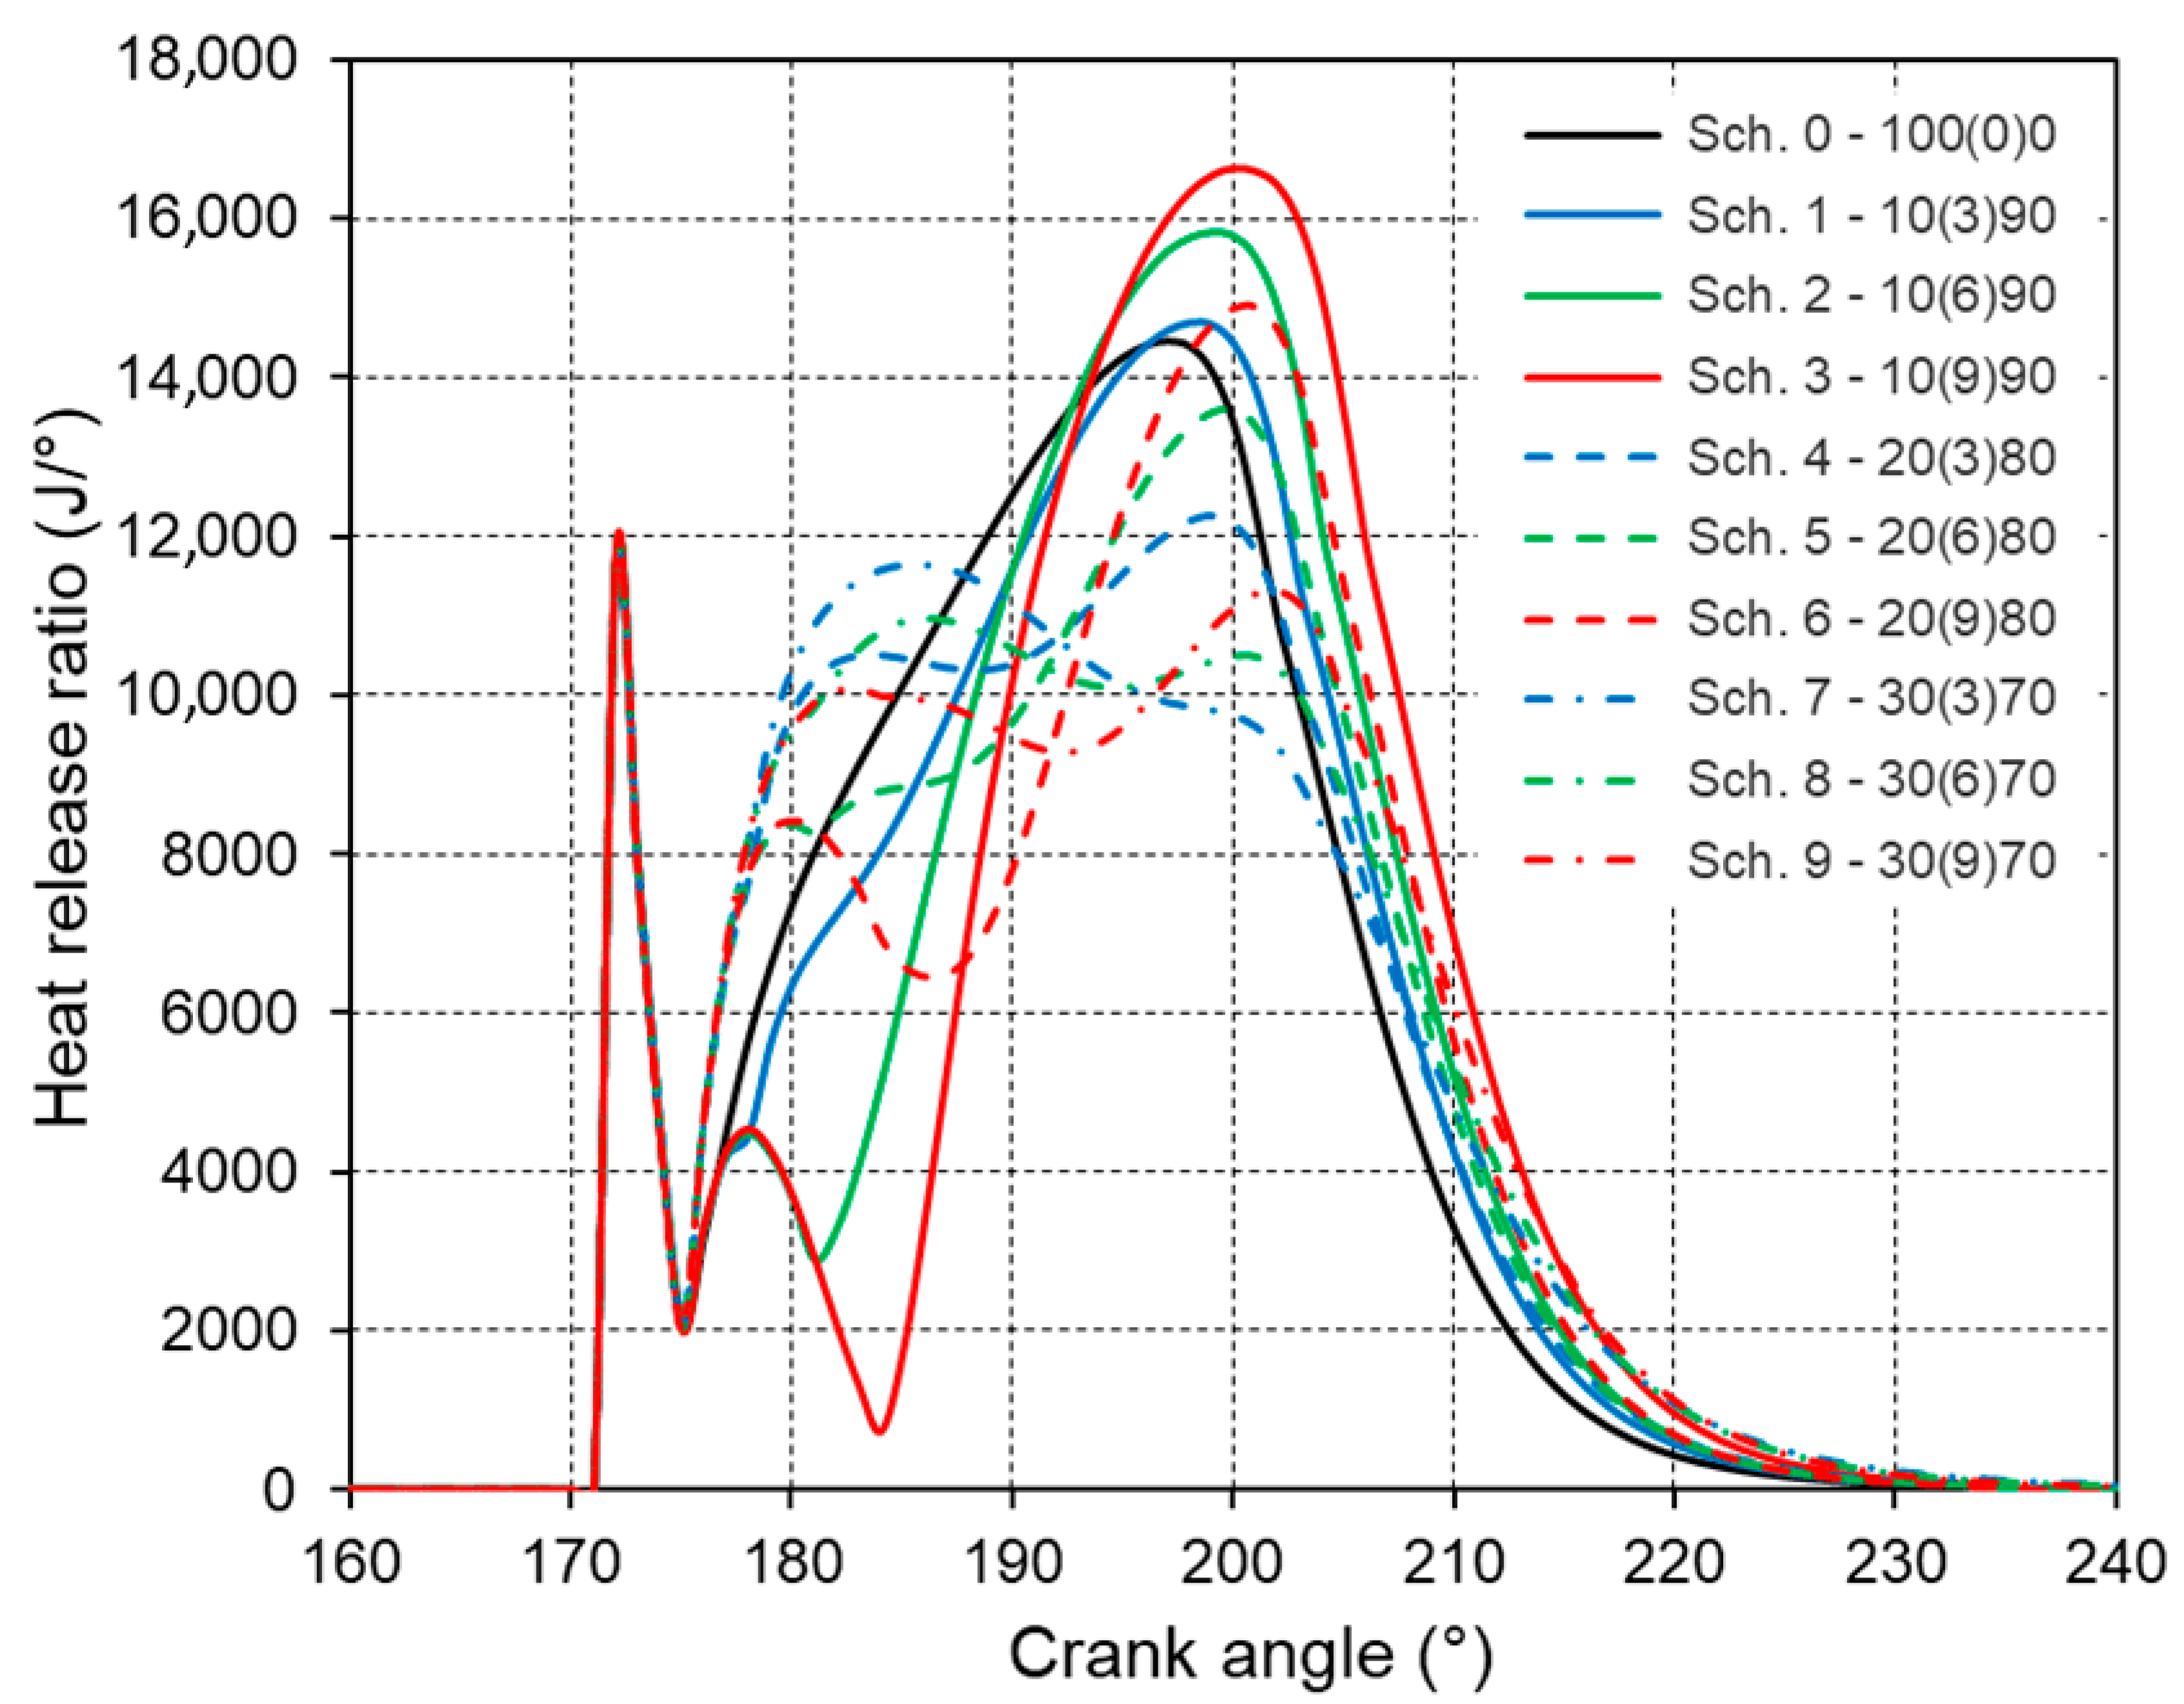
Figure 14 shows the heat release rate curves for the nine fuel injection schemes (Schemes 1–9) while
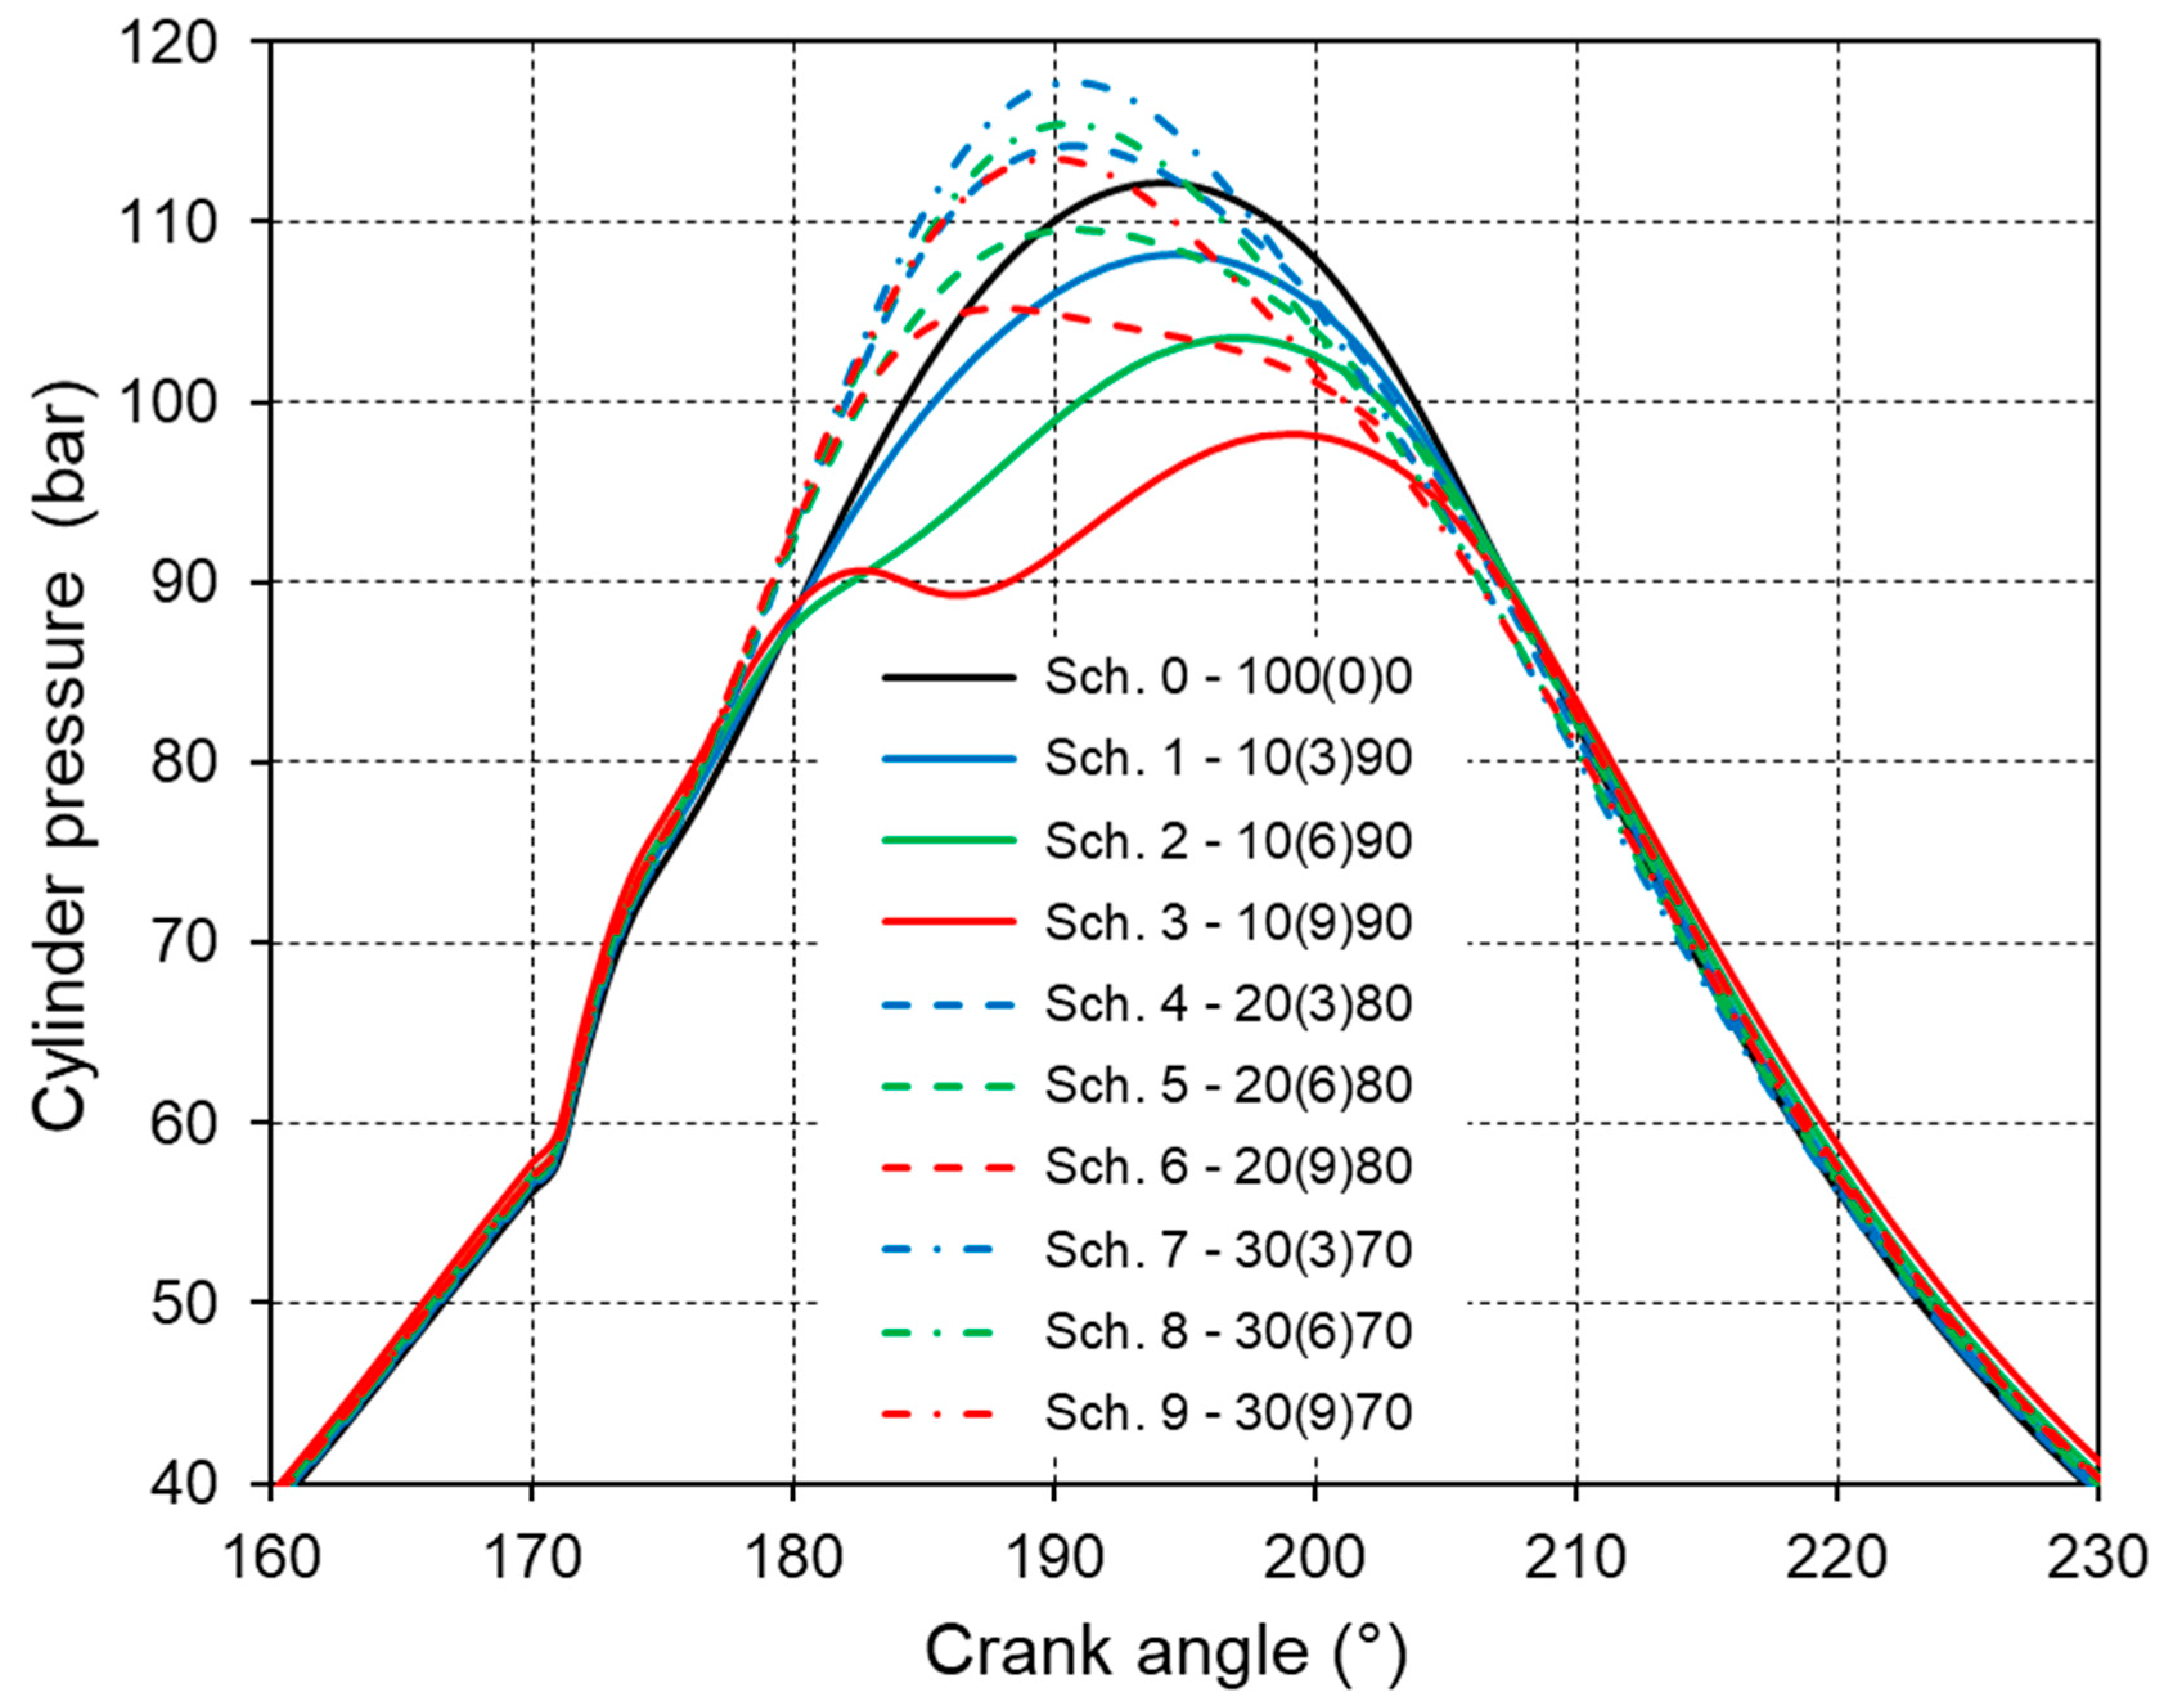
Figure 15 shows the effect of split injection on the pressure in the cylinder during the high-pressure part of the process. Both figures are showing curves for 75% of MCR power and the shape of curves obtained for 50% and 100% are very similar.
The diagrams shown in
Figure 14 and the corresponding heat release rate curves show that split combustion consisting of “pilot” and “main” injection results in a reduction in heat release rate in the first part of the mixing controlled combustion phase whose intensity is determined by the rate of fuel mixture formation. In this case, a greater reduction in the rate of heat release in the first part of the mixing controlled combustion phase occurs with an increase in the difference Δ
φMI between injections. As the proportion of injected “pilot” fuel increases, the effect on reducing the heat release rate decreases in the first part of the mixing controlled combustion phase but increases in the second part. The impact of split fuel injection on cylinder pressure is shown in
Figure 15. There is a noticeable trend of decreasing cylinder pressure with increasing the difference Δ
φMI between “pilot” and “main” injection. While increasing the amount of “pilot” fuel leads to a decrease in this effect. Further increase in the amount of “pilot” fuel also leads to an increase in the maximum pressure in the cylinder.
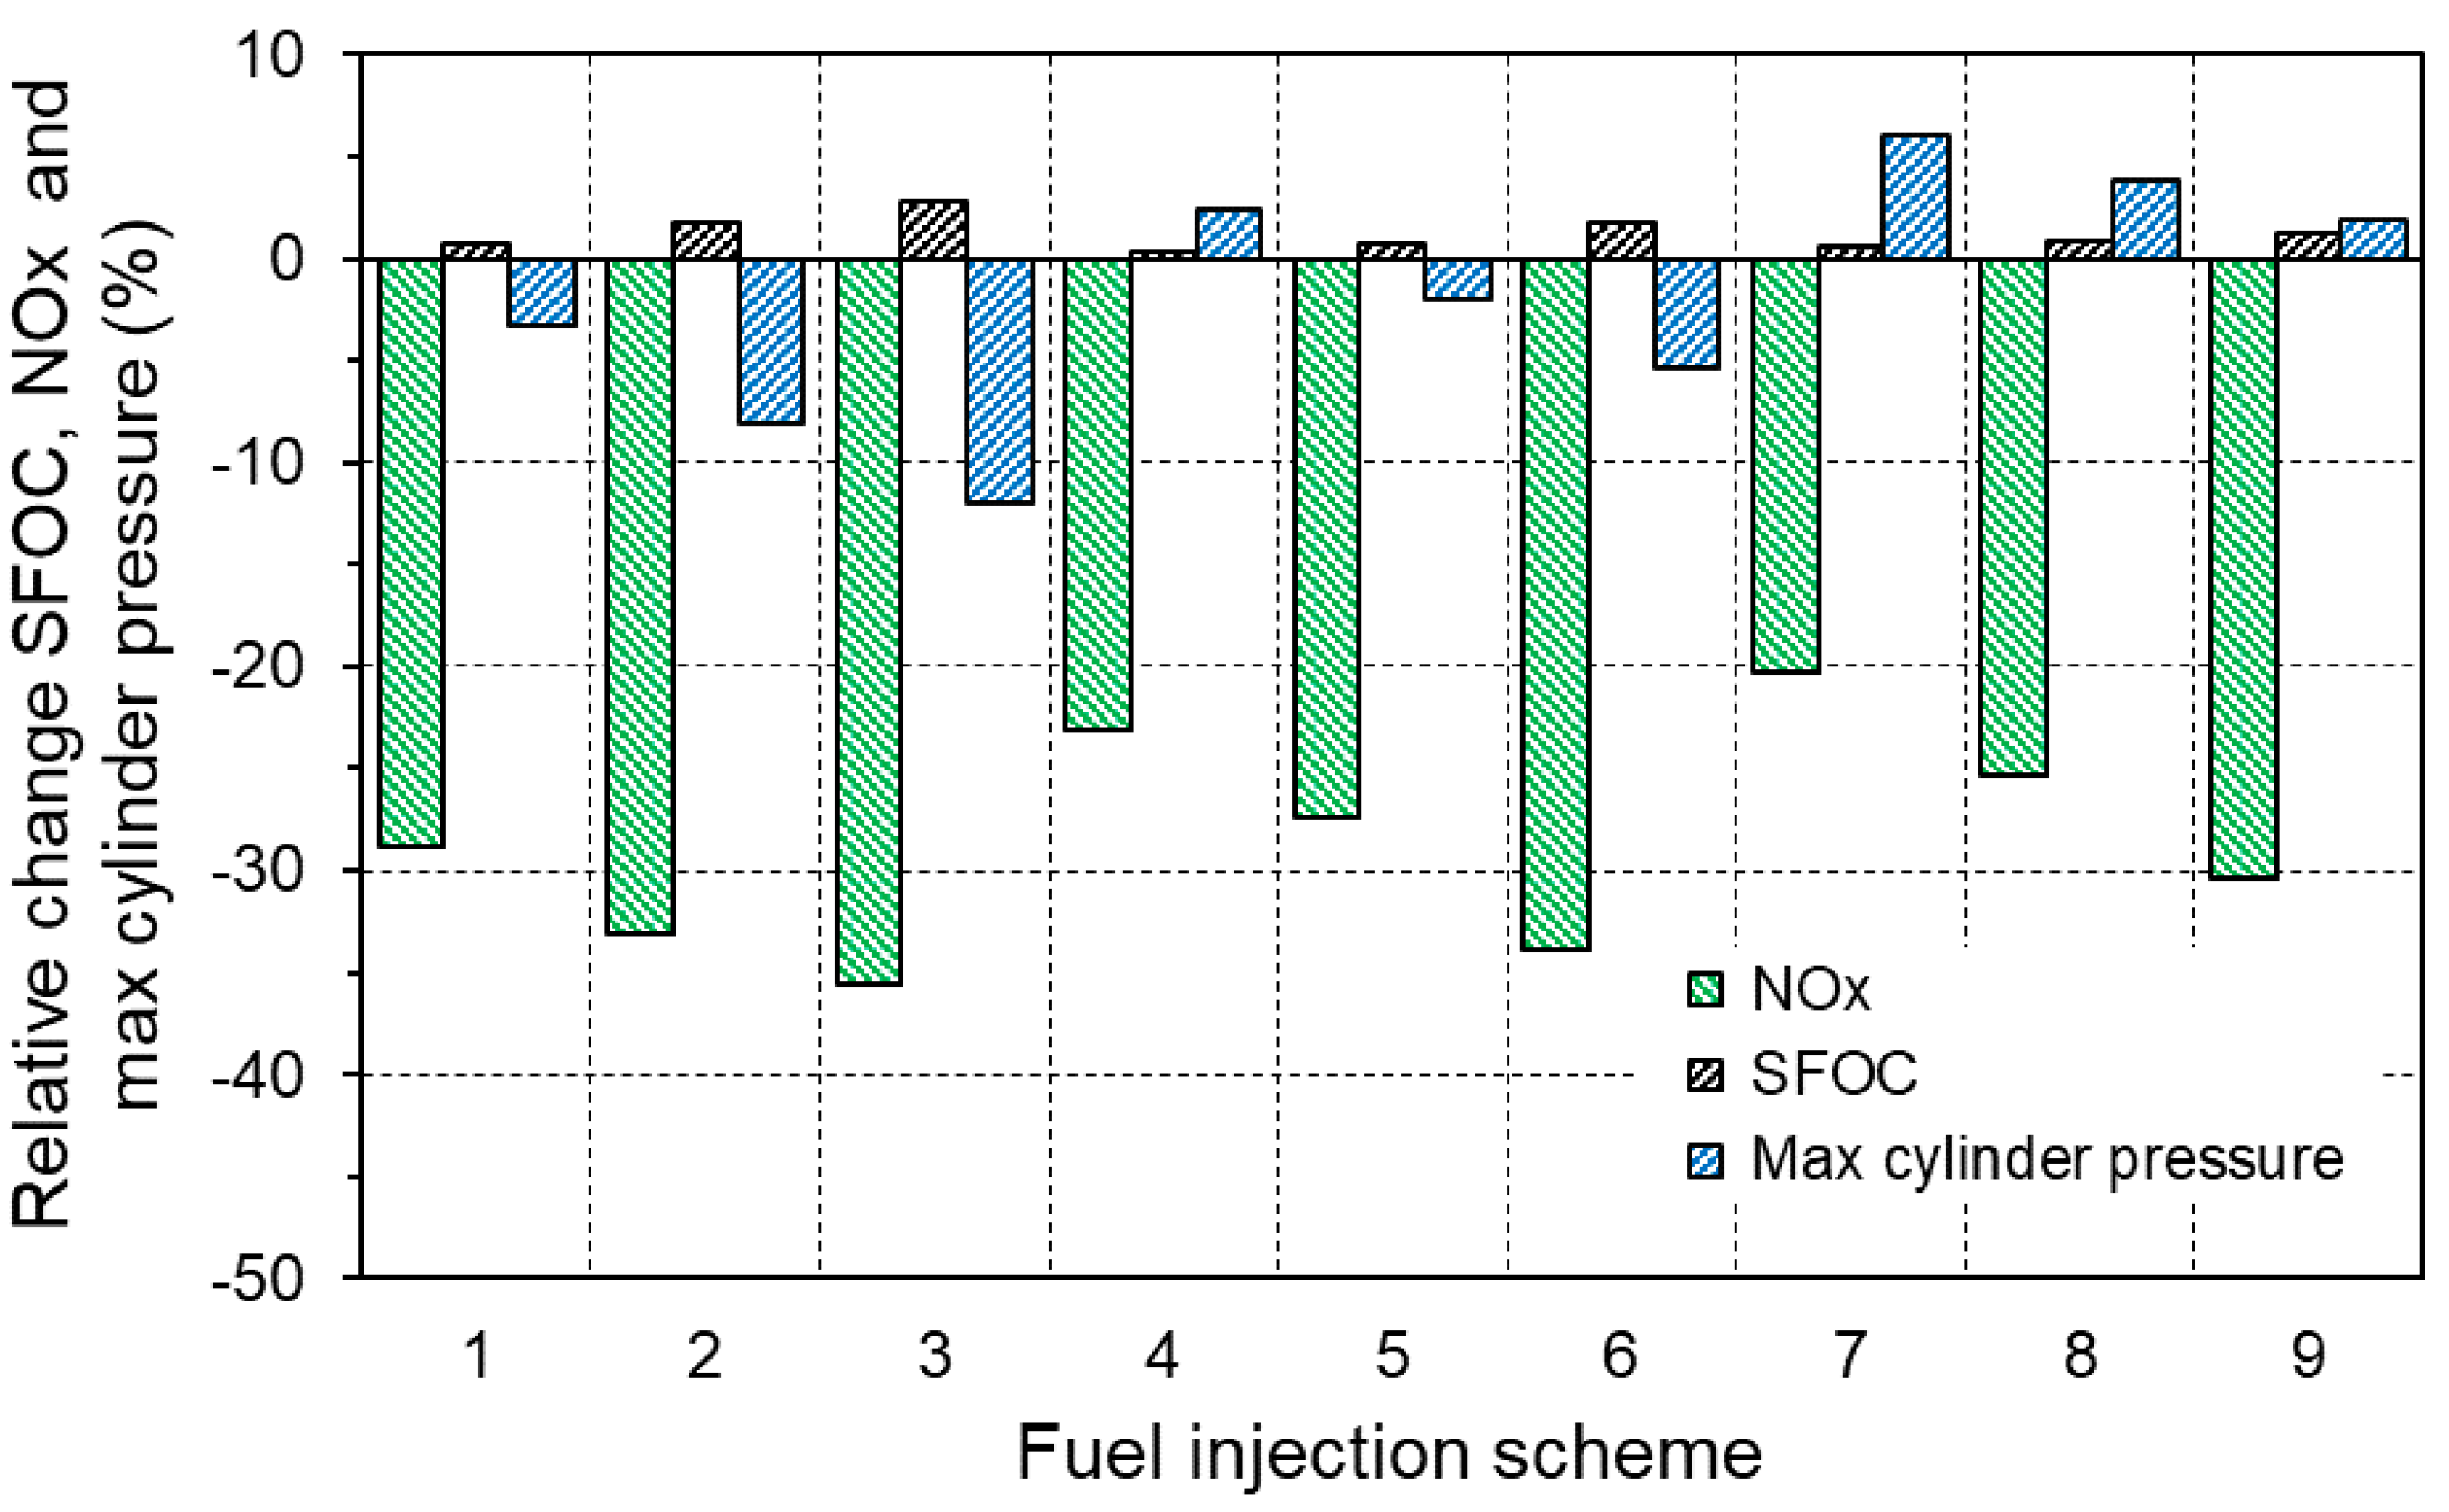
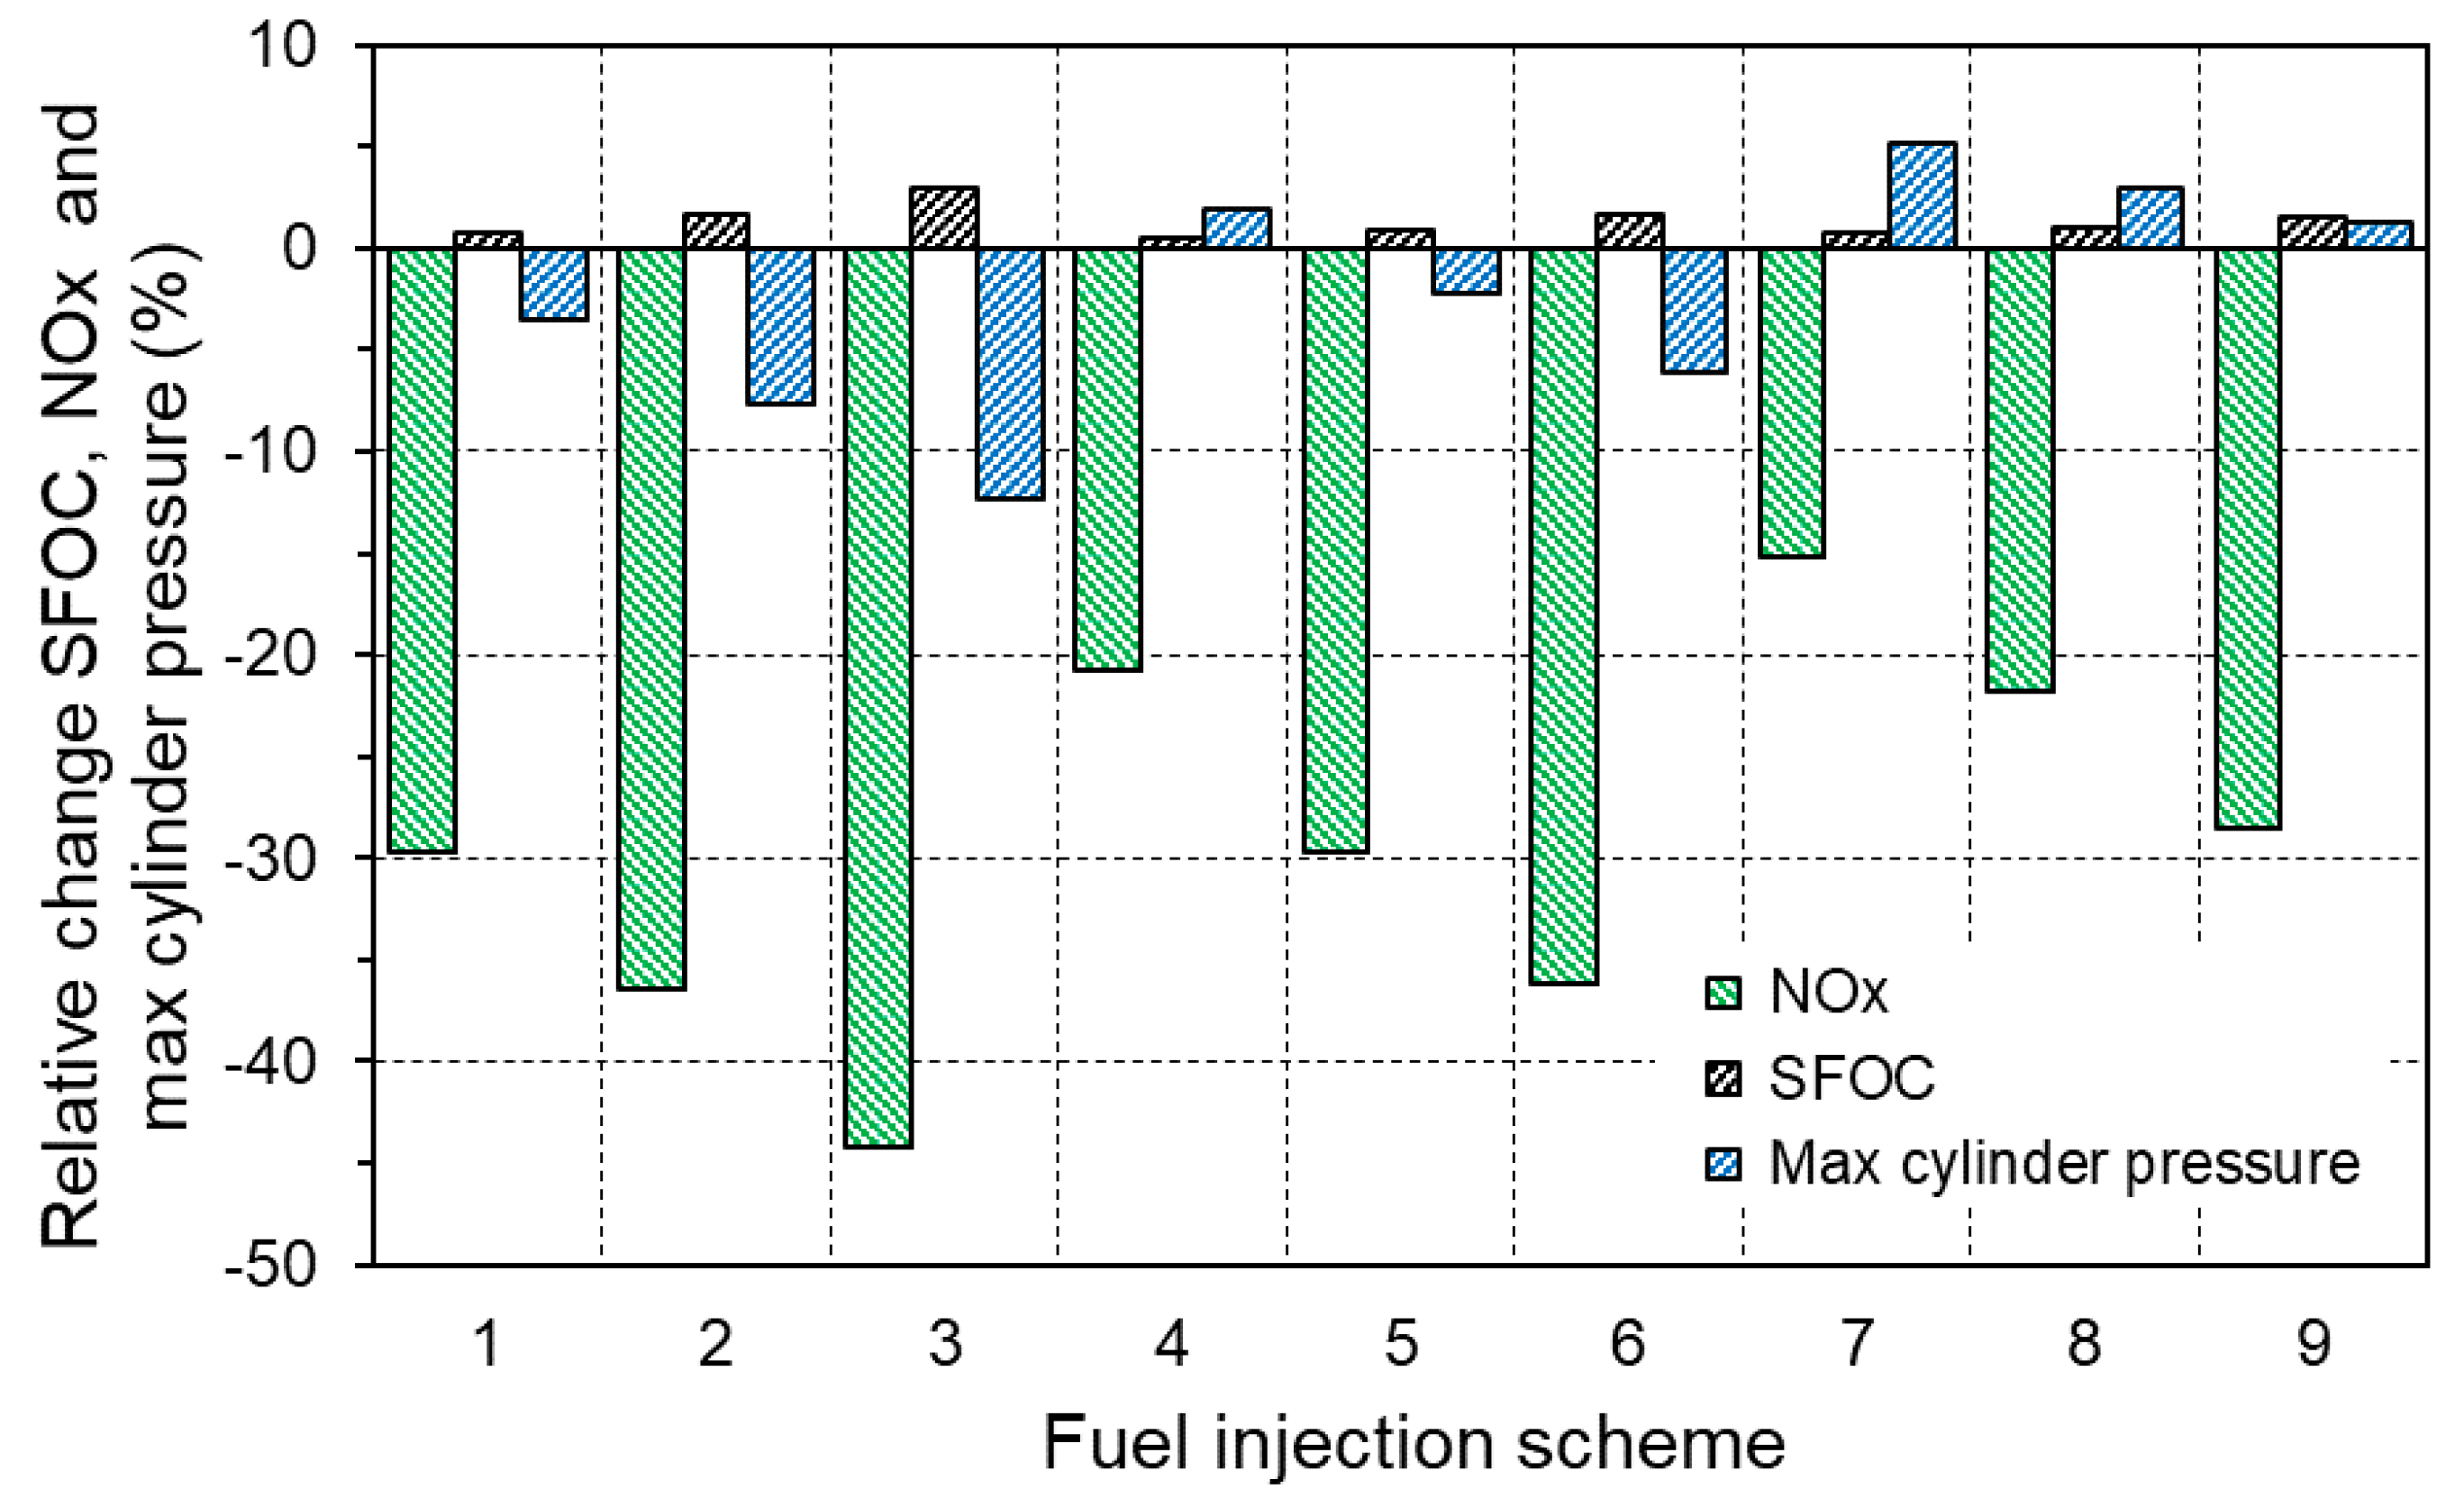
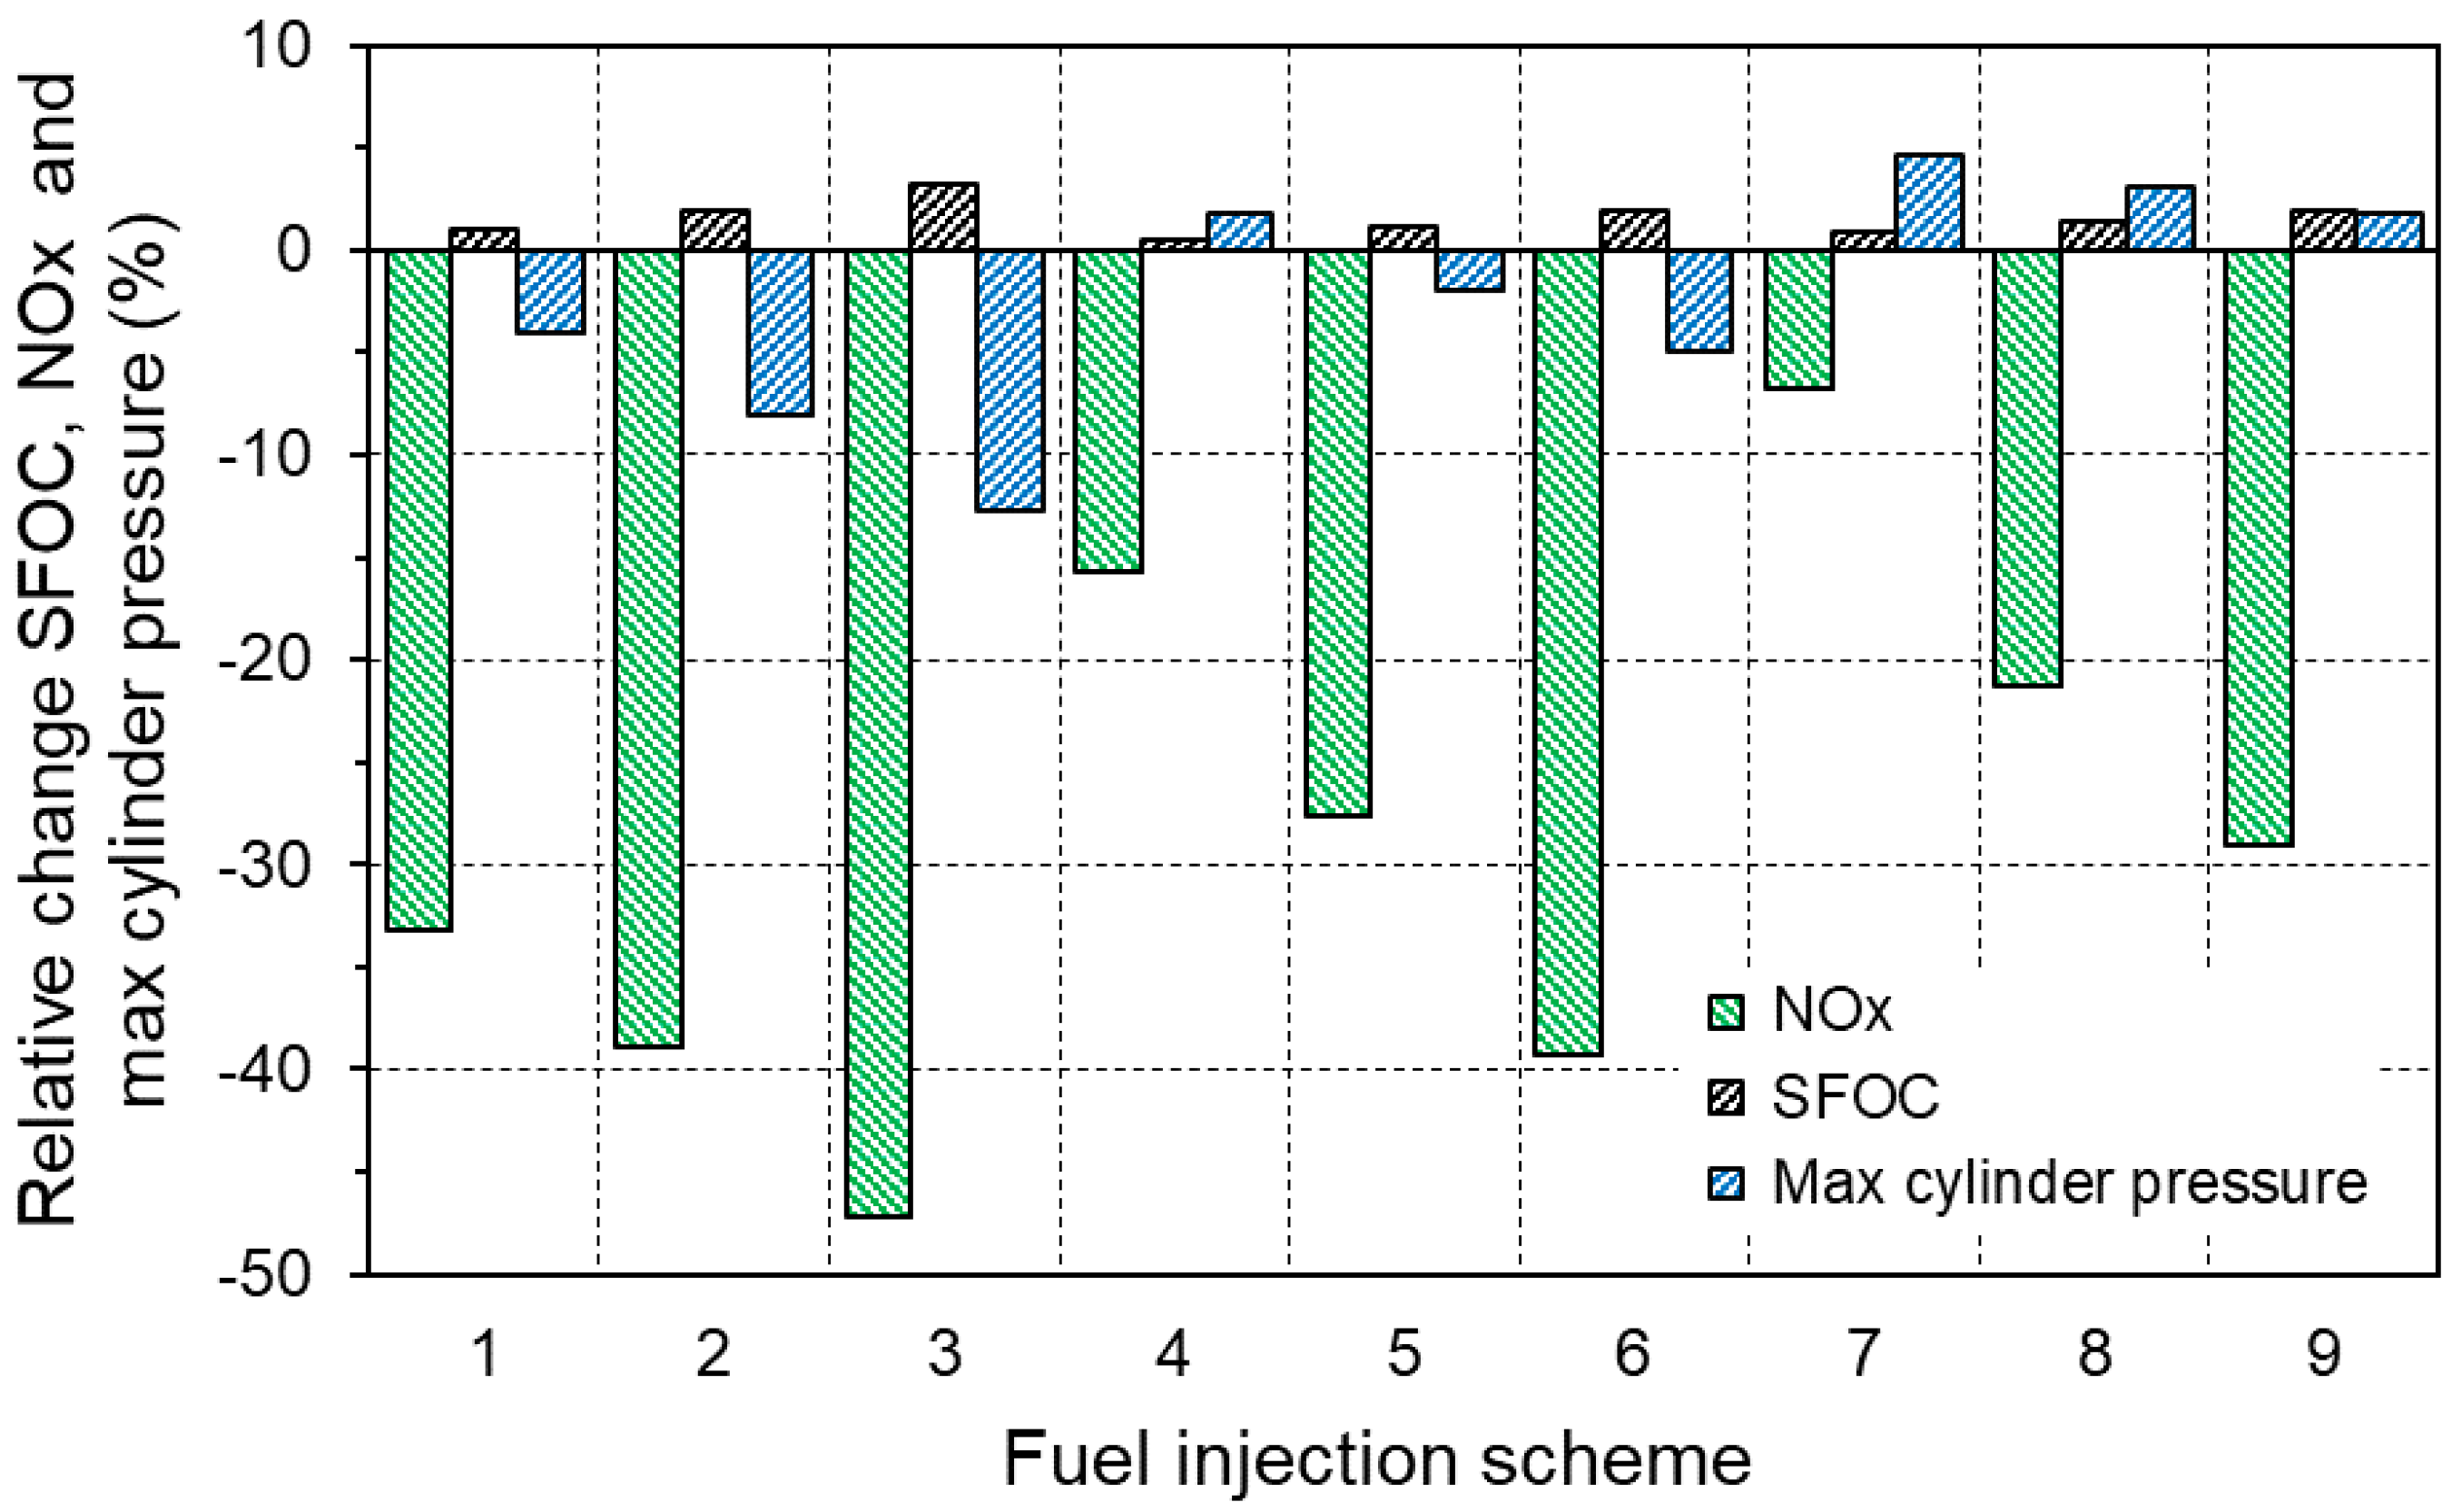
The effects of different nine split fuel injection schemes (Sch. 1 to 9) on SFOC, NO
x emission and maximum cylinder pressure at different engine loads compared to the base engine are shown in
Figure 16,
Figure 17 and
Figure 18.
7. Conclusions
Marine propulsion systems are required to be as energy efficient as possible and to meet environmental protection standards. This paper analyzes the impact of split injection on fuel consumption and NOx emissions of marine medium-speed diesel engines.
For the needs of the research, a zero-dimensional, two-zone numerical model of a diesel engine was developed. Comparison of the results obtained by the simulation with the available data of the engine manufacturer and from sea trials showed relatively small deviations of the numerical model in relation to the real engine. Sub-model based on the extended Zeldovich mechanism was applied to predict NOx emissions.
The operation of the motor that drives synchronous generator was simulated under stationary conditions for three operating points and nine injection schemes. The results obtained by numerical simulations of engine operation indicate that by using split injection it is possible to achieve a relatively large reduction in NOx emissions. However, all analyzed split injection schemes lead to increases in SFOC. Depending on the engine load, the NOx emission is reduced from approximately 29% to 33% and the increase in fuel consumption specificity does not exceed 1%. It is possible to achieve greater reductions in NOx emissions but with significant reductions in engine efficiency. The results are showing that NOx emission reduction of up to 46% is achievable. However, this increases SFOC by approximately 3%. When increasing the angle between injection the maximum pressure decreases, so the amount of pilot injection is increased to compensate the difference.
Based on the results obtained by numerical simulations of engine operation, it is to be concluded that properly applied split fuel injection is an effective method for reducing NOx emissions. If the appropriate scheme is applied it can be done without significant reduction in engine efficiency.
To continue research in this field an appropriate algorithm is to be developed since there are unlimited number of schemes that can be simulated and designed. Such an algorithm would allow faster and more accurate determination of the optimal injection scheme depending on the operating conditions of the engine.


