Article

Flexible Pile Group Interaction Factors under Arbitrary Lateral Loading in Sand

by
Miloš Marjanović
1,*,
Mirjana Vukićević
1 and
Diethard König
2
1
Faculty of Civil Engineering, University of Belgrade, Bulevar kralja Aleksandra 73, 11000 Belgrade, Serbia
2
Chair of Soil Mechanics, Foundation Engineering and Environmental Geotechnics, Ruhr-Universität Bochum, Universitätsstraße 150, 44780 Bochum, Germany
*
Author to whom correspondence should be addressed.
J. Mar. Sci. Eng. 2020, 8(10), 800; https://doi.org/10.3390/jmse8100800
Submission received: 6 August 2020 / Revised: 16 September 2020 / Accepted: 1 October 2020 / Published: 15 October 2020

Abstract

:
Marine and harbor structures, wind turbines, bridges, offshore platforms, industrial chimneys, retaining structures etc. can be subjected to significant lateral loads from various sources. Appropriate assessment of the foundations capacity of these structures is thus necessary, especially when these structures are supported by pile groups. The pile group interaction effects under lateral loading have been investigated intensively in past decades, and the most of the conducted studies have considered lateral loading that acts along one of the two orthogonal directions, parallel to the edge of pile group. However, because of the stochastic nature of its source, the horizontal loading on the pile group may have arbitrary direction. The number of studies dealing with the pile groups under arbitrary loading is very limited. The aim of this paper is to investigate the influence of the arbitrary lateral loading on the pile group response, in order to improve (extend) the current design approach for laterally loaded pile groups. Free head, flexible bored piles in sand were analyzed through the extensive numerical study. The main hypothesis of the research is that some critical pile group configurations, loading directions, and soil conditions exist, which can lead to the unsafe structural design. Critical pile positions inside the commonly used pile group configurations are identified with respect to loading directions. The influence of different soil conditions was discussed.

1. Introduction

In situations where surface soil layers have low bearing capacity, pile foundations are the common foundation solution. Pile foundations are usually designed as closely spaced, square, or rectangular pile groups. Beside the primary function to transfer the vertical loads to the stiff soil layers, pile foundations can be significantly loaded with horizontal (lateral) loads. These loads may originate from different sources, such as: wave, current and ice action, ship impacts, wind pressure, earthquake, earth pressures, traffic acceleration, braking forces, soil displacements etc. The examples of laterally loaded engineering structures are: marine and harbor structures, wind turbines, bridges, offshore platforms, industrial chimneys, retaining structures, etc. The magnitude of lateral load is usually 10–15% of vertical load (and up to 30% in offshore structures) [1]. This fact makes the problem of the laterally loaded pile groups very challenging in marine engineering applications.
When the pile group is laterally loaded, stress–strain fields of adjacent piles overlap, followed with the separation (“gapping”) between the piles and the soil at the back of the piles. The influence of leading (front) pile row on lateral response of trailing (rear) pile rows is called “shadowing” because the rear rows are in the shadow of the front pile row (Figure 1a). The problem of interaction between the piles inside the closely spaced laterally loaded pile group has been recognized by the scientific community. Ideally, the bearing capacity of the pile group shall be equal to the sum of the bearing capacities of the individual piles. However, due to the soil–structure interaction effects, load-displacement behavior of a pile inside the group is different from the behavior of the equivalent single pile (Figure 1b). In addition, the maximum pile bending moment in the pile group will be larger than for an equivalent single pile. When the pile spacing is increased, the effects of overlapping between the resisting zones become less significant.
Engineering problems that can arise due to the inappropriate assessment of the pile lateral load can be very serious. Failure in such cases can lead to significant damage or even collapse of the entire superstructure. In the cases of bridges or other structures supported by pile foundations, only a few centimeters of lateral displacements can cause the significant stress development [2]. According to Eurocode 7 provisions [3], lateral pile displacements are usually limited to 3% of pile diameter, or to max. 2 cm. Despite the fact that the current design practice for pile foundations is based on the capacity-based design, many authors [2,4,5,6,7,8,9] pointed out that the opposite, displacement-based design is more appropriate.
The pile group interaction effects under lateral loading have been investigated intensively in past decades, both numerically and experimentally. Many numerical solutions with different level of complexity have been proposed: closed form and empirical solutions [10,11,12], limit equilibrium methods [13,14], strain wedge method [15,16,17,18,19], and p-y curve method [20,21,22,23,24,25,26]. The development of fast computers led to rapid development of continuum-based methods, which allow for the full discretization of both soil and the structure, combined with the use of advanced constitutive models. Continuum-based representation of both the soil and the piles can provide a more realistic analysis, with the use of material properties with a clear physical meaning. On the contrary, continuum-based methods require more engineering effort for the numerical model preparation, as well as the higher computational hardware requirements. Continuum-based studies on the laterally loaded pile groups are mainly based on the following numerical methods: finite element method (FEM) [27,28,29,30,31], finite difference method (FDM) [2,8,32,33,34] and boundary element method (BEM) [35,36,37].
Beside numerical studies, the pile group behavior under lateral loading has been investigated using different experimental methods. Full scale tests can eliminate most of the uncertainties of the considered problem. However, due to the high costs, only a limited number of full scale pile load test results are available in the literature. As an alternative, experiments with small scale models are also reported. The conducted experimental studies of the laterally loaded pile groups are summarized in several studies (e.g., Fayyazi et al. [38], Lemnitzer et al. [39], Ashour and Ardalan [40]). The results are mainly presented as the p-multipliers for various pile groups. Recently, improvement of CT (computer tomography) and PIV (particle image velocimetry) technologies led to the experimental studies [41,42,43,44,45] of soil deformation patterns under lateral loading, with the main conclusions regarding the three-dimensional (almost conical) shape of the soil deformation zone, as well as the progressive soil failure.
The magnitude of the pile group interaction can be described by comparing the pile group response with the response of equivalent single pile for the same mean loading. One of the possible representations is the concept of pile interaction factors, which is still in use in everyday engineering practice in Germany, through the recommendations of DIN/EN codes [46,47] and working group “piles” (EAP) [48]. The pile interaction factor αi for the pile i inside the pile group is defined using the following expression:
α i = H i H S P ,
where Hi is the lateral force on pile i and HSP is the lateral force for on equivalent single pile, for the same displacement level. According to the studies by Klüber [49] and Kotthaus [50], pile interaction factors are mainly dependent on both the pile spacing and pile position inside the pile group. Interaction factors αi are calculated using the partial interaction factors αL (in the loading direction), αQA (perpendicular to loading direction, outer piles) and αQZ (perpendicular to loading direction, inner piles), using following equations:
αi = αL · αQA,
αi = αL · αQZ.
The determination of pile interaction factors is illustrated in Figure 2.
Proposed values for the partial interaction factors αL, αQA, and αQZ are given in Figure 3. Based on the recommendation of EAP [48], the pile interaction factors αi are used for the assessment of the modulus of subgrade reaction and pile bending moments for each pile inside the pile group.
Total pile group efficiency under lateral loading can be described using the following non-dimensional parameter (n—total number of piles) GW:
G W = H G n H S P = i = 1 n H i n H S P .
The pile group efficiency GW is equal to the mean value of all interaction factors αi. Lateral force distribution between the piles can also be described using the load proportions LPi:
L P i = H i H G .
So far, most of the studies on pile group interaction effects have considered lateral loading acting along one of the two orthogonal directions, parallel to the edge of pile group (namely X and Y directions, Figure 1a). However, because of the stochastic nature of its source, the horizontal loading on the pile group may have arbitrary direction. The number of studies dealing with the pile groups under arbitrary loading is very limited. Randolph [51] defined the influence of the loading direction via simple algebraic expressions for two laterally loaded flexible piles, both for elastic homogeneous and Gibson soil. Ochoa and O’Neill [52], based on the experimental results in submerged sand, have developed the interaction factors dependent on the angle between the load vector and the line that connects the pile heads. Fan and Long [53] analyzed the interaction between the piles under various loading directions and derived the modulus reduction factors to account for the interaction effects at the ultimate limit state. Su and Yan [54] formulated the multidirectional p-y model for sands that was incorporated into FEM and validated through the simulations of piles under unidirectional and multidirectional lateral loading. Mayoral et al. [55] formulated the p-y curves for piles under multidirectional loading in soft clays. The independent application of the common p-y curves in two orthogonal directions was found to be impossible. Georgiadis et al. [56] analyzed the influence of the arbitrary lateral loading on the ultimate resistance of the two rigid piles using FEM.
In their recent paper, Su and Zhou [57] presented the experimental study of 2 × 2 square and rectangular pile groups under static lateral loading in different directions. The results of this study have shown that the loading direction has great influence on the response of the pile group, mainly on the redistribution of the lateral load between the piles, and on the total group bearing capacity. The pile groups at medium pile spacing were found to be more sensitive to the variation in loading direction. In addition, some pile load distributions have increased when the loading direction was different than the usual 0/90° case, which leads to the hypothesis that some critical (worst-case) loading cases exist, which can lead to the minimum foundation capacity. Such findings of this study, as well as the fact that, up to the authors’ knowledge, arbitrary loading case was studied in a very limited number of research papers, mainly motivated further research presented in this paper.
Therefore, the main aim of this paper is to investigate the influence of arbitrary lateral loading on the pile group response, in order to improve (extend) the current design approach for laterally loaded pile groups. The main hypothesis of the research is that some critical pile group configurations, loading directions, and soil conditions exist, which can lead to unsafe design. This hypothesis is analyzed through the broad numerical study, and critical pile positions inside the commonly used pile group configurations are identified with respect to loading directions. The influence of different soil conditions, mainly sandy soil, is discussed.

2. Research Methodology and Scope

The methodology used in this study follows the concept of “numerical experiment”, where a numerical simulation is used to mimic the real experiment. Compared to the real experiments, numerical simulations allow for the large number of analyses to be done faster and cheaper. Full scale experiments are expensive and therefore not feasible solution for the larger studies. First, the numerical model of laterally loaded pile group was generated and validated, and then the broad parametric study was conducted in order to assess the influence of various parameters on the pile group interaction.
Interaction inside the pile group is influenced by various factors, such as: pile spacing and arrangement inside the pile group, total number of piles, pile stiffness, length and diameter, pile installation method, soil conditions, loading level, pile head conditions, pile-soil slippage and separation, and presence of axial loading. A significant number of research papers [58,59,60,61,62,63,64,65] points out and ranks the most important factors that influence this problem. “Apriori” sensitivity analysis of different problem parameters, through the broad literature survey, was done in order to select the most important parameters for further analysis.
Regarding the scope of the present study, bored piles are analyzed, as more expected in common engineering practice. These piles can also sustain larger vertical loading, so the horizontal loading is expected to be high as well. According to Van Impe [66], “bored and CFA piles account for 50% of the world pile market, while the remaining is mainly covered by driven (42%) and screw piles”. Regarding the pile length, long, flexible piles are considered, as the more common case [51]. Pile spacing and configuration are identified as the governing factors for the pile group interaction by different authors [2,67], while pile length and diameter are identified as the less important [32,51].
In this study, only free head piles were considered. According to Mokwa and Duncan [68], boundary conditions at the pile head are somewhere in between the fixed and free head pile. The same authors pointed out that the pure fixed head conditions are hard to achieve in reality, even when the pile cap is very stiff. Despite the different deflection response of fixed and free head piles, pile load redistribution can be considered independent on pile head conditions, especially within the working load conditions. This statement is supported by various authors [21,32,69].

3. Numerical Model

The FEM is today considered as the most reliable and widely used numerical method for engineering analysis of complex foundation systems. Regarding the laterally loaded pile group, FEM allows for detailed modeling of all important model components: pile geometry, soil continuity and nonlinear behavior, and especially the pile–soil interaction through the slippage and gapping. According to Dodds and Martin [23], “modeling lateral behavior in any way other than with three-dimensional models using nonlinear soil models and interface elements must constitute a compromise.” Eurocode 7 [3] strongly suggests the use of soil–structure interaction in the numerical analysis, especially in the case of complex foundations, such as laterally loaded pile foundations or piled-raft foundations.
Within this study, the response of the pile groups under arbitrary static lateral loading was computed using FEM code PLAXIS 3D (Anniversary Edition) [70]. PLAXIS 3D is a world-wide used code for the stress–strain, stability, and groundwater flow analysis in geotechnical engineering, that supports an easy graphical input of the models with complex geometry, as well as the illustrative presentation of the results. It also features various constitutive models for soil and rock, with different levels of complexity.

3.1. Model Components

Numerical prediction of the laterally loaded pile group behavior is a challenging task that requires realistic modeling of the deformation behavior of the soil, pile, and the contact between the soil and the pile. As follows, model details for different model components are briefly presented.

3.1.1. Pile

Two pile modeling techniques are mainly used in PLAXIS 3D: full 3D (solid) pile model, and recently implemented embedded beam model. The comparison of two modeling techniques was studied by Marjanović et al. [71] on an idealized example of 2 × 2 pile group in loose and dense sand, with conclusions that, in the case of the weaker pile–soil contact, pile group behavior cannot be resembled using the embedded beam model in PLAXIS 3D. Therefore, the full 3D pile model was adopted for this study. Pile volumes are modeled using 10-node tetrahedral elements (nodes in the corners and the middles of the edges), with three translational degrees of freedom (ux, uy, uz) per node. This type of element provides a second-order (quadratic) interpolation of nodal displacement components.
Pile behavior is assumed as linear elastic. Bowles [72] pointed out the possibility of concrete cracking as the problem in realistic modeling of the laterally loaded pile. Comodromos et al. [73] analyzed the influence of concrete cracking on the response of laterally loaded piles, and concluded that, at the working load levels, fully elastic assumption of the pile behavior will not lead to the significant change in the interaction effects and stress redistribution. Therefore, the pile constitutive behavior is defined using the linear elastic model, based on the generalized Hooke’s law.
The extraction of the pile group results from the 3D FEM simulation is not a simple task. This is mainly related to the determination of pile section forces (shear forces and bending moments). Theoretically, this task is done by integration of component stresses over the pile cross section. Despite the fact that the calculation of the section forces from volume elements is implemented in PLAXIS 3D, this step cannot be done automatically, but requires that the user performs the whole procedure manually for each pile volume. In order to simplify the calculation of pile section forces and to automatize the post-processing as well, the “dummy” beams are added into the numerical model. Such a modeling concept is common when the laterally loaded piles are modeled using the 3D elements [74,75]. The elastic beam finite elements with very small bending stiffness (106 times smaller than the pile bending stiffness EI) are inserted along the pile axes. Because the “dummy” beam stiffness is very small, system stiffness matrix remains almost unchanged. “Dummy” beams are enforced to deform together with the pile axis, and the pile section forces are then easily computed by simple multiplication of “dummy” beam section forces with 106.

3.1.2. Pile–Soil Interface

In reality, the contact between the piles and the surrounding soil is not fully rigid, but weaker, so there are small relative displacements along the pile–soil interface. In general, the pile–soil interface strength depends on the type of pile material (wood, steel, concrete, etc.) and pile installation effects (bored, driven, jacked-in). Because this study considers only the bored piles, installation effects and loading history were neglected.
The pile–soil contact was modeled using thin 2D interface elements. These elements are different from the regular finite elements: they have pairs of nodes instead of single nodes, with the distance between the two nodes of a node pair equal to zero. Each node has three translational degrees of freedom (ux, uy, uz). As the result, these elements allow for differential displacements between the node pairs to simulate both slipping and gapping on the pile–soil contact [70].
The constitutive behavior of the pile–soil interface is defined by the elastic-perfectly plastic Mohr–Coulomb (MC) model with a non-associated flow rule and zero tension cut-off criterion (when tension develops, a gap between the pile and the surrounding soil is generated). The shear strength parameters of the pile–soil interface (cinter, φinter) are related to the strength reduction factor Rinter, which reduces the shear strength parameters (c′ and φ′) of the MC model, according to the following expressions:
cinter = Rinter c′,
tan φinter = Rinter tan φ′.
In general, there is lack of experimental data for real pile–soil interface parameters. Suitable values of Rinter are recommended in the literature [70] for different soil types, and the usual value is around 0.5.

3.1.3. Soil

Soil constitutive behavior is modeled using the Hardening Soil (HS) model (Schanz and Vermeer [76]). As in the case of the MC model, the limit stress states of the HS model are defined using the parameters for the MC failure criterion (cohesion c′, angle of internal friction φ′, and dilation angle ψ). However, the soil stiffness is described more accurately, using advanced stiffness parameters: the triaxial loading stiffness E50, the triaxial unloading stiffness Eur, and the oedometer loading stiffness Eoed. These stiffnesses are not constants, but are dependent on the loading level (principal stress state). The magnitude of the stress level dependency is governed using the parameter m. The values of these three stiffness parameters are not mutually independent—usually the following relationships are used:
E50 = Eoed,
Eur = 3E50.
Opposite to the MC model, the yield surface of the HS model is not fixed in the principal stress space, but it can expand due to plastic straining. Two types of hardening are included in the model: shear hardening (due to primary deviatoric loading) and compression hardening (due to oedometer and isotropic loading).
Due to the fact that the pile group response under lateral loading is mainly governed by the properties of the top soil layer (near-surface soil conditions) [2], the soil was modeled as homogeneous and isotropic. Because the static loading is assumed, drained soil conditions are assumed in the model. The soil volumes are also modeled using 10-node tetrahedral elements.

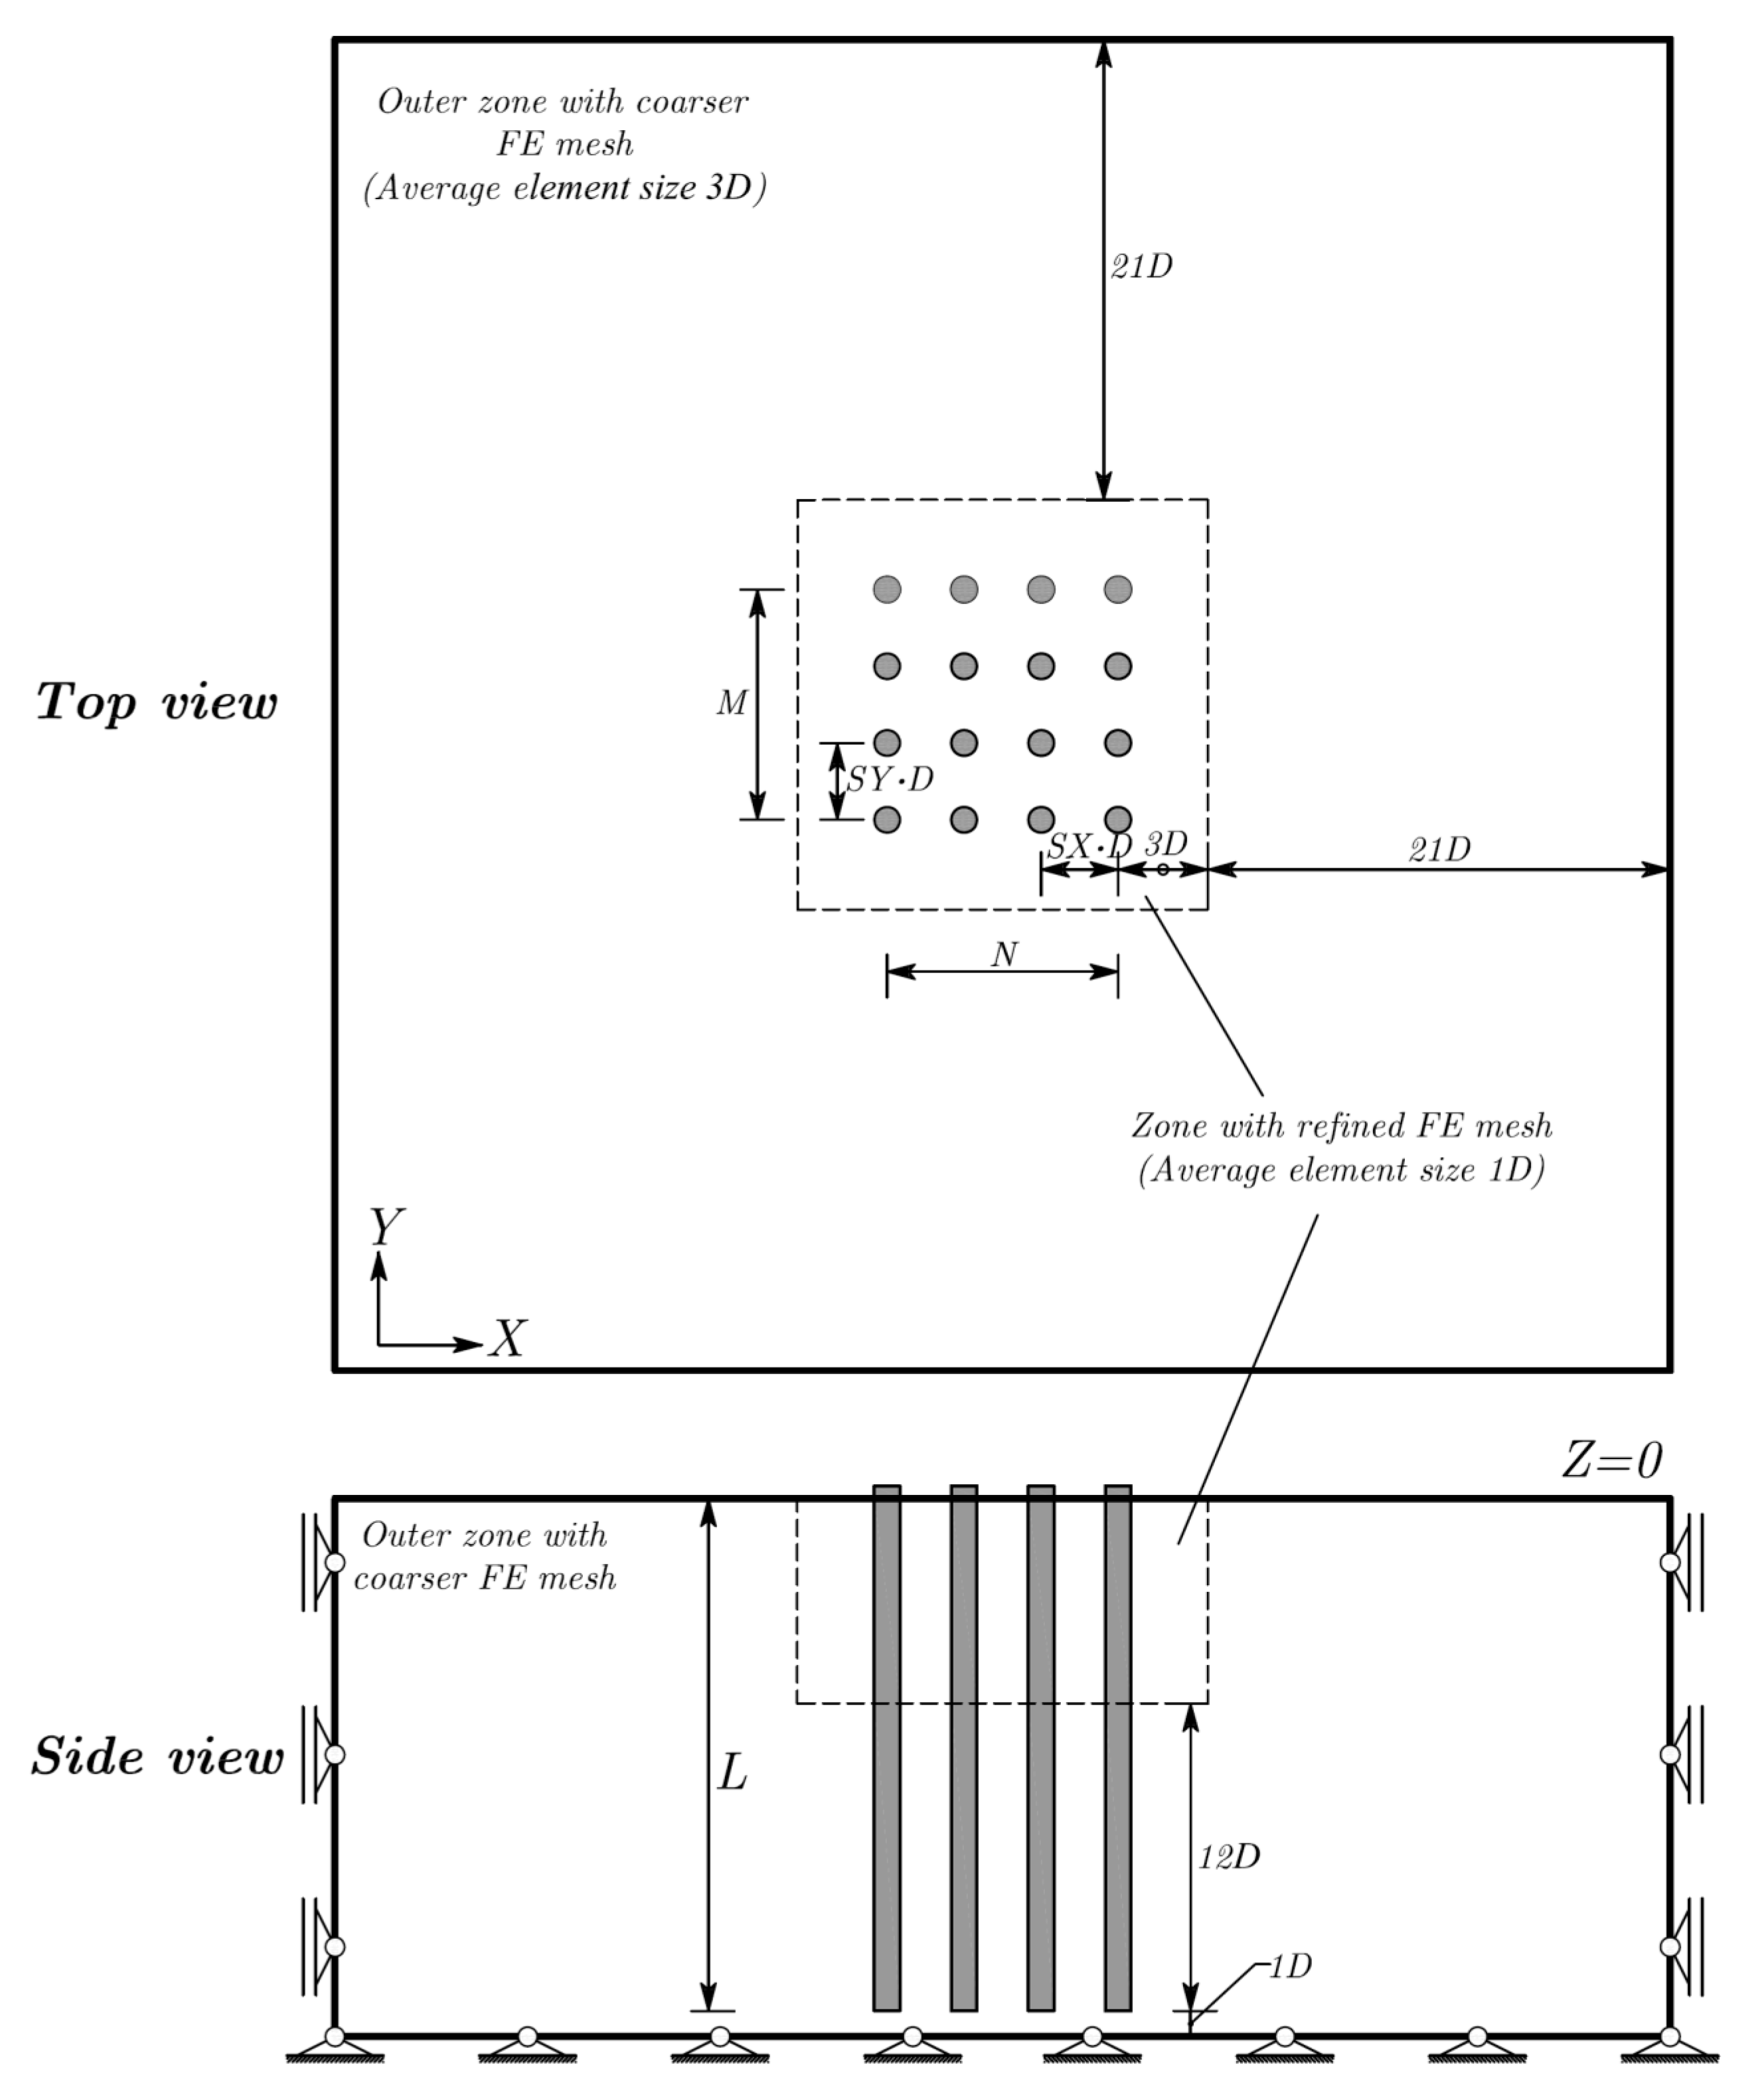
3.2. Model Geometry, Discretization, and Boundary Conditions

Model side domain limits were chosen far enough from the center of the pile group, in order to avoid the boundary effects on the model response. Sensitivity analyses were done to determine the optimum size of the model. Because the model geometry will change for different pile group configurations, it was adopted that the distance between the model domain sides and the edges of the pile group remain the same. The spacing between the pile bottom (tip) and the bottom model boundary was chosen to be relatively small, because the lateral pile group response is mainly governed by the top soil layer in the case of flexible piles, as well as with the active pile length.
PLAXIS 3D does not allow for very precise control of the model discretization. However, it allows the user to define “refinement zones” inside the model volume, where the mesh discretization can be finer. Around the pile group, the rectangular prismatic refinement zone was adopted. Trial analyses were executed on models with different discretization setups, in order to optimize the accuracy and computational cost. The most of the model geometry parameters have been designed as the multiplicators of pile diameter D, so the whole geometry can be parameterized as the function of pile diameter D.
The displacements on the model boundaries were fully fixed in all directions at the bottom of the model, while the displacements on the side planes were limited to vertical direction. The final model geometry and the mesh refinement zone are presented in Figure 4 and Figure 5.

3.3. Calculation Stages

Numerical simulations within the study were done as the staged (phase) analysis, and consisted of the following stages:
  • Initial (K0) stage—initial stress field in the soil is established. Horizontal stress state is calculated using the Jaky’s formula [77]: K0 = 1 − sin φ′.
  • Construction stage—soil volume is replaced with 3D finite elements that represent the piles (wished-in-place concept). Interface elements are also activated in this stage
  • Prescribed displacements (4 increments)—the prescribed displacements up to 0.1D are applied at the pile top, in desired loading direction. The prescribed displacements simulate the displacement control test under static loading conditions.

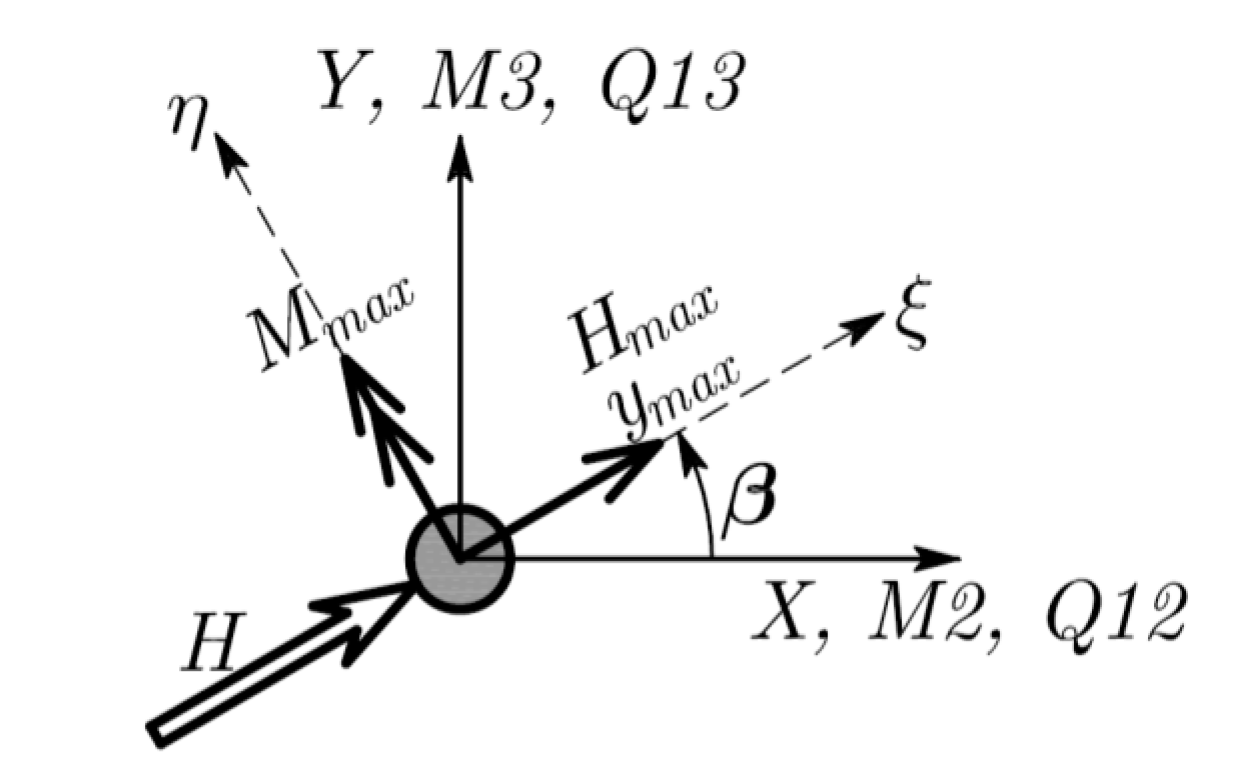
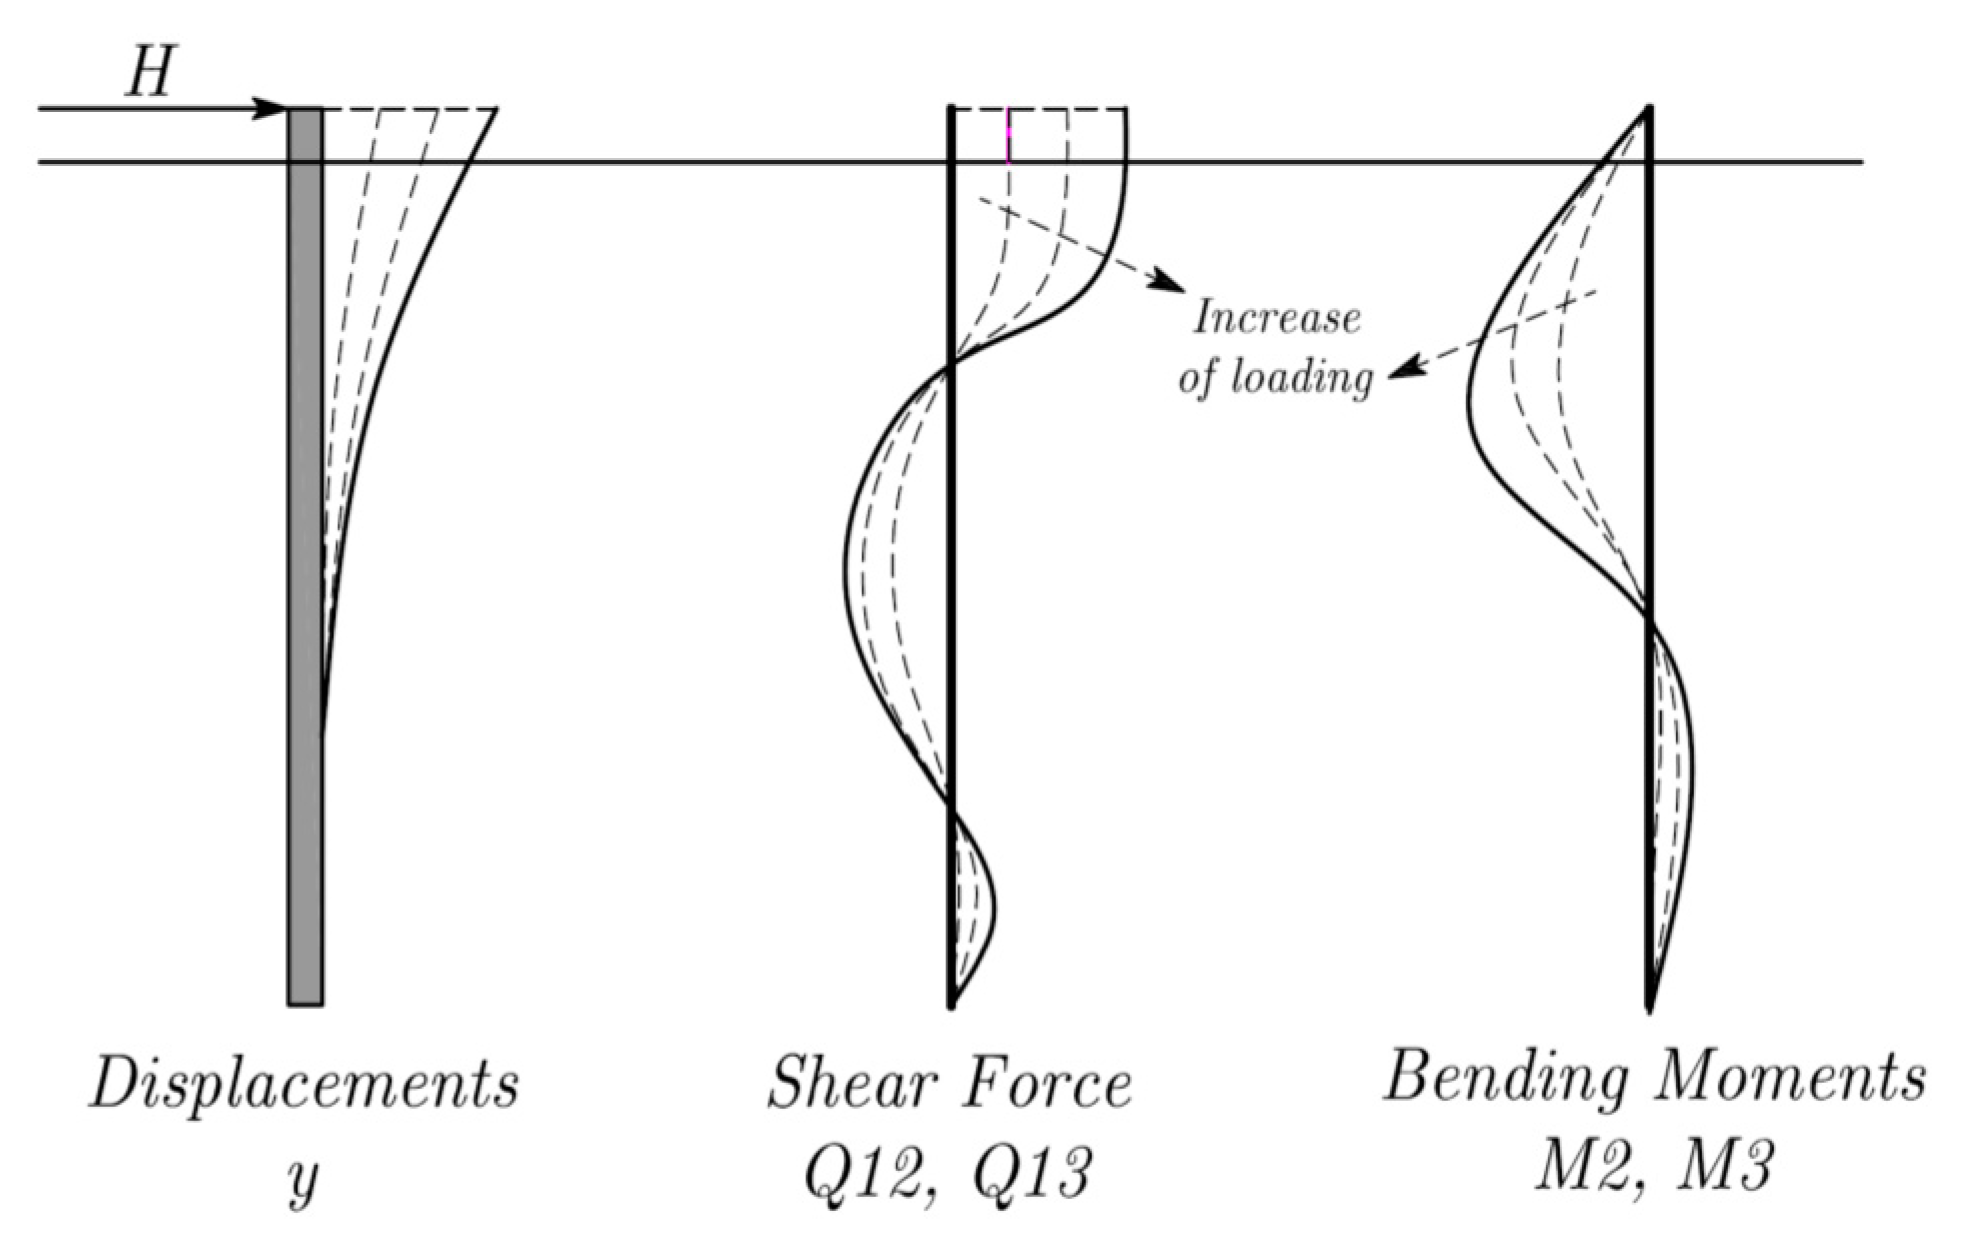
3.4. Post-Processing of the Results

Beside the complexity of described numerical model and numerical simulation itself, data management after calculations was an equally challenging task, because all raw data had to be reordered to interpret the pile group results. PLAXIS 3D allows the extraction of all results in Euclidean XY space. However, for the arbitrary loading case, the resultant maximum displacement, shear forces, and bending moments must be recalculated, using simple vector algebra (Figure 6):
The most important step in the post-processing of the pile group results is the precise evaluation of the pile shear forces. However, the shear forces extracted directly from the “dummy” beams in PLAXIS 3D are slightly unrealistic, which is the issue recognized and analyzed by Tedesco [74], who concluded that such behavior could be associated with the PLAXIS 3D beam elements, that compute the shear forces using the bending moment derivative along the pile length. In order to properly evaluate the pile shear forces, first, the pile bending moments were approximated using the B-spline approximations, with 10 interior knots and 5th order spline interpolation. Other fitting techniques, such as polynomials and cubic splines, were also considered. Then, the shear forces profile was computed by differentiation of the fitted pile bending moments line along the pile, and then the pile shear force at the ground level was used for the calculation of the interaction factors. The shape of the characteristic diagrams obtained in the numerical analysis is given in Figure 7.

3.5. Automatization of the Calculation Procedures

Parametric study done within this research includes multiple FEM simulations, with different combinations of input data. In such case, one of the critical “bottlenecks” are the repetitive pre-/post-processing activities, and this part of the analysis is usually prone to errors. Despite the fact that the PLAXIS 3D is very user friendly, the preparation and (especially) the post-processing of multiple numerical models of the pile group is time-consuming. Scripting is a popular approach for the automatization of numerical analysis, and such features are nowadays implemented in PLAXIS 3D and many other FEM packages, mainly using the Python programming language. PLAXIS 3D input and output modules can be fully controlled through the user defined Python scripts, instead the GUI (graphical user interface).
In order to perform the most of the calculation procedure in this study automatically, the broad development and implementation of original Python scripts was done throughout every numerical analysis step. In this manner, the PLAXIS 3D becomes a “problem calculator”, while the simulation parameters and data analysis are handled by the separate computer programs. Such approach cannot increase the single simulation calculation time, neither prevent the conceptual errors in the numerical model, but data handling in all simulation stages becomes substantially faster.
Beside scripting, PLAXIS 3D allows for the use of multiple computers through the local area network. Due to availability of multiple licenses of PLAXIS 3D, the set of computer programs for multiple simulation running on different computers was developed. The parametric study was then done on (in average) 4–7 computers at the same time, depending on the current availability. The program was tested on up to 30 computers, and the only limit is the number of available PLAXIS 3D licenses. It is important to note that single computer calculates only one simulation at a time, but as soon the simulation is finished, the next simulation is started automatically. This process lasts as long as the simulation queue contains at least one simulation, and the total computation time is decreased with the number of used computers, assuming the same simulation complexity and the same computer hardware. This original solution has provided the optimum use of relatively expensive resources (code licenses and computer power).

3.6. Model Validation

Numerical model was validated based on the back-calculation of the small-scale pile group test from the literature. Trial and error analysis was used to match the experimental results with the model response.

3.6.1. Experimental Results

A well-documented centrifuge test at 50 g, done by Kotthaus [50], was used for model validation. Both single pile and the three pile rows at 3D spacing were back-calculated. The experimental setup was prepared by the sand rainfall method, to achieve the desired relative sand density. Dry sand was used for the centrifuge test. Experimental piles were fabricated as hollow aluminum tubes. The outside pile diameter was 30 mm, and the pipe wall thickness was 2 mm. Model dimensions were chosen to mimic the real structure, made of solid concrete piles. The model and prototype dimensions are given in Table 1. Prototype model dimensions are determined according to scaling laws [78].
Free head pile top conditions were provided using the screws that allowed for the rotation of the pile head, but enforced the same pile top displacements (displacements control test). In order to increase the pile soil friction inside the dense sand, soil particles were glued onto the pile shaft. The point of load application was above the ground level, because of the experimental setup.

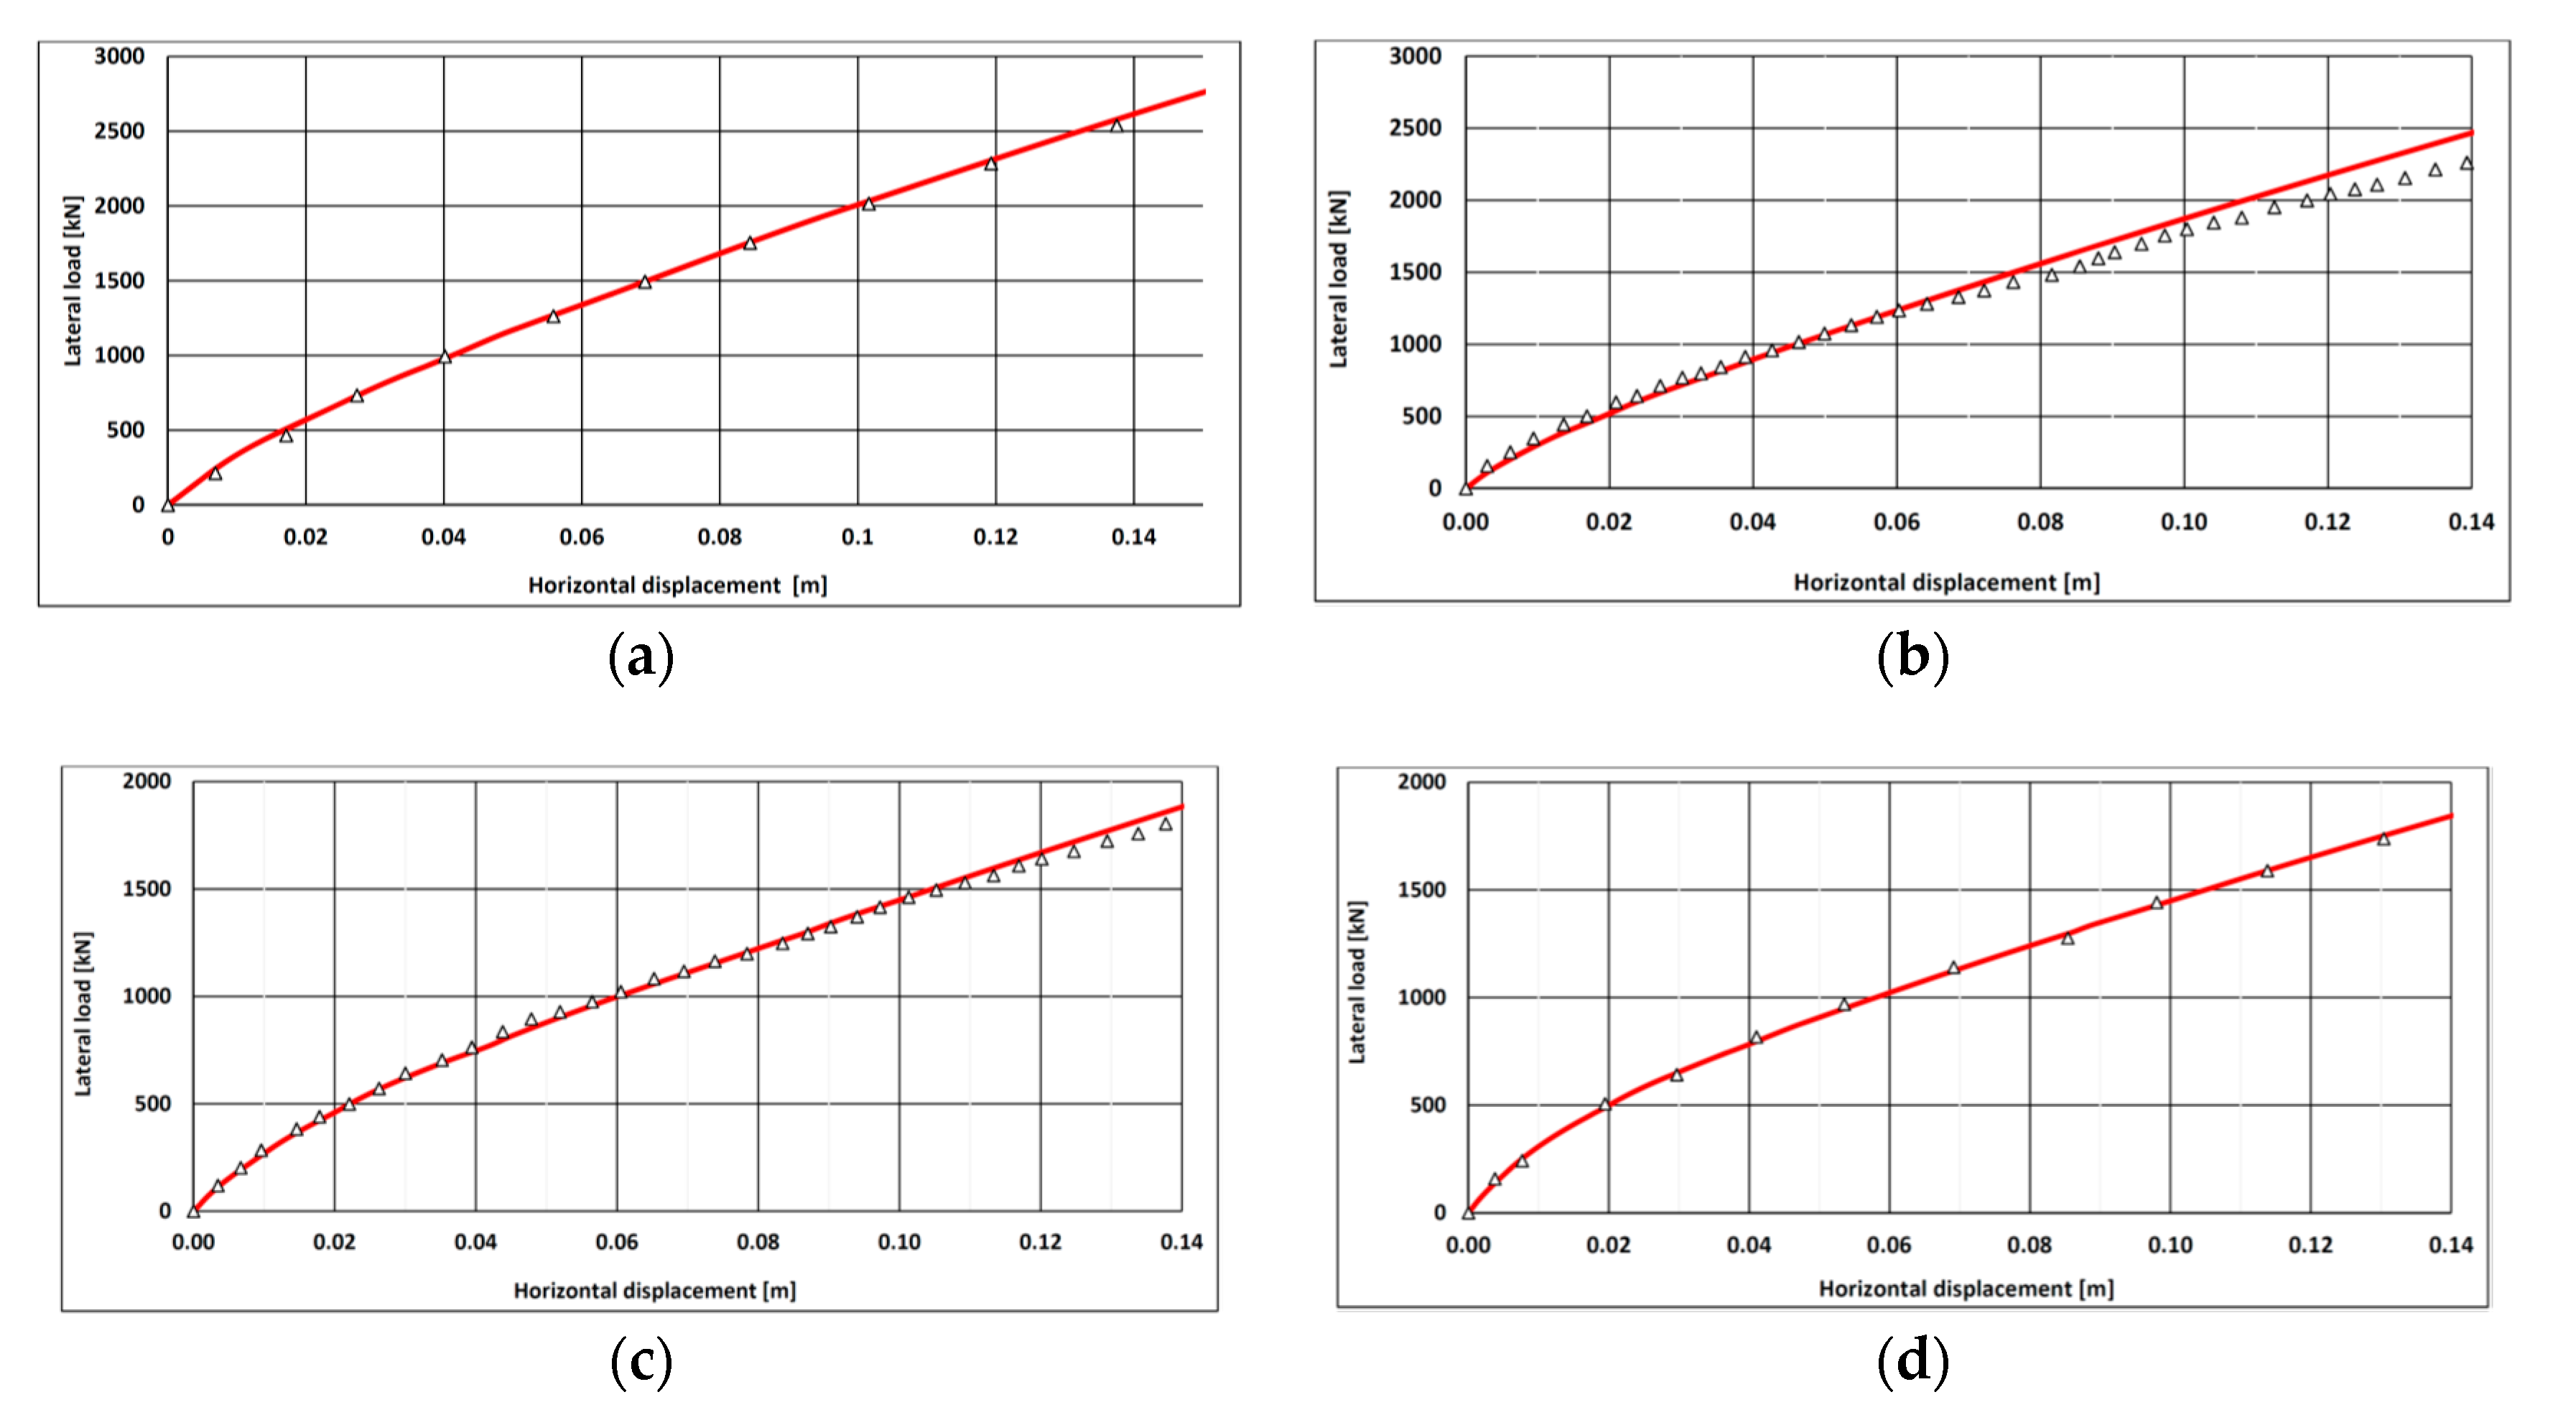
3.6.2. Validation Results
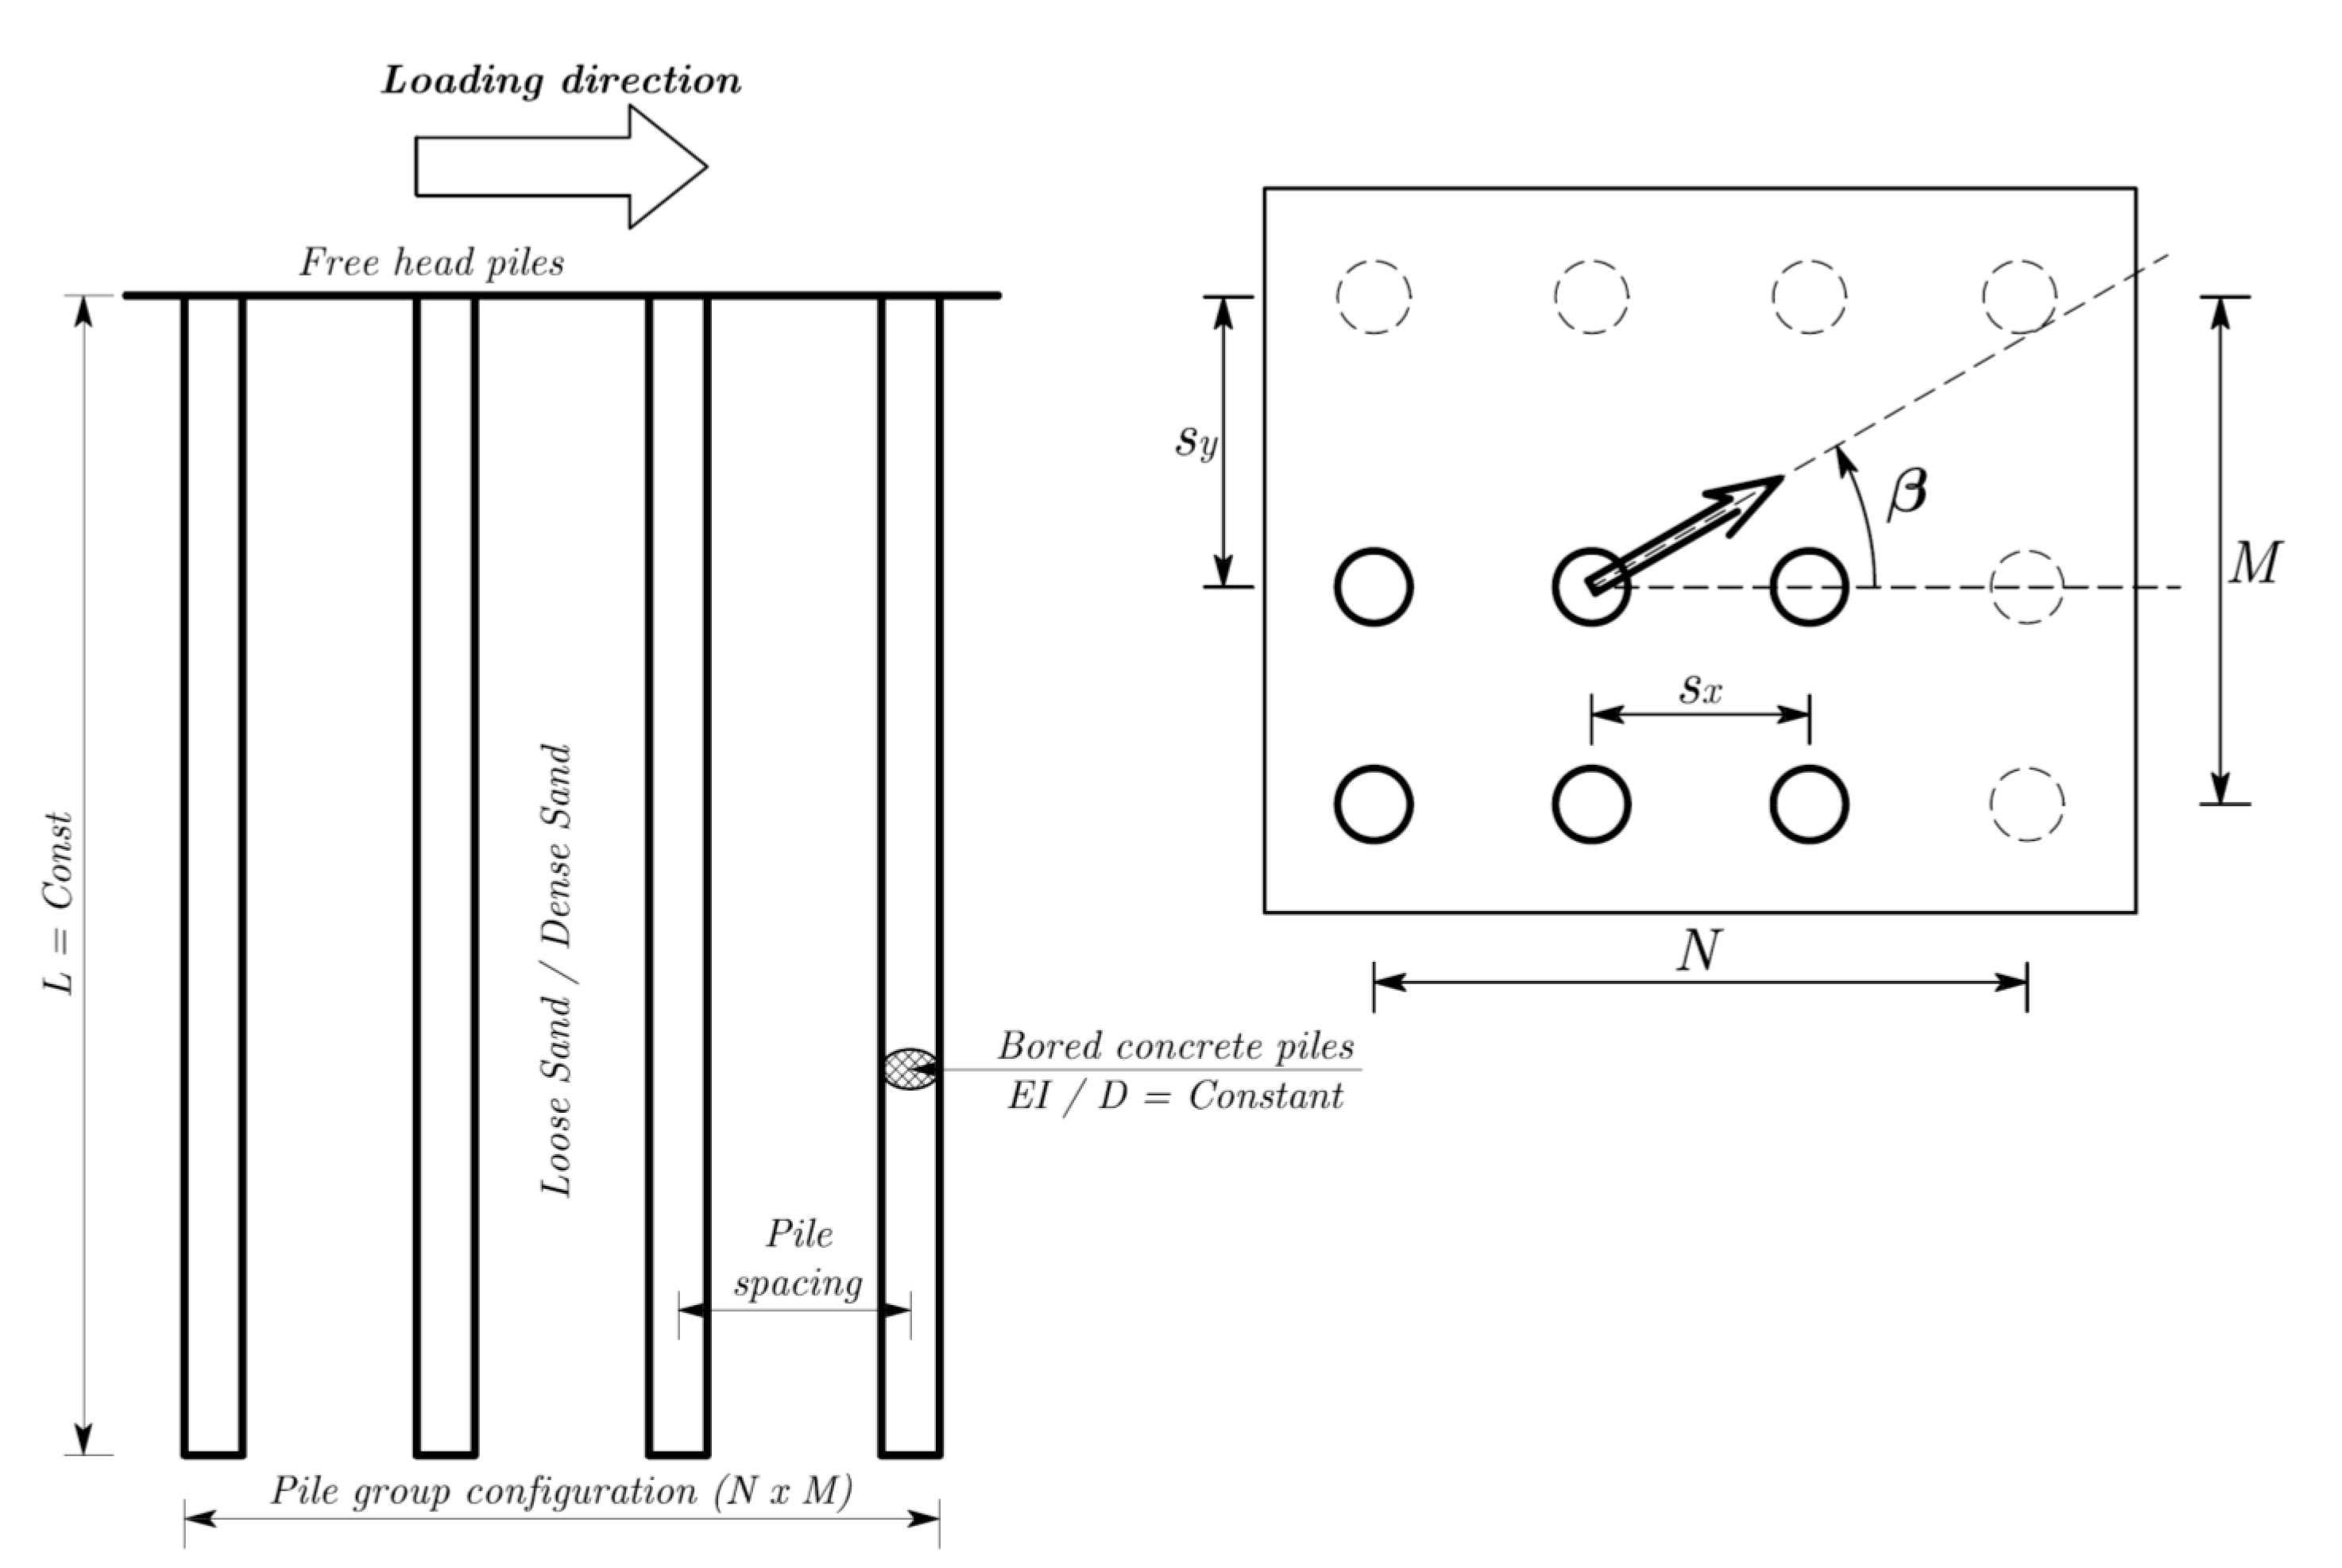
For the accurate numerical simulation of geotechnical problem, the first step is selection and proper calibration of the soil constitutive model. The available experimental soil testing results for the dense sand (CU = 2.08, D10 = 0.12 mm, D50 = 0.23 mm, emax = 0.914, emin = 0.583) used in the centrifuge experiment by Kotthaus [50] were used for the calibration of the hardening soil model in PLAXIS 3D. The effective angle of internal friction for the dense sand was initially assumed as ϕ’ = 41°, and oedometer modulus as Eoed = 28 MPa, based on the results of the sand laboratory tests given in [50,79]. However, slight trial and error adjustments of initially assumed values had to be done in order to better match the measured pile group response. This alteration is justified by the fact that the stress states around the laterally loaded are not fully matched by conventional laboratory tests. Finally adopted constitutive model parameters are given in Table 2.
The measured vs. computed load-displacement response is given in Figure 8. Despite slight discrepancies, presented results of the model validation show a satisfactory match with the experimental results and the overall performance of the numerical model is considered to be acceptably accurate for the parametric study of the considered problem.

4. Parametric Study

The scope of this study was designed with the aim to assess the most anticipated practical situations with the reasonable complexity. The following major problem parameters, according to “apriori” sensitivity analysis, were selected for this study: soil type, pile group configuration, and pile spacing, as well as the loading direction, as the main parameter under investigation (Figure 9). The selection of study parameters is briefly elaborated in the following subsections.
In all simulations, a pile Young’s modulus of 30.5 GPa was adopted to simulate the most common concrete class used in everyday engineering practice. Pile length L and diameter were kept constant: D = 1.0 m, and L = 20.0 m. These values provide flexible pile behavior (L/D = 20). The pile head was extended above the ground level (L2 = 0.25 m), to avoid numerical instabilities caused by the high concentrated forces at the place of observation the horizontal displacement.
Two “synthetic” soil types, loose and dense dry sand, were simulated. Brown et al. [26] noted that the shadowing effect was more pronounced in sand compared with stiff clay. Constitutive model parameters for dense sand was adopted to be close to the parameters of the validated numerical model, and loose sand parameters were chosen as significantly different, in order to compare the soil stiffening effects on the pile group response. The parameters of the investigated soils are summarized in Table 3.
Pile groups with different pile arrangements were analyzed, as summarized in Table 4. The numerical model symmetry could not be applied. In order to effectively analyze and discuss the interaction effects, as well as to limit the calculation time, it was decided to limit the total number of piles inside the pile group up to 3 × 3 piles.
From the practical standpoint, it is a more common case that the configuration of the pile group (NxM) varies (square, rectangular, circular, etc.), while the spacing between the piles is kept on the lowest possible level. If the pile spacing is higher than 5D, the costs of the pile cap will increase to a very high level [60]. In this study, pile spacing between 2D–5D were investigated.

5. Results and Discussion

The results of the parametric study are presented in the form of pile interaction factors and maximum bending moments for each pile inside the pile group, with respect to loading direction. The representative plots are given to illustrate the main results trends. All results are presented for the displacement levels 0.03D (y/D = 0.03) and 0.10D (y/D = 0.10).
All original computer codes, PLAXIS 3D AE numerical models, raw simulation results and results databases are available from the first author via e-mail upon request.

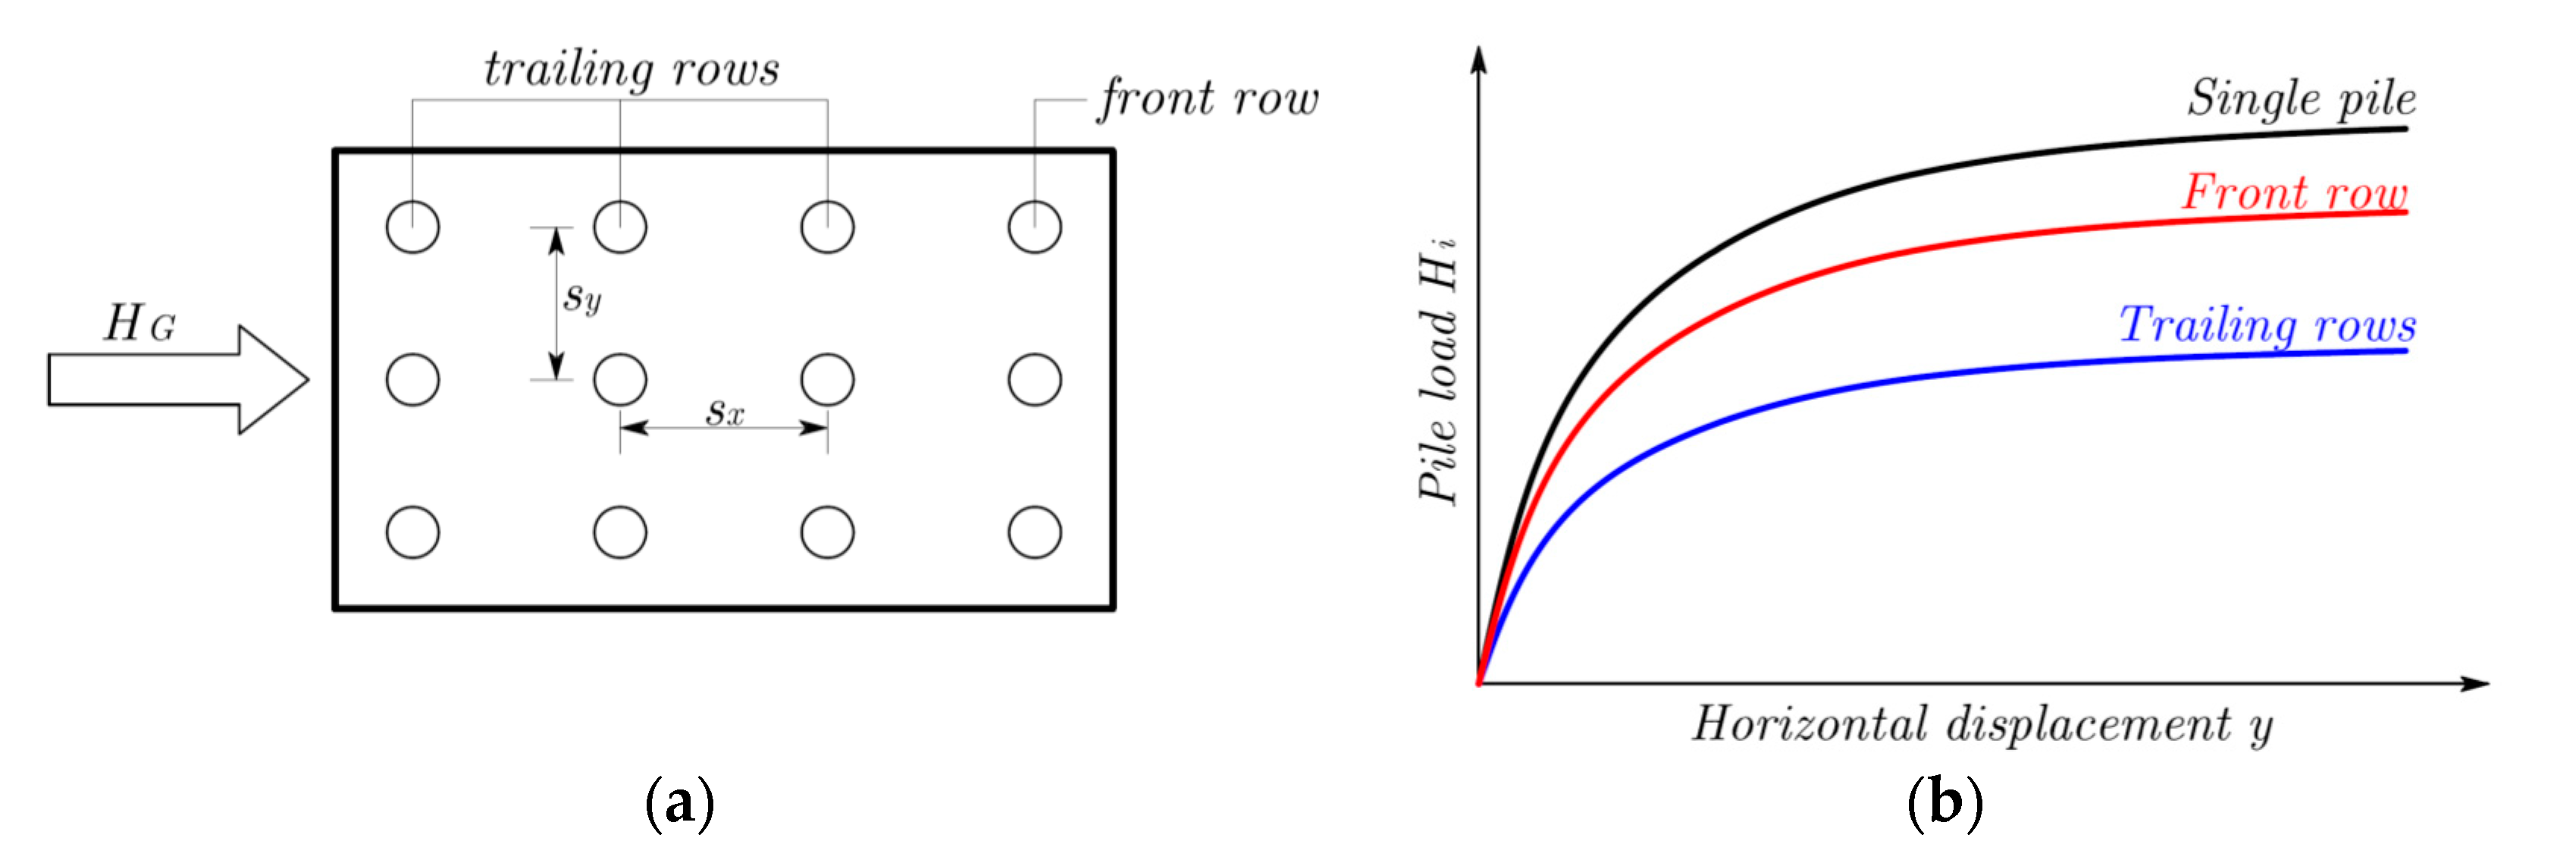
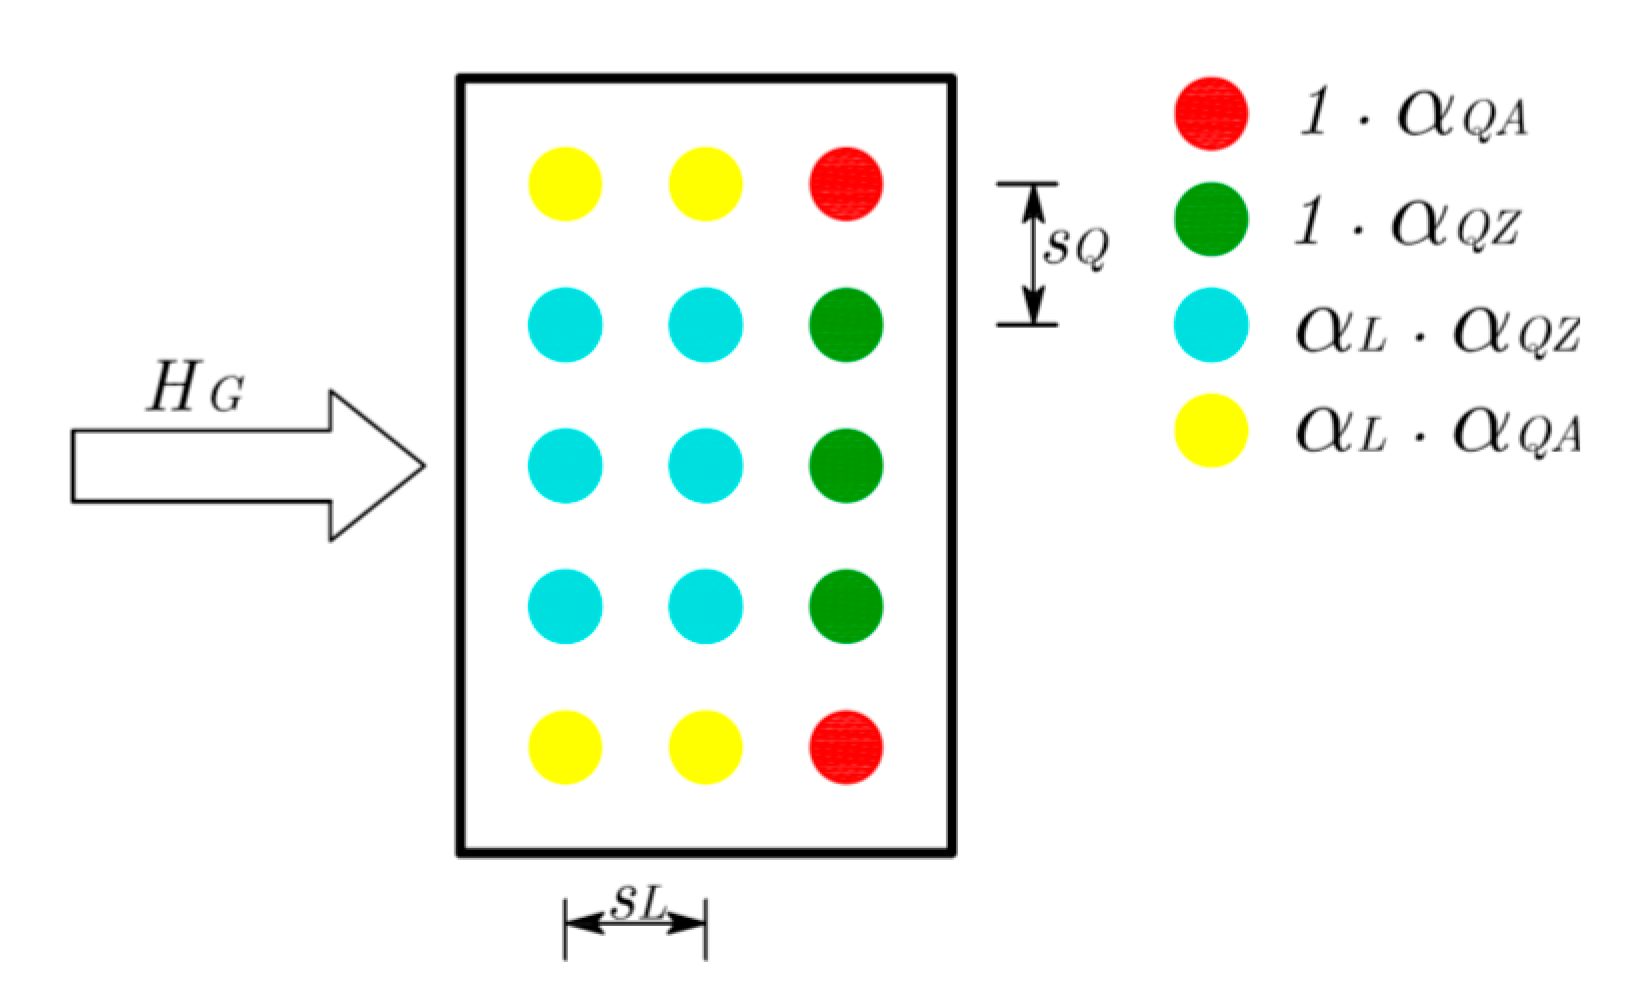
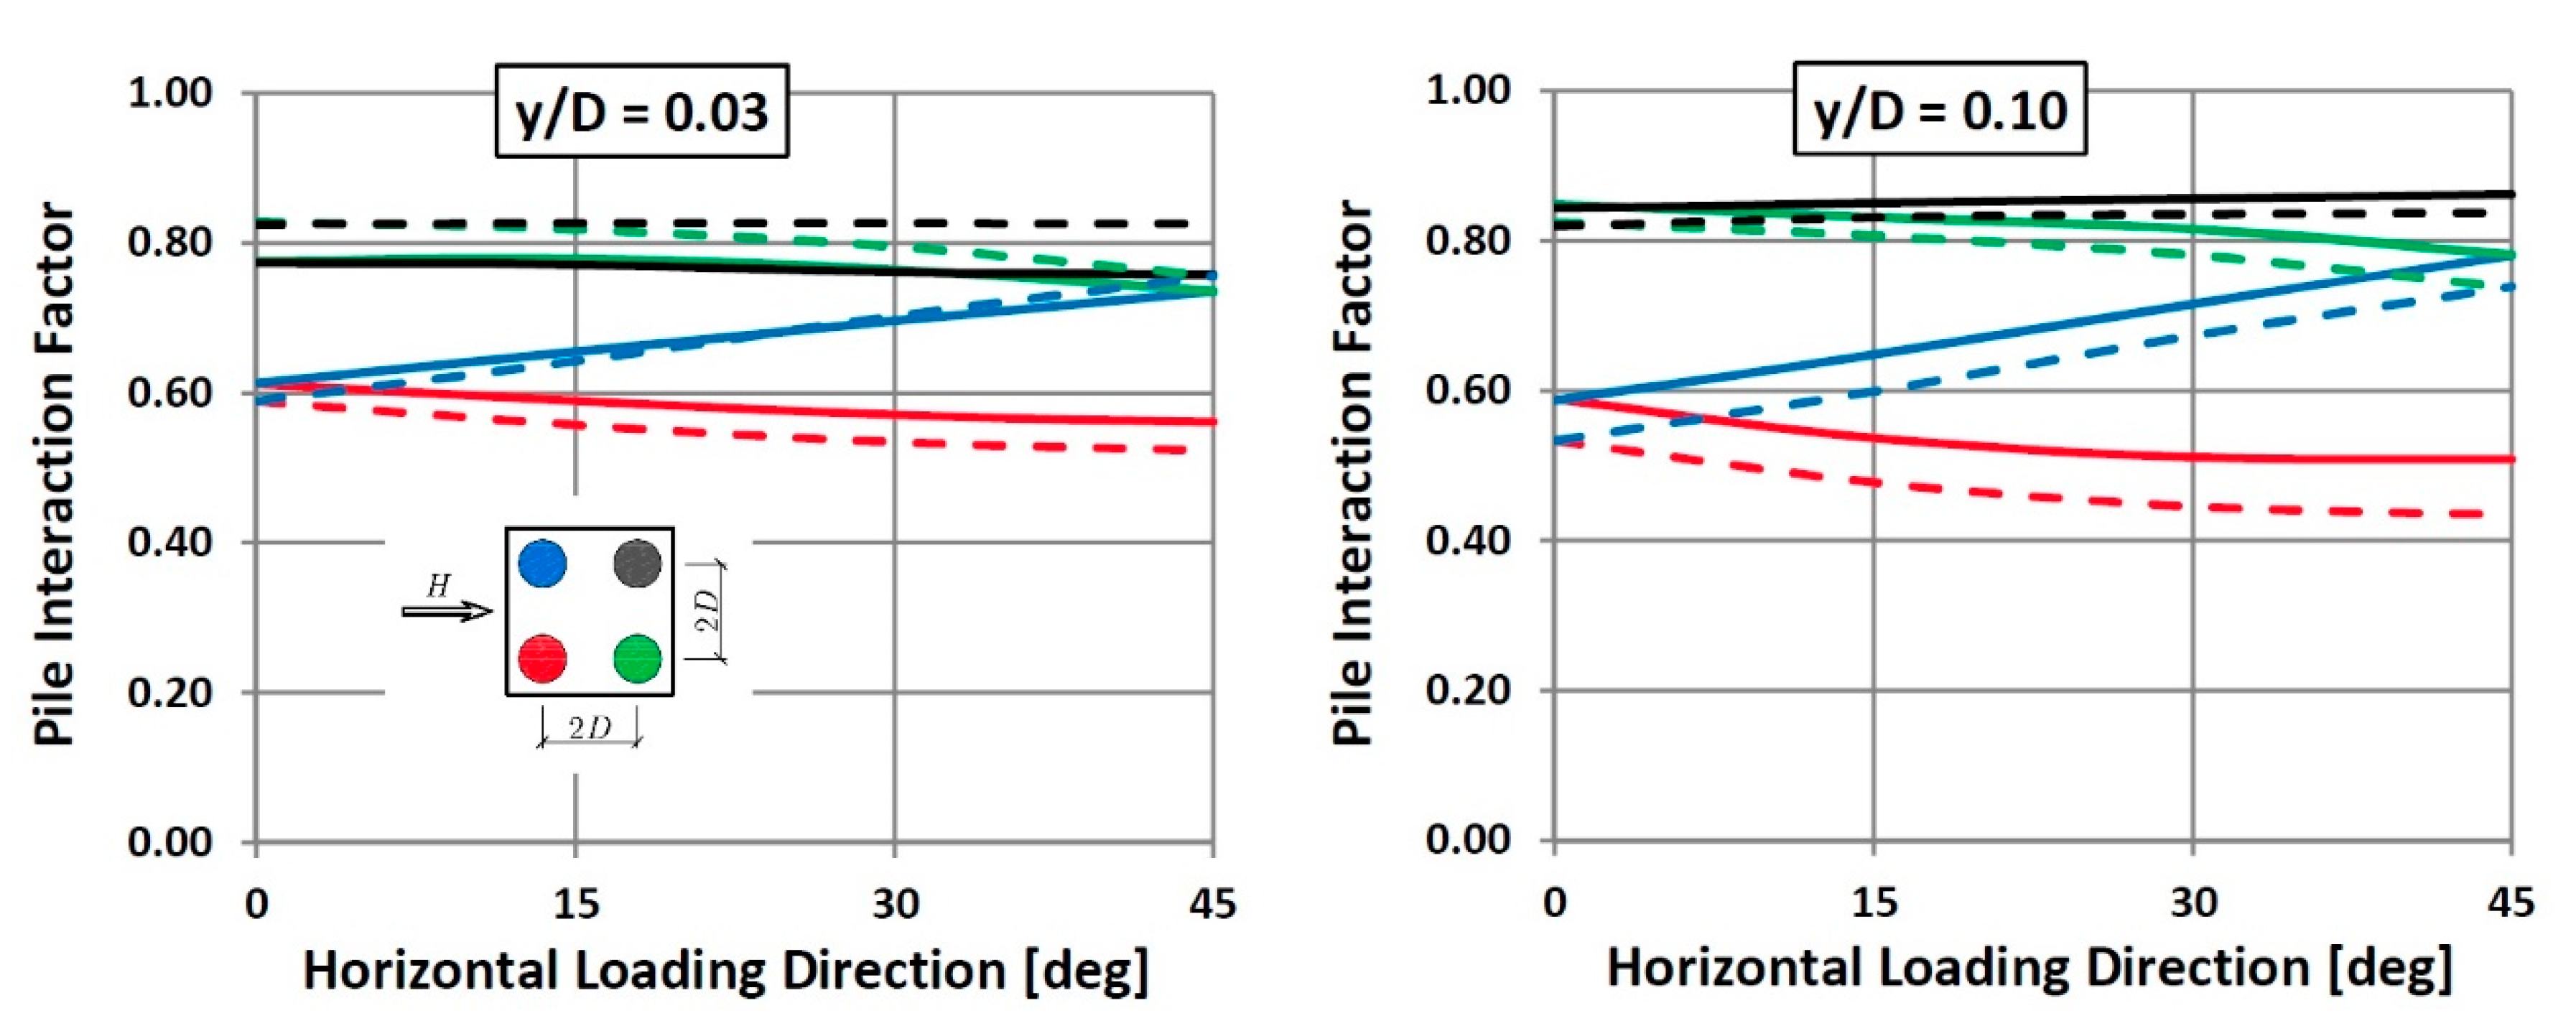
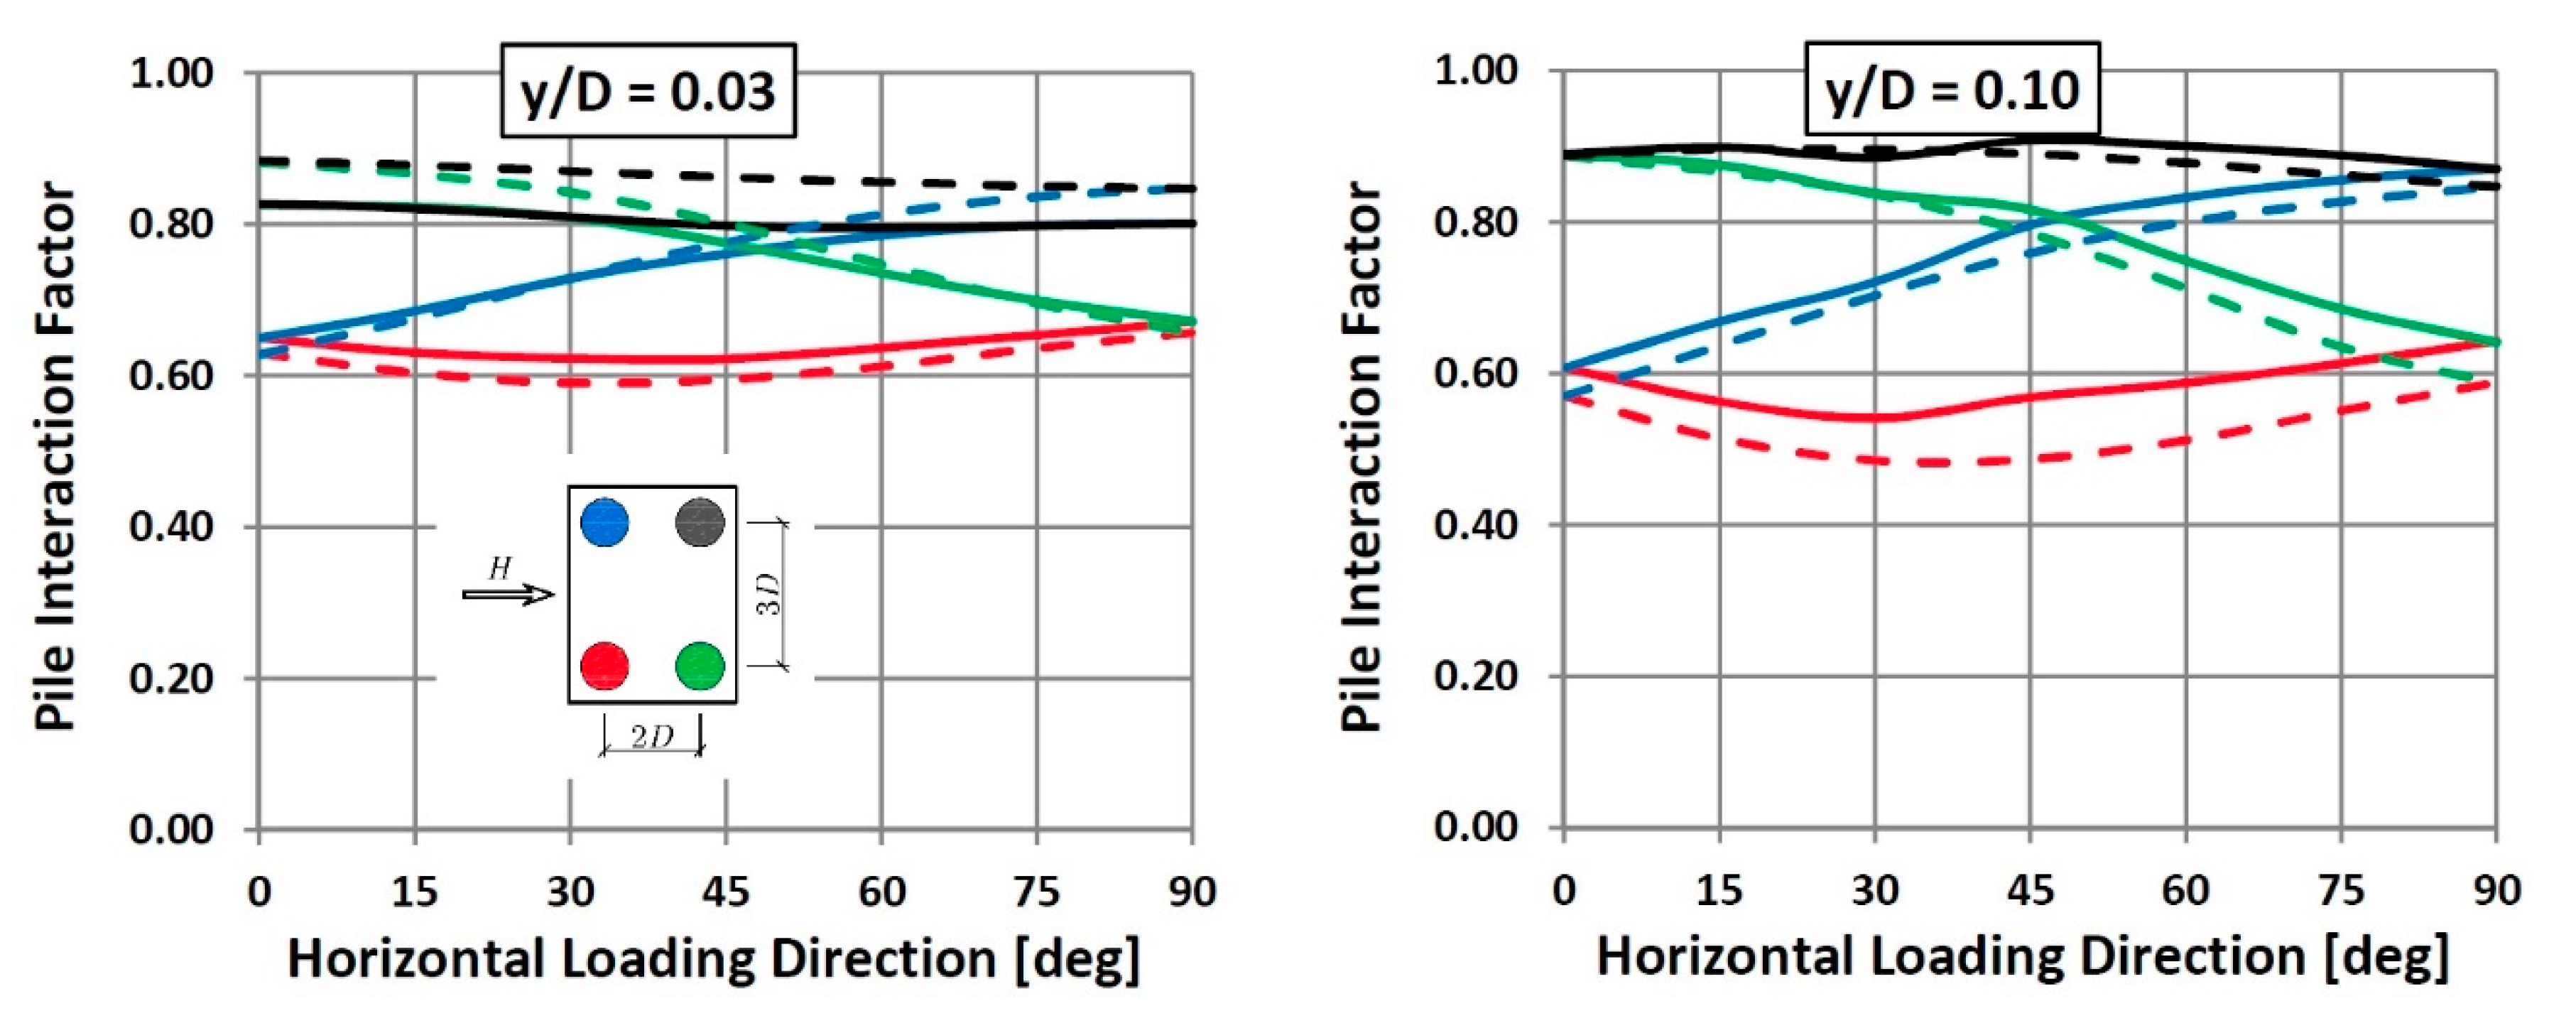
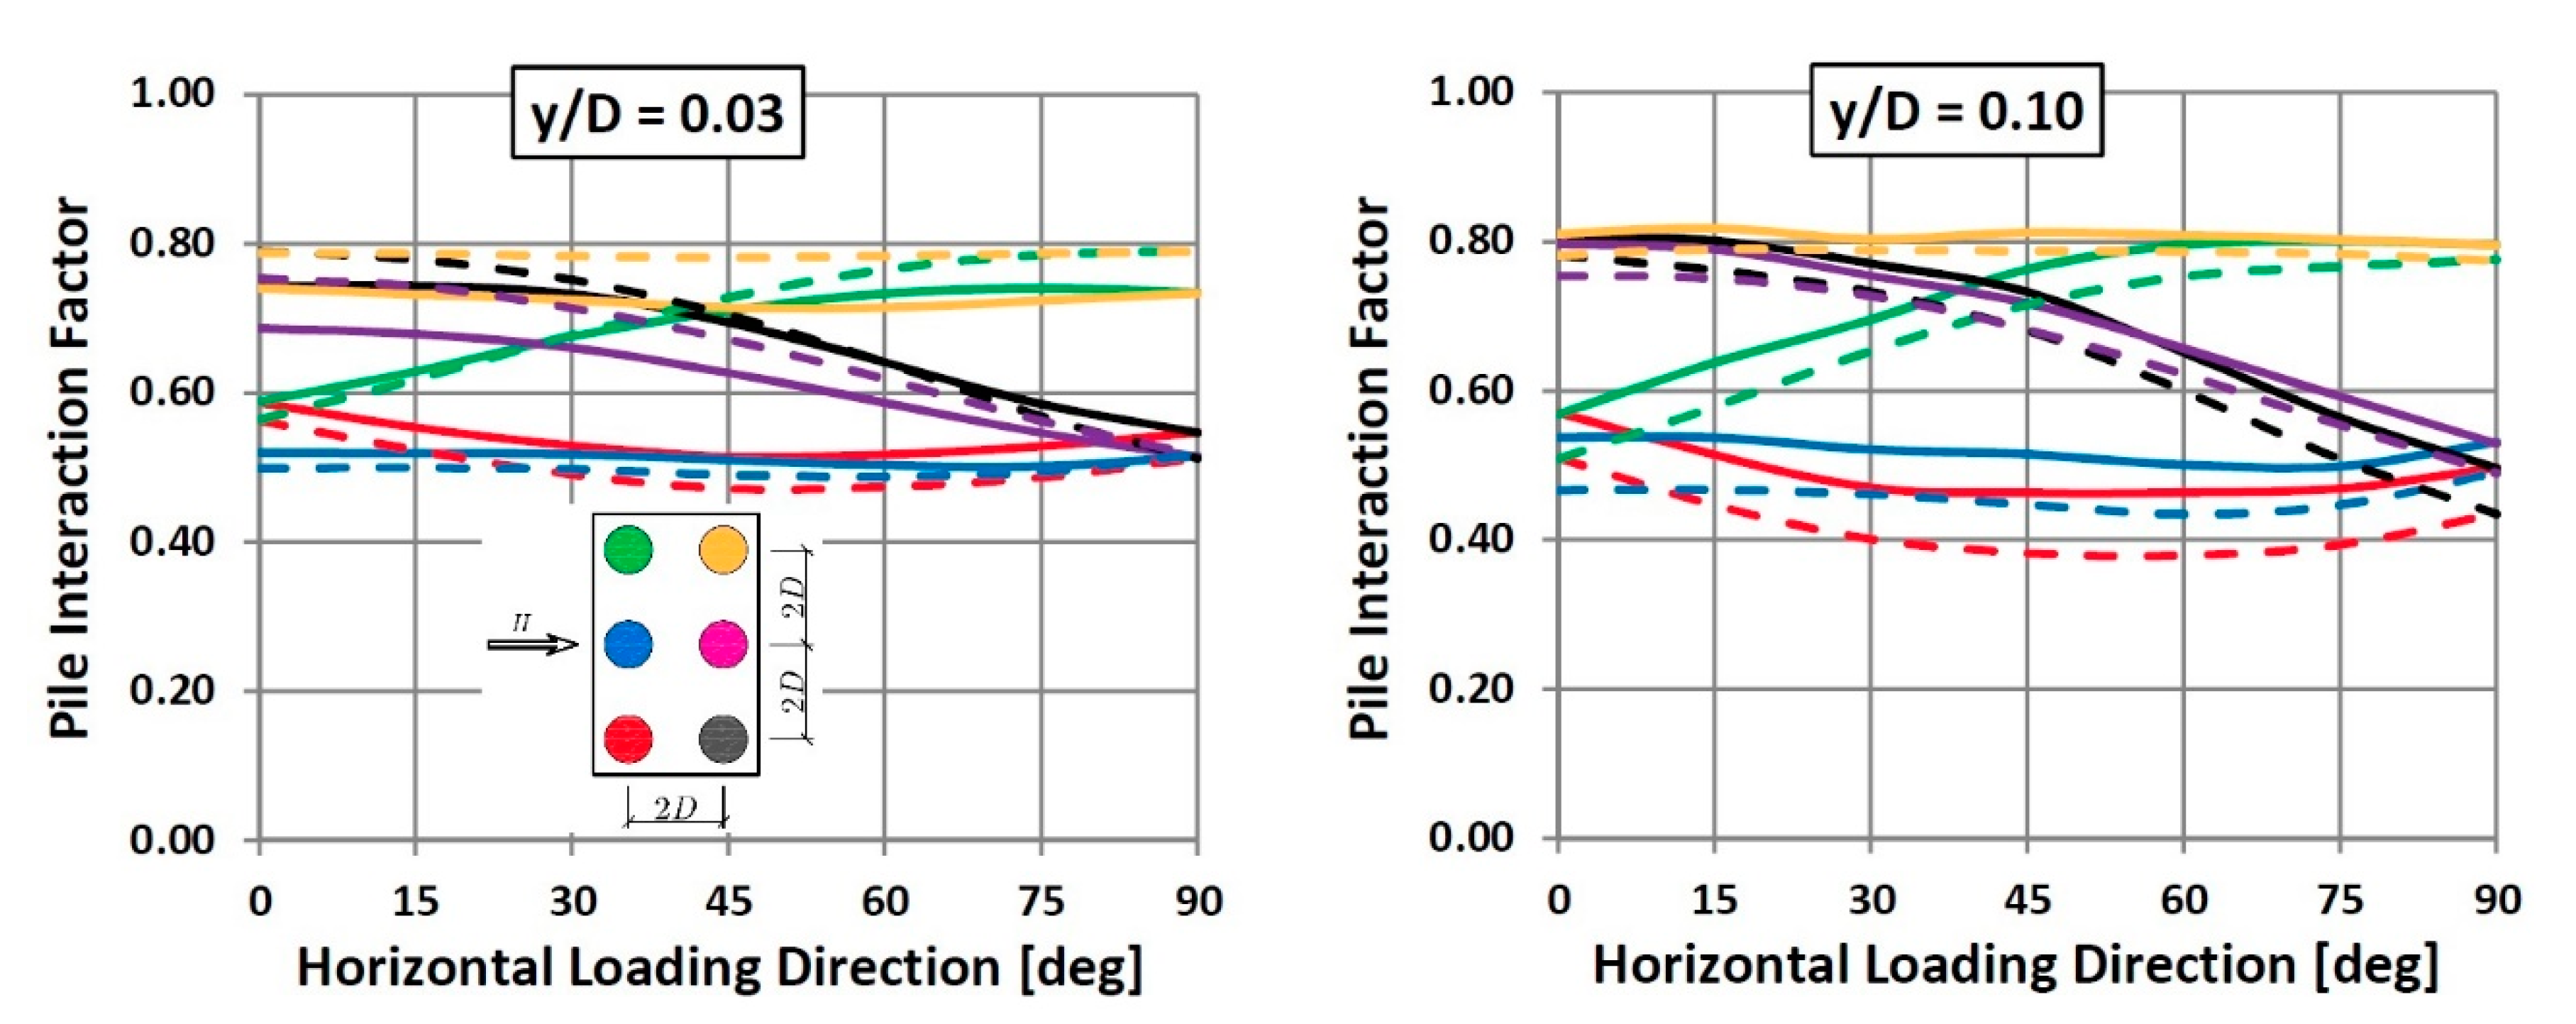
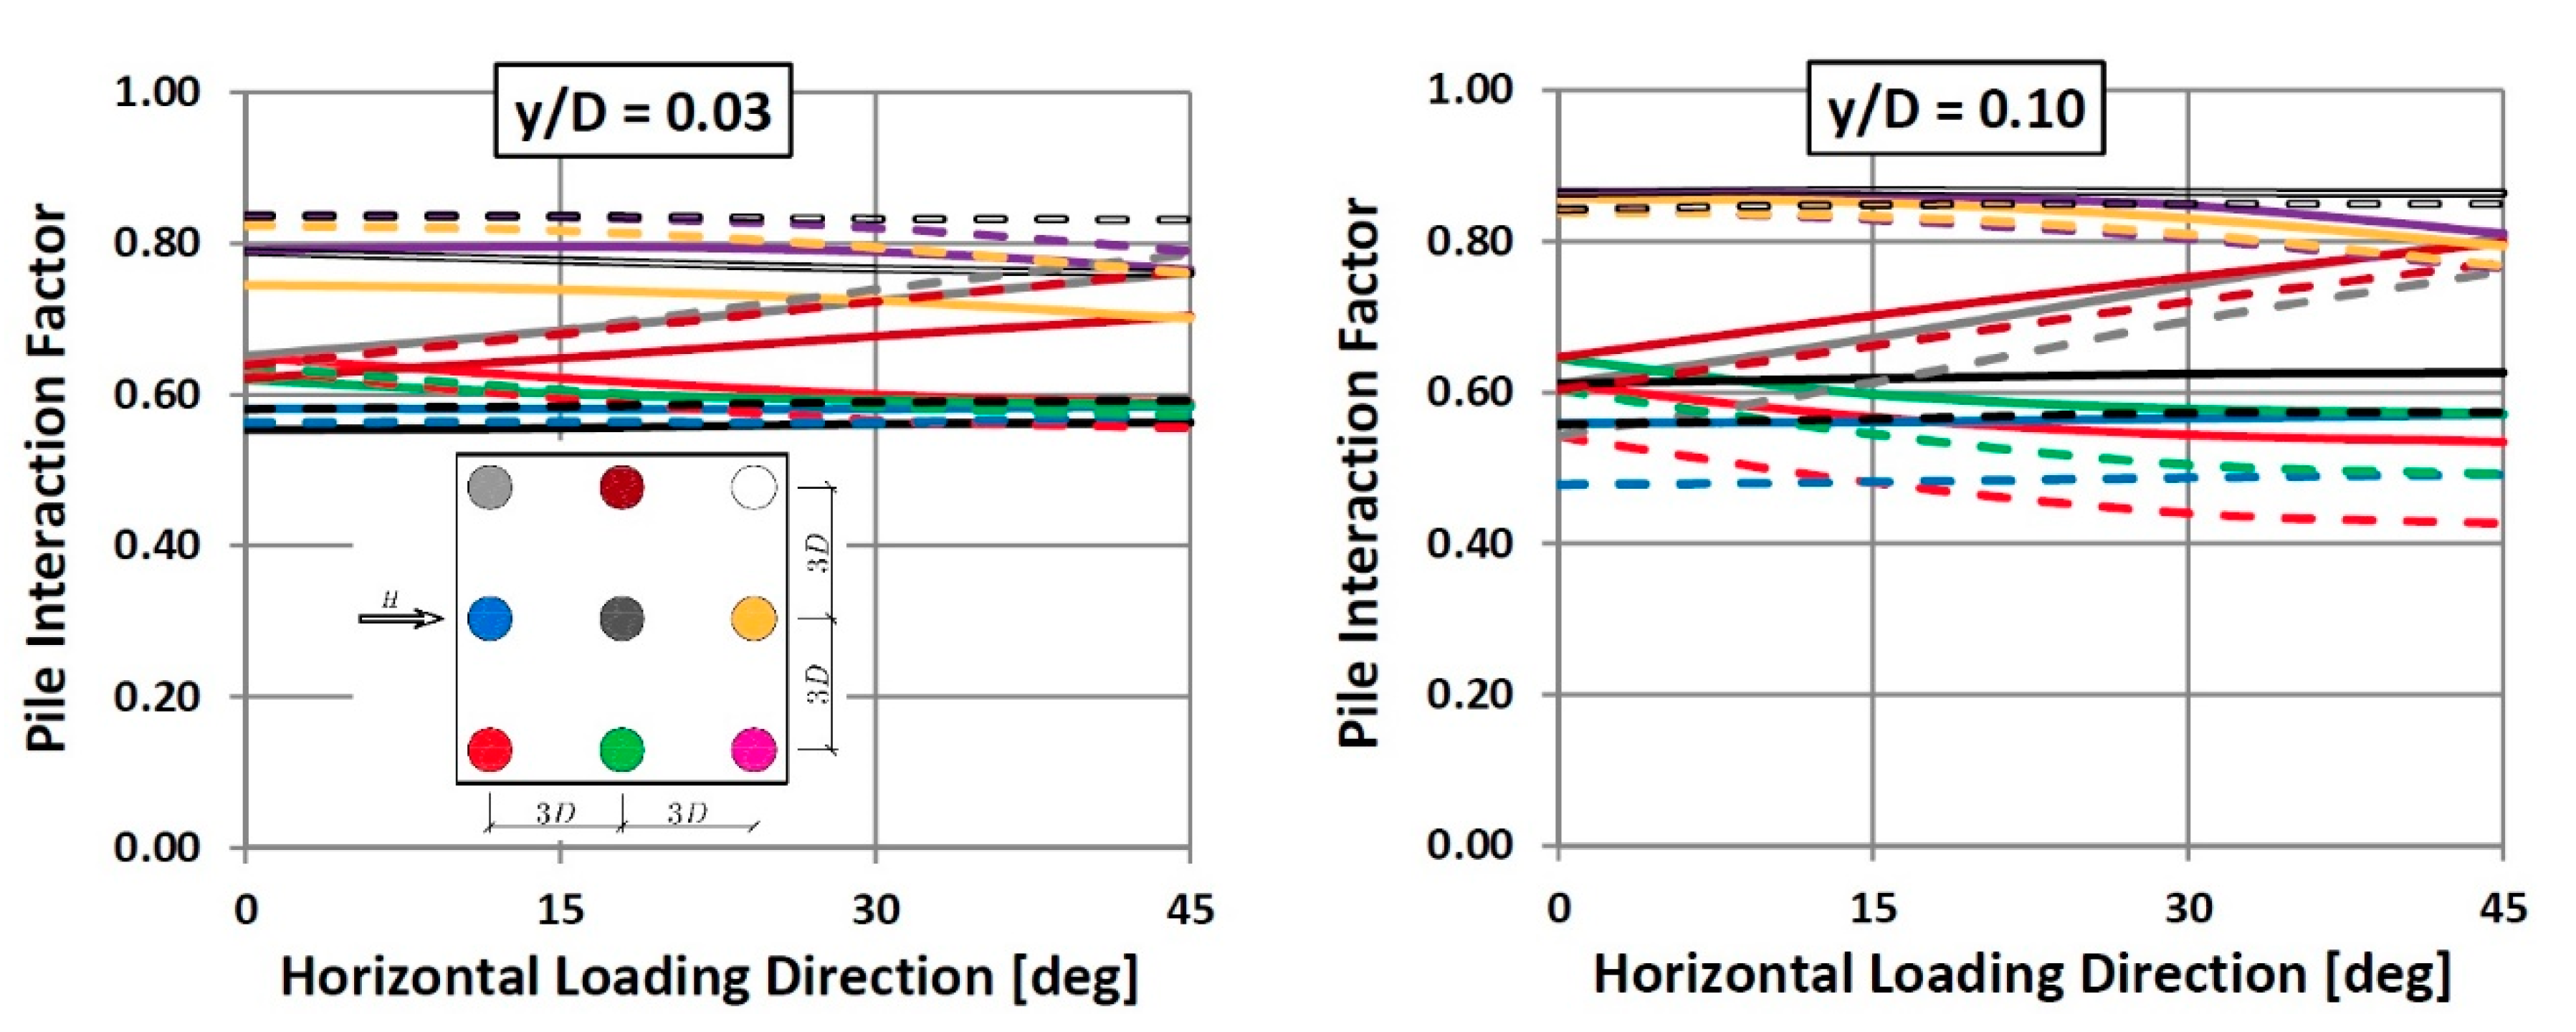
5.1. Pile Interaction Factors

Pile interaction factors for different pile group configurations are presented on Figure 10, Figure 11, Figure 12 and Figure 13. Full lines denote the results for loose sand, while dashed lines denote the results for dense sand.
Pile interaction factors for the closely-spaced square 2 × 2 pile group (sx = 2D, sy = 2D) are presented in Figure 10. The significant influence of the displacement level is observed—the interaction factors are changing in a broader range at the higher displacement level. The influence of the soil type is also pronounced, but at the smaller level, compared to the pile position inside the pile group. Similar trends can be seen for the square 3 × 3 pile group interaction factors, given in Figure 13. The effects of symmetry are clearly observed: the black and green pile have the same interaction factors for the loading direction angle equal to zero. For the direction angle of 45 degrees, the green and blue pile have the same interaction factors, due to symmetry. In addition, the well-known behavior of front and rear piles can be observed: for the loading direction angle equal to zero, black and green (front) piles carry higher loading than red and blue (rear) piles.
Pile interaction factors for the closely-spaced rectangular 2 × 2 pile group (sx = 2D, sy = 3D) are presented in Figure 11. The similar shape of the plot is also observed for different pile spacing, with decreased interaction with increased pile spacing. As in the previous case (Figure 10), the significant influence of the displacement level and medium influence of soil type on pile group interaction is observed. The behavior of green and blue piles is significantly different, compared to the other two piles. The changing of interaction factors for these piles is more pronounced with the variation in loading direction. Therefore, these piles can be considered as sensitive to change in loading direction, which can lead to the unsafe design in the case of unpredictable change of loading direction.
Pile interaction factors for the closely-spaced rectangular 2 × 3 pile group (sx = 2D, sy = 2D) are presented in Figure 12. The interaction factors in this case follows the same trends as in the previous case. The green, purple, and black pile can be considered as more sensitive.
Finally, pile interaction factors for square 3 × 3 pile group (sx = 3D, sy = 3D) are presented in Figure 13. The trend lines, in general, follows the same pattern as in the case of the 2 × 2 square pile group.

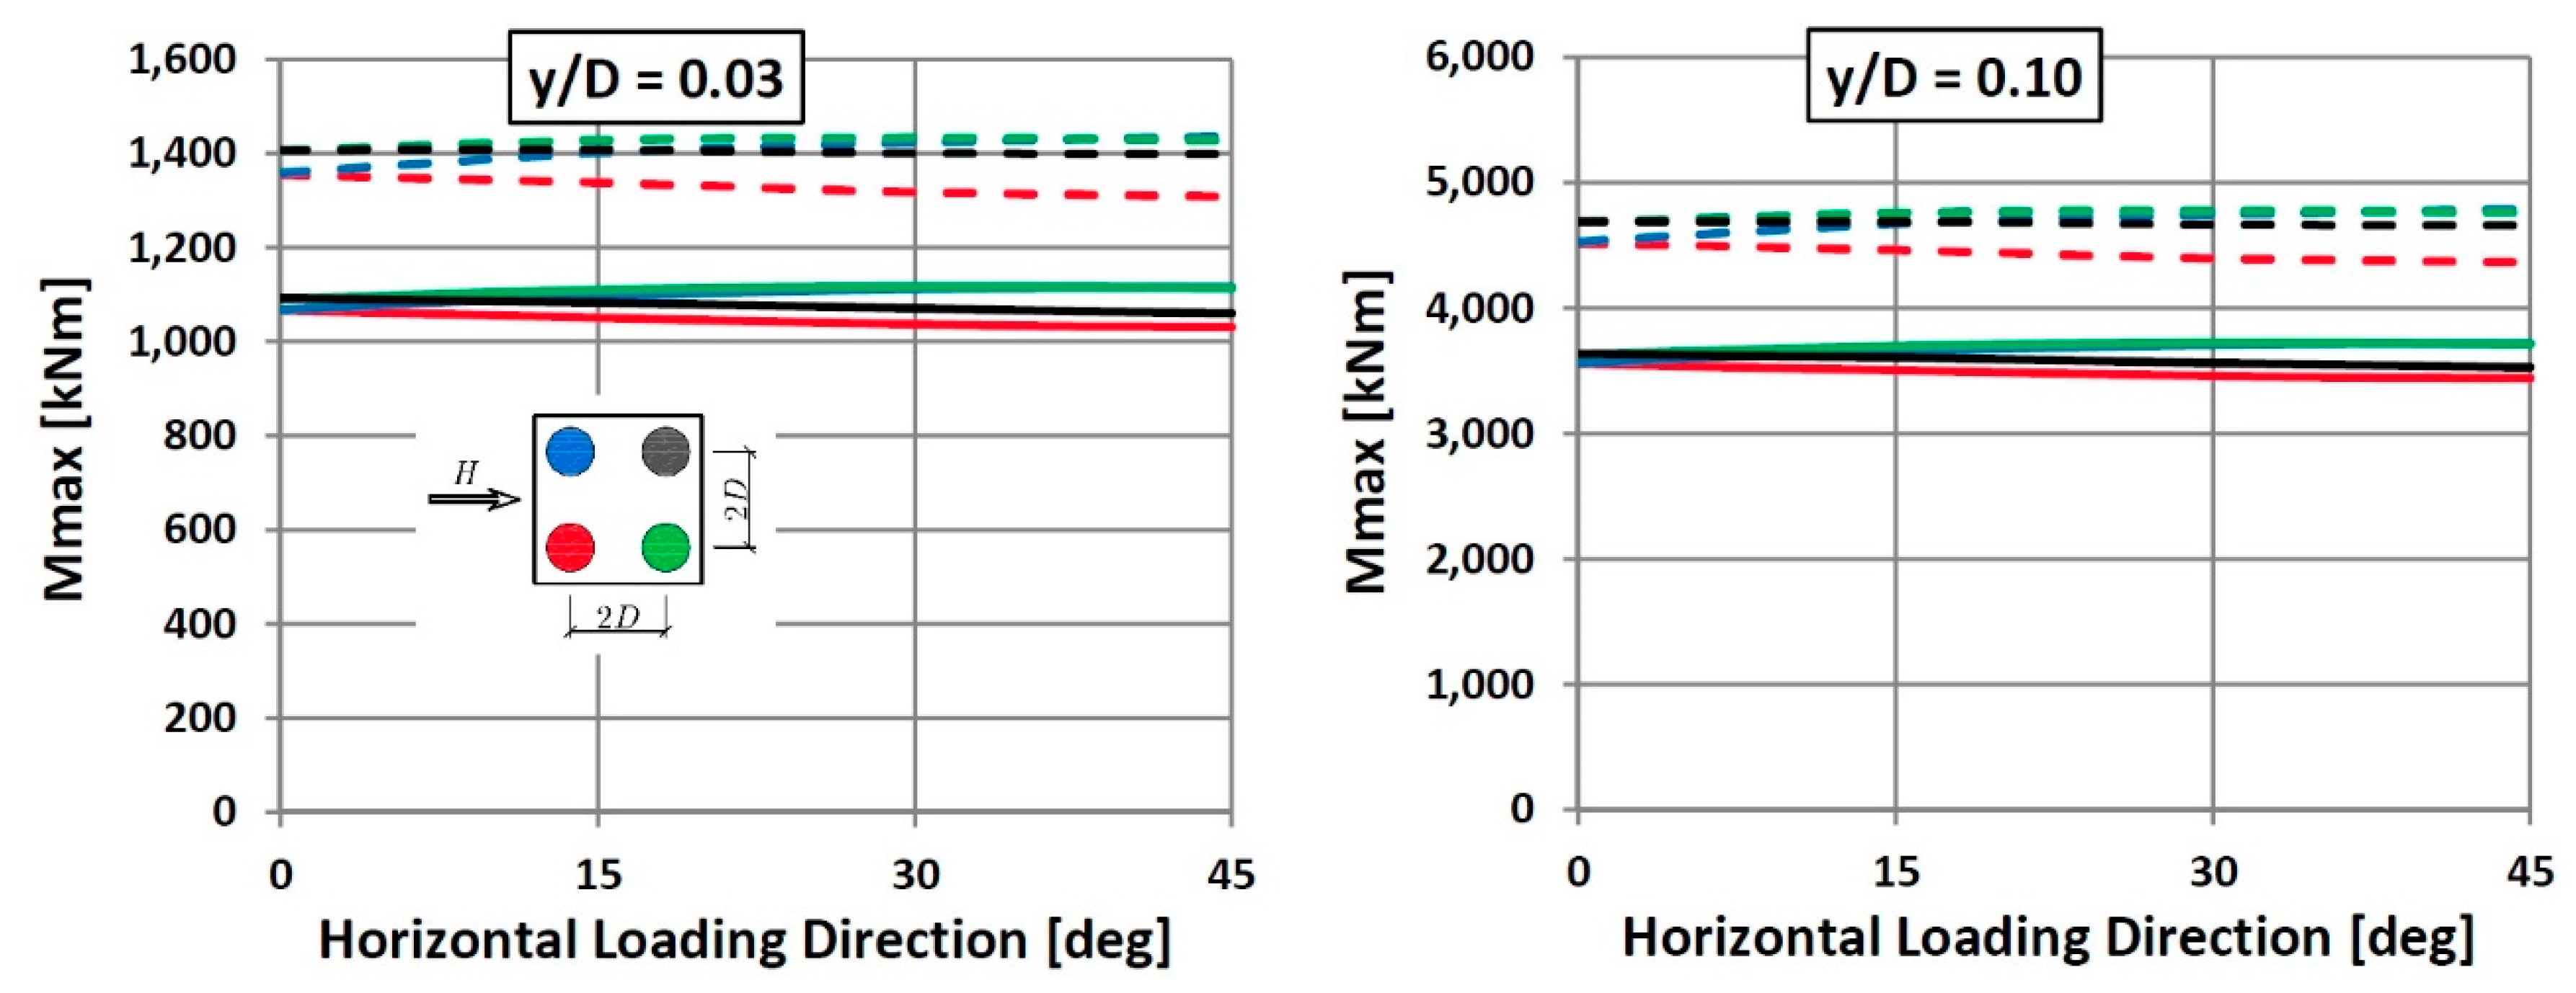
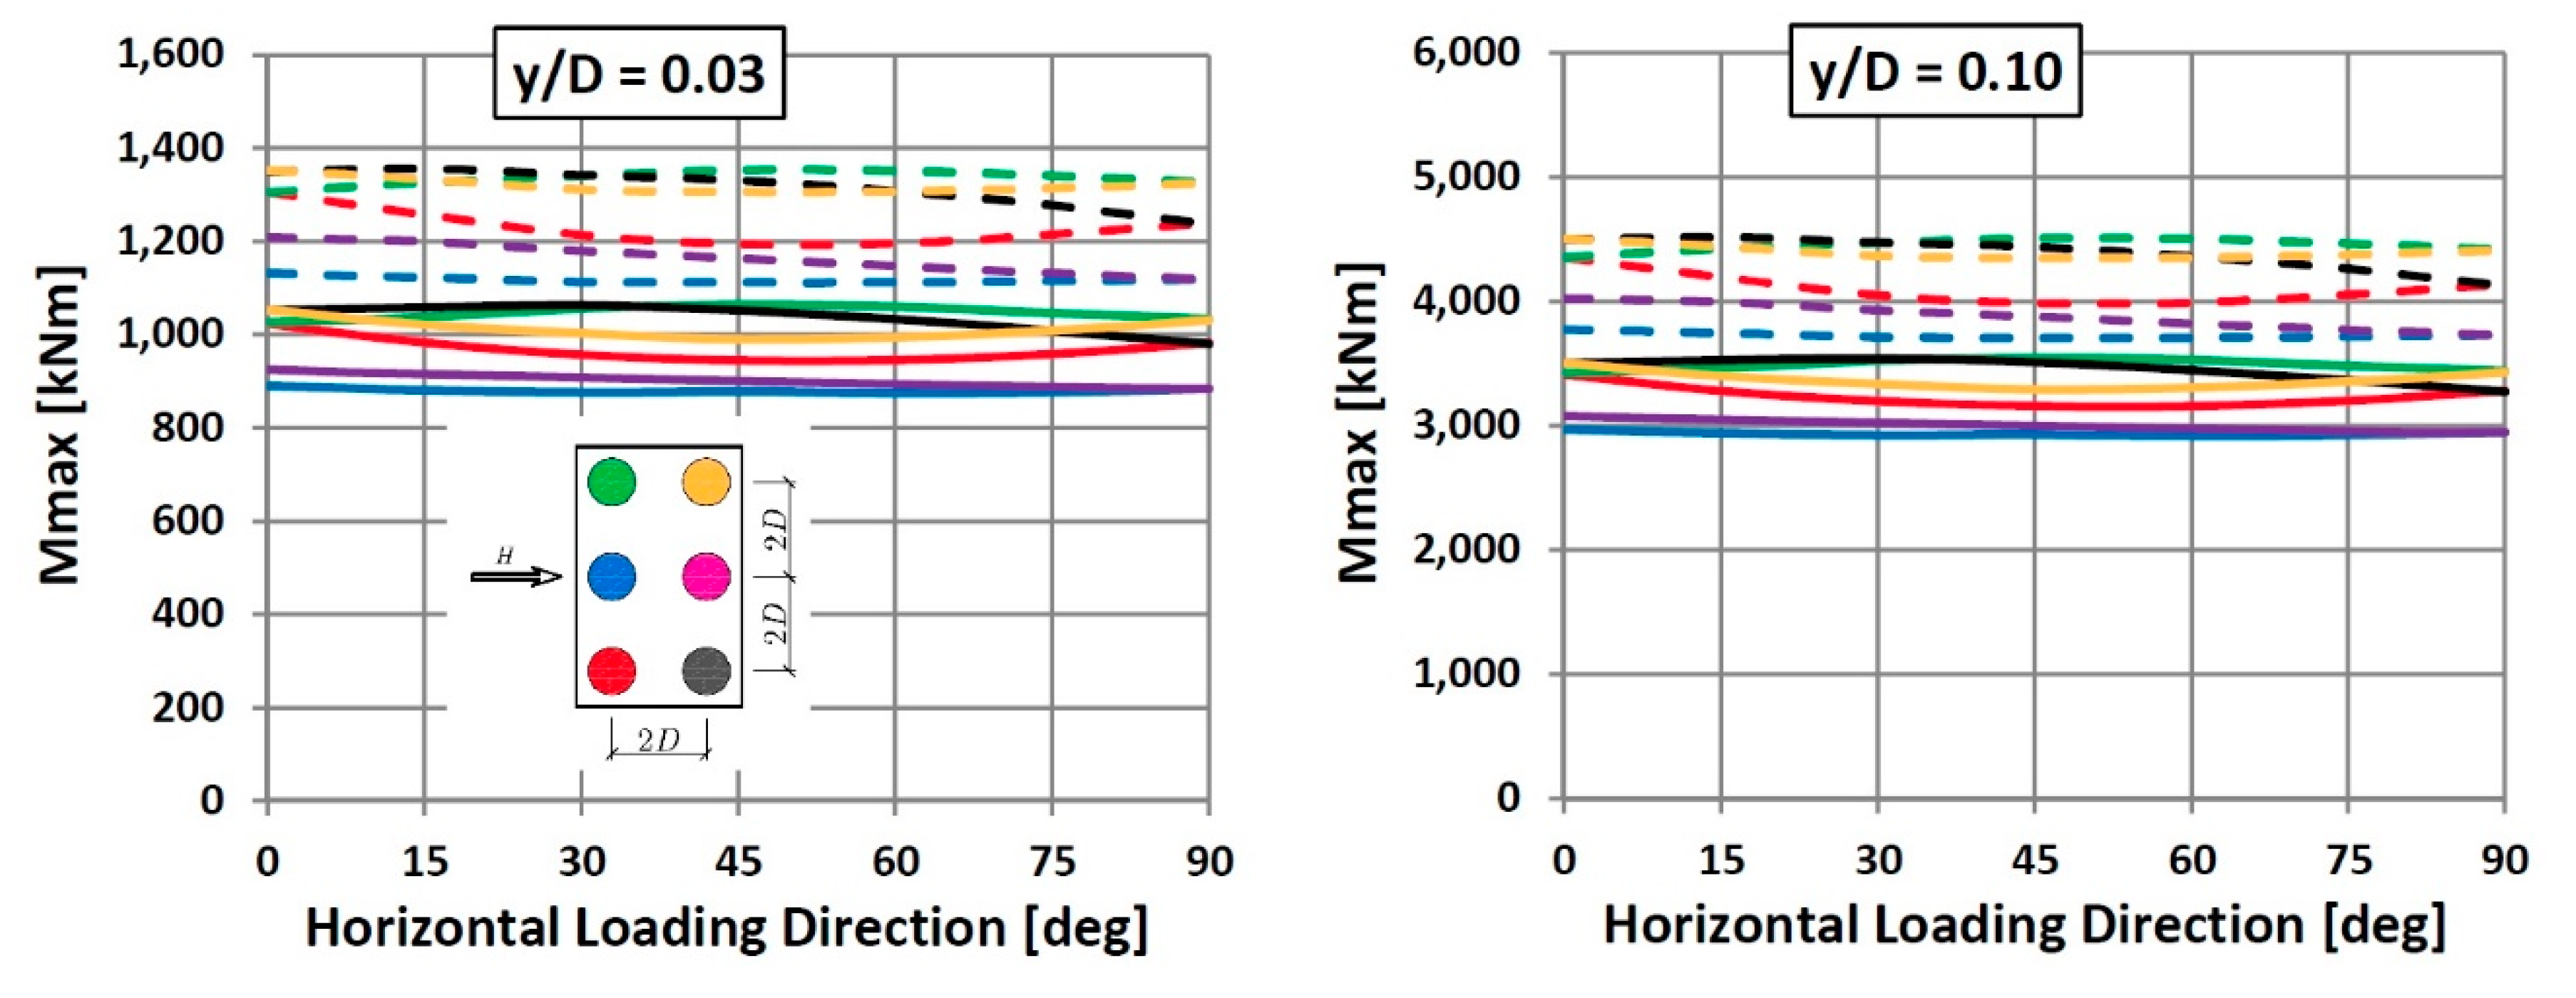
5.2. Maximum Bending Moments

Maximum pile bending moments for different pile group configurations are presented in Figure 14, Figure 15 and Figure 16. Full lines denote the results for loose sand, while dashed lines denote the results for dense sand.
As shown in Figure 14, maximum pile bending moments are not significantly influenced with the loading direction. As expected, higher bending moments occur in dense sand (due to the displacement control test and larger soil resistance in dense sand). Beside the higher absolute bending moment, the displacement level does not affect the distribution of the bending moments between the piles. It can be concluded that the pile group configuration and pile position are the governing factors in this case.
In the case of the rectangular 2 × 3 pile group (sx = 2D, sy = 2D), maximum pile bending moments (Figure 15) are distributed more unequally between the piles, compared with the square pile group at the same pile spacing. Again, higher bending moments occur in dense sand. In addition, the influence of the lateral loading direction on the maximum bending moments can be considered as less important, compared to the pile position inside the pile group. The same pile groups (2 × 3) with different spacing show similar trends, with less moment differences between the piles at larger pile spacing (as expected).
Maximum pile bending moments for the square 3 × 3 pile group (sx = 3D, sy = 3D) follows the similar trend as the smaller square pile group, but with significantly higher differences of the maximum moment between the piles. In general, the maximum bending moment between the piles shows larger discrepancies with the increased number of the piles in the pile group configuration.

6. Conclusions

A broad numerical experiment has been conducted to examine the influence of the arbitrary lateral loading direction on the interaction inside the pile group. Free head, flexible bored piles in dry sands were considered. The FEM 3D numerical model was designed and validated by back-calculation of the existing experimental results. The capabilities of PLAXIS 3D software to perform multiple numerical simulations have been tested in an automated scripting environment, using original computer programs. The common approach to the analysis of the laterally loaded pile group is expanded with the pile interaction factors for the arbitrary loading direction. The results of the study provide more clear insight into the pile group behavior under lateral loading. Based on the presented analyses, the following conclusions can be made:
  • Modeling of the laterally loaded pile group using the full 3D finite element model provides reasonable results for the case of the bored piles.
  • As expected, the level of interaction between the piles is higher at higher displacement levels. The influence of the displacement level on the pile group interaction effects should be investigated in more detail, especially at small displacement levels.
  • The interaction level is decreased with increased pile spacing. By means of quantification, interaction factors are between 0.6–0.9 for working load levels, and 0.4–0.9 for high loading levels.
  • The pile interaction factors are dependent on soil type, but soil conditions are less important factor, compared to pile group configuration, displacement level, and pile position inside the pile group.
  • The influence of the loading direction on the maximum bending moments is relatively small, which is expected, given the central symmetry of the circular piles. The soil conditions significantly affect the bending moments. The displacement level does not affect the maximum bending moment distribution between the piles. Bending moment discrepancies are more pronounced with the increased number of piles.
  • The force in some individual piles inside the pile group significantly changes with the change of loading direction. These piles can be considered as sensitive, because the change of the loading direction can be unpredictable. The critical positions of these piles inside the pile group have been identified for the considered pile group configurations.
  • The concept of multiple numerical simulations, followed with original computer programs, could be easily extended to other numerical models and more used in everyday practice. Bearing in mind that the simulation sets can be run during the night, this approach leads to the optimum use of hardware and software resources.
The presented conclusions emphasize the importance of the considered problem and can lead to further research topics in various fields. Due to availability of modern experimental techniques, such as CT and PIV, the experimental analysis of soil deformation patterns under arbitrary loading would provide better insight in the problem and lead to more accurate numerical models. The identified concept of sensitive piles should be investigated in more detail, with the aim to eliminate the sensitive elements from the foundations design. The influence of the different water level in the soil could also be investigated in more detail, since this paper considered only dry sand. Finally, the speed of numerical simulations could be reduced with the alternative modeling approaches—through development of improved embedded beam model formulations (with advanced interface) in FEM, as well as the more advanced strain wedge model (with arbitrary wedge orientation).

Author Contributions

Conceptualization, D.K.; methodology, M.M.; software, M.M.; validation, M.M., D.K., M.V.; formal analysis, M.M.; funding acquisition, M.V., D.K.; investigation, M.M.; resources, D.K.; data curation, M.M.; writing—original draft preparation, M.M., M.V., D.K.; writing—review and editing, M.M., M.V., D.K.; visualization, M.M.; supervision, M.V., D.K.; project administration, M.M., M.V., D.K. All authors have read and agreed to the published version of the manuscript.

Funding

This research was funded partially by Serbian Government, Ministry of Education, Science and Technological Development, via Project TR 36046, and partially by German Academic Exchange Service (DAAD), via project SEEFORM (South Eastern European Graduate School for Master and Ph.D. Formation in Engineering). First author was supported with a short-term scholarship for international PhD guest researcher by German Research Foundation (DFG) within the Collaborative Research Center SFB 837 “Interaction Modeling in Mechanized Tunneling”, subprojects A5 and C2. Network license of the PLAXIS 3D software and significant financial support were provided by the Chair of Soil Mechanics, Foundation Engineering and Environmental Geotechnics, Ruhr-Universität Bochum.

Acknowledgments

The authors express their sincerest reverence to Tom Schanz, who passed away during this research, for his scientific contributions, dedication and leadership. Valuable initial topic discussions with René Schäfer and technical (IT) assistance by Reinhard Mosinski are acknowledged.

Conflicts of Interest

The authors declare no conflict of interests.

References

  1. Rao, S.N.; Ramakrishna, V.; Rao, M.B. Influence of Rigidity on Laterally Loaded Pile Groups in Marine Clay. J. Geotech. Geoenviron. 1998, 124, 542–549. [Google Scholar] [CrossRef]
  2. Comodromos, E.M.; Pitilakis, K.D. Response evaluation for horizontally loaded fixed-head pile groups using 3-D non-linear analysis. Int. J. Numer Anal. Methods Geomech. 2005, 29, 597–625. [Google Scholar] [CrossRef]
  3. European Committee for Standardization. Eurocode 7: Geotechnical Design—Part. 1: General Rules; European Committee for Standardization: Bruxelles, Belgium, 2004. [Google Scholar]
  4. Randolph, M. Design methods for pile group and piled rafts. In Proceedings of the 13th International Conference on Soil Mechanics and Geotechnical Engineering, New Delhi, India, 5–10 January 1994; pp. 61–82. [Google Scholar]
  5. Burland, J.; Broms, B.; De Mello, V.F.B. Behaviour of foundations and structures. In Proceedings of the 9th International Conference on Soil Mechanics and Geotechnical Engineering, Tokyo, Japan, 10–15 July 1977; pp. 495–546. [Google Scholar]
  6. Mandolini, A.; Viggiani, C. Settlement of piled foundations. Géotechnique 1997, 47, 791–816. [Google Scholar] [CrossRef]
  7. Poulos, H.G.; Davis, E.H. Pile Foundation Analysis and Design; Wiley: New York, NY, USA, 1980. [Google Scholar]
  8. Papadopoulou, M.C.; Comodromos, E.M. On the response prediction of horizontally loaded fixed-head pile groups in sands. Comput. Geotech. 2010, 37, 930–941. [Google Scholar] [CrossRef]
  9. Lesny, K. Design of laterally loaded piles-limits of limit state design. In Proceedings of the Geo-Risk 2017: Reliability-Based Design and Code Developments, Denver, CO, USA, 4–7 June 2017; pp. 267–276. [Google Scholar]
  10. Winkler, E. Die Lehre von der Elasticität und Festigkeit: Mit Besonderer Rücksicht auf ihre Anwendung in der Technik, für Polytechnische Schulen, Bauakademien, Ingenieure, Maschinenbauer, Architekten, etc.; Dominicius: Prague, Czech Republic, 1867. [Google Scholar]
  11. Hetenyi, M. Beams on Elastic Foundation: Theory with Applications in the Fields of Civil and Mechanical Engineering; The University of Michigan Press: Ann Arbor, MI, USA, 1946. [Google Scholar]
  12. Terzaghi, K. Evaluation of coefficients of subgrade reaction. Geotechnique 1955, 5, 297–326. [Google Scholar] [CrossRef]
  13. Broms, B.B. Lateral resistance of piles in cohesive soils. J. Soil Mech. Found. Div. 1964, 90, 27–64. [Google Scholar]
  14. Broms, B.B. Lateral resistance of piles in cohesionless soils. J. Soil Mech. Found. Div. 1964, 90, 123–158. [Google Scholar]
  15. Norris, G. Theoretically based BEF laterally loaded pile analysis. In Proceedings of the 3rd International Conference on Numerical Methods in Offshore Piling, Nantes, France, 21–22 May 1986; pp. 361–386. [Google Scholar]
  16. Ashour, M.; Pilling, P.; Norris, G. Documentation of the strain wedge model program for analyzing laterally loaded piles and pile groups. In Proceedings of the 32nd Engineering Geology and Geotechnical Engineering Symposium, Boise, ID, USA, 26–28 March 1997; pp. 26–28. [Google Scholar]
  17. Ashour, M.; Norris, G.; Pilling, P. Lateral loading of a pile in layered soil using the strain wedge model. J. Geotech. Geoenviron. 1998, 124, 303–315. [Google Scholar] [CrossRef]
  18. Ashour, M.; Pilling, P.; Norris, G. Assessment of pile group response under lateral load. In Proceedings of the 4th International Conference on Recent Advances in Geotechnical Earthquake Engineering and Soil Dynamics, San Diego, CA, USA, 25–28 June 2001. [Google Scholar]
  19. Ashour, M.; Pilling, P.; Norris, G. Lateral behavior of pile groups in layered soils. J. Geotech. Geoenviron. 2004, 130, 508–592. [Google Scholar] [CrossRef]
  20. McClelland, B.; Focht, J. Soil modulus for laterally loaded piles. J. Soil Mech Found. Div 1958, 82, 1–22. [Google Scholar]
  21. Matlock, H. Correlations for design of laterally loaded piles in soft clay. In Proceedings of the Offshore Technology Conference, Houston, TX, USA, 22–24 April 1970; pp. 77–94. [Google Scholar]
  22. Reese, L.C.; Cox, W.R.; Koop, F.D. Analysis of laterally loaded piles in sand. In Offshore Technology in Civil Engineering Hall of Fame Papers from the Early Years; American Society of Civil Engineers: Reston, VA, USA, 1974; pp. 95–105. [Google Scholar]
  23. Dodds, A.M.; Martin, G.R. Modeling Pile Behavior in Large Pile Groups under Lateral Loading. Technical Report mceer-07-0004; University of Southern California: Los Angeles, CA, USA, 2007. [Google Scholar]
  24. Robertson, P.K.; Davies, M.P.; Campanella, R.G. Design of laterally loaded driven piles using the flat dilatometer. Geotech. Test. J. 1989, 12, 30–38. [Google Scholar]
  25. Briaud, J.L.; Smith, T.; Meyer, B. Laterally loaded piles and the pressuremeter: Comparison of existing methods. In Laterally Loaded Deep Foundations: Analysis and Performance; ASTM International: West Conshohocken, PA, USA, 1984. [Google Scholar]
  26. Brown, D.A.; Morrison, C.; Reese, L.C. Lateral load behavior of pile group in sand. J. Geotech. Eng. ASCE 1988, 114, 1261–1276. [Google Scholar] [CrossRef]
  27. Brown, D.A.; Shie, C.F. Three dimensional finite element model of laterally loaded piles. Comput. Geotech. 1990, 10, 59–79. [Google Scholar] [CrossRef]
  28. Brown, D.A.; Shie, C.F. Some numerical experiments with a three dimensional finite element model of a laterally loaded pile. Comput. Geotech. 1991, 12, 14–162. [Google Scholar] [CrossRef]
  29. Brown, D.A.; Shie, C.F. Numerical experiments into group effects on the response of piles to lateral loading. Comput. Geotech. 1990, 10, 211–230. [Google Scholar] [CrossRef]
  30. Wakai, A.; Gose, S.; Ugai, K. 3-D elasto-plastic finite element analyses of pile foundations subjected to lateral loading. Soils Found. 1999, 39, 97–111. [Google Scholar] [CrossRef] [Green Version]
  31. Yang, Z.; Jeremic, B. Numerical study of group effects for pile groups in sands. Int. J. Numer. Anal. Met. 2003, 27, 1255–1276. [Google Scholar] [CrossRef]
  32. Comodromos, E.; Papadopoulou, M. Response evaluation of horizontally loaded pile groups in clayey soils. Geotechnique 2012, 62, 329–339. [Google Scholar] [CrossRef]
  33. Papadopoulou, M.C.; Comodromos, E.M. Explicit extension of the p-y method to pile groups in sandy soils. Acta Geotech 2014, 9, 485–497. [Google Scholar] [CrossRef]
  34. Comodromos, E.M.; Papadopoulou, M.C. Explicit extension of the p-y method to pile groups in cohesive soils. Comput Geotech 2013, 47, 28–41. [Google Scholar] [CrossRef]
  35. Poulos, H.G. Behavior of laterally loaded piles: I—single piles. J. Soil Mech. Found. Div. 1971, 97, 711–731. [Google Scholar]
  36. Poulos, H.G. Behavior of laterally loaded piles: II—pile groups. J. Soil Mech. Found. Div. 1971, 97, 733–751. [Google Scholar]
  37. Banerjee, P.K.; Driscoll, R.M. Three-dimensional analysis of vertical pile groups. In Proceedings of the Second International Conference on Numerical Methods in Geomechanics, Blacksburg, VA, USA, 1 June 1976; pp. 438–450. [Google Scholar]
  38. Fayyazi, M.S.; Taiebat, M.; Finn, W.L. Group reduction factors for analysis of laterally loaded pile groups. Can. Geotech. J. 2014, 51, 758–769. [Google Scholar] [CrossRef]
  39. Lemnitzer, A.; Khalili-Tehrani, P.; Ahlberg, E.R.; Rha, C.; Taciroglu, E.; Wallace, J.W.; Stewart, J.P. Nonlinear Efficiency of Bored Pile Group under Lateral Loading. J. Geotech. Geoenviron 2010, 136, 1673–1685. [Google Scholar] [CrossRef]
  40. Ashour, M.; Ardalan, H. Employment of the p-multiplier in pile-group analysis. J. Bridg. Eng 2011, 16, 612–623. [Google Scholar] [CrossRef]
  41. Otani, J.; Pham, K.D.; Sano, J. Investigation of failure patterns in sand due to laterally loaded pile using X-ray CT. Soils Found. 2006, 46, 529–535. [Google Scholar] [CrossRef] [Green Version]
  42. Hajialilue-Bonab, M.; Azarnya-Shahgoli, H.; Sojoudi, Y. Soil deformation pattern around laterally loaded piles. Int. J. Phys. Model. Geo. 2011, 11, 116–125. [Google Scholar] [CrossRef]
  43. Hajialilue-Bonab, M.; Sojoudi, Y.; Puppala, A.J. Study of strain wedge parameters for laterally loaded piles. Int. J. Geomech. 2013, 13, 143–152. [Google Scholar] [CrossRef]
  44. Iai, S.; Tobita, T.; Hussien, M.N.; Ozutsumui, N.; Rollins, K. Soil-pile interaction under lateral load. In Soil-Foundation-Structure Interaction; CRC Press: Boca Raton, FL, USA, 2010; pp. 117–124. [Google Scholar]
  45. Morita, K.; Otani, J.; Mukunoki, T.; Hironaka, J.; Pham, K.D. Evaluation of vertical and lateral bearing capacity mechanisms of pile foundations using X-ray CT. In Proceedings of the International Workshop on Recent Advances of Deep Foundations, Yokosuka, Japan, 1–2 February 2007; pp. 217–223. [Google Scholar]
  46. German Institute for Standardization. Subsoil—Verification of the Safety of Earthworks and Foundations—Supplementary Rules to DIN EN 1997–1; German Institute for Standardization: Berlin, Germany, 2010. [Google Scholar]
  47. German Institute for Standardization. DIN 4014: Bored Cast-in-Place Piles: Formation, Design and Bearing Capacity; German Institute for Standardization: Berlin, Germany, 1990. [Google Scholar]
  48. Deutschen Gesellschaft für Geotechnik, e.V. Deutschen Gesellschaft für Geotechnik e.V.: EA-Pfähle: Empfehlungen des Arbeitskreises “Pfähle”; Wilhelm Ernst & Sohn: Berlin, Germany, 2012. [Google Scholar]
  49. Klüber, E. Tragverhalten von Pfahlgruppen unter Horizontal Belastung. Ph.D. Thesis, Technische Universität Darmstadt, Darmstadt, Germany, 1988. [Google Scholar]
  50. Kotthaus, M. Zum Tragverhalten von horizontal belasteten Pfahlreihen aus langen Pfählen in Sand. Ph.D. Thesis, Ruhr-Universität Bochum, Bochum, Germany, 1992. [Google Scholar]
  51. Randolph, M.F. The response of flexible piles to lateral loading. Geotechnique 1981, 31, 247–259. [Google Scholar] [CrossRef]
  52. Ochoa, M.W.; O’Neill, M. Lateral pile interaction factors in submerged sand. J. Geotech. Eng. ASCE 1989, 115, 359–378. [Google Scholar] [CrossRef]
  53. Fan, C.C.; Long, J.H. A modulus-multiplier approach for non-linear analysis of laterally loaded pile groups. Int. J. Numer Anal. Met. 2007, 31, 1117–1145. [Google Scholar] [CrossRef]
  54. Su, D.; Yan, W. A multidirectional p-y model for lateral sand-pile interactions. Soils Found. 2013, 53, 199–214. [Google Scholar] [CrossRef] [Green Version]
  55. Mayoral, J.M.; Pestana, J.M.; Seed, R.B. Multi-directional cyclic p-y curves for soft clays. Ocean. Eng. 2016, 115, 1–18. [Google Scholar] [CrossRef] [Green Version]
  56. Georgiadis, K.; Sloan, S.; Lyamin, A. Ultimate lateral pressure of two side-by-side piles in clay. Geotechnique 2013, 63, 733–745. [Google Scholar] [CrossRef] [Green Version]
  57. Su, D.; Zhou, Y.G. Effect of Loading Direction on the Response of Laterally Loaded Pile Groups in Sand. Int. J. Geomech. 2015, 16, 04015051. [Google Scholar] [CrossRef]
  58. Brown, D.A.; O’Neill, M.W.; Hoit, M.; McVay, M.; El Nagger, M.H.; Chakraborty, S. Static and Dynamic Lateral Loading of Pile Groups. Technical Report NCHRP 24; Transportation Research Board: Washington, DC, USA, 2001. [Google Scholar]
  59. Huang, A.B.; Hsueh, C.K.; O’Neill, M.W.; Chern, S.; Chen, C. Effects of construction on laterally loaded pile groups. J. Geotech. Geoenviron. 2001, 127, 385–397. [Google Scholar] [CrossRef]
  60. McVay, M.; Casper, R.; Shang, T.I. Lateral response of three-row groups in loose to dense sands at 3D and 5D pile spacing. J. Geotech. Eng. 1995, 121, 436–441. [Google Scholar] [CrossRef]
  61. Rollins, K.M.; Peterson, K.T.; Weaver, T.J. Lateral load behavior of full-scale pile group in clay. J. Geotech. Geoenviron. 1998, 124, 468–478. [Google Scholar] [CrossRef]
  62. Cox, W.R.; Dixon, D.A.; Murphy, B.S. Lateral-load tests on 25.4-mm (1-in.) diameter piles in very soft clay in side-by-side and in-line groups. In Laterally Loaded Deep Foundations: Analysis and Performance; ASTM International: West Conshohocken, PA, USA, 1984. [Google Scholar]
  63. Reese, L.C.; Van Impe, W.F. Single Piles and Pile Groups under Lateral Loading; CRC Press: Boca Raton, FL, USA, 2011; Available online: https://books.google.com.hk/books/about/Single_Piles_and_Pile_Groups_Under_Later.html?id=7qg0SwAACAAJ&redir_esc=y (accessed on 14 October 2020).
  64. Chandrasekaran, S.; Boominathan, A.; Dodagoudar, G. Group interaction effects on laterally loaded piles in clay. J. Geotech. Geoenviron. 2010, 136, 573–582. [Google Scholar] [CrossRef]
  65. McVay, M.; Zhang, L.; Molnit, T.; Lai, P. Centrifuge testing of large laterally loaded pile groups in sands. J. Geotech. Geoenviron. 1998, 124, 1016–1026. [Google Scholar] [CrossRef]
  66. Van Impe, W. Foreword: Belgian geotechnics’ experts research on screw piles. In Belgian Screw Pile Technology Design and Recent Developments; A.A. Balkema: Rotterdam, The Netherlands; Momenta: London, UK, 2003. [Google Scholar]
  67. Basile, F. Analysis and design of pile groups. In Numerical Analysis and Modelling in Geomechanics; CRC Press: Boca Raton, FL, USA, 2003; pp. 278–315. [Google Scholar]
  68. Mokwa, R.L.; Duncan, J.M. Rotational Restraint of Pile Caps during Lateral Loading. J. Geotech. Geoenviron. 2003, 129, 829–837. [Google Scholar] [CrossRef]
  69. Reese, L.C.; Van Impe, W.F. Single Piles and Pile Groups under Lateral Loading; CRC Press: Boca Raton, FL, USA, 2000; Available online: https://books.google.com.hk/books/about/Single_Piles_and_Pile_Groups_Under_Later.html?id=jEs5z6-2xG4C&redir_esc=y (accessed on 14 October 2020).
  70. Brinkgreve, R.B.J.; Kumarswamy, S.; Swolfs, W.M.; Waterman, D.; Chesary, A.; Bonnier, P.G.; Haxaire, A. PLAXIS 3D AE—User Manual; Plaxis BV: Delft, The Netherlands, 2015. [Google Scholar]
  71. Marjanovic, M.; Vukicevic, M.; König, D.; Schanz, T.; Schäfer, R. Modeling of laterally loaded piles using embedded beam elements. In Proceedings of the International Conference “Contemporary achievements in Civil Engineering 2016”, Subotica, Serbia, 22 April 2016; pp. 349–358. [Google Scholar]
  72. Bowles, J. Foundation Analysis and Design; McGraw-Hill: New York, NY, USA, 1996. [Google Scholar]
  73. Comodromos, E.M.; Papadopoulou, M.C.; Rentzeperis, I.K. Effect of cracking on the response of pile test under horizontal loading. J. Geotech. Geoenviron. 2009, 135, 1275–1284. [Google Scholar] [CrossRef]
  74. Tedesco, G. Offshore Tower or Platform Foundations: Numerical Analysis of a Laterally Loaded Single Pile or Pile Group in Soft Clay and Analysis of Actions on a Jacket Structure. Master’s Thesis, University of Bologna, Bologna, Italy, 2013. [Google Scholar]
  75. Zhang, Y.; Andersen, K.H.; Tedesco, G. Ultimate bearing capacity of laterally loaded piles in clay - Some practical considerations. Marine Struct. 2016, 50, 260–275. [Google Scholar] [CrossRef]
  76. Schanz, T.; Vermeer, P.A. Formulation and verification of the Hardening Soil Model. In Beyond 2000 in Computation Geotechnics—10 Years of PLAXIS; Balkema: Rotterdam, The Netherlands, 1999; pp. 1–16. [Google Scholar]
  77. Jaky, J. The coefficient of earth pressure at rest. J. Soc. Hung. Arch. Eng. 1944, 78, 355–358. [Google Scholar]
  78. Garnier, J.; Gaudin, C.; Springman, S.M.; Culligan, P.J.; Goodings, D.; König, D.; Kutter, B.; Phillips, R.; Randolph, M.F.; Thorel, L. Catalogue of scaling laws and similitude questions in geotechnical centrifuge modelling. Int. J. Phys. Model. Geo. 2007, 7, 1–23. [Google Scholar] [CrossRef]
  79. Kayalar, A. Bettung von Horizontal Belasteten Pfahlreihen und Bohrpfahlwänden. Bachelar‘s Thesis, Ruhr-Universität Bochum, Bochum, Germany, 2012. [Google Scholar]
Figure 1. (a) Front and trailing rows in laterally loaded pile group (HG—total lateral force acting on pile group, sx and sy—center-to-center spacing between the piles in X and Y directions, respectively); (b) Influence of the “shadowing” on the load distribution inside the pile group (Hi—lateral force acting on pile i).
Jmse 08 00800 g001
Figure 2. Determination of pile interaction factors based on the pile position inside the pile group (after Kotthaus [50]). sL and sQ denote the pile center-to-center spacings in the direction of the lateral loading HG, and perpendicular to the direction of the lateral loading, respectively. Four different pile types, based on the pile position inside the pile group, are distinguished and associated with four different colors.
Jmse 08 00800 g002
Figure 3. Values of partial interaction factors αL, αQA, and αQZ based on the pile spacings in the loading direction sL (a) and the pile spacing perpendicular (b) to the loading direction sQ (after Kotthaus [50]). Note that at the pile spacings sL ≥ 6D and sQ ≥ 3D, no interaction occurs (D—pile diameter).
Jmse 08 00800 g003
Figure 4. Sketch of the numerical model with parameterized geometry. N, M denote the number of piles in X and Y direction, respectively. SX and SY are center-to-center pile spacings, in diameters D.
Jmse 08 00800 g004
Figure 5. Numerical model components in the mesh refinement zone.
Jmse 08 00800 g005
Figure 6. Directions of the maximum displacements ymax, shear forces Hmax, and bending moments Mmax. Loading direction is governed by the loading direction angle β. X, Y, Q12, Q13, M2, and M3 denotes the directions of displacements, shear forces, and bending moments in XY space in PLAXIS 3D, respectively.
Jmse 08 00800 g006
Figure 7. Shape of the characteristic diagrams for a free head pile. Q12, Q13, M2, and M3 denotes the shear forces and bending moments in XY space in PLAXIS 3D, respectively.
Jmse 08 00800 g007
Figure 8. Measured (triangles) vs. computed (red line) load-displacement response for (a) single pile; (b) pile row—front pile; (c) pile row—middle pile; (d) pile row—rear pile. Horizontal (lateral) displacements are given in prototype scale.
Jmse 08 00800 g008
Figure 9. Sketch of the parametric study parameters: left—side view; right—top view; β—angle of direction of lateral loading.
Jmse 08 00800 g009
Figure 10. Pile interaction factors for square 2 × 2 pile group (sx = 2D, sy = 2D). Different colors denote piles inside the pile group. Full lines—loose sand; dashed lines—dense sand.
Jmse 08 00800 g010
Figure 11. Pile interaction factors for rectangular 2 × 2 pile group (sx = 2D, sy = 3D). Different colors denote piles inside the pile group. Full lines—loose sand; dashed lines—dense sand.
Jmse 08 00800 g011
Figure 12. Pile interaction factors for rectangular 2 × 3 pile group (sx = 2D, sy = 2D). Different colors denote piles inside the pile group. Full lines—loose sand; dashed lines—dense sand.
Jmse 08 00800 g012
Figure 13. Pile interaction factors for square 3 × 3 pile group (sx = 3D, sy = 3D). Different colors denote piles inside the pile group. Full lines—loose sand; dashed lines—dense sand.
Jmse 08 00800 g013
Figure 14. Maximum bending moments for square 2 × 2 pile group (sx = 2D, sy = 2D). Different colors denote piles inside the pile group. Full lines—loose sand; dashed lines—dense sand.
Jmse 08 00800 g014
Figure 15. Maximum bending moments for rectangular 2 × 3 pile group (sx = 2D, sy = 2D). Different colors denote piles inside the pile group. Full lines—loose sand; dashed lines—dense sand.
Jmse 08 00800 g015
Figure 16. Maximum bending moments for square 3 × 3 pile group (sx = 3D, sy = 3D). Different colors denote piles inside the pile group. Full lines—loose sand; dashed lines—dense sand.
Jmse 08 00800 g016
Table 1. Centrifuge model dimensions (after Kotthaus [50]). Prototype model mimic the real concrete pile, with the concrete class between C20/25 and C25/30.
Centrifuge ModelPrototypeReal Structure
Pile diameter D (m)0.0301.51.5
Pile embedment length L (m)0.6003030
Pile length above ground level L2 (m)0.0854.254.25
Pipe wall thickness t (m)0.0020.10
Pipe inner diameter d (m)0.0261.30
Young’s modulus E (MN/m2)70 00070,00030,508
Moment of inertia I (m4)1.73 × 10−80.1080.2485
Bending stiffness EI (kNm2)1.21307,581,4487,581,448
Table 2. Hardening soil model parameters after back-calculation of experimental results.
Model ParameterValue
Volumetric weight γ (kN/m3)16.6
Cohesion c’ (kN/m2)0
Angle of internal friction ϕ’ (°)35
Dilation angle ψ (°)5
Triaxial loading stiffness E50 (kN/m2)28,800
Oedometer loading stiffnessEoed (kN/m2)28,800
Triaxial unloading stiffness Eur (kN/m2)115,200 (=4E50)
Poisson’s ratio ν (-)0.25
m (-)0.47
Rinter (-)0.654
Table 3. Hardening soil model parameters for the “synthetic soils”, compared with the parameters of validated numerical model.
Model ParameterModel ValidationParametric Study
Dense SandLoose SandDense Sand
Volumetric weight γ (kN/m3)16.61618
Cohesion c’ (kN/m2)000
Angle of internal friction ϕ’ (°)353042
Dilation angle ψ (°)5012
Triaxial loading stiffness E50 (kN/m2)28,80015,00030,000
Oedometer loading stiffnessEoed (kN/m2)28,80015,00030,000
Triaxial unloading stiffness Eur (kN/m2)115,20060,000120,000
Poisson’s ratio ν (-)0.250.250.25
m (-)0.470.500.50
Rinter (-)0.6540.650.65
Table 4. Summary of analyzed pile group configuration. The loading direction angle was varied in 15° increments.
Pile Group ShapeN × MSx (D)Sy (D)Loading Direction β (°)
Square2 × 2220/15/30/45
3 × 333
Rectangle2 × 2230/15/30/45/60/75/90
24
25
34
35
45
2 × 322
23
24
32
33
34
35
42
43
44
45
53
54
55
3 × 323
24
25
34
35
45
Publisher’s Note: MDPI stays neutral with regard to jurisdictional claims in published maps and institutional affiliations.

