Comparative Proteomic Profiling of Marine and Freshwater Synechocystis Strains Using Liquid Chromatography-Tandem Mass Spectrometry

 ,
,  ,
, 
Abstract

1. Introduction
2. Materials and Methods
2.1. Materials
2.2. Culture Conditions
2.3. Whole-Cell Protein Tryptic Digestion
2.4. High pH RP Fractionation
2.5. Mass Spectrometric Acquisition
2.6. Mass Spectrometric Data Analysis
2.7. Bioinformatics Analysis
3. Results and Discussion
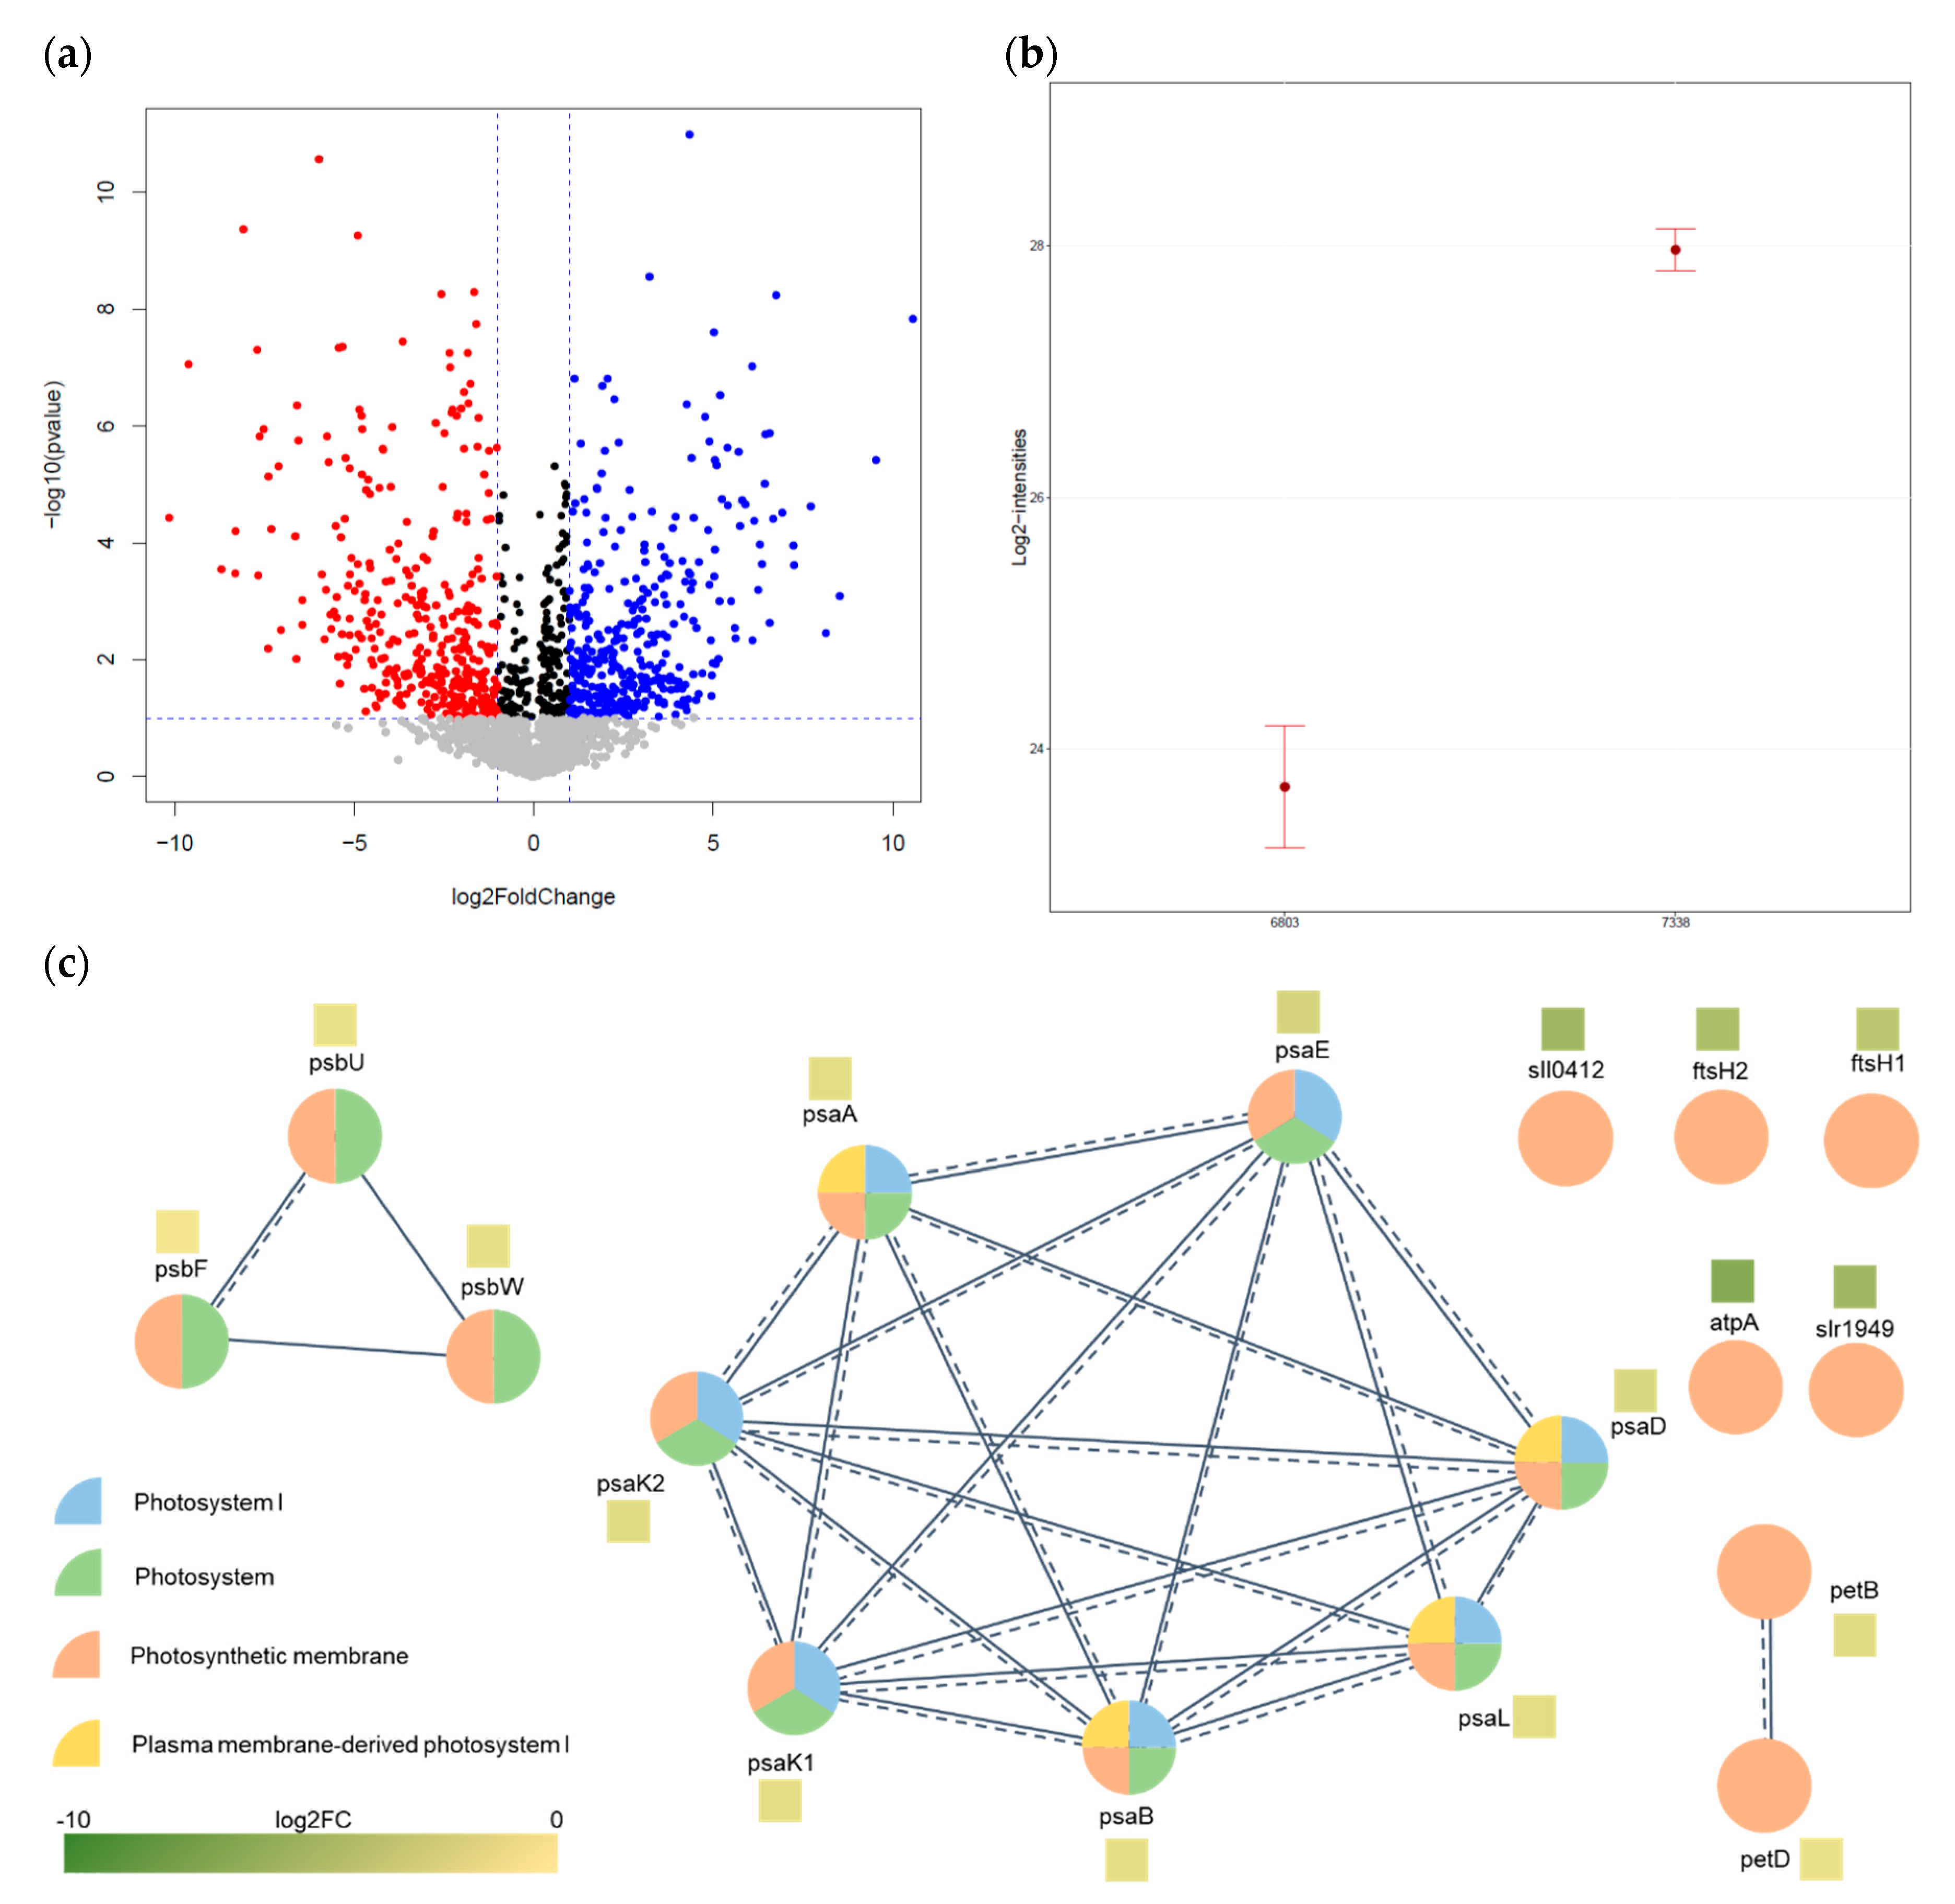
3.1. Data-Dependent Acquisition (DDA) for Proteomic Profiling of Synechocystis 6803 and 7338
3.2. Comparative Analysis of Quantification Data
3.3. Bioinformatics Analysis
4. Conclusions
Supplementary Materials
Author Contributions
Funding
Conflicts of Interest
References
- Georgianna, D.R.; Mayfield, S.P. Exploiting diversity and synthetic biology for the production of algal biofuels. Nature 2012, 488, 329–335. [Google Scholar] [CrossRef]
- Hondo, S.; Takahashi, M.; Osanai, T.; Matsuda, M.; Hasunuma, T.; Tazuke, A.; Nakahira, Y.; Chohnan, S.; Hasegawa, M.; Asayama, M. Genetic engineering and metabolite profiling for overproduction of polyhydroxybutyrate in cyanobacteria. J. Biosci. Bioeng. 2015, 120, 510–517. [Google Scholar] [CrossRef]
- Bonnard, I.; Bornancin, L.; Dalle, K.; Chinain, M.; Zubia, M.; Banaigs, B.; Roué, M. Assessment of the Chemical diversity and potential toxicity of benthic cyanobacterial blooms in the Lagoon of Moorea Island (French Polynesia). J. Mar. Sci. Eng. 2020, 8, 406. [Google Scholar] [CrossRef]
- De Santi, F.; Luciani, G.; Bresciani, M.; Giardino, C.; Lovergine, F.P.; Pasquariello, G.; Vaiciute, D.; De Carolis, G. Synergistic Use of synthetic aperture radar and optical imagery to monitor surface accumulation of cyanobacteria in the Curonian Lagoon. J. Mar. Sci. Eng. 2019, 7, 461. [Google Scholar] [CrossRef]
- Pagliara, P.; Barca, A.; Verri, T.; Caroppo, C. The Marine Sponge Petrosia ficiformis Harbors Different Cyanobacteria Strains with Potential Biotechnological Application. J. Mar. Sci. Eng. 2020, 8, 638. [Google Scholar] [CrossRef]
- Wahlen, B.D.; Willis, R.M.; Seefeldt, L.C. Biodiesel production by simultaneous extraction and conversion of total lipids from microalgae, cyanobacteria, and wild mixed-cultures. Bioresour. Technol. 2011, 102, 2724–2730. [Google Scholar] [CrossRef] [PubMed]
- Janasch, M.; Asplund-Samuelsson, J.; Steuer, R.; Hudson, E.P. Kinetic modeling of the Calvin cycle identifies flux control and stable metabolomes in Synechocystis carbon fixation. J. Exp. Bot. 2018, 70, 973–983. [Google Scholar] [CrossRef]
- Kłodawska, K.; Kovács, L.; Vladkova, R.; Rzaska, A.; Gombos, Z.; Laczkó-Dobos, H.; Malec, P. Trimeric organization of photosystem I is required to maintain the balanced photosynthetic electron flow in cyanobacterium Synechocystis sp. PCC 6803. Photosynth. Res. 2020, 143, 251–262. [Google Scholar] [CrossRef]
- Cheregi, O.; Funk, C. Regulation of the scp Genes in the Cyanobacterium Synechocystis sp. PCC 6803—What is New? Molecules 2015, 20, 14621–14637. [Google Scholar] [CrossRef] [PubMed]
- Angermayr, S.A.; Hellingwerf, K.J.; Lindblad, P.; Teixeira De Mattos, M.J. Energy biotechnology with cyanobacteria. Curr. Opin. Biotechnol. 2009, 20, 257–263. [Google Scholar] [CrossRef]
- Hannon, M.; Gimpel, J.; Tran, M.; Rasala, B.; Mayfield, S. Biofuels from algae: Challenges and potential. Biofuels 2010, 1, 763–784. [Google Scholar] [CrossRef] [PubMed]
- Nozzi, N.E.; Oliver, J.W.K.; Atsumi, S. Cyanobacteria as a Platform for Biofuel Production. Front. Bioeng. Biotechnol. 2013, 1. [Google Scholar] [CrossRef]
- Sarsekeyeva, F.; Zayadan, B.K.; Usserbaeva, A.; Bedbenov, V.S.; Sinetova, M.A.; Los, D.A. Cyanofuels: Biofuels from cyanobacteria. Reality and perspectives. Photosynth. Res. 2015, 125, 329–340. [Google Scholar] [CrossRef]
- Ikeuchi, M.; Tabata, S. Synechocystissp. PCC 6803—A useful tool in the study of the genetics ofcyanobacteria. Photosynth. Res. 2001, 70, 73–83. [Google Scholar] [CrossRef]
- Wijffels, R.H.; Kruse, O.; Hellingwerf, K.J. Potential of industrial biotechnology with cyanobacteria and eukaryotic microalgae. Curr. Opin. Biotechnol. 2013, 24, 405–413. [Google Scholar] [CrossRef] [PubMed]
- Giner-Lamia, J.; López-Maury, L.; Florencio, F.J. Global Transcriptional Profiles of the Copper Responses in the Cyanobacterium Synechocystis sp. PCC 6803. PLoS ONE 2014, 9, e108912. [Google Scholar] [CrossRef] [PubMed]
- Giner-Lamia, J.; López-Maury, L.; Reyes, J.C.; Florencio, F.J. The CopRS Two-Component System Is Responsible for Resistance to Copper in the Cyanobacterium Synechocystis sp. PCC 6803. Plant Physiol. 2012, 159, 1806–1818. [Google Scholar] [CrossRef] [PubMed]
- Nagarajan, S.; Srivastava, S.; Sherman, L.A. Essential role of the plasmid hik31 operon in regulating central metabolism in the dark in Synechocystis sp. PCC 6803. Mol. Microbiol. 2014, 91, 79–97. [Google Scholar] [CrossRef]
- Ikeuchi, M. Complete genome sequence of a cyanobacterium Synechocystis sp. PCC 6803, the oxygenic photosynthetic prokaryote. Protein Nucleic Acid Enzyme 1996, 41, 2579–2583. [Google Scholar]
- Chen, Z.; Li, X.; Tan, X.; Zhang, Y.; Wang, B. Recent Advances in Biological functions of thick pili in the cyanobacterium synechocystis sp. PCC 6803. Front. Plant Sci. 2020, 11. [Google Scholar] [CrossRef]
- Liu, X.; Sheng, J.; Curtiss, R., III. Fatty acid production in genetically modified cyanobacteria. Proc. Natl. Acad. Sci. USA 2011, 108, 6899–6904. [Google Scholar] [CrossRef] [PubMed]
- Tan, X.; Yao, L.; Gao, Q.; Wang, W.; Qi, F.; Lu, X. Photosynthesis driven conversion of carbon dioxide to fatty alcohols and hydrocarbons in cyanobacteria. Metab. Eng. 2011, 13, 169–176. [Google Scholar] [CrossRef] [PubMed]
- Dexter, J.; Fu, P. Metabolic engineering of cyanobacteria for ethanol production. Energy Environ. Sci. 2009, 2, 857–864. [Google Scholar] [CrossRef]
- Lee, B.D.; Apel, W.A.; Walton, M.R. Screening of Cyanobacterial Species for Calcification. Biotechnol. Prog. 2004, 20, 1345–1351. [Google Scholar] [CrossRef] [PubMed]
- Tan, L.T. Bioactive natural products from marine cyanobacteria for drug discovery. Phytochemistry 2007, 68, 954–979. [Google Scholar] [CrossRef] [PubMed]
- Nunnery, J.K.; Mevers, E.; Gerwick, W.H. Biologically active secondary metabolites from marine cyanobacteria. Curr. Opin. Biotechnol. 2010, 21, 787–793. [Google Scholar] [CrossRef] [PubMed]
- Noh, Y.; Lee, H.; Hong, S.-J.; Lee, H.; Cho, B.-K.; Lee, C.-G.; Choi, H.-K. Comparative primary metabolic and lipidomic profiling of freshwater and marine synechocystis strains using by GC-MS and NanoESI-MS analyses. Biotechnol. Bioprocess Eng. 2020, 25, 308–319. [Google Scholar] [CrossRef]
- Herreros-Cabello, A.; Callejas-Hernández, F.; Fresno, M.; Gironès, N. Comparative proteomic analysis of trypomastigotes from Trypanosoma cruzi strains with different pathogenicity. Infect. Genet. Evol. 2019, 76, 104041. [Google Scholar] [CrossRef]
- Elhosseiny, N.M.; Elhezawy, N.B.; Attia, A.S. Comparative proteomics analyses of Acinetobacter baumannii strains ATCC 17978 and AB5075 reveal the differential role of type II secretion system secretomes in lung colonization and ciprofloxacin resistance. Microb. Pathog. 2019, 128, 20–27. [Google Scholar] [CrossRef]
- Battchikova, N.; Muth-Pawlak, D.; Aro, E.-M. Proteomics of cyanobacteria: Current horizons. Curr. Opin. Biotechnol. 2018, 54, 65–71. [Google Scholar] [CrossRef]
- Gao, L.; Wang, J.; Ge, H.; Fang, L.; Zhang, Y.; Huang, X.; Wang, Y. Toward the complete proteome of Synechocystis sp. PCC 6803. Photosynth. Res. 2015, 126, 203–219. [Google Scholar] [CrossRef] [PubMed]
- Huang, F.; Hedman, E.; Funk, C.; Kieselbach, T.; Schröder, W.P.; Norling, B. Isolation of Outer Membrane ofSynechocystissp. PCC 6803 and Its Proteomic Characterization. Mol. Cell. Proteom. 2004, 3, 586–595. [Google Scholar] [CrossRef] [PubMed]
- Slabas, A.R.; Suzuki, I.; Murata, N.; Simon, W.J.; Hall, J.J. Proteomic analysis of the heat shock response inSynechocystis PCC6803 and a thermally tolerant knockout strain lacking the histidine kinase 34 gene. Proteomics 2006, 6, 845–864. [Google Scholar] [CrossRef] [PubMed]
- Gao, Y.; Xiong, W.; Li, X.-B.; Gao, C.-F.; Zhang, Y.-L.; Li, H.; Wu, Q.-Y. Identification of the proteomic changes in Synechocystis sp. PCC 6803 following prolonged UV-B irradiation. J. Exp. Bot. 2009, 60, 1141–1154. [Google Scholar] [CrossRef] [PubMed]
- Rowland, J.G.; Simon, W.J.; Prakash, J.S.S.; Slabas, A.R. Proteomics reveals a role for the RNA helicase crhR in the modulation of multiple metabolic pathways during cold acclimation of synechocystis sp. PCC6803. J. Proteome Res. 2011, 10, 3674–3689. [Google Scholar] [CrossRef] [PubMed]
- Fulda, S.; Mikkat, S.; Huang, F.; Huckauf, J.; Marin, K.; Norling, B.; Hagemann, M. Proteome analysis of salt stress response in the cyanobacteriumSynechocystis sp. strain PCC 6803. Proteomics 2006, 6, 2733–2745. [Google Scholar] [CrossRef] [PubMed]
- Wegener, K.M.; Singh, A.K.; Jacobs, J.M.; Elvitigala, T.; Welsh, E.A.; Keren, N.; Gritsenko, M.A.; Ghosh, B.K.; Camp, D.G.; Smith, R.D.; et al. Global Proteomics Reveal an Atypical Strategy for Carbon/Nitrogen Assimilation by a Cyanobacterium Under Diverse Environmental Perturbations. Mol. Cell. Proteom. 2010, 9, 2678–2689. [Google Scholar] [CrossRef] [PubMed]
- Angeleri, M.; Muth-Pawlak, D.; Wilde, A.; Aro, E.-M.; Battchikova, N. Global proteome response of Synechocystis 6803 to extreme copper environments applied to control the activity of the inducible petJ promoter. J. Appl. Microbiol. 2019, 126, 826–841. [Google Scholar] [CrossRef]
- Spät, P.; Klotz, A.; Rexroth, S.; Maček, B.; Forchhammer, K. Chlorosis as a Developmental Program in Cyanobacteria: The Proteomic Fundament for Survival and Awakening. Mol. Cell. Proteom. 2018, 17, 1650–1669. [Google Scholar] [CrossRef]
- Baers, L.L.; Breckels, L.M.; Mills, L.A.; Gatto, L.; Deery, M.J.; Stevens, T.J.; Howe, C.J.; Lilley, K.S.; Lea-Smith, D.J. Proteome Mapping of a Cyanobacterium Reveals Distinct Compartment Organization and Cell-Dispersed Metabolism. Plant Physiol. 2019, 181, 1721–1738. [Google Scholar] [CrossRef]
- Cui, M.; Liu, Y.; Zhang, J. Sulfamethoxazole and tetracycline induced alterations in biomass, photosynthesis, lipid productivity, and proteomic expression of Synechocystis sp. PCC 6803. Environ. Sci. Pollut. Res. 2020, 27, 30437–30447. [Google Scholar] [CrossRef] [PubMed]
- Talamantes, T.; Ughy, B.; Domonkos, I.; Kis, M.; Gombos, Z.; Prokai, L. Label-free LC-MS/MS identification of phosphatidylglycerol-regulated proteins inSynechocystissp. PCC6803. Proteomics 2014, 14, 1053–1057. [Google Scholar] [CrossRef] [PubMed]
- Gao, L.; Ge, H.; Huang, X.; Liu, K.; Zhang, Y.; Xu, W.; Wang, Y. Systematically Ranking the Tightness of Membrane Association for Peripheral Membrane Proteins (PMPs). Mol. Cell. Proteom. 2015, 14, 340–353. [Google Scholar] [CrossRef] [PubMed]
- Qiao, J.; Wang, J.; Chen, L.; Tian, X.; Huang, S.; Ren, X.; Zhang, W. Quantitative iTRAQ LC–MS/MS Proteomics reveals metabolic responses to biofuel ethanol in cyanobacterial synechocystis sp. PCC 6803. J. Proteome Res. 2012, 11, 5286–5300. [Google Scholar] [CrossRef]
- Liu, J.; Chen, L.; Wang, J.; Qiao, J.; Zhang, W. Proteomic analysis reveals resistance mechanism against biofuel hexane in Synechocystis sp. PCC 6803. Biotechnol. Biofuels 2012, 5, 68. [Google Scholar] [CrossRef]
- Huang, S.; Chen, L.; Te, R.; Qiao, J.; Wang, J.; Zhang, W. Complementary iTRAQ proteomics and RNA-seq transcriptomics reveal multiple levels of regulation in response to nitrogen starvation in Synechocystis sp. PCC 6803. Mol. Biosyst. 2013, 9, 2565–2574. [Google Scholar] [CrossRef]
- Tian, X.; Chen, L.; Wang, J.; Qiao, J.; Zhang, W. Quantitative proteomics reveals dynamic responses of Synechocystis sp. PCC 6803 to next-generation biofuel butanol. J. Proteom. 2013, 78, 326–345. [Google Scholar] [CrossRef]
- Chen, L.; Wu, L.; Wang, J.; Zhang, W. Butanol tolerance regulated by a two-component response regulator Slr1037 in photosynthetic Synechocystis sp. PCC 6803. Biotechnol. Biofuels 2014, 7, 89. [Google Scholar] [CrossRef]
- Song, Z.; Chen, L.; Wang, J.; Lu, Y.; Jiang, W.; Zhang, W. A Transcriptional Regulator Sll0794 Regulates Tolerance to Biofuel Ethanol in PhotosyntheticSynechocystissp. PCC 6803. Mol. Cell. Proteom. 2014, 13, 3519–3532. [Google Scholar] [CrossRef]
- Krynická, V.; Georg, J.; Jackson, P.J.; Dickman, M.J.; Hunter, C.N.; Futschik, M.E.; Hess, W.R.; Komenda, J. Depletion of the FtsH1/3 Proteolytic complex suppresses the nutrient stress response in the cyanobacterium synechocystis sp strain PCC 6803. Plant Cell 2019, 31, 2912–2928. [Google Scholar] [CrossRef]
- Solymosi, D.; Nikkanen, L.; Muth-Pawlak, D.; Fitzpatrick, D.; Vasudevan, R.; Howe, C.J.; Lea-Smith, D.J.; Allahverdiyeva, Y. Cytochrome cM decreases photosynthesis under photomixotrophy in synechocystis sp. PCC 6803. Plant Physiol. 2020, 183, 700–716. [Google Scholar] [CrossRef] [PubMed]
- Toyoshima, M.; Tokumaru, Y.; Matsuda, F.; Shimizu, H. Assessment of protein content and phosphorylation level in synechocystis sp. PCC 6803 under various growth conditions using quantitative phosphoproteomic analysis. Molecules 2020, 25, 3582. [Google Scholar] [CrossRef] [PubMed]
- Svensson, M.; Borén, M.; Sköld, K.; Fälth, M.; Sjögren, B.; Andersson, M.; Svenningsson, P.; Andrén, P.E. Heat stabilization of the tissue proteome: A new technology for improved proteomics. J. Proteome Res. 2009, 8, 974–981. [Google Scholar] [CrossRef] [PubMed]
- Van-An, D.; Jeeyun, A.; Na-Young, H.; Jong-Moon, P.; Jeong-Hun, M.; Tae Wan, K.; Hookeun, L. Proteomic Analysis of the vitreous body in proliferative and non-proliferative diabetic retinopathy. Curr. Proteom. 2020, 17. [Google Scholar] [CrossRef]
- Yun, G.; Park, J.-M.; Duong, V.-A.; Mok, J.-H.; Jeon, J.; Nam, O.; Lee, J.; Jin, E.; Lee, H. Proteomic profiling of emiliania huxleyi using a three-dimensional separation method combined with tandem mass spectrometry. Molecules 2020, 25, 3028. [Google Scholar] [CrossRef] [PubMed]
- Dwivedi, R.C.; Spicer, V.; Harder, M.; Antonovici, M.; Ens, W.; Standing, K.G.; Wilkins, J.A.; Krokhin, O.V. Practical implementation of 2D HPLC scheme with accurate peptide retention prediction in both dimensions for high-throughput bottom-up proteomics. Anal. Chem. 2008, 80, 7036–7042. [Google Scholar] [CrossRef]
- Perez-Riverol, Y.; Csordas, A.; Bai, J.; Bernal-Llinares, M.; Hewapathirana, S.; Kundu, D.J.; Inuganti, A.; Griss, J.; Mayer, G.; Eisenacher, M.; et al. The PRIDE database and related tools and resources in 2019: Improving support for quantification data. Nucleic Acids Res. 2018, 47, D442–D450. [Google Scholar] [CrossRef]
- Eng, J.K.; Jahan, T.A.; Hoopmann, M.R. Comet: An open-source MS/MS sequence database search tool. Proteomics 2013, 13, 22–24. [Google Scholar] [CrossRef]
- Deutsch, E.W.; Mendoza, L.; Shteynberg, D.; Slagel, J.; Sun, Z.; Moritz, R.L. Trans-Proteomic Pipeline, a standardized data processing pipeline for large-scale reproducible proteomics informatics. Proteom. Clin. Appl. 2015, 9, 745–754. [Google Scholar] [CrossRef]
- Keller, A.; Nesvizhskii, A.I.; Kolker, E.; Aebersold, R. Empirical Statistical Model To Estimate the Accuracy of Peptide Identifications Made by MS/MS and Database Search. Anal. Chem. 2002, 74, 5383–5392. [Google Scholar] [CrossRef]
- Nesvizhskii, A.I.; Keller, A.; Kolker, E.; Aebersold, R. A Statistical model for identifying proteins by tandem mass spectrometry. Anal. Chem. 2003, 75, 4646–4658. [Google Scholar] [CrossRef] [PubMed]
- Pino, L.K.; Searle, B.C.; Bollinger, J.G.; Nunn, B.; MacLean, B.; MacCoss, M.J. The Skyline ecosystem: Informatics for quantitative mass spectrometry proteomics. Mass Spectrom. Rev. 2020, 39, 229–244. [Google Scholar] [CrossRef] [PubMed]
- Jong-Moon, P.; Van-An, D.; Jeong-Hun, M.; Doo-Jin, C.; Hookeun, L. A Quantitative Proteomic Analysis to Reveal Effects of N-acetylcysteine on H2O2-induced Cytotoxicity. Curr. Proteom. 2020, 17, 1–13. [Google Scholar] [CrossRef]
- Choi, M.; Chang, C.-Y.; Clough, T.; Broudy, D.; Killeen, T.; MacLean, B.; Vitek, O. MSstats: An R package for statistical analysis of quantitative mass spectrometry-based proteomic experiments. Bioinformatics 2014, 30, 2524–2526. [Google Scholar] [CrossRef] [PubMed]
- Ashburner, M.; Ball, C.A.; Blake, J.A.; Botstein, D.; Butler, H.; Cherry, J.M.; Davis, A.P.; Dolinski, K.; Dwight, S.S.; Eppig, J.T.; et al. Gene Ontology: Tool for the unification of biology. Nat. Genet. 2000, 25, 25–29. [Google Scholar] [CrossRef]
- Kanehisa, M.; Goto, S.; Kawashima, S.; Nakaya, A. The KEGG databases at GenomeNet. Nucleic Acids Res. 2002, 30, 42–46. [Google Scholar] [CrossRef]
- Szklarczyk, D.; Gable, A.L.; Lyon, D.; Junge, A.; Wyder, S.; Huerta-Cepas, J.; Simonovic, M.; Doncheva, N.T.; Morris, J.H.; Bork, P.; et al. STRING v11: Protein–protein association networks with increased coverage, supporting functional discovery in genome-wide experimental datasets. Nucleic Acids Res. 2018, 47, D607–D613. [Google Scholar] [CrossRef]
- Tiwary, S.; Levy, R.; Gutenbrunner, P.; Salinas Soto, F.; Palaniappan, K.K.; Deming, L.; Berndl, M.; Brant, A.; Cimermancic, P.; Cox, J. High-quality MS/MS spectrum prediction for data-dependent and data-independent acquisition data analysis. Nat. Methods 2019, 16, 519–525. [Google Scholar] [CrossRef]
- Duong, V.-A.; Park, J.-M.; Lee, H. Review of three-dimensional liquid chromatography platforms for bottom-up proteomics. Int. J. Mol. Sci. 2020, 21, 1524. [Google Scholar] [CrossRef]
- Yang, F.; Shen, Y.; Camp, D.G.; Smith, R.D. High-pH reversed-phase chromatography with fraction concatenation for 2D proteomic analysis. Expert Rev. Proteom. 2012, 9, 129–134. [Google Scholar] [CrossRef]
- Chen, D.; Shen, X.; Sun, L. Strong cation exchange-reversed phase liquid chromatography-capillary zone electrophoresis-tandem mass spectrometry platform with high peak capacity for deep bottom-up proteomics. Anal. Chim. Acta 2018, 1012, 1–9. [Google Scholar] [CrossRef] [PubMed]
- Hu, A.; Noble, W.S.; Wolf-Yadlin, A. Technical advances in proteomics: New developments in data-independent acquisition. F1000Research 2016, 5, 419. [Google Scholar] [CrossRef] [PubMed]
- Hagemann, M. Molecular biology of cyanobacterial salt acclimation. FEMS Microbiol. Rev. 2011, 35, 87–123. [Google Scholar] [CrossRef] [PubMed]
- Nanatani, K.; Shijuku, T.; Takano, Y.; Zulkifli, L.; Yamazaki, T.; Tominaga, A.; Souma, S.; Onai, K.; Morishita, M.; Ishiura, M.; et al. Comparative analysis of kdp and ktr mutants reveals distinct roles of the potassium transporters in the model cyanobacterium Synechocystis sp. strain PCC 6803. J. Bacteriol. 2015, 197, 676–687. [Google Scholar] [CrossRef] [PubMed]
- Morrissey, J.; Bowler, C. Iron utilization in marine cyanobacteria and eukaryotic algae. Front. Microbiol. 2012, 3. [Google Scholar] [CrossRef] [PubMed]
- Marin, K.; Kanesaki, Y.; Los, D.A.; Murata, N.; Suzuki, I.; Hagemann, M. Gene Expression Profiling Reflects Physiological Processes in Salt Acclimation of Synechocystis sp. Strain PCC 6803. Plant Physiol. 2004, 136, 3290–3300. [Google Scholar] [CrossRef]
- Kanesaki, Y.; Suzuki, I.; Allakhverdiev, S.I.; Mikami, K.; Murata, N. Salt Stress and Hyperosmotic Stress Regulate the Expression of Different Sets of Genes in Synechocystis sp. PCC 6803. Biochem. Biophys. Res. Commun. 2002, 290, 339–348. [Google Scholar] [CrossRef]
- Lee, R.E. Phycology; Cambridge University Press: New York, NY, USA, 2012; pp. 33–80. [Google Scholar]
- Kobayashi, M.; Takatani, N.; Tanigawa, M.; Omata, T. Posttranslational Regulation of Nitrate Assimilation in the Cyanobacterium Synechocystis sp. Strain PCC 6803. J. Bacteriol. 2005, 187, 498–506. [Google Scholar] [CrossRef]
- Maeda, S.I.; Omata, T. Substrate-binding Lipoprotein of the Cyanobacterium Synechococcus sp. Strain PCC 7942 Involved in the Transport of Nitrate and Nitrite. J. Biol. Chem. 1997, 272, 3036–3041. [Google Scholar] [CrossRef]
- Herrero, A.; Muro-Pastor, A.M.; Flores, E. Nitrogen Control in Cyanobacteria. J. Bacteriol. 2001, 183, 411–425. [Google Scholar] [CrossRef]
- Valladares, A.; Montesinos, M.L.; Herrero, A.; Flores, E. An ABC-type, high-affinity urea permease identified in cyanobacteria. Mol. Microbiol. 2002, 43, 703–715. [Google Scholar] [CrossRef] [PubMed]
- Collier, J.L.; Brahamsha, B.; Palenik, B. The marine cyanobacterium Synechococcus sp. WH7805 requires urease (urea amiohydrolase, EC 3.5.1.5) to utilize urea as a nitrogen source: Molecular-genetic and biochemical analysis of the enzyme. Microbiology 1999, 145, 447–459. [Google Scholar] [CrossRef] [PubMed]
- Moore, L.R.; Post, A.F.; Rocap, G.; Chisholm, S.W. Utilization of different nitrogen sources by the marine cyanobacteriaProchlorococcusandSynechococcus. Limnol. Oceanogr. 2002, 47, 989–996. [Google Scholar] [CrossRef]
- Maurino, V.G.; Peterhansel, C. Photorespiration: Current status and approaches for metabolic engineering. Curr. Opin. Plant Biol. 2010, 13, 248–255. [Google Scholar] [CrossRef] [PubMed]
- Hagemann, M.; Vinnemeier, J.; Oberpichler, I.; Boldt, R.; Bauwe, H. The Glycine Decarboxylase Complex is not Essential for the Cyanobacterium Synechocystis sp. Strain PCC 6803. Plant Biol. 2005, 7, 15–22. [Google Scholar] [CrossRef]
- Christensen, K.E.; Mackenzie, R.E. Mitochondrial one-carbon metabolism is adapted to the specific needs of yeast, plants and mammals. Bioessays 2006, 28, 595–605. [Google Scholar] [CrossRef]
- Blackwell, R.D.; Murray, A.J.; Lea, P.J.; Kendall, A.C.; Hall, N.P.; Turner, J.C.; Wallsgrove, R.M. The value of mutants unable to carry out photorespiration. Photosynth. Res. 1988, 16, 155–176. [Google Scholar] [CrossRef]
- Timm, S.; Florian, A.; Arrivault, S.; Stitt, M.; Fernie, A.R.; Bauwe, H. Glycine decarboxylase controls photosynthesis and plant growth. FEBS Lett. 2012, 586, 3692–3697. [Google Scholar] [CrossRef]
- Igamberdiev, A.U.; Bykova, N.V.; Lea, P.J.; Gardestrom, P. The role of photorespiration in redox and energy balance of photosynthetic plant cells: A study with a barley mutant deficient in glycine decarboxylase. Physiol. Plant. 2001, 111, 427–438. [Google Scholar] [CrossRef]
- Yancey, P.; Clark, M.; Hand, S.; Bowlus, R.; Somero, G. Living with water stress: Evolution of osmolyte systems. Science 1982, 217, 1214–1222. [Google Scholar] [CrossRef]


| GO Term | Description | p-Value |
|---|---|---|
| Down-Regulated Proteins | ||
| Biological Process | ||
| GO:0008152 | Metabolic process | 1.31 × 10⁻⁶ |
| GO:0071704 | Organic substance metabolic process | 2.29 × 10⁻³ |
| GO:0009987 | Cellular process | 1.26 × 10⁻³ |
| GO:0044237 | Cellular metabolic process | 1.21 × 10⁻² |
| Cellular Component | ||
| GO:0030094 | Plasma membrane-derived photosystem I | 3.54 × 10⁻² |
| GO:0005737 | Cytoplasm | 4.83 × 10⁻² |
| GO:0044424 | Intracellular part | 1.93 × 10⁻² |
| Molecular Function | ||
| GO:0016462 | Pyrophosphatase activity | 4.54 × 10⁻² |
| GO:0046872 | Metal ion binding | 3.15 × 10⁻² |
| GO:0043168 | Anion binding | 6.92 × 10⁻³ |
| GO:0000166 | Nucleotide binding | 2.00 × 10⁻² |
| GO:0036094 | Small molecule binding | 1.41 × 10⁻² |
| GO:0003824 | Catalytic activity | 1.28 × 10⁻⁷ |
| Up-Regulated Proteins | ||
| Biological Process | ||
| GO:0044238 | Primary metabolic process | 4.06 × 10⁻² |
| Cellular Component | ||
| GO:0005737 | Cytoplasm | 4.58 × 10⁻² |
| GO:0005623 | Cell | 2.52 × 10⁻² |
| KEGG Pathway | Locus Name | Gene Name | Protein Description | log2FC | Adjusted p-Value |
|---|---|---|---|---|---|
| Photosynthesis | slr1834 | psaA | Photosystem I P700 chlorophyll a apoprotein A1 | −1.761 | 1.90 × 10⁻⁷ |
| slr1835 | psaB | Photosystem I P700 chlorophyll a apoprotein A2 | −1.592 | 1.79 × 10⁻⁸ | |
| slr0737 | psaD | Photosystem I reaction center subunit II | −2.287 | 6.07 × 10⁻⁷ | |
| sll0819 | psaF | Photosystem I reaction center subunit III | −0.263 | 4.43 × 10⁻³ | |
| slr1655 | psaL | Photosystem I reaction center subunit XI | −1.816 | 4.14 × 10⁻⁷ | |
| sll0247 | isiA | Iron stress-induced chlorophyll-binding protein | 7.719 | 2.43 × 10⁻⁵ | |
| ATP-binding cassette (ABC) transporters | sll1451 | nrtB | Nitrate transport protein | −1.527 | 2.41 × 10⁻³ |
| sll1452 | nrtC | Nitrate transport protein | −2.396 | 2.44 × 10⁻² | |
| slr0513 | sfuA | Iron (III) transport system substrate-binding protein | 5.747 | 8.82 × 10⁻⁴ | |
| slr1295 | 3.228 | 1.17 × 10⁻⁶ | |||
| slr1201 | urtC | Urea transport system permease protein | −3.068 | 2.38 × 10⁻³ | |
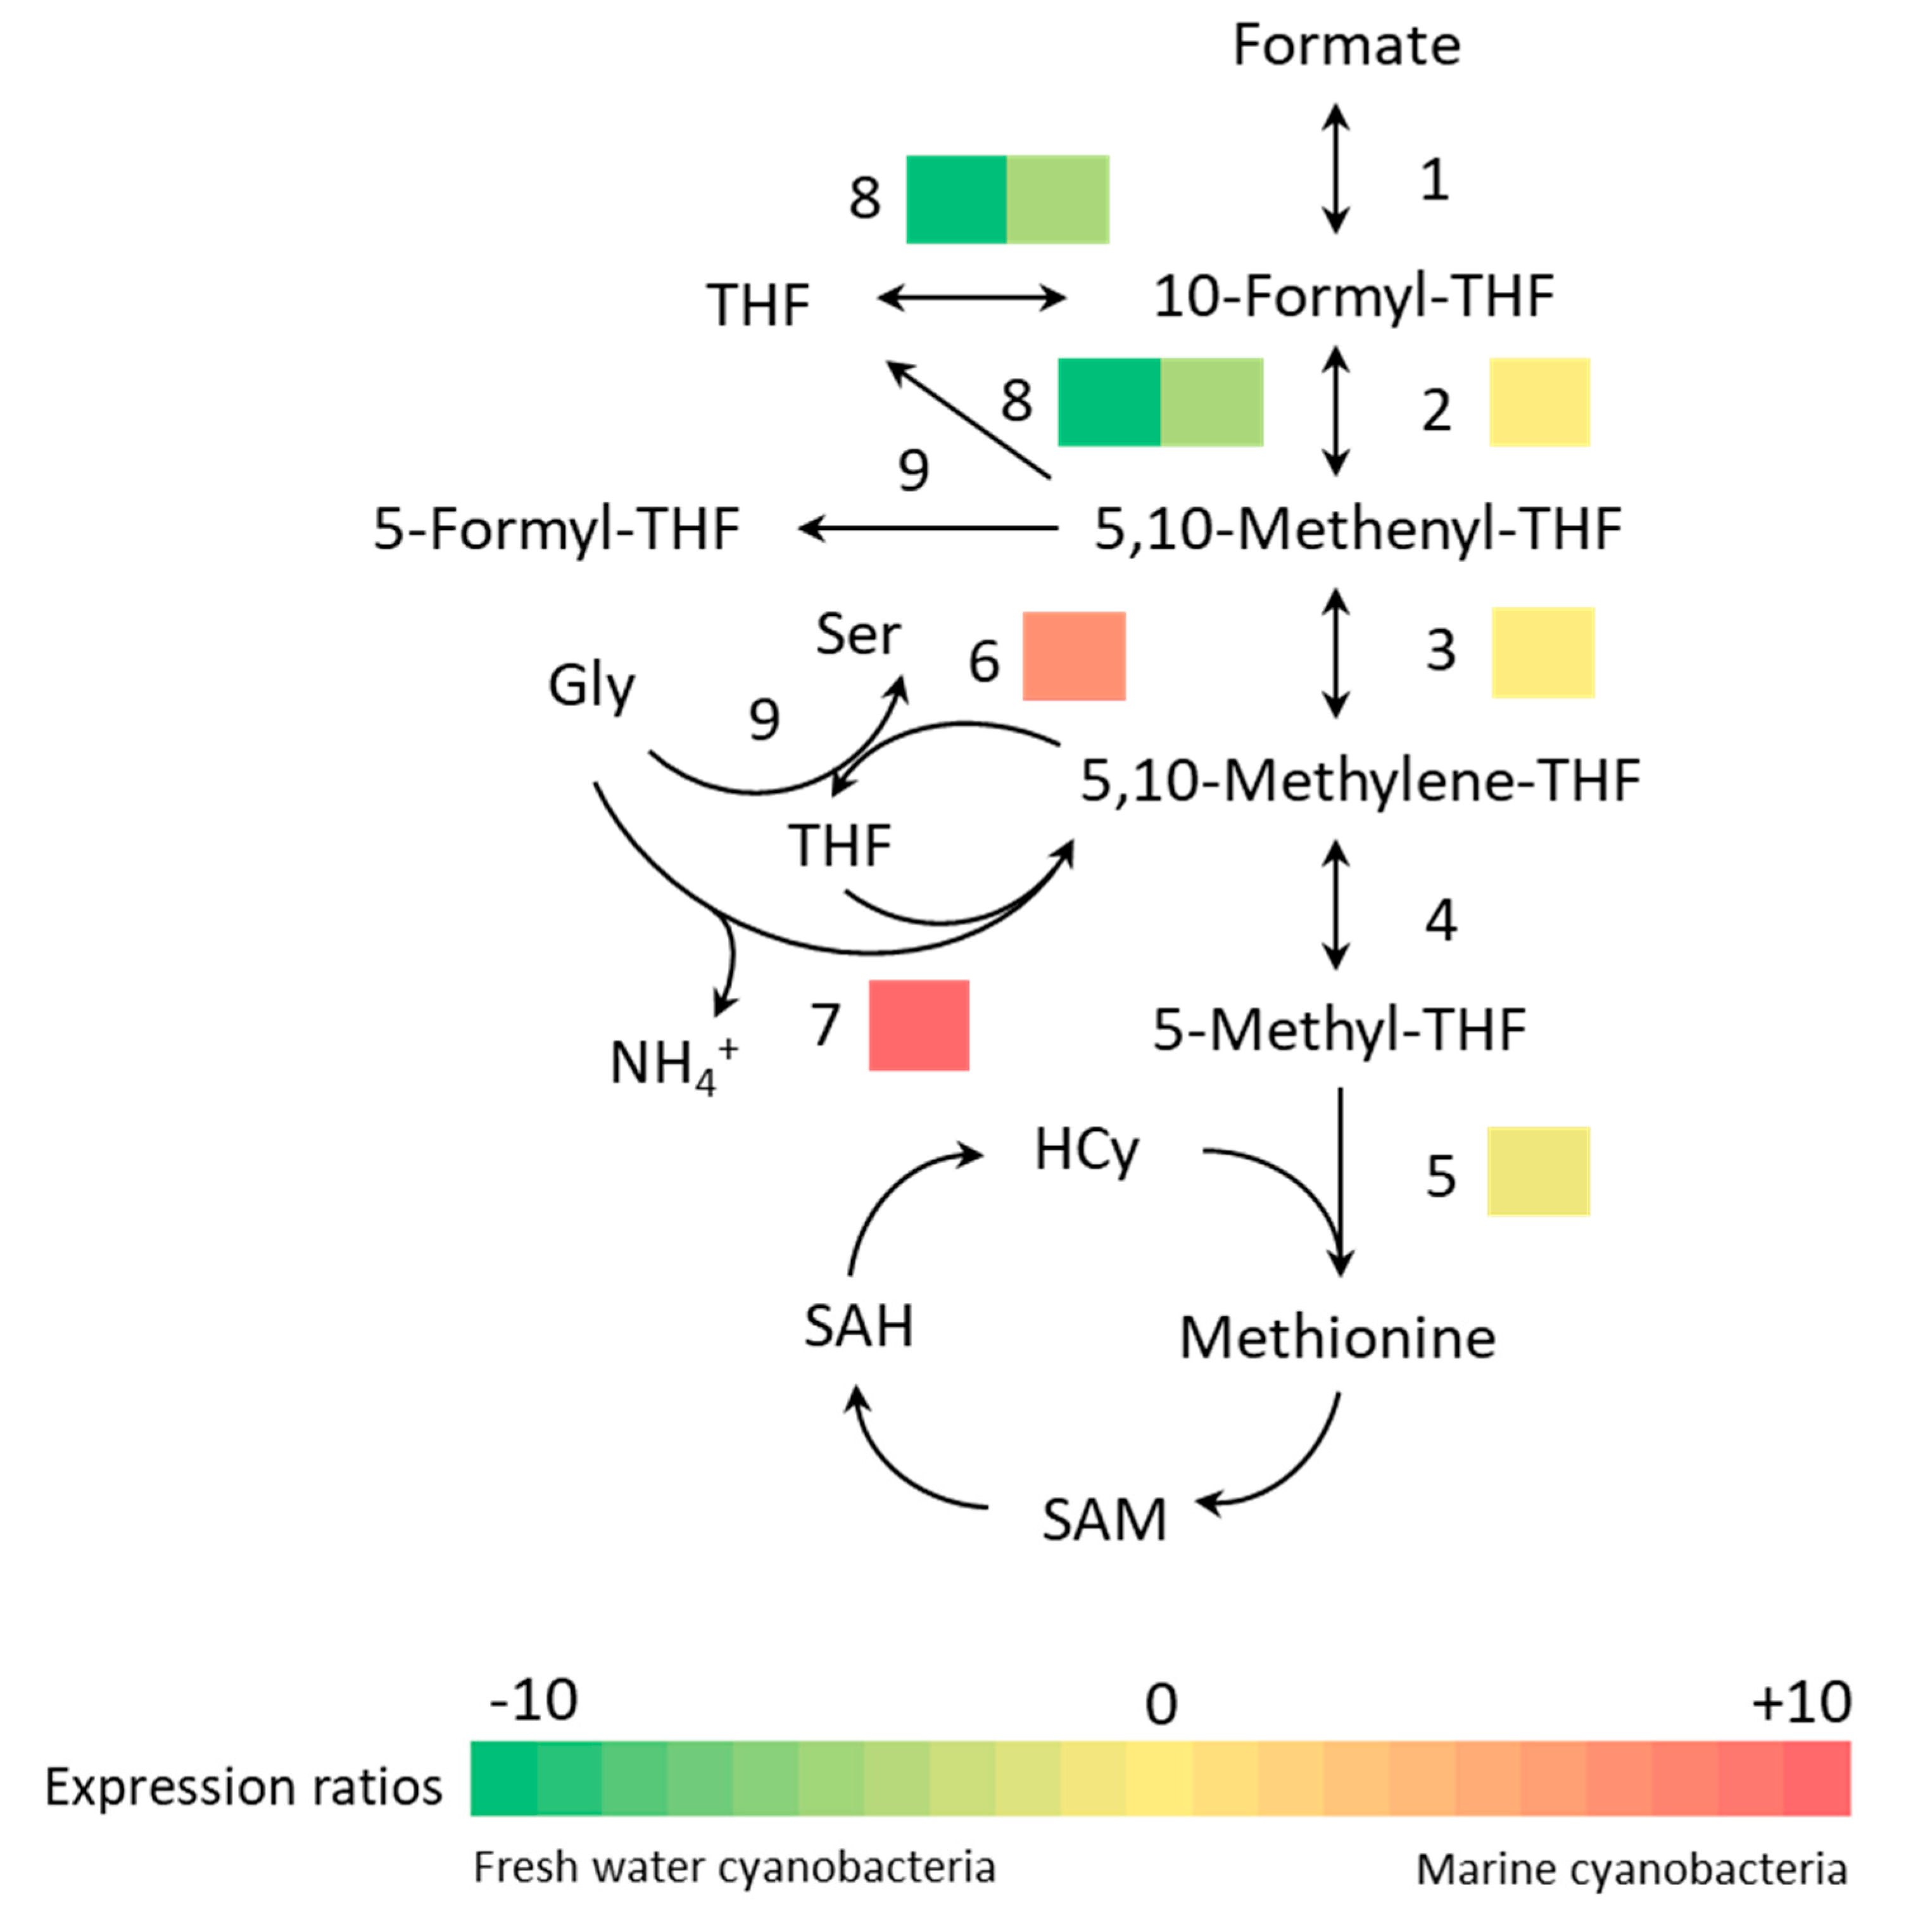
| One carbon pool by folate | sll0753 | folD | Bifunctional NADP-dependent methylene tetrahydrofolate cyclohydrolase/dehydrogenase | −1.271 | 3.12 × 10⁻² |
| slr0212 | metH | Methionine synthase | −2.040 | 3.24 × 10⁻² | |
| sll1635 | thyX | Thymidylate synthase | 3.642 | 2.41 × 10⁻³ | |
| sll0171 | gcvT | Aminomethyltransferase | 9.540 | 1.25 × 10⁻⁴ | |
| slr0861 | purT | Hosphoribosylamine-glycine ligase | −7.698 | 6.82 × 10⁻⁶ | |
| slr0477 | purN | −4.239 | 1.23 × 10⁻² |
© 2020 by the authors. Licensee MDPI, Basel, Switzerland. This article is an open access article distributed under the terms and conditions of the Creative Commons Attribution (CC BY) license (http://creativecommons.org/licenses/by/4.0/).
Share and Cite
Kwon, D.; Park, J.-M.; Duong, V.-A.; Hong, S.-J.; Cho, B.-K.; Lee, C.-G.; Choi, H.-K.; Kim, D.-M.; Lee, H. Comparative Proteomic Profiling of Marine and Freshwater Synechocystis Strains Using Liquid Chromatography-Tandem Mass Spectrometry. J. Mar. Sci. Eng. 2020, 8, 790. https://doi.org/10.3390/jmse8100790
Kwon D, Park J-M, Duong V-A, Hong S-J, Cho B-K, Lee C-G, Choi H-K, Kim D-M, Lee H. Comparative Proteomic Profiling of Marine and Freshwater Synechocystis Strains Using Liquid Chromatography-Tandem Mass Spectrometry. Journal of Marine Science and Engineering. 2020; 8(10):790. https://doi.org/10.3390/jmse8100790
Chicago/Turabian StyleKwon, Dami, Jong-Moon Park, Van-An Duong, Seong-Joo Hong, Byung-Kwan Cho, Choul-Gyun Lee, Hyung-Kyoon Choi, Dong-Myung Kim, and Hookeun Lee. 2020. "Comparative Proteomic Profiling of Marine and Freshwater Synechocystis Strains Using Liquid Chromatography-Tandem Mass Spectrometry" Journal of Marine Science and Engineering 8, no. 10: 790. https://doi.org/10.3390/jmse8100790
APA StyleKwon, D., Park, J.-M., Duong, V.-A., Hong, S.-J., Cho, B.-K., Lee, C.-G., Choi, H.-K., Kim, D.-M., & Lee, H. (2020). Comparative Proteomic Profiling of Marine and Freshwater Synechocystis Strains Using Liquid Chromatography-Tandem Mass Spectrometry. Journal of Marine Science and Engineering, 8(10), 790. https://doi.org/10.3390/jmse8100790