Economic Feasibility of Floating Offshore Wind Farms in the North of Spain

 ,
, 

Abstract
1. Introduction
2. Methodology
2.1. Procedure
- Geographic phase.
- Economic phase.
- Restrictions phase.
2.2. Geographic Phase
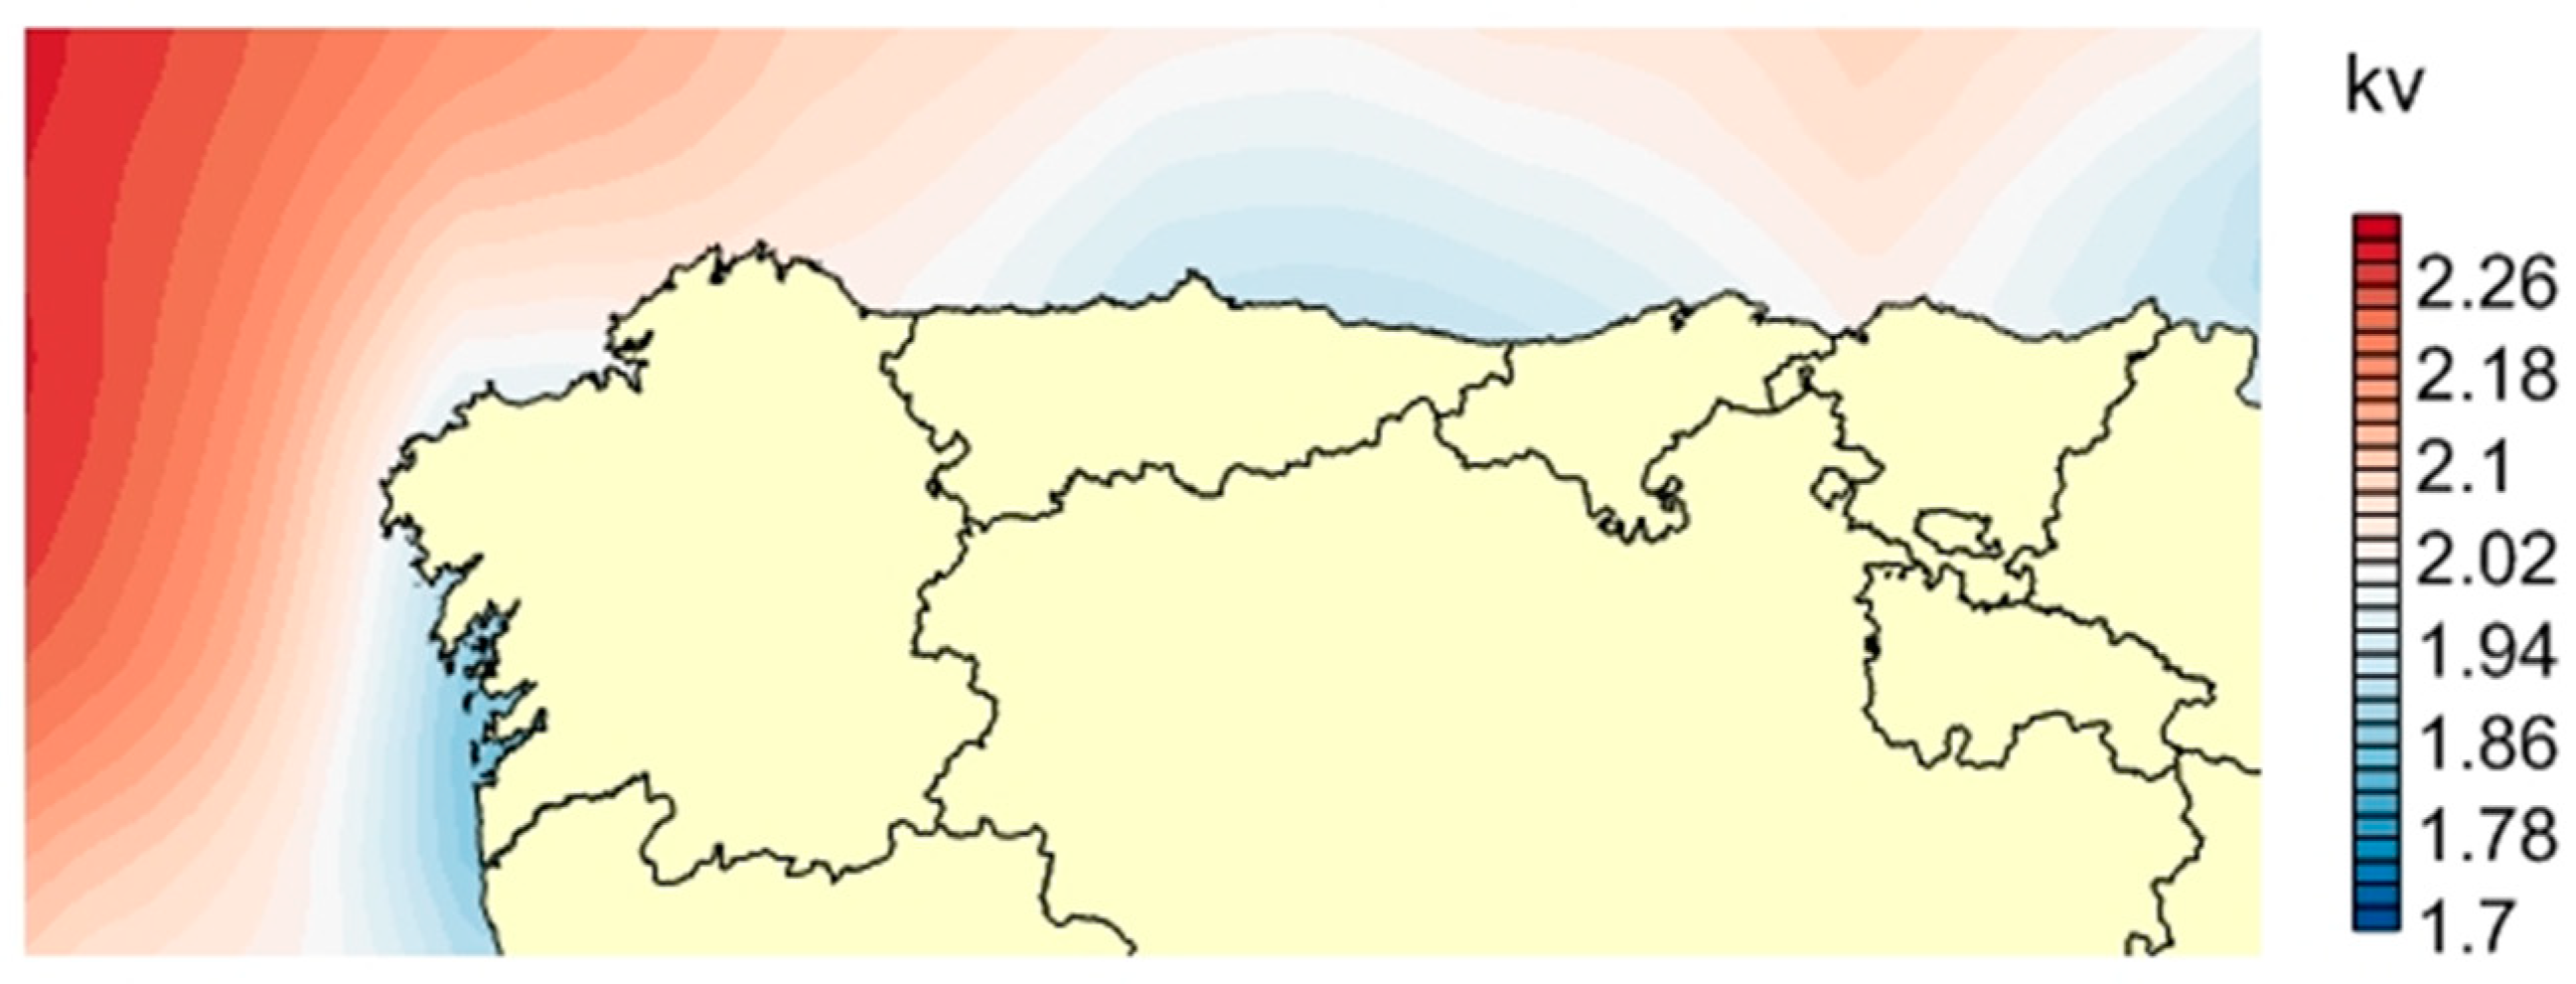
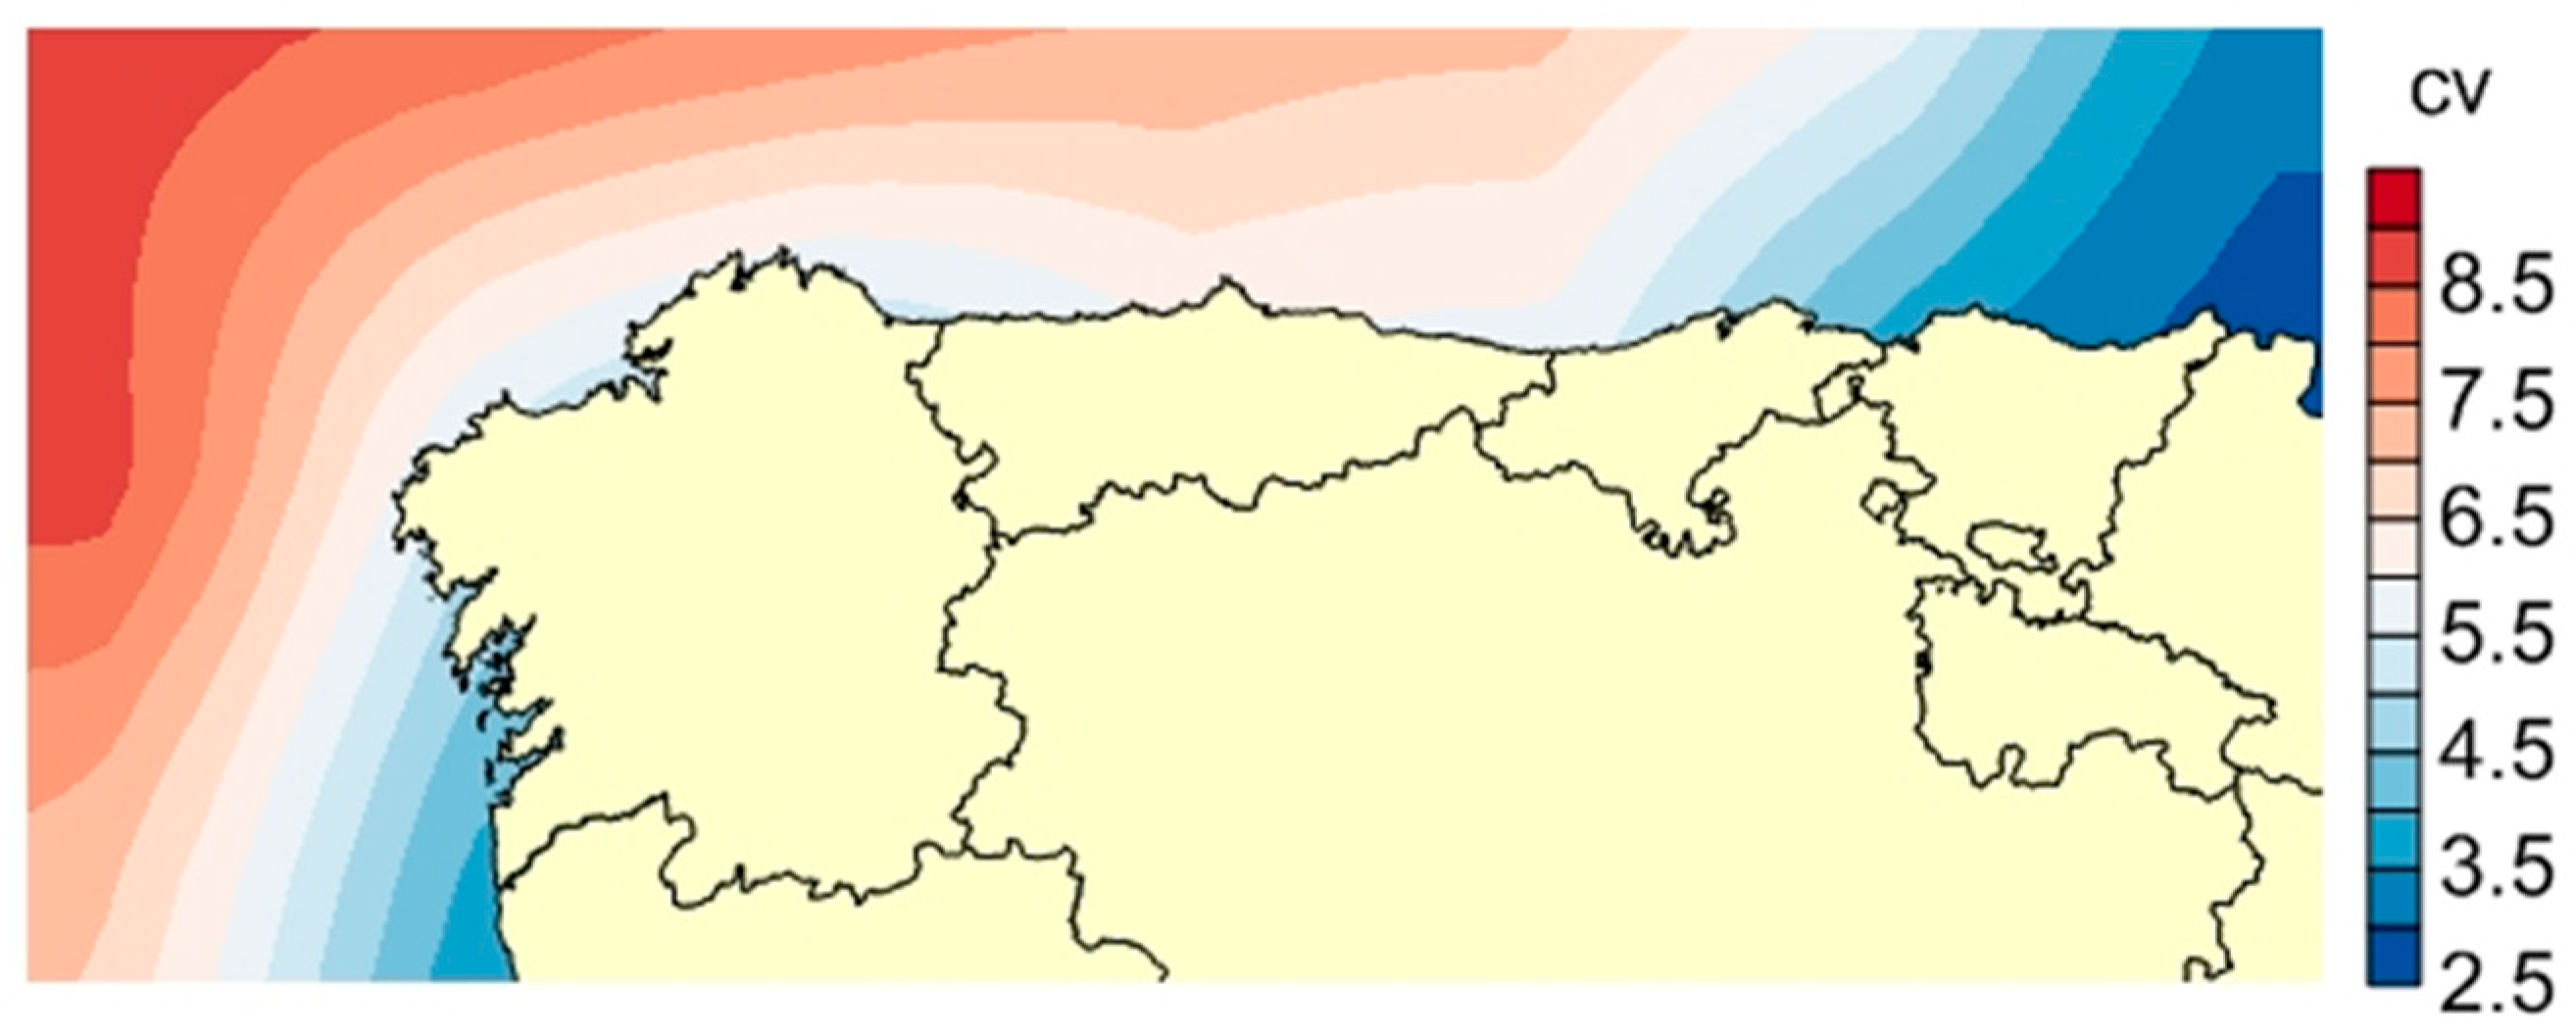
- The shape and scale parameters of the wind were set after having fitted a Weibull distribution to 10 years of wind data (2000–2010), extracted from the ERA-Interim hindcast database, created by the ECMWF (European Centre For Medium Weather Forecast). Weibull distribution is the most common distribution considered for wind resource modelling. The Weibull distribution obeys the following mathematical expression:in which a is the shape parameter and b is the scale parameter.
- The significant wave height (Hs) and the mean wave period (Tm) were calculated using the wave model SWAN, which is a third generation spectral model that simulates the wave transformation nearshore, based on wind data, boundary conditions, and bathymetry information [42]. It is one of the most common models usually considered to obtain wave data. It outputs spectral as well as statistical data about the wave climate. These two parameters, Hs and Tm, are calculated according to the following equations:in which:
- : variance density spectrum.
- : absolute radian frequency, calculated considering the doppler shifted dispersion relation.
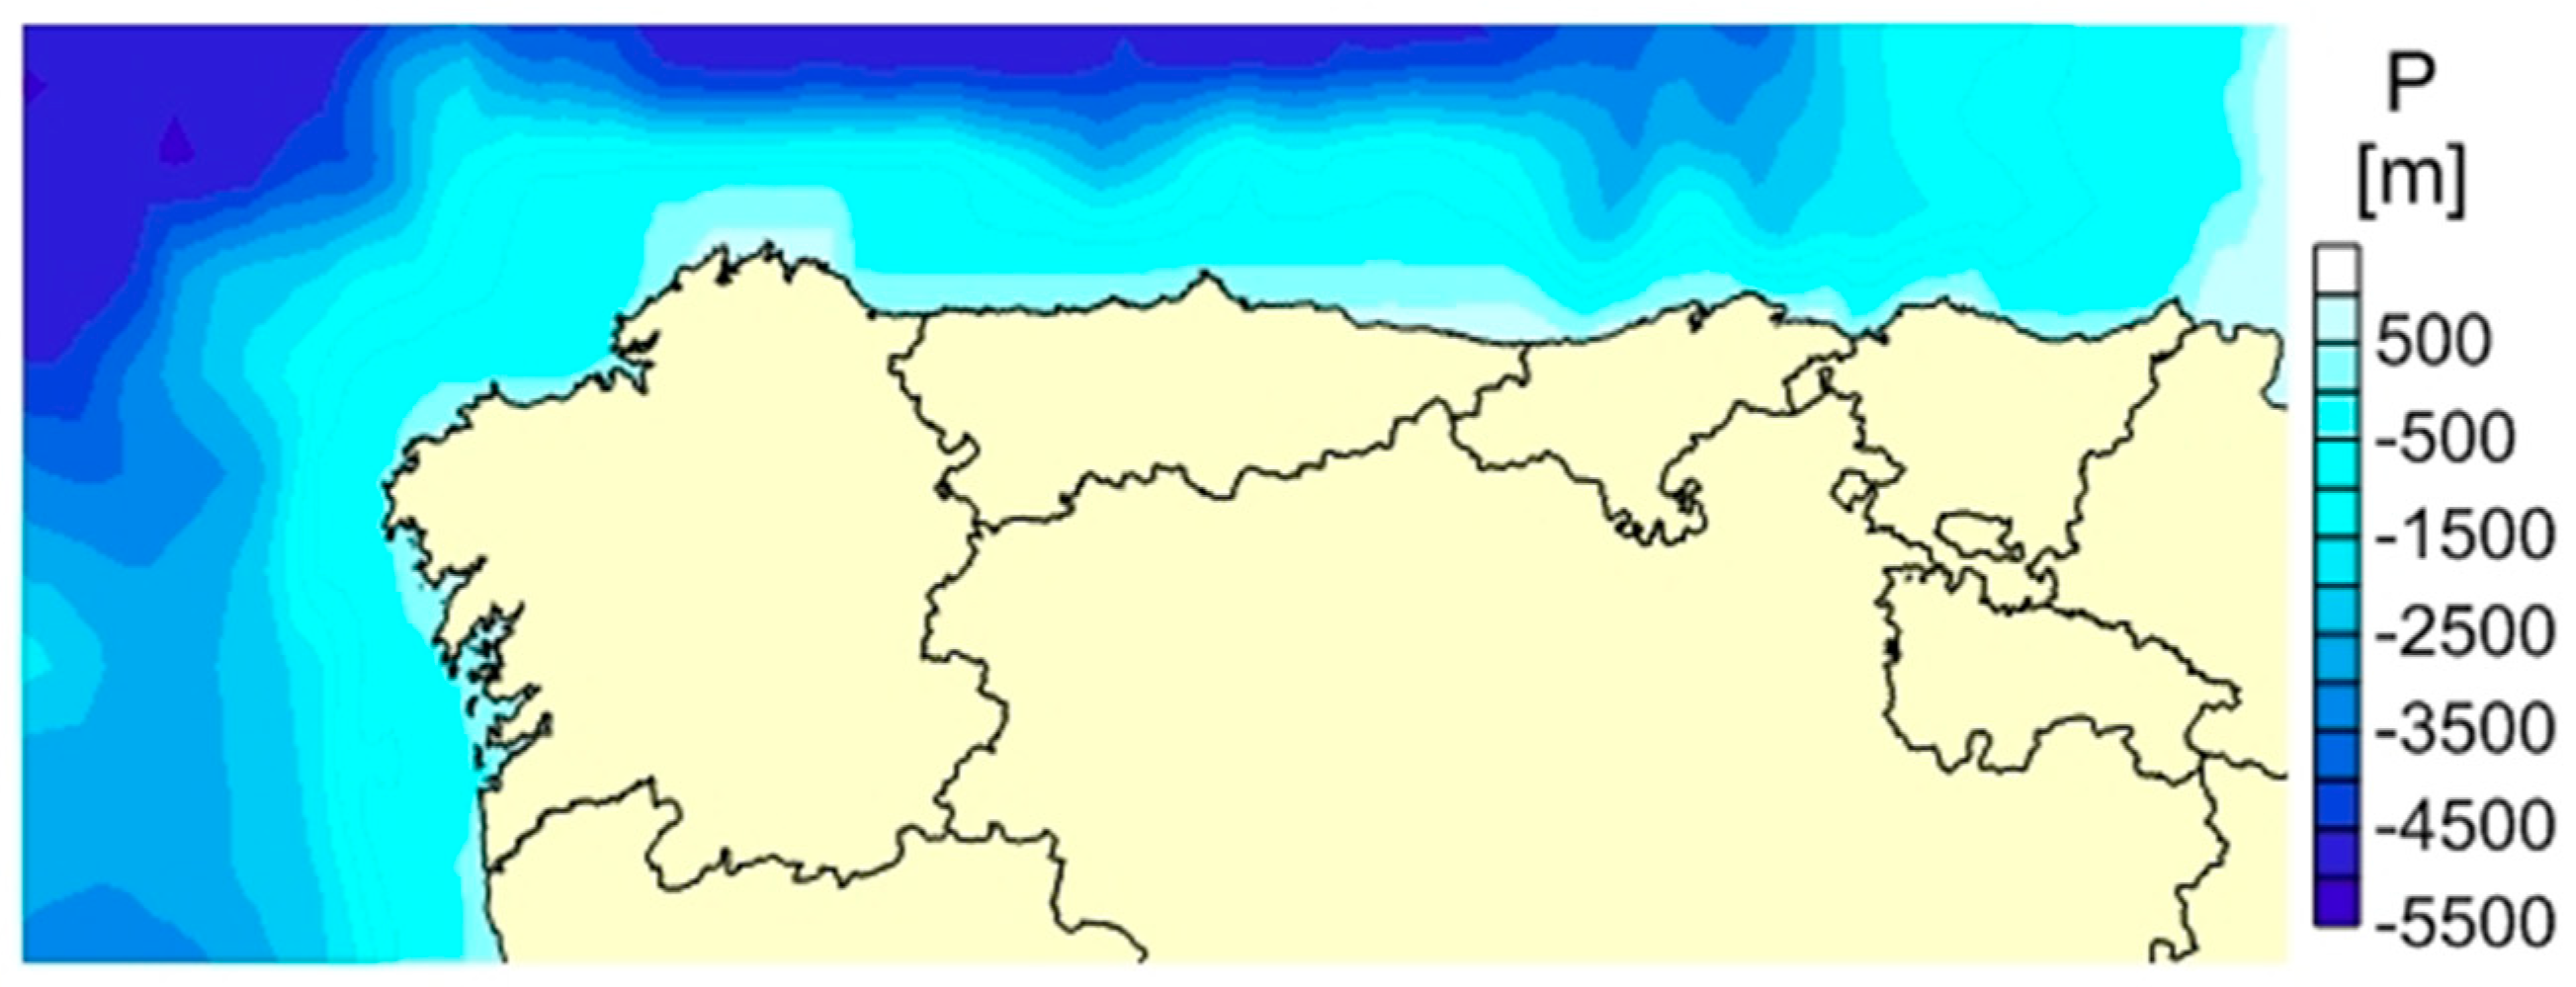
- The bathymetry was taken from GEBCO (General Bathymetric Chart of the Oceans) with a resolution of 0.0083° × 0.0083°. This resolution was afterward interpolated for the simulations with the wave model for computational purposes. The implemented resolution was 0.05° × 0.1°. Afterward, for the feasibility study, the bathymetry was then interpolated to a resolution of 16 km × 33 km.
2.3. Economic Phase
- : cash flow on year t.
- : expenses on year t. It considers the exploitation costs (C5) during all the operation years of the project.
- : revenues on year t based on the incomes obtained from the sale of electricity and dependent on the country.
- : life cycle years (20 years).
- : initial investment. It considers the C1, C2, C3, and C4 during the years of constructing the farm, and C6 during the last year of its life cycle.
- : discount rate (8%)
- : total equity.
- : cost of equity (8%).
- : debt.
- : interest rate (5%,24%).
- : tax shield (1–25%).
2.4. Restrictions Phase
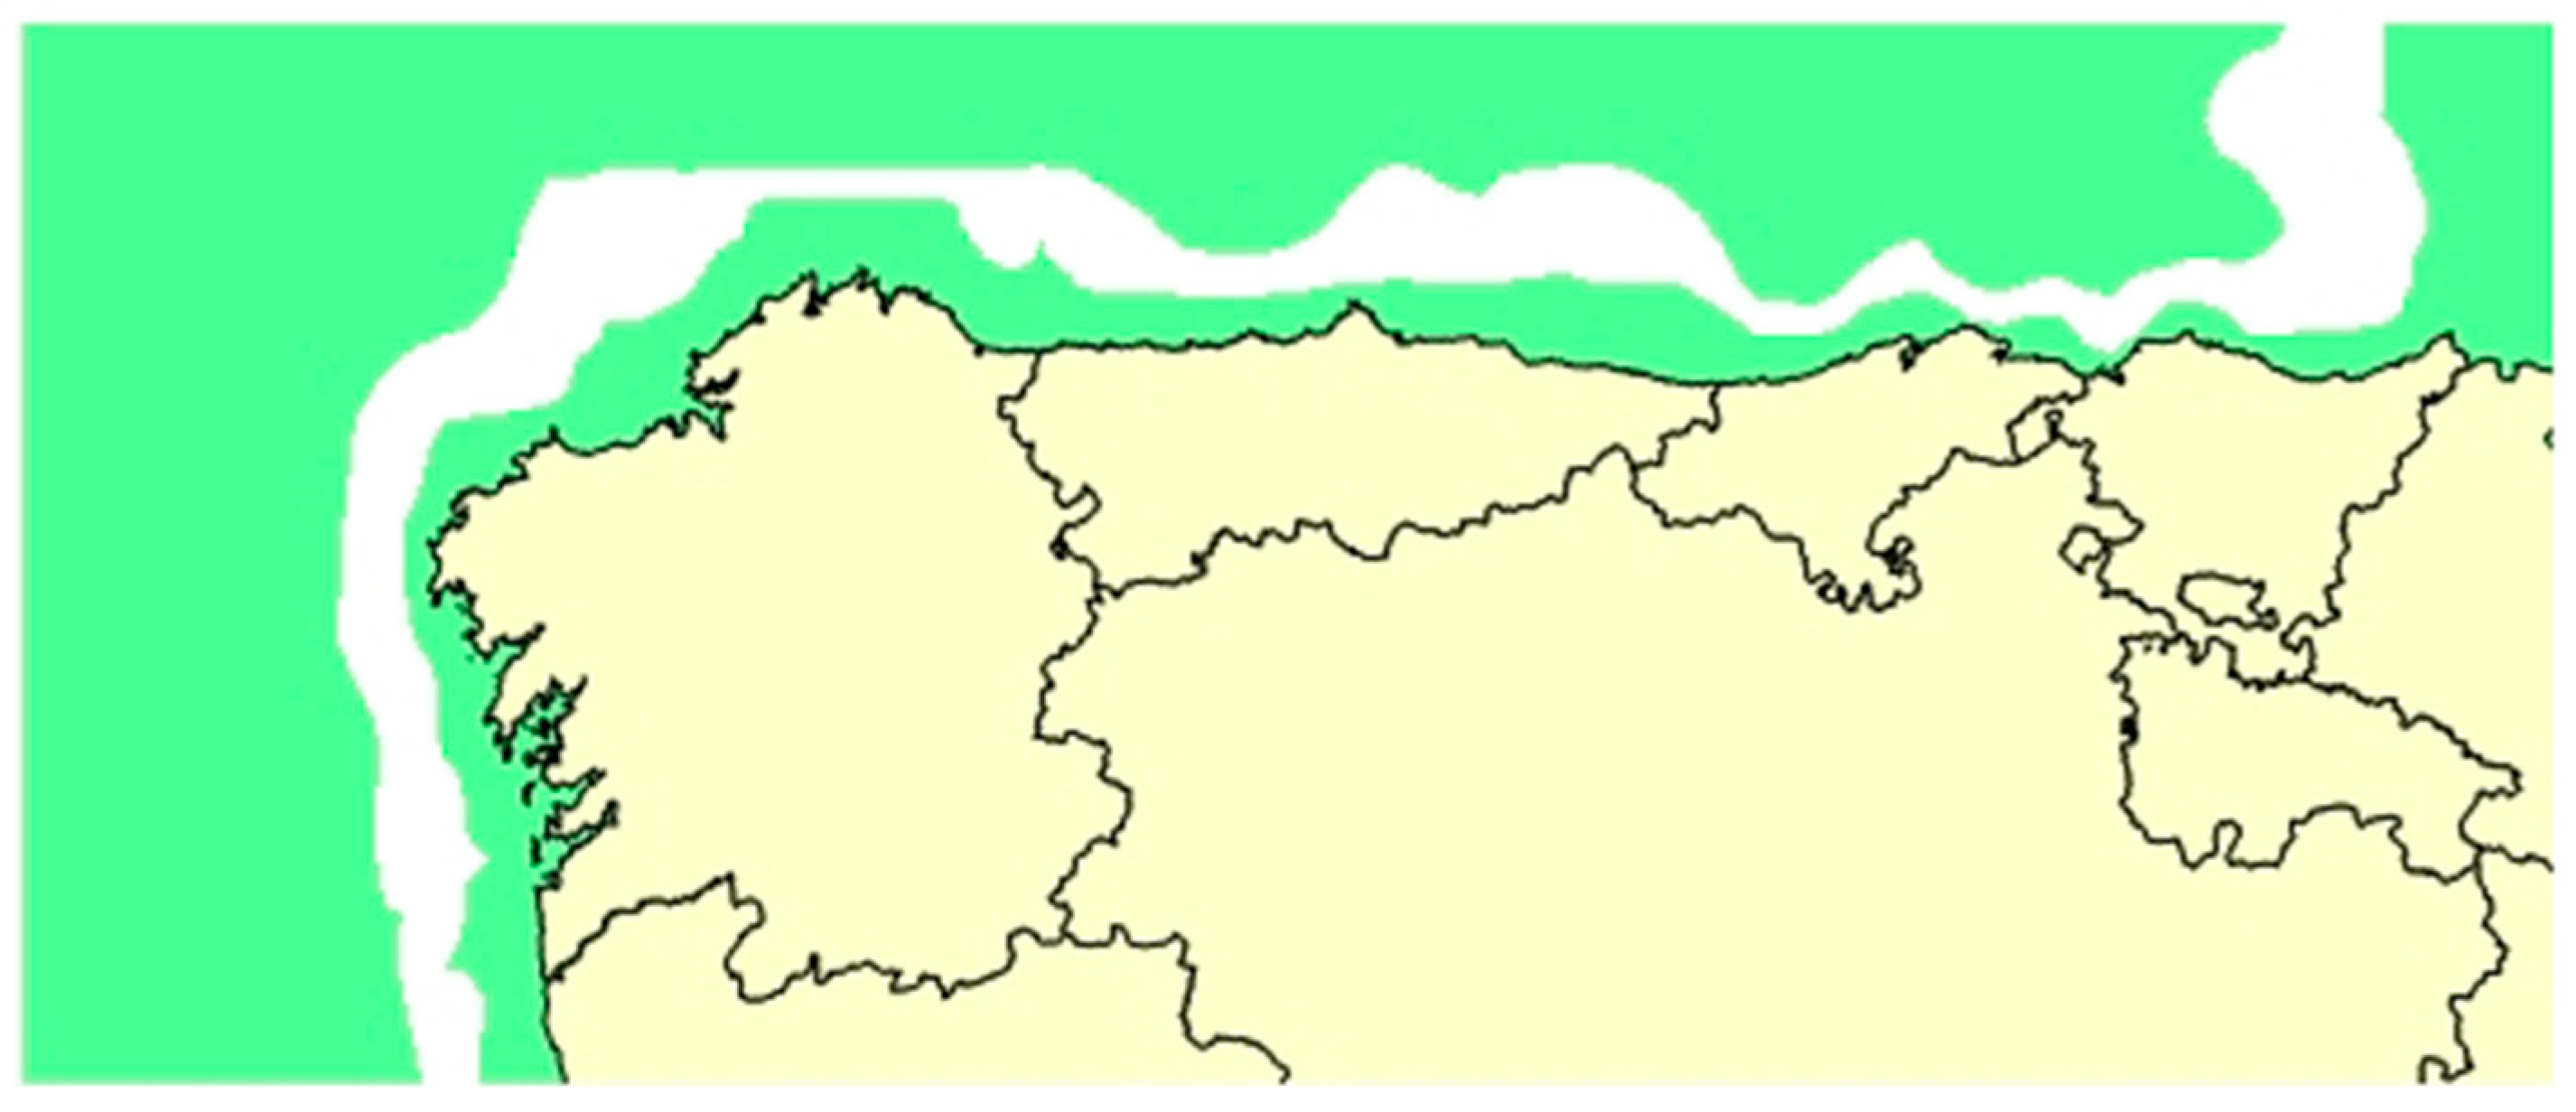
3. Case of Study
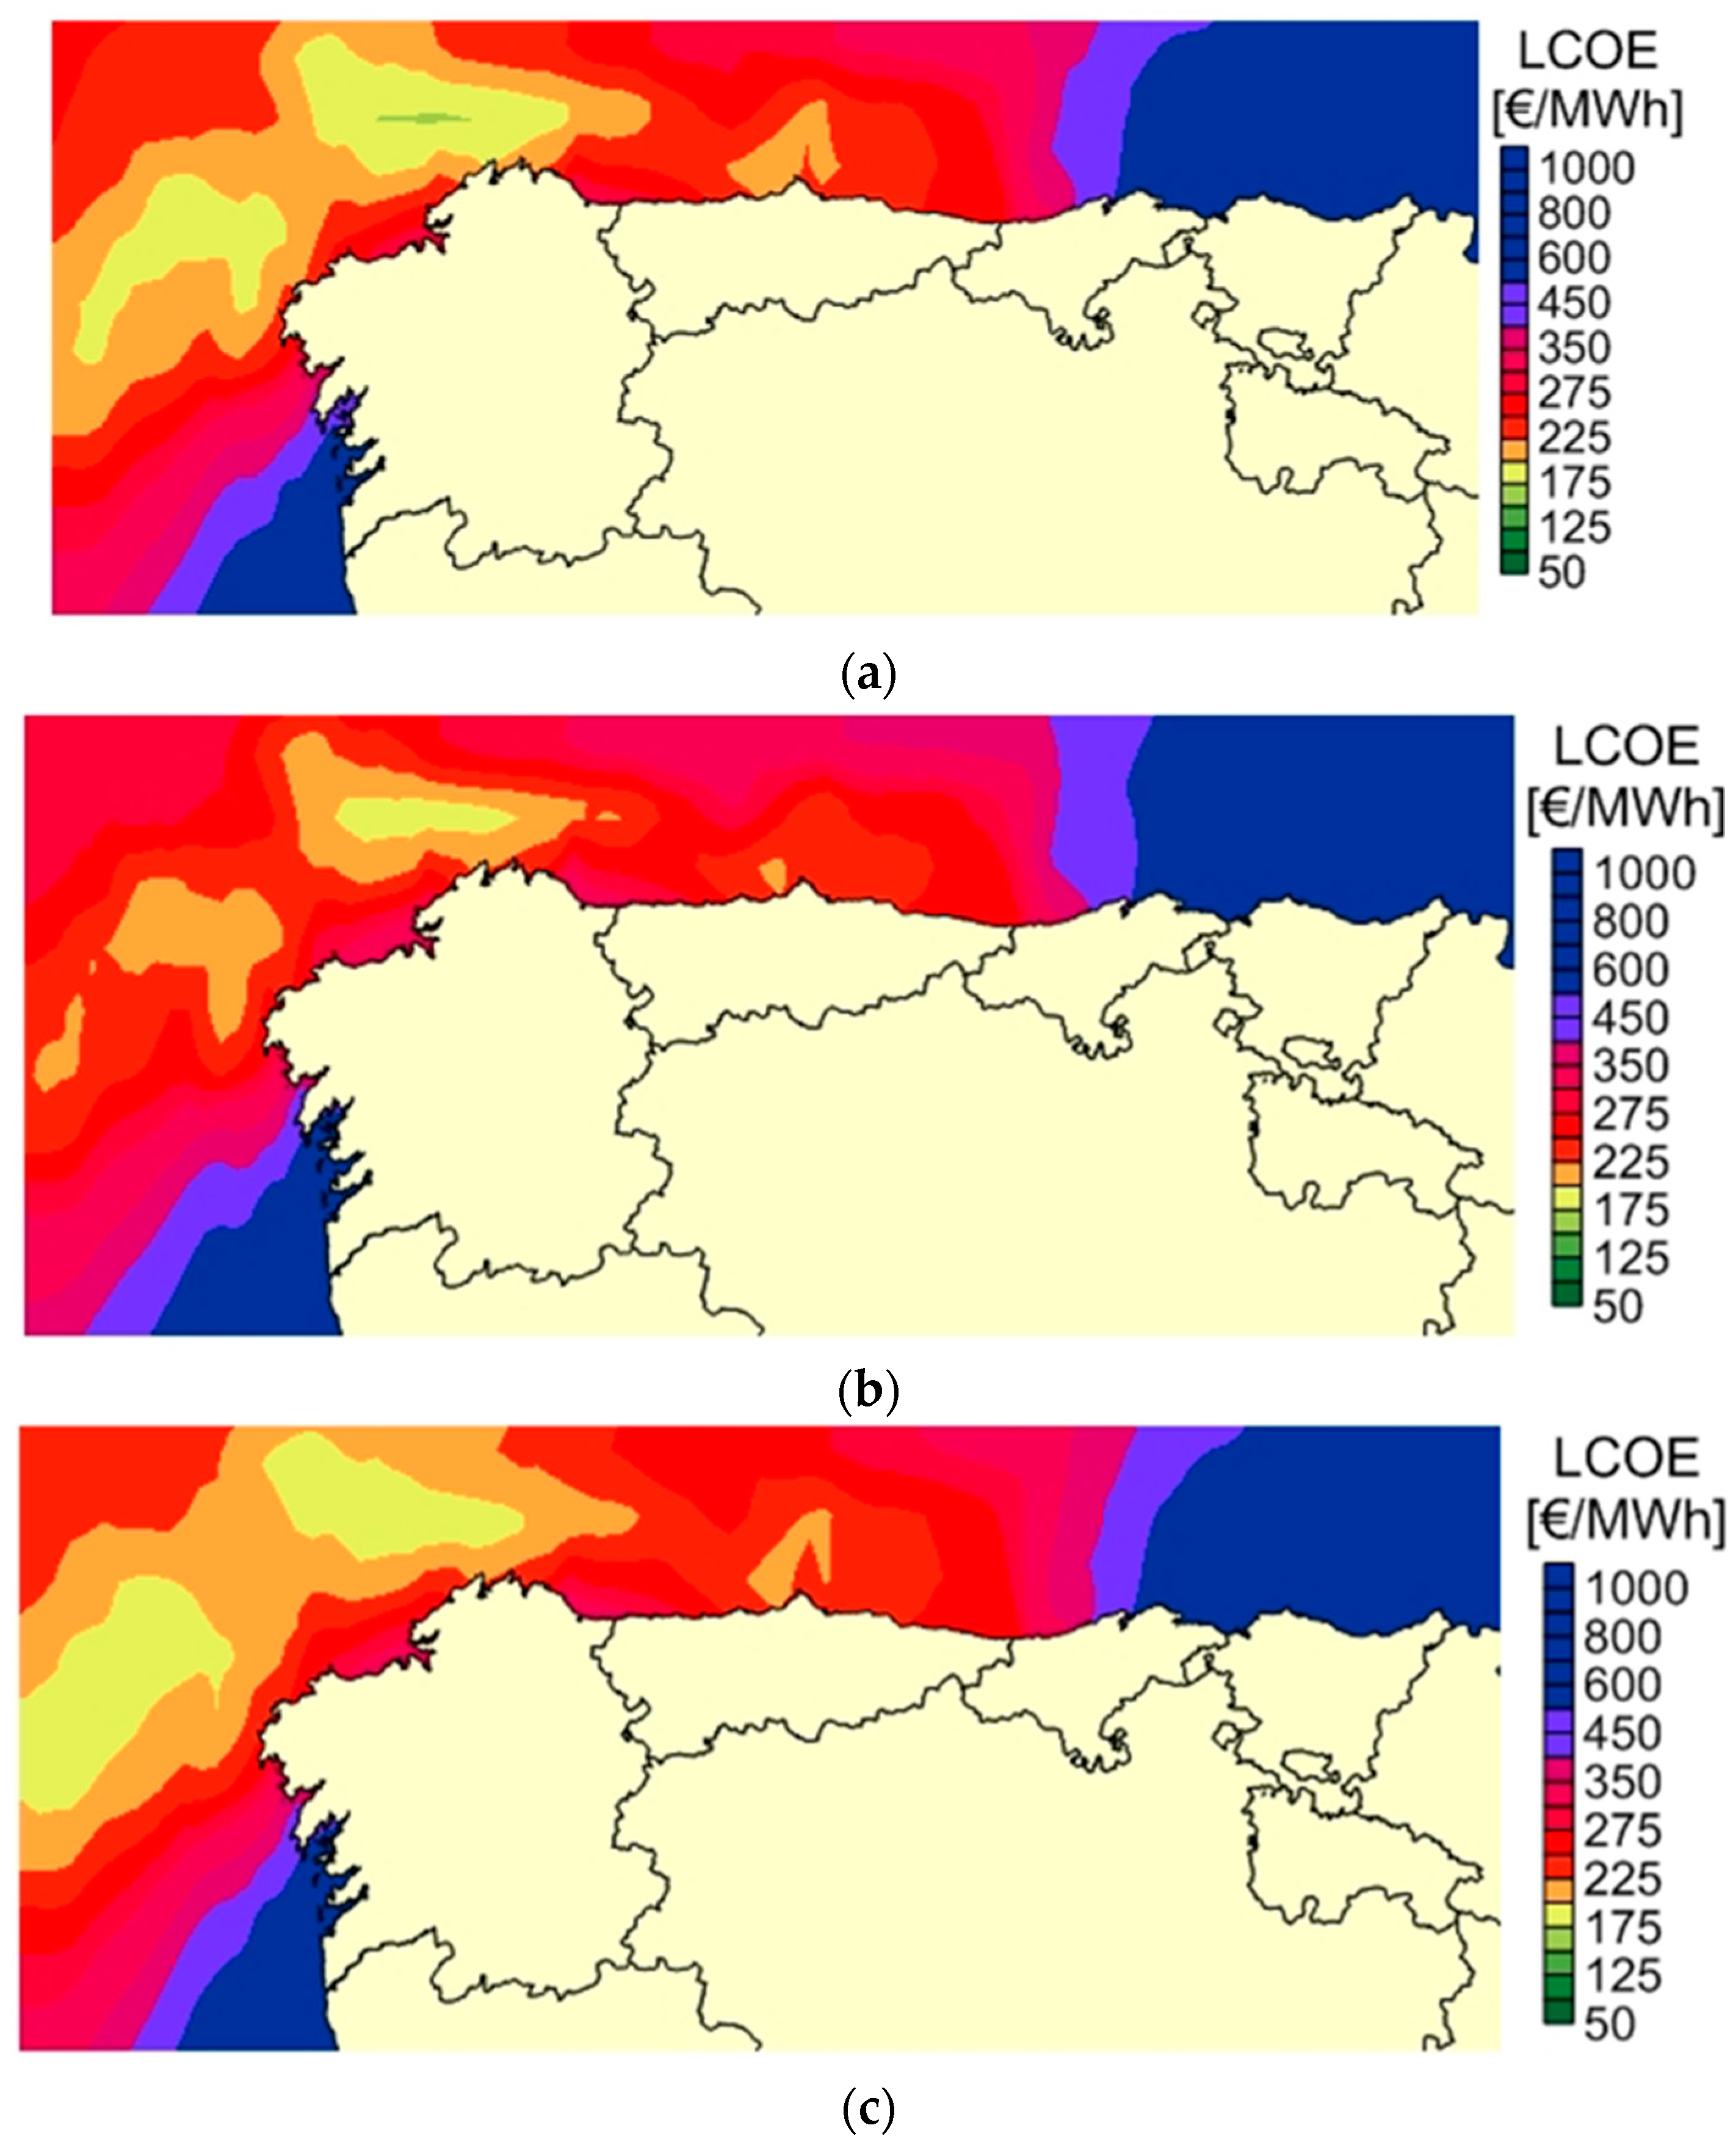
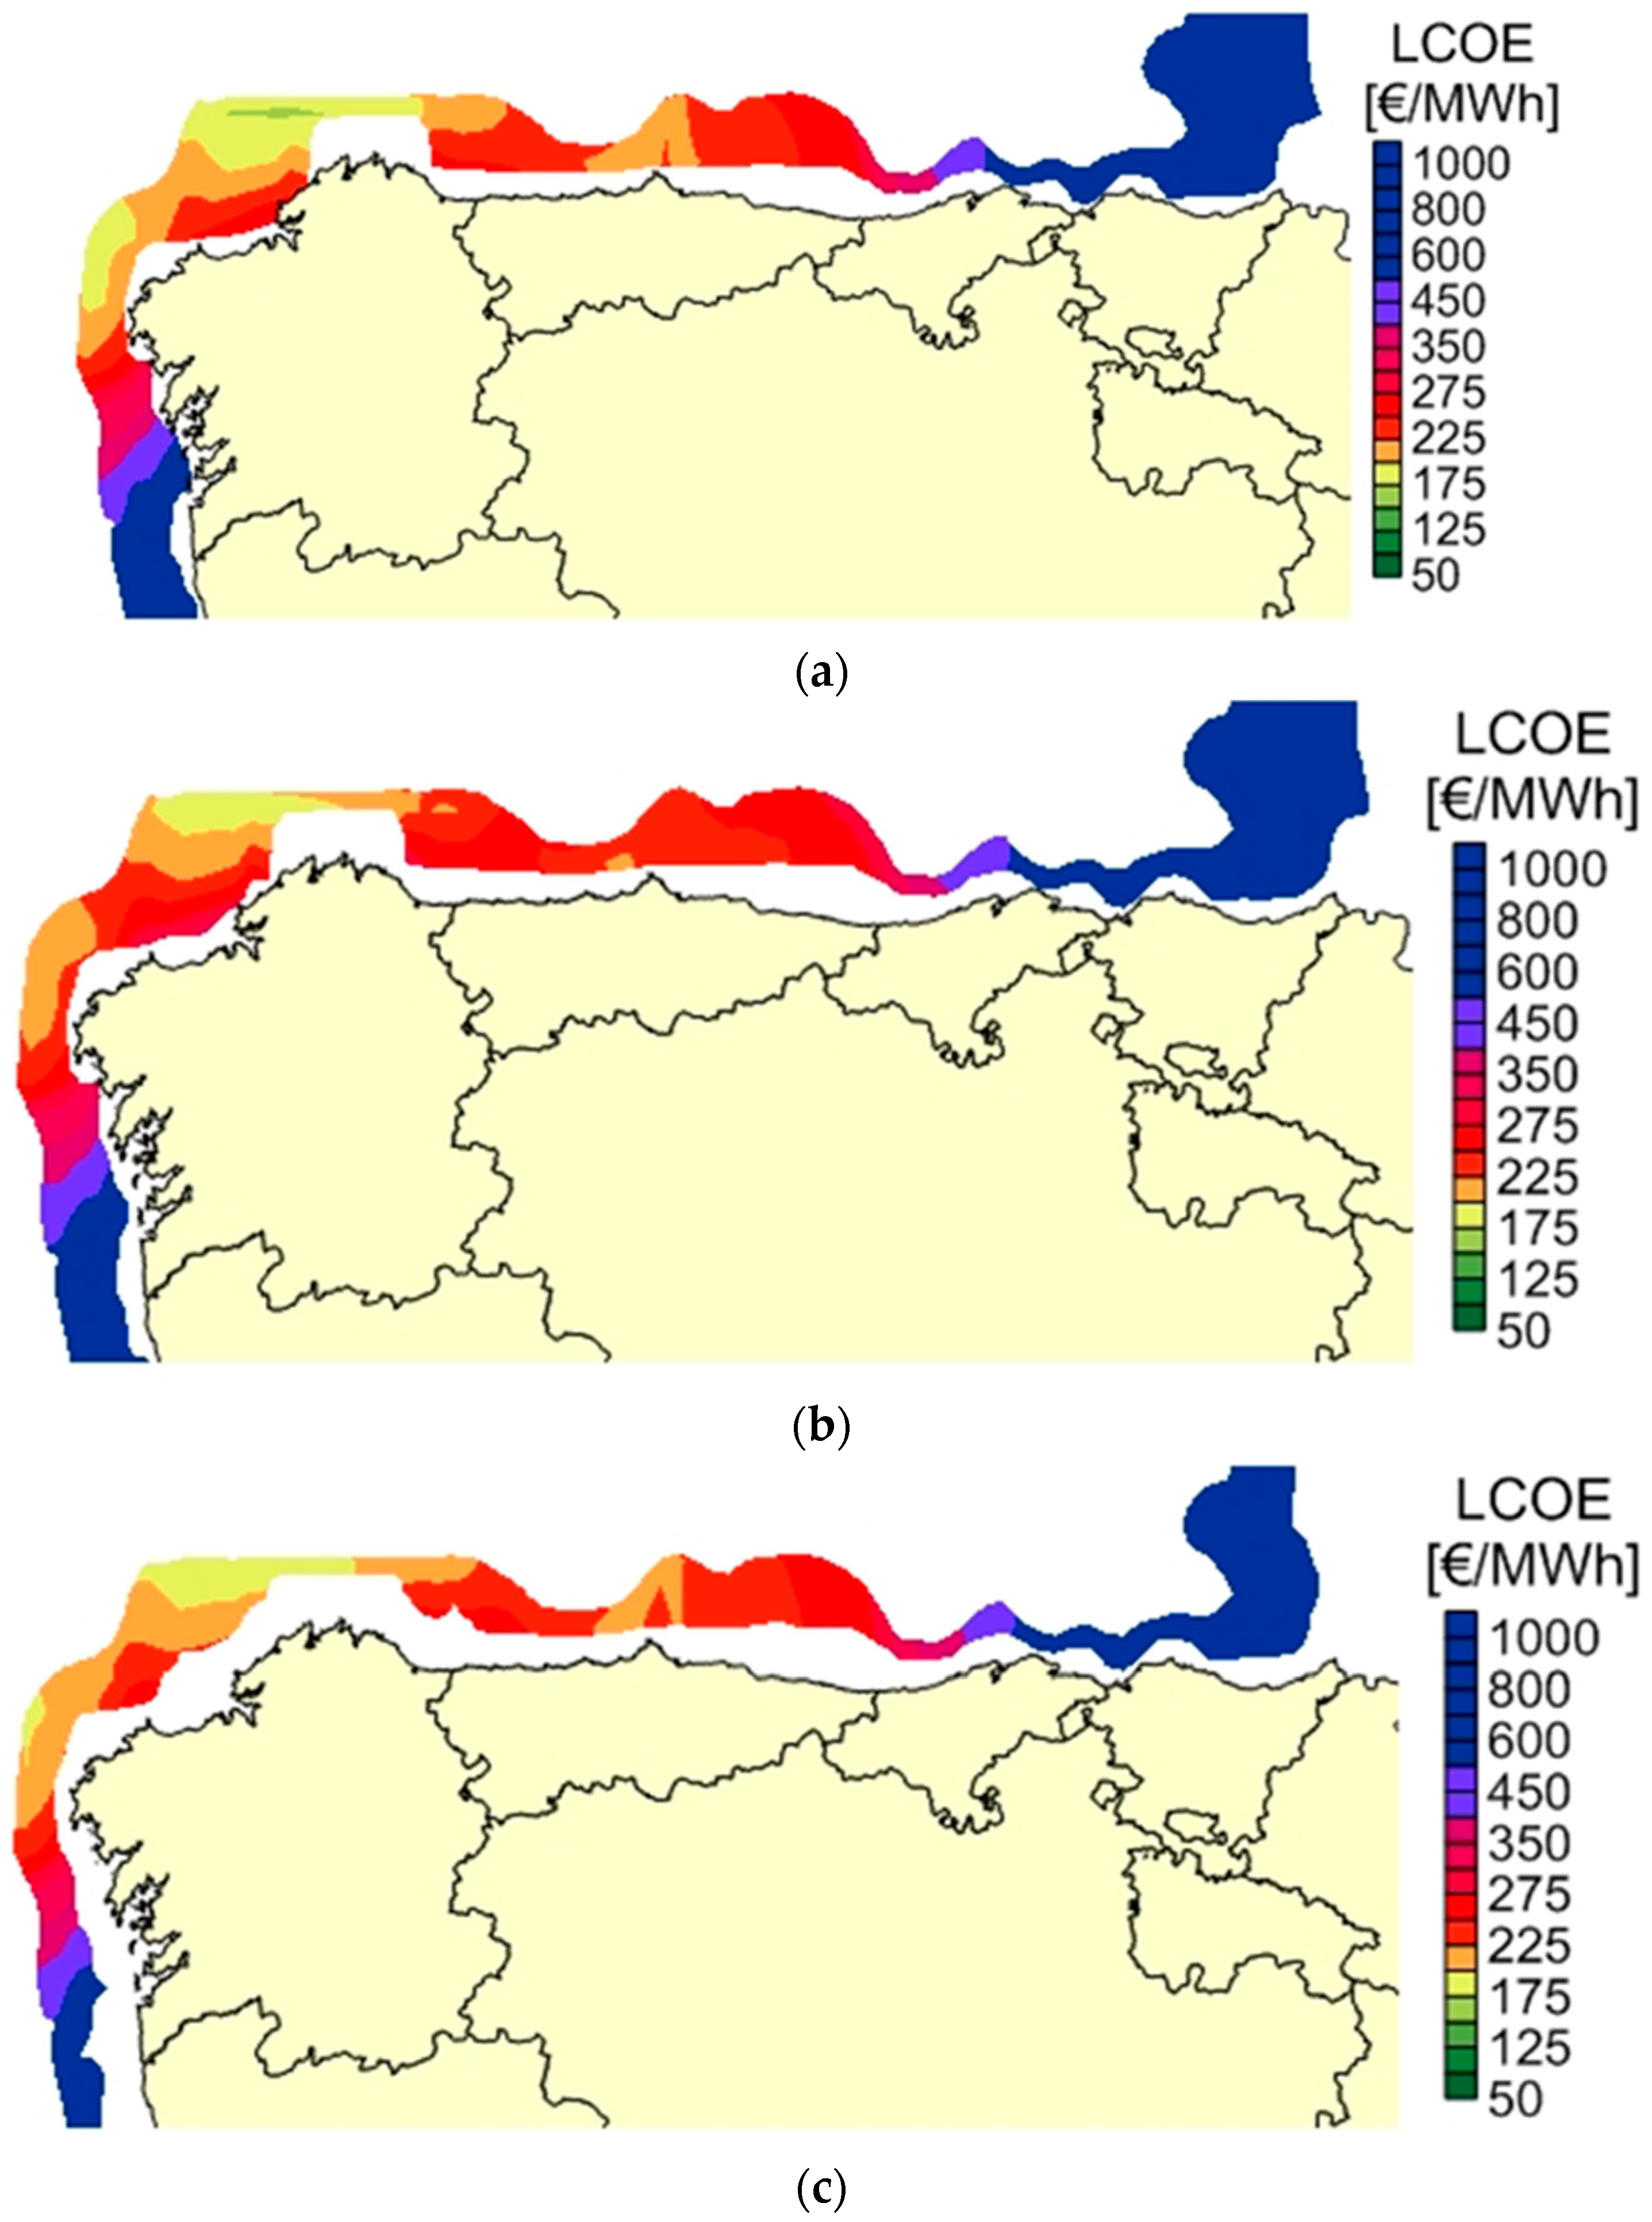
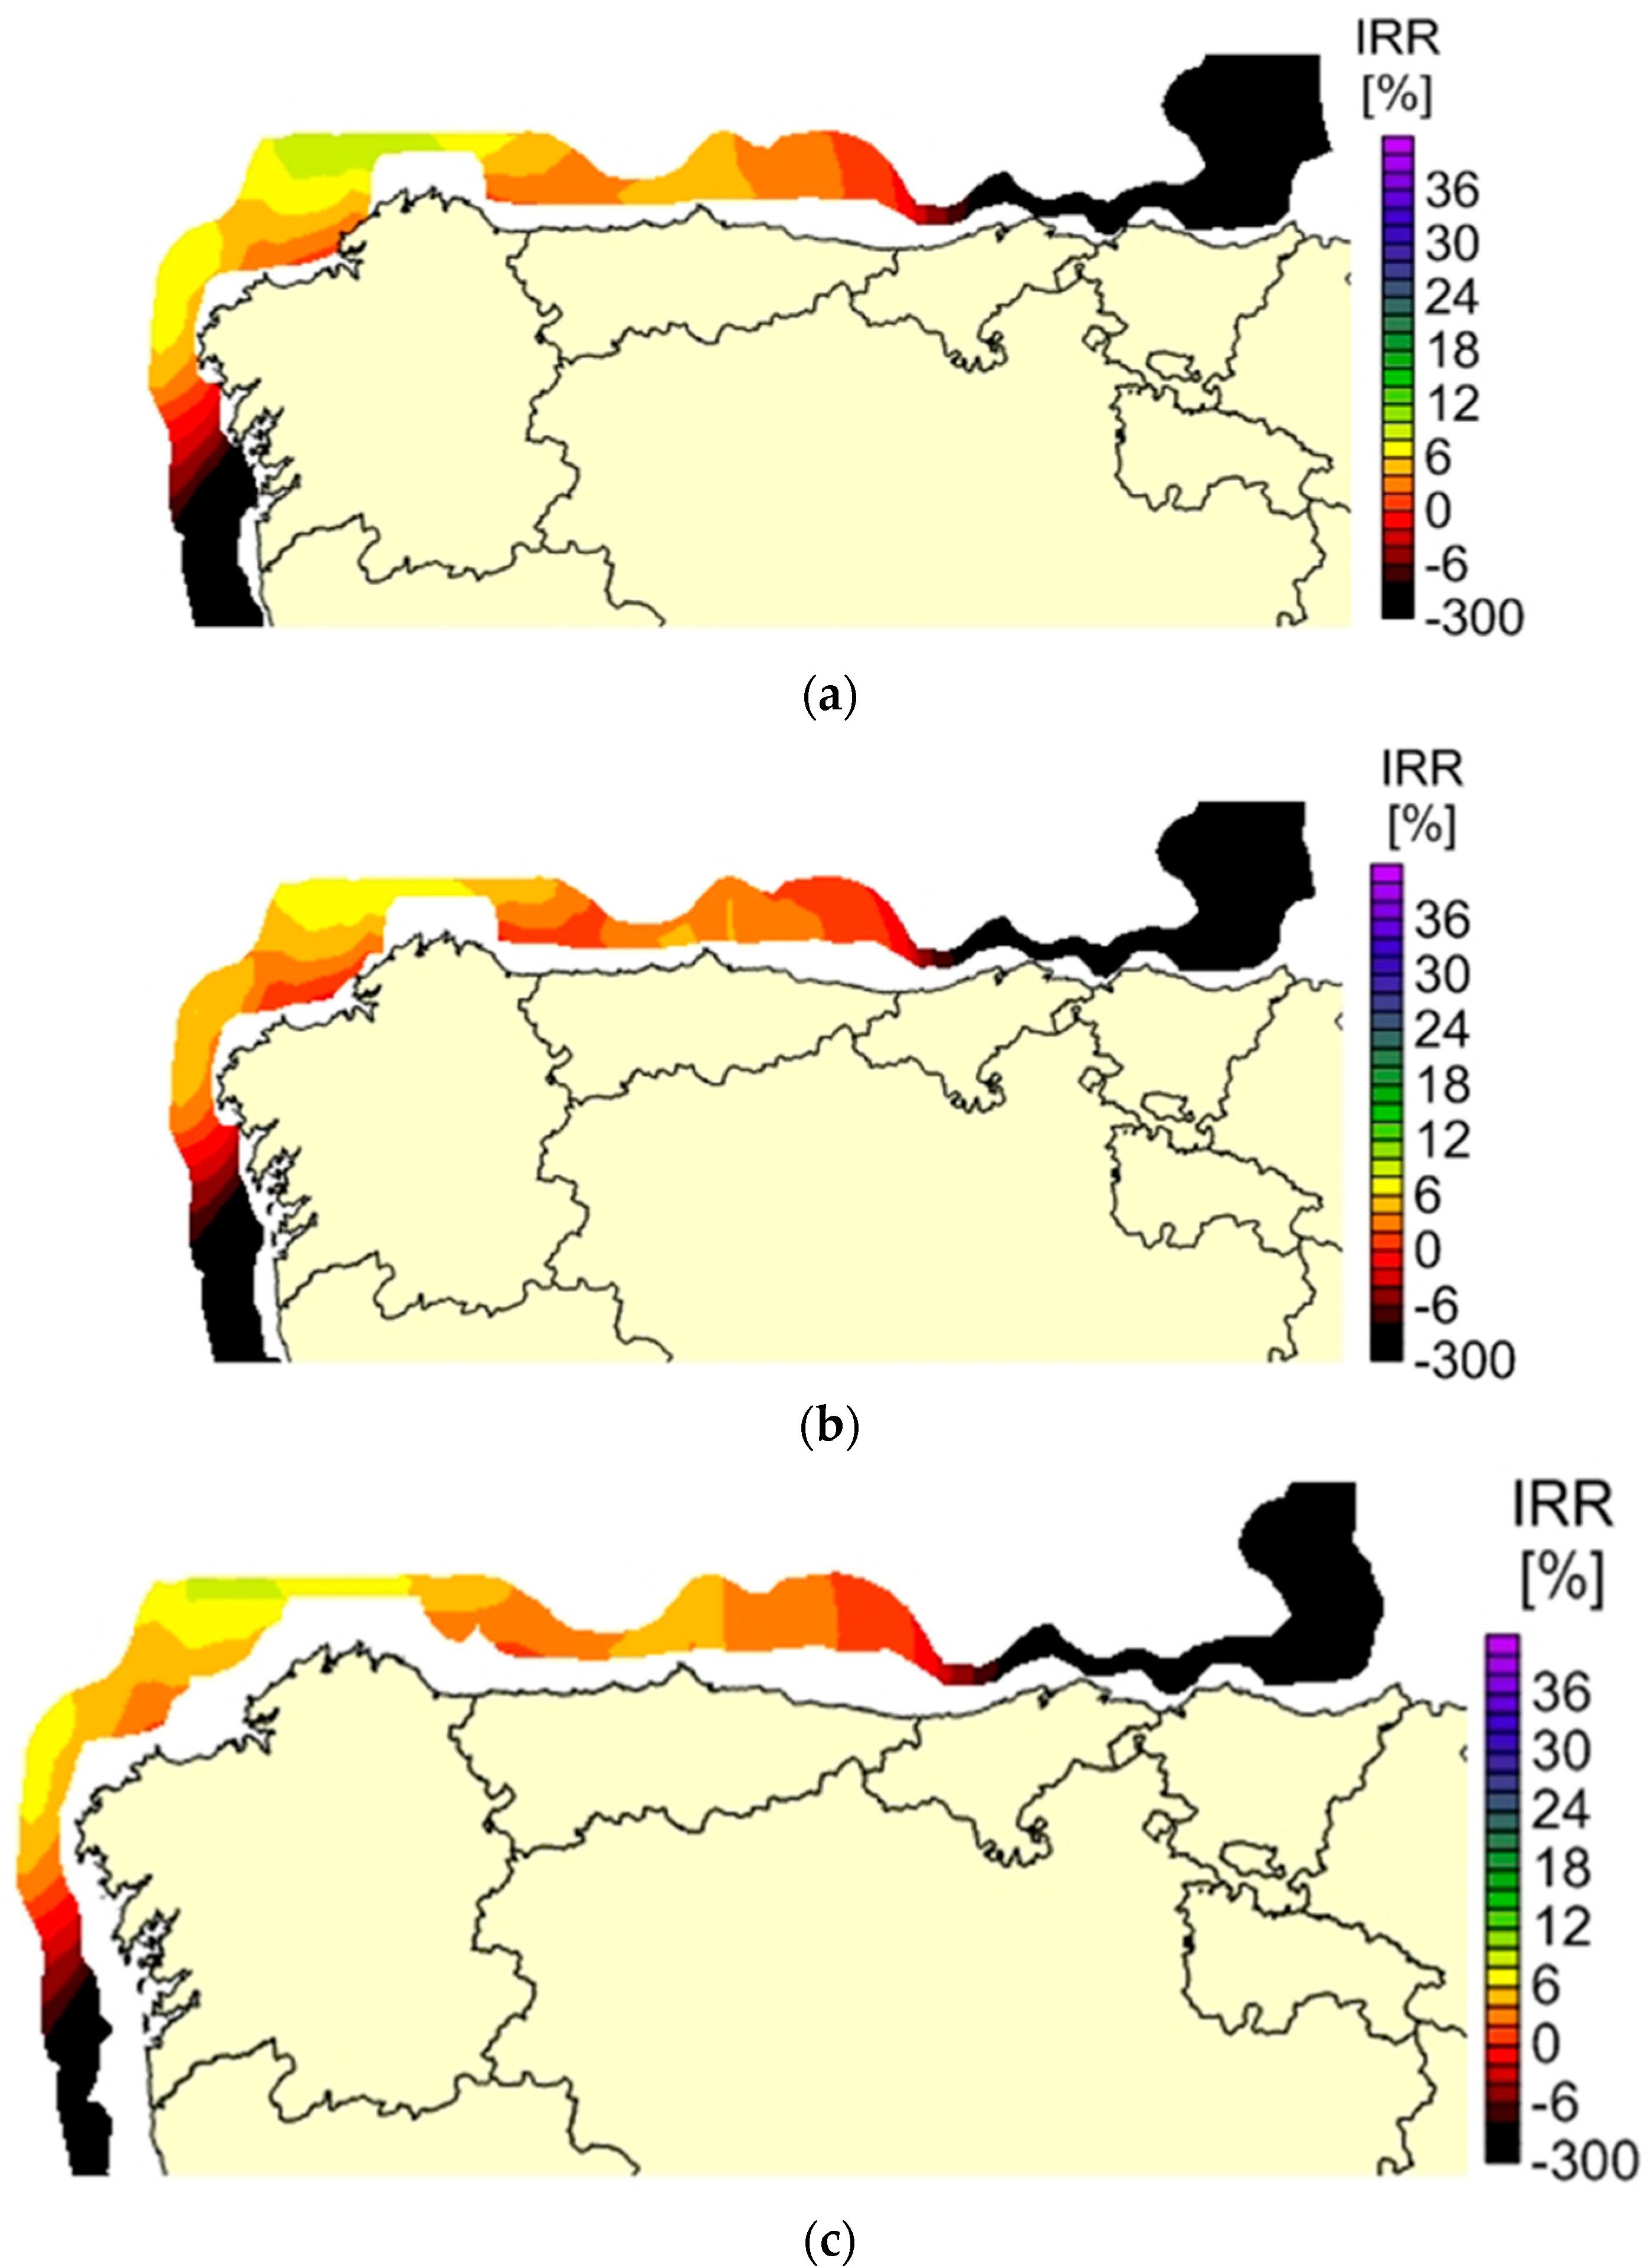
4. Results
5. Conclusions
Author Contributions
Funding
Conflicts of Interest
References
- Official Journal of the European Union EC. Directive 2009/28/EC of the European Parliament and of the Council of 23 April 2009 on the Promotion of the Use of Energy from Renewable Sources and Amending and Subsequently Repealing Directives 2001/77/EC and 2003/30/EC; Official Journal of the European Union: Brussels, Belgium, 2009; pp. 16–60. [Google Scholar]
- Consejo de Ministros de 11 de Noviembre de 2011. Plan de Energías Renovables (PER) 2011–2020; IDAE: Madrid, Spain, 2011; pp. 1–824. Available online: https://www.idae.es/tecnologias/energias-renovables/plan-de-energias-renovables-2011-2020 (accessed on 14 March 2013).
- Stamford, L.; Azapagic, A. Life cycle sustainability assessment of UK electricity scenarios to 2070. Energy Sustain. Dev. 2014, 23, 194–211. [Google Scholar] [CrossRef]
- Balali, M.H.; Nouri, N.; Omrani, E.; Nasiri, A.; Otieno, W. An overview of the environmental, economic, and material developments of the solar and wind sources coupled with the energy storage systems. Int. J. Energy Res. 2017, 41, 1948–1962. [Google Scholar] [CrossRef]
- Zhang, X.; Pei, W.; Deng, W.; Du, Y.; Qi, Z.; Dong, Z. Emerging smart grid technology for mitigating global warming. Int. J. Energy Res. 2015, 39, 1742–1756. [Google Scholar] [CrossRef]
- European Wind Energy Association (EWEA). Deep Water the Next Step for Offshore Wind Energy; European Wind Energy Association (EWEA): Brussels, Belgium, 2013. [Google Scholar]
- Wilkes, J.; Pineda, I.; Corbetta, G. Wind Energy Scenarios for 2020; WindEurope: Brussels, Belgium, 2014. [Google Scholar]
- Guedes Soares, C.; Bhattacharjee, J.; Karmakar, D. Overview and prospects for development of wave and offshore wind energy. Brodogradnja 2014, 65, 87–109. [Google Scholar]
- Kang, J.; Sun, L.; Guedes Soares, C. Fault Tree Analysis of floating offshore wind turbines. Renew. Energy 2019, 133, 1455–1467. [Google Scholar] [CrossRef]
- Santos, F.; Teixeira, A.P.; Guedes Soares, C. Modelling and simulation of the operation and maintenance of offshore wind turbines. Proc. Inst. Mech. Eng. Part O J. Risk Reliab. 2015, 229, 385–393. [Google Scholar] [CrossRef]
- Sobral, J.; Kang, J.C.; Guedes Soares, C. Weighting the influencing factors on offshore wind farms availability. In Advances in Renewable Energies Offshore; Guedes Soares, C., Ed.; Taylor & Francis: London, UK, 2019; pp. 853–863. [Google Scholar]
- Stock-Williams, C.; Swamy, S.K. Automated daily maintenance planning for offshore wind farms. Renew. Energy 2018, 133, 1–11. [Google Scholar] [CrossRef]
- Santos, F.P.; Teixeira, A.P.; Guedes Soares, C. Maintenance planning of an offshore wind turbine using stochastic petri nets with predicates. J. Offshore Mech. Arct. Eng. 2018, 140, 021904. [Google Scholar] [CrossRef]
- Sajadi, A.; Strezoski, L.; Clark, K.; Prica, M.; Loparo, K.A. Transmission system protection screening for integration of offshore wind power plants. Renew. Energy 2018, 125, 225–233. [Google Scholar] [CrossRef]
- Nie, B.; Li, J. Technical potential assessment of offshore wind energy over shallow continent shelf along China coast. Renew. Energy 2018, 128, 391–399. [Google Scholar] [CrossRef]
- Salvação, N.; Bernardino, M.; Guedes Soares, C. Assessing mesoscale wind simulations in different environments. Comput. Geosci. 2014, 71, 28–36. [Google Scholar] [CrossRef]
- Salvação, N.; Guedes Soares, C. Wind resource assessment offshore the Atlantic Iberian coast with the WRF model. Energy 2018, 145, 276–287. [Google Scholar] [CrossRef]
- Salvação, N.; Guedes Soares, C.; Bentamy, A. Offshore wind energy assessment for the Iberian coasts using remotely sensed data. In Renewable Energies Offshore; Guedes Soares, C., Ed.; Taylor & Francis Group: London, UK, 2015; pp. 755–762. [Google Scholar]
- Khanali, M.; Ahmadzadegan, S.; Omid, M.; Keyhani Nasab, F.; Chau, K.W. Optimizing layout of wind farm turbines using genetic algorithms in Tehran province, Iran. Int. J. Energy Environ. Eng. 2018, 9, 399–411. [Google Scholar] [CrossRef]
- Shamshirband, S.; Rabczuk, T.; Chau, K.W. A Survey of Deep Learning Techniques: Application in Wind and Solar Energy Resources. IEEE Access 2019, 7, 164650–164666. [Google Scholar] [CrossRef]
- Sieros, G.; Chaviaropoulos, P.; Sorensen, J.; Bulder, B.; Jamieson, P. Upscaling wind turbines: Theoretical and practical aspects and their impact on the cost of energy. Wind Energy 2012, 25, 3–17. [Google Scholar] [CrossRef]
- Pope, K.; Naterer, G.F.; Dincer, I.; Tsang, E. Power correlation for vertical axis wind turbines with varying geometries. Int. J. Energy Res. 2011, 35, 423–435. [Google Scholar] [CrossRef]
- Ahmed, M.R. Blade sections for wind turbine and tidal current turbine applications-current status and future challenges. Int. J. Energy Res. 2012, 36, 829–844. [Google Scholar] [CrossRef]
- Ladenburg, J. Stated public preferences for on-land and offshore wind power generation—A review. Wind Energy 2009, 12, 171–181. [Google Scholar] [CrossRef]
- Sovacool, B.K.; Enevoldsen, P.; Koch, C.; Barthelmie, R.J. Cost performance and risk in the construction of offshore and onshore wind farms. Wind Energy 2016, 20, 891–908. [Google Scholar] [CrossRef]
- Henderson, A.R.; Morgan, C.; Smith, B.; Sorensen, H.C.; Barthelmie, R.J.; Boesmans, B.; Sorensen, H.C.; Barthelmie, R.J.; Boesmans, B. Offshore Wind Energy in Europe? A Review of the State-of-the-Art. Wind Energy 2003, 6, 35–52. [Google Scholar] [CrossRef]
- Bagbanci, H.; Karmakar, D.; Guedes Soares, C. Review of offshore floating wind turbines concepts. In Maritime Engineering and Technology; Guedes Soares, C., Garbatov, Y., Sutulo, S., Santos, T.A., Eds.; Taylor & Francis Group: London, UK, 2012; pp. 553–562. [Google Scholar]
- Yeter, B.; Garbatov, Y.; Guedes Soares, C. Uncertainty analysis of soil-pile interactions of monopile offshore wind turbine support structures. Appl. Ocean Res. 2019, 82, 74–88. [Google Scholar] [CrossRef]
- Yeter, B.; Garbatov, Y.; Guedes Soares, C. Fatigue damage assessment of fixed offshore wind turbine tripod support structures. Eng. Struct. 2015, 101, 518–528. [Google Scholar] [CrossRef]
- Yeter, B.; Garbatov, Y.; Guedes Soares, C. Ultimate strength assessment of jacket offshore wind turbine support structures subjected to progressive bending loading. Ships Offshore Struct. 2019, 142, 165–175. [Google Scholar] [CrossRef]
- Myhr, A.; Bjerkseter, C.; Ågotnes, A.; Nygaard, T.A. Levelised cost of energy for offshore floating wind turbines in a life cycle perspective. Renew. Energy 2014, 66, 714–728. [Google Scholar] [CrossRef]
- Sant, T.; Bonnici, D.; Farrugia, R.; Micallef, D. Measurements and modelling of the power performance of a model floating wind turbine under controlled conditions. Wind Energy 2015, 18, 811–834. [Google Scholar] [CrossRef]
- Uzunoglu, E.; Karmakar, D.; Guedes Soares, C. Floating offshore wind platforms. In Floating Offshore Wind Farms; Castro-Santos, L., Diaz-Casas, V., Eds.; Springer International Publishing Switzerland: Cham, Switzerland, 2016; pp. 53–76. [Google Scholar]
- Raed, K.; Teixeira, A.P.; Guedes Soares, C. Uncertainty assessment for the extreme hydrodynamic responses of a wind turbine semi-submersible platform using different environmental contour approaches. Ocean Eng. 2019. [Google Scholar] [CrossRef]
- Uzunoglu, E.; Guedes Soares, C. A system for the hydrodynamic design of tension leg platforms of floating wind turbines. Ocean Eng. 2019, 171, 78–92. [Google Scholar] [CrossRef]
- Kausche, M.; Adam, F.; Dahlhaus, F.; Großmann, J. Floating offshore wind—Economic and ecological challenges of a TLP solution. Renew. Energy 2018, 126, 270–280. [Google Scholar] [CrossRef]
- Bagbanci, H.; Karmakar, D.; Guedes Soares, C. Comparison of spar and semisubmersible floater concepts of offshore wind turbines using long-term analysis. J. Offshore Mech. Arct. Eng. 2015, 137, 061601. [Google Scholar] [CrossRef]
- Karmakar, D.; Bagbanci, H.; Guedes Soares, C. Long-term extreme load prediction of spar and semisubmersible floating wind turbines using the environmental contour method. J. Offshore Mech. Arct. Eng. 2016, 138, 021601. [Google Scholar] [CrossRef]
- Jonkman, J.; Matha, D. Dynamics of offshore floating wind turbines—Analysis of three concepts. Wind Energy 2011, 14, 557–569. [Google Scholar] [CrossRef]
- Roddier, D.; Cermelli, C.; Aubault, A.; Weinstein, A. WindFloat: A floating foundation for offshore wind turbines. J. Renew. Sustain. Energy 2010, 2, 1–34. [Google Scholar] [CrossRef]
- Navantia Página Web NAVANTIA. Available online: http://www.navantia.es (accessed on 3 March 2016).
- Bento, A.R.; Martinho, P.; Guedes Soares, C. Wave energy assessement for Northern Spain from a 33-year hindcast. Renew. Energy 2018, 127, 322–333. [Google Scholar] [CrossRef]
- Castro-Santos, L.; Diaz-Casas, V. Life-cycle cost analysis of floating offshore wind farms. Renew. Energy 2014, 66, 41–48. [Google Scholar]
- Castro-Santos, L.; Martins, E.; Guedes Soares, C. Methodology to calculate the costs of a floating offshore renewable energy farm. Energies 2016, 9, 324. [Google Scholar] [CrossRef]
- Castro-Santos, L.; Diaz-Casas, V. Economic influence of location in floating offshore wind farms. Ocean Eng. 2015, 107, 13–22. [Google Scholar] [CrossRef]
- Short, W.; Packey, D.; Holt, T. A Manual for the Economic Evaluation of Energy Efficiency and Renewable Energy Technologies; National Renawable Energy Laboratory publication: Golden, CO, USA, 1995. [Google Scholar]
- Castro-Santos, L.; Filgueira-Vizoso, A.; Carral-Couce, L.; Formoso, J.Á.F. Economic feasibility of floating offshore wind farms. Energy 2016, 112, 868–882. [Google Scholar] [CrossRef]
- Hertenstein, J.H.; Mckinnon, S.M. Solving the puzzle of the cash flow statement. Bus. Horiz. 1997, 40, 69–76. [Google Scholar] [CrossRef]
- ECN; MARIN; Lagerwey the Windmaster; TNO; TUD; MSC. Study to Feasibility of Boundary Conditions for Floating Offshore Wind Turbines; Technical Report 2002; CMC: Delft, The Netherlands, 2002. [Google Scholar]
- Sclavounos, P.D.; Lee, S.; DiPietro, J. Floating offshore wind turbines: Tension leg platform and taught leg buoy concepts supporting 3–5 mw wind turbines. In Proceedings of the European Wind Energy Conference (EWEC), Warsaw, Poland, 20–23 April 2010; pp. 1–7. [Google Scholar]
- Jonkman, J. Definition of the Floating System for Phase IV of OC3; National Renawable Energy Laboratory publication: Golden, CO, USA, 2010. [Google Scholar]
- Boletín Oficial del Estado (B.O.E.). Orden IET/1045/2014, de 16 de Junio, por la que se Aprueban los Parámetros Retributivos de las Instalaciones Tipo Aplicables a Determinadas Instalaciones de Producción de Energía Eléctrica a Partir de Fuentes de Energía Renovables, Cogeneración y Residuos; Boletín Oficial del Estado: Spain, Madrid, 2014; pp. 85173–85276. [Google Scholar]
- Castro-Santos, L.; Diaz-Casas, V. Perspectivas de futuro de los parques eólicos marinos flotantes. Dínamo Técnica 2014, 14, 11–13. [Google Scholar]


| Variable | Semisubmersible | TLP | Spar | Units |
|---|---|---|---|---|
| 8.0 | 18.0 | 9.4 | m | |
| 12.0 | - | - | m | |
| 13.0 | - | - | m | |
| 2.0 | - | - | m | |
| 5.0 | - | - | m | |
| 1.5 | - | - | m | |
| 1.5 | - | - | m | |
| 10.0 | 44.9 | 120.0 | m | |
| 2.0 | 3.0 | - | m | |
| 76.0 | 54.0 | 9.4 | m | |
| 16.8 | 47.9 | 70 | m |
| Scenario | Electric Tariff (€/MWh) |
|---|---|
| Scenario 1 | 50 |
| Scenario 2 | 100 |
| Scenario 3 | 200 |
© 2020 by the authors. Licensee MDPI, Basel, Switzerland. This article is an open access article distributed under the terms and conditions of the Creative Commons Attribution (CC BY) license (http://creativecommons.org/licenses/by/4.0/).
Share and Cite
Castro-Santos, L.; Bento, A.R.; Silva, D.; Salvação, N.; Guedes Soares, C. Economic Feasibility of Floating Offshore Wind Farms in the North of Spain. J. Mar. Sci. Eng. 2020, 8, 58. https://doi.org/10.3390/jmse8010058
Castro-Santos L, Bento AR, Silva D, Salvação N, Guedes Soares C. Economic Feasibility of Floating Offshore Wind Farms in the North of Spain. Journal of Marine Science and Engineering. 2020; 8(1):58. https://doi.org/10.3390/jmse8010058
Chicago/Turabian StyleCastro-Santos, Laura, A. Rute Bento, Dina Silva, Nadia Salvação, and C. Guedes Soares. 2020. "Economic Feasibility of Floating Offshore Wind Farms in the North of Spain" Journal of Marine Science and Engineering 8, no. 1: 58. https://doi.org/10.3390/jmse8010058
APA StyleCastro-Santos, L., Bento, A. R., Silva, D., Salvação, N., & Guedes Soares, C. (2020). Economic Feasibility of Floating Offshore Wind Farms in the North of Spain. Journal of Marine Science and Engineering, 8(1), 58. https://doi.org/10.3390/jmse8010058