Article

Fuel Consumption and CO2 Emission Reductions of Ships Powered by a Fuel-Cell-Based Hybrid Power Source

1
Department of Chemical and Biomolecular Engineering, Yonsei University, 134 Shinchon-dong, Seodaemun-gu, Seoul 120-749, Korea
2
Department of Marine System Engineering, Korea Maritime and Ocean University, 727 Taejong-ro, Busan 49112, Korea
3
Department of Electrical Engineering, Colleges of Korea Polytechnic, 155 Sanjeon-ro, Ulsan 44482, Korea
*
Author to whom correspondence should be addressed.
J. Mar. Sci. Eng. 2019, 7(7), 230; https://doi.org/10.3390/jmse7070230
Submission received: 17 May 2019 / Revised: 15 July 2019 / Accepted: 15 July 2019 / Published: 18 July 2019
(This article belongs to the Special Issue Ship Lifecycle)

Abstract

:
The need for technological development to reduce the impact of air pollution caused by ships has been strongly emphasized by many authorities, including the International Maritime Organization (IMO). This has encouraged research to develop an electric propulsion system using hydrogen fuel with the aim of reducing emissions from ships. This paper describes the test bed we constructed to compare our electric propulsion system with existing power sources. Our system uses hybrid power and a diesel engine generator with a combined capacity of 180 kW. To utilize scale-down methodology, the linear interpolation method is applied. The proposed hybrid power source consists of a molten carbonate fuel cell (MCFC), a battery, and a diesel generator, the capacities of which are 100 kW, 30 Kw, and 50 kW, respectively. The experiments we conducted on the test bed were based on the outcome of an analysis of the electrical power consumed in each operating mode considering different types of merchant ships employed in practice. The output, fuel consumption, and CO2 emission reduction rates of the hybrid and conventional power sources were compared based on the load scenarios created for each type of ship. The CO2 emissions of the hybrid system was compared with the case of the diesel generator alone operation for each load scenario, with an average of 70%~74%. This analysis confirmed the effectiveness of using a ship with a fuel-cell-based hybrid power source.

1. Introduction

In 2015, the “Third IMO Greenhouse Gas Study,” conducted by the International Maritime Organization (IMO) [1], reported that air pollutants emitted from ships in 2012 accounted for 13% of NOx, 12% of SOx, and 2.6% of CO2 in terms of global atmospheric pollutant emissions [2,3]. The International Council on Clean Transport (ICCT), an international environmental non-profit organization, has analyzed and forecasted the pollutant emissions from ships from 1990 to 2050, and reported that the NOx and SOx emitted from ships are expected to increase to 30% and 20%, respectively, of all global pollutant emissions [3,4,5]. These study results support the view that the long-term effects of atmospheric pollutants caused by ships are foreseen to become more severe, considering the trend of increasing global trade in the future. Clearly, there is a need to develop technology for reducing pollutant emissions from ships [6,7].
Currently, fuel cells that use hydrogen fuel to reduce pollutant emissions from ships are being studied [8,9,10,11]. Fuel cells take the chemical energy within the hydrogen that is used as fuel and convert it into electrical and thermal energy through an electrochemical reaction with the oxygen present in the air. They produce almost no pollutant emissions or noise when generating electricity, and they can use various fuels as sources of hydrogen. Fuel cells are an eco-friendly energy source with very high electrical efficiency. Fuel-cell-based power generation can reduce greenhouse gas emissions by 30% compared to existing power generation methods [12]. Therefore, most advanced countries throughout the world regard fuel cells as a next-generation technology and are actively developing them [13,14].
The research on a hybrid system combining a fuel cell system with a diesel engine, which is the main power source of a ship, has been conducted in Europe [15,16,17,18]. The report of the European Maritime Safety Agency (EMSA), ‘Study on the Use of Fuel Cells in Shipping’, applied fuel cells as the main power or auxiliary power of ships from the beginning of 2000 and 24 projects in Europe and the United States with the beginning of the ‘US Ship Service Fuel Cell Program [US SSFC]’ project [19]. Analysis of these studies shows that most of the methods are generally aimed at improving the performance of hybrid systems (fuel cells, diesel generators) or the configuration of their systems and that there is no experimental study on the reduction of CO2 emissions from the hybrid power generation systems [20,21].
Therefore, an empirical study was conducted through experiments on CO2 reduction that has not been carried out in previous projects so far. Molten carbonate fuel cells (MCFCs) were selected as fuel cell systems of a combined power source because the characteristics of MCFCs are suitable for application to ships [22,23]. Since MCFCs operate at high temperature, the reaction rate is fast, even when using low-cost catalysts, as compared with relatively different fuel cell systems. Even when the ship is sailing for a long time, the external reformer is not installed separately and natural gas or coal gas is directly used as fuel. It is appropriate to apply it as the main power source for the base load of the ship [24].
In this study, to reduce the emissions from ships, empirical experiments on the fuel consumption and carbon dioxide emission reduction effect of a combined power source (fuel cell + battery + diesel generator) instead of the diesel generator were conducted. The capacity of the combined power source was 100 kW for MCFCs, 30 kW for batteries, and 50 kW for diesel generators. In order to carry out the experiment on the test bed, the power amount for each operation mode was analyzed according to the type of the commercial vessel, and the scale was downsized according to the capacity of the test bed. The fuel consumption and carbon dioxide emissions of the ship were calculated, according to the load profile of the ship, within 180 kW of the configured system. It can be confirmed through the demonstration that carbon dioxide emission and fuel consumption was considerably reduced compared to the conventional diesel power source.

2. Background

The International Convention for the Prevention of Marine Pollution from Ships (MARPOL) agreed that emissions, such as NOx and SOx, from ships should be reduced by 20% or less of the current emission amounts from 2008 to 2015. Since 2016, the agreement has recommended an 80% reduction in pollutant emissions [25]. In addition, the IMO has introduced the energy efficiency design index (EEDI), which is an index of factors to be considered in ship design to contribute toward reducing CO2 emissions. The CO2 emission regulations based on the EEDI that were imposed by the IMO on all new ships built since 2013 are listed in Table 1 and Table 2. Ships that do not meet the required EEDI levels are prohibited from entering ports [26]. In Table 2, the EEDI will be implemented in phases. Currently, it is in phase 1, which runs from year 2015 to 2019. Phase 2 will run from year 2020 to 2024 and phase 3 from year 2025 onwards [27].
National and international regulations are gradually being strengthened and require ocean pollutant emissions from ships to be reduced continuously. However, it is not possible to address this problem solely through modern engine technology without installing additional devices for preventing environmental pollution. Therefore, there is an increasing demand for high-efficiency power sources for ships with almost no pollutant emissions. Normal high-efficiency diesel engines have an energy efficiency of approximately 40%, and facilities equipped with CO2-capturing devices or pollutant-processing devices for emission gases have limited effectiveness owing to increases in the system volume and fuel energy consumption [28].
On the other hand, if fuel cells powered by hydrogen, which are eco-friendly high-efficiency power sources, could be an alternative solution, instead of diesel engines, to a propel ship, there could be almost no emissions (for example, NOx, SOx, CO2, or PM); the fuel cells would produce no noise or vibration and would have good power generation efficiency [14]. As such, fuel cells powered by hydrogen have considerable potential as a next-generation main power source for ships. In addition, they can be modularized to reduce complexities in terms of their construction and installation. Therefore, their capacity can be adjusted such that it is most effective for specific types or functions of ships. They have a very wide range of uses and are considered a technology that will play a leading role in ship propulsion systems in the future [8,29].

3. Types and Properties of Fuel Cell Systems

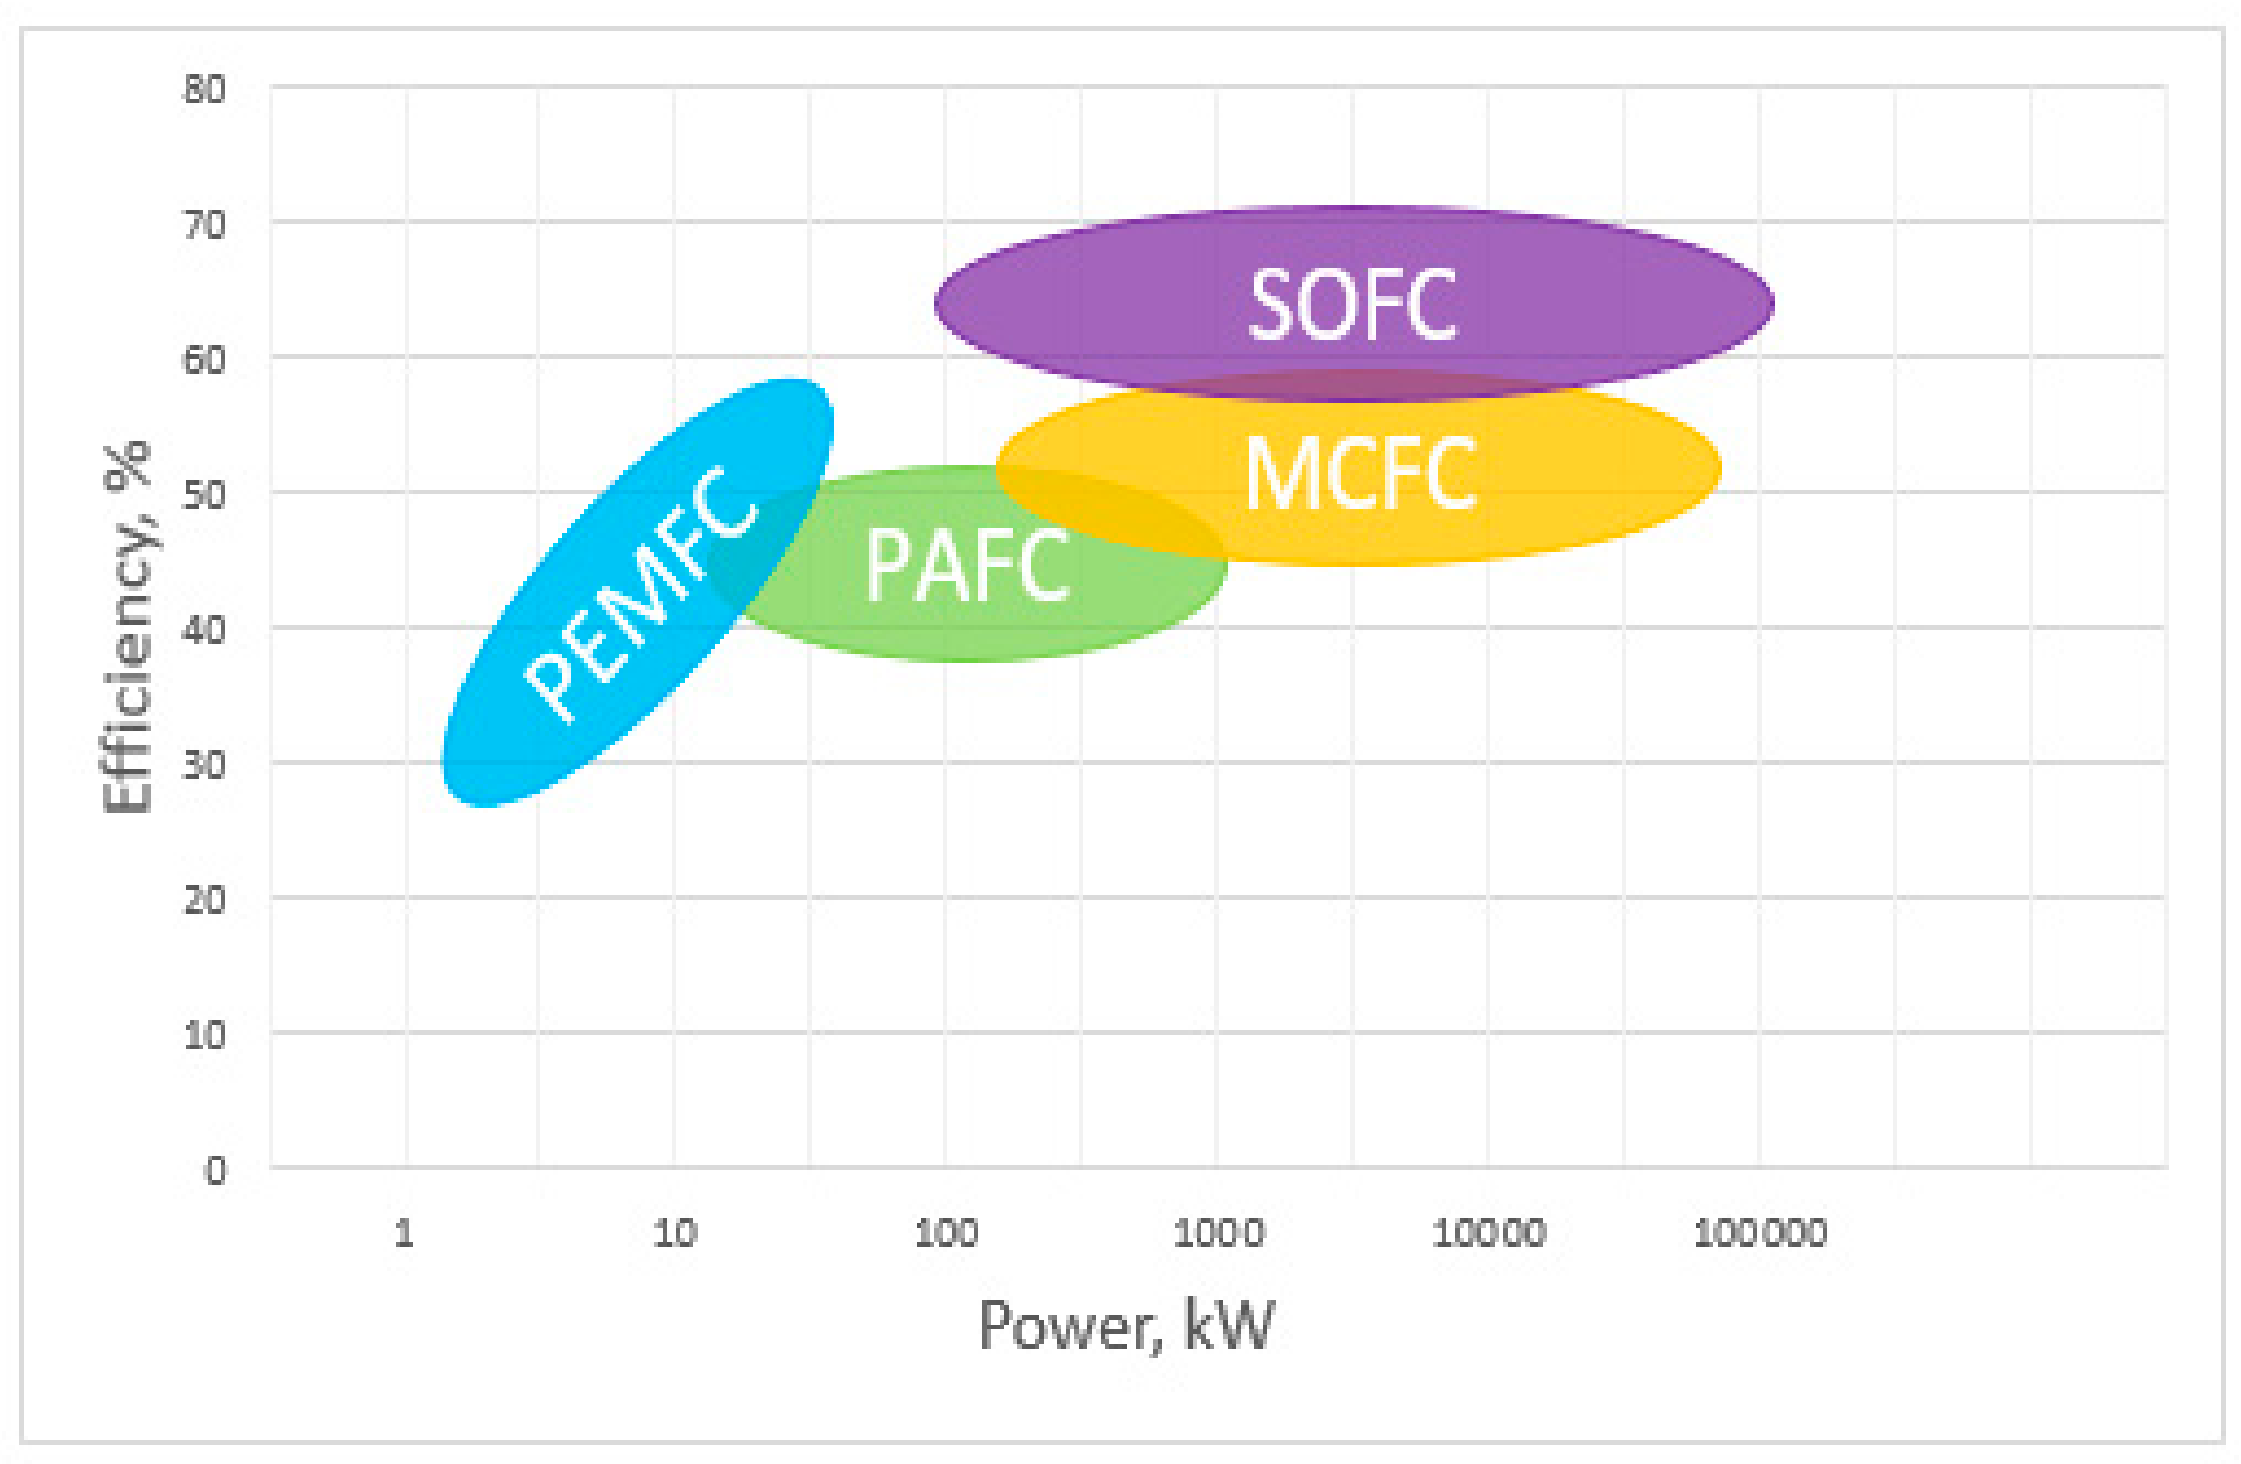
Most fuel cells generate electricity and heat via the chemical reaction between hydrogen and oxygen, and water is created as the product. Various types of fuel cells are being studied, and each of these fuel cells is classified according to the characteristics of its electrolyte. The properties of these cells are described in Figure 1 and Table 3 [19,24].
Although there are various types of fuel cells, such as in Table 3, in this paper, MCFCs are considered to be the main power source for the base load of the ship and were applied on the test bed. Because MCFCs operate at a high temperature, they can achieve a fast reaction rate even with a comparatively low-cost catalyst, a simple system design of a fuel cell, and low initial investment cost. In addition, even when the ship is sailing for a long time, natural gas or coal gas can be directly used as a fuel without installing an external reformer separately [16,22,23].

4. Comparative Analysis of Fuel Consumption and CO2 Emission Reductions in Hybrid Power Sources vs. Conventional Commercial Diesel Generators

4.1. Greenhouse Gas Calculation Method

4.1.1. Intergovernmental Panel on Climate Change (IPCC) Emission Coefficient

Emissions from ships include greenhouse gases (GHGs) emitted from the diesel engines, steam engines with boilers, and gas turbines, which are the main engine types used to power ships, ranging from leisure crafts to large-scale freighters. The emitting crafts, which are the focus of the ship section of the “Intergovernmental Panel on Climate Change (IPCC) Guidelines 2006” report, include sailing ships, fishing boats, and other ships. The method for calculating GHG emissions is presented in Table 4 [30].
The activity data used in the Tier 1 method are based on fuel consumption, thus emission coefficients are needed for each fuel and pollutant. In the case of CO2, SO2, and heavy metals, there is a close relationship between the emission coefficient and the CO2, SO2, and heavy metal content of the fuels. The calculations must take into account the related pollutant content in the fuel for each year and the target class of the ship according to the national region.
Tier 1 and Tier 2 emissions were calculated by using a method that uses petroleum sales as the index for the basic level of activity. It performs calculations by assuming the averaged characteristics of each ship type. The method to calculate Tier 3 emissions was based on the operating profile information of the ship. The Tier 3 method can be used when it is possible to collect not only the data on the engine, fuel usage, and duty cycle of the ship, but also information about its voyage. Because the actual voyage data of the ship must be taken into account, port arrival/departure statistical data regarding the voyage of the ship was used to calculate the fuel consumption and emissions while taking into account the emissions for each operating profile and the ship type, fuel type, engine type, technical specifications, and engine load, yearly operating time, etc.

4.1.2. IMO Conversion Emission Factor

At the 1997 MARPOL conference, research on the GHGs emitted by ships was presented via a discussion on “CO2 emissions from ships.” The first GHG study performed by the IMO was presented at the 45th the Marine Environment Protection Committee [MEPC] conference. At the 56th MPEC conference, it was determined that a second IMO GHG study would be performed to examine atmospheric emissions caused by exhaust gas emissions, volatile fuel emissions, and refrigerant leaks.
One goal of this study is to calculate the CO2 emissions occurring when a hybrid power source is used in a ship. For this, only the exhaust gas emissions of the diesel engine and fuel cell were considered. Although the IPCC calculates GHG emissions by taking into account the ship type, fuel type, engine type, etc., this study used the CO2 mass conversion factor, a dimensionless constant, presented in the “Calculation of Energy Efficiency Operational Indicator Based on Operational Data” to calculate the CO2 emissions (IMO MEPC1/Circ 684 2009). GHG emissions were calculated by using the IPCC 2006 guidelines for CH4 and N2O in Table 5 (IPCC 2006), and the ISO 8217 Grades DMX conversion factor was used for CO2 [31,32,33].

4.2. Specifications of Components in the Fuel-Cell-Based Hybrid Power Source Test Bed

The process flow diagram (PFD) of the fuel-cell-based hybrid power source test bed is shown in Figure 2. The test bed was composed of the following specific components: The MCFC system, energy storage system (ESS), diesel generator, load bank, and intelligent energy management system [34,35,36,37].

4.2.1. MCFC System

The fuel cell used in the test bed was a 300 kW MCFC system composed of a stack module, an electric balance of plant (EBOP), and a machinery balance of plant (MBOP) [38]. The fuel cell system constituting the combined power source was operated with a rated capacity of 300 kW. However, a 100 kW output was used in a practical test bed. The MBOP was pretreated to make a better chemical reaction between the fuel gas and air, which concludes a pre-former, heater, humidifier, valves, pump, and blower [39]. The specifications are listed in Table 6.
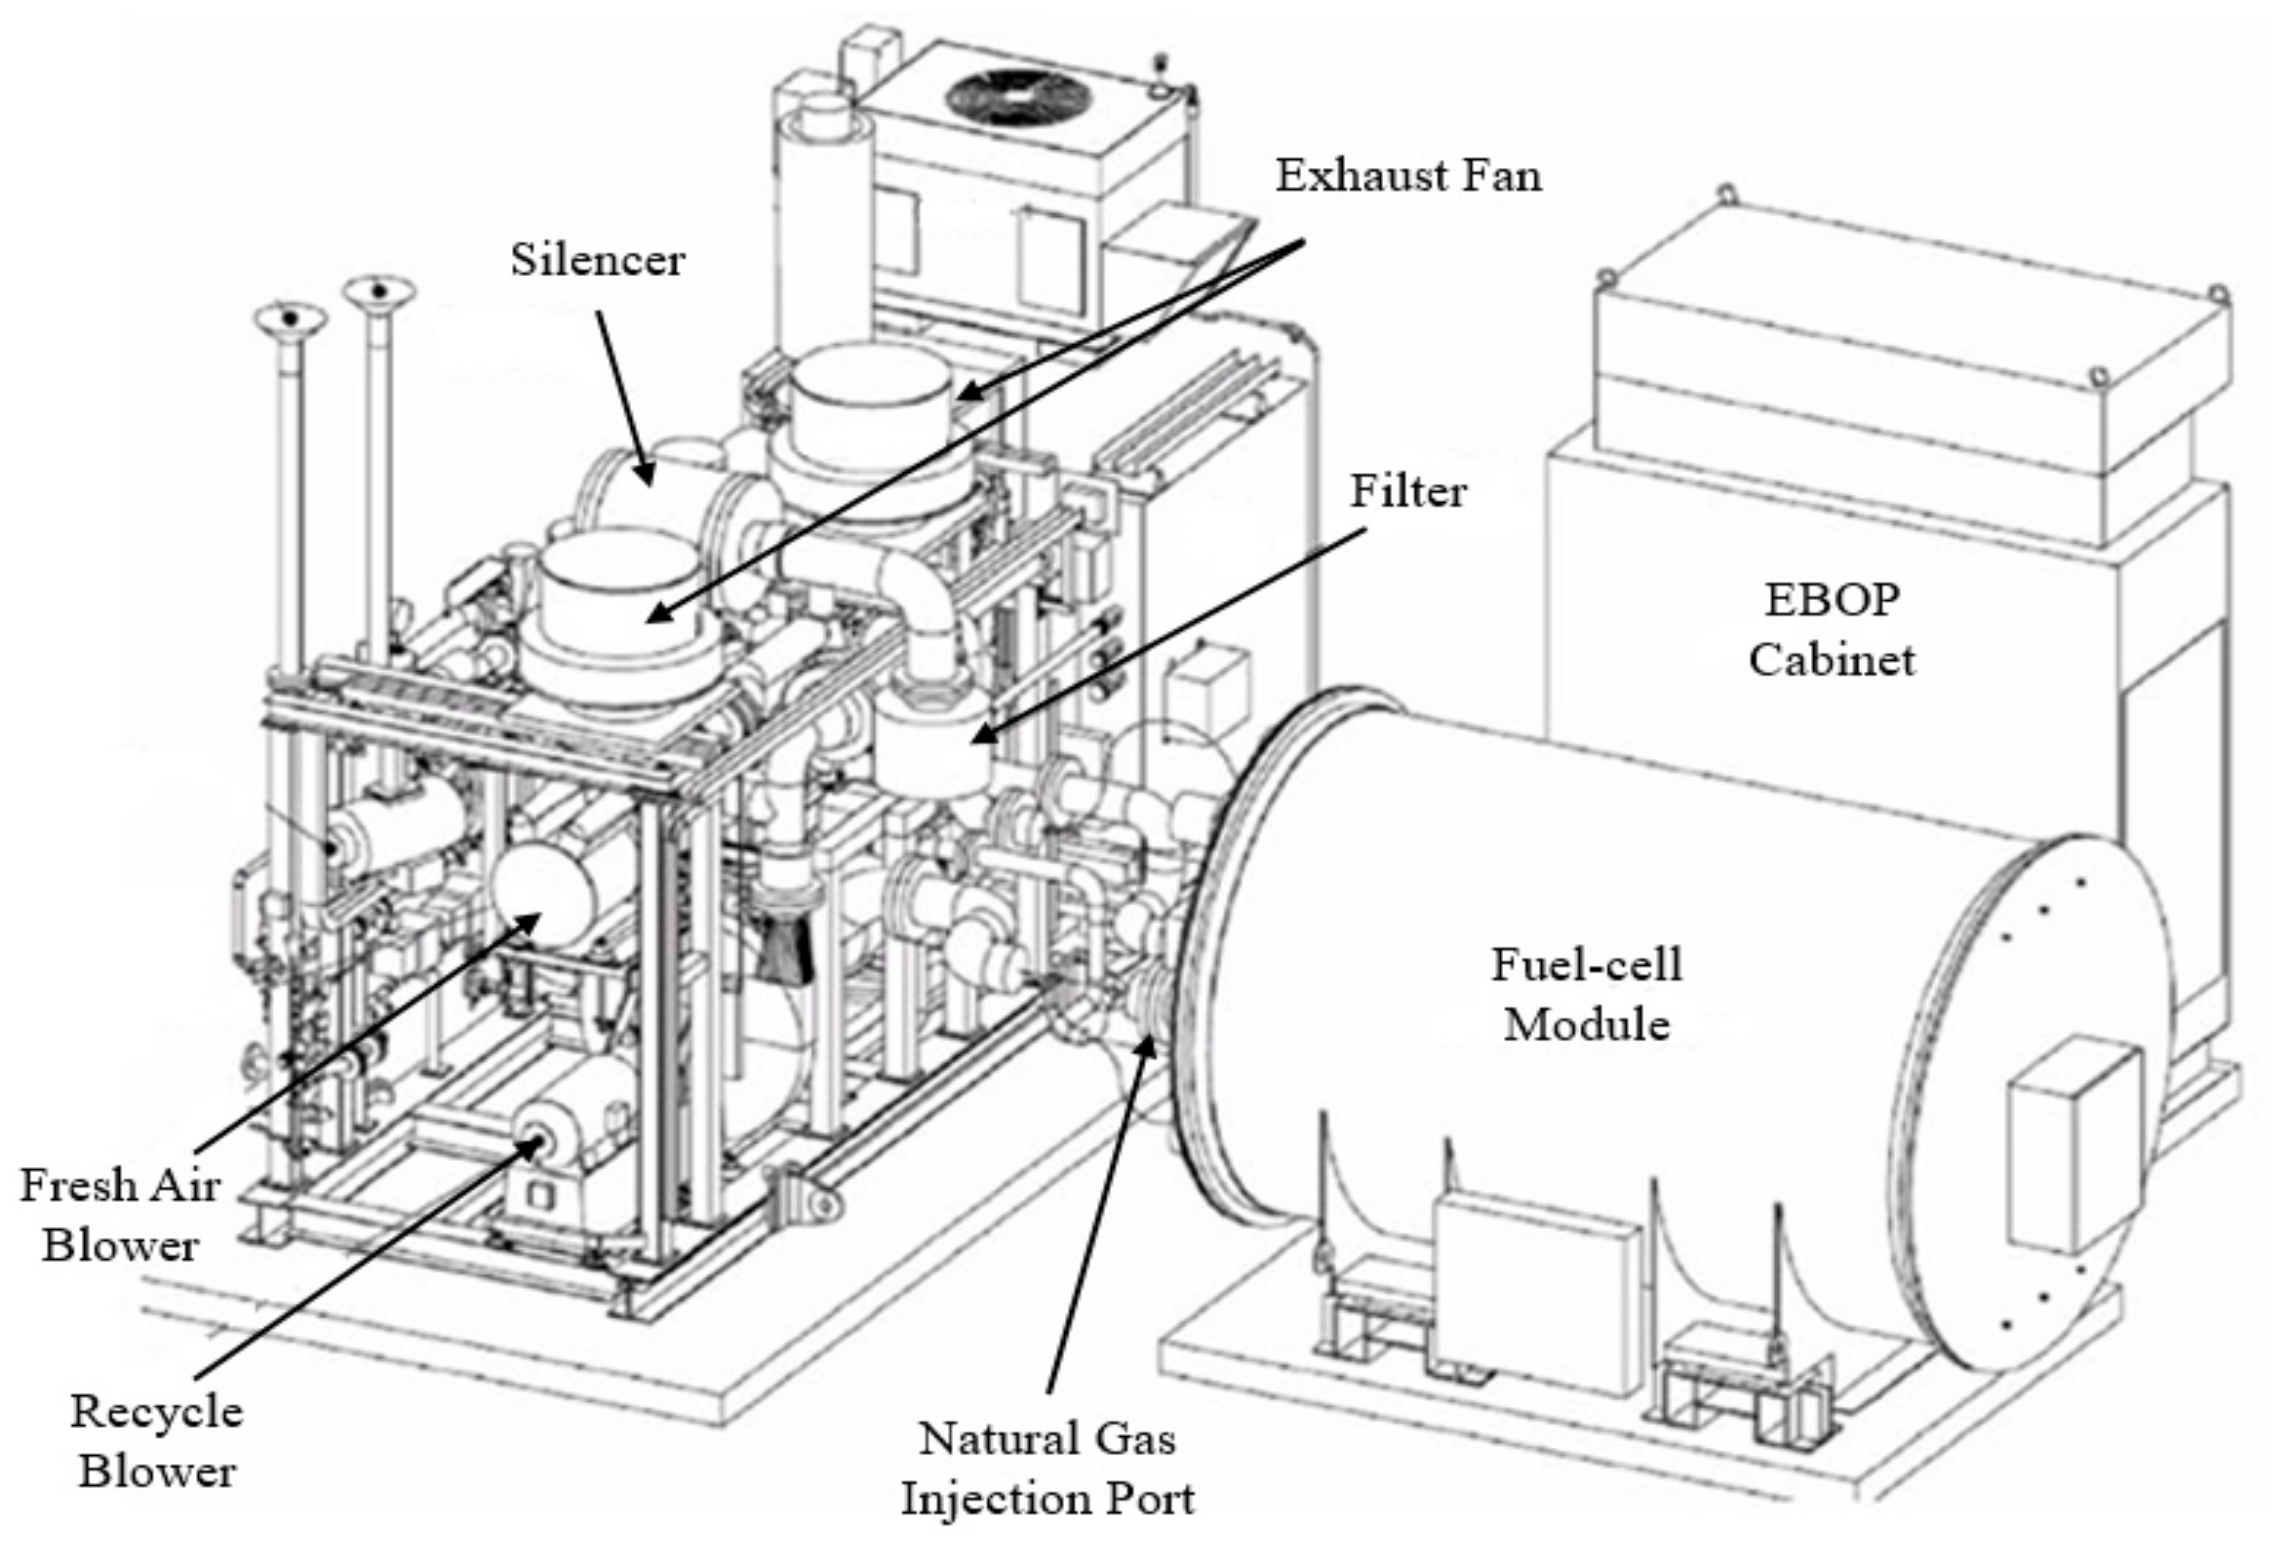
The peripheral equipment needed by the fuel cell system is shown in Figure 3. It includes a fuel injection part for supplying natural gas, a potable water injection part for producing ultrapure water, a part for emitting drainage water resulting from the production of ultrapure water, and a nitrogen/mixed gas injection part for protecting the stack. The air injection and exhaust gas emission parts were at the top of the MBOP. Two exhaust fans were installed within the MBOP [40].
The power generation concept of the fuel cell system is shown in Figure 4. The system was composed of a heat-up operating mode, which increases the initial temperature of the fuel cell stack module, a ramp-up operating mode, which increases the power to the rated output for actual power generation, and the operation mode, which produces the rated output.

4.2.2. Energy Storage System (ESS)

The energy storage system is the electricity storage device, which uses electricity in the battery generated by the fuel cell stored. As shown in Figure 5, it is composed of a secondary battery and power conditioning system (PCS) [41].
A lead-acid battery was used for the ESS in the test bed, and it was built using the bidirectional connection system, of which the specifications are listed in Table 7. The PCS has functions for checking the state of charging (SOC) of batteries in real time and controlling the temperature, current, and voltage to enable the system to be operated in a stable manner. It also has functions for surge protection, automated prevention of overcharging/overload, overvoltage alarms, and overvoltage prevention.

4.2.3. Diesel Generator System (DGS)

The 50 kW synchronous generator used in the test bed is a revolving-field-type generator which uses a permanent magnet. Its specifications are given in Table 8.

4.2.4. Load Bank

The load bank is a forced air-cooled load bank with a rated capacity of 300 kW. It has high resistivity and experiences little change in resistance due to temperature increases. It uses an iron-chrome type 2 heating wire (FCHW-2). The load bank was used in the test bed to provide the electrical load for testing power sources, such as the generator or the uninterruptable power supply. The specifications of the load bank are listed in Table 9. The resistance of the load bank was connected in parallel to allow the load capacity to be adjusted.

4.2.5. Intelligent Energy Management System (IEMS)

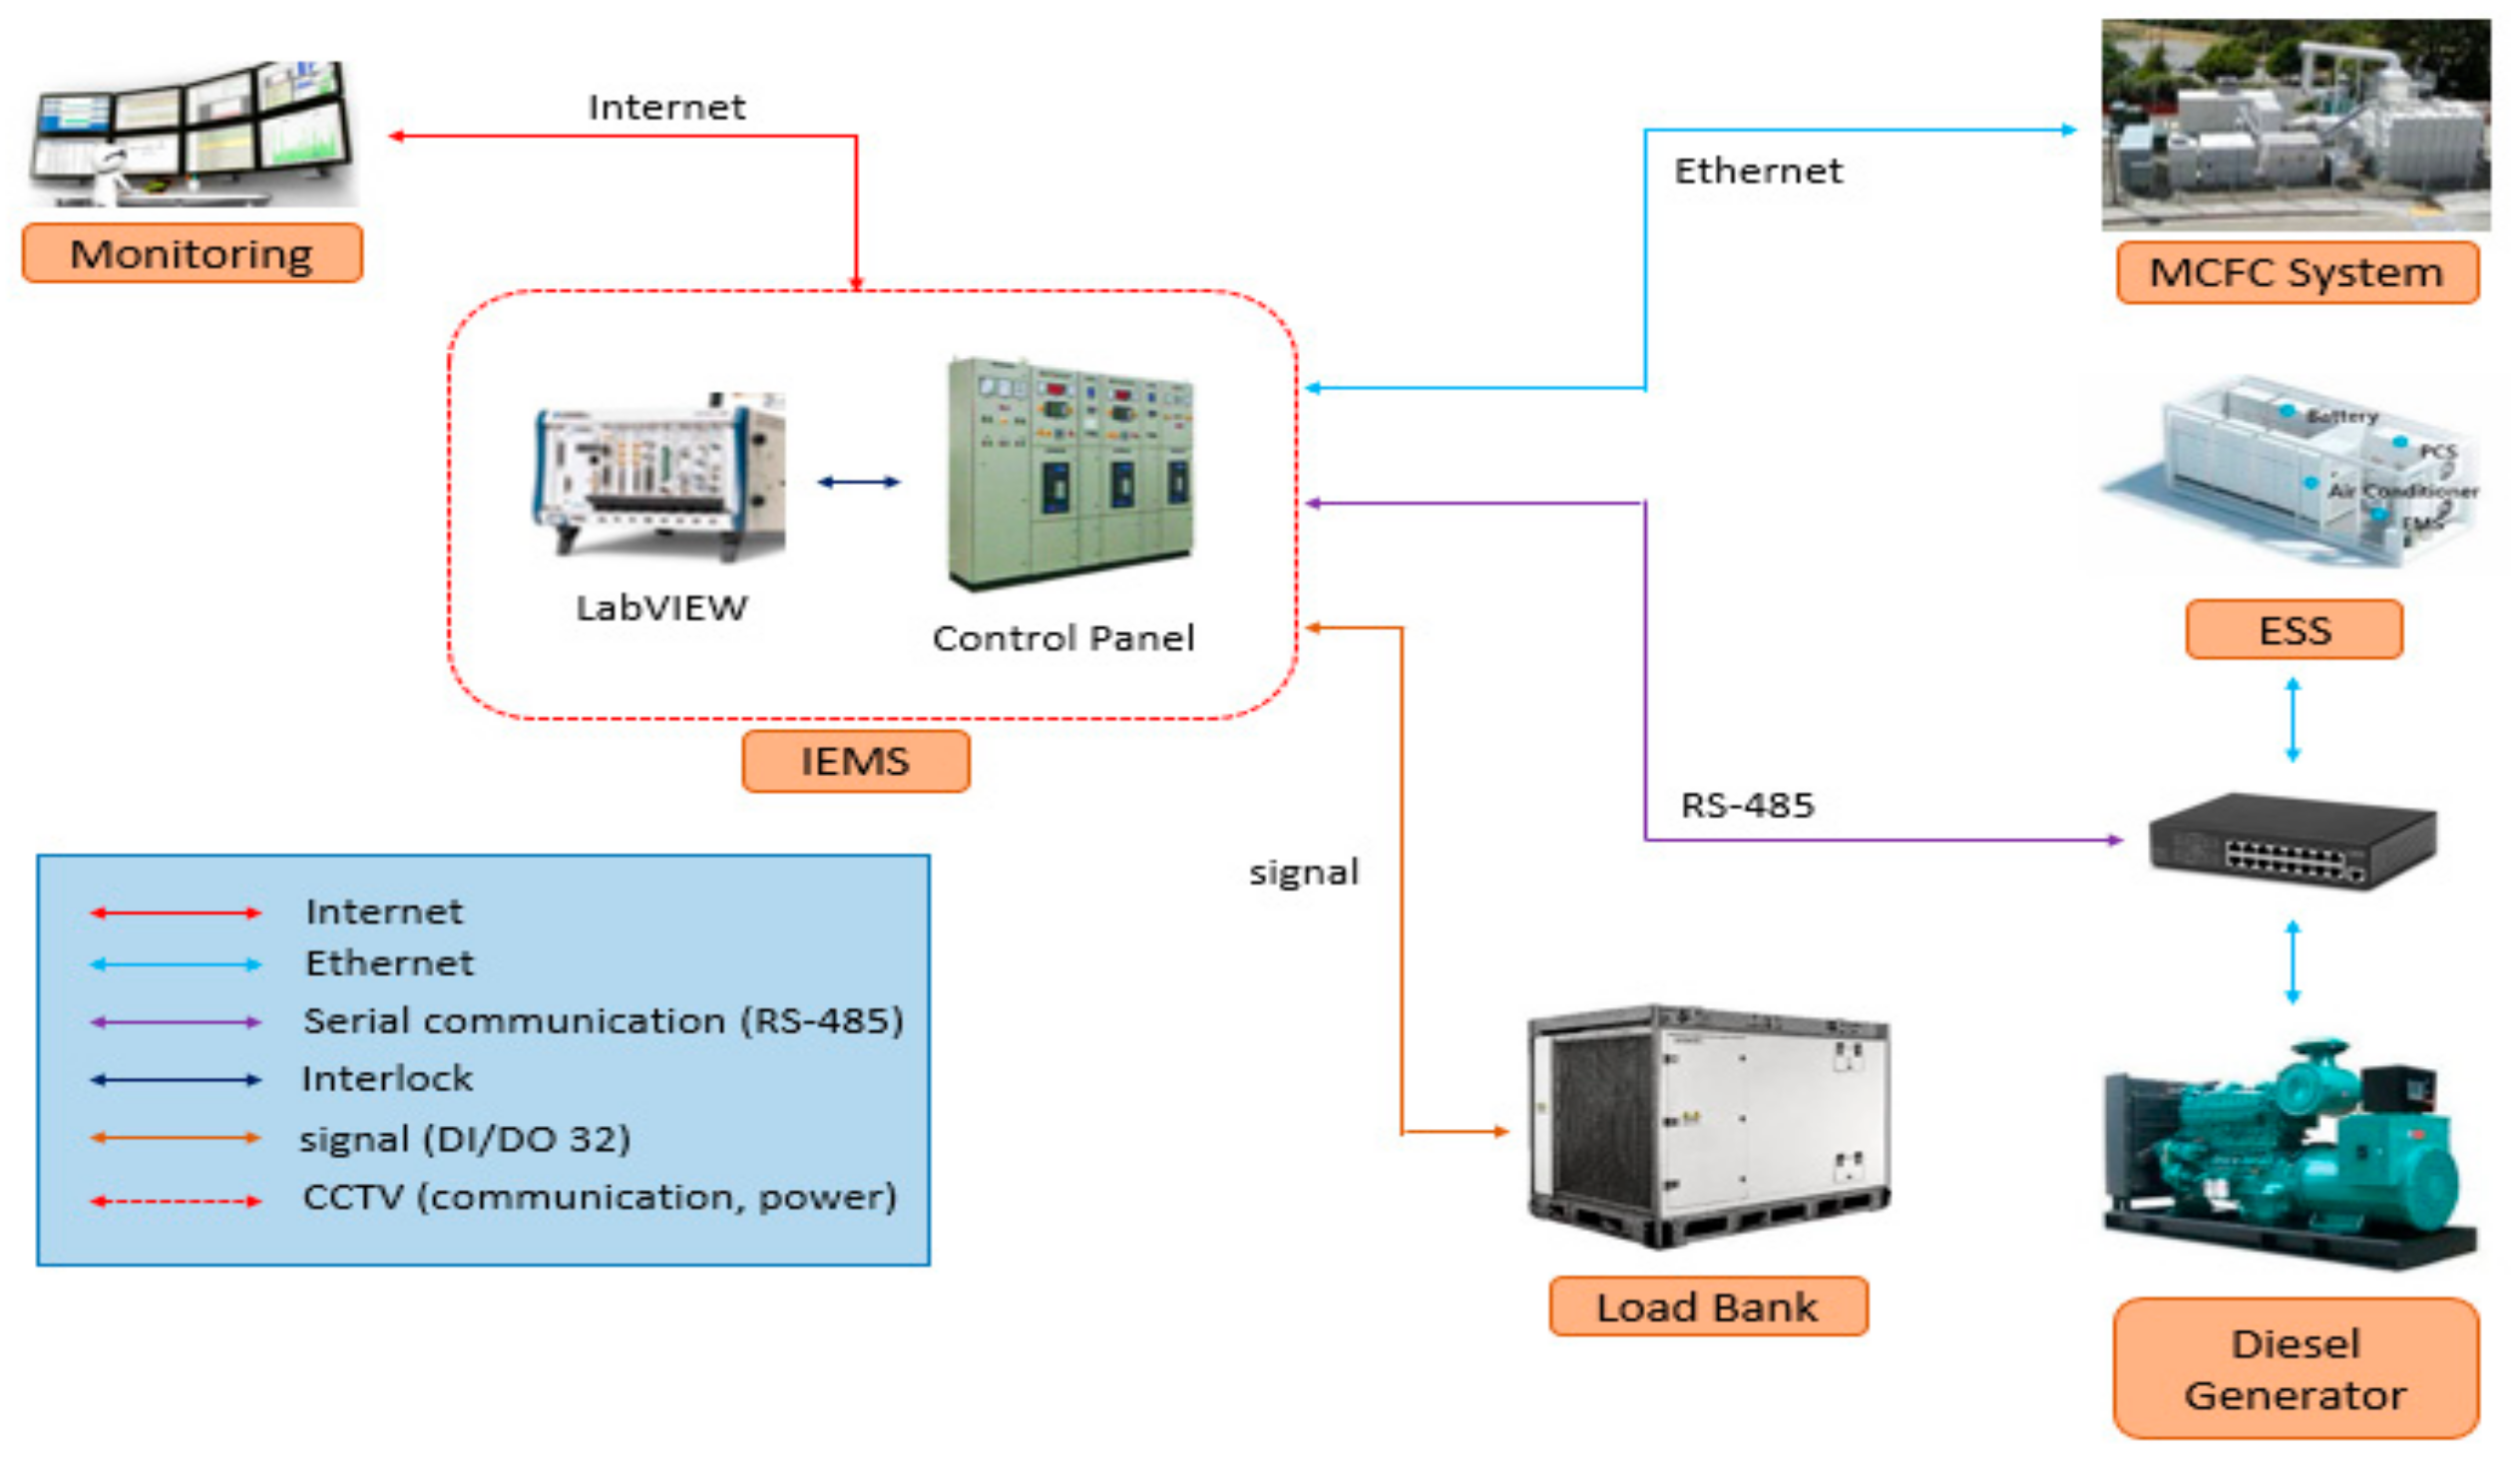
The intelligent energy management system (IEMS) is a control system which monitors the voltage, current, and output of each device and the system state in real time and enables the system to be operated reliably. It adjusts the load of the load bank according to the load pattern in real time and allows the different devices to be synchronized [42,43,44,45,46].
The test bed was organized such that the IEMS and power sources (MCFC, diesel generator system (DGS), and ESS) could send and receive device statuses and operation commands through an interface, as shown in Figure 6. Communications were based on an RS-285 and Ethernet to take into account noise and effects of external factors, such as surrounding devices. In addition, an external connection to the internet was used to allow the operating test bed system to be monitored from locations with internet connectivity.
As shown in the Table 10 below, the control logic was configured to control the complex power system according to the SOC of the ESS according to the load.

4.3. Comparison of Fuel Consumption and CO2 Emission Reduction Rates of the Conventional Commercial Diesel Engine vs. the Hybrid Power Source

4.3.1. Conventional Commercial Diesel Power Source vs. the Fuel-Cell-Based Hybrid Power Source (FCHPS)

The conventional commercial diesel power source was selected from the Doosan Infracore’s P126-TI model with a capacity of 241 kW, which was optimized for an average load of 80%. This generator’s specific rated power was 80% load of 241 kW, 192.8 kW and selected as the standard model of the diesel generator of the test bed. The diesel generator for fuel cell-based hybrid power source was selected as a DB-58 model with a capacity of 70 kW among the diesel engines of the Doosan Infracore’s generator. The generator was also optimized for an average load of 80%, 56 kW was selected as the diesel generator reference model for the combined power source of the test bed.
In order to analyze the CO2 emissions reduction of the combined power source, the fuel consumption and the carbon dioxide emissions of the commercial diesel generator optimized for the same power as the hybrid power source were applied to the baseload. To compare the fuel consumption of the MCFC and the diesel generator of the combined power source, each fuel consumption amount was converted into the petroleum conversion factor (1 Tonnage of oil equivalent [TOE] = 1000 kgoe). As shown in the Table 11 and Table 12, the fuel consumption factor of the diesel generator and the MCFC were matched by applying the energy calorific value conversion factor to each fuel consumption amount for application of the petroleum conversion factor.
Estimation of greenhouse gas emissions was based on the methodology presented in the IPCC Guidelines. In international organizations and countries, emission factors are calculated and used according to the IPCC Guidelines. IMO has also developed a method for estimating carbon dioxide emissions for ships based on the IPCC Guidelines. However, the IPCC Guidelines provide a methodology for estimating emission factors, but IMO suggests a calculation method using conversion factors [47]. Table 11 and Table 12 show a calculation formula and conversion standard.

4.3.2. Analysis of Fuel Consumption and CO2 Emissions Reduction in Hybrid Power Source

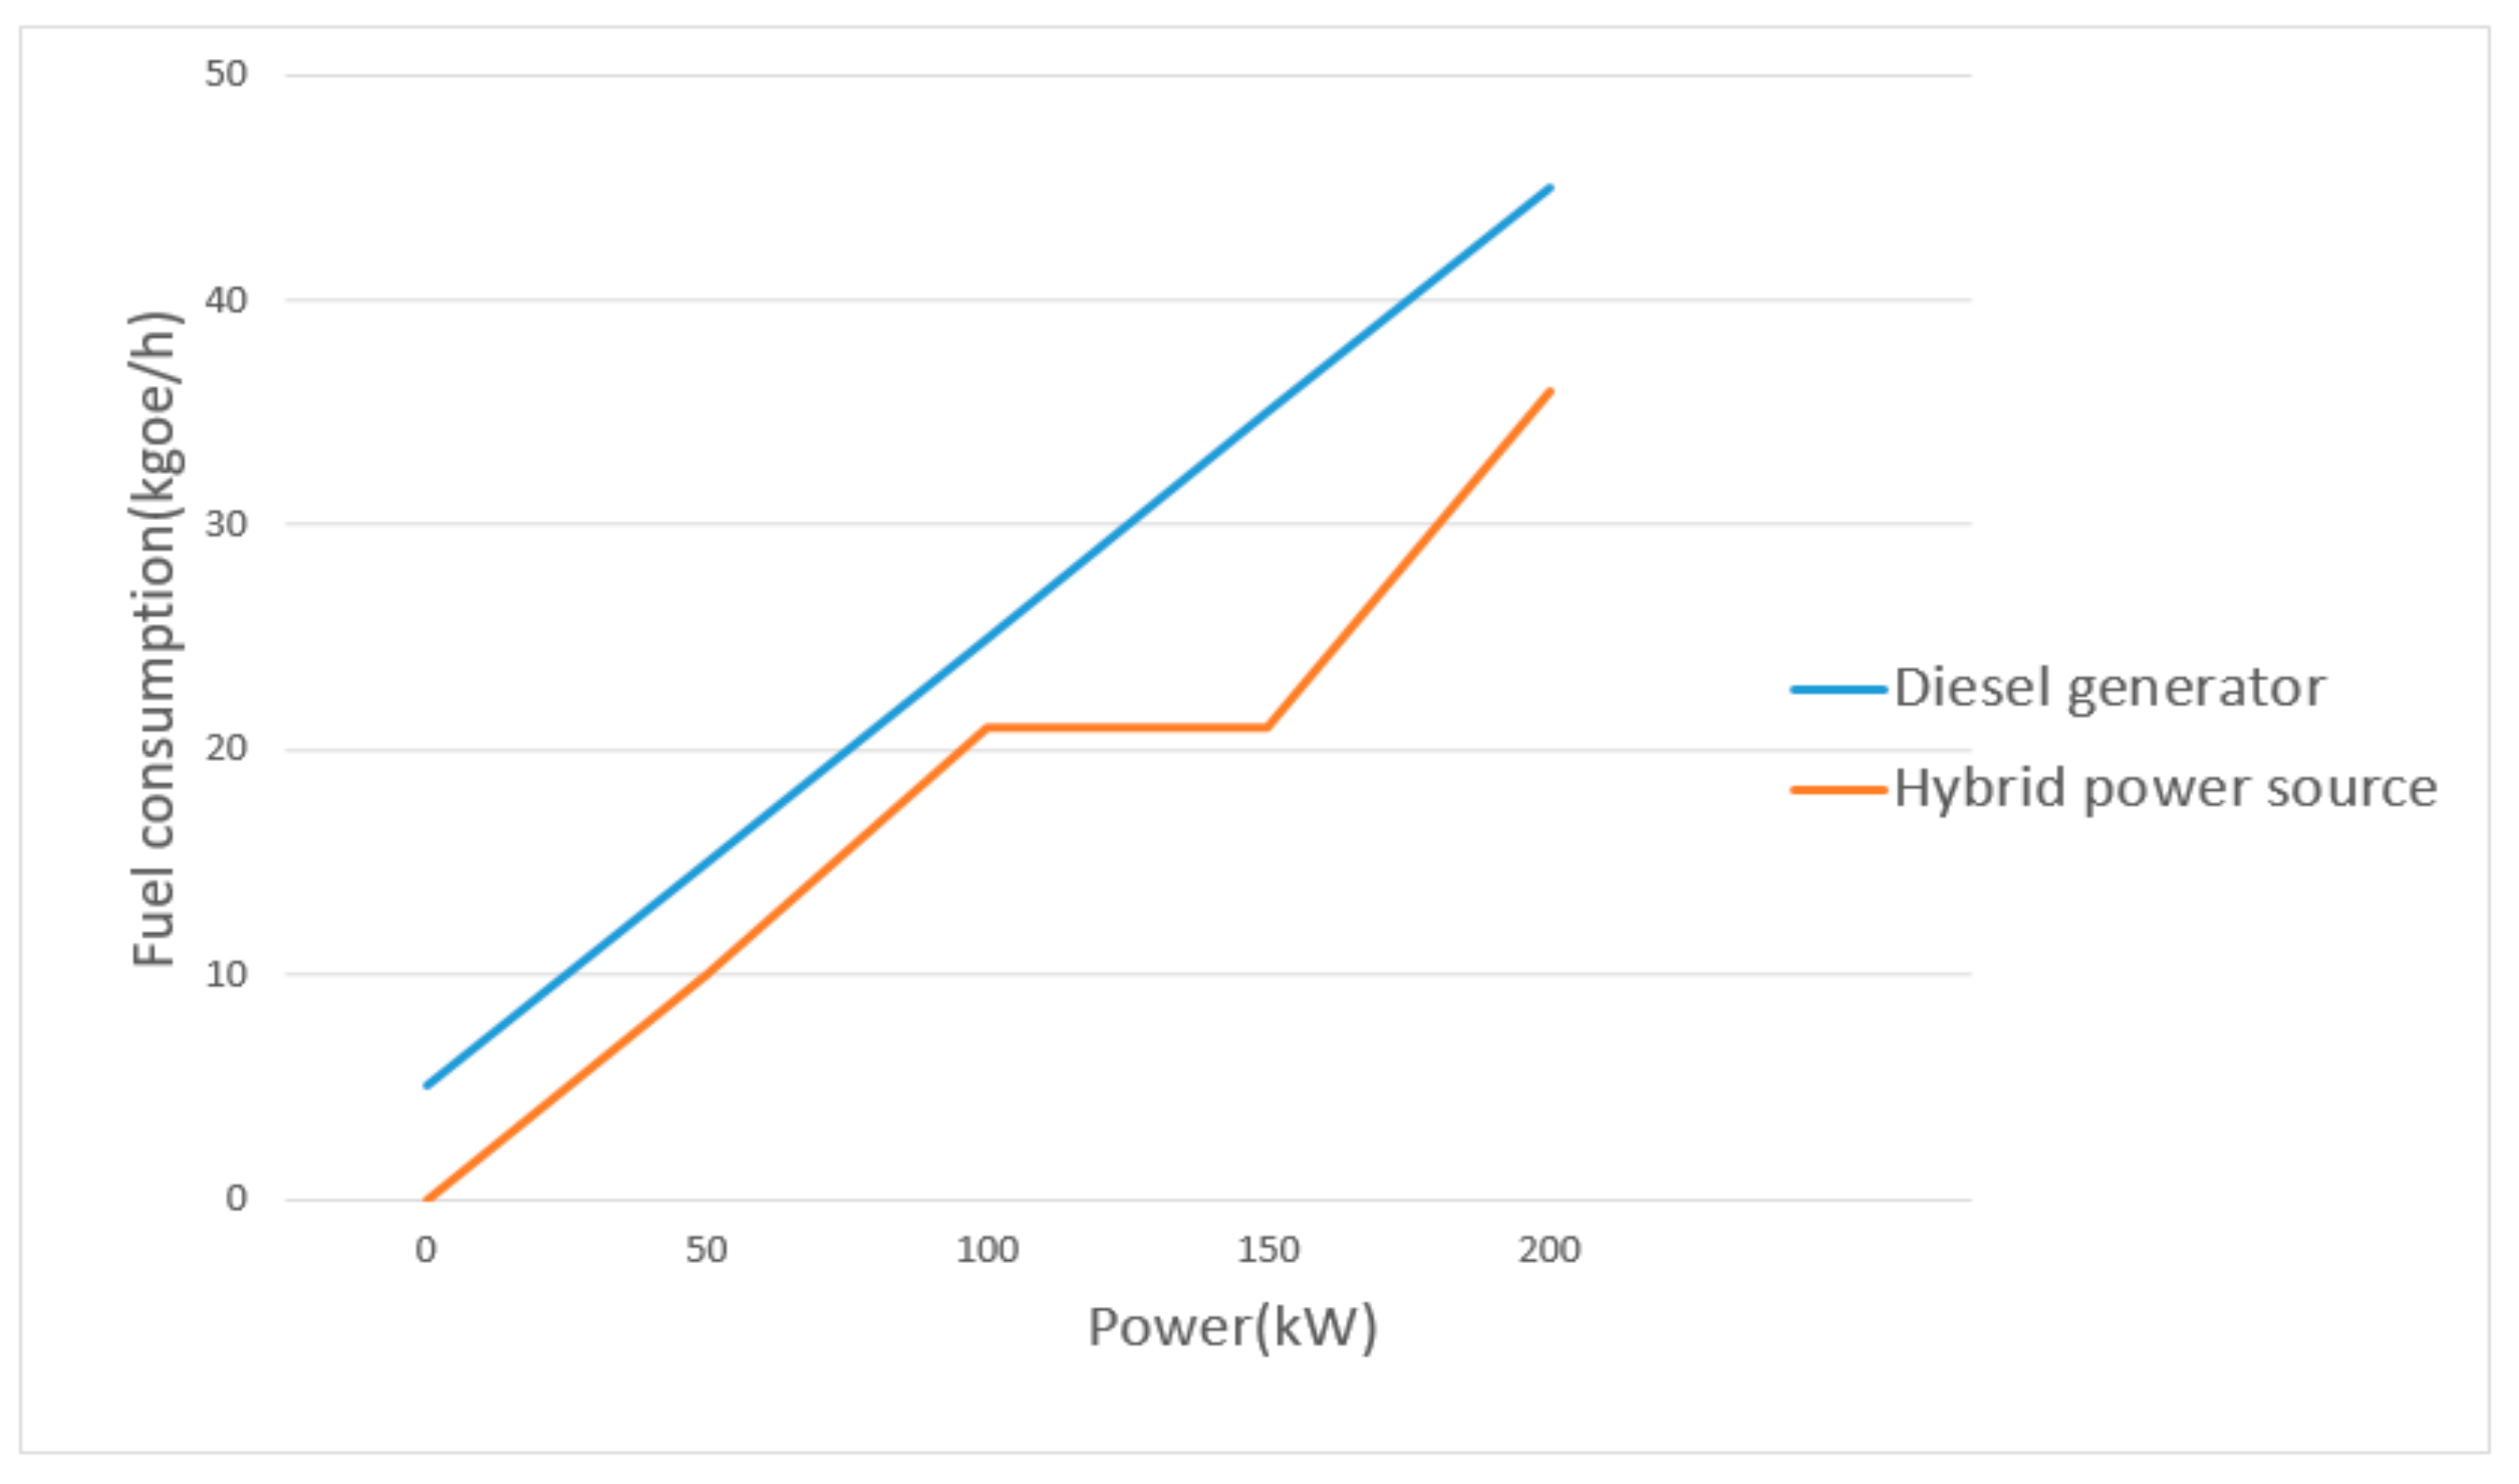
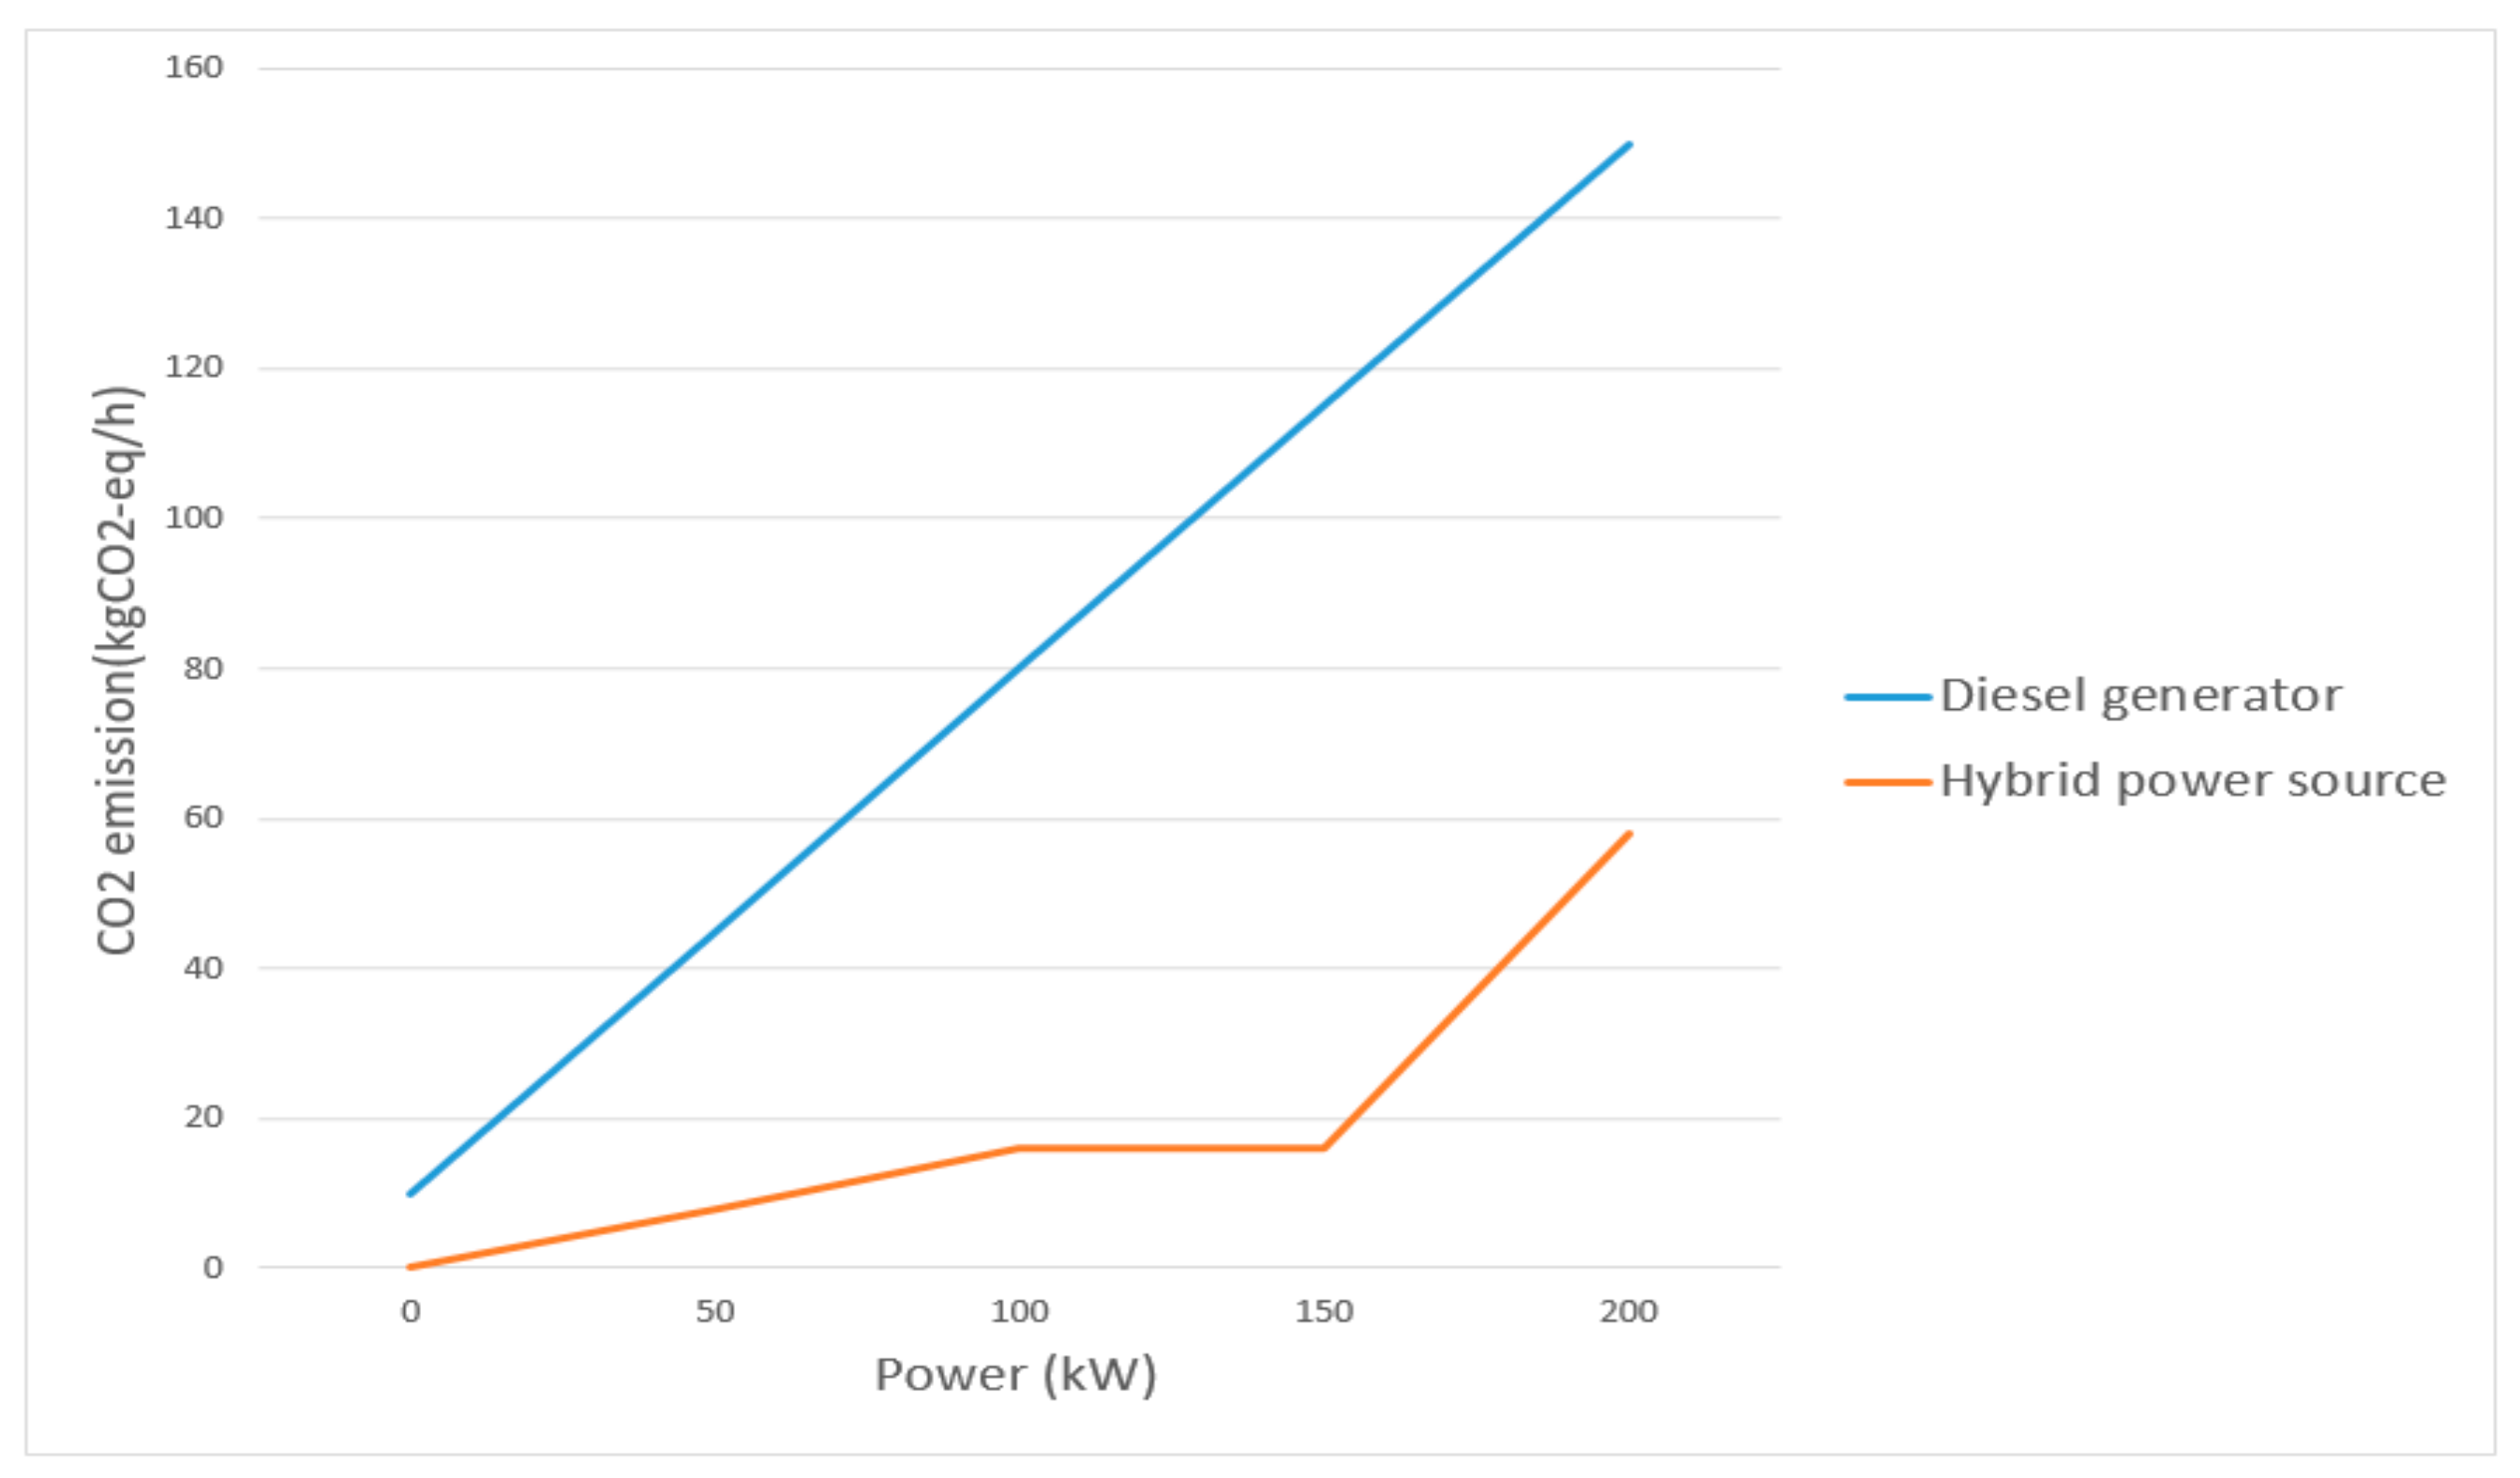
The test bed used in this study consisted of a hybrid power source with a combined capacity of 180 kW (100 kW fuel cell, 30 kW battery, and 50 kW diesel generator). The power generation in the hybrid power source was designed such that the fuel cell was set for base-load operation and the battery and diesel generator operated in sequence. At 100 kW in Figure 7, there is a 1% difference in the fuel consumption of the commercial diesel generator and the fuel cell. At 130 kW, the difference in fuel consumption with the diesel generator increases because the fuel cell and the battery, which does not need fuel supply, are operating. At 180 kW, the fuel cell, battery, and diesel generator were operating, and it can be seen that there was a reduction in the fuel consumption and CO2 emissions of the hybrid power source compared to the commercial diesel generator. At 100 kW in Figure 8, the CO2 emissions of the fuel cell are 9% of those of the commercial diesel engine. At 130 kW, at which the fuel cell and battery were operating, the difference in CO2 emissions compared with the diesel generator increases. At 180 kW, at which the fuel cell, battery, and diesel generator were operating, the CO2 emissions of the hybrid power source were reduced by 39% compared to that of the commercial diesel generator. Table 13 shows the CO2 emission reduction rates.

5. Analysis of Fuel Consumption and CO2 Emission Reduction in a Fuel-Cell-Based Hybrid Power Source Using Simulations of Operating Profiles by Type of Ship

The actual electric load analysis values that were used in this study were taken from the operating profiles of ships, including a 5500 TEU Reefer Container, a 13000 TEU Container, a 40 k DWT Bulk Carrier, 130 k DWT LNG Carrier, and 300 k DWT very large crude oil carrier (VLCC). These values were scaled down for each operation mode and suitable load scenarios for each ship type were used. To utilize scale-down methodology, the linear interpolation method is applied [48]. For example, if the original 5500 TEU Reefer Container’s rated power is 4154 kW, the rated power of the test bed is 180 kW, when applying the scale down method. At part load, 1424 kW will be converted to 61 kW. All following test bed operating loads were calculated in this way. For the load scenarios in Table 14, according to the ship type operating scenarios, the following power sources were applied.

5.1. 5500 TEU Reefer Container

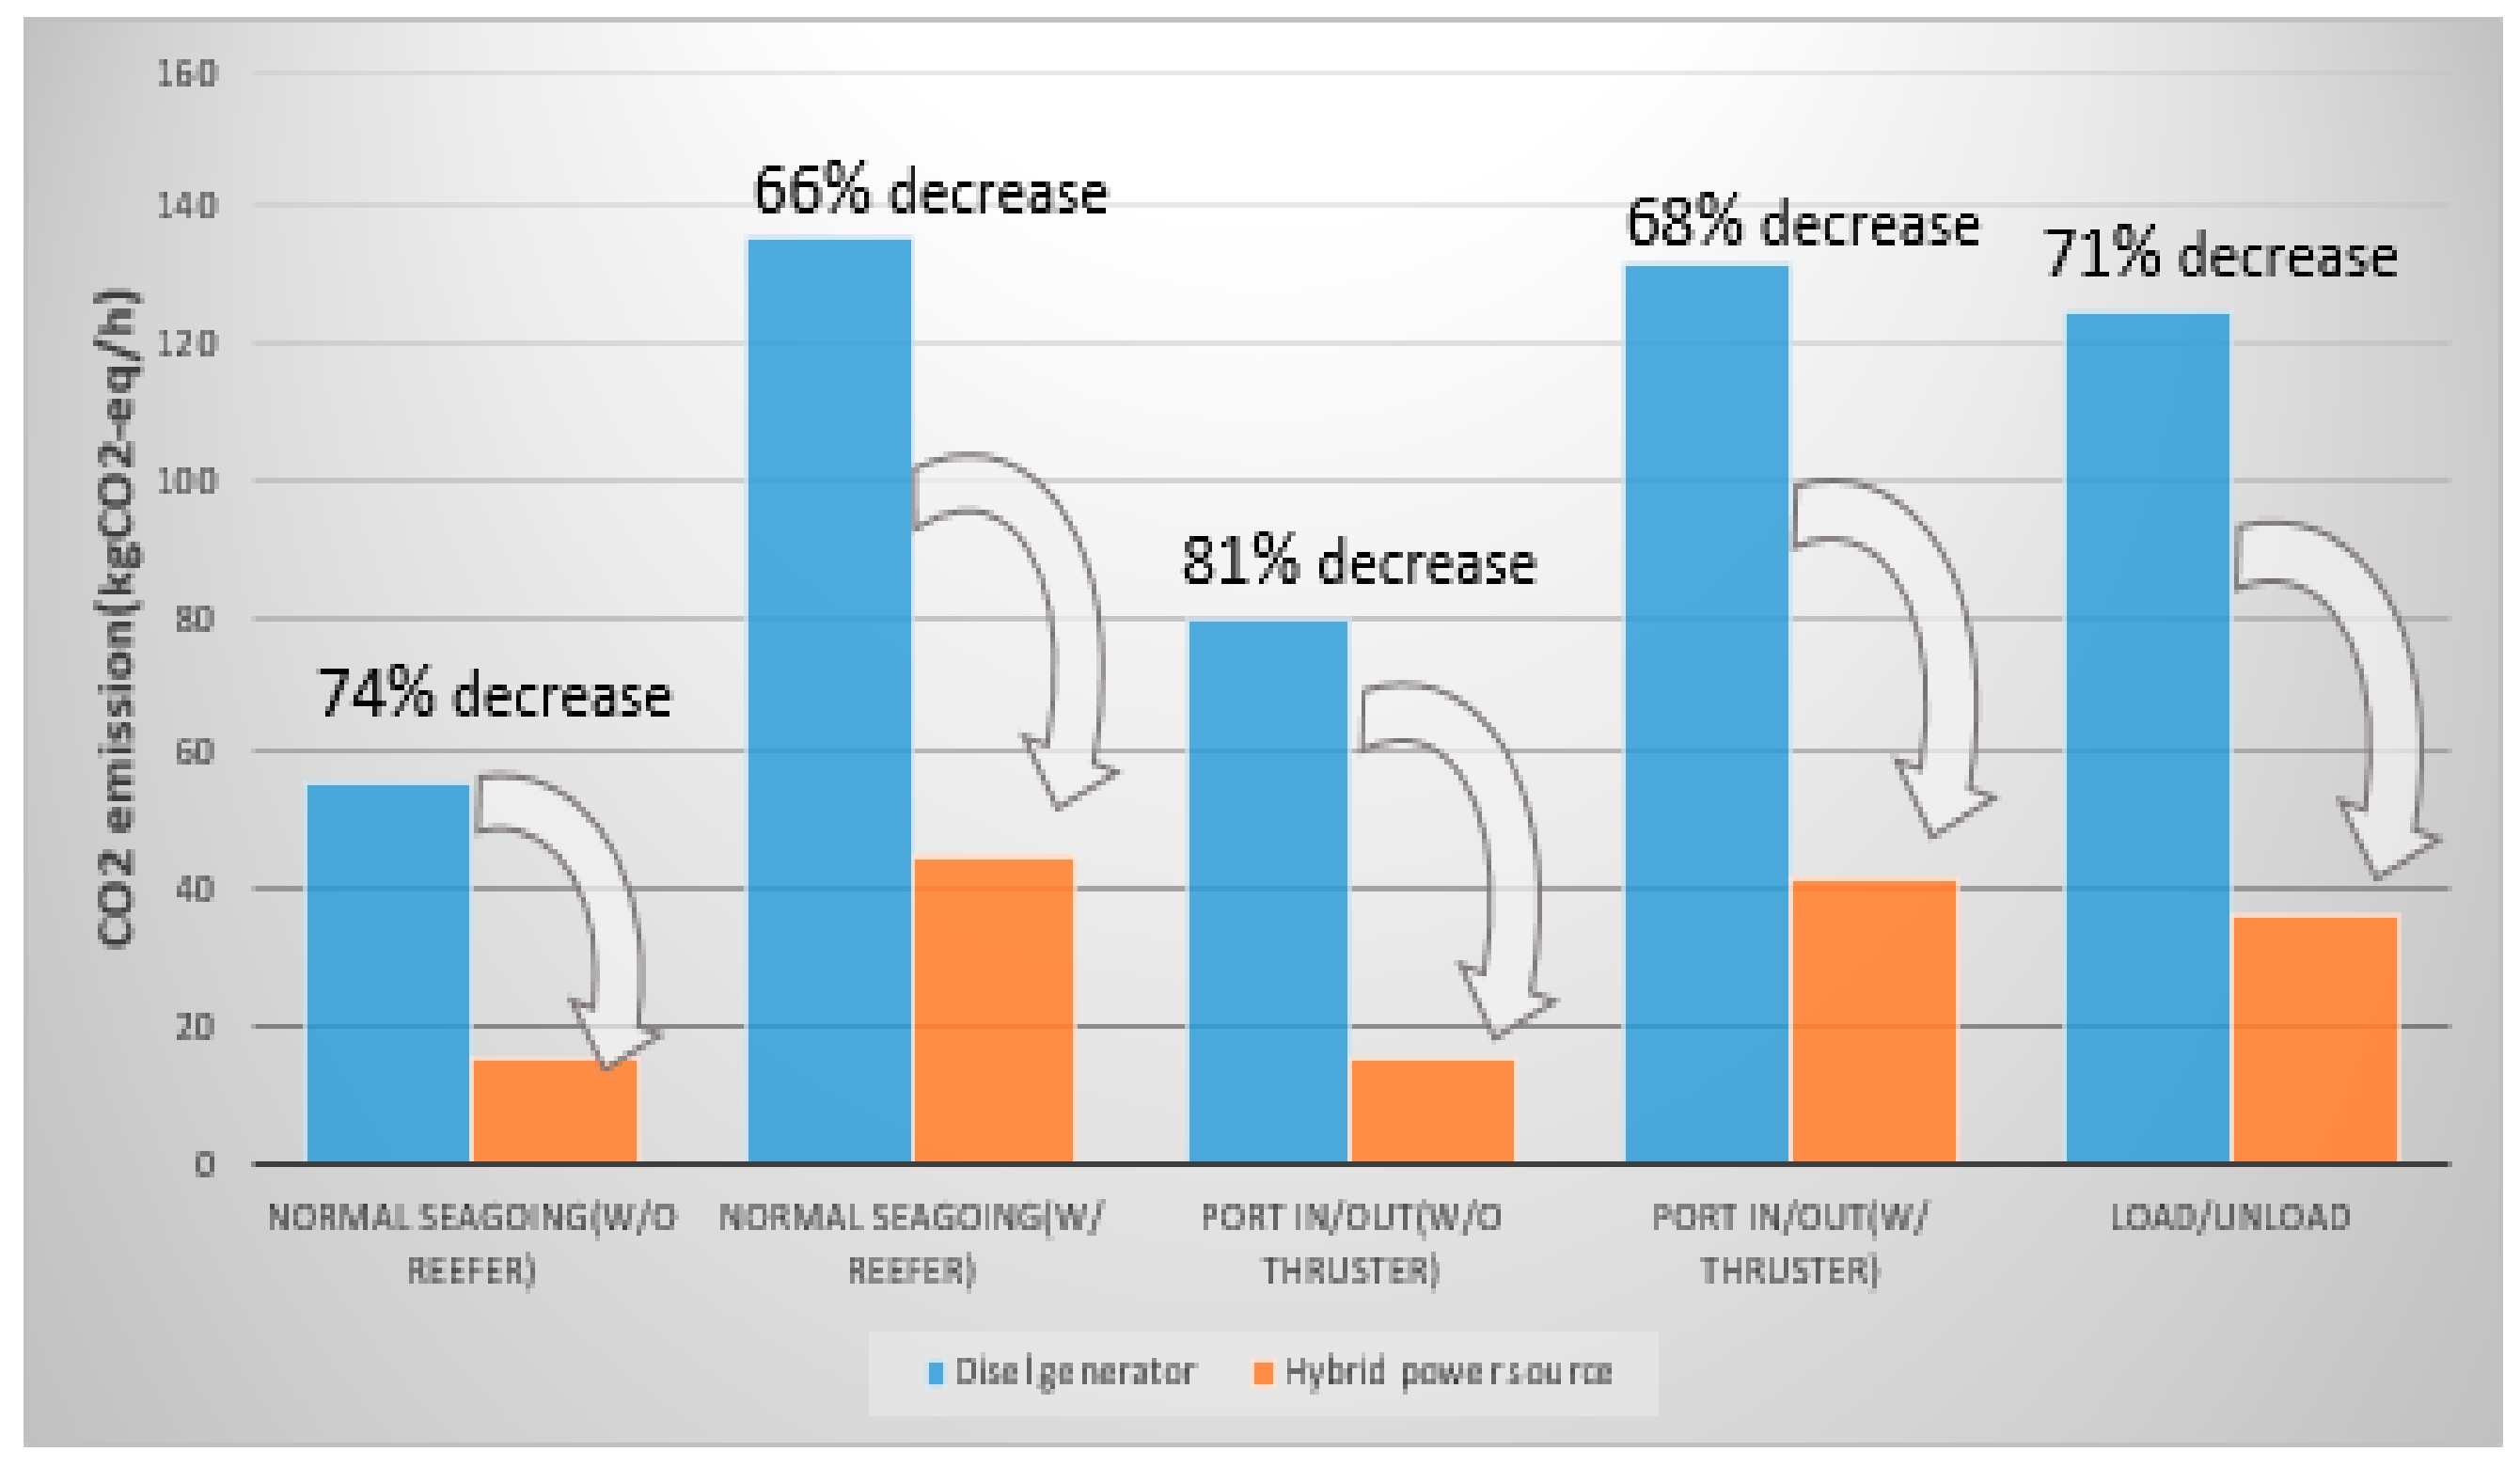
The 5500 TEU reefer container uses the following operating modes during operations: Normal seagoing (without reefer), normal seagoing (with reefer), port in/out (without thruster), port in/out (with thruster), and load/unload. To perform the test bed experiments, the scale of the values obtained as a result of the electric load analysis were adjusted to reflect the output of each operating mode of an actual ship. As shown in Figure 9, the hybrid power source was used in the load scenarios of this ship. Normal seagoing (without reefer) was a fuel cell operation interval. Normal seagoing (with reefer) was a fuel cell + battery + diesel generator operation interval. Port in/out (without thruster) was a fuel cell operation interval. Port in/out (with thruster) and load/unload were fuel cell + battery + diesel generator operation intervals. The scale-adjusted electric load analysis was applied to the test bed, and the output tests were carried out.
Figure 10 compares the fuel consumption during each operating mode of this ship. The fuel consumption reached a maximum during the normal seagoing (with reefer) mode and a minimum during the normal seagoing (without reefer) mode. As the load increased, the fuel consumption increased; similarly, as the load decreased, the fuel consumption decreased. However, when observing the CO2 emission reduction rates shown in Figure 11, it can be seen that the CO2 emission reduction rate was the highest in the port in/out (without thruster) mode, during which the second least amount of fuel was consumed.

5.2. 13000 TEU Container

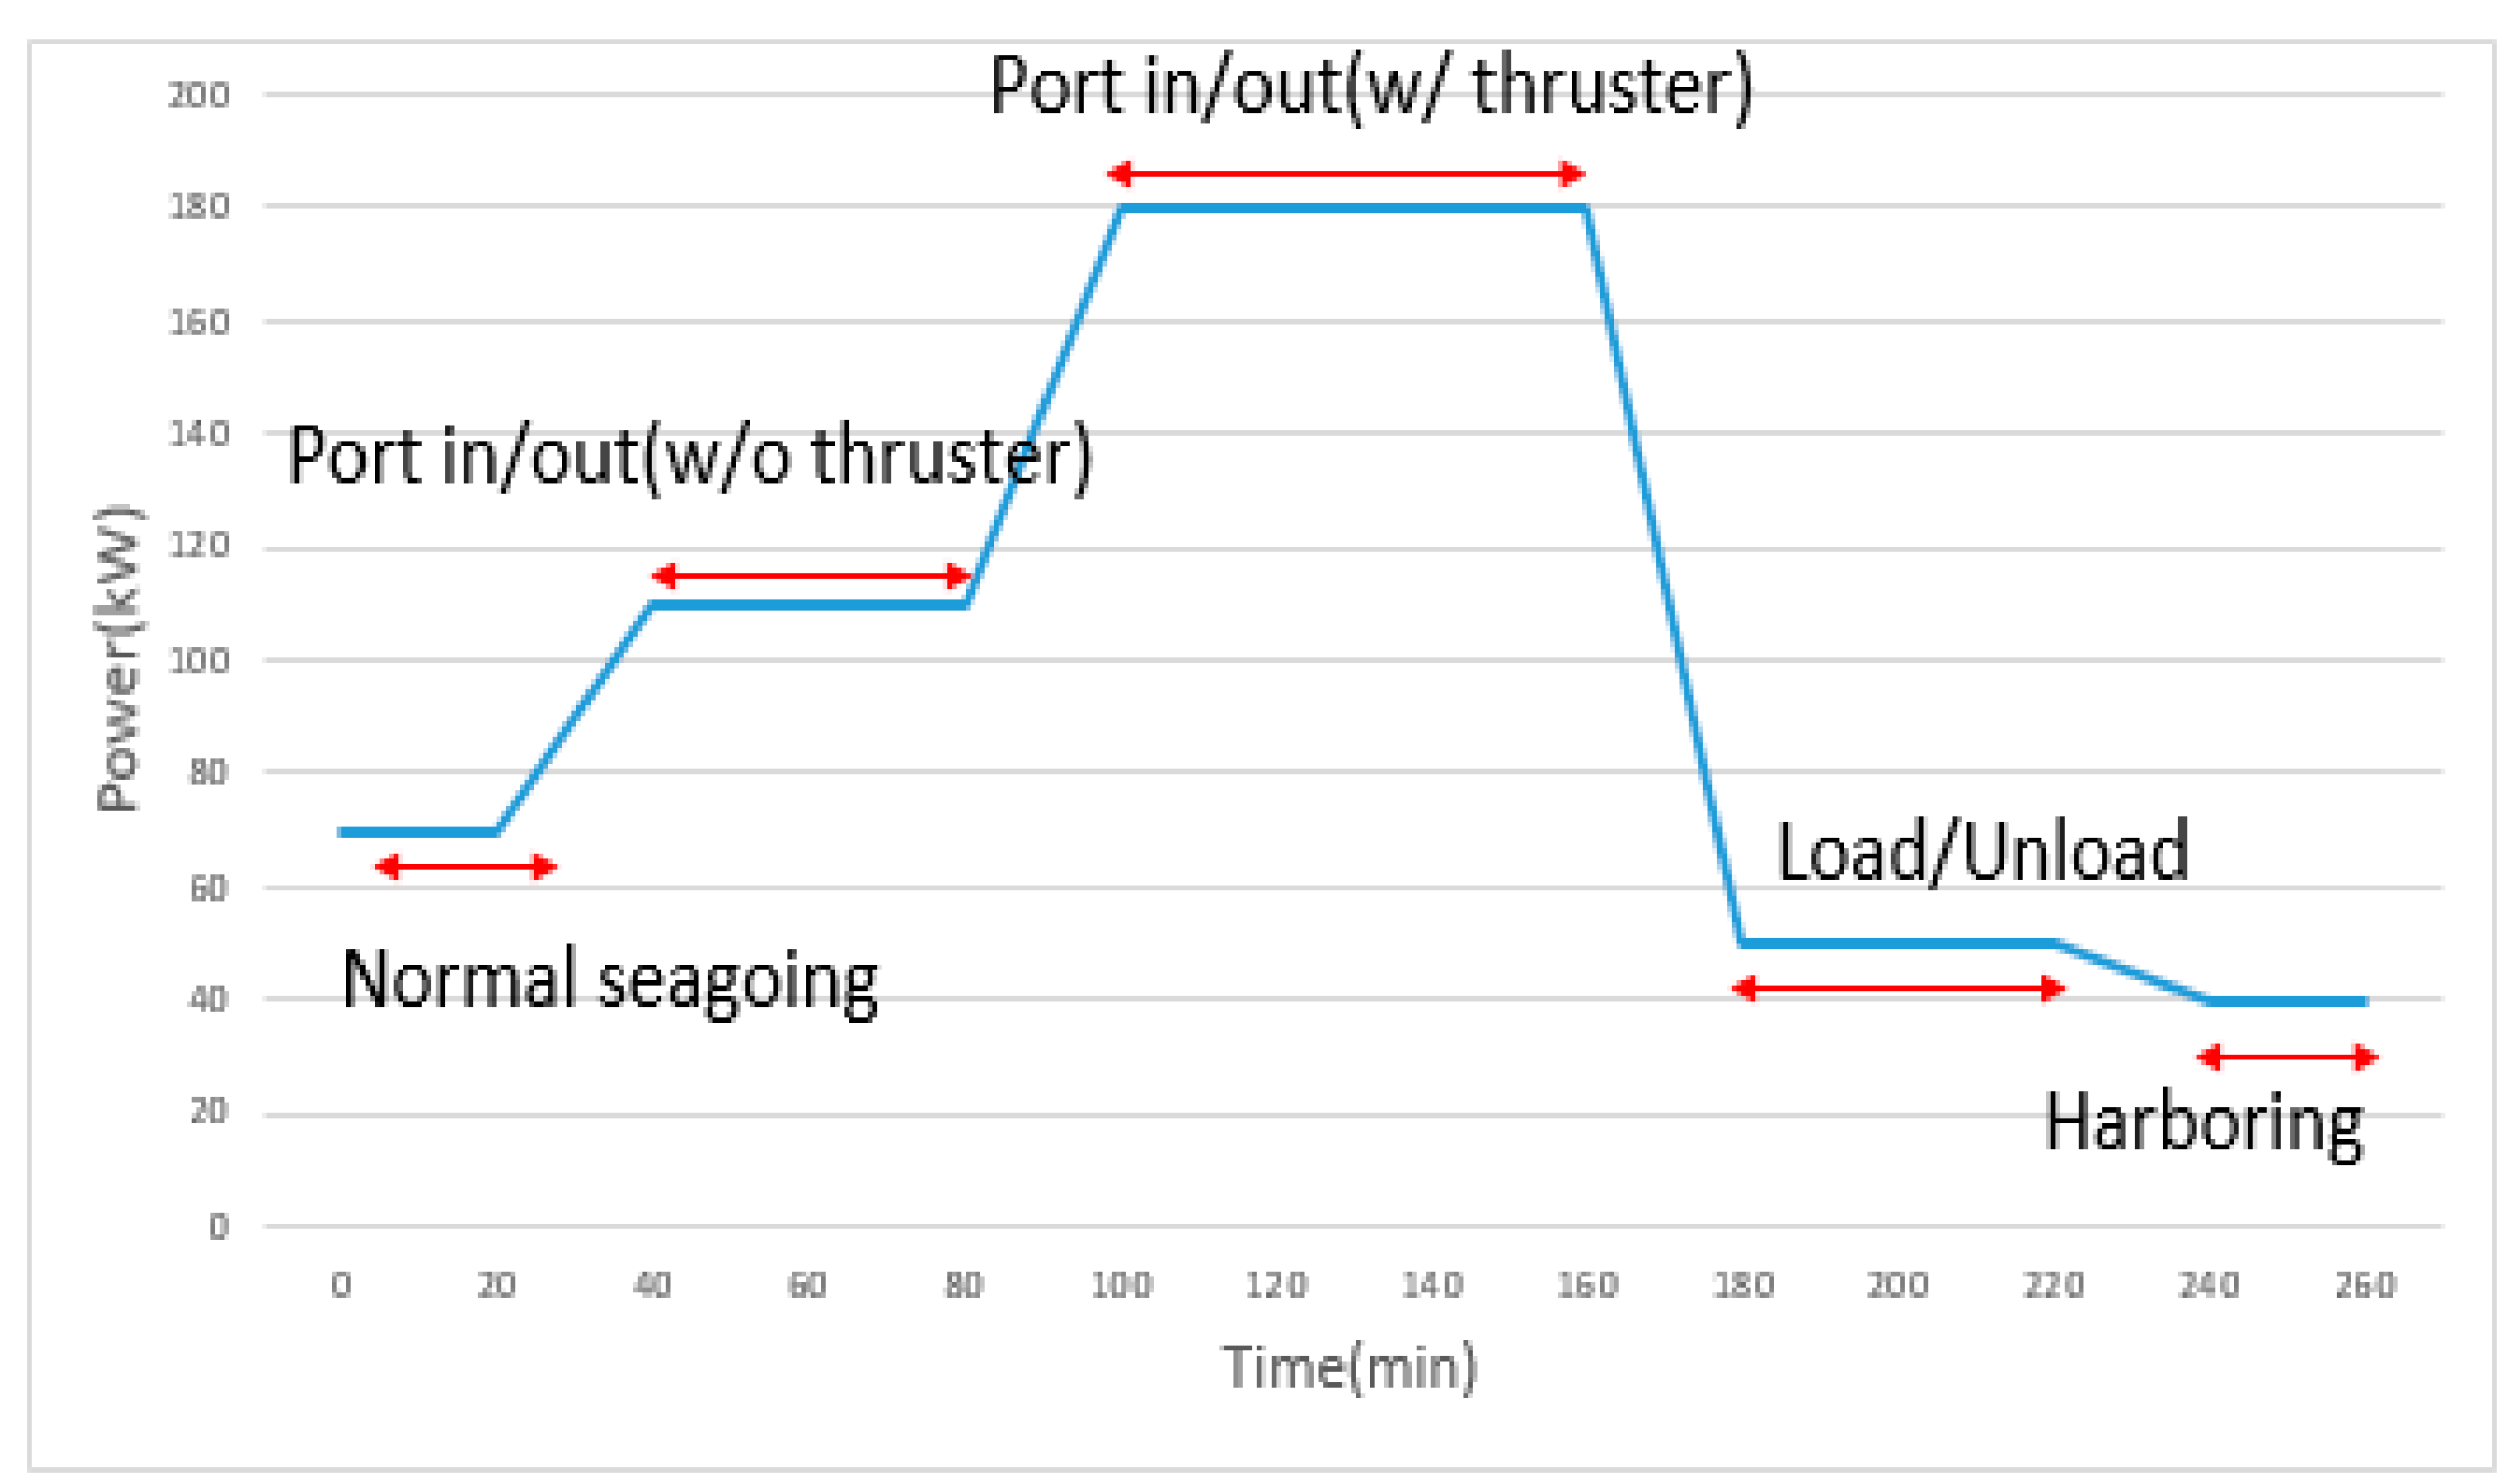
The 13000 TEU container uses the following operating modes during voyage: Normal seagoing, port in/out (without thruster), port in/out (with thruster), load/unload, and harboring. The test bed experiments were conducted by adjusting the scale of the values obtained from the electric load analysis or the output of each operating mode of an actual ship. As shown in Figure 12, the hybrid power source was used in the load scenarios of this ship. Normal seagoing was a fuel cell operation interval. Port in/out (without thruster) was a fuel cell + battery operation interval. Port in/out (with thruster) was a fuel cell + battery + diesel generator operation interval. Load/unload and harboring were fuel cell operation intervals. The scale-adjusted electric load analysis was applied to the test bed, and the output tests were performed.
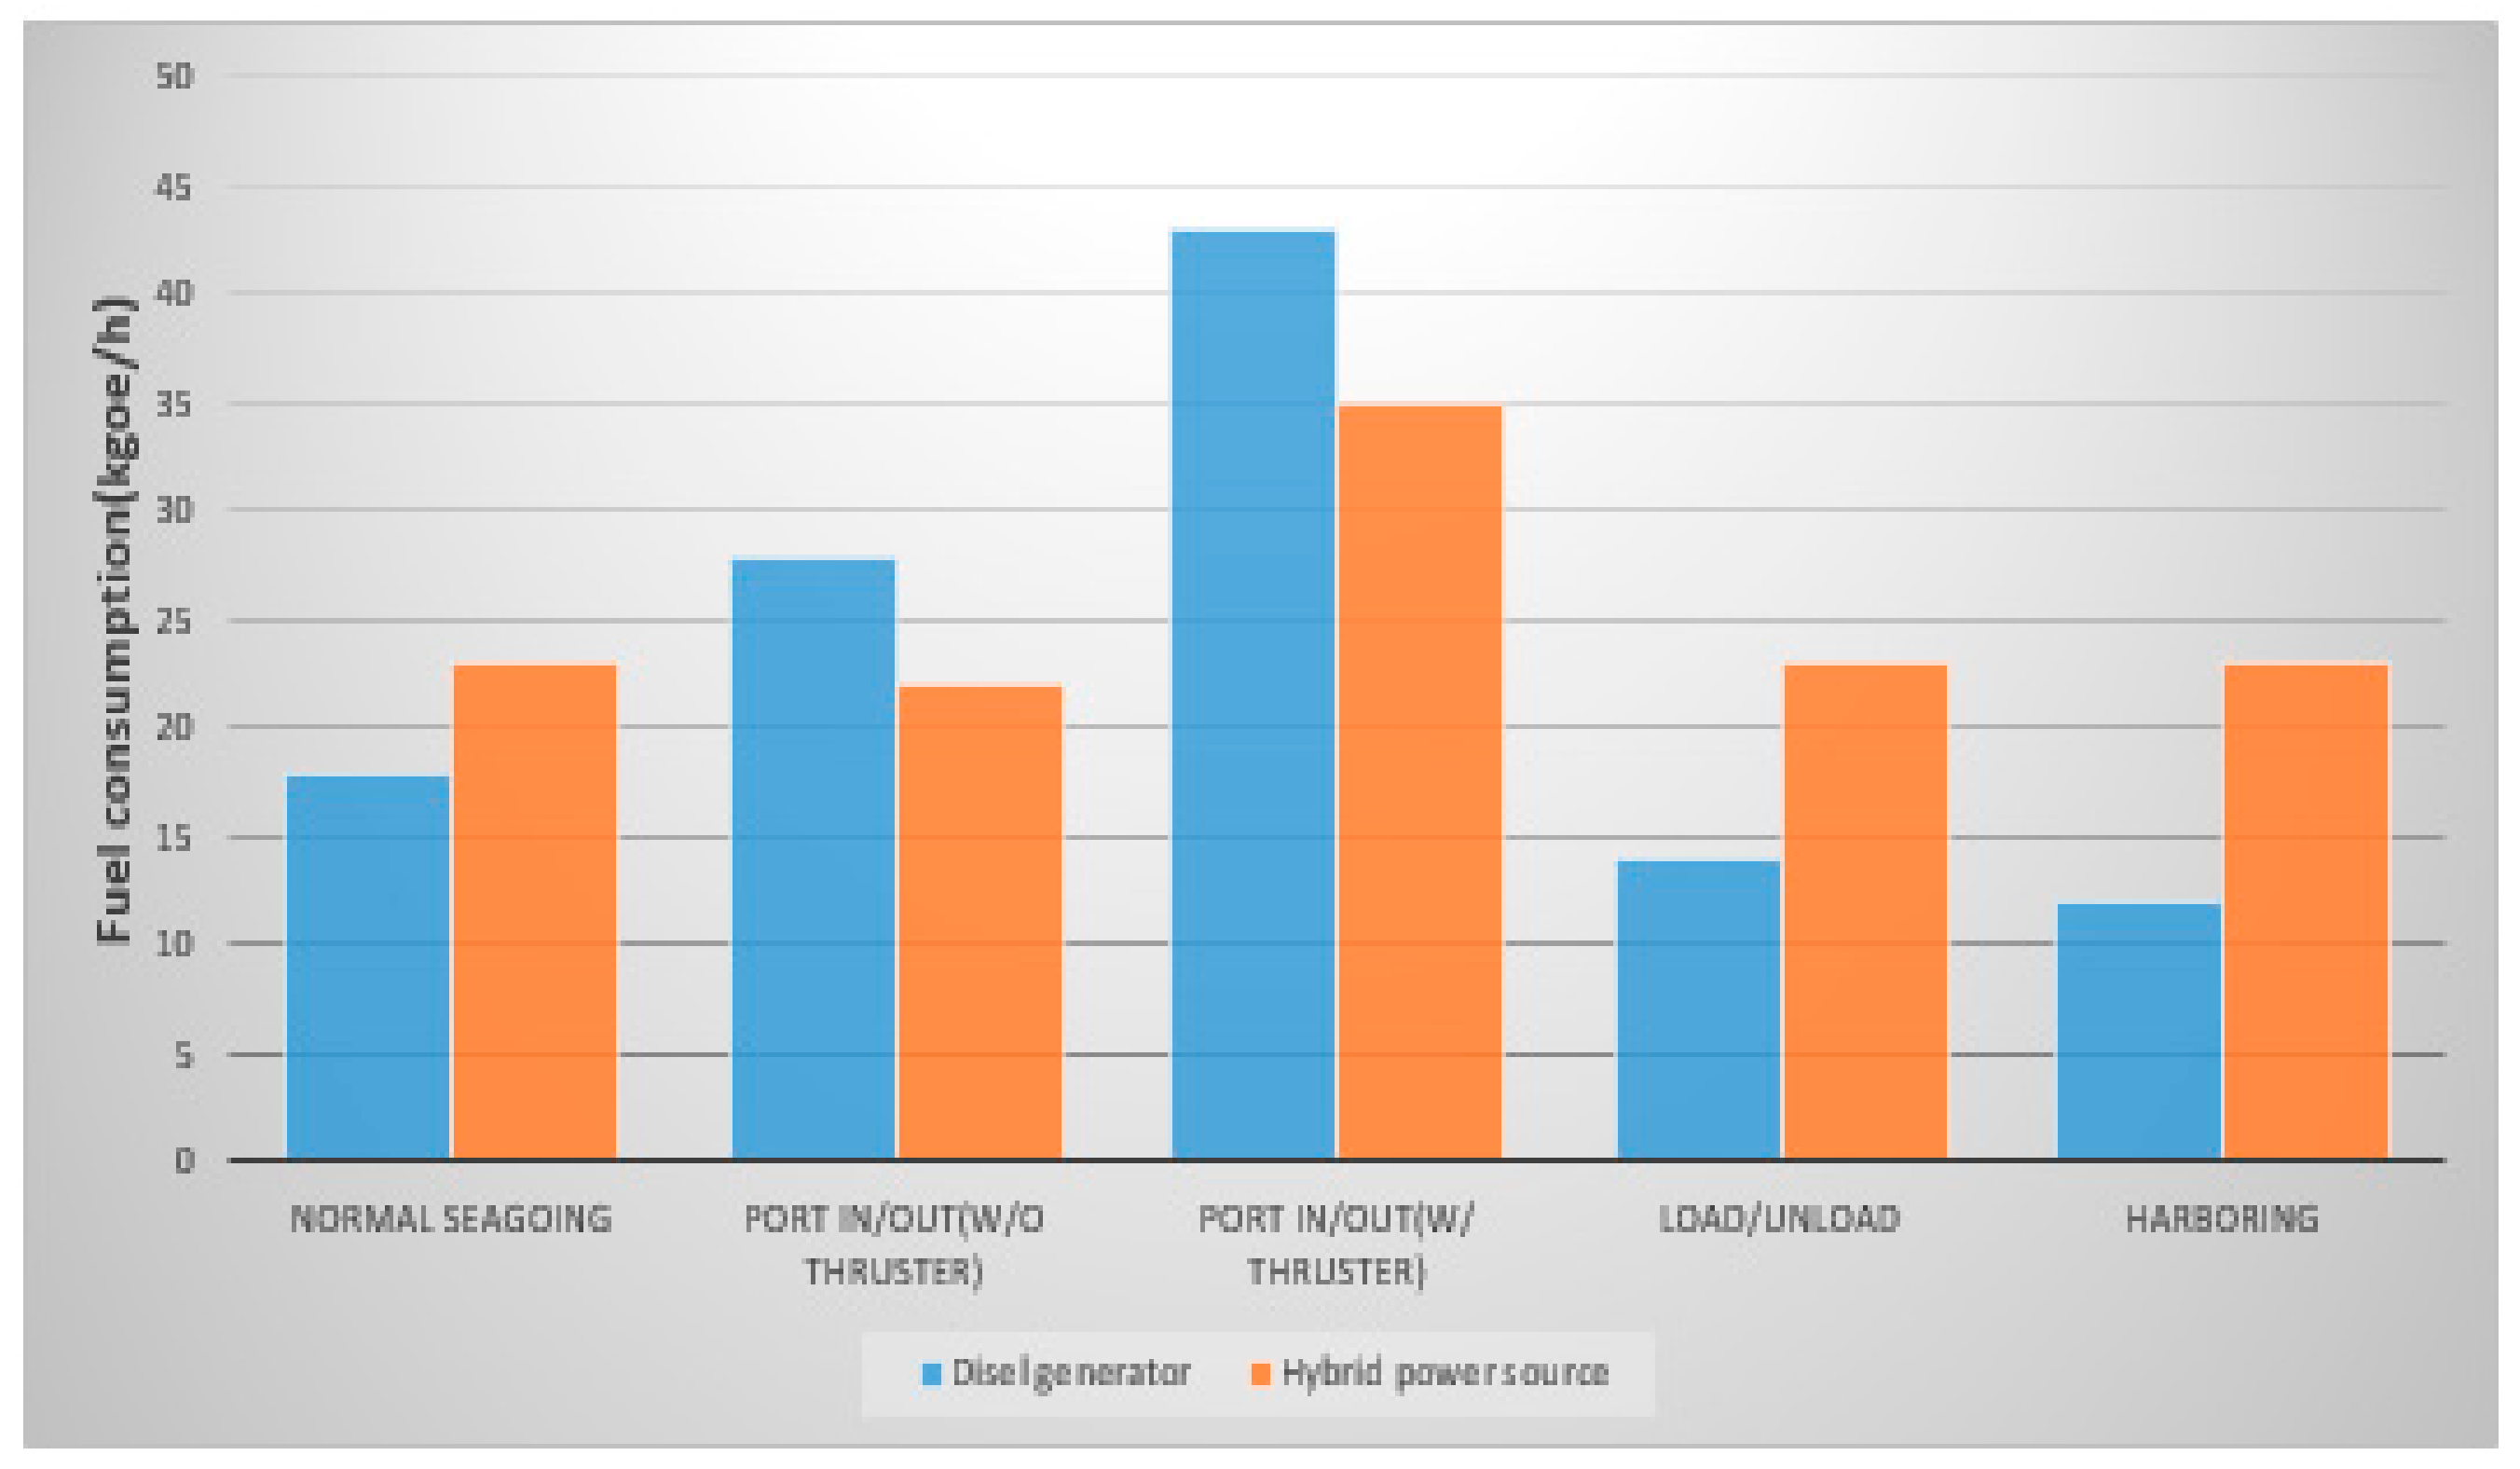
Figure 13 compares the fuel consumption during each operating mode of this ship. The fuel consumption was at maximum during the port in/out (with thruster) mode and at minimum during the load/unload mode. The load increased (and decreased) as the fuel consumption increased (and decreased), respectively. However, on observing the CO2 emission reduction rates shown in Figure 14, it can be seen that the CO2 emission reduction rate was low in the load/unload and harboring modes despite the low fuel consumption.

5.3. 40 k DWT Bulk Carrier

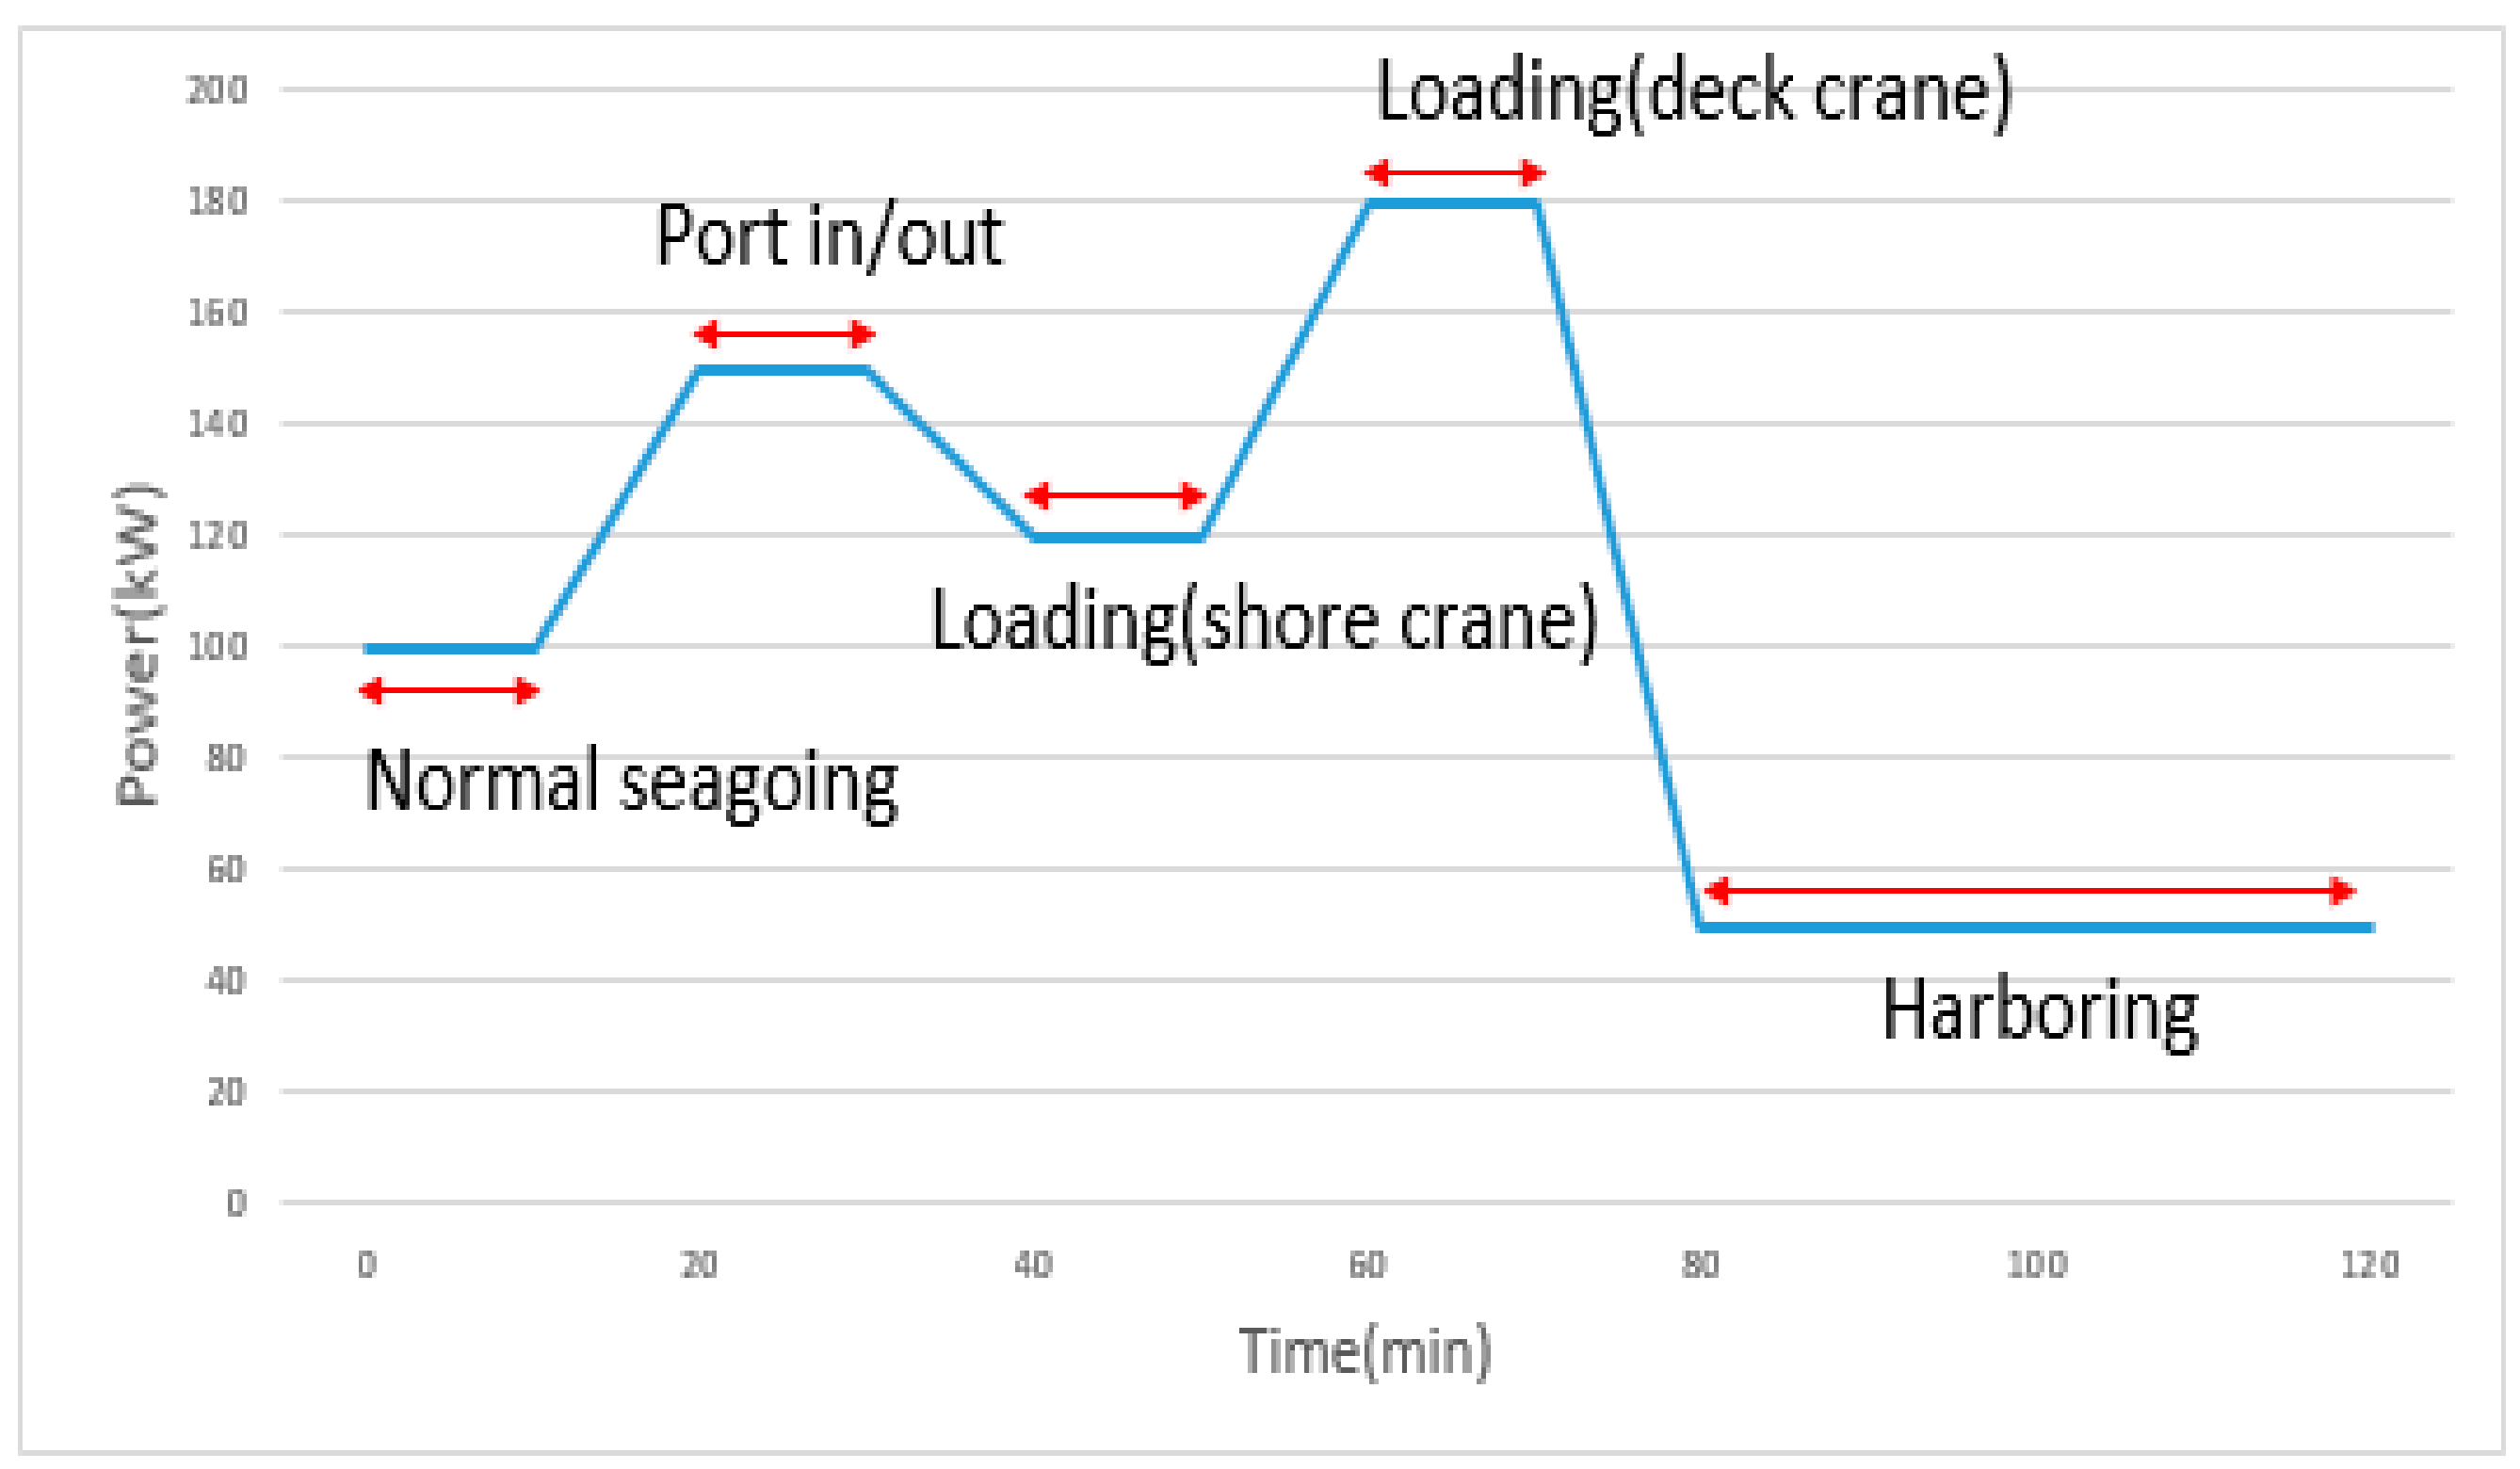
The 40 k DWT bulk carrier uses the following operating modes during operations: Normal seagoing, port in/out, loading (shore crane), loading (deck crane), and harboring. To perform the test bed experiments, the scale of the values obtained as a result of the electric load analysis was adjusted according to the output of each operating mode of an actual ship. As shown in Figure 15, the hybrid power source was used in the load scenarios. Normal seagoing was a fuel cell operation interval. Port in/out was a fuel cell + battery + diesel generator operation interval. Port in/out (with thruster) was a fuel cell + battery + diesel generator operation interval. Loading (shore crane) was a fuel cell + battery operation interval. Loading (deck crane) was a fuel cell + battery + diesel generator operation interval. Harboring was a fuel cell interval. The scale-adjusted electric load analysis was applied to the test bed before the output tests were performed.
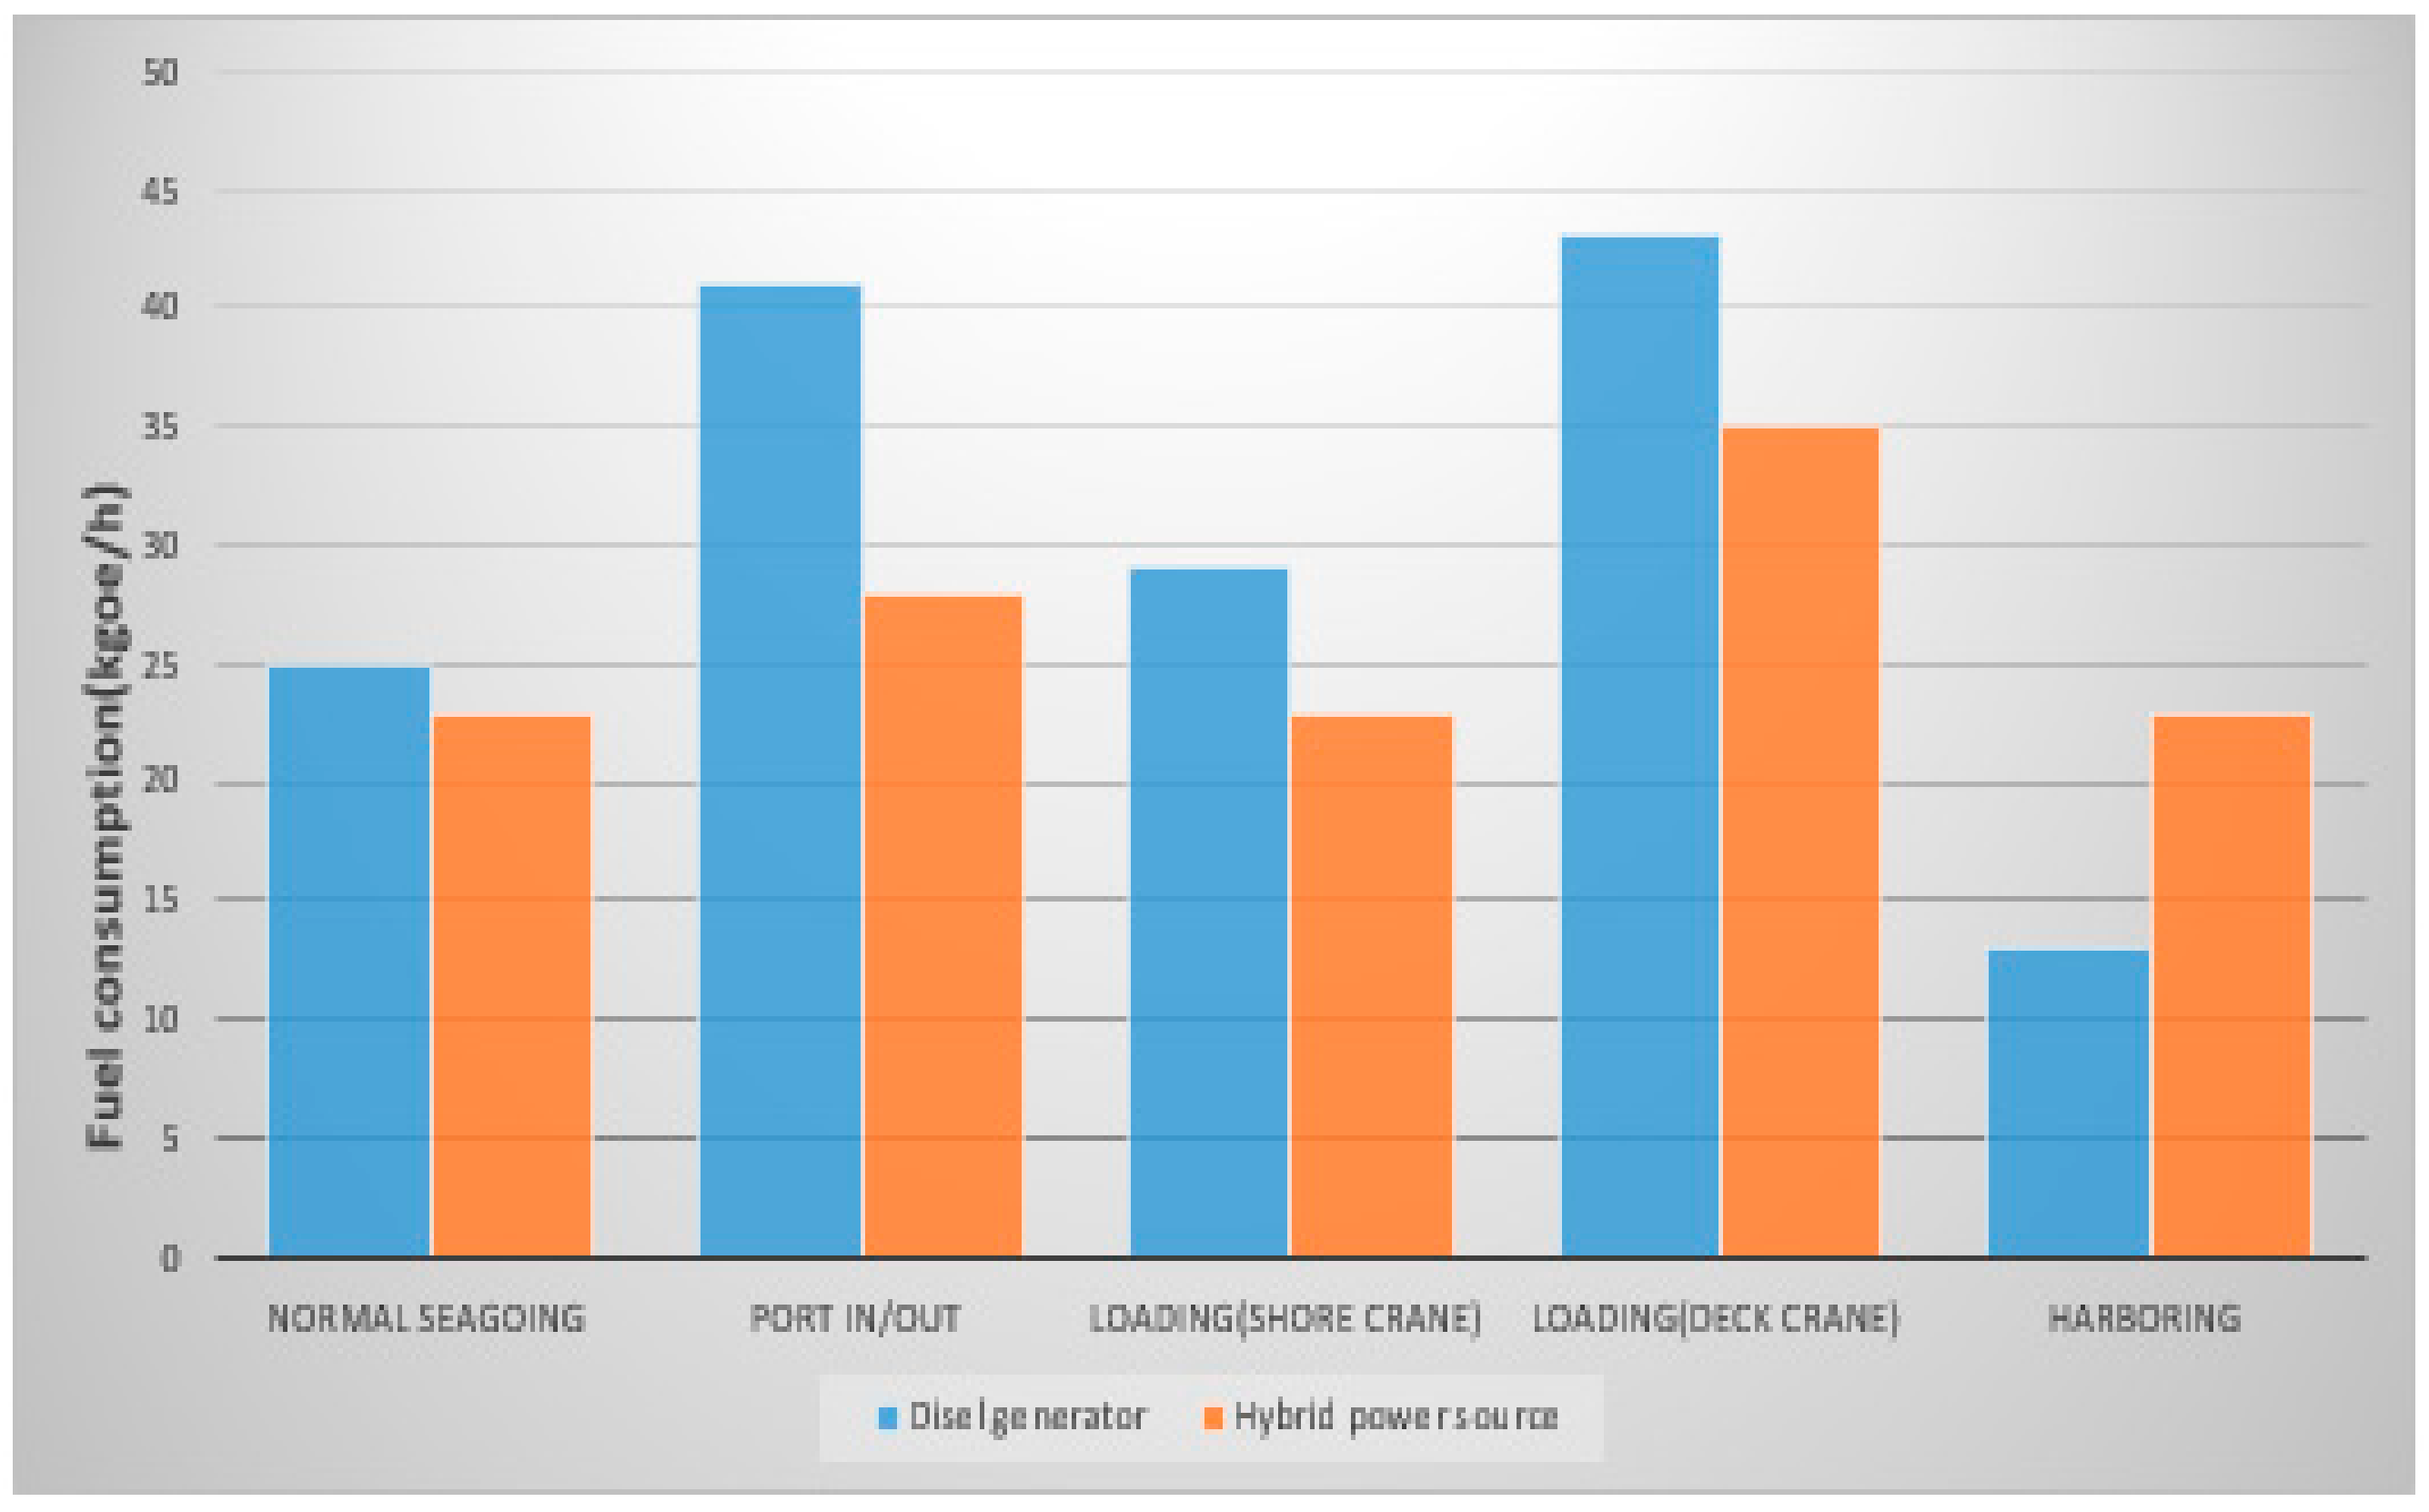
Figure 16 compares the fuel consumption during each operating mode of this ship. The fuel consumption was at maximum during the loading (deck crane) mode and at minimum during the harboring mode. The fuel consumption increased as the load increased, and decreased as the load decreased. However, on observing the CO2 emission reduction rates shown in Figure 17, it can be seen that the CO2 emission reduction rate of the loading (shore crane) mode was as high as 85% even though this operation consumed more fuel than during normal seagoing operations.

5.4. 130 k DWT LNG Carrier

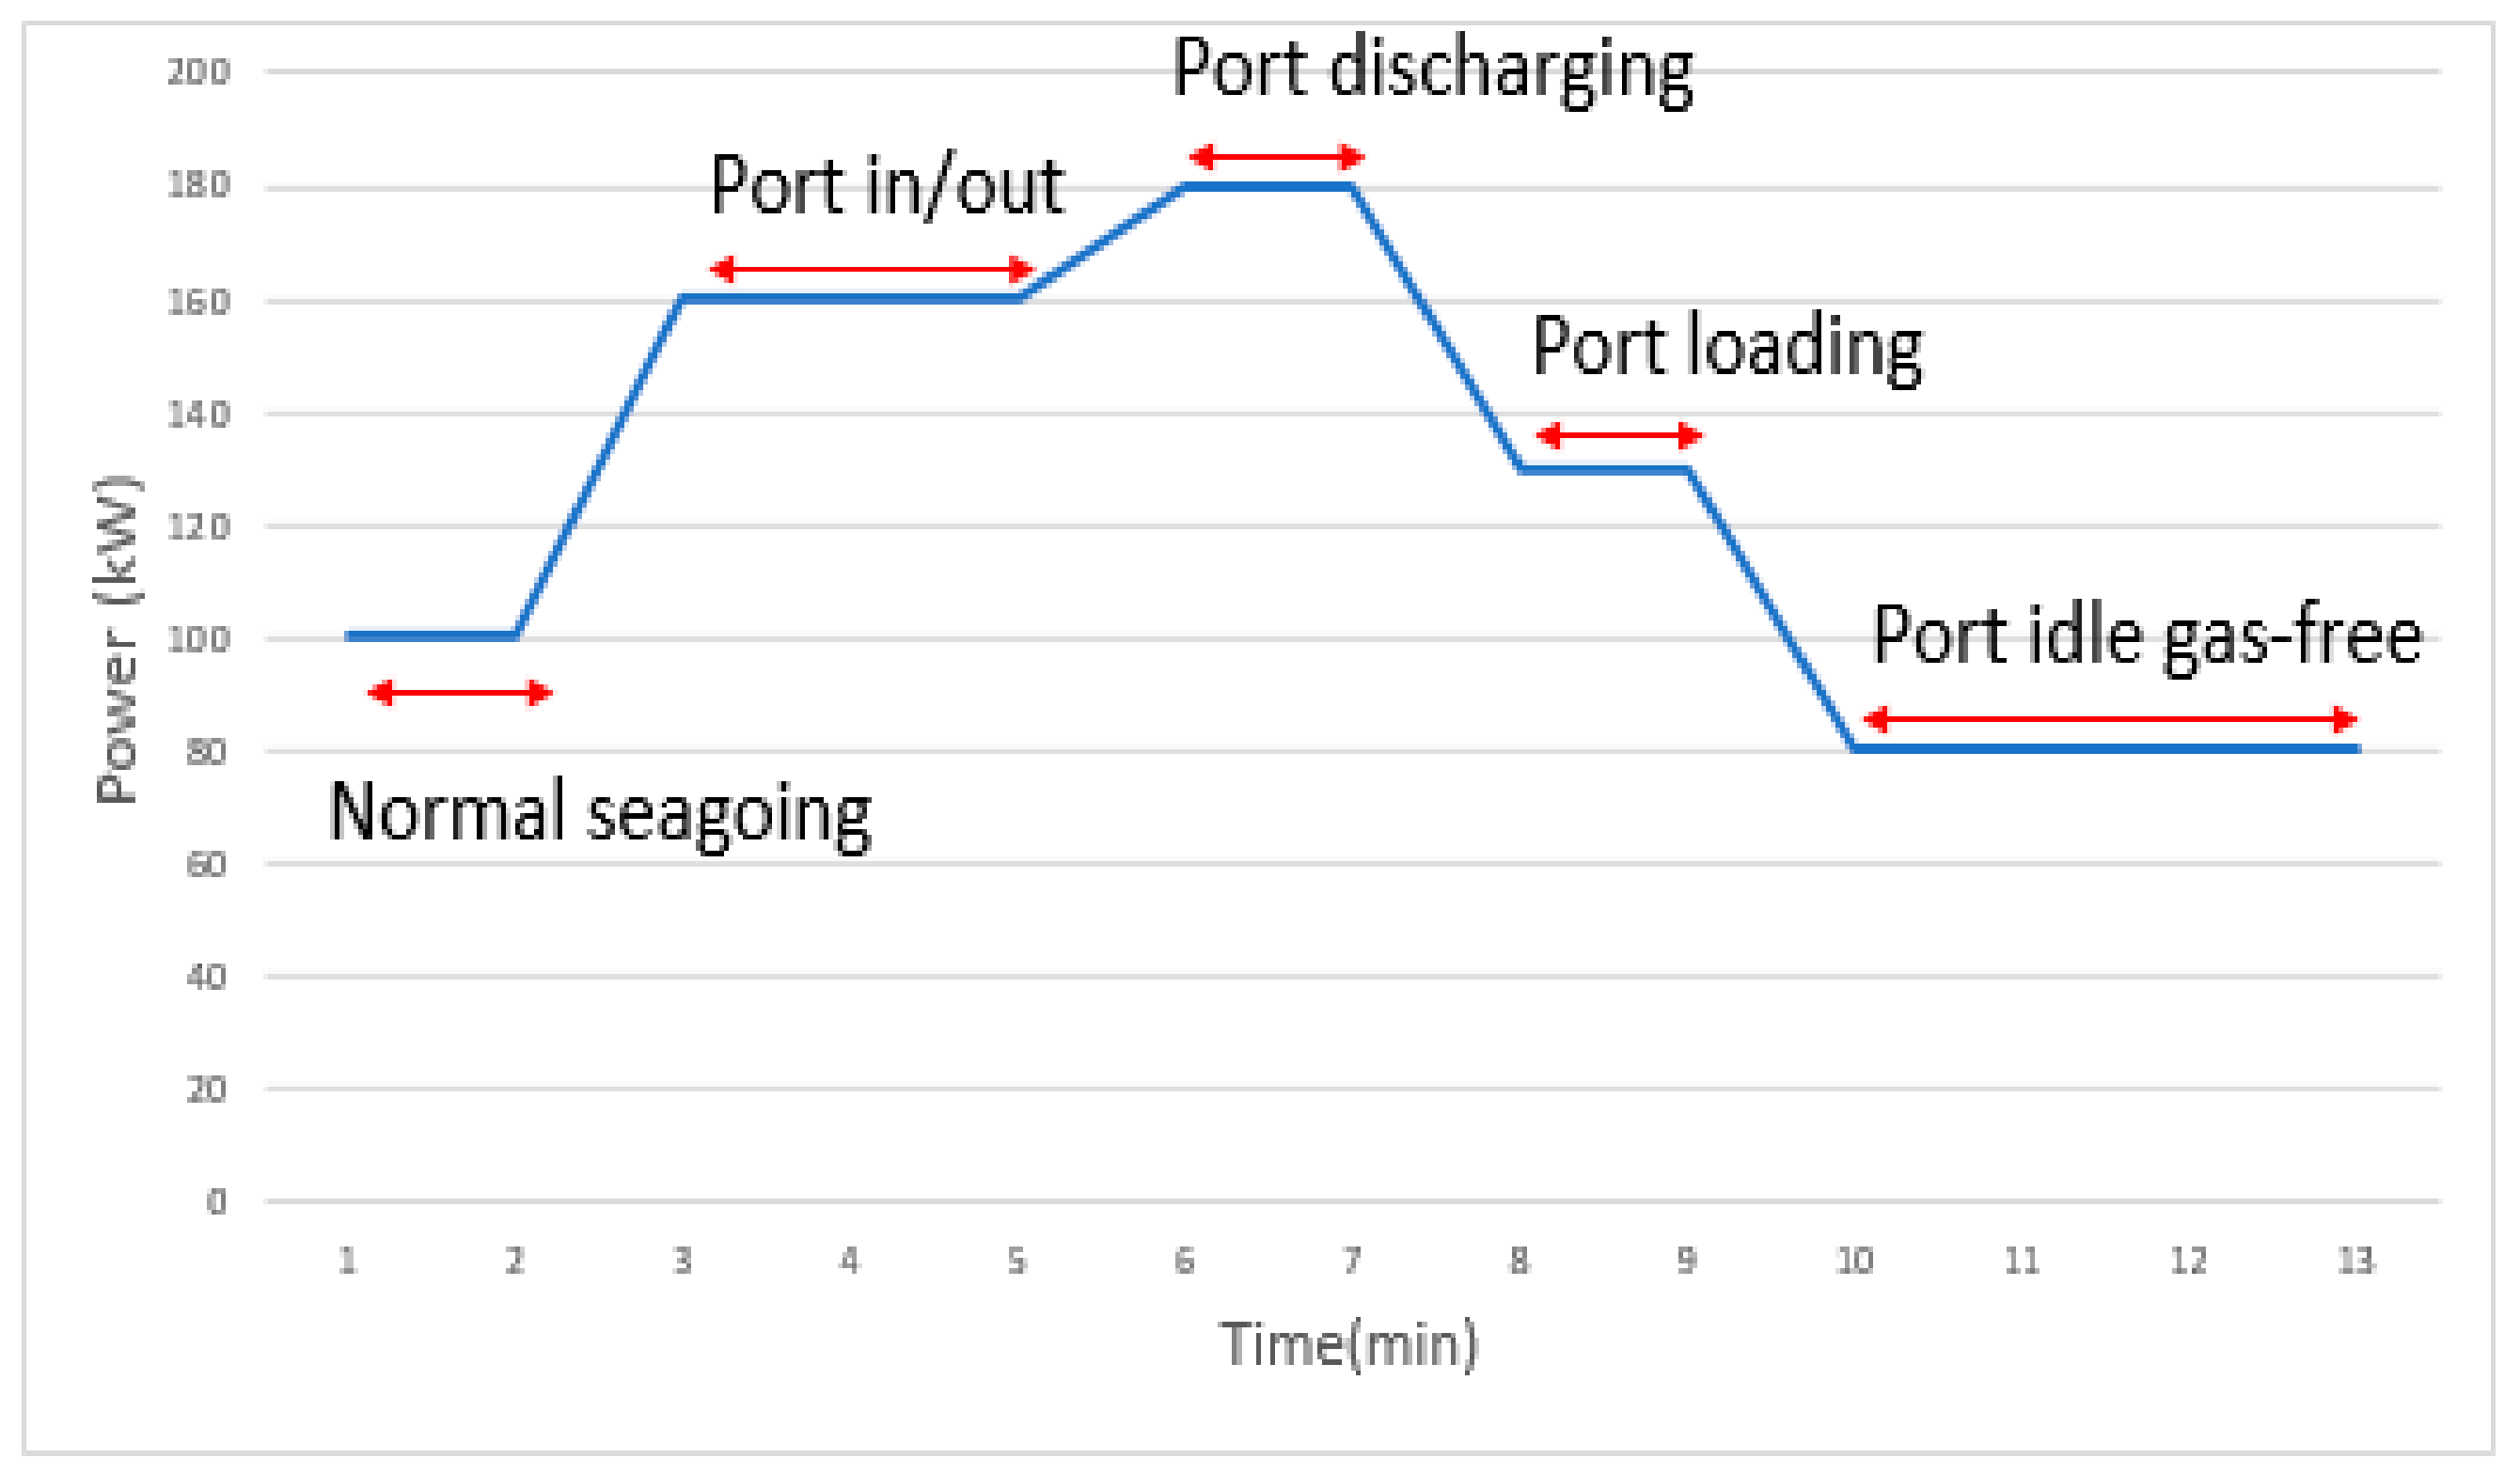
The 130 k DWT LNG carrier uses the following operating modes during its operations: Normal seagoing, port in/out, port discharging, port loading, and port idle gas free. The test bed experiments were conducted by adjusting the scale of the values obtained from the electric load analysis based on the output of each operating mode of an actual ship. As shown in Figure 18, the hybrid power source was used in the load scenarios of this ship. Normal seagoing was a fuel cell operation interval. Port in/out, port discharging, and port loading were fuel cell + battery + diesel generator operation intervals. Port idle gas free was a fuel cell operation interval. The scale-adjusted electric load analysis was applied to the test bed, and the output tests were performed.
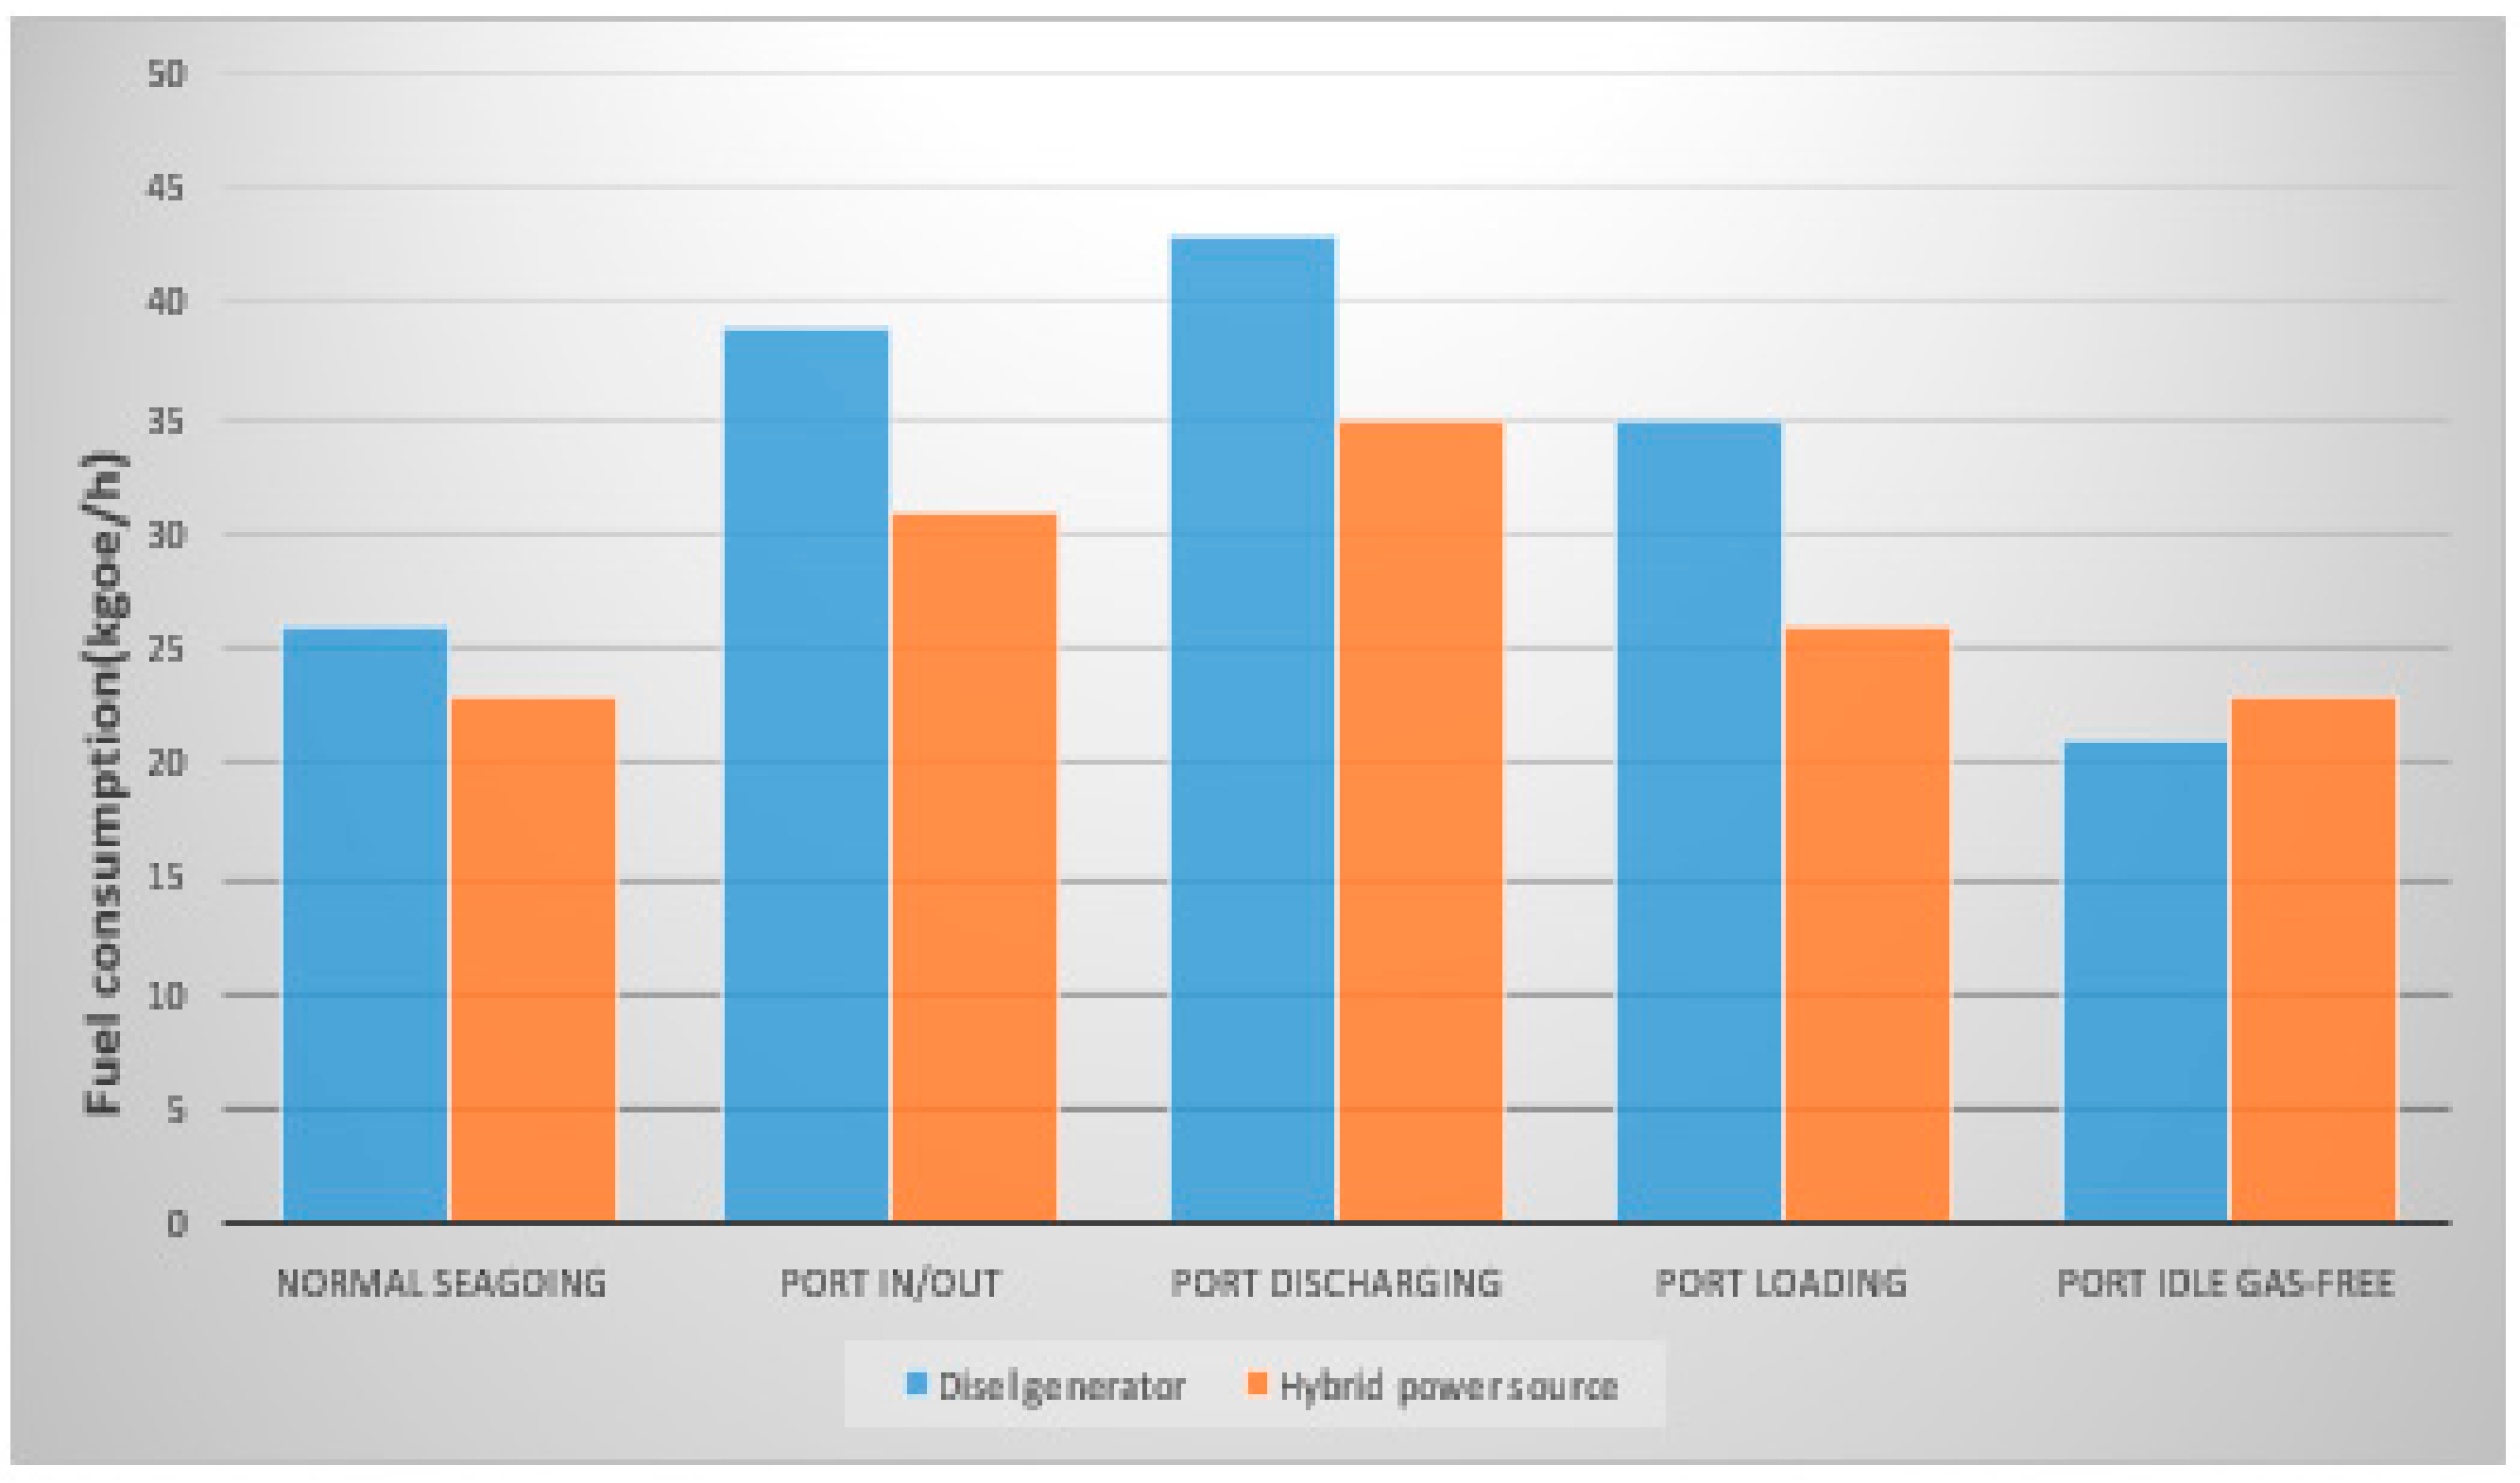
Figure 19 compares the fuel consumption during each operating mode of this ship. The maximum amount of fuel was consumed during the port discharging mode, whereas it reached a minimum during the port idle gas free mode. The fuel consumption increased and decreased as the load increased and decreased, respectively. However, on examining the CO2 emission reduction rates shown in Figure 20, it can be seen that the CO2 emission reduction rate of the normal seagoing mode was as high as 83%, even though the fuel consumption in this mode exceeded that in the port idle gas free mode.

5.5. 300 k DWT Very Large Crude Oil Carrier (VLCC)

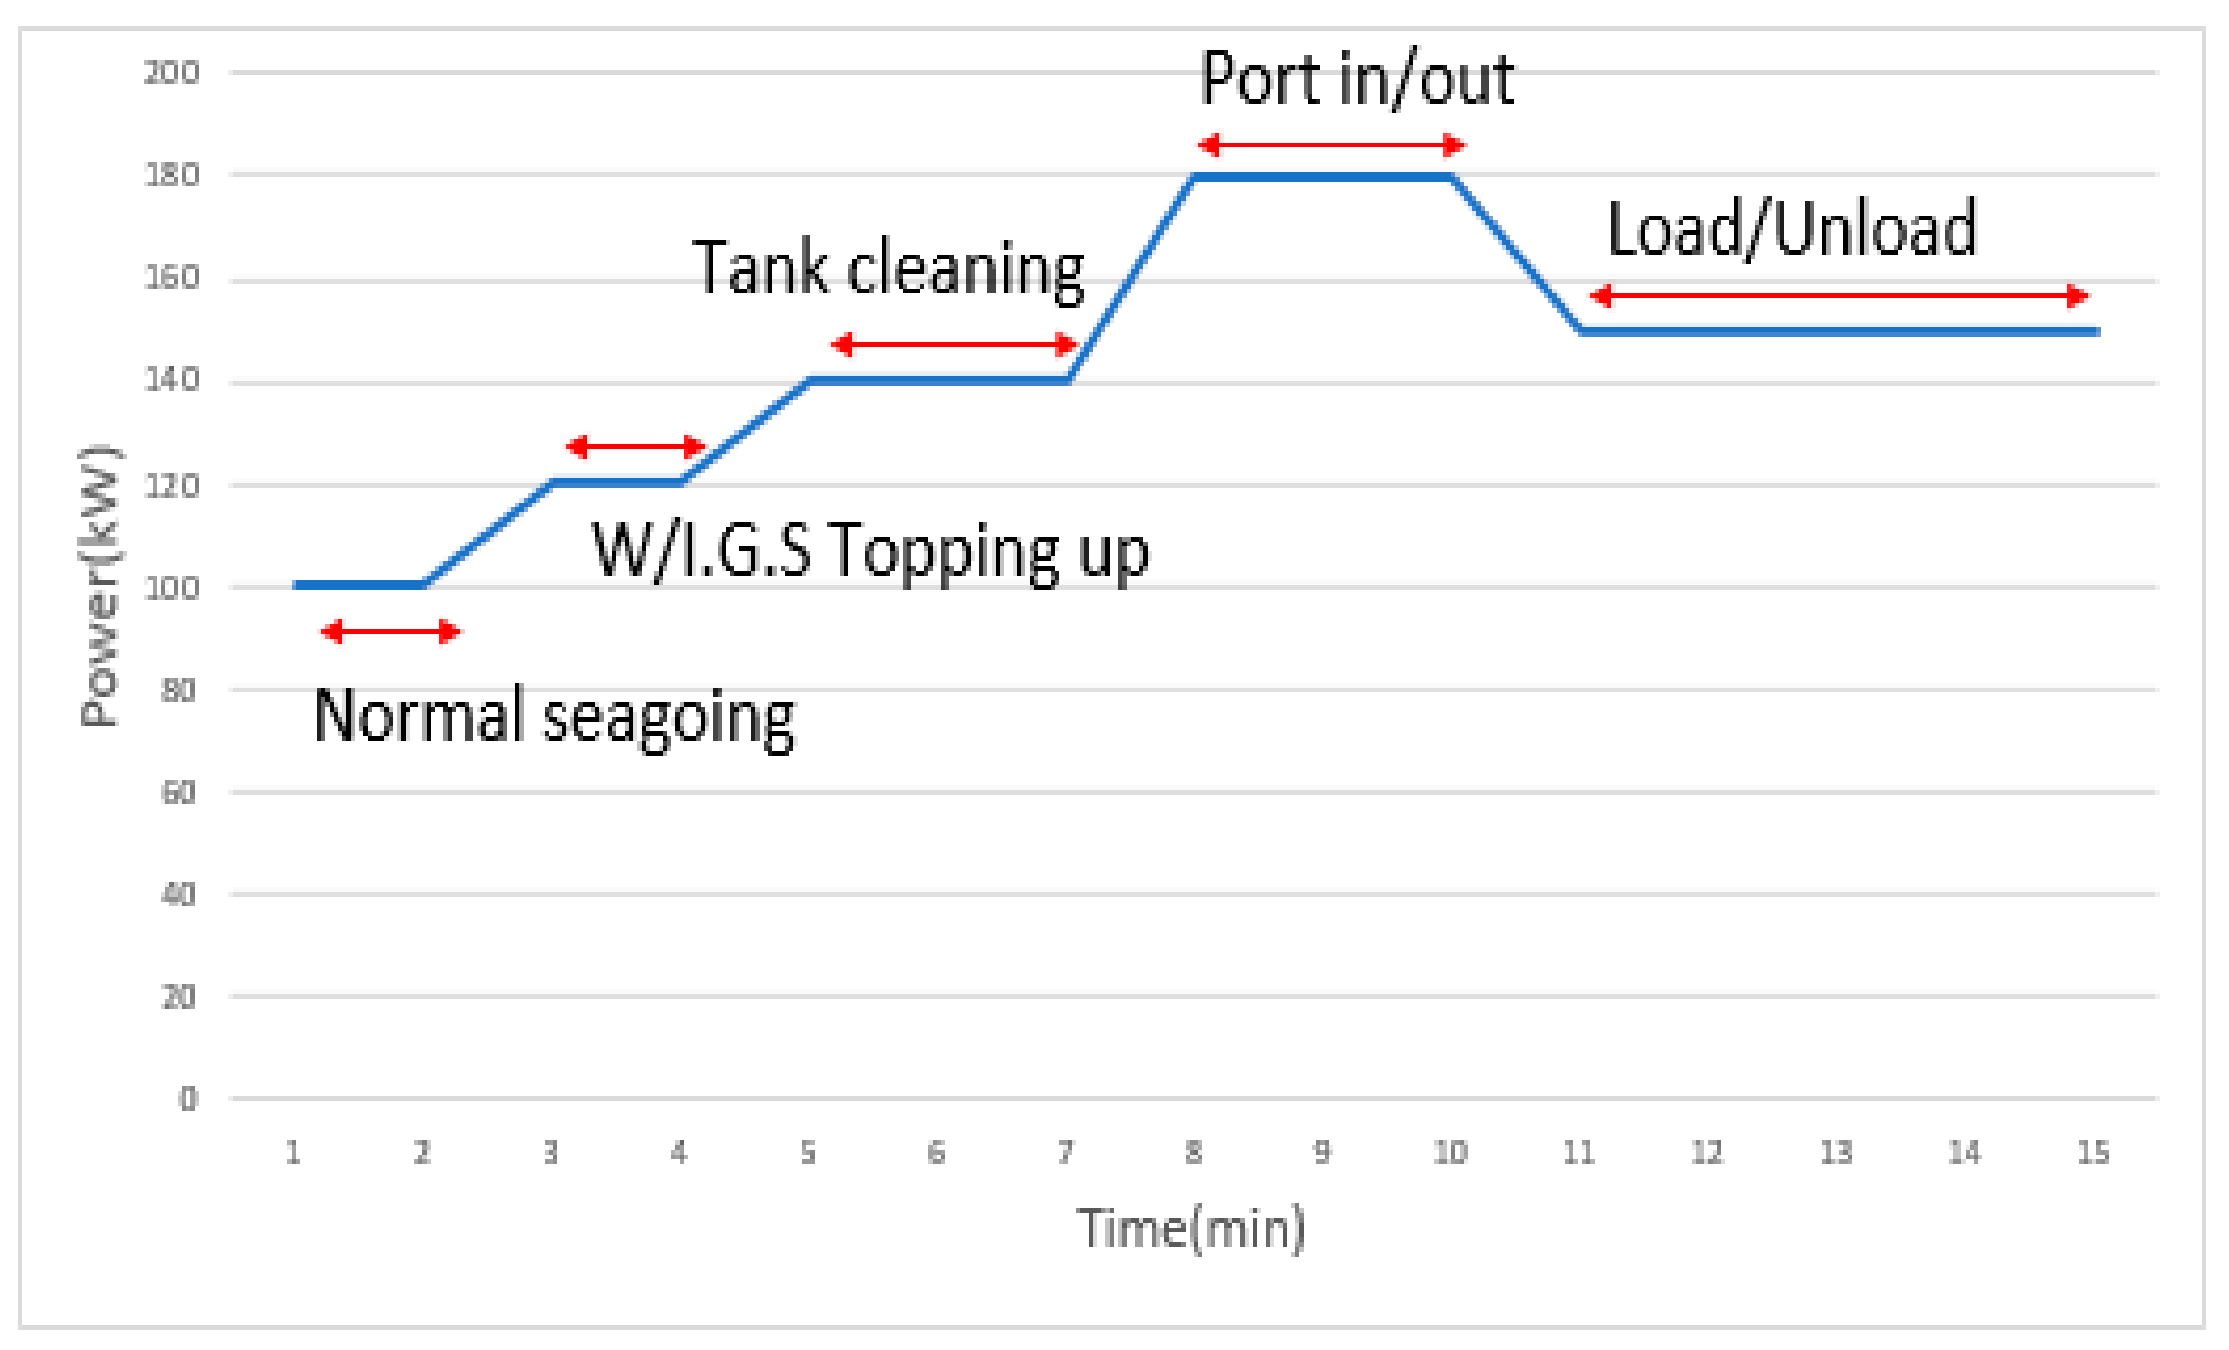
The 300 k DWT VLCC uses the following operating modes during operations: Normal seagoing, with an inert gas supply system (IGS) topping up, tank cleaning, port in/out, and load/unload. An adjustment was made to the scale of the values of the electric load analysis of the output of each operating mode of an actual ship to perform the test bed experiments. As shown in Figure 21, the hybrid power source was used in the load scenarios of this ship. Normal seagoing was a fuel cell operation interval. With IGS topping up was a fuel cell + battery operation interval. Tank cleaning, port in/out, and load/unload were fuel cell + battery + diesel generator operation intervals. The scale-adjusted electric load analysis was applied to the test bed, and the output tests were performed.
Figure 22 compares the fuel consumption during each operating mode of this ship. The fuel consumption was at maximum during the port in/out mode and at minimum during the normal seagoing mode. The fuel consumption increased as the load increased and decreased as the load decreased. However, on observing the CO2 emission reduction rates shown in Figure 23, it can be seen that the CO2 emission reduction rate in the IGS topping up mode was as high as 85%, even though the fuel consumption in this mode was higher than in normal seagoing mode.
Operating profile scenarios for each type of ship were developed, and the five developed load scenarios were applied to the test bed. The results are presented in Table 15.

6. Conclusions

This study analyzed the fuel consumption and CO2 emission reduction rates when a fuel-cell-based hybrid power source instead of a conventional commercial diesel power source was used in ships. The results showed that under the rated output on a test bed with a load bank of 180 kW, the conventional commercial diesel generator consumed fuel at 43.5 kgoe/h and emitted CO2 at 148.5 kg/h, whereas the fuel-cell-based hybrid power source consumed fuel at 35.6 kgoe/h and emitted CO2 at 57.7 kg/h, as given in Table 11. The hybrid power source reduced fuel consumption by 18% and CO2 emissions by 61% at part load in the port period. These results indicate that it is possible to reduce CO2 emissions by up to 61% if a hybrid power source of the same capacity is used to power a ship.
In this study, the actual electric load analysis values of the 5500 TEU Reefer Container, 13 k TEU Container, 40 k Bulk Carrier, 130 k DWT LNG Carrier, and 300 k DWT Crude Oil Tanker were scaled down according to the operation mode, and the control logic and systems of the test bed developed in this study were operated normally according to the respective load scenarios. The experimental results of applying the developed five load scenarios to the test bed are shown in Table 15.
Because the output characteristics and control time of the diesel generator, according to the power source of the hybrid system, were reduced, according to the load variation pattern of the ship and the ship’s type, the CO2 emissions of the hybrid system, as compared with the case of the diesel generator, alone operated for each load scenario with an average of 70%~74% less.
In order to apply the hybrid system to ships, it is possible to maximize the CO2 emission reduction effect by setting the capacity of the fuel cell + battery to be able to take charge of the base load of the ship through analysis of the base load of each ship type.

Author Contributions

Conceptualization, G.R., H.K. and K.Y.; Methodology, G.R., K.Y. and H.J.; Formal analysis, G.R. and H.J.; Supervision, H.K. and K.Y., Visualization, H.J; Writing-original draft preparation, G.R. and K.Y.; Writing-review and editing, K.Y.

Funding

This research received no external funding.

Acknowledgments

We thank our colleagues from Jong Su Kim who provided insight and expertise that greatly assisted the research, although they may not agree with all of the conclusions of this paper.

Conflicts of Interest

The authors declare no conflicts of interest.

Nomenclature

AFCAlkaline fuel cell
DWTDeadweight tons
EBOPElectric balance of plant
EEDIEnergy efficiency design index
EPSSElectric power switching system
ESSEnergy storage system
IEMSIntelligent energy management system
IGSInert gas system
IMOInternational maritime organization
IPCCIntergovernmental panel on climate change
KGOEKilograms of oil equivalent
MARPOLThe international convention for the prevention of marine pollution from ships
MCFCMolten carbonate fuel cell
MDOPMachinery balance of plant
PAFCPhosphoric acid fuel cells
PCSPower conditioning system
PEMFCPolymer electrolyte membrane fuel cell
PFDProcess flow diagram
PMParticulate matter
SFCSpecific fuel consumption
SOCState of charge
SOFCSolid oxide fuel cell
TEUTwenty-foot equivalent units
VLCCVery large crude-oil carrier

References

  1. International Maritime Organization. Third IMO Greenhouse Gas Study. Available online: http://www.imo.org/en/OurWork/Environment/PollutionPrevention/AirPollution/Documents/Third%20Greenhouse%20Gas%20Study/GHG3%20Executive%20Summary.pdf (accessed on 15 August 2015).
  2. Bouman, E.A.; Lindstad, E.; Rialland, A.I.; Strømman, A.H.; Lindstad, H.E. State-of-the-art technologies, measures, and potential for reducing GHG emissions from shipping—A review. Transp. Res. Part D Transp. Environ. 2017, 52, 408–421. [Google Scholar] [CrossRef]
  3. European Parliament. Emission Reduction Targets for International Aviation and Shipping. Available online: http://www.europarl.europa.eu/RegData/etudes/STUD/2015/569964/IPOL_STU(2015)569964_EN.pdf (accessed on 18 September 2015).
  4. International Council on Clean Transportaion. Greenhouse Gas Emissions from Global Shipping. Available online: https://www.theicct.org/sites/default/files/publications/Global-shipping-GHG-emissions-2013-2015_ICCT-Report_17102017_vF.pdf (accessed on 1 October 2017).
  5. International Maritime Organization. Marine Environment Protection Committee 72nd Session. Available online: http://www.imo.org/en/MediaCentre/MeetingSummaries/MEPC/Pages/MEPC-72nd-session.aspx (accessed on 13 April 2018).
  6. Pestana, H. Future trends of electrical propulsion and implications to ship design. Marit. Technol. Eng. 2014, 1, 797–803. [Google Scholar]
  7. Yang, Z.; Zhang, D.; Caglayan, O.; Jenkinson, I.; Bonsall, S.; Wang, J.; Huang, M.; Yan, X.; Yang, Z. Selection of techniques for reducing shipping NOx and SOx emissions. Transp. Res. Part D Transp. Environ. 2012, 17, 478–486. [Google Scholar] [CrossRef]
  8. Sattler, G. Fuel Cells Going On-Board. J. Power Sources 2000, 86, 61–67. [Google Scholar] [CrossRef]
  9. Tronstad, T.; Endresen, Ø. Fuel cells for low emission ships. In Proceedings of the International Renewable Energy Conference 2005, Beijing, China, 7–8 November 2005; pp. 141–149. [Google Scholar]
  10. Schneider, J.; Dirk, S.; Schneider, J.; Dirk, S.; Motor, P. ZEMShip. In Proceedings of the 18th World Hydrogen Energy Conference 2010, Essen, Germany, 16–20 May 2010; Volume 78, pp. 132–135. [Google Scholar]
  11. Yuan, J.; Ng, S.H.; Sou, W.S. Uncertainty quantification of CO2 emission reduction for maritime shipping. Energy Policy 2016, 88, 113–130. [Google Scholar] [CrossRef]
  12. Van Biert, L.; Godjevac, M.; Visser, K.; Aravind, P. A review of fuel cell systems for maritime applications. J. Power Sources 2016, 327, 345–364. [Google Scholar] [CrossRef] [Green Version]
  13. De-Troya, J.J.; Álvarez, C.; Fernández-Garrido, C.; Carral, L. Analysing the possibilities of using fuel cells in ships. Int. J. Hydrog. Energy 2016, 41, 2853–2866. [Google Scholar] [CrossRef]
  14. Andújar, J.; Segura, F.; Andujar-Márquez, J.M. Fuel cells: History and updating. A walk along two centuries. Renew. Sustain. Energy Rev. 2009, 13, 2309–2322. [Google Scholar] [CrossRef]
  15. Inal, O.B.; Deniz, C. Fuel Cell Availability for Merchant Ships Fuel Cell Availability for Merchant Ships. In Proceedings of the 3rd International Symposium on Naval Architecture and Maritime (INT-NAM 2018), İstanbul, Turkey, 23–25 April 2018; Volume 1, pp. 907–916. [Google Scholar]
  16. Tomczyk, P. MCFC versus other fuel cells—Characteristics, technologies and prospects. J. Power Sources 2006, 160, 858–862. [Google Scholar] [CrossRef]
  17. Vogler, F.; Würsig, G. New Developments for Maritime Fuel Cell Systems. In Proceedings of the 18th World Hydrogen Energy Conference (WHEC 2010), Essen, Germany, 16–21 May 2010; Volume 78, pp. 444–453. [Google Scholar]
  18. McConnell, V.P. Now, Voyager? The Increasing Marine Use of Fuel Cells. Fuel Cells Bull. 2010, 2010, 12–17. [Google Scholar] [CrossRef]
  19. Tronstad, T.; Åstrand, H.H.; Haugom, G.P.; Langfeldt, L. Study on the Use of Fuel Cells in Shipping; EMSA European Maritime Safety Agency: Lisbon, Portugal, 2017; Volume 1, pp. 1–108. [Google Scholar]
  20. Yazdanfar, J.; Mehrpooya, M.; Yousefi, H.; Palizdar, A. Energy and exergy analysis and optimal design of the hybrid molten carbonate fuel cell power plant and carbon dioxide capturing process. Energy Convers. Manag. 2015, 98, 15–27. [Google Scholar] [CrossRef]
  21. Milewski, J.; Lewandowski, J.; Miller, A. Reducing CO2 emissions from coal fired power plant by using a molten carbonate fuel cell. In Proceedings of the ASME Turbo Expo 2008, Berlin, Germany, 9–13 June 2008; pp. 1–7. [Google Scholar]
  22. Welaya, Y.M.; El Gohary, M.M.; Ammar, N.R. A comparison between fuel cells and other alternatives for marine electric power generation. Int. J. Nav. Arch. Ocean Eng. 2011, 3, 141–149. [Google Scholar] [CrossRef] [Green Version]
  23. Mekhilef, S.; Saidur, R.; Safari, A. Comparative study of different fuel cell technologies. Renew. Sustain. Energy Rev. 2012, 16, 981–989. [Google Scholar] [CrossRef]
  24. Larminie, J.; Dicks, A. Fuel Cell Systems Explained; Wiley: Hoboken, NJ, USA, 2003. [Google Scholar]
  25. International Maritime Organization. MARPOL Convention 73/78 Annex VI. Available online: http://www.imo.org/en/About/Conventions/ListOfConventions/Pages/International-Convention-for-the-Prevention-of-Pollution-from-Ships-(MARPOL).aspx (accessed on 19 May 2005).
  26. International Maritime Organization. IMO MEPC1/Circ 684. Guidelines for Voluntary Use of the Ship Energy Efficiency Operational Indicator (EEOI). Available online: https://www.classnk.or.jp/hp/pdf/activities/statutory/eedi/mepc_1-circ_684.pdf (accessed on 17 August 2009).
  27. International Maritime Organization. Ship Energy Efficiency Regulations and Related Guidelines. Available online: http://www.imo.org/en/OurWork/Environment/PollutionPrevention/AirPollution/Documents/Air%20pollution/M2%20EE%20regulations%20and%20guidelines%20final.pdf (accessed on 2 January 2016).
  28. Woodyard, D. Pounder’s: Marine Diesel Engines and Gas Turbines; Elsevier: Burlington, UK, 2004. [Google Scholar]
  29. Zahedi, B.; Norum, L.E.; Ludvigsen, K.B. Optimized efficiency of all-electric ships by dc hybrid power systems. J. Power Sources 2014, 255, 341–354. [Google Scholar] [CrossRef]
  30. Intergovernmental Panel on Climate Change. IPCC Guidelines for National Greenhouse Gas Inventories. Available online: https://www.ipcc-nggip.iges.or.jp/public/2006gl/vol2.html (accessed on 10 January 2006).
  31. ISO. ISO 8271:2012 Petroleum Products—Specifications of Marine Fuels. Available online: https://www.iso.org/obp/ui/#iso:std:iso:8217:ed-5:v1:en (accessed on 5 March 2012).
  32. International Maritime Organization. Marine Environment Protection Committee 65th Session Agenda Item 4. Available online: http://yasinskiy.net/docs/wp-content/uploads/2018/06/MEPC.-65-INF.3-Rev.1.pdf (accessed on 11 December 2012).
  33. Park, S.-K.; Youn, Y.-M. Analysis of International Standardization Trend for the Application of Fuel Cell Systems on Ships. J. Korean Soc. Mar. Environ. Saf. 2015, 20, 579–585. [Google Scholar] [CrossRef]
  34. Inci, M.; Türksoy, Ö. Review of fuel cells to grid interface: Configurations, technical challenges and trends. J. Clean. Prod. 2019, 213, 1353–1370. [Google Scholar] [CrossRef]
  35. Kirubakaran, A.; Jain, S.; Nema, R. A review on fuel cell technologies and power electronic interface. Renew. Sustain. Energy Rev. 2009, 13, 2430–2440. [Google Scholar] [CrossRef]
  36. Park, K.-D.; Roh, G.-T.; Kim, K.-H.; Ahn, J.-W. Experimental study on development of a marine hybrid power system. J. Korean Soc. Mar. Eng. 2017, 41, 495–500. [Google Scholar] [CrossRef]
  37. Bassam, A.M.; Phillips, A.B.; Turnock, S.R.; Wilson, P.A. An improved energy management strategy for a hybrid fuel cell/battery passenger vessel. Int. J. Hydrog. Energy 2016, 41, 22453–22464. [Google Scholar] [CrossRef] [Green Version]
  38. Fuel Cell Energy Inc. 300kW DFC300 Specification. Available online: http://www.fuelcellenergy.com/assets/PID000155_FCE_DFC300_r1_hires.pdf (accessed on 16 August 2011).
  39. Milewski, J.; Świercz, T.; Badyda, K.; Miller, A.; Dmowski, A.; Biczel, P. The control strategy for a molten carbonate fuel cell hybrid system. Int. J. Hydrog. Energy 2010, 35, 2997–3000. [Google Scholar] [CrossRef]
  40. Heidebrecht, P.; Sundmacher, K. Molten carbonate fuel cell (MCFC) with internal reforming: Model-based analysis of cell dynamics. Chem. Eng. Sci. 2003, 58, 1029–1036. [Google Scholar] [CrossRef]
  41. Cao, J.; Emadi, A. A New Battery/Ultracapacitor Hybrid Energy Storage System for Electric, Hybrid, and Plug-in Hybrid Electric Vehicles. IEEE Trans. Power Electron. 2012, 27, 122–132. [Google Scholar]
  42. Choi, C.H.; Yu, S.; Han, I.-S.; Kho, B.-K.; Kang, D.-G.; Lee, H.Y.; Seo, M.-S.; Kong, J.-W.; Kim, G.; Ahn, J.-W.; et al. Development and demonstration of PEM fuel-cell-battery hybrid system for propulsion of tourist boat. Int. J. Hydrog. Energy 2016, 41, 3591–3599. [Google Scholar] [CrossRef]
  43. Han, J.; Charpentier, J.-F.; Tang, T. An Energy Management System of a Fuel Cell/Battery Hybrid Boat. Energies 2014, 7, 2799–2820. [Google Scholar] [CrossRef] [Green Version]
  44. San Martín, J.I.; Zamora, I.; Asensio, F.J.; García Villalobos, J.; San Martín, J.J.; Aperribay, V. Control and Management of a Fuel Cell Microgrid. Energy Efficiency Optimization. Renew. Energy Power Qual. J. 2017, 7, 314–319. [Google Scholar] [CrossRef]
  45. Garcia, P.; Fernandez, L.M.; Garcia, C.A.; Jurado, F.; Fernández-Ramirez, L.M. Energy Management System of Fuel-Cell-Battery Hybrid Tramway. IEEE Trans. Ind. Electron. 2010, 57, 4013–4023. [Google Scholar] [CrossRef]
  46. Jabir, M.; Mokhlis, H.; Muhammad, M.A.; Illias, H.A. Optimal battery and fuel cell operation for energy management strategy in MG. IET Gener. Transm. Distrib. 2019, 13, 997–1004. [Google Scholar] [CrossRef]
  47. National Law Information Center of Korea. Enforcement Rule of Energy Law. Available online: http://law.go.kr/nwRvsLsInfoR.do?lsiSeq=200561 (accessed on 28 December 2017).
  48. Ha, Y.-J.; Lee, Y.-G.; Kang, B.H. A Study on the Estimation of the Form Factor of Full-Scale Ship by the Experimental Data of Geosim Models. J. Soc. Nav. Arch. Korea 2013, 50, 291–297. [Google Scholar] [CrossRef] [Green Version]
Figure 1. Comparison of efficiency versus power generation in each type of fuel cell.
Jmse 07 00230 g001
Figure 2. Process flow diagram of the test bed.
Jmse 07 00230 g002
Figure 3. Configuration diagram of peripheral equipment for DFC300 MA.
Jmse 07 00230 g003
Figure 4. Concept of Power generation for fuel cell system.
Jmse 07 00230 g004
Figure 5. Basic diagram for the energy storage system (ESS).
Jmse 07 00230 g005
Figure 6. Diagram of interface design.
Jmse 07 00230 g006
Figure 7. Comparison of fuel consumption of the commercial diesel generator and the hybrid power source.
Jmse 07 00230 g007
Figure 8. Comparison of CO2 emissions of the commercial diesel generator and the hybrid power source.
Jmse 07 00230 g008
Figure 9. Power consumption of 5500 TEU reefer container during different operation modes.
Jmse 07 00230 g009
Figure 10. Fuel consumption in each operating mode of the 5500 TEU reefer container.
Jmse 07 00230 g010
Figure 11. Comparison of CO2 emissions and CO2 emission reduction rate in each operating mode of the 5500 TEU reefer container.
Jmse 07 00230 g011
Figure 12. Operating modes of the 13000 TEU container.
Jmse 07 00230 g012
Figure 13. Fuel consumption in each operating mode of the 13000 TEU container ship.
Jmse 07 00230 g013
Figure 14. Comparison of CO2 emissions and CO2 emission reduction rate in each operating mode of the 13000 TEU container ship.
Jmse 07 00230 g014
Figure 15. Operating modes of the 40 k DWT bulk carrier.
Jmse 07 00230 g015
Figure 16. Fuel consumption in each operating mode of the 40 k DWT bulk carrier.
Jmse 07 00230 g016
Figure 17. Comparison of CO2 emissions and CO2 emission reduction rate in each operating mode of the 40 k DWT bulk carrier.
Jmse 07 00230 g017
Figure 18. Operating modes of the 130 k DWT LNG carrier.
Jmse 07 00230 g018
Figure 19. Fuel consumption in each operation mode of the 13 0k DWT LNG carrier.
Jmse 07 00230 g019
Figure 20. Comparison of CO2 emissions and CO2 emission reduction rate in each operating mode of the 130 k DWT LNG carrier.
Jmse 07 00230 g020
Figure 21. Operating modes of the 300 k DWT VLCC.
Jmse 07 00230 g021
Figure 22. Fuel consumption in each operating mode of the 300 k DWT VLCC.
Jmse 07 00230 g022
Figure 23. Comparison of CO2 emissions and CO2 emission reduction rate in each operating mode of the 300 k DWT VLCC.
Jmse 07 00230 g023
Table 1. International Convention for the Prevention of Marine Pollution from Ships (MARPOL) 73/78—Annex VI Regulations for the Prevention of Air Pollution from Ships.
Year BuiltCapacityNOxSOxPMRemarks
2008~2015>125 kW7.7 g/kWh24 kg/ton1.2 kg/ton20% decrease
2016~2.0 g/kWh6 kg/ton0.3 kg/ton80% decrease
Table 2. The energy efficiency design index (EEDI)-based CO2 emission reduction goals.
Phase 0 (Year Built)Phase 1Phase 2Phase 3
2013~20142015~20192020~20242025~
Scheduled to take effect10% decrease20% decrease30% decrease
Table 3. Fuel cell types (catalyst, durability, and hydrogen storage).
Fuel Cell TypesMain FuelElectrolyteTemperature of GenerationLevel of TechnologySubject of Application
PEMFCHydrogenIon conductive polymer filmOrdinary temperature~100 °CDevelopment and demonstration phaseSmall power source,
MethanolAutomobile
MCFCNatural gasMolten carbonate600~700 °CDevelopment phaseHybrid power generation
Coal gas
PAFCNatural gasPhosphoric acid150~200 °CCommercialization phaseDistributed power system
Methanol
SOFCNatural gasSolid oxide700~1000 °CDevelopment phaseHybrid power generation
Coal gas
AFCHydrogenPotassium hydroxide80~120 °CCommercialization phaseSpace missions
Table 4. Calculation methods according to emission gas.
CO2CH4N2O
Estimate methodologyTier 1,2Tier 1,2Tier 1,2
Table 5. Fuel-based exhaust gas emission factors.
EmissionEmission FactorGuideline Reference
CH40.3 [ T C H 4 / T F u e l ] IPCC 2006
N2O0.08 [ T N 2 O / T F u e l ] IPCC 2006
CO23.206 [ T C O 2 / T F u e l ] ISO 8217 Grades DMX
Table 6. DFC300 MA system specifications.
DFC300 MA Generation Plant Specifications
Machinery Balance of Plant [MBOP]
Height (Main enclosure)9.6`
Height (Ship loose items)14.6`
Width8.0`
Length19.8`
Weight12,292 kg
Electric Balance of Plant [EBOP]
Height9.5`
Width3.5`
Length9.0`
Weight12,292 kg
Stack Module8.4`
Height8.2`
Width15.0`
Length18,143 kg
Weight
Total Weight42,727 kg
Power output
Rated output250 kW
Voltage380~480 VAC
Frequency50~60 Hz
Power qualityPer IEEE 519
Table 7. ESS general battery and inverter specifications.
DivisionItemSpecification
BatteryGeneralRated output100 kW
Rated voltage407 VDC
Capacity300 AH
Assembly of Cell110S/2P
Range of voltage352 V~451 V
Max discharge current600 A
ProtectionOVP, UVP, OCP, OTP
CommunicationRS 232C, CAN 2.0
InverterAlternating Current [AC] InputComposition3 Phase
Voltage440 VAC
Frequency50/60 Hz
Rated output100 kW
Total Harmonic Distortion [THD]Below 5%
OutputVoltage440 VAC
Frequency50/60 Hz
Rated output100 kW
FunctionProtectionOver current, Over temperature, Over voltage, Low battery shutdown, Reverse flow
Table 8. Hybrid test bed and generator specifications.
ItemSpecification
Engine partStandby power rating>95 PS
Engine type4 Stroke, Water cooled
Revolution1800 rpm
Number of cylinders6
Cylinder typeVertical series
Governor typeSpeed control type
Cooling systemRadiator type
FuelDiesel
Starting systemDC 24 V battery start
Generator partTypeRevolving field magnet
Standby power rating50 kW/62.5 kVA
Prime power rating45 kW/56 kVA
Voltage440/254 V
Current82 A
Phase and wireThree phase four wire
Frequency60 Hz
Power factor0.8 Lag
Pole4
Revolution1800 rpm
Table 9. Load bank specifications.
Rated Capacity300 kW
Rated Voltage3 Phase, 440 V, 60 Hz
Current and Resistance Value for Each Capacity
Unit Capacity (kW)QuantitySynthetic Capacity (kW)Unit Current (A)Unit ResistanceEnclosure Configuration
0.110.10.131936 Ω1 box
0.210.20.26968 Ω
0.410.40.52484 Ω
0.810.81.04242 Ω
1111.31193.6 Ω
2122.6296.8 Ω
4145.2448.4 Ω
81810.4924.2 Ω
1611620.9912.1 Ω
3213241.986.05 Ω
60424078.783.22 Ω
Total15304.5399.7-
Table 10. Configuration of control logic for power system.
LoadControl Condition
≤100 kWESS SOC ≥ 80%MCFC and Consumption Load leveler
ESS SOC ≤ 80%MCFC and Charging ESS
101 kW ≤ Load ≤ 130 kWESS SOC ≥ 60%MCFC and Charging ESS and Diesel Generator [D/G] Off
40% ≤ ESS SOC ≥ 60%MCFC and ESS Discharging
ESS SOC ≤ 40%MCFC and ESS Discharging and D/G Operation
131 kW ≤ Load ≤ 180 kWESS SOC ≤ 35%MCFC and D/G Operation, ESS limit (≤20 kW)
ESS SOC ≤ 30%MCFC and D/G Operation, ESS limit (≤10 kW)
ESS SOC ≤ 25%MCFC and D/G Operation, ESS off
Table 11. Flow conversion formula and CO2 emission calculation formula.
Power SourceCalculation Method of Fuel ConsumptionCalculation Method of CO2
Diesel generatorKgoe/h = flow (L/h) × 0.901CO2 = 0.857 × flow (L/h) × (3.206 + 0.3 + 0.08)
Fuel cellKgoe/h = flow (m3/h) × 1.043CO2 = 0.631 × Electric Energy (kWh)
Table 12. Conversion standard of energy calorific value.
FuelUnitGloss Calorific ValueNet Calorific Value
MJkcal10−3 TOEMJkcal10−3 TOE
DieselL37.790100.90135.284200.842
LNGNm343.610,4301.04339.494200.942
Table 13. CO2 emission reduction rates in the commercial diesel generator vs. the hybrid power source.
Fuel Consumption (kgoe/h)CO2 Emissions (kgCO2/h)
Diesel generator43.5148.5
Hybrid power source35.657.7
CO2 reduction rate61%
Table 14. Load scenario according to the ship type.
VesselsOperation ModePower Sources
5500 TEU Reefer ContainerNormal seagoing (w/o reefer)Fuel Cell
Normal seagoing (w/reefer)Fuel Cell + Battery + D/G
Port in/out (w/o thruster)Fuel Cell
Port in/out (w/ thruster)Fuel Cell + Battery + D/G
Load/UnloadFuel Cell + Battery + D/G
13,000 TEU ContainerNormal seagoingFuel Cell
Port in/out (w/o thruster)Fuel Cell + Battery
Port in/out (w/ thruster)Fuel Cell + Battery + D/G
Load/UnloadFuel Cell
HarboringFuel Cell
40 k DWT Bulk CarrierNormal seagoingFuel Cell
Port in/outFuel Cell + Battery + D/G
Loading (shore crane)Fuel Cell + Battery
Loading (crane)Fuel Cell + Battery + D/G
HarboringFuel Cell
130 k DWT LNG CarrierNormal seagoingFuel Cell
Port in/outFuel Cell + Battery + D/G
Port dischargingFuel Cell + Battery + D/G
Port loadingFuel Cell + Battery + D/G
Port idle gas freeFuel Cell
300 k DWT VLCCNormal seagoingFuel Cell
W/I.G.S Topping upFuel Cell + Battery
Tank cleaningFuel Cell + Battery + D/G
Port in/outFuel Cell + Battery + D/G
Load/UnloadFuel Cell + Battery + D/G
Table 15. Cumulative CO2 emissions and reductions at load scenario.
CaseCO2 Emissions (kgCO2)Fuel Consumption (kgoe)CO2 Reduction RateExperiment Time (h:m:s)
Diesel GeneratorHybrid Power SourceDiesel GeneratorHybrid Power Source
5500 TEU Reefer Container205.656.860.354.1722:50:59
13,000 Container233.969.568.657.8704:01:01
40 k DWT Bulk Carrier184.949.854.252.0732:01:07
130 k DWT LNG Carrier217.759.663.854.9732:00:23
300 k DWT VLCC238.562.869.955.8742:00:20