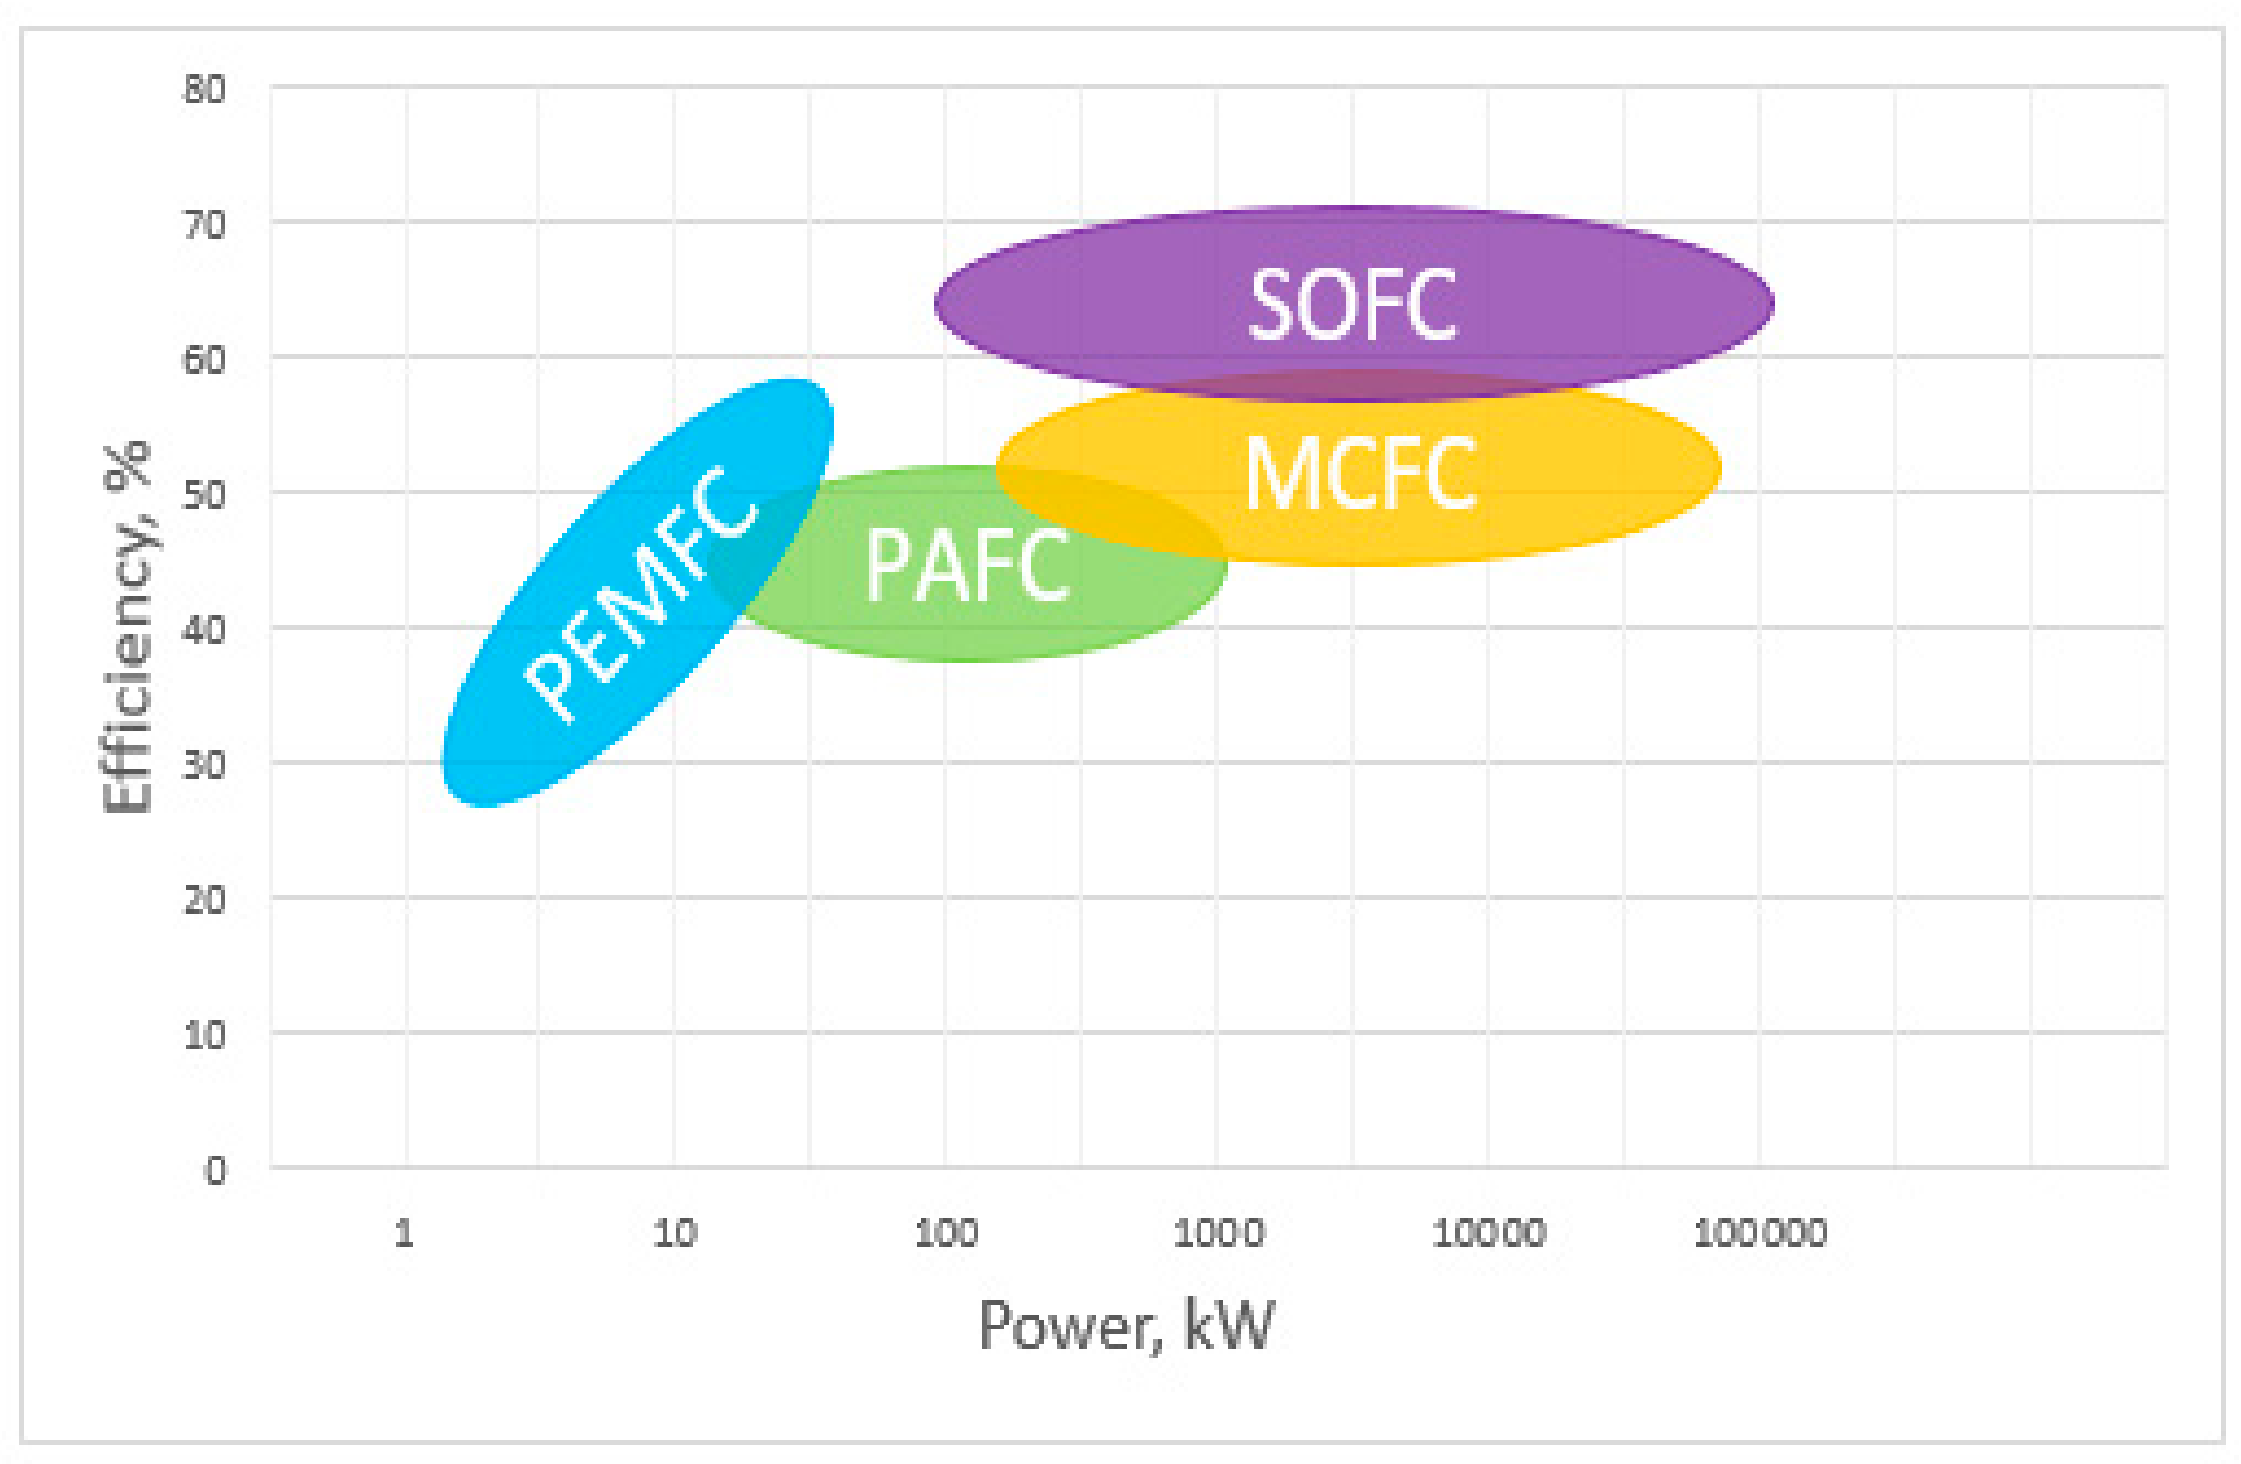
Figure 1.
Comparison of efficiency versus power generation in each type of fuel cell.
Figure 1.
Comparison of efficiency versus power generation in each type of fuel cell.
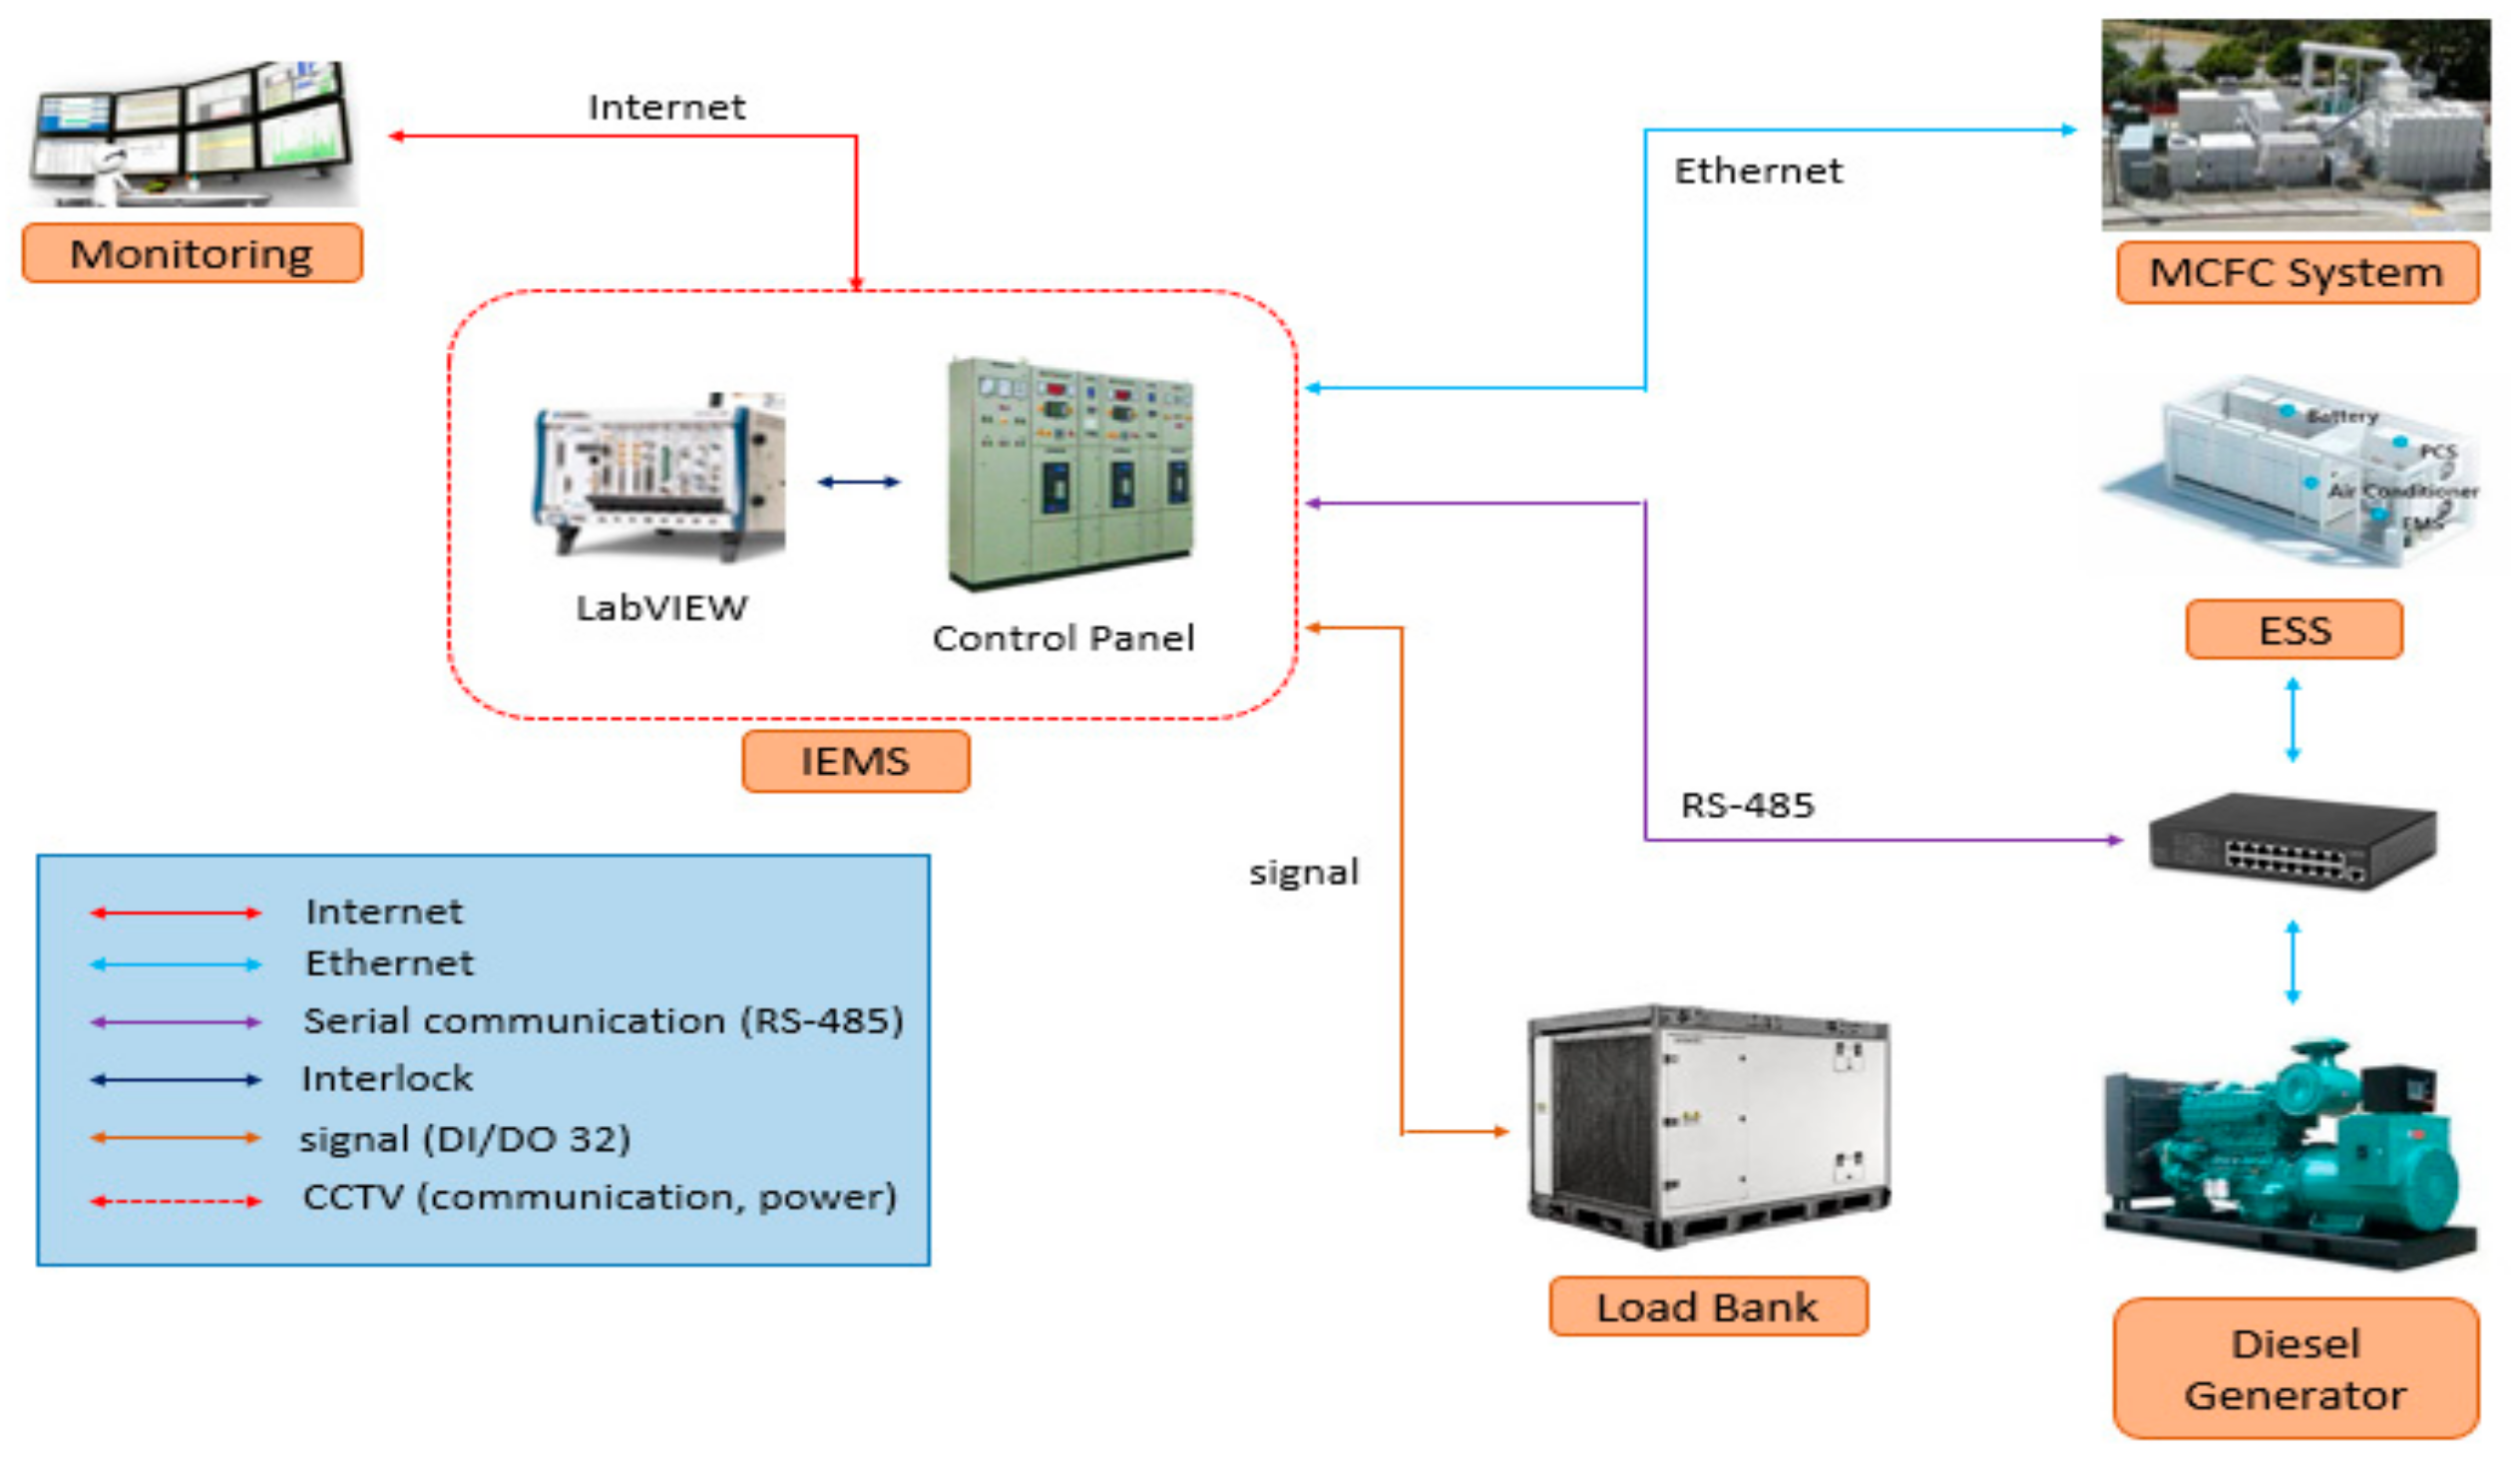
Figure 2.
Process flow diagram of the test bed.
Figure 2.
Process flow diagram of the test bed.
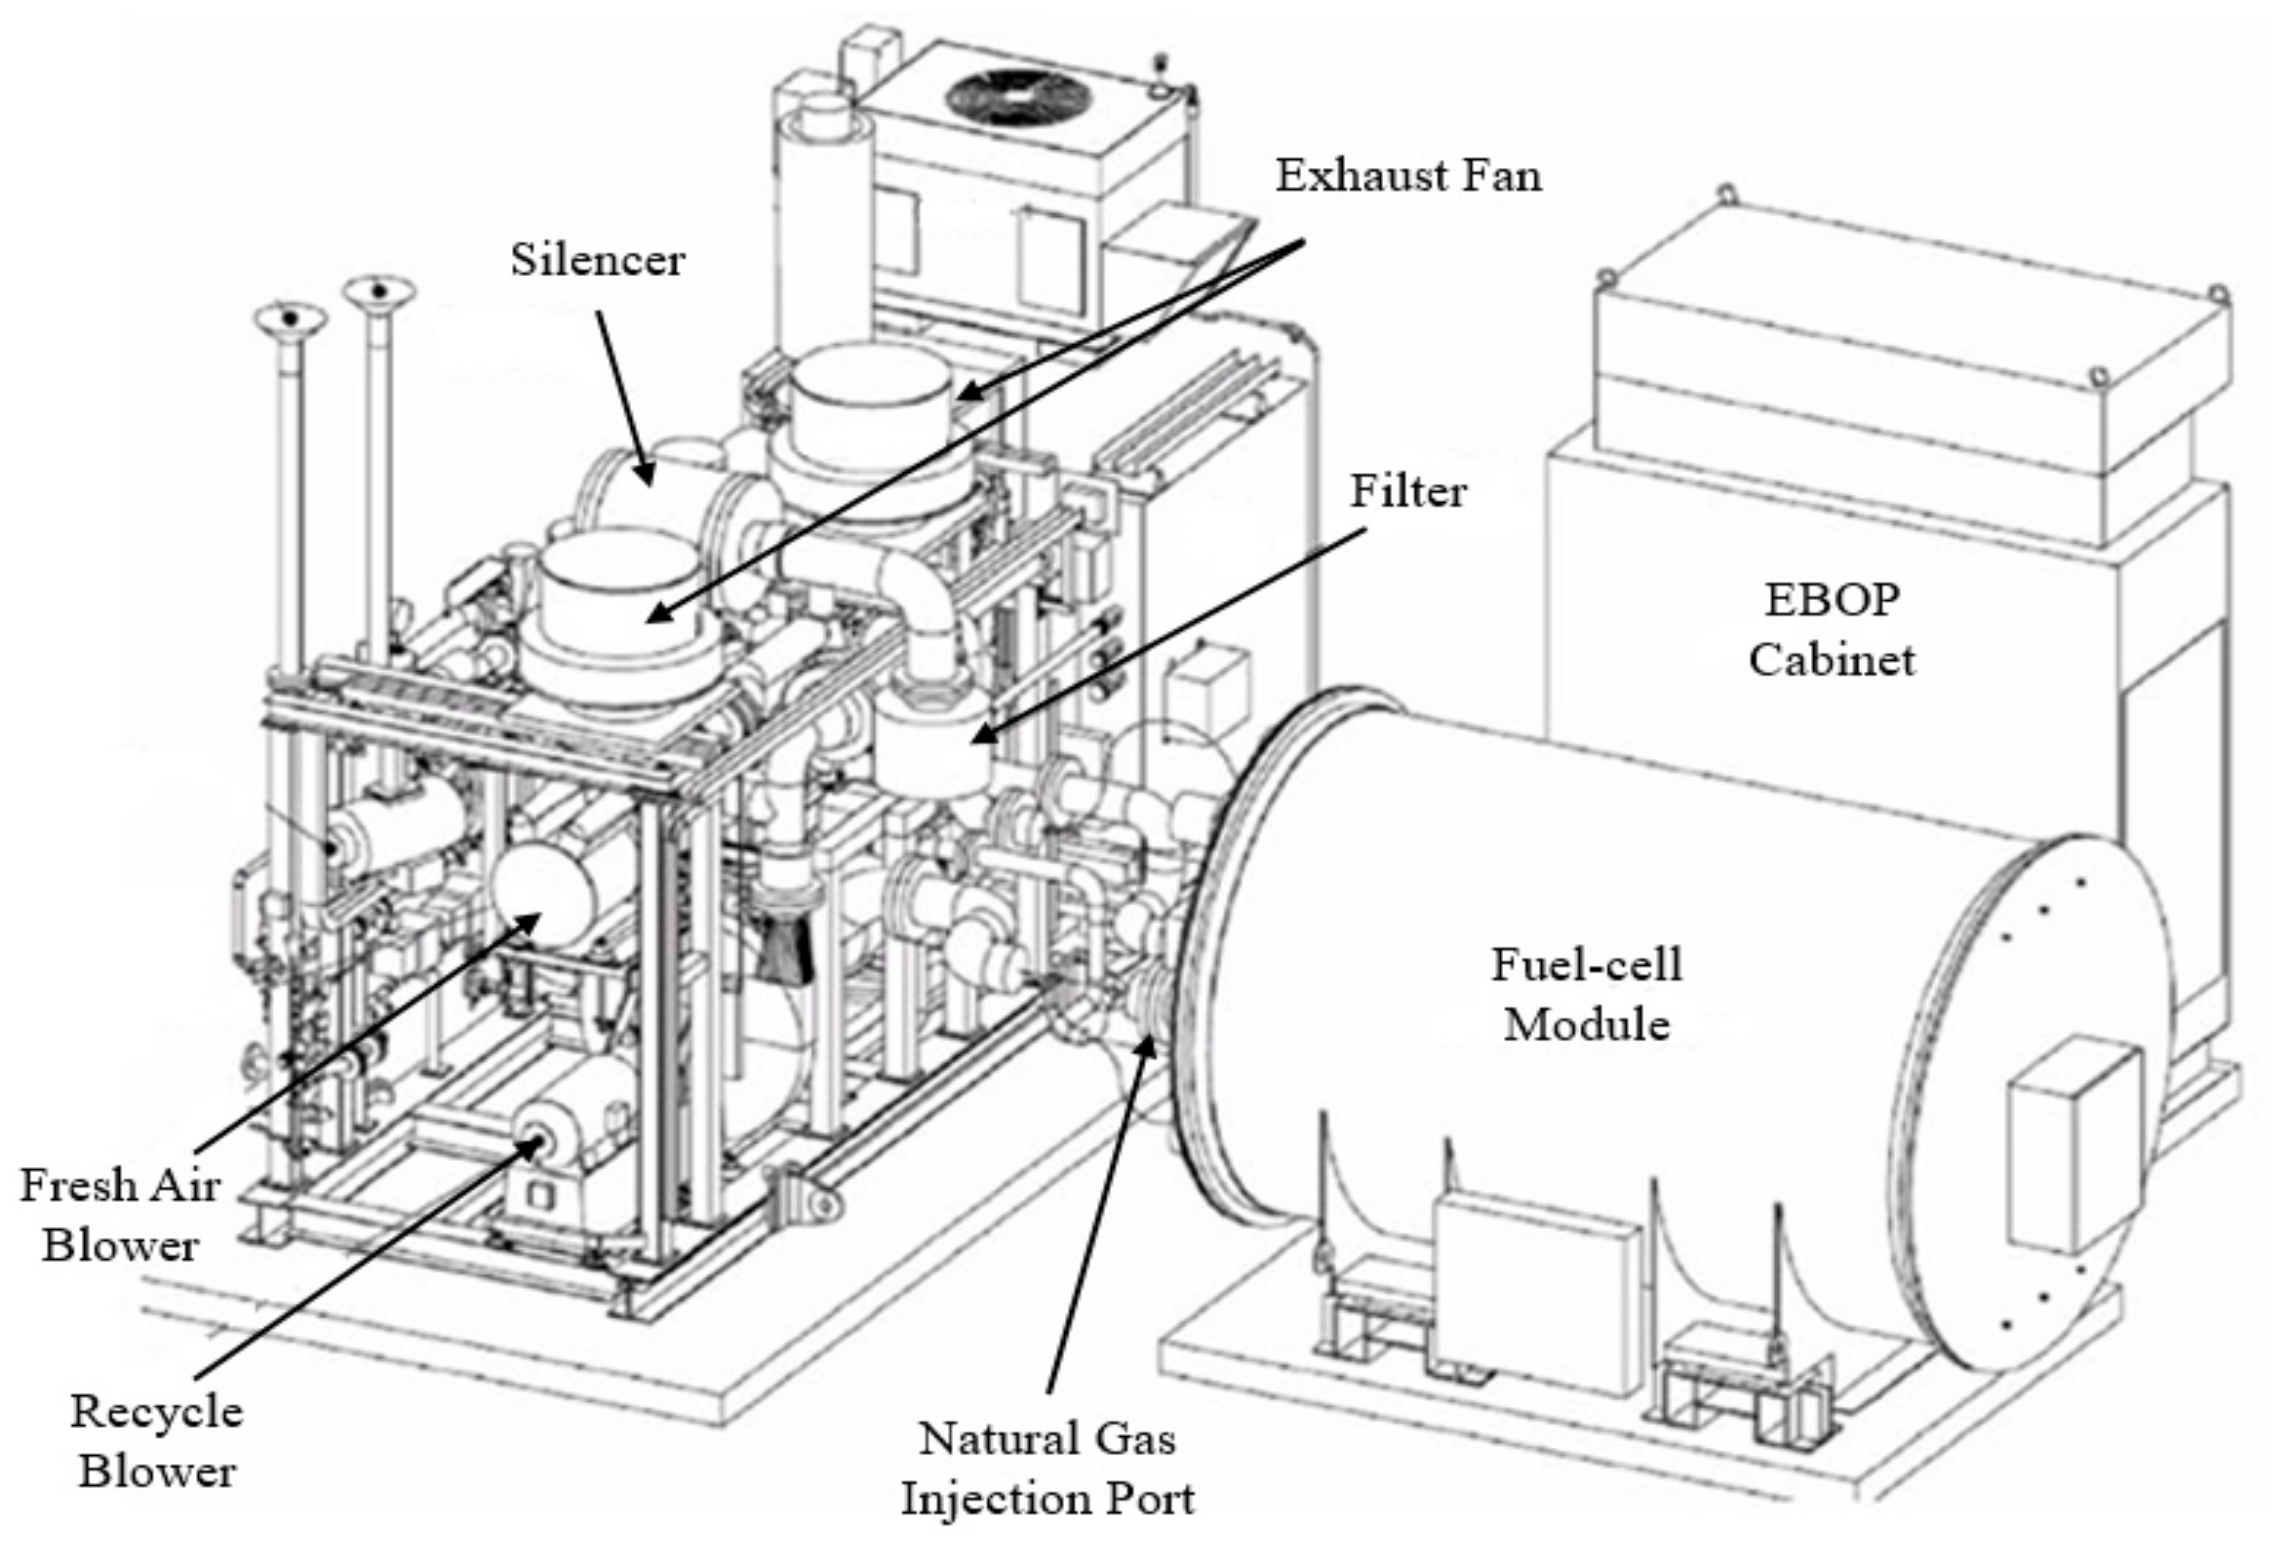
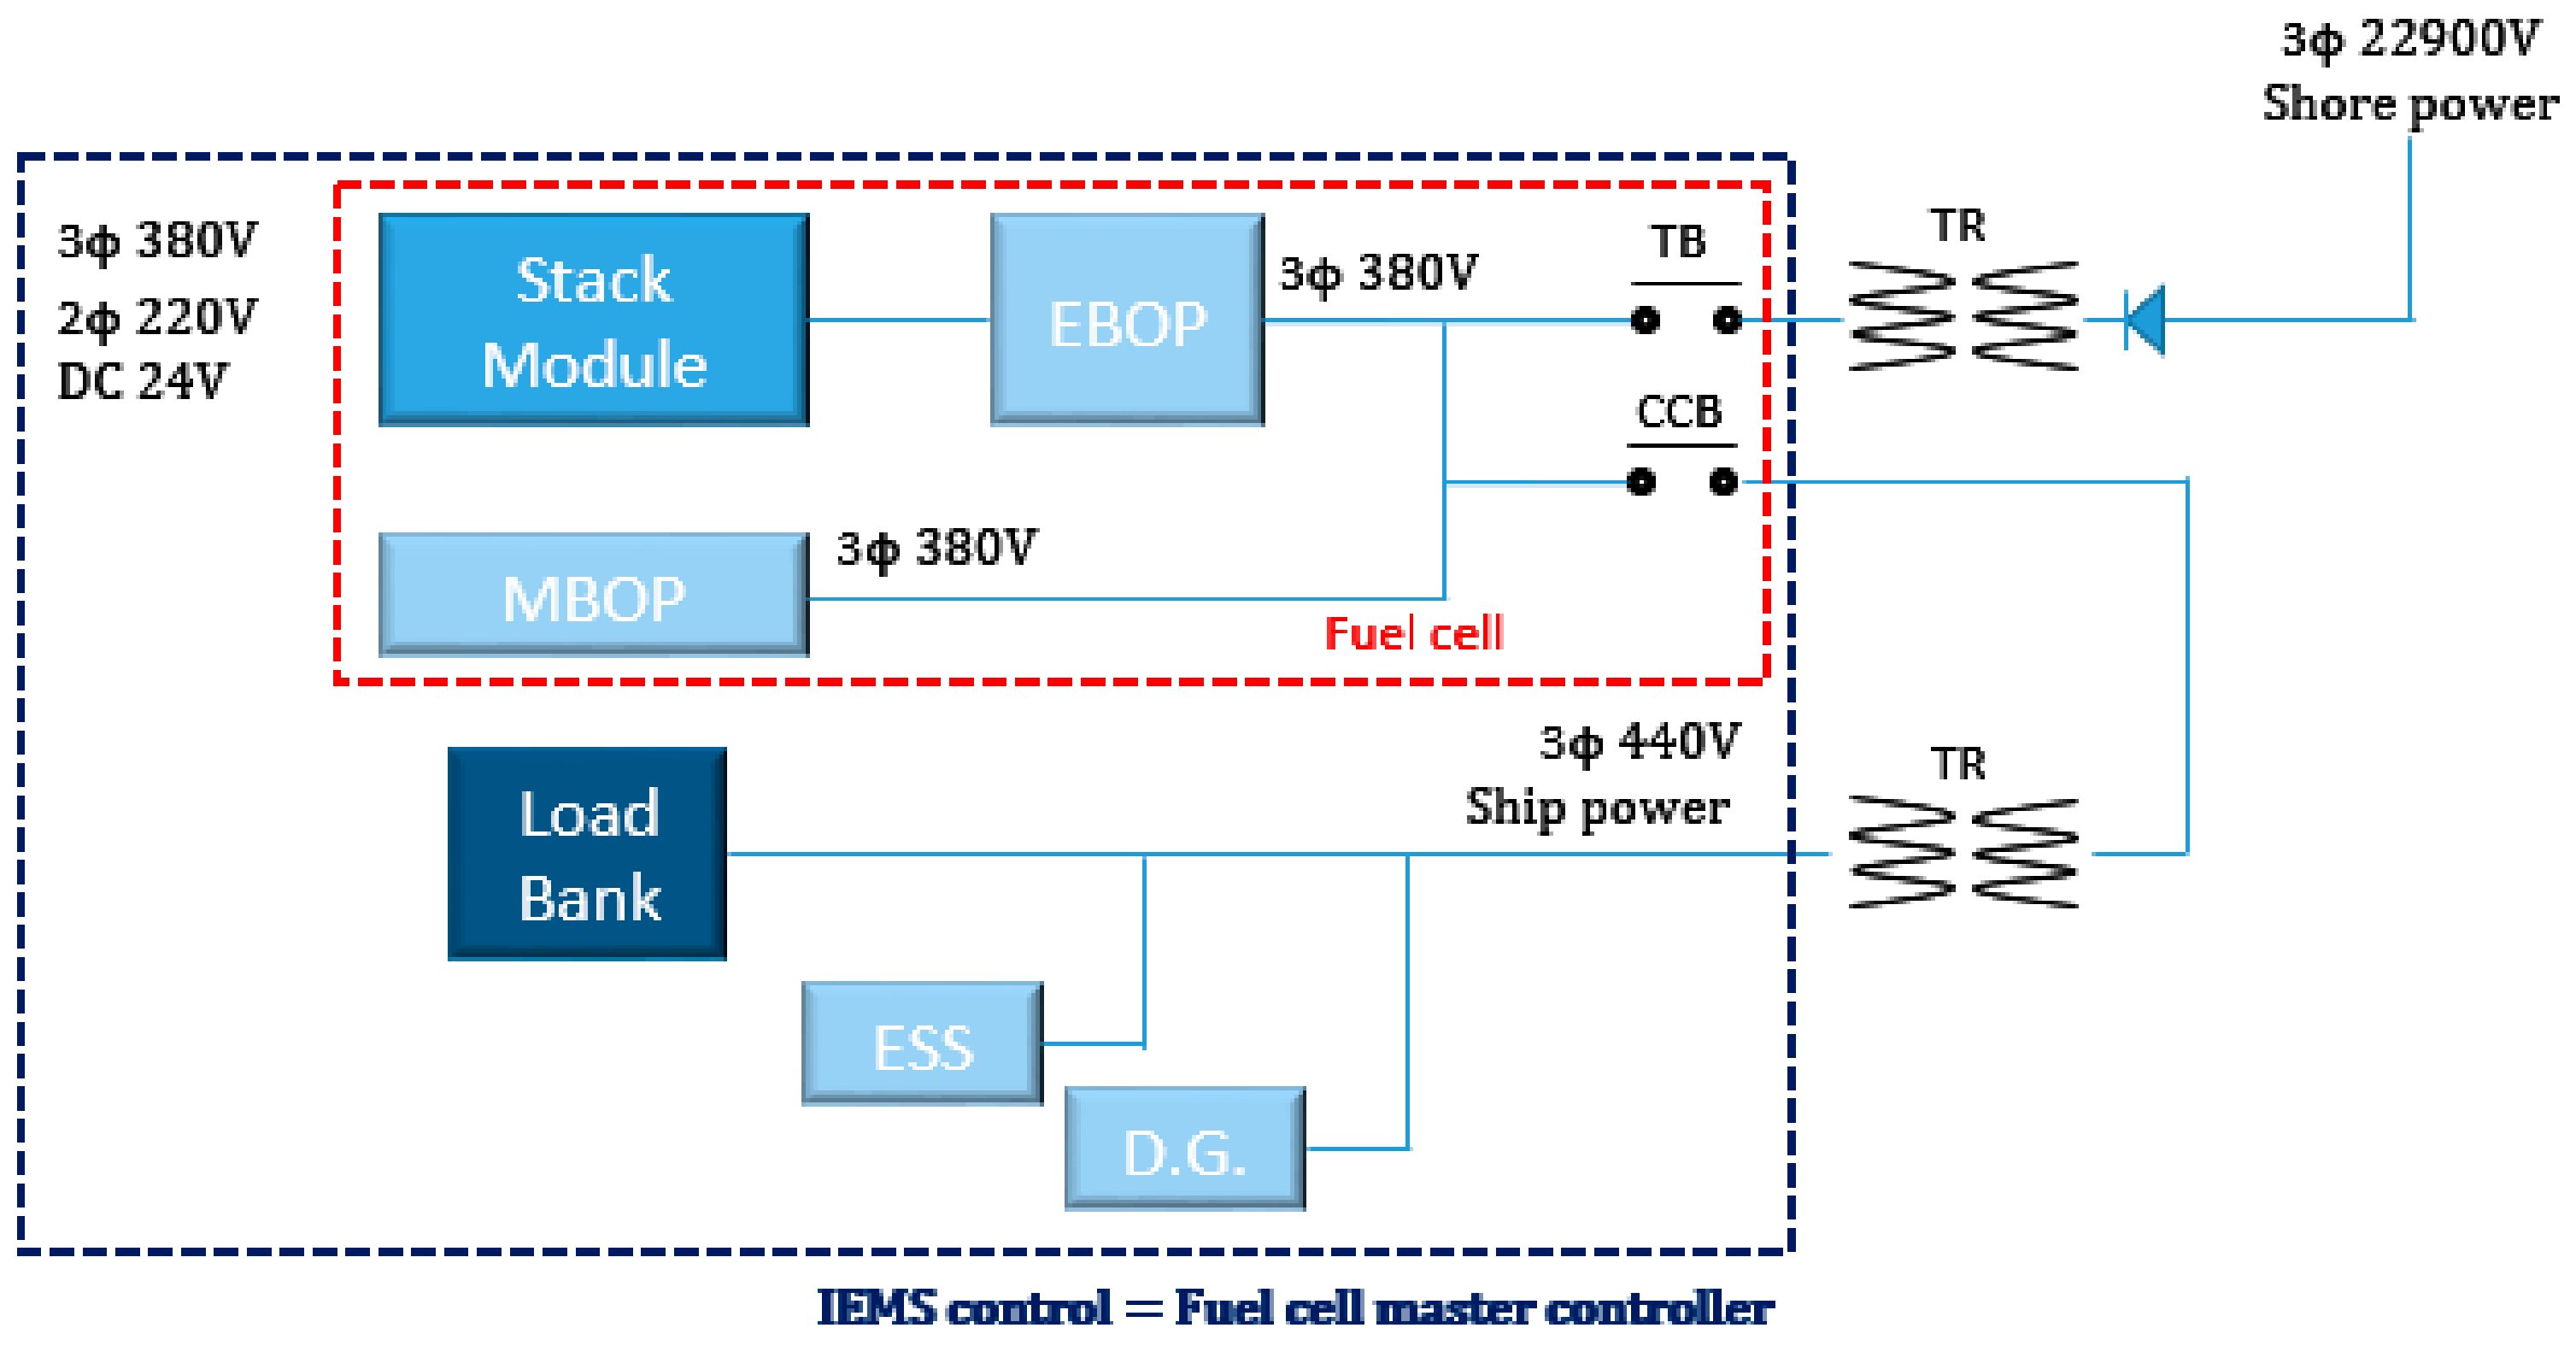
Figure 3.
Configuration diagram of peripheral equipment for DFC300 MA.
Figure 3.
Configuration diagram of peripheral equipment for DFC300 MA.
Figure 4.
Concept of Power generation for fuel cell system.
Figure 4.
Concept of Power generation for fuel cell system.
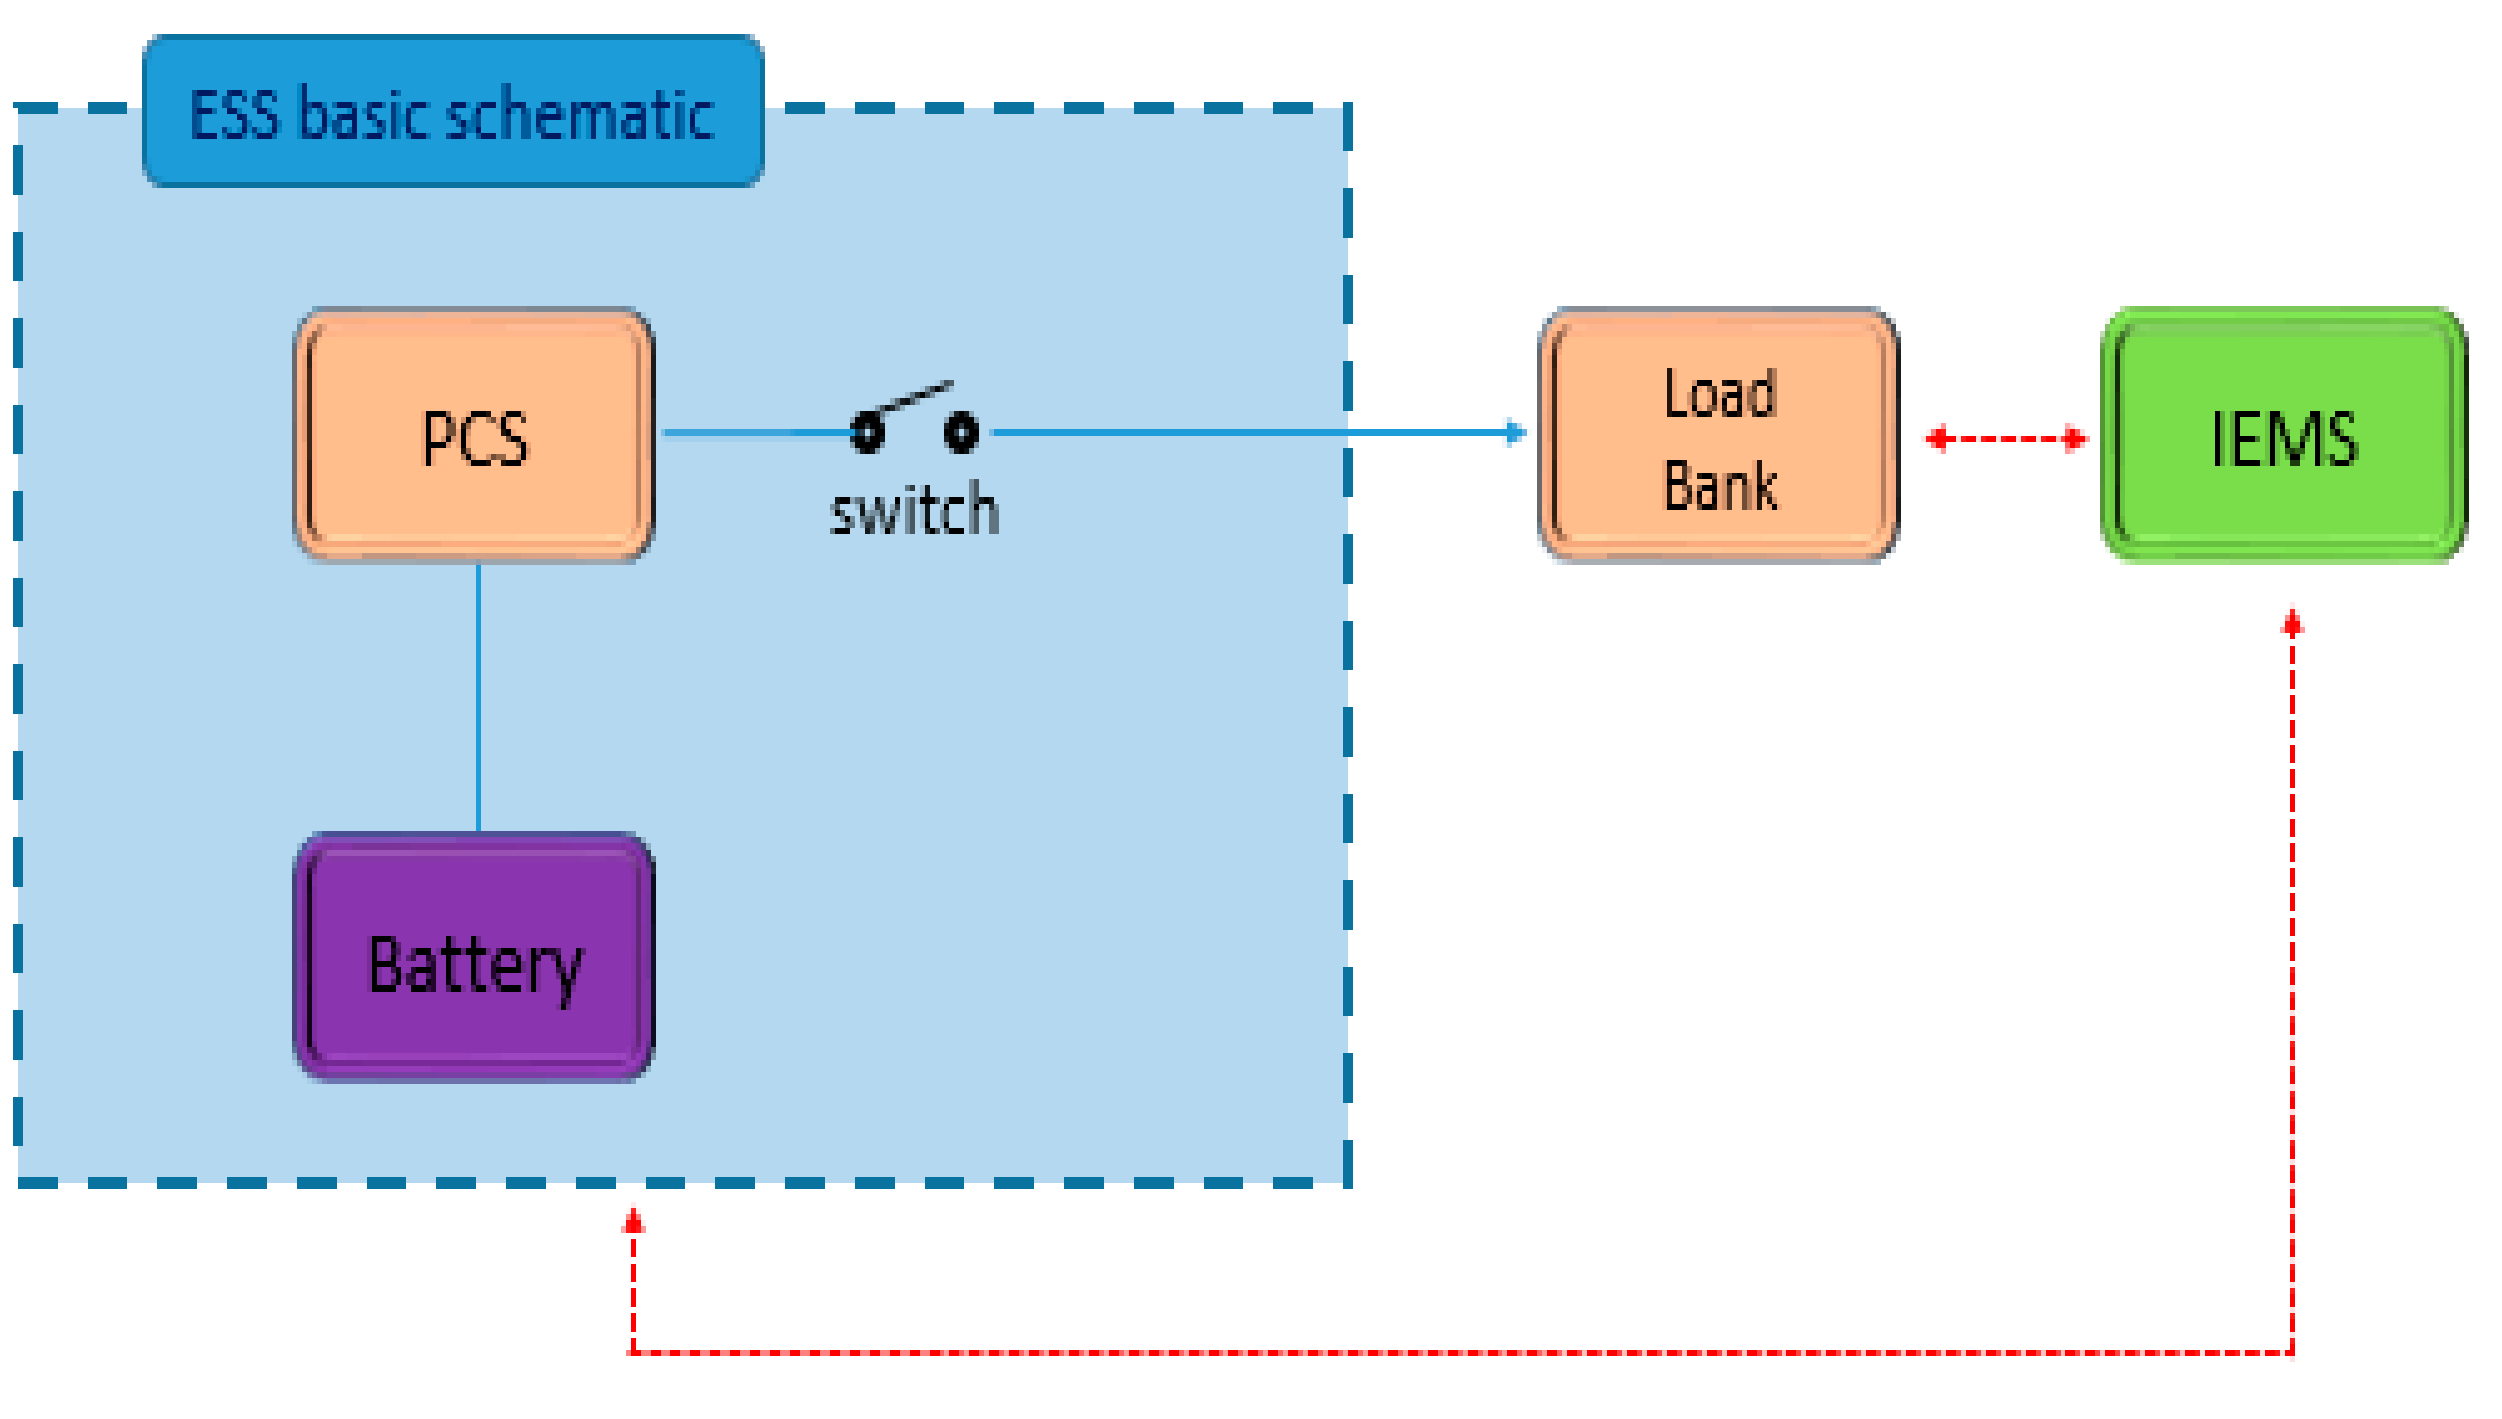
Figure 5.
Basic diagram for the energy storage system (ESS).
Figure 5.
Basic diagram for the energy storage system (ESS).
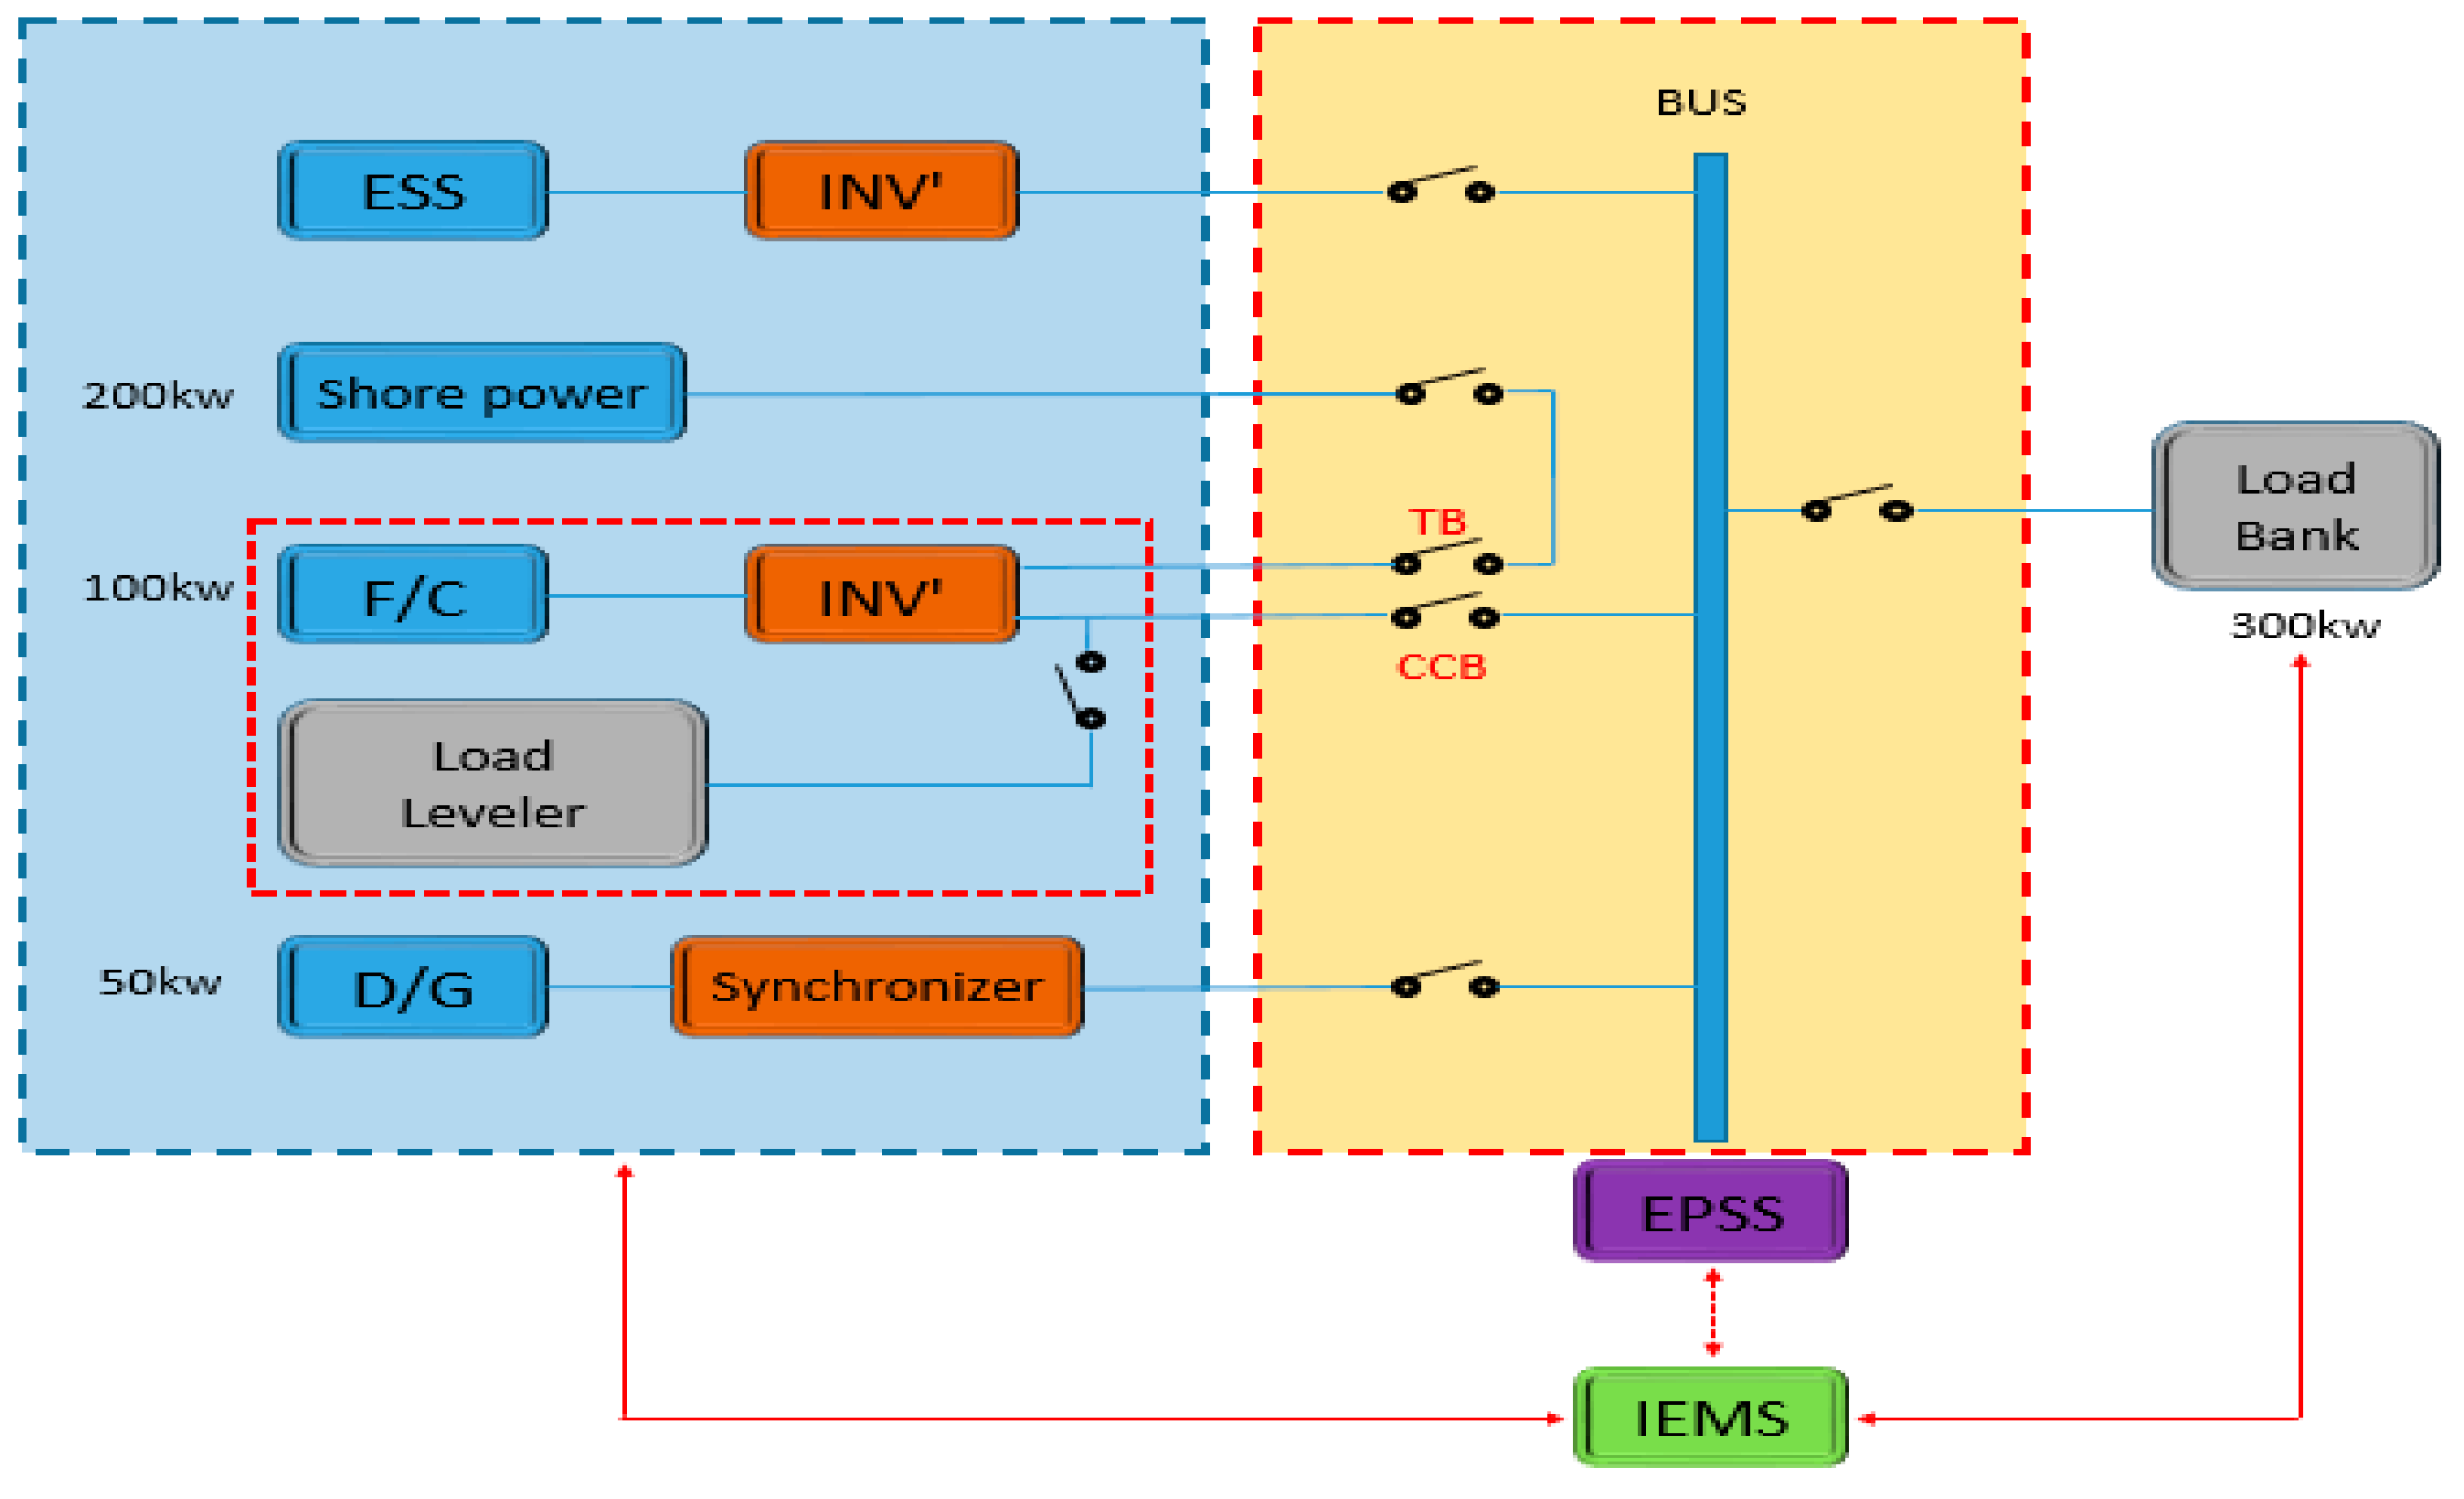
Figure 6.
Diagram of interface design.
Figure 6.
Diagram of interface design.
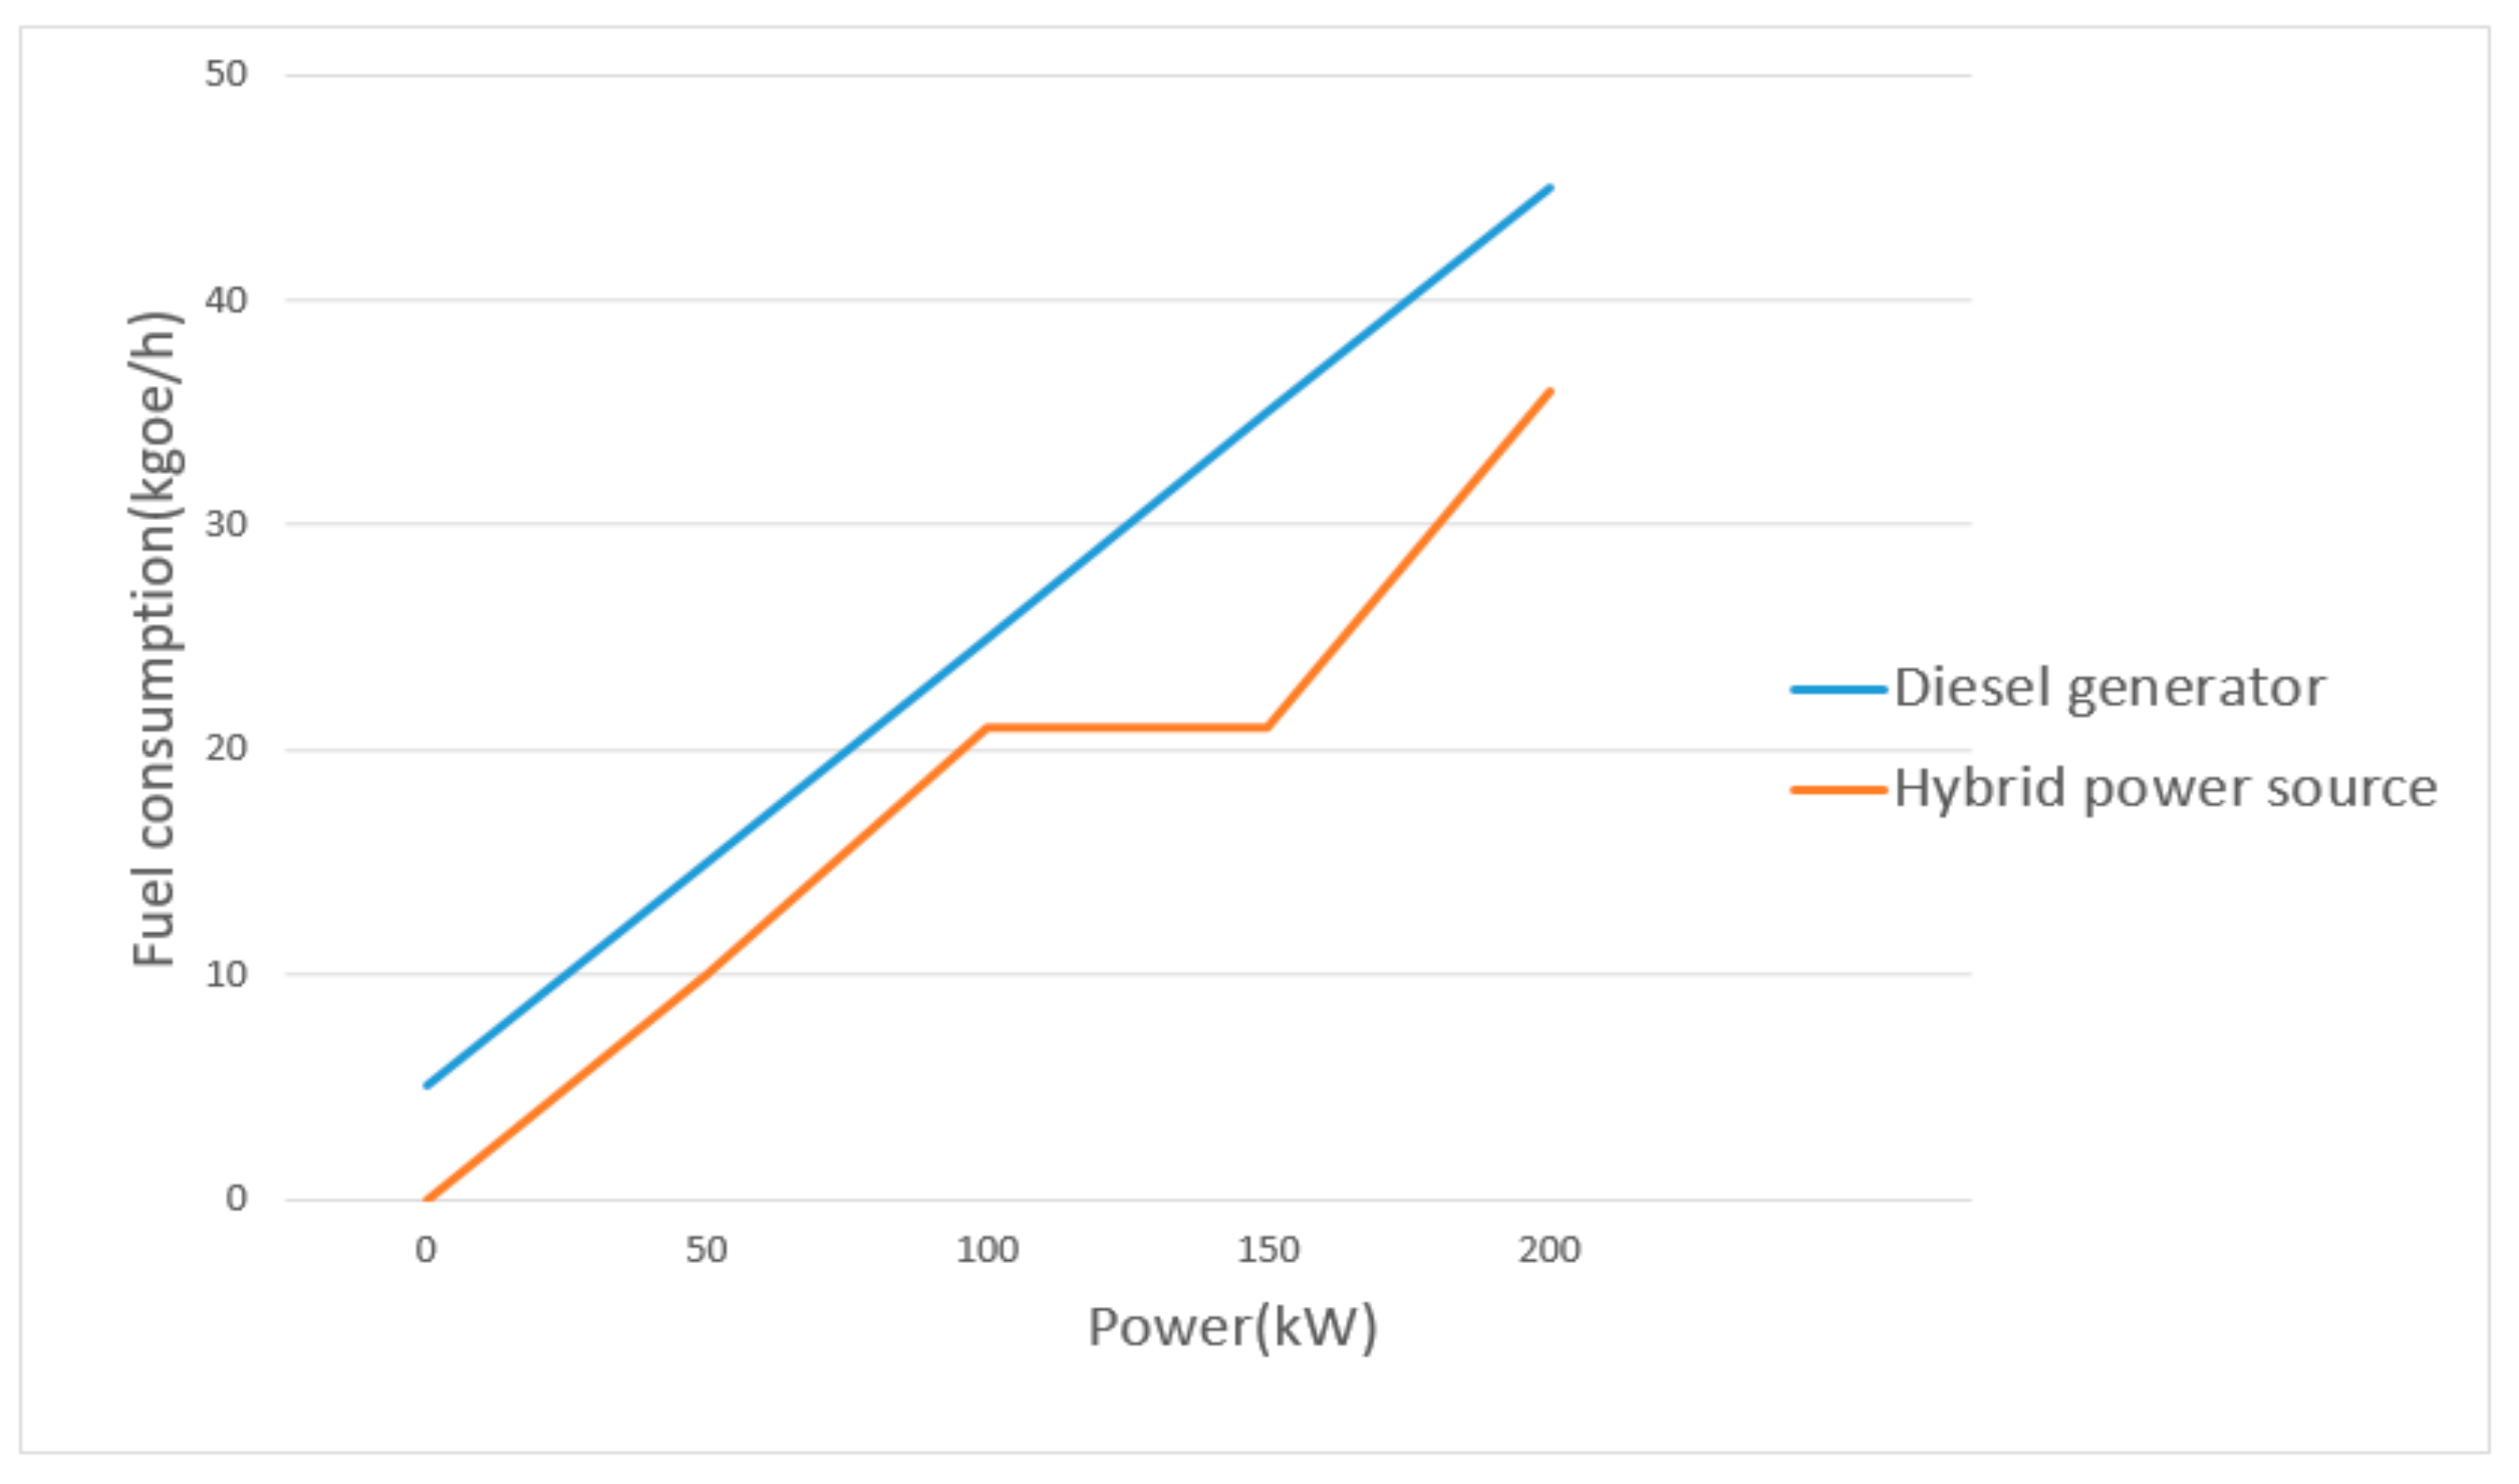
Figure 7.
Comparison of fuel consumption of the commercial diesel generator and the hybrid power source.
Figure 7.
Comparison of fuel consumption of the commercial diesel generator and the hybrid power source.
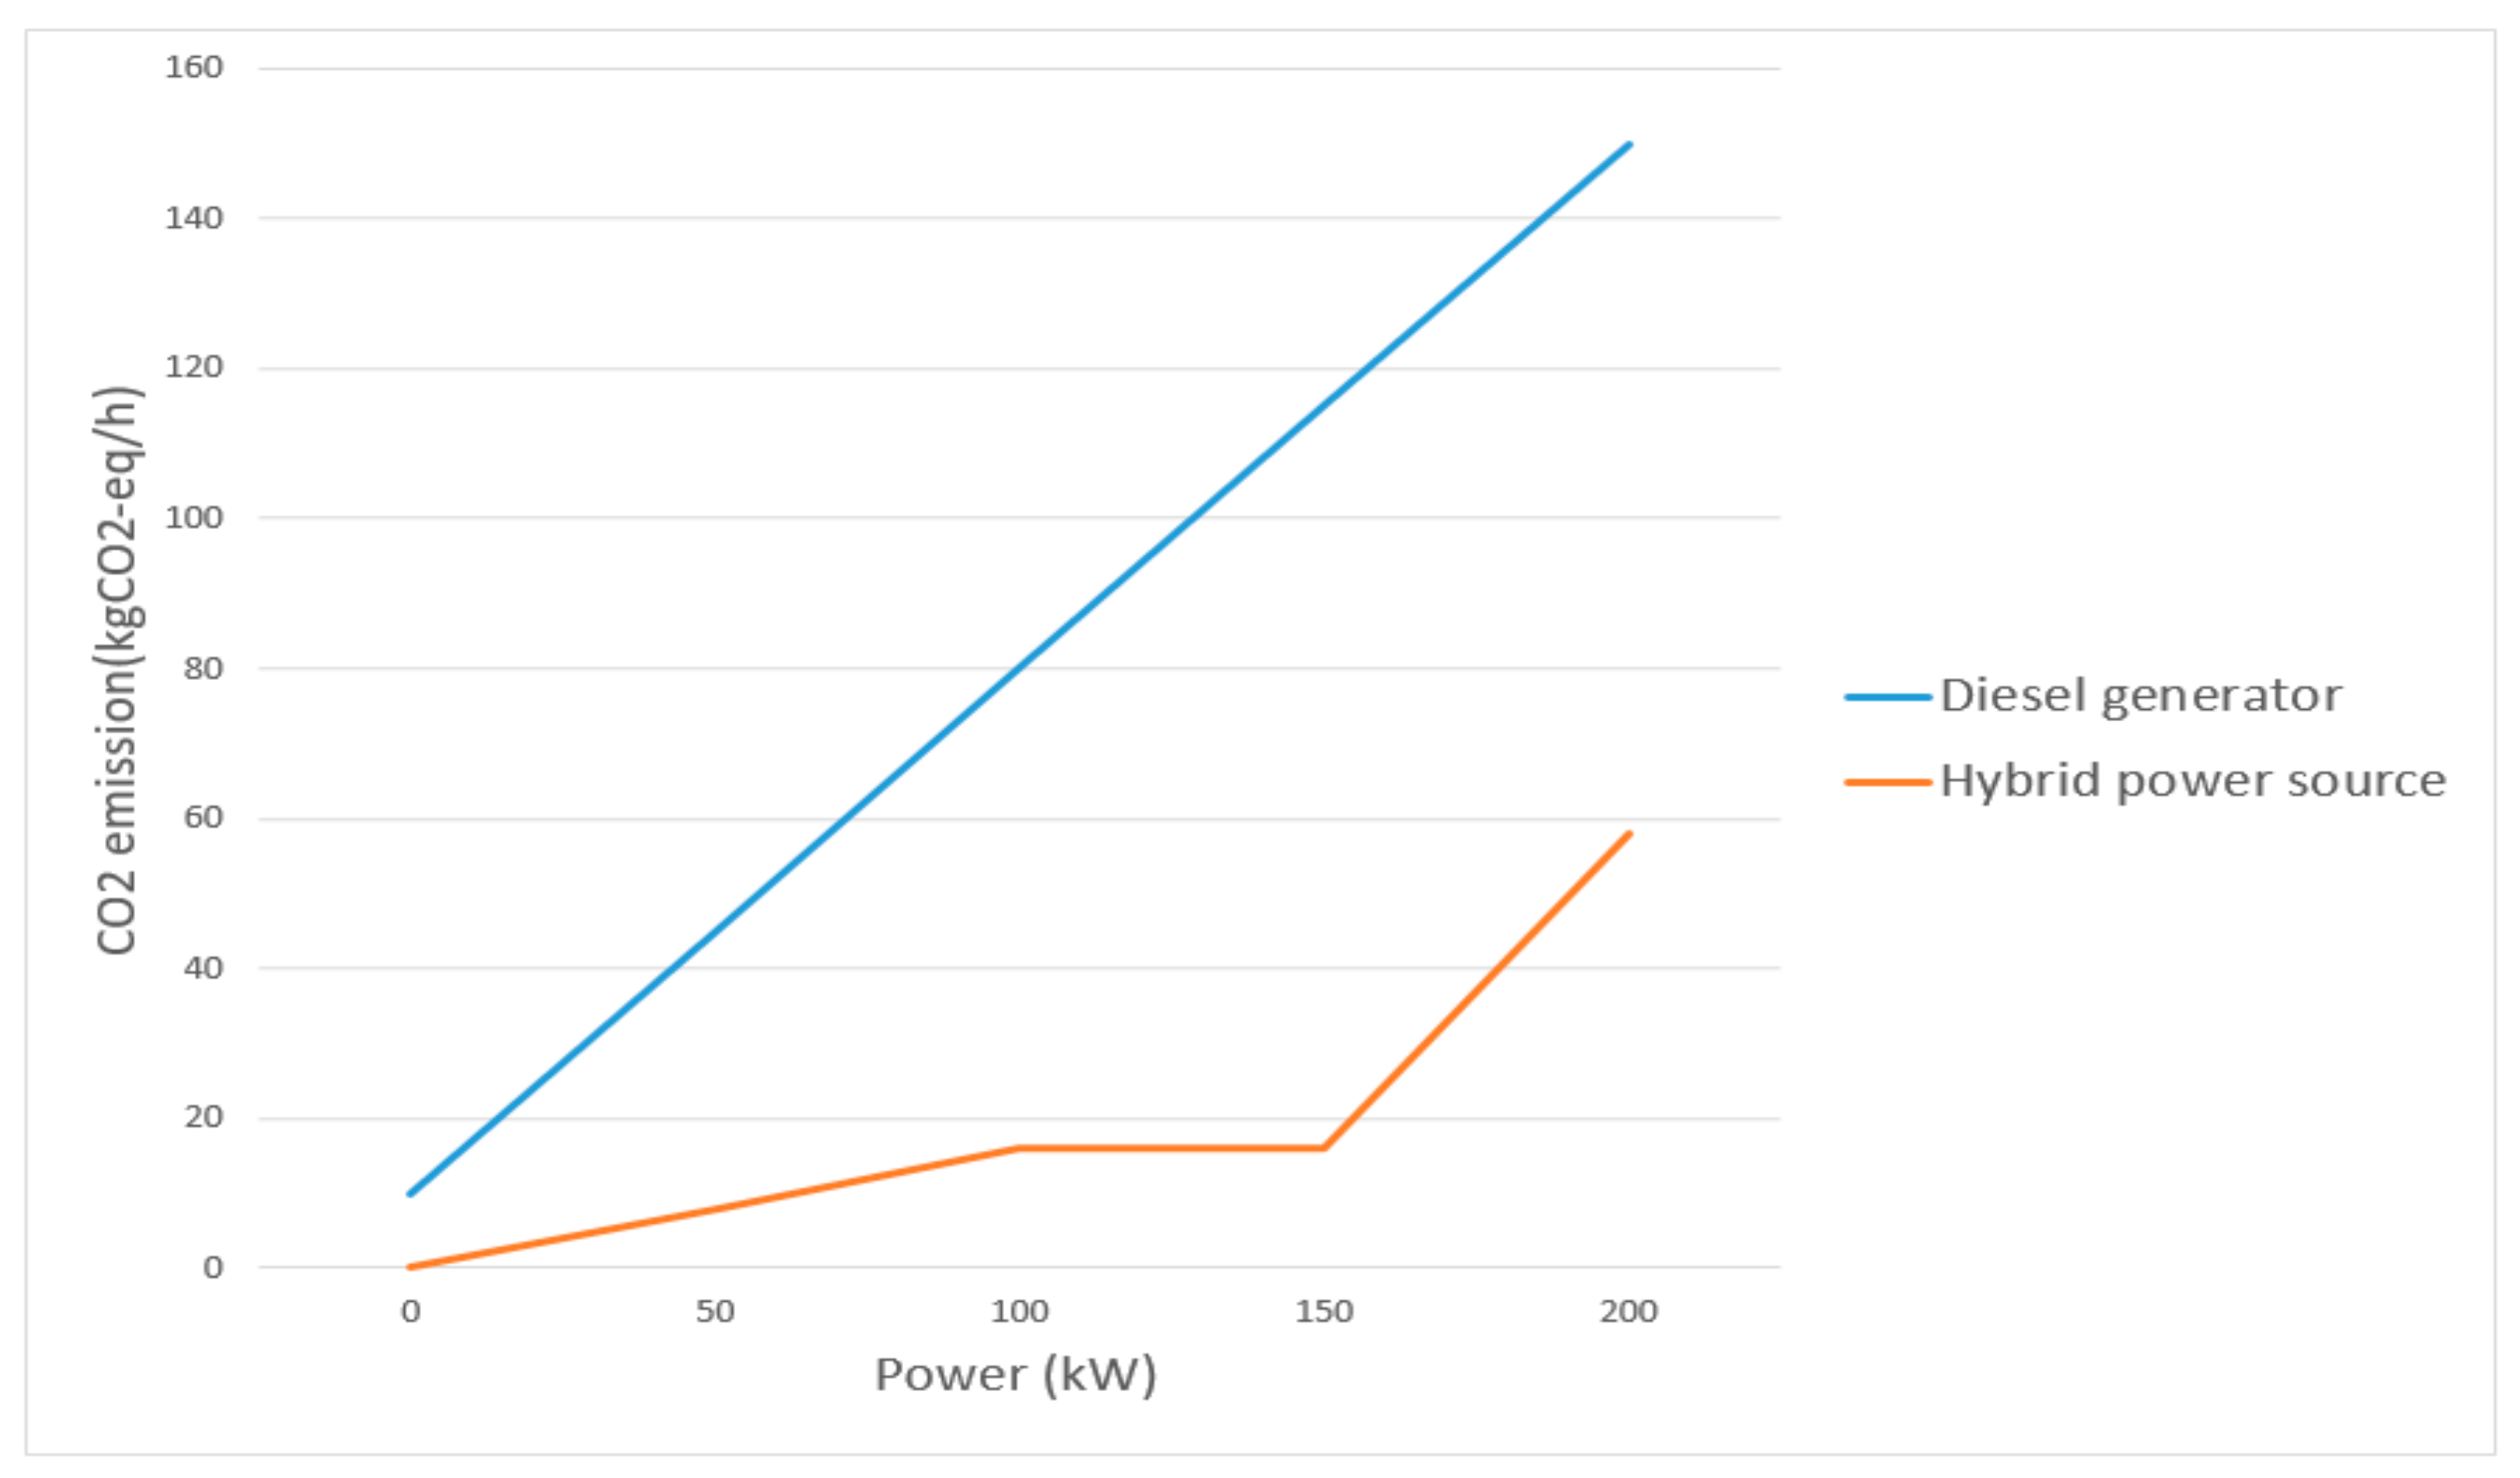
Figure 8.
Comparison of CO2 emissions of the commercial diesel generator and the hybrid power source.
Figure 8.
Comparison of CO2 emissions of the commercial diesel generator and the hybrid power source.
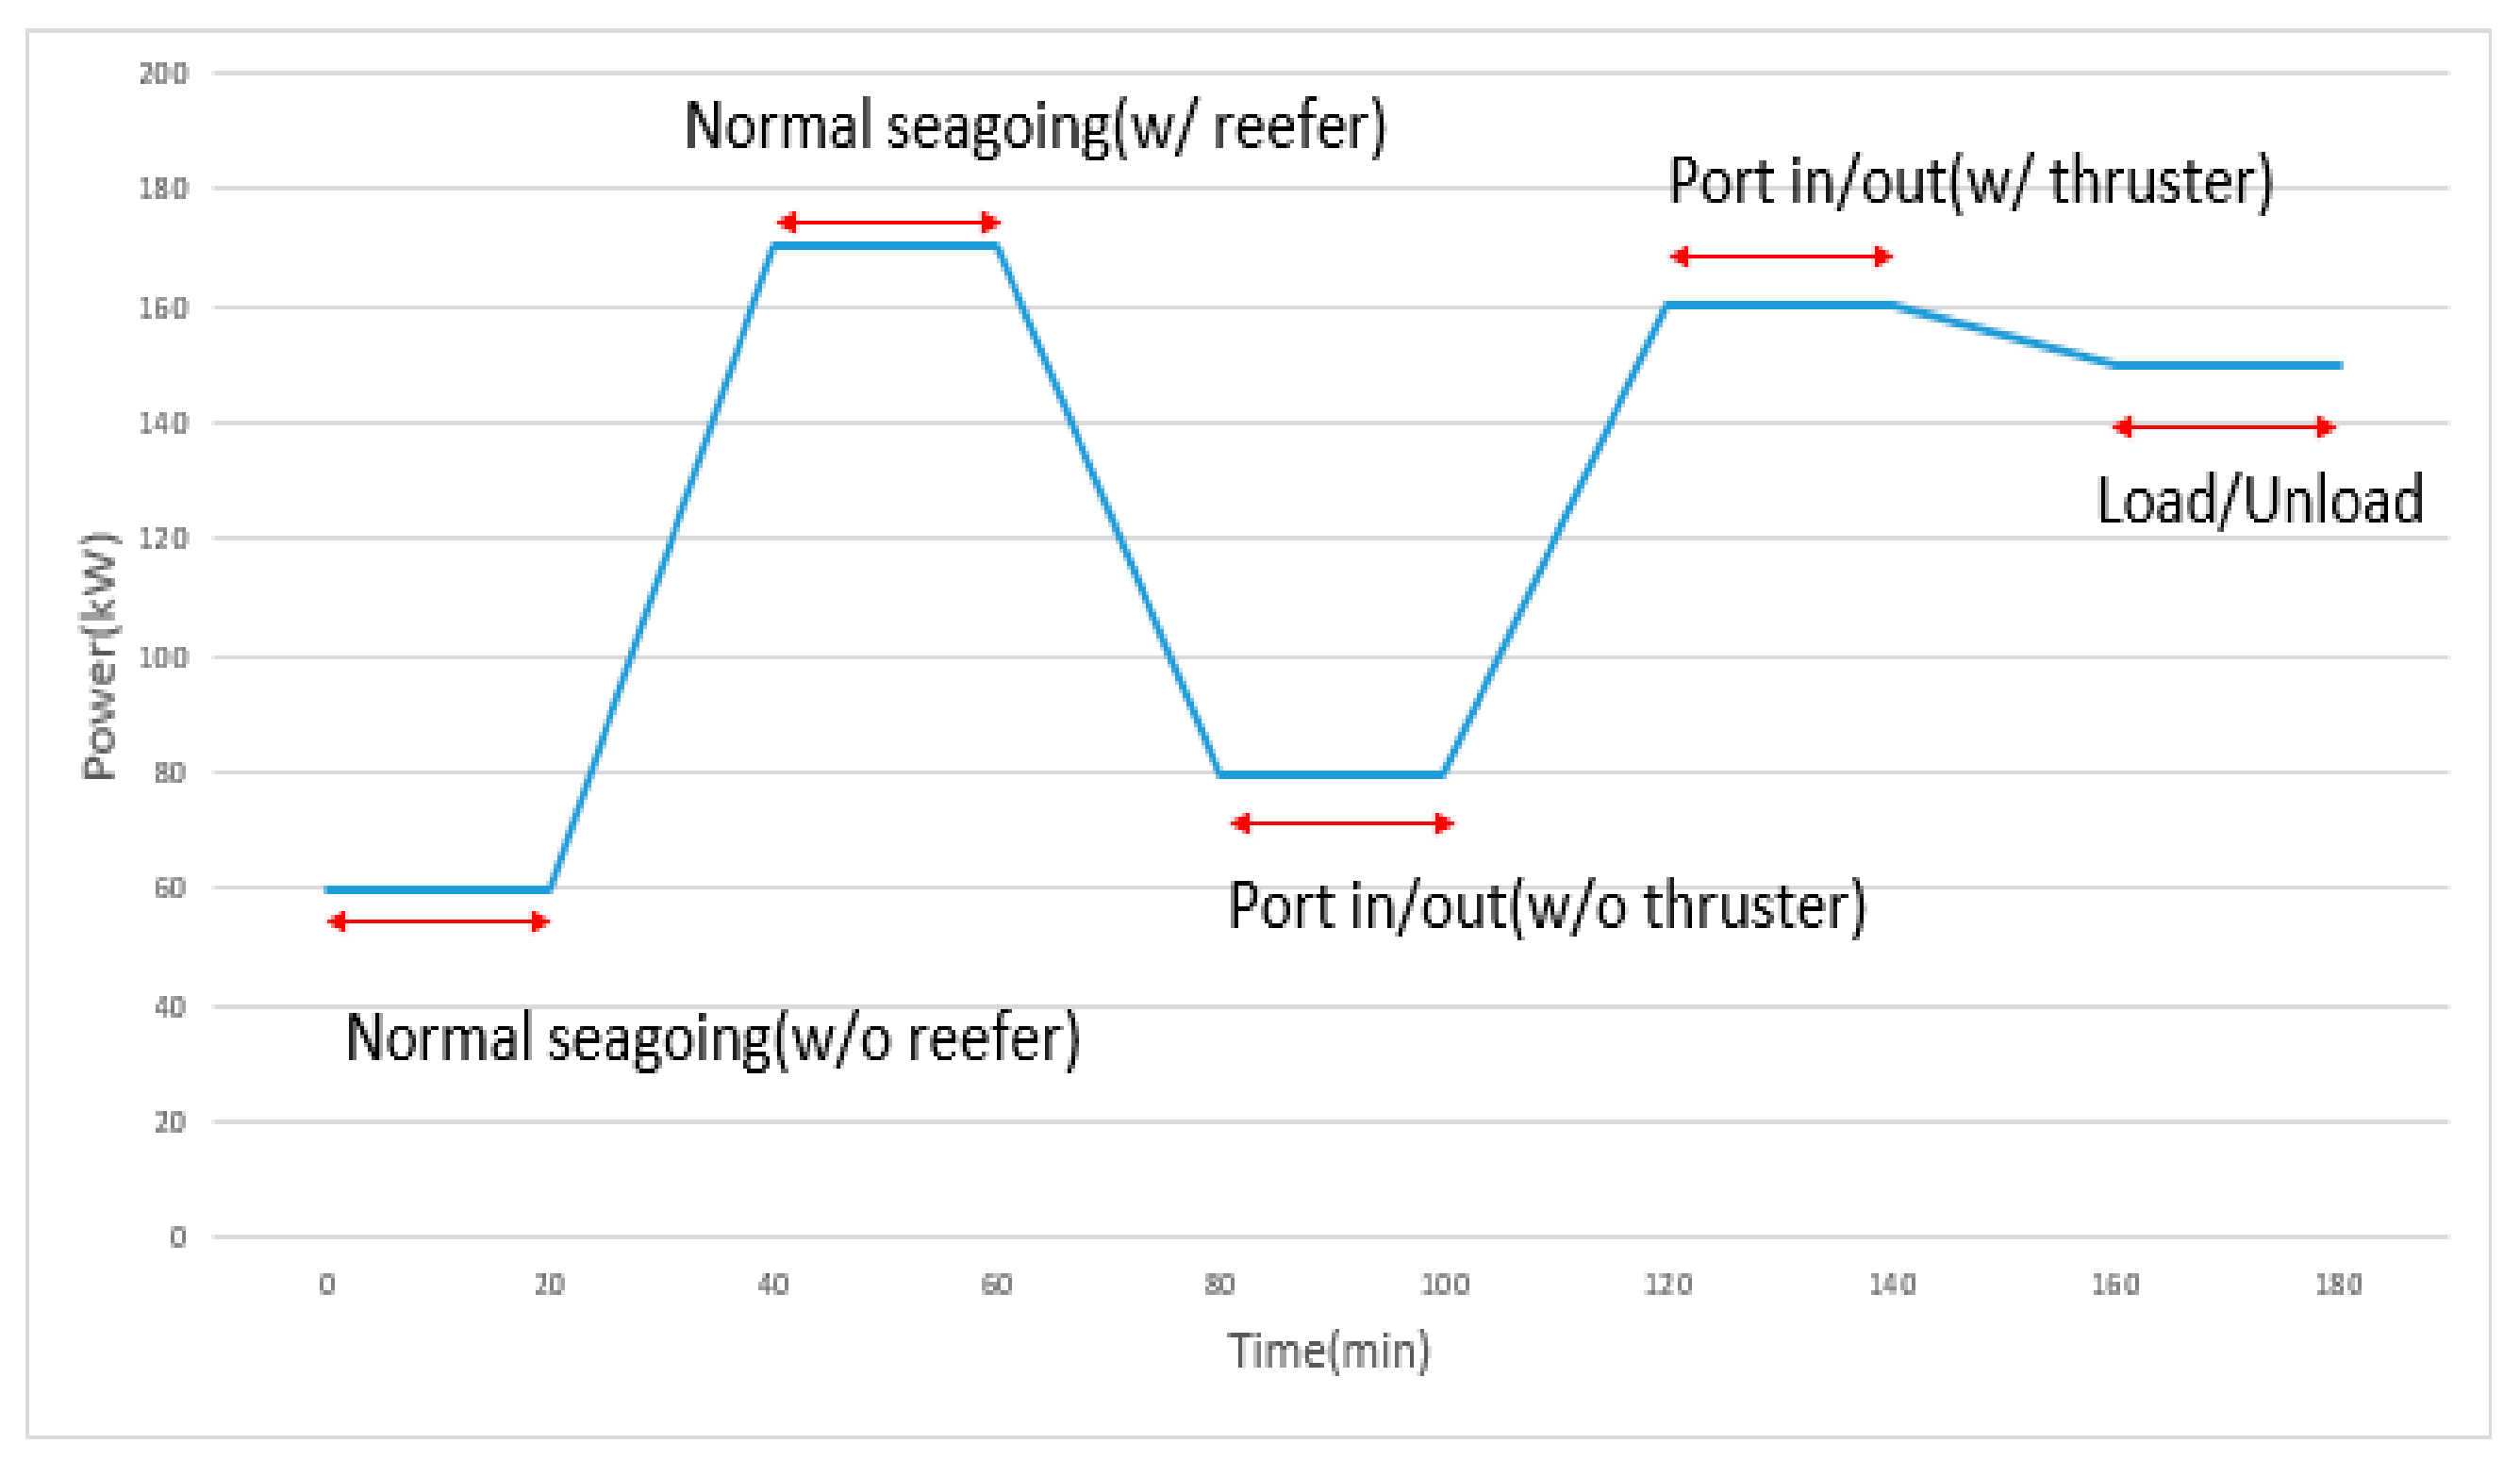
Figure 9.
Power consumption of 5500 TEU reefer container during different operation modes.
Figure 9.
Power consumption of 5500 TEU reefer container during different operation modes.
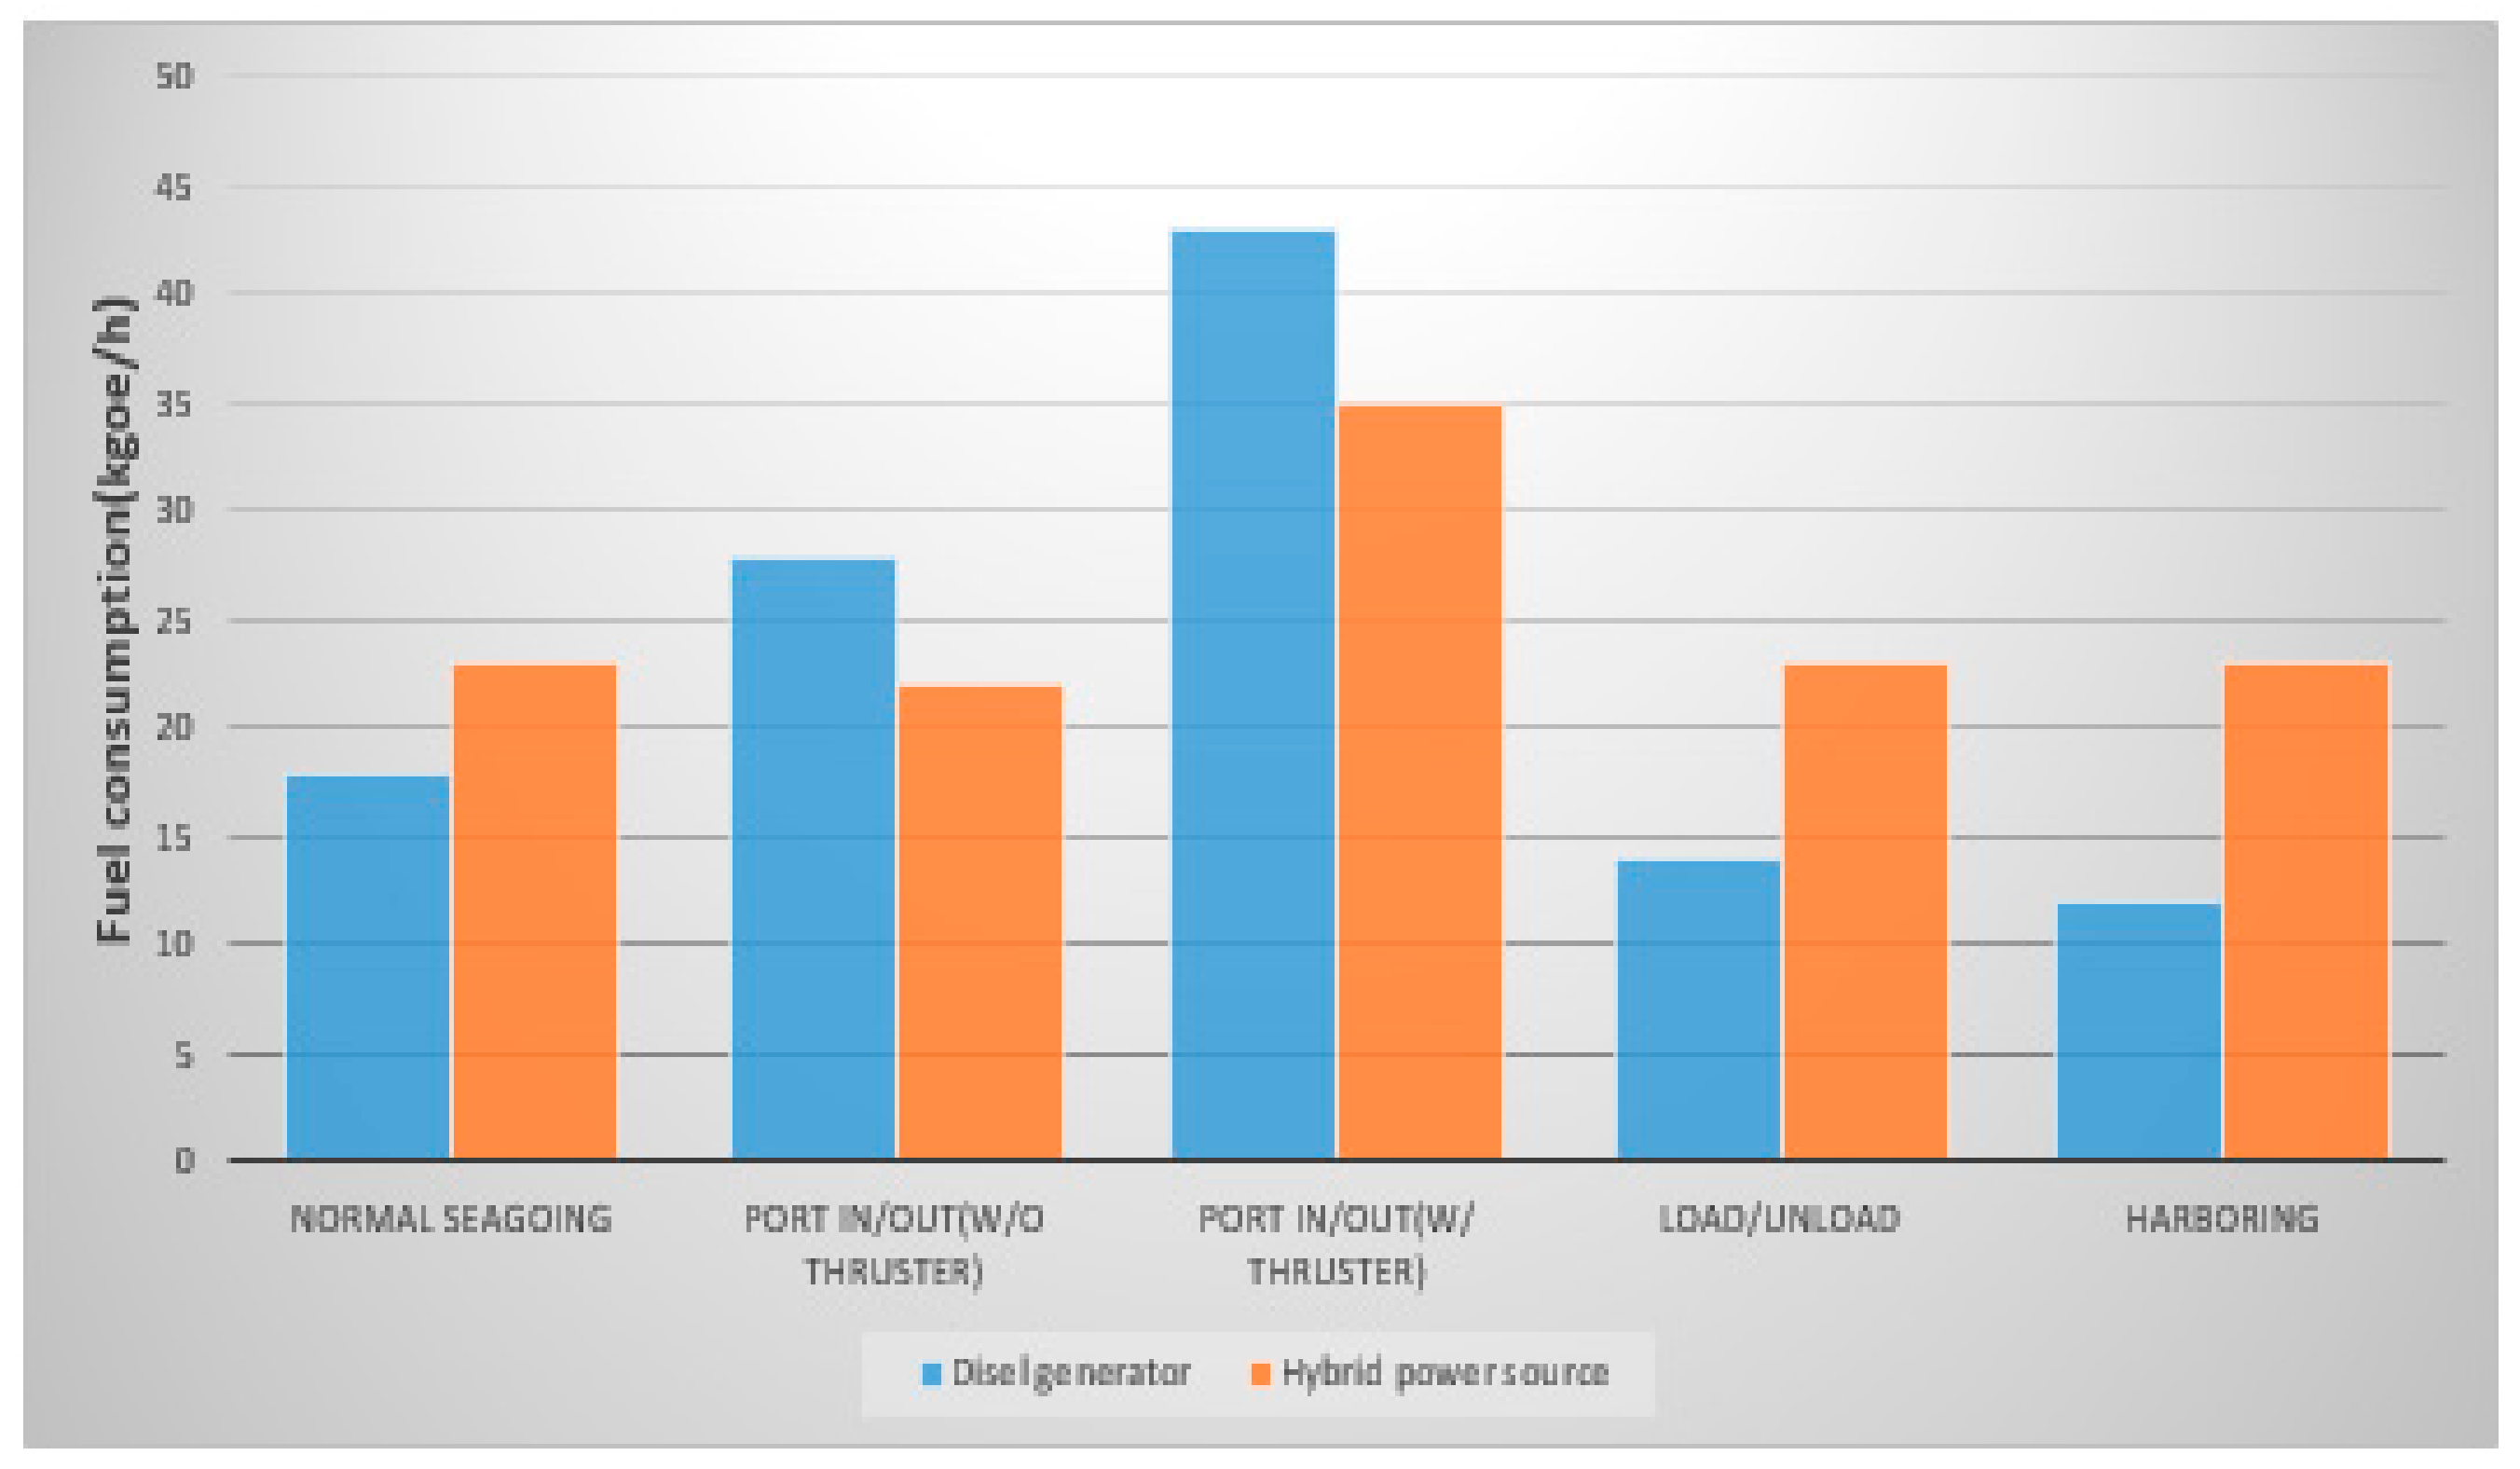
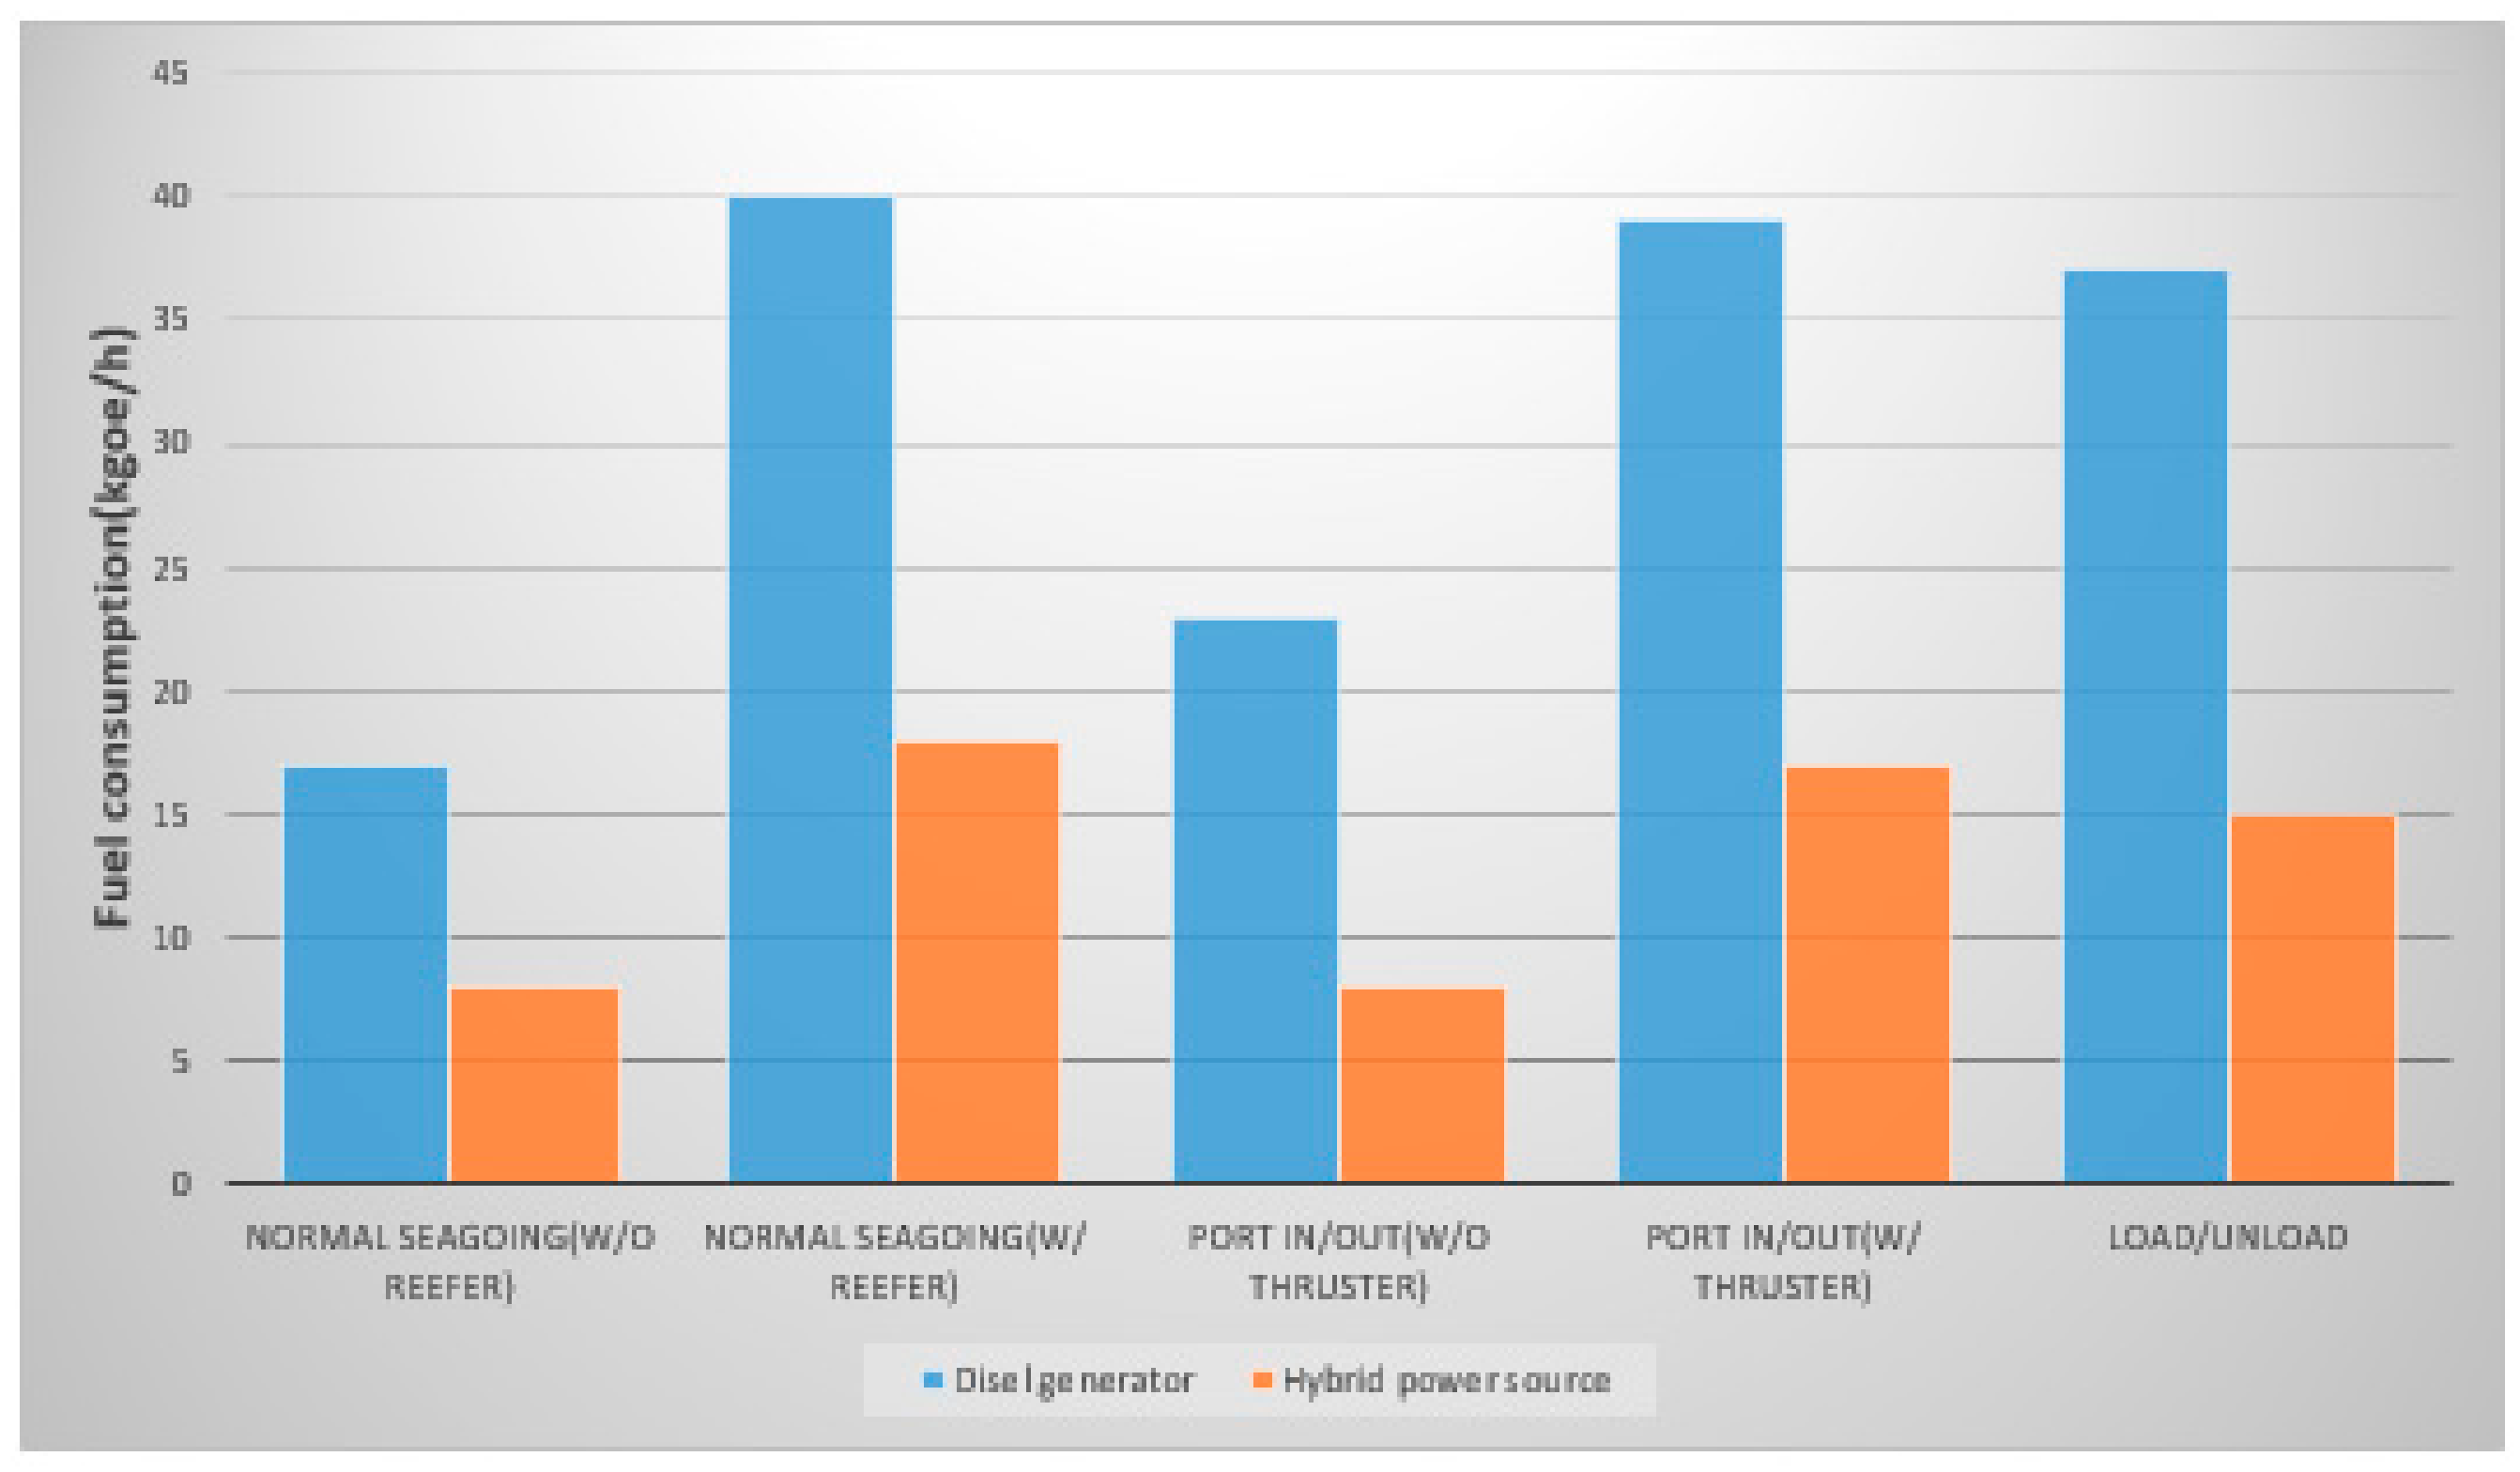
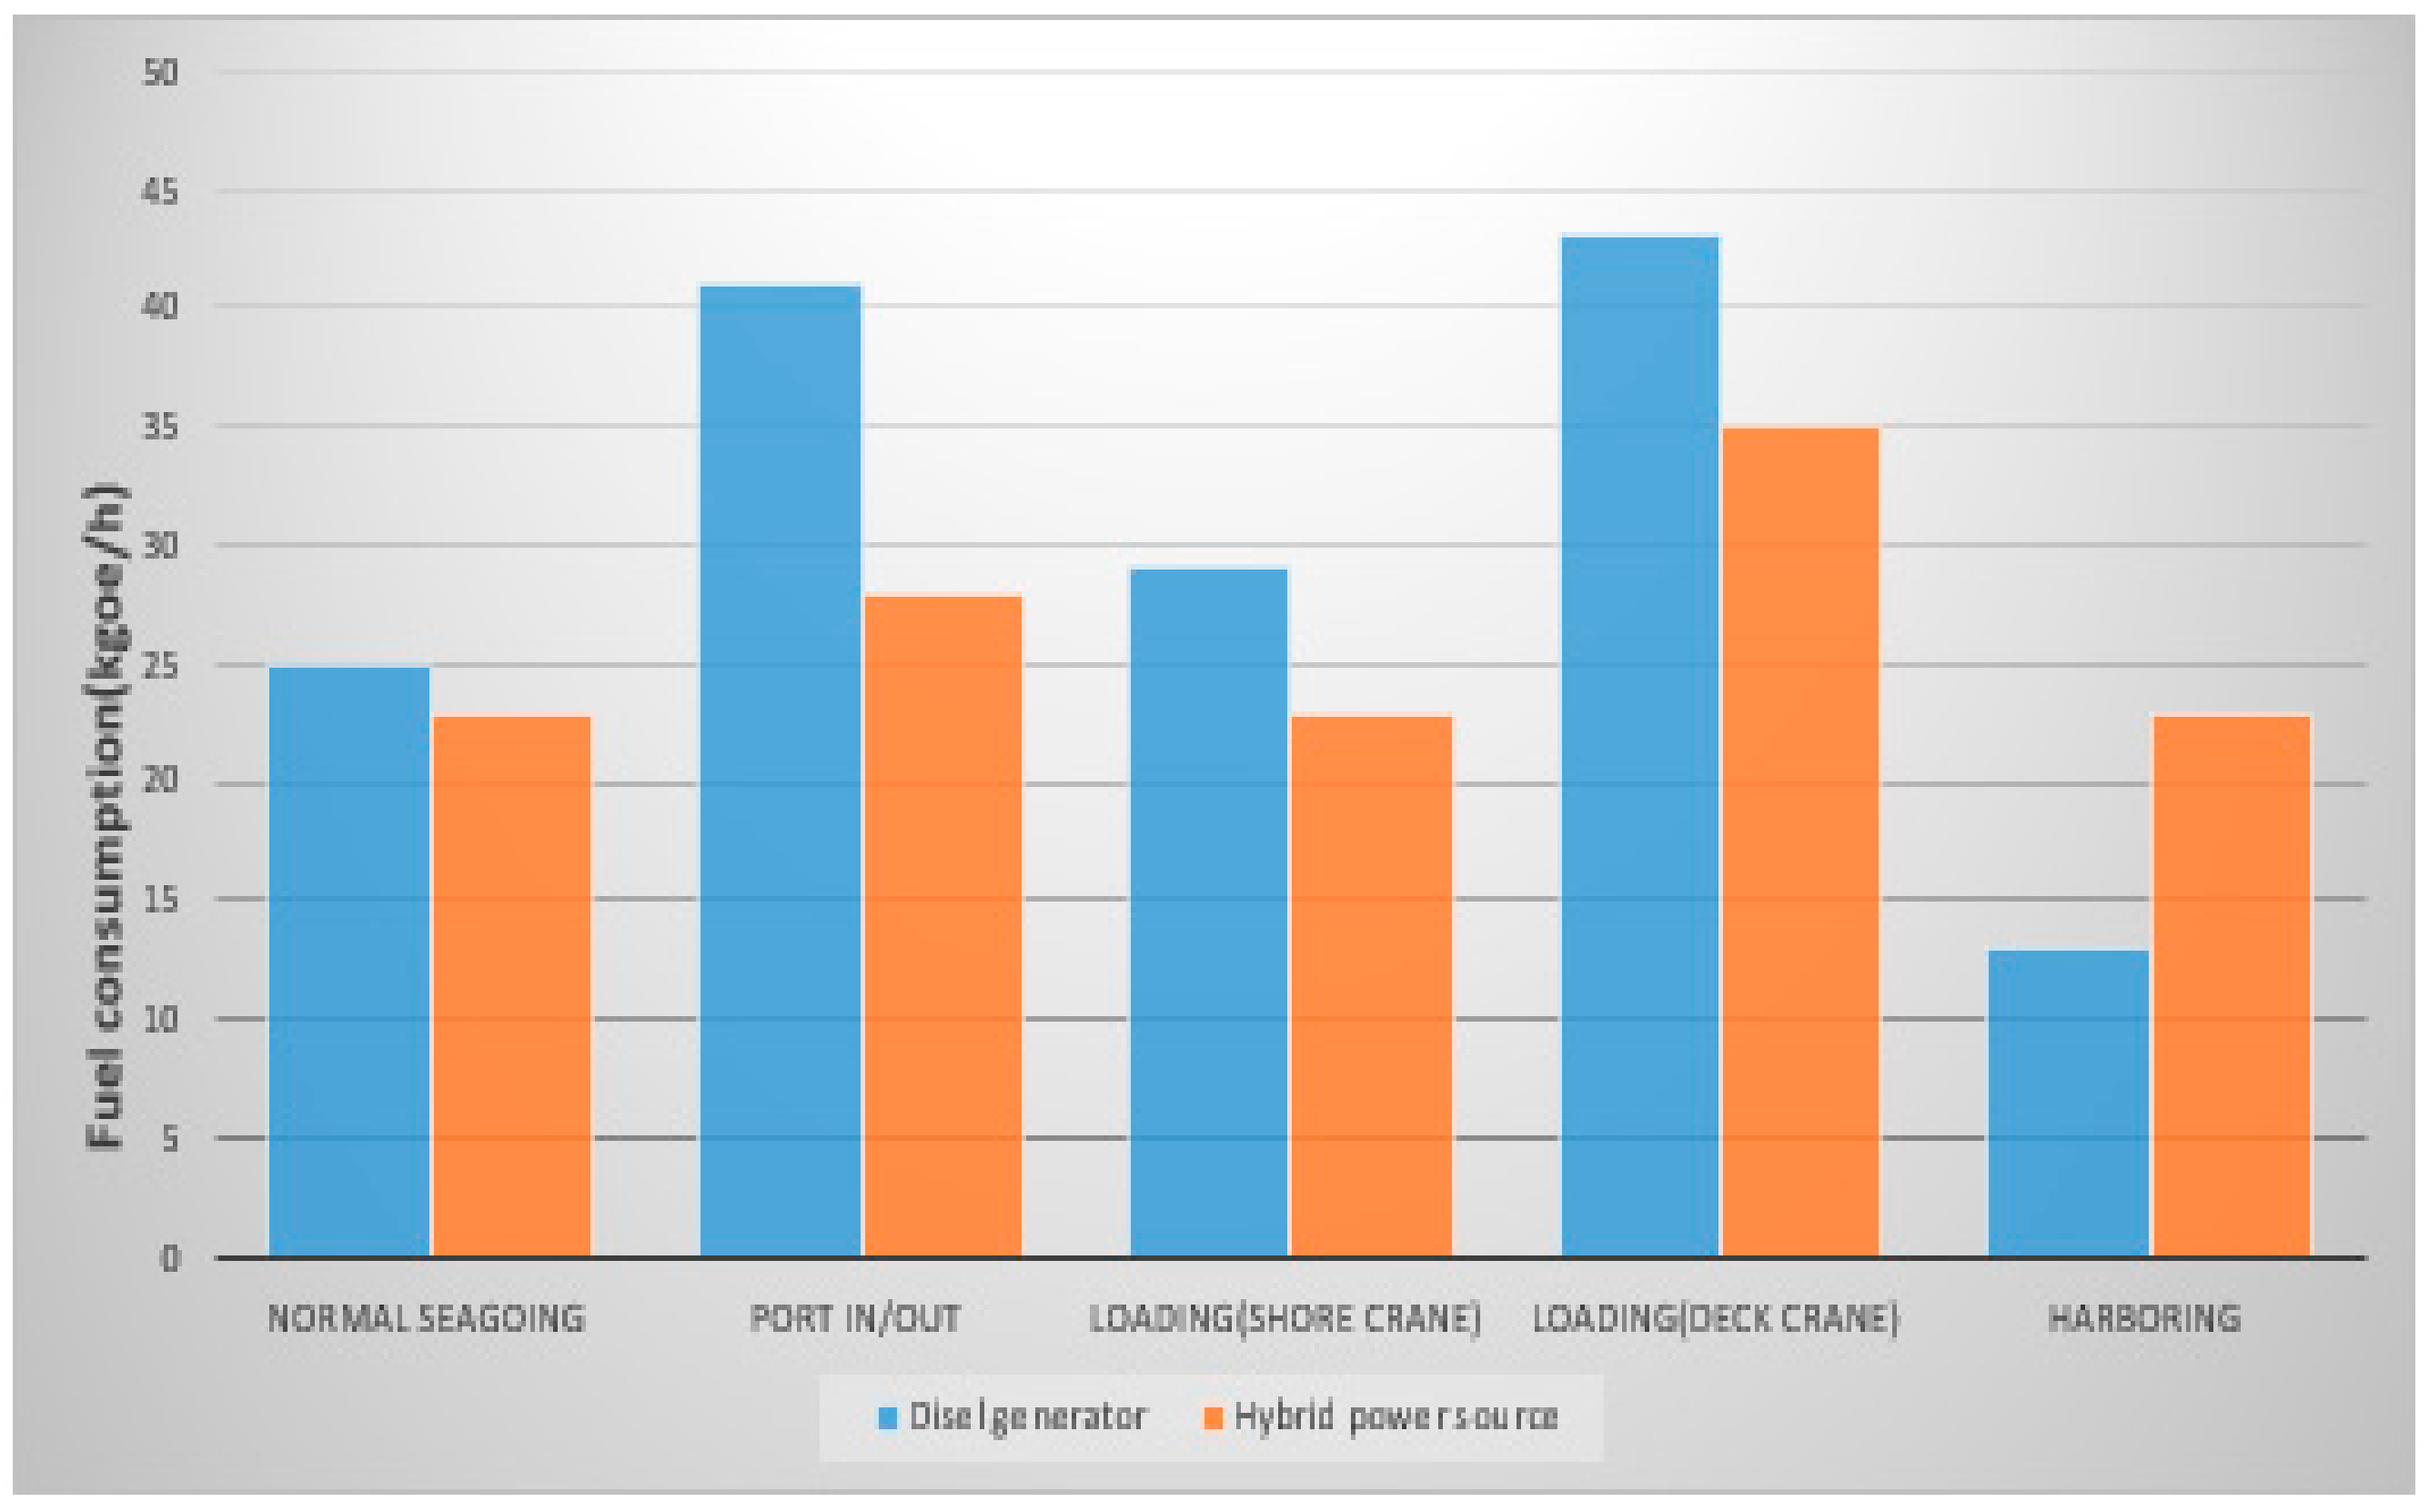
Figure 10.
Fuel consumption in each operating mode of the 5500 TEU reefer container.
Figure 10.
Fuel consumption in each operating mode of the 5500 TEU reefer container.
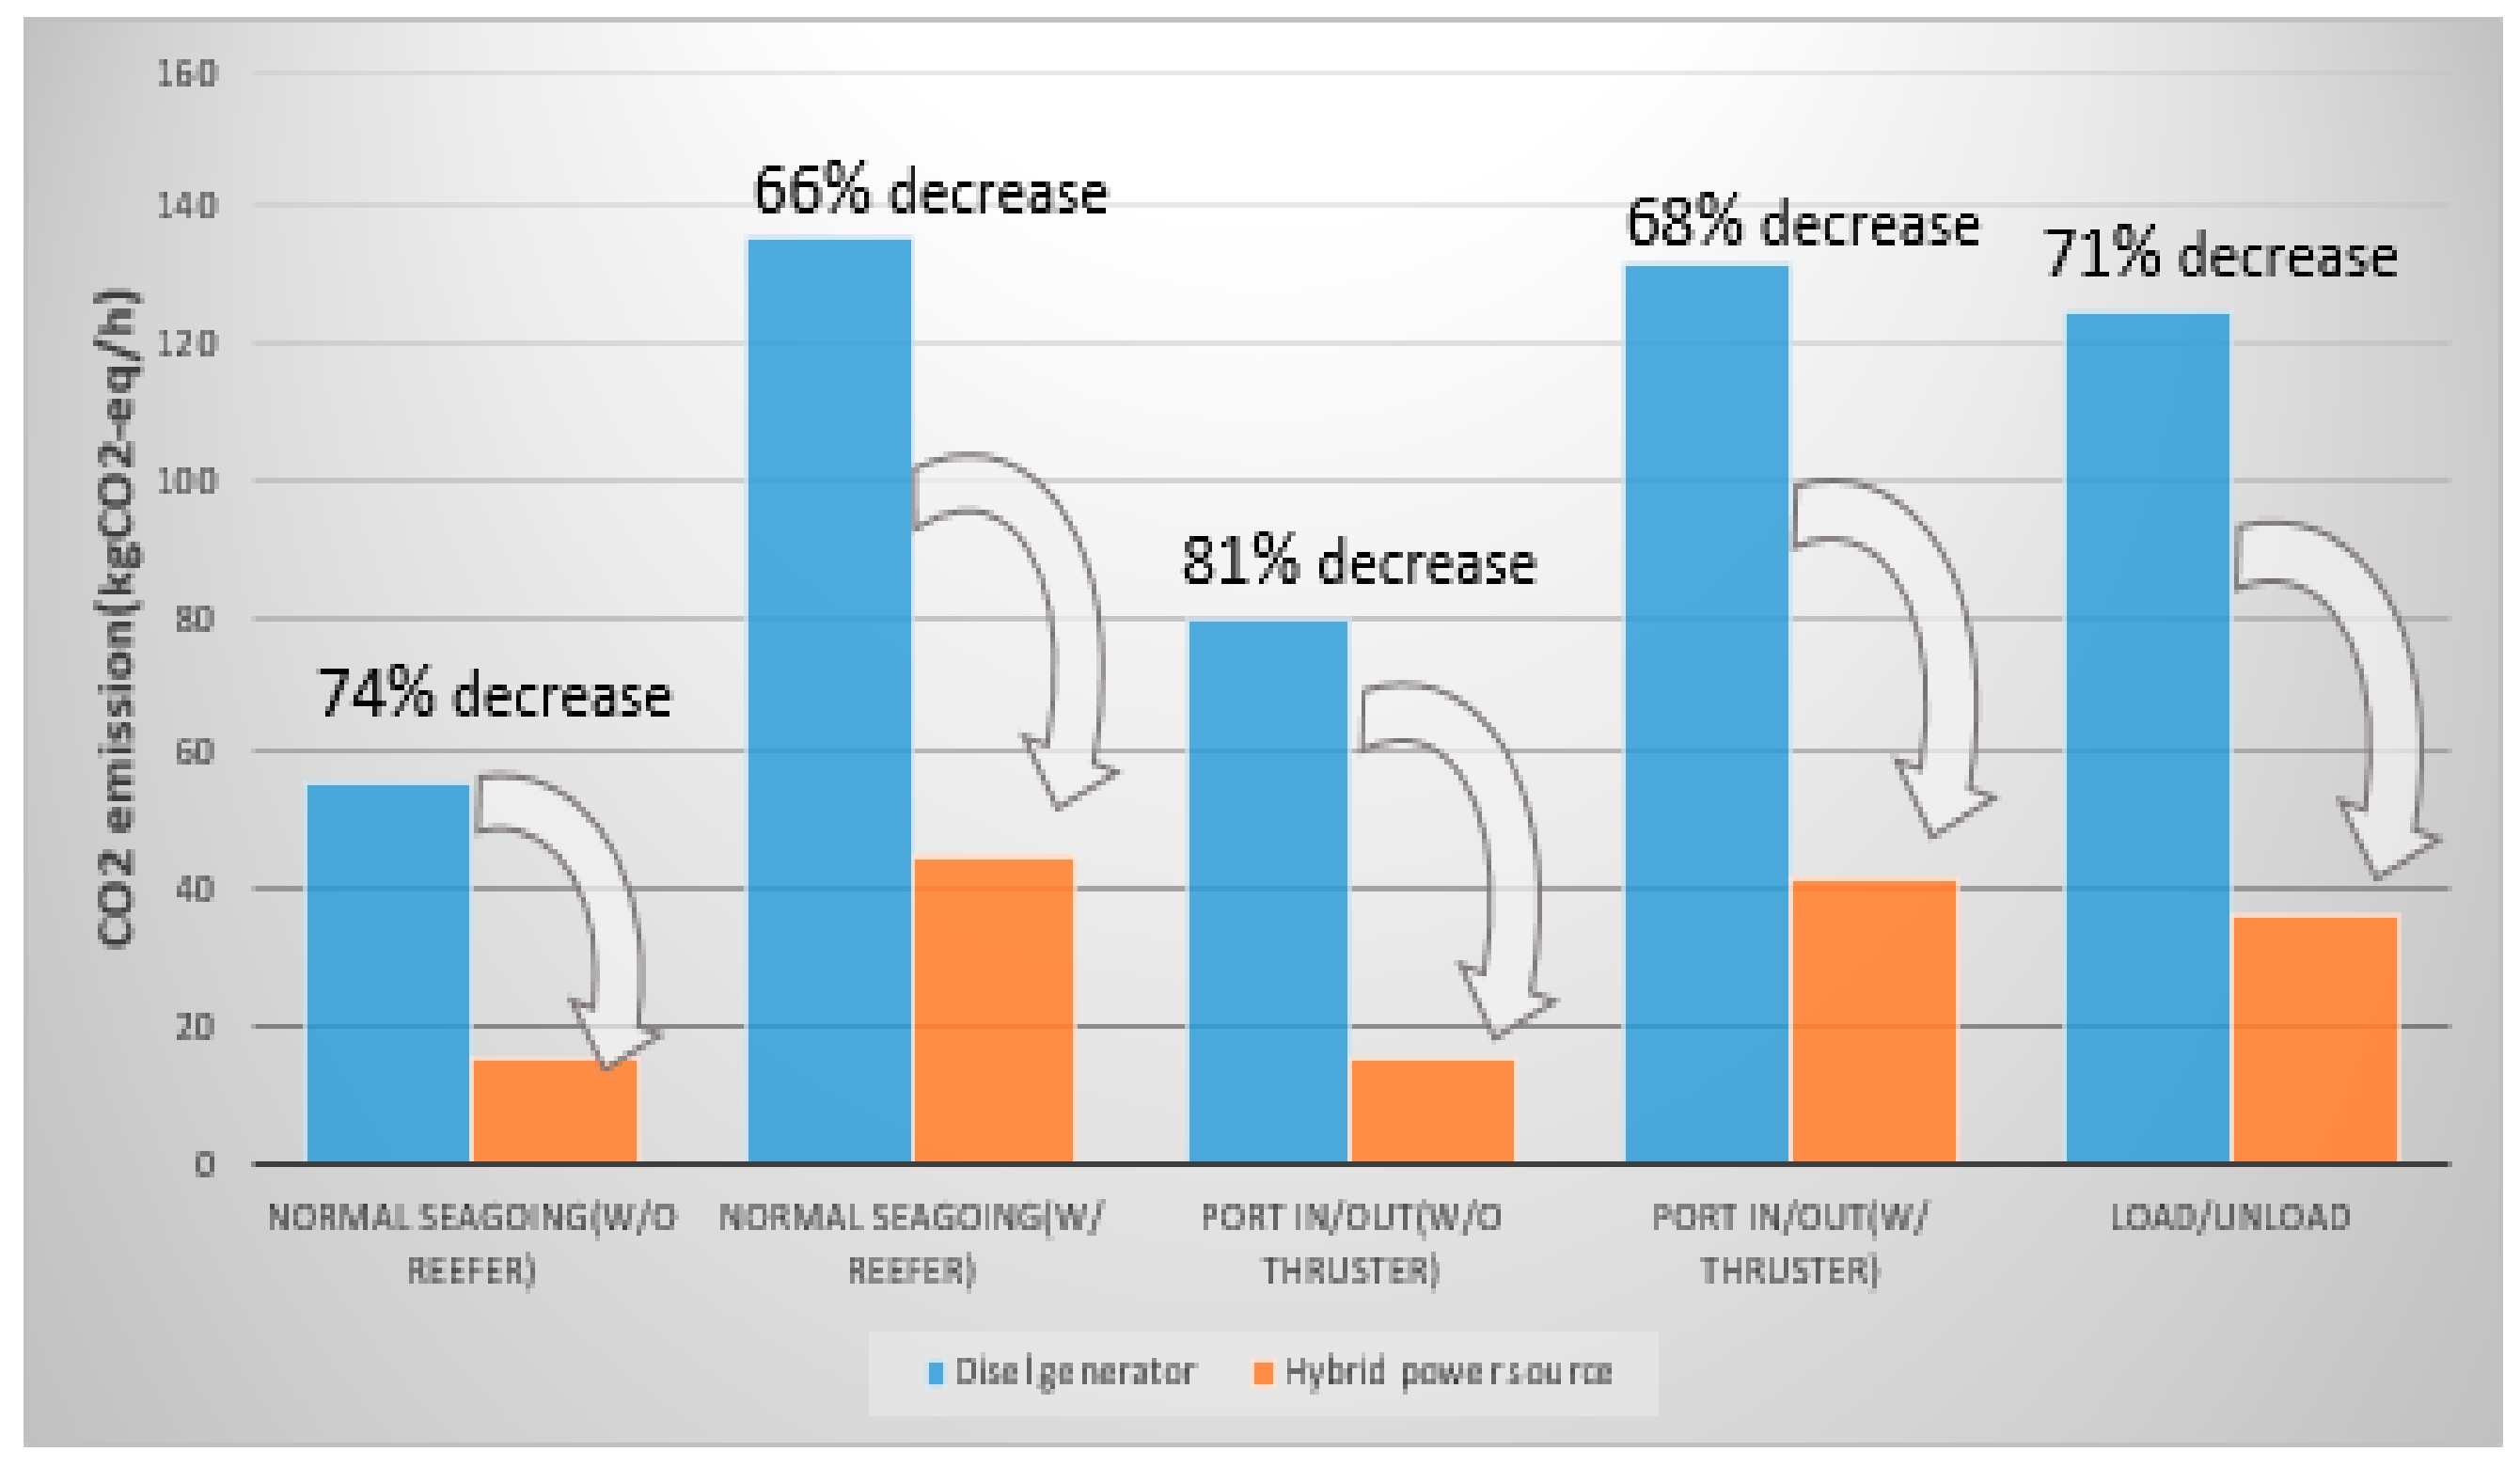
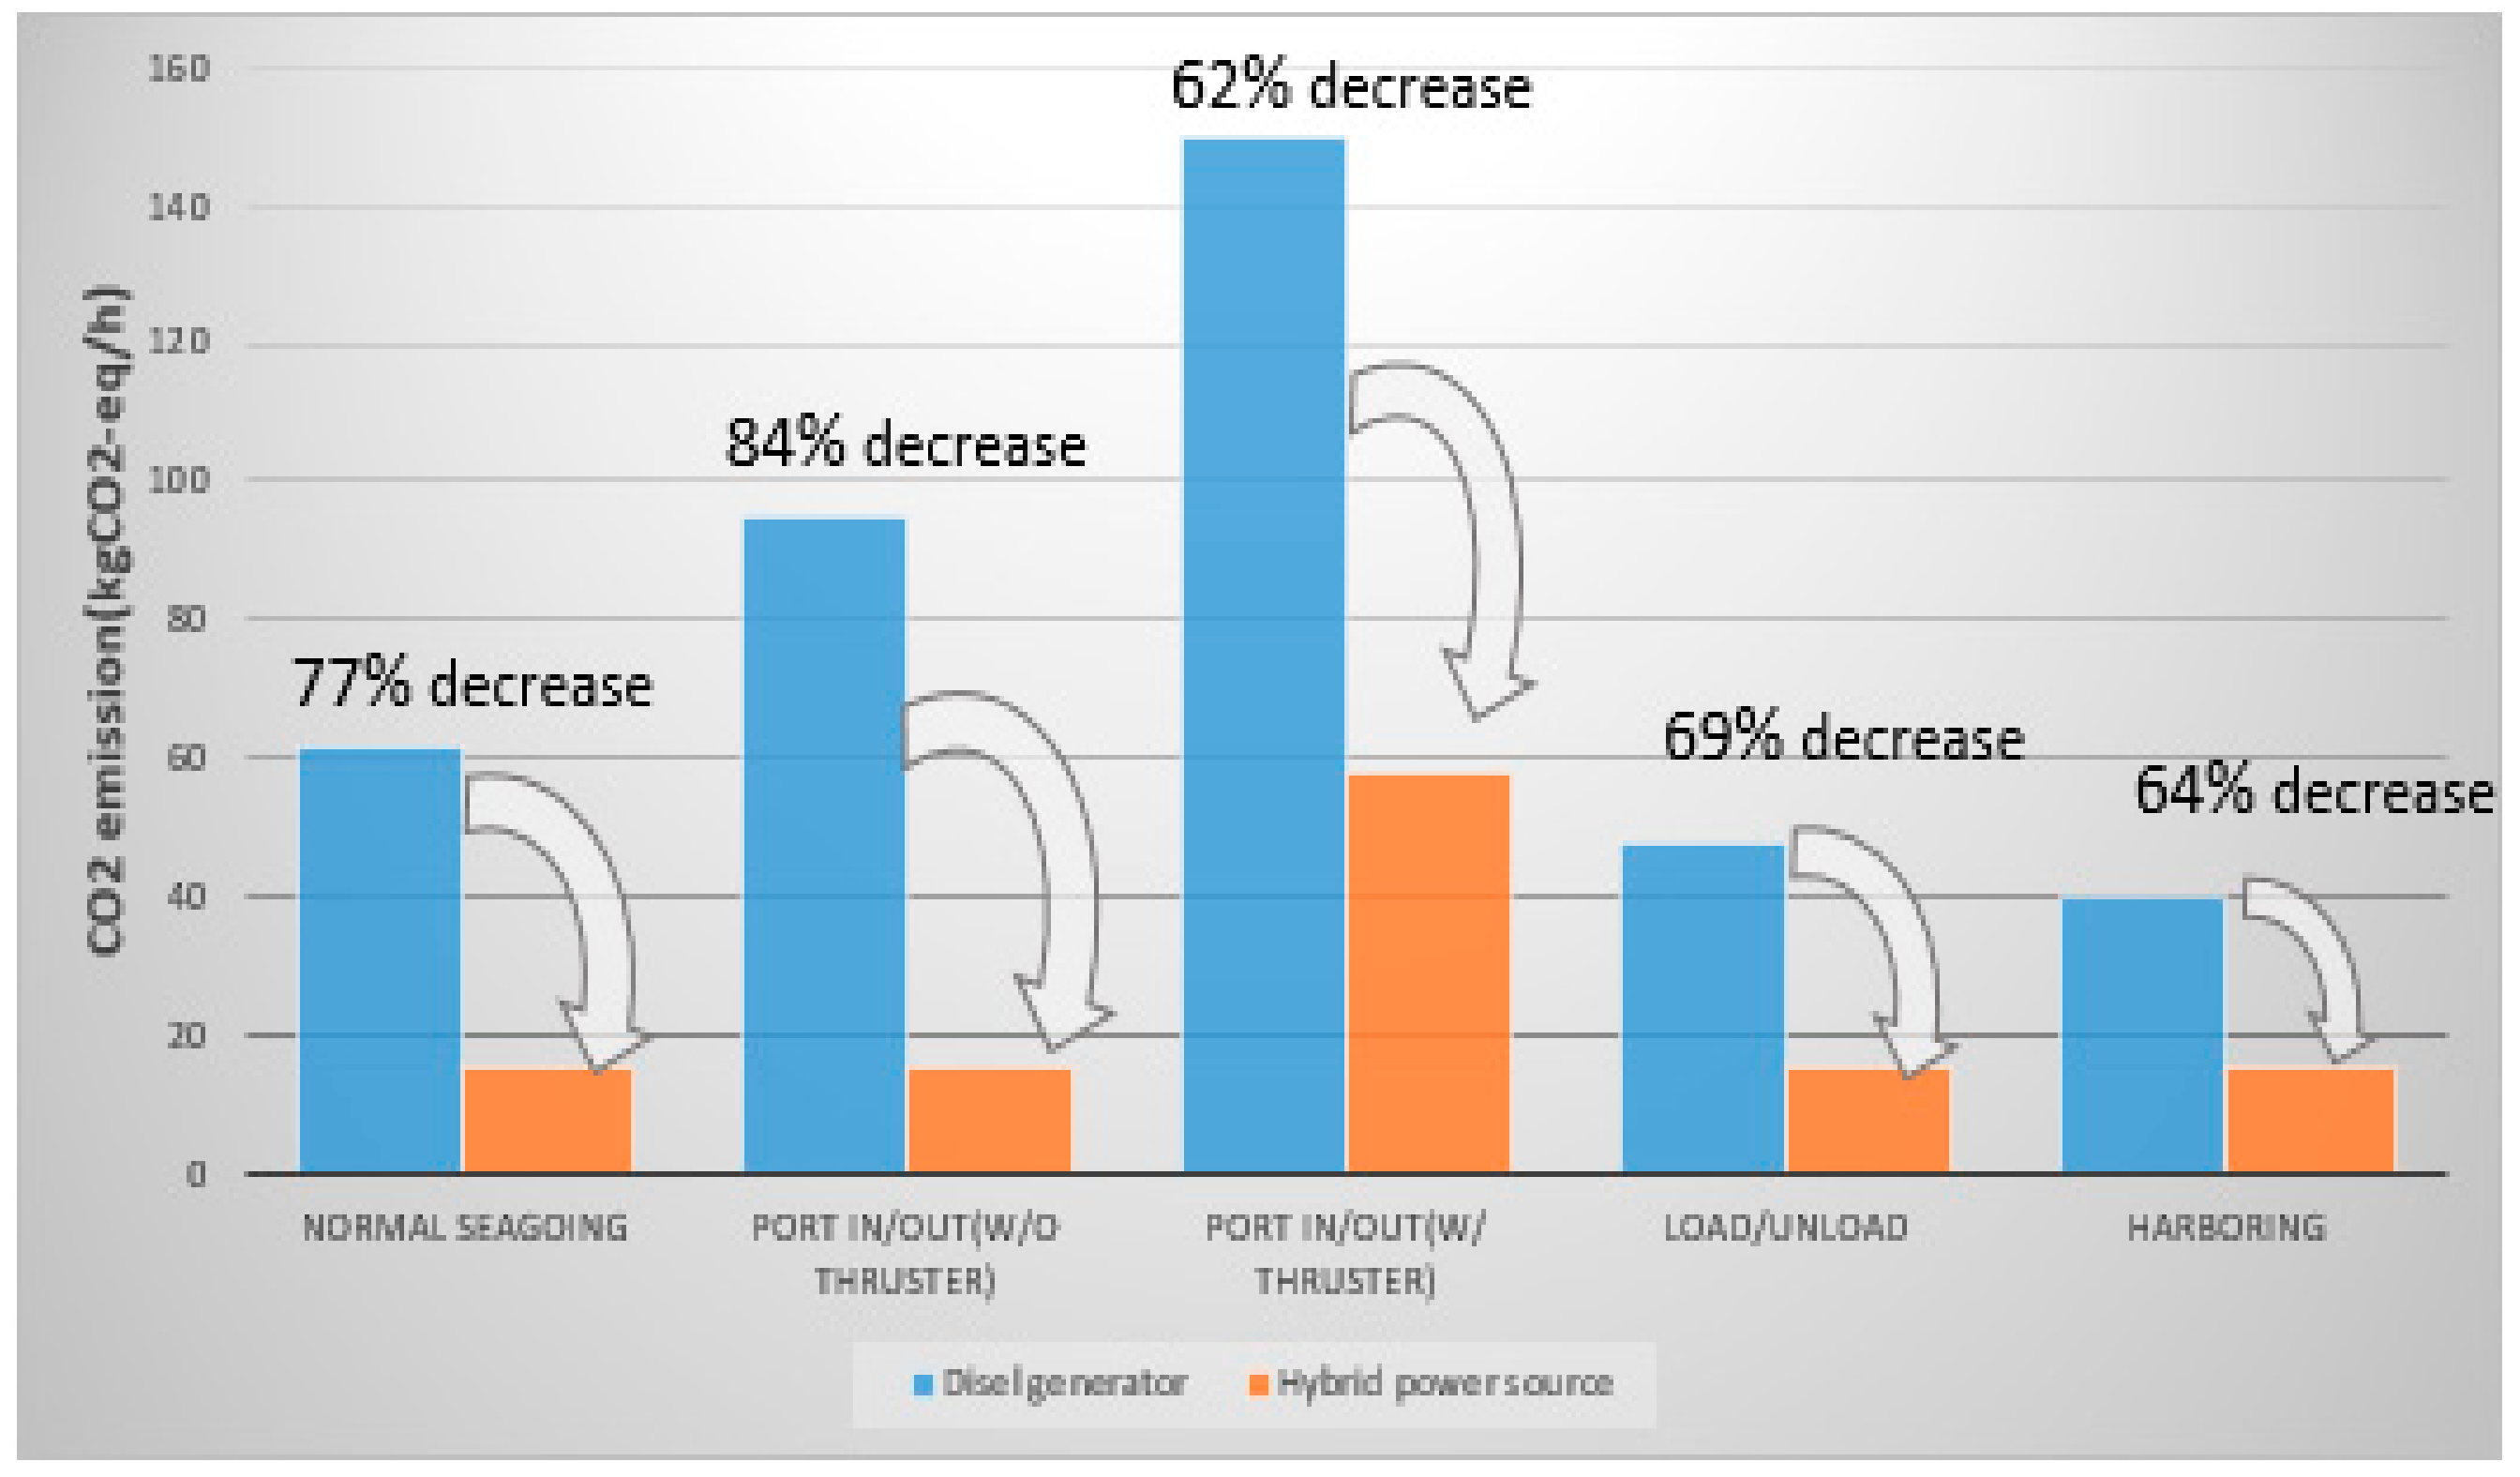
Figure 11.
Comparison of CO2 emissions and CO2 emission reduction rate in each operating mode of the 5500 TEU reefer container.
Figure 11.
Comparison of CO2 emissions and CO2 emission reduction rate in each operating mode of the 5500 TEU reefer container.
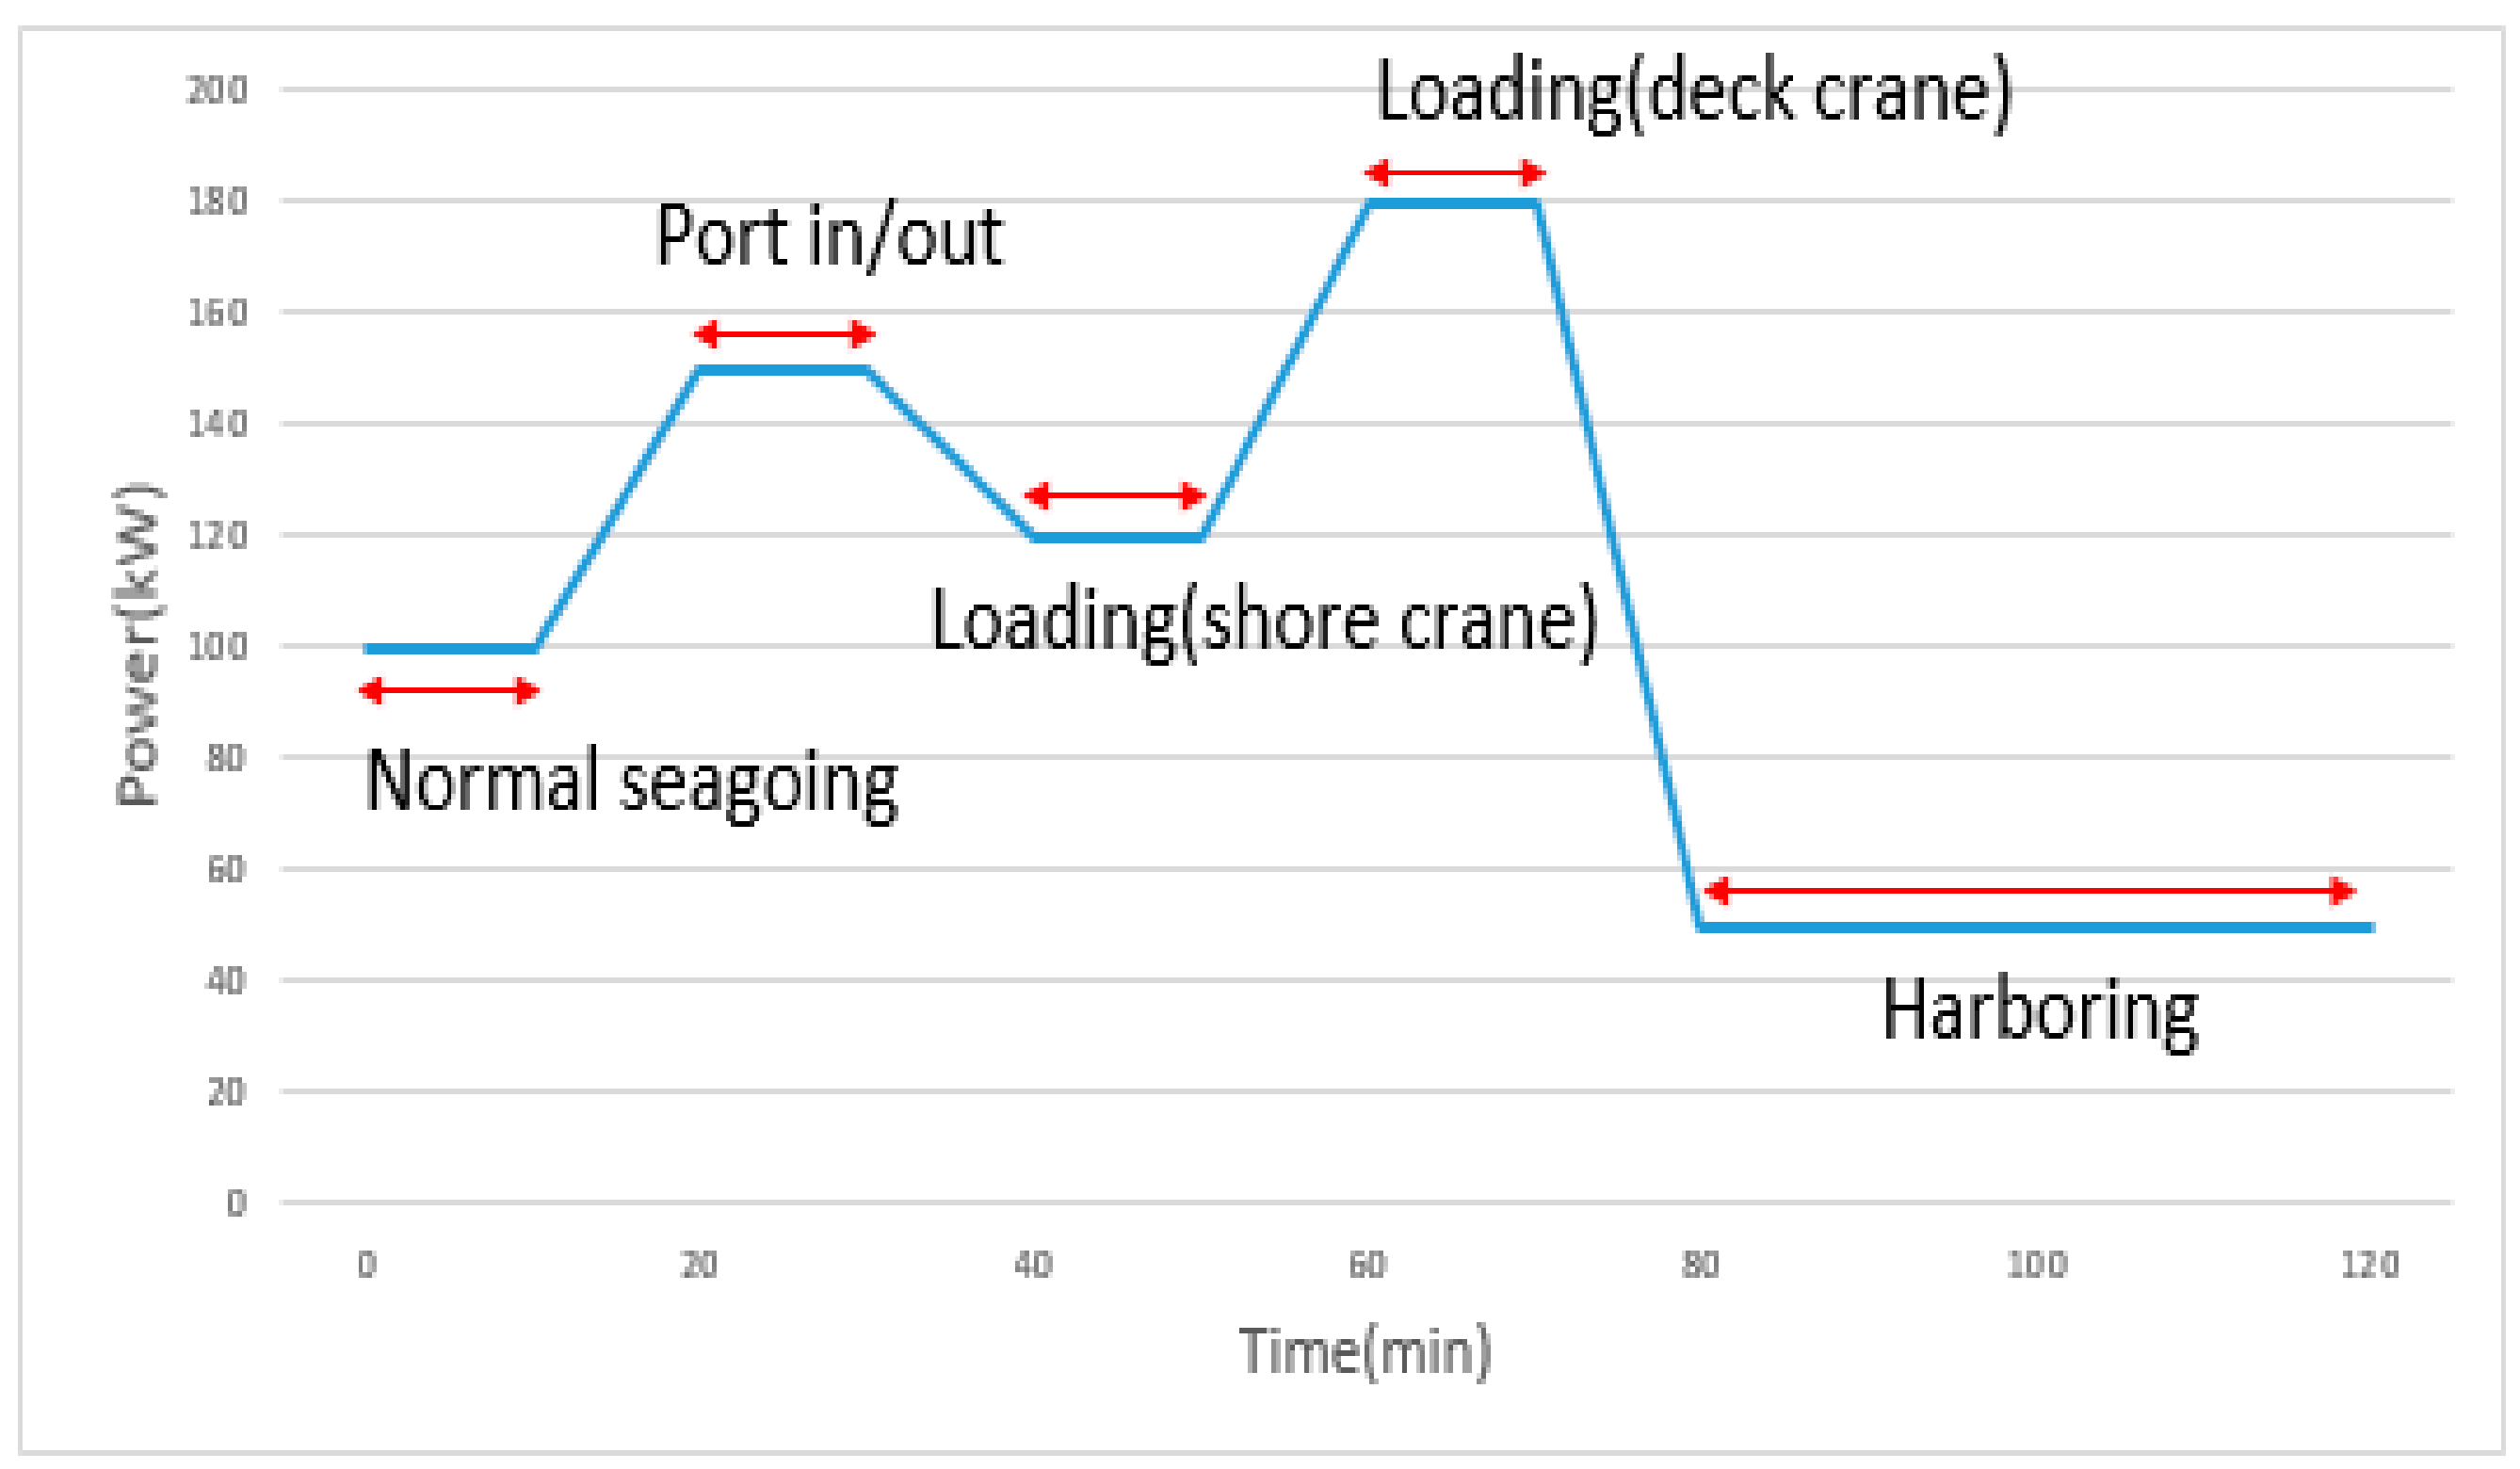
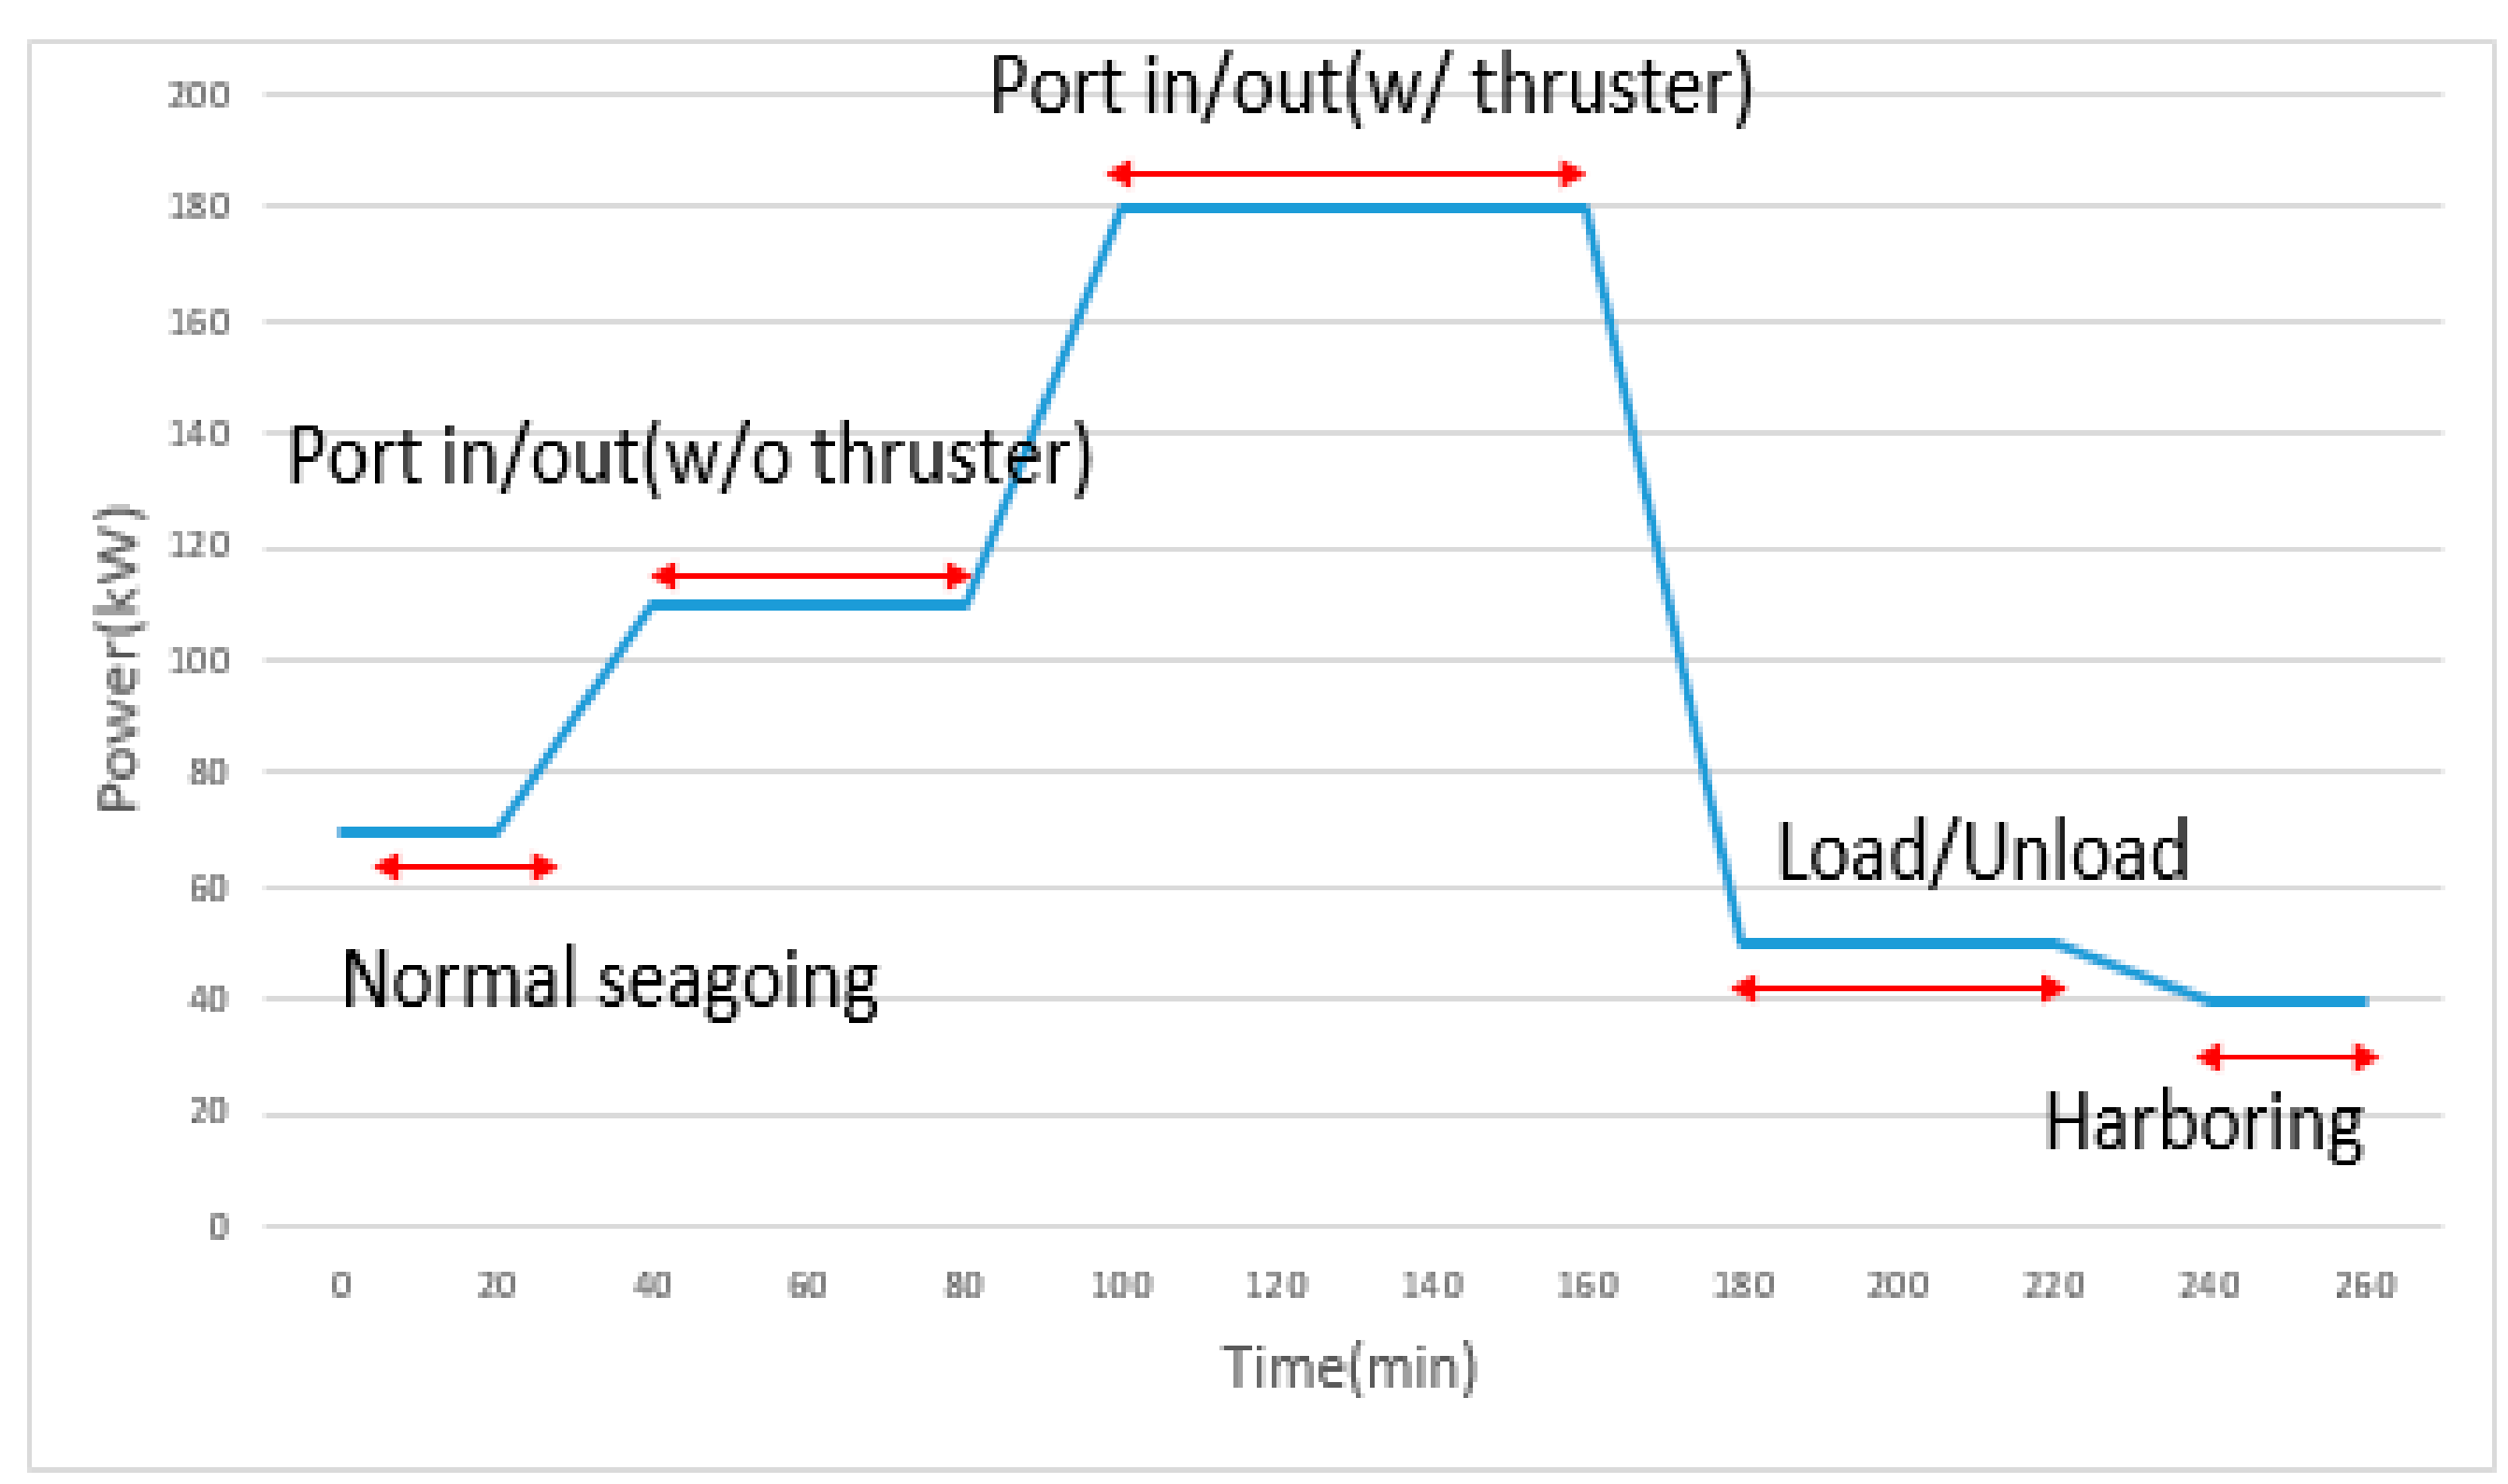
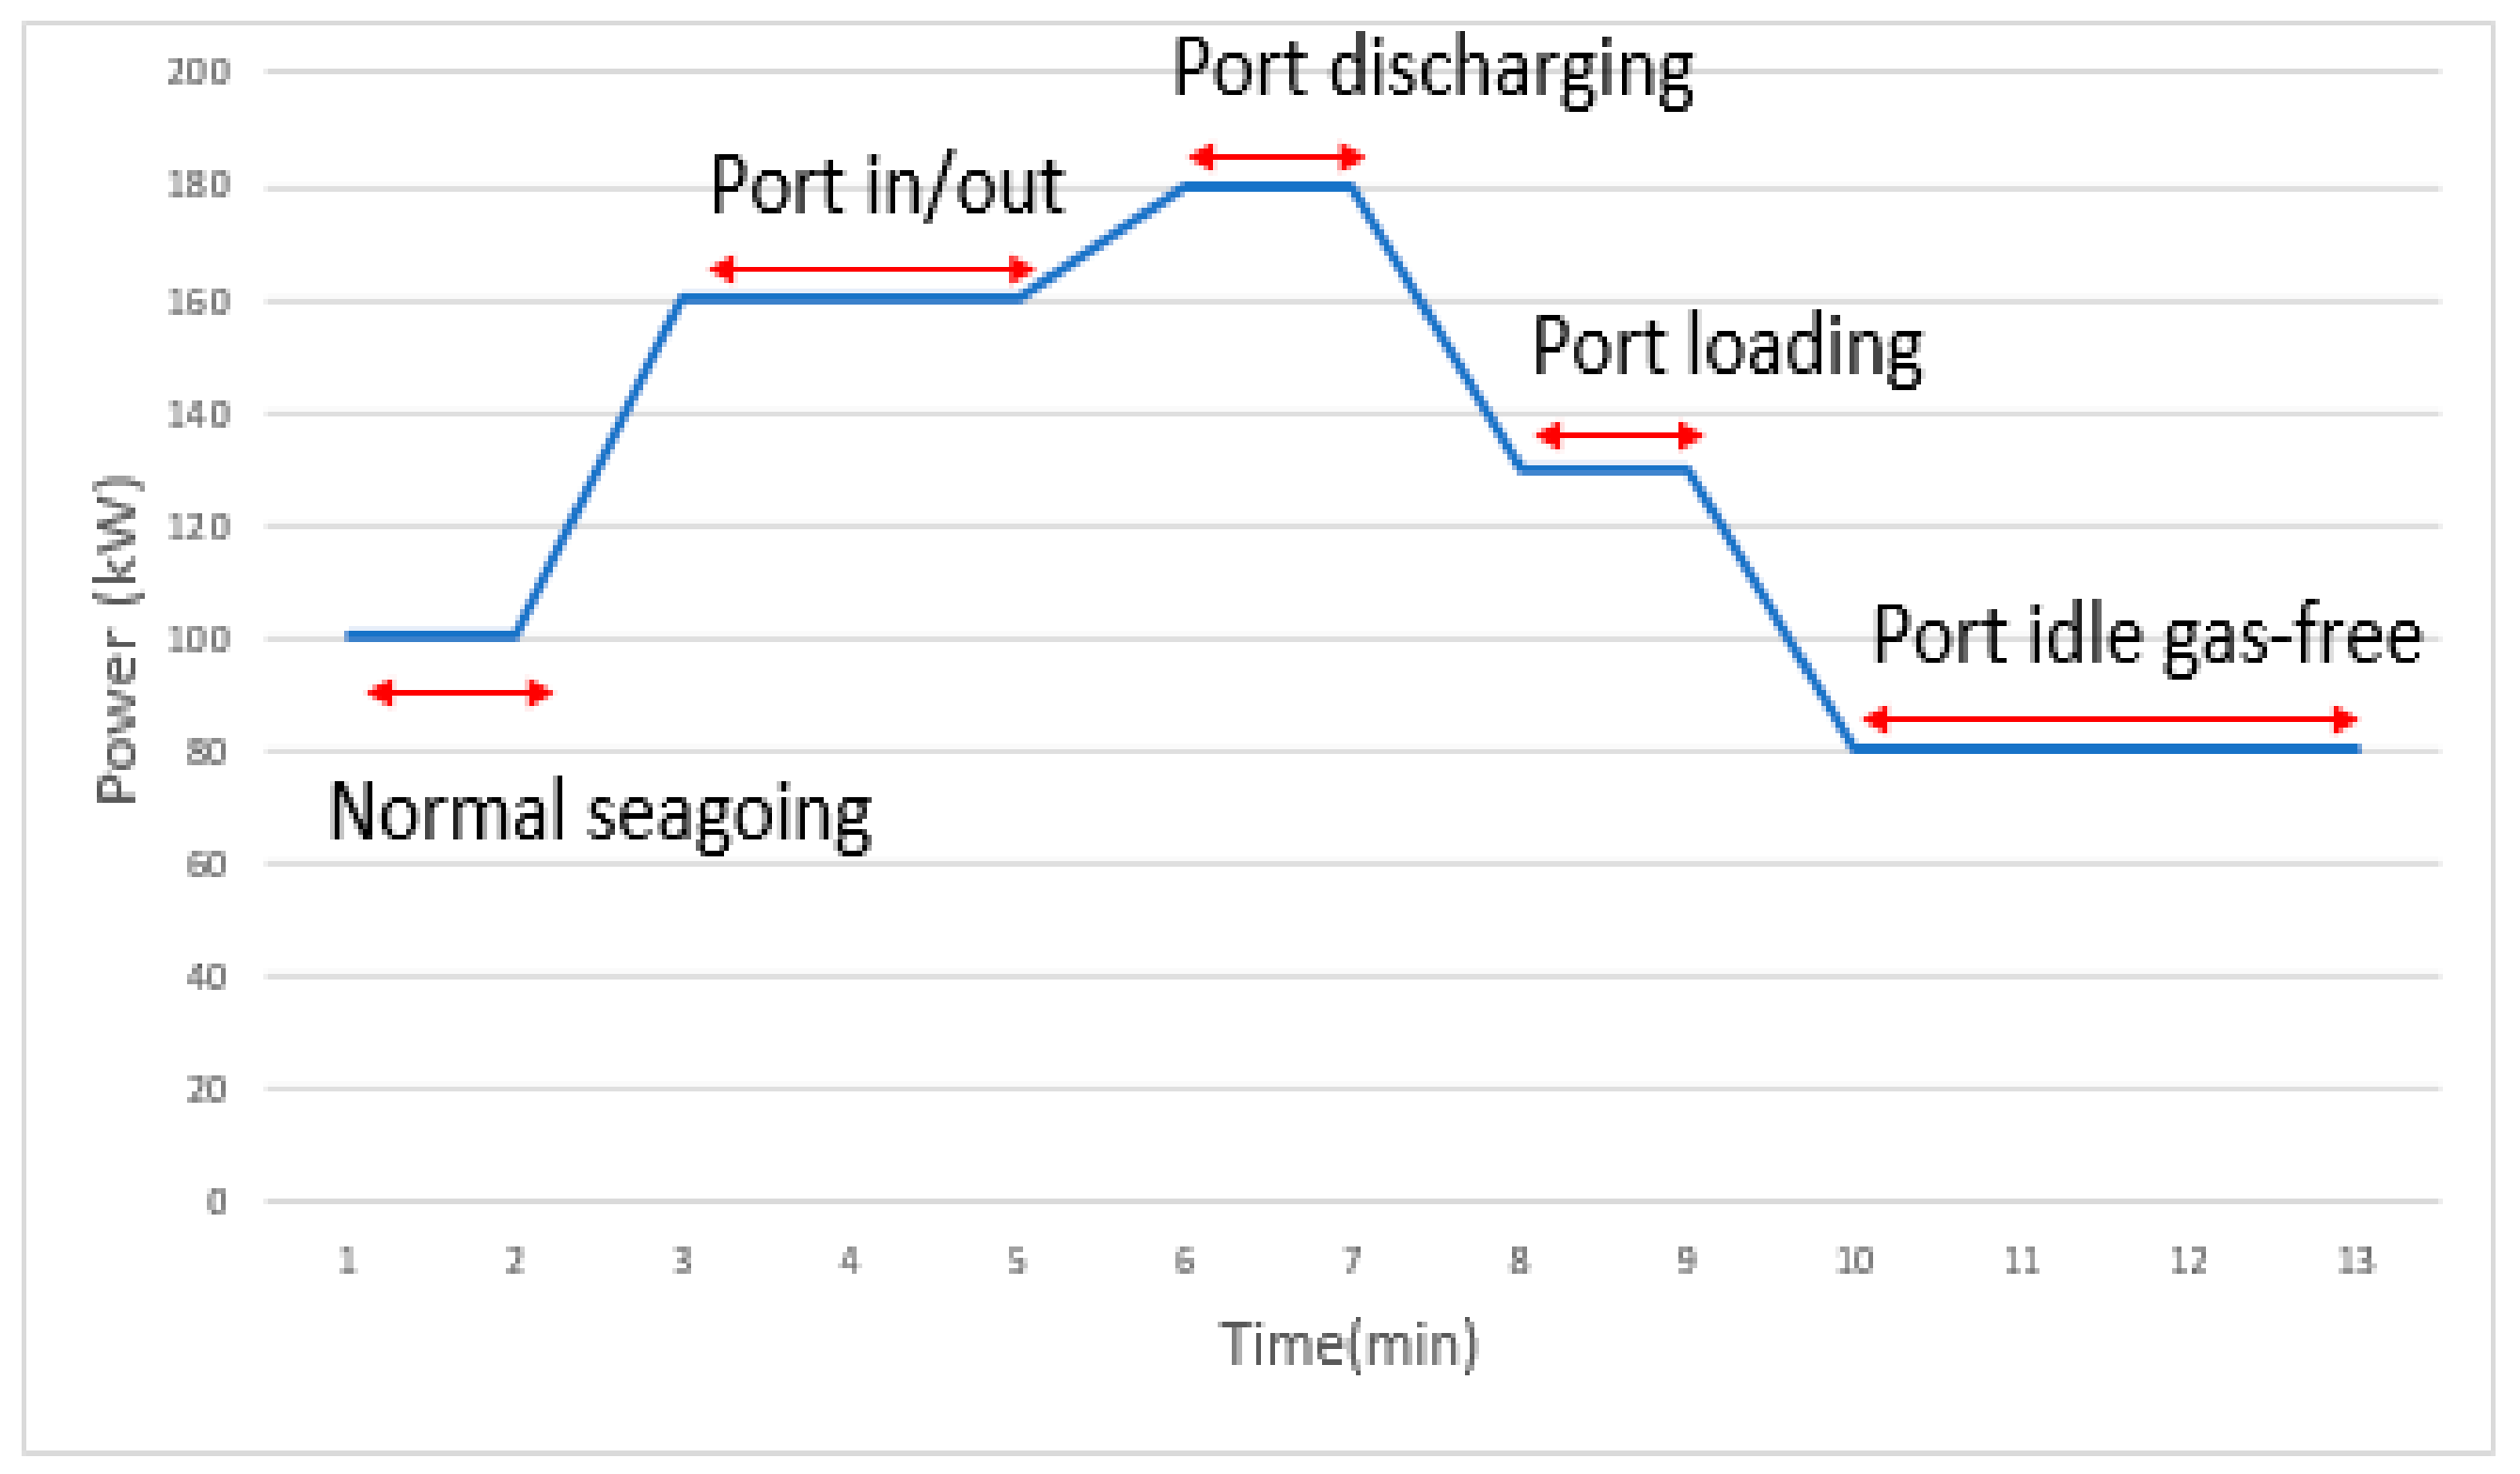
Figure 12.
Operating modes of the 13000 TEU container.
Figure 12.
Operating modes of the 13000 TEU container.
Figure 13.
Fuel consumption in each operating mode of the 13000 TEU container ship.
Figure 13.
Fuel consumption in each operating mode of the 13000 TEU container ship.
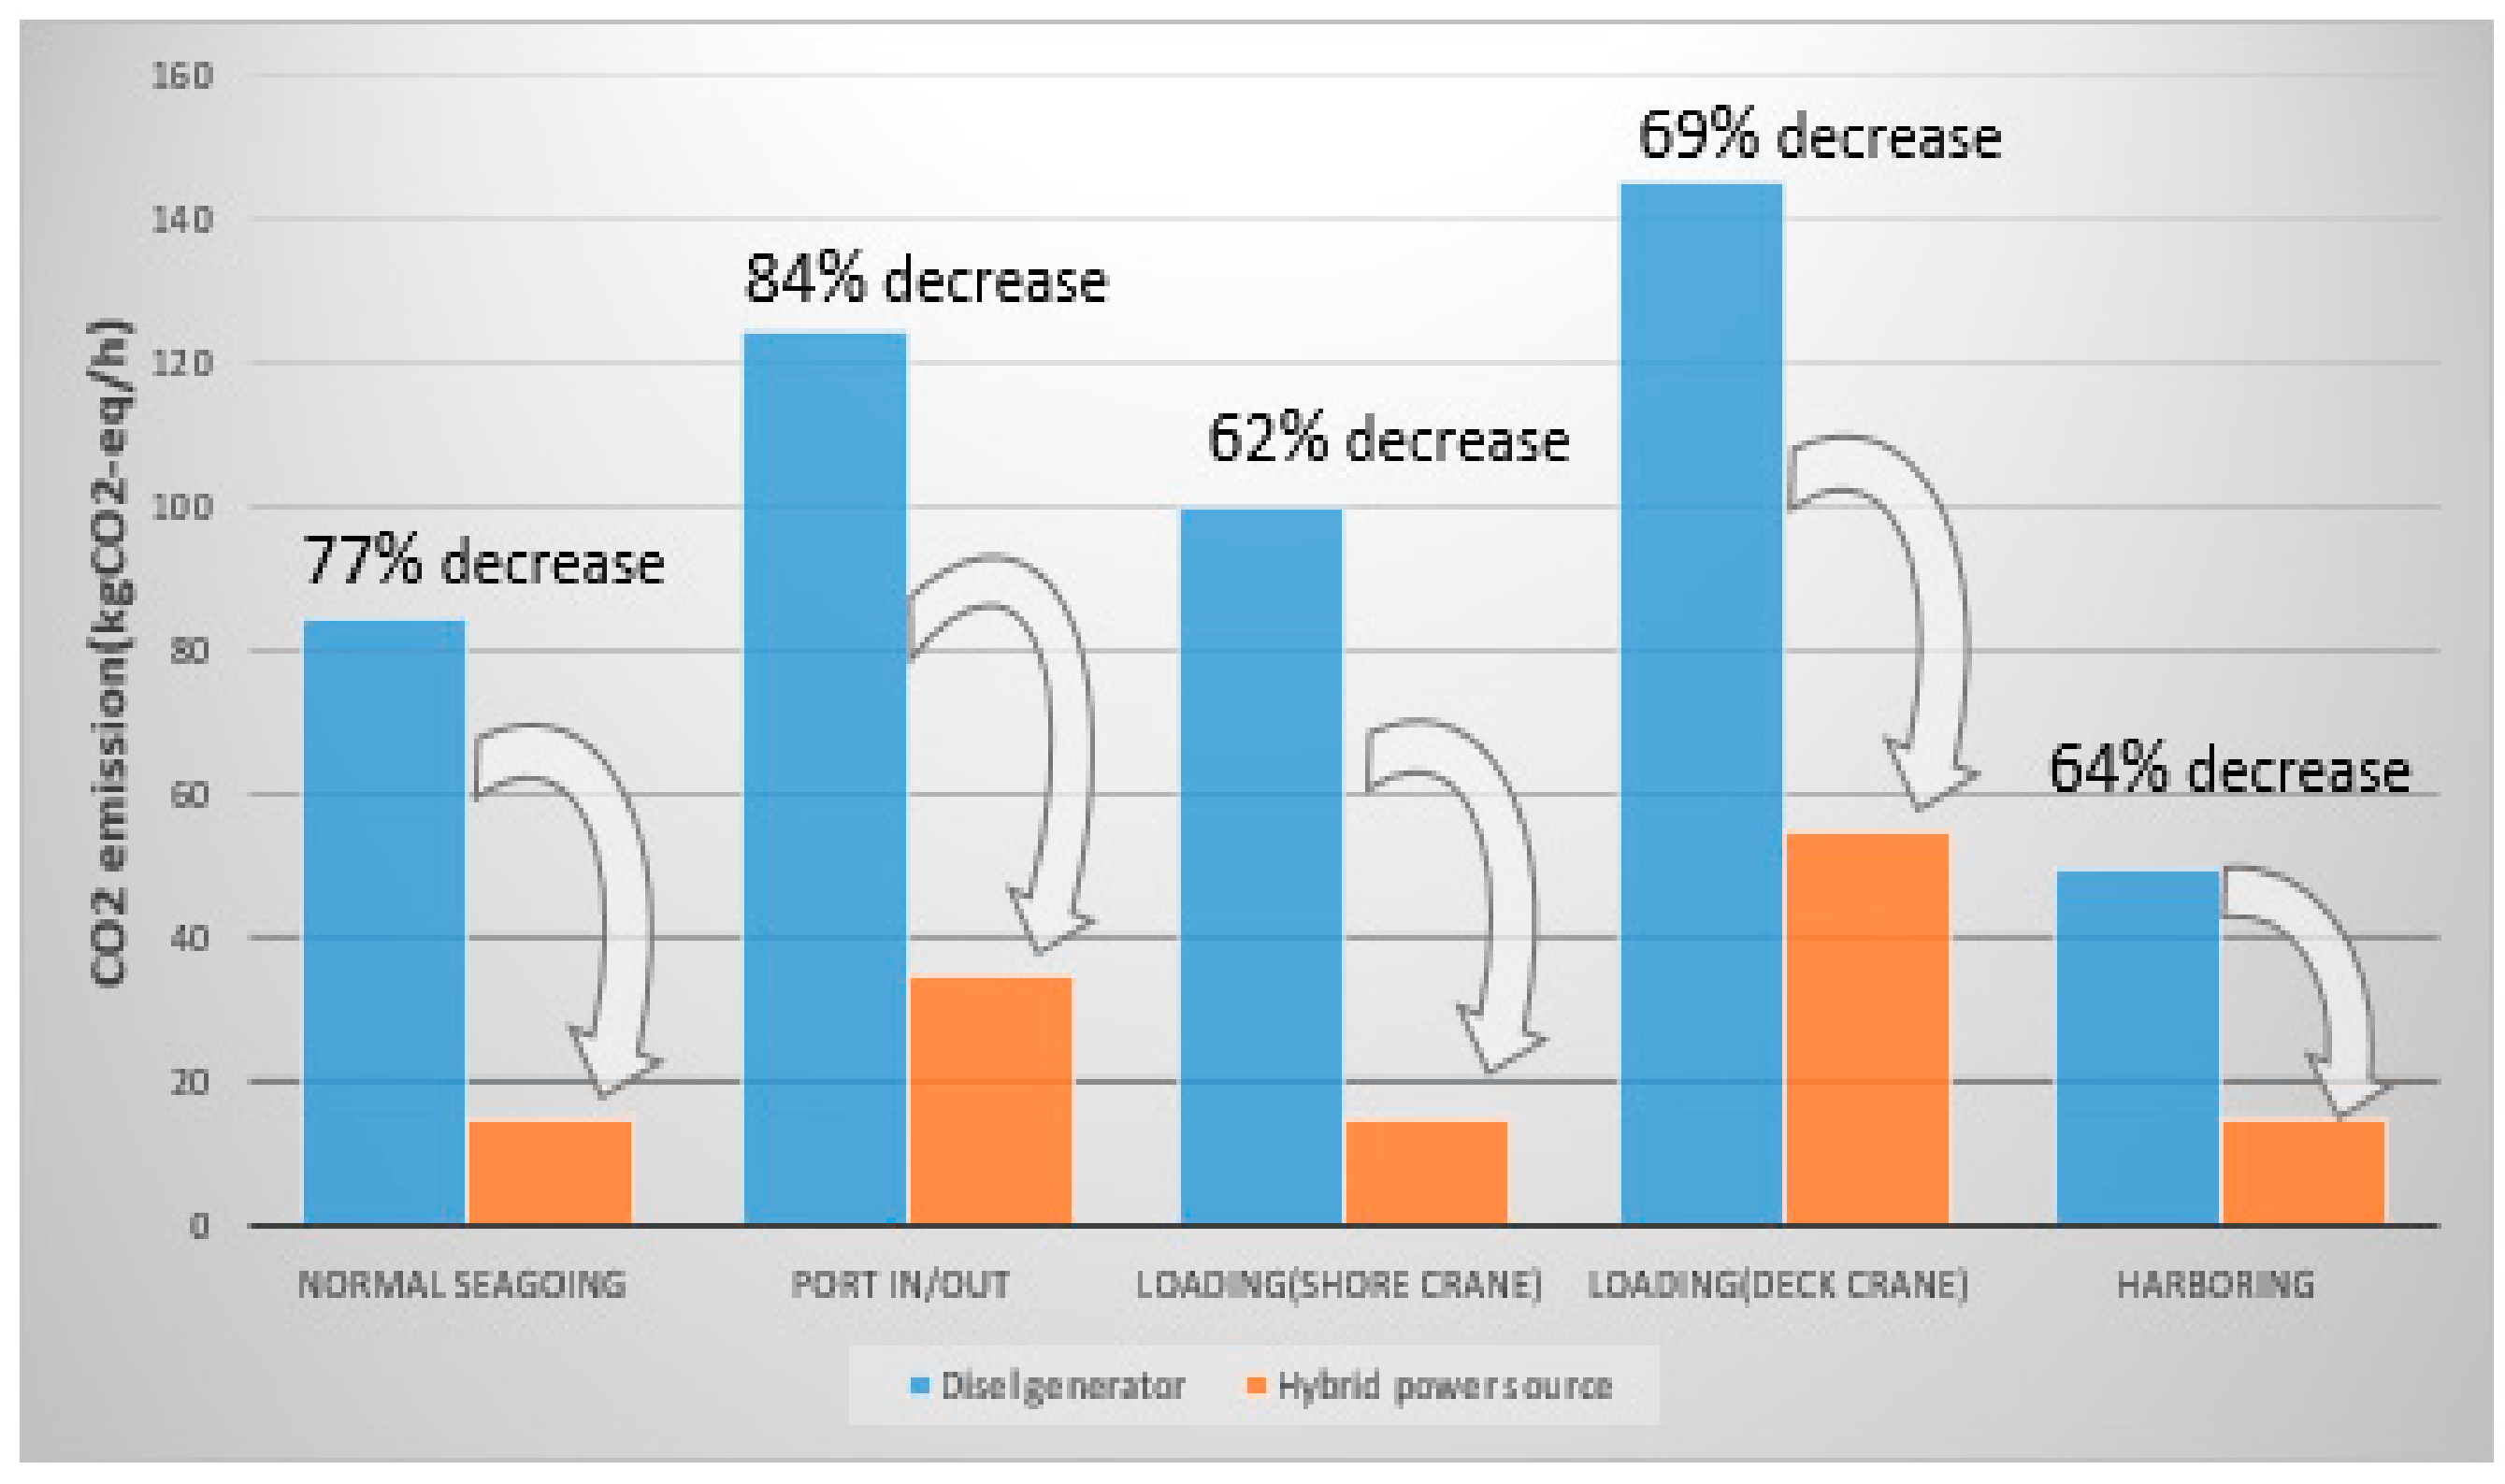
Figure 14.
Comparison of CO2 emissions and CO2 emission reduction rate in each operating mode of the 13000 TEU container ship.
Figure 14.
Comparison of CO2 emissions and CO2 emission reduction rate in each operating mode of the 13000 TEU container ship.
Figure 15.
Operating modes of the 40 k DWT bulk carrier.
Figure 15.
Operating modes of the 40 k DWT bulk carrier.
Figure 16.
Fuel consumption in each operating mode of the 40 k DWT bulk carrier.
Figure 16.
Fuel consumption in each operating mode of the 40 k DWT bulk carrier.
Figure 17.
Comparison of CO2 emissions and CO2 emission reduction rate in each operating mode of the 40 k DWT bulk carrier.
Figure 17.
Comparison of CO2 emissions and CO2 emission reduction rate in each operating mode of the 40 k DWT bulk carrier.
Figure 18.
Operating modes of the 130 k DWT LNG carrier.
Figure 18.
Operating modes of the 130 k DWT LNG carrier.
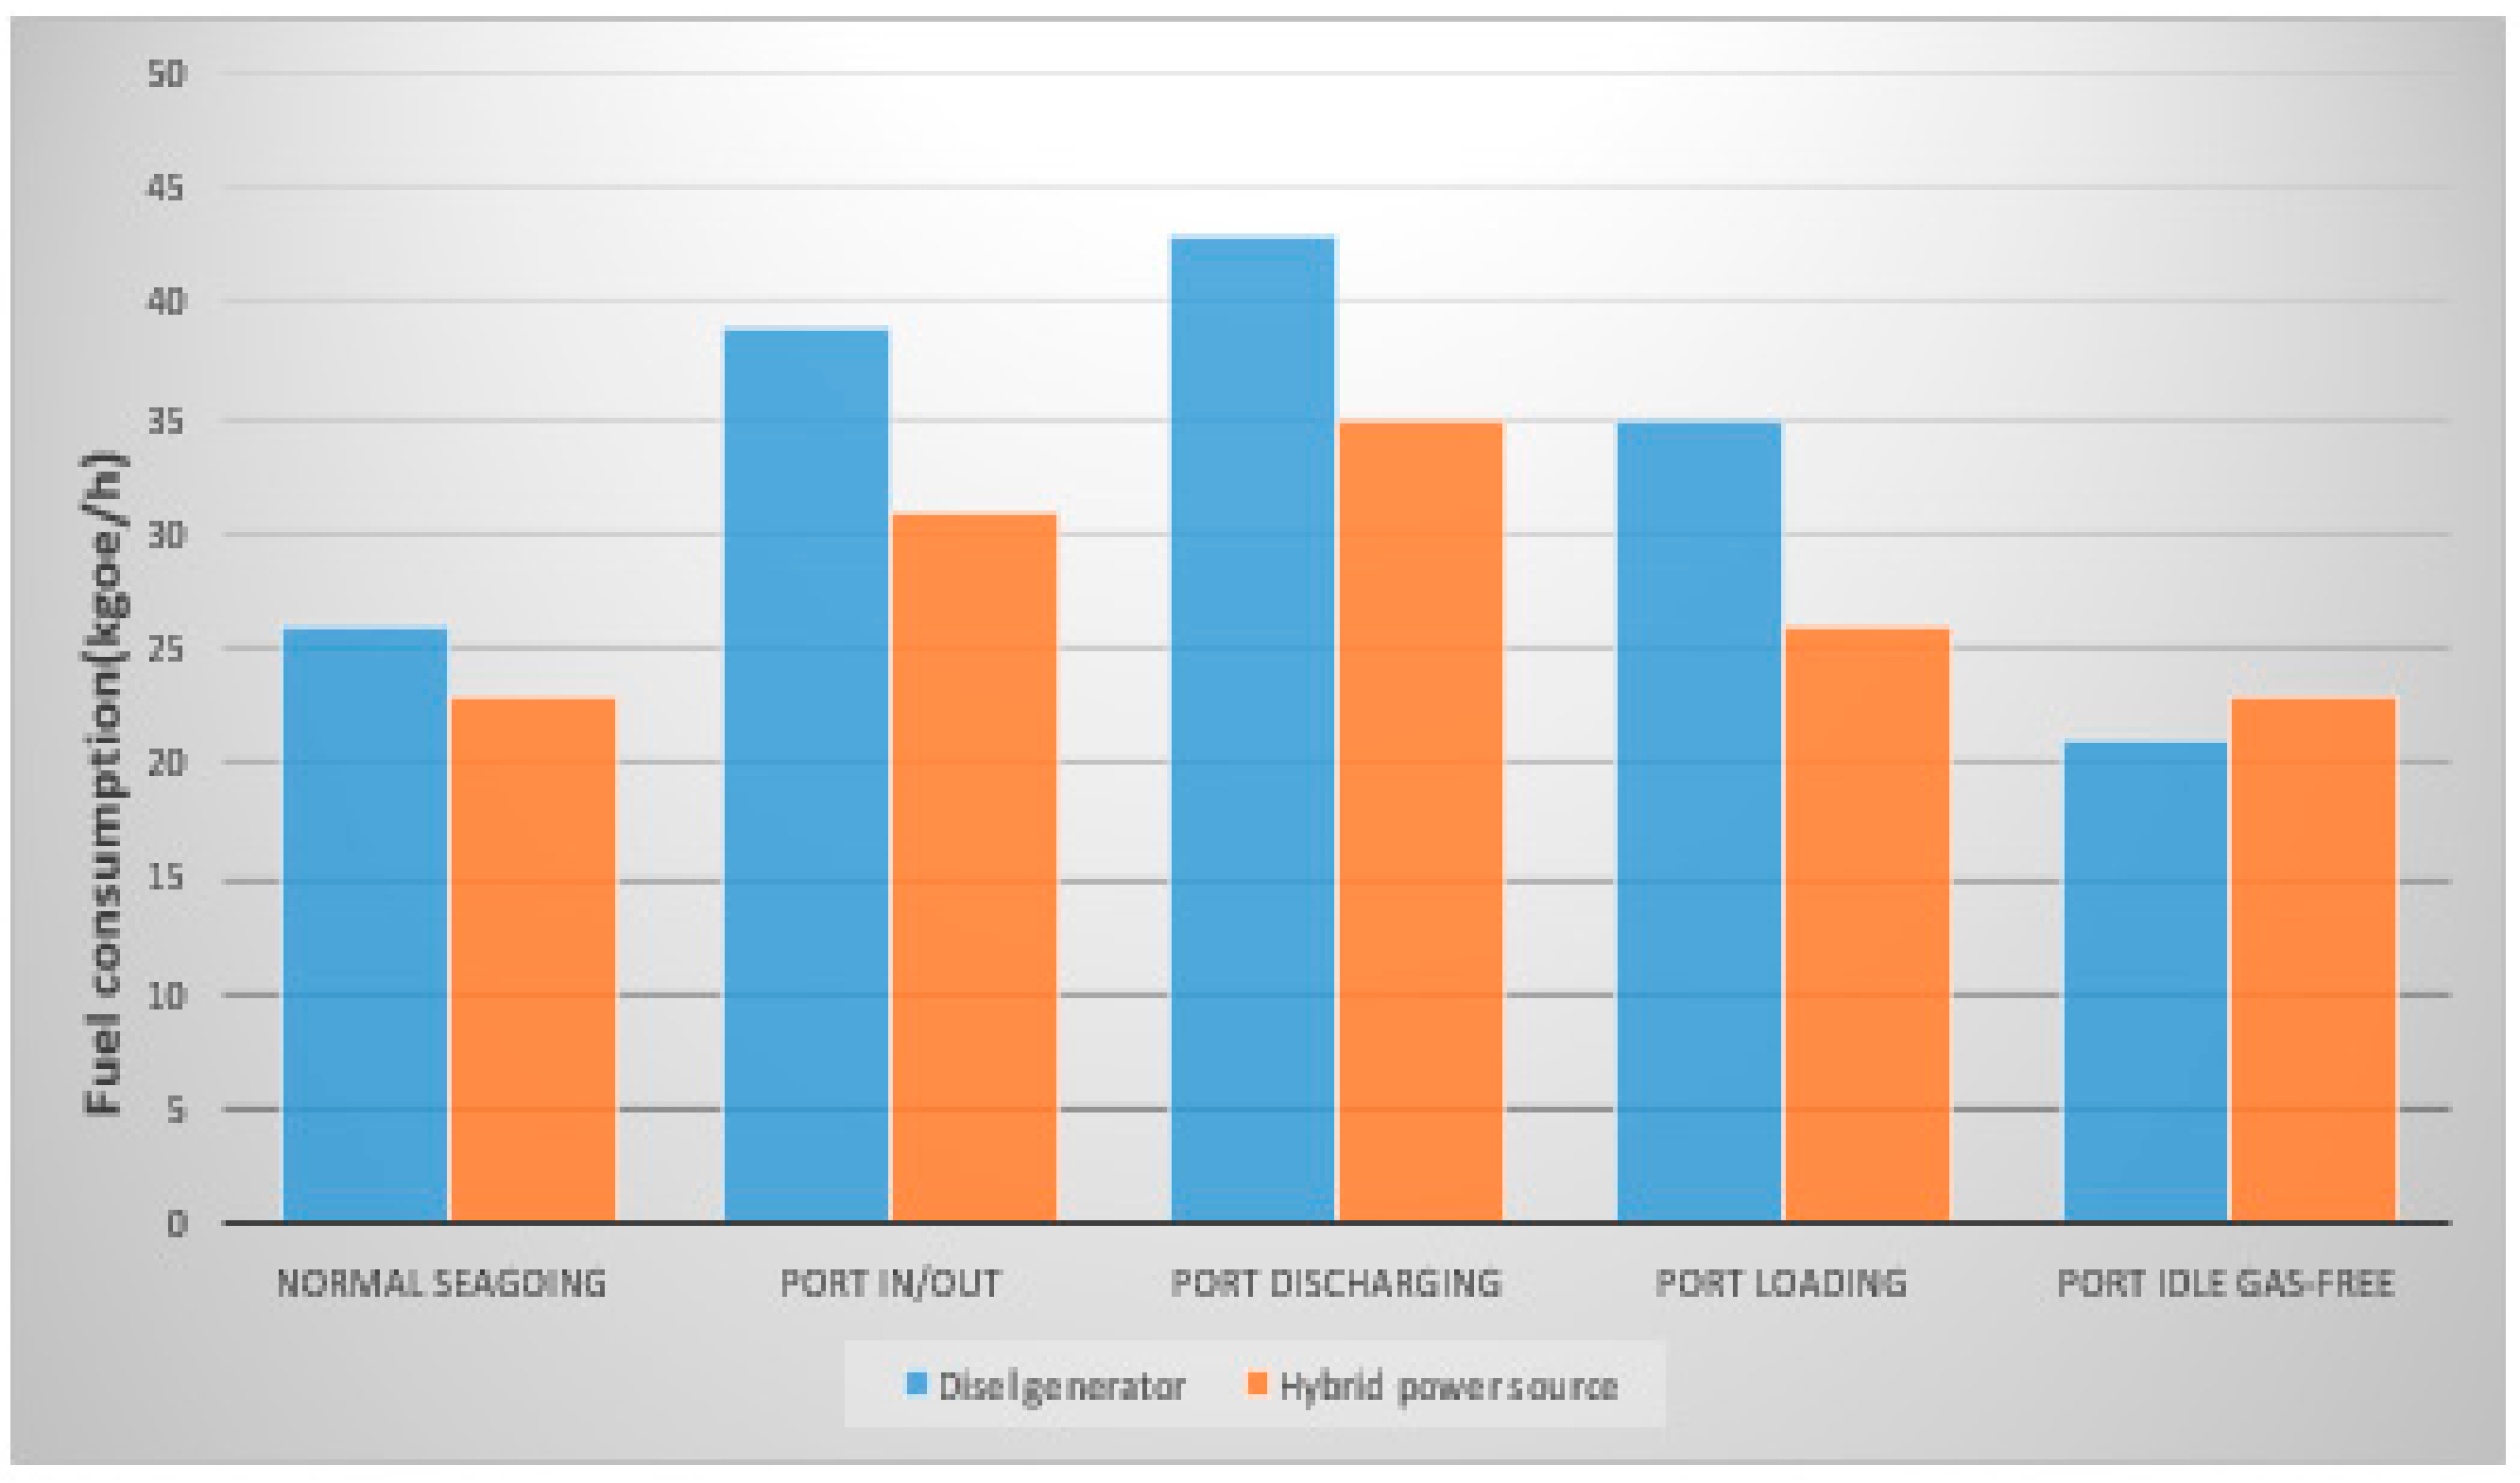
Figure 19.
Fuel consumption in each operation mode of the 13 0k DWT LNG carrier.
Figure 19.
Fuel consumption in each operation mode of the 13 0k DWT LNG carrier.
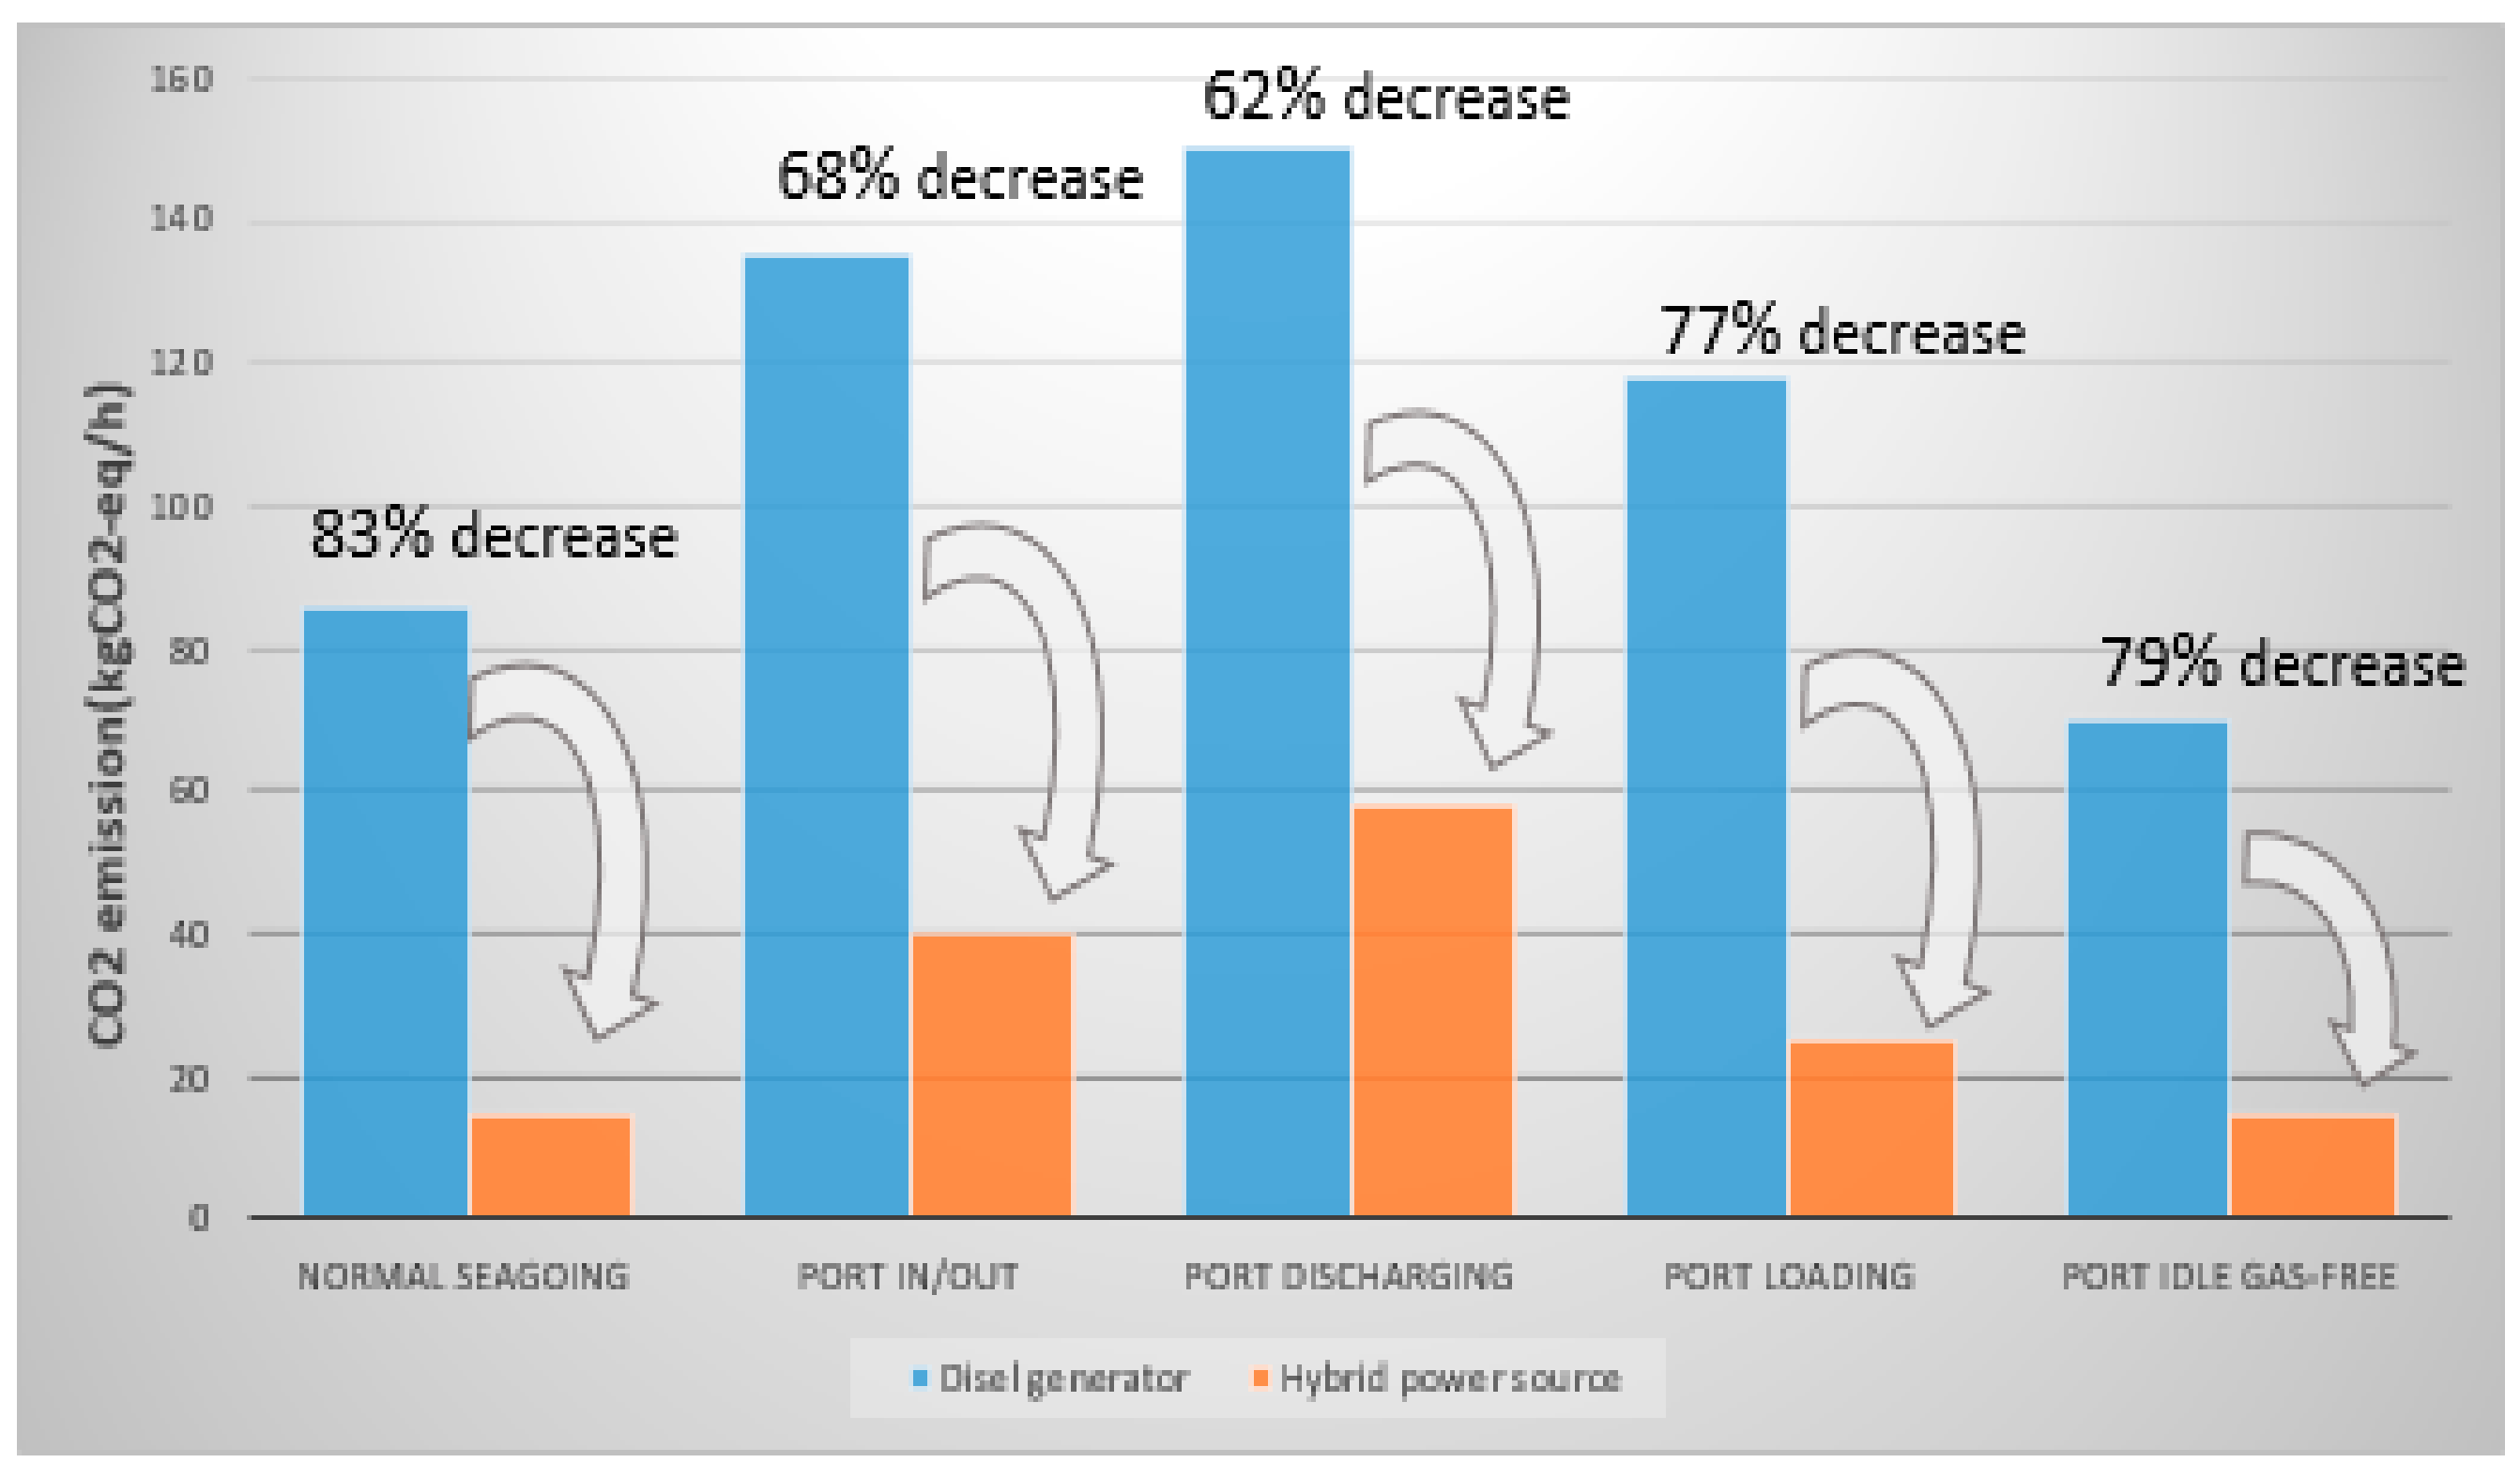
Figure 20.
Comparison of CO2 emissions and CO2 emission reduction rate in each operating mode of the 130 k DWT LNG carrier.
Figure 20.
Comparison of CO2 emissions and CO2 emission reduction rate in each operating mode of the 130 k DWT LNG carrier.
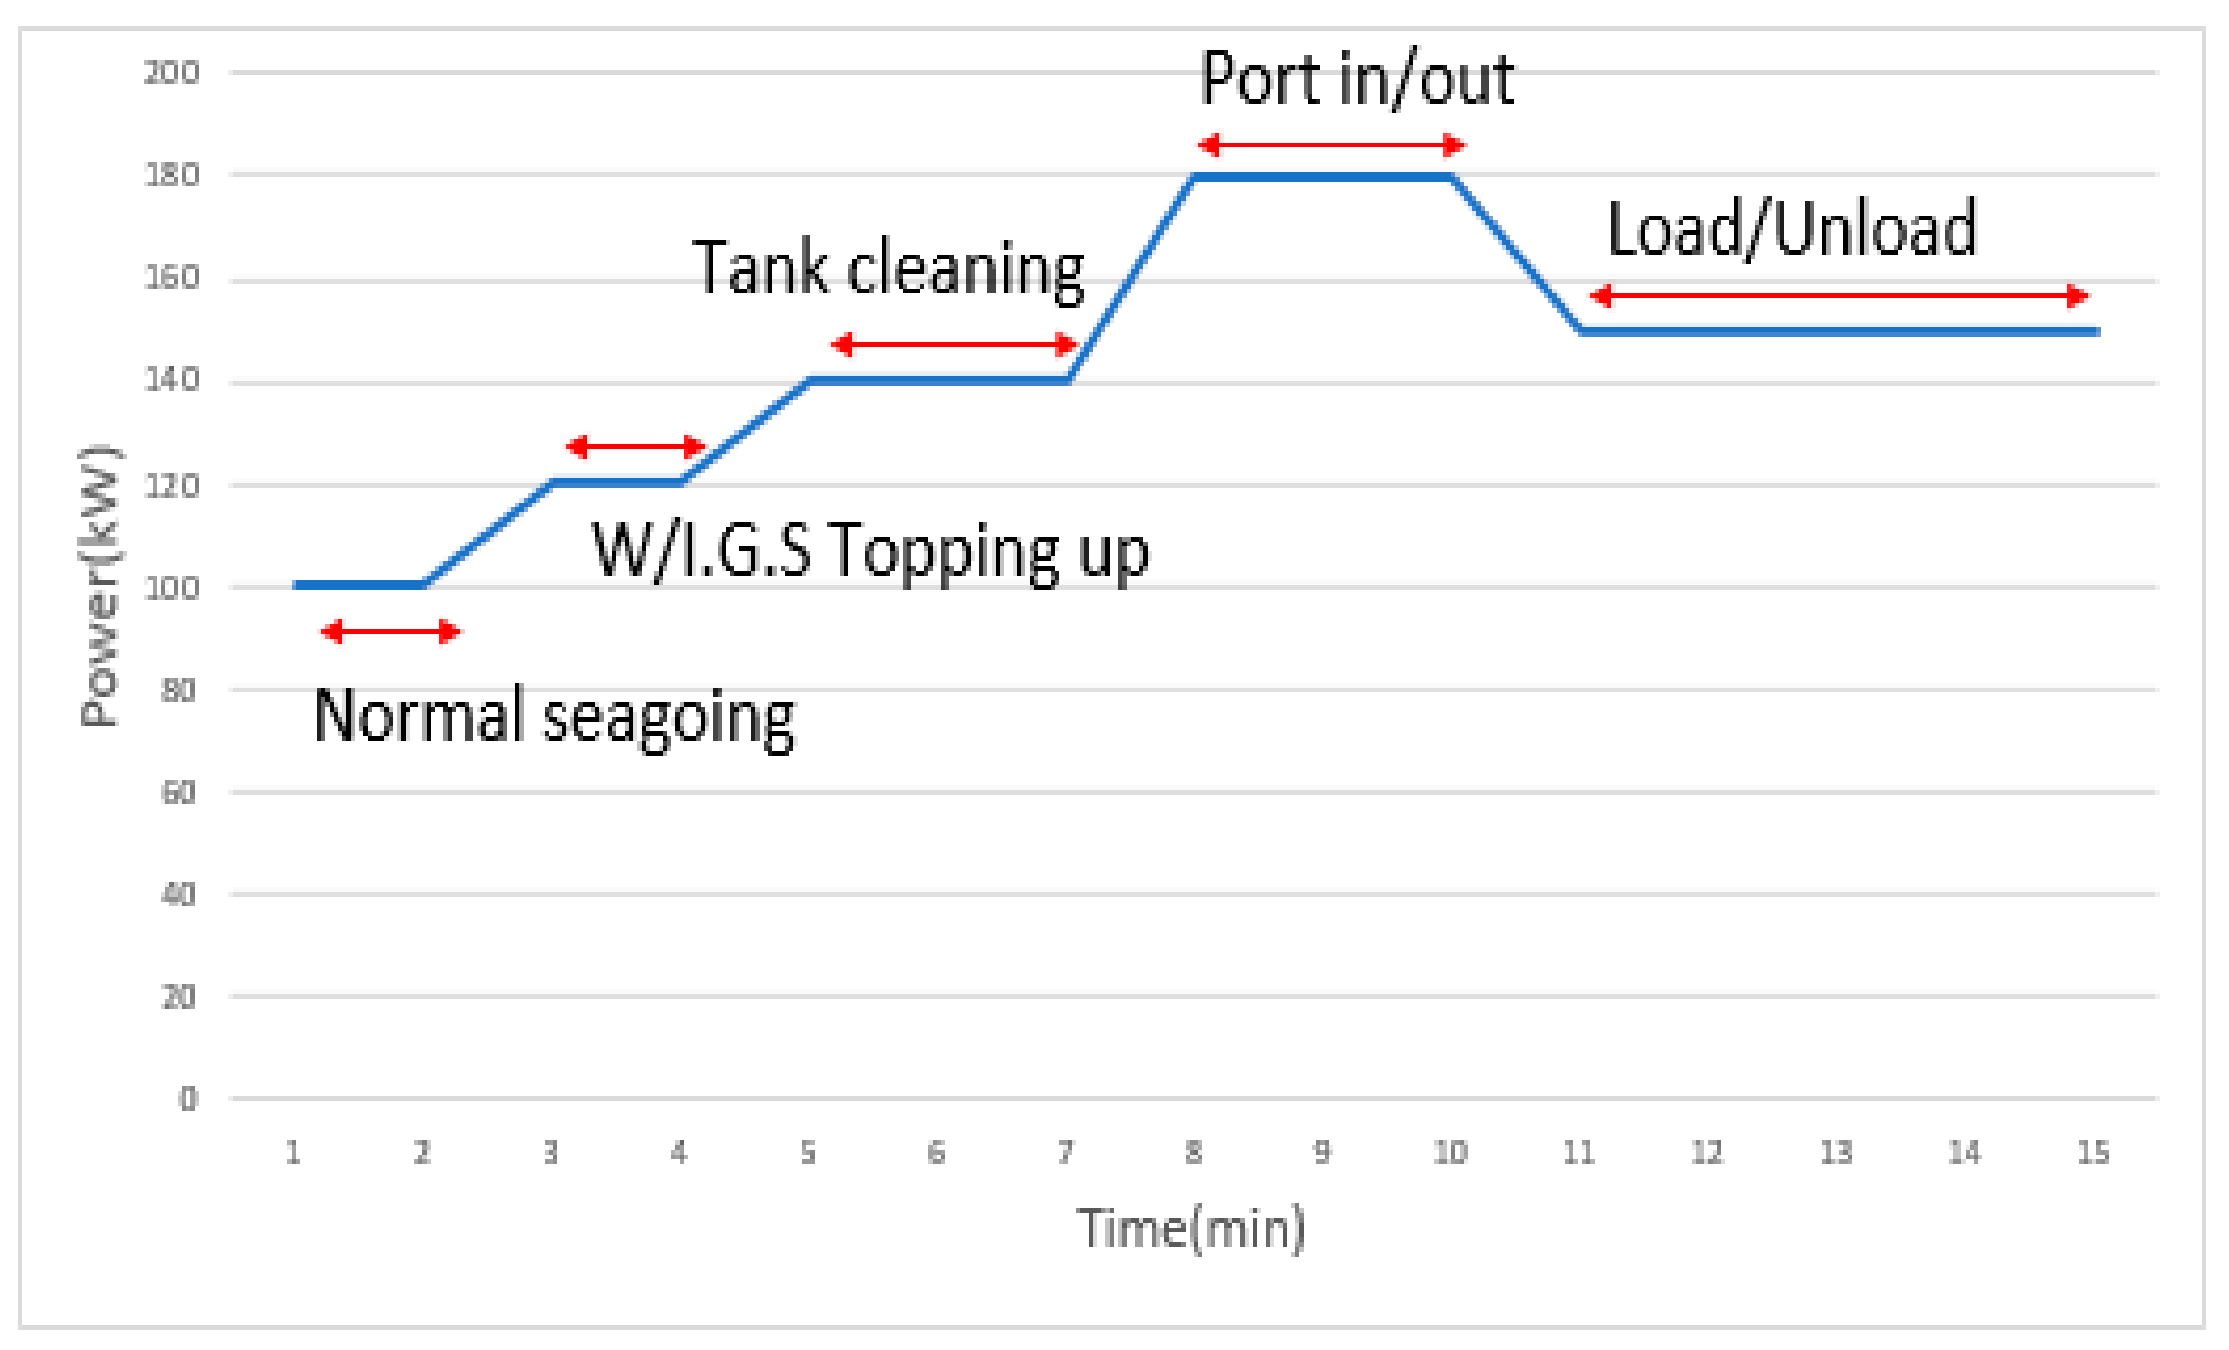
Figure 21.
Operating modes of the 300 k DWT VLCC.
Figure 21.
Operating modes of the 300 k DWT VLCC.
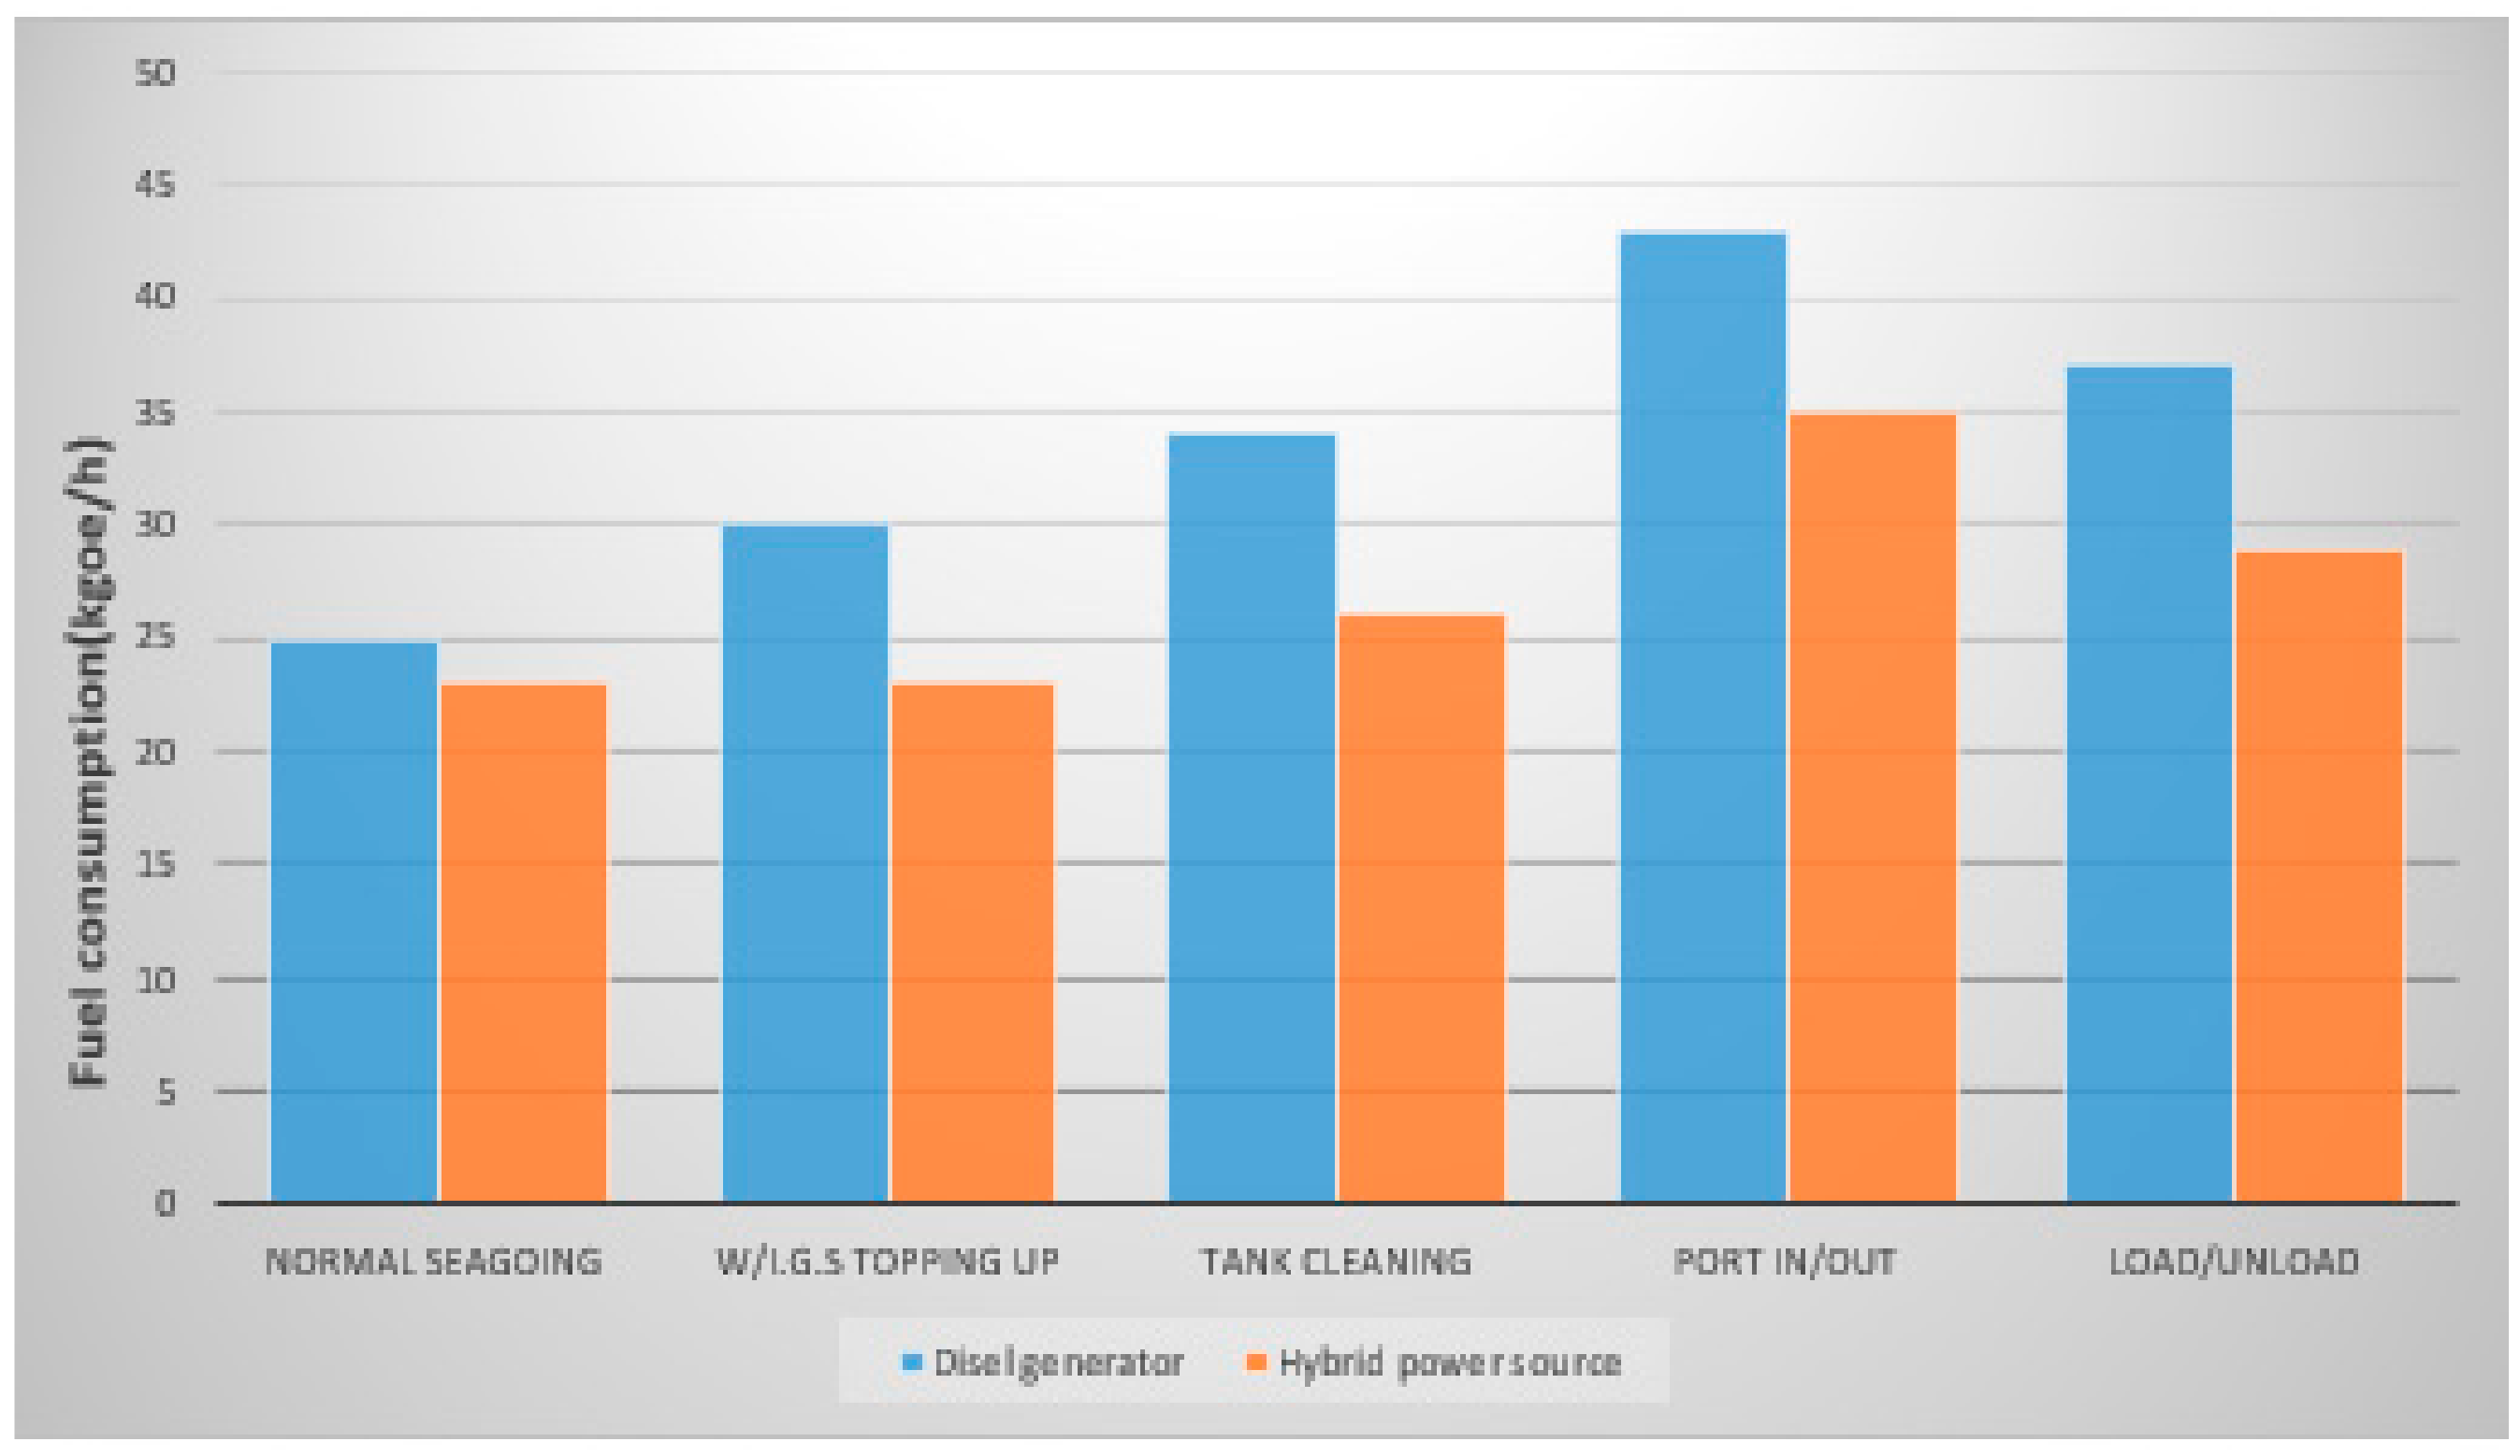
Figure 22.
Fuel consumption in each operating mode of the 300 k DWT VLCC.
Figure 22.
Fuel consumption in each operating mode of the 300 k DWT VLCC.
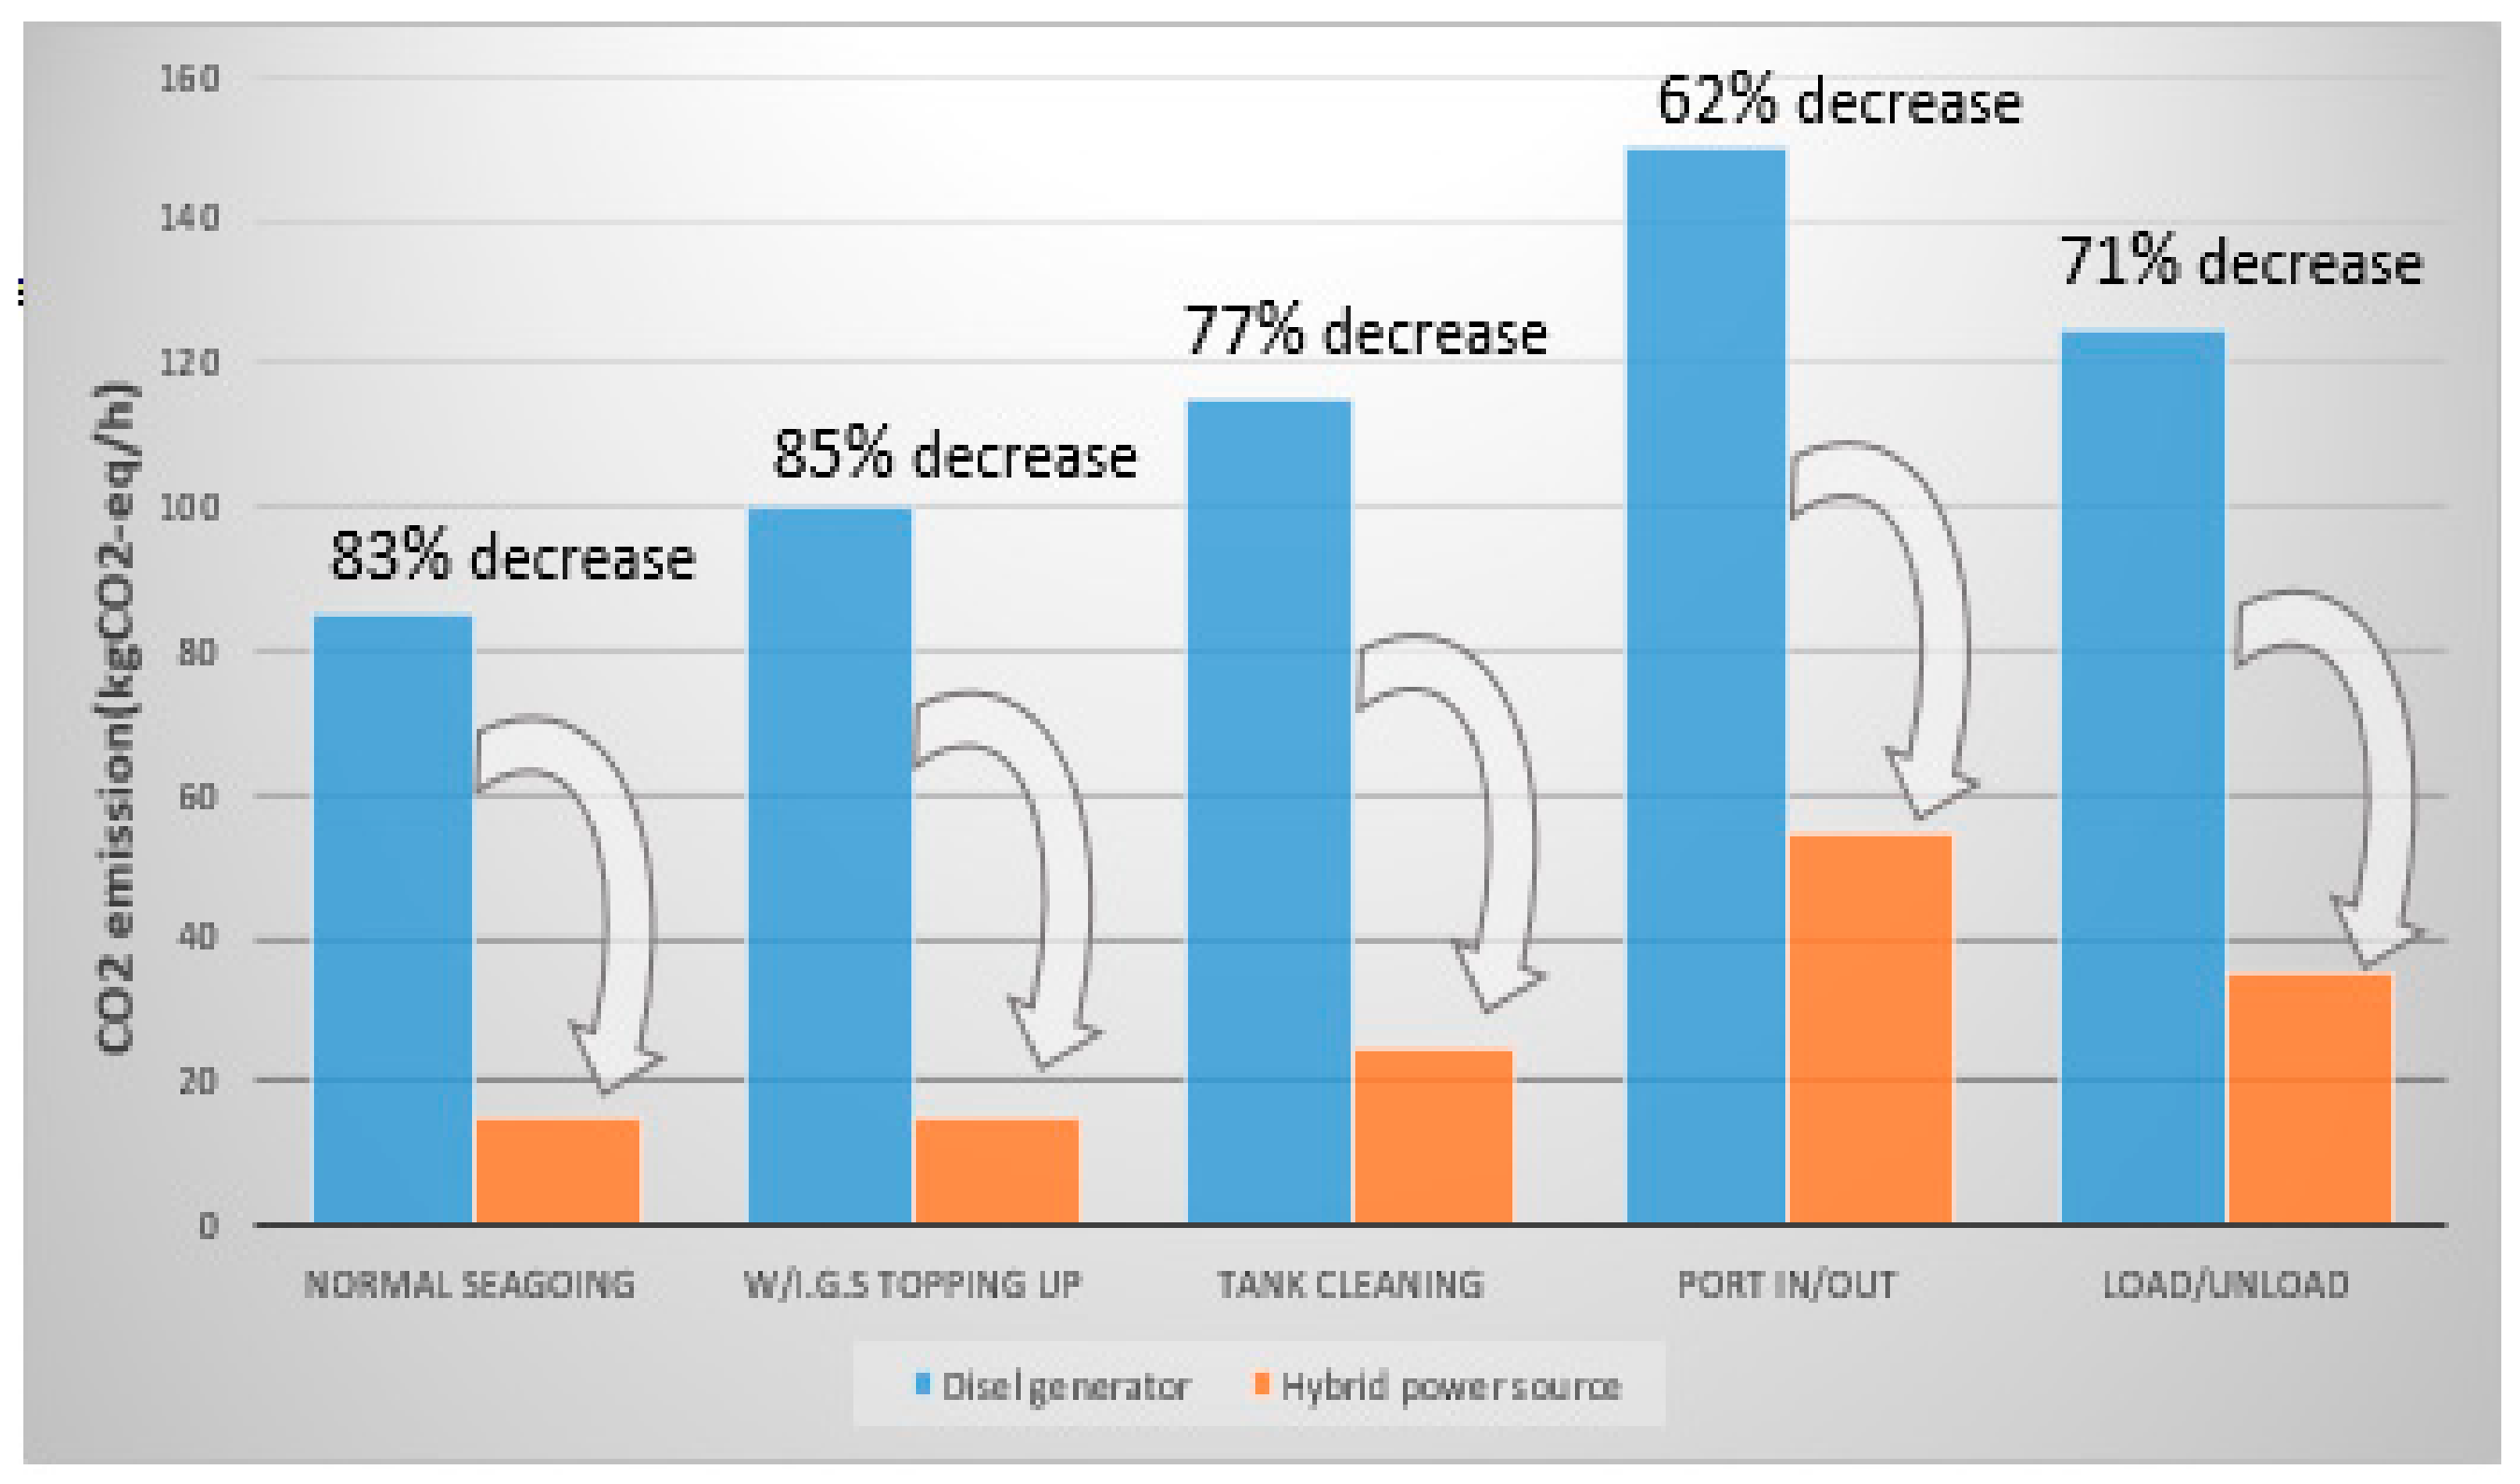
Figure 23.
Comparison of CO2 emissions and CO2 emission reduction rate in each operating mode of the 300 k DWT VLCC.
Figure 23.
Comparison of CO2 emissions and CO2 emission reduction rate in each operating mode of the 300 k DWT VLCC.
Table 1.
International Convention for the Prevention of Marine Pollution from Ships (MARPOL) 73/78—Annex VI Regulations for the Prevention of Air Pollution from Ships.
Table 1.
International Convention for the Prevention of Marine Pollution from Ships (MARPOL) 73/78—Annex VI Regulations for the Prevention of Air Pollution from Ships.
| Year Built | Capacity | NOx | SOx | PM | Remarks |
|---|
| 2008~2015 | >125 kW | 7.7 g/kWh | 24 kg/ton | 1.2 kg/ton | 20% decrease |
| 2016~ | 2.0 g/kWh | 6 kg/ton | 0.3 kg/ton | 80% decrease |
Table 2.
The energy efficiency design index (EEDI)-based CO2 emission reduction goals.
Table 2.
The energy efficiency design index (EEDI)-based CO2 emission reduction goals.
| Phase 0 (Year Built) | Phase 1 | Phase 2 | Phase 3 |
|---|
| 2013~2014 | 2015~2019 | 2020~2024 | 2025~ |
| Scheduled to take effect | 10% decrease | 20% decrease | 30% decrease |
Table 3.
Fuel cell types (catalyst, durability, and hydrogen storage).
Table 3.
Fuel cell types (catalyst, durability, and hydrogen storage).
| Fuel Cell Types | Main Fuel | Electrolyte | Temperature of Generation | Level of Technology | Subject of Application |
|---|
| PEMFC | Hydrogen | Ion conductive polymer film | Ordinary temperature~100 °C | Development and demonstration phase | Small power source, |
| Methanol | Automobile |
| MCFC | Natural gas | Molten carbonate | 600~700 °C | Development phase | Hybrid power generation |
| Coal gas |
| PAFC | Natural gas | Phosphoric acid | 150~200 °C | Commercialization phase | Distributed power system |
| Methanol |
| SOFC | Natural gas | Solid oxide | 700~1000 °C | Development phase | Hybrid power generation |
| Coal gas |
| AFC | Hydrogen | Potassium hydroxide | 80~120 °C | Commercialization phase | Space missions |
Table 4.
Calculation methods according to emission gas.
Table 4.
Calculation methods according to emission gas.
| | CO2 | CH4 | N2O |
|---|
| Estimate methodology | Tier 1,2 | Tier 1,2 | Tier 1,2 |
Table 5.
Fuel-based exhaust gas emission factors.
Table 5.
Fuel-based exhaust gas emission factors.
| Emission | Emission Factor | Guideline Reference |
|---|
| CH4 | 0.3 [ | IPCC 2006 |
| N2O | 0.08 [ | IPCC 2006 |
| CO2 | 3.206 [ | ISO 8217 Grades DMX |
Table 6.
DFC300 MA system specifications.
Table 6.
DFC300 MA system specifications.
| DFC300 MA Generation Plant Specifications |
| Machinery Balance of Plant [MBOP] | |
| Height (Main enclosure) | 9.6` |
| Height (Ship loose items) | 14.6` |
| Width | 8.0` |
| Length | 19.8` |
| Weight | 12,292 kg |
| Electric Balance of Plant [EBOP] | |
| Height | 9.5` |
| Width | 3.5` |
| Length | 9.0` |
| Weight | 12,292 kg |
| Stack Module | 8.4` |
| Height | 8.2` |
| Width | 15.0` |
| Length | 18,143 kg |
| Weight | |
| Total Weight | 42,727 kg |
| Power output | |
| Rated output | 250 kW |
| Voltage | 380~480 VAC |
| Frequency | 50~60 Hz |
| Power quality | Per IEEE 519 |
Table 7.
ESS general battery and inverter specifications.
Table 7.
ESS general battery and inverter specifications.
| | Division | Item | Specification |
|---|
| Battery | General | Rated output | 100 kW |
| Rated voltage | 407 VDC |
| Capacity | 300 AH |
| Assembly of Cell | 110S/2P |
| Range of voltage | 352 V~451 V |
| Max discharge current | 600 A |
| Protection | OVP, UVP, OCP, OTP |
| Communication | RS 232C, CAN 2.0 |
| Inverter | Alternating Current [AC] Input | Composition | 3 Phase |
| Voltage | 440 VAC |
| Frequency | 50/60 Hz |
| Rated output | 100 kW |
| Total Harmonic Distortion [THD] | Below 5% |
| Output | Voltage | 440 VAC |
| Frequency | 50/60 Hz |
| Rated output | 100 kW |
| Function | Protection | Over current, Over temperature, Over voltage, Low battery shutdown, Reverse flow |
Table 8.
Hybrid test bed and generator specifications.
Table 8.
Hybrid test bed and generator specifications.
| | Item | Specification |
|---|
| Engine part | Standby power rating | >95 PS |
| Engine type | 4 Stroke, Water cooled |
| Revolution | 1800 rpm |
| Number of cylinders | 6 |
| Cylinder type | Vertical series |
| Governor type | Speed control type |
| Cooling system | Radiator type |
| Fuel | Diesel |
| Starting system | DC 24 V battery start |
| Generator part | Type | Revolving field magnet |
| Standby power rating | 50 kW/62.5 kVA |
| Prime power rating | 45 kW/56 kVA |
| Voltage | 440/254 V |
| Current | 82 A |
| Phase and wire | Three phase four wire |
| Frequency | 60 Hz |
| Power factor | 0.8 Lag |
| Pole | 4 |
| Revolution | 1800 rpm |
Table 9.
Load bank specifications.
Table 9.
Load bank specifications.
| Rated Capacity | 300 kW |
|---|
| Rated Voltage | 3 Phase, 440 V, 60 Hz |
|---|
| Current and Resistance Value for Each Capacity |
|---|
| Unit Capacity (kW) | Quantity | Synthetic Capacity (kW) | Unit Current (A) | Unit Resistance | Enclosure Configuration |
|---|
| 0.1 | 1 | 0.1 | 0.13 | 1936 Ω | 1 box |
| 0.2 | 1 | 0.2 | 0.26 | 968 Ω |
| 0.4 | 1 | 0.4 | 0.52 | 484 Ω |
| 0.8 | 1 | 0.8 | 1.04 | 242 Ω |
| 1 | 1 | 1 | 1.31 | 193.6 Ω |
| 2 | 1 | 2 | 2.62 | 96.8 Ω |
| 4 | 1 | 4 | 5.24 | 48.4 Ω |
| 8 | 1 | 8 | 10.49 | 24.2 Ω |
| 16 | 1 | 16 | 20.99 | 12.1 Ω |
| 32 | 1 | 32 | 41.98 | 6.05 Ω |
| 60 | 4 | 240 | 78.78 | 3.22 Ω |
| Total | 15 | 304.5 | 399.7 | - | |
Table 10.
Configuration of control logic for power system.
Table 10.
Configuration of control logic for power system.
| Load | Control Condition |
|---|
| ≤100 kW | ESS SOC ≥ 80% | MCFC and Consumption Load leveler |
| ESS SOC ≤ 80% | MCFC and Charging ESS |
| 101 kW ≤ Load ≤ 130 kW | ESS SOC ≥ 60% | MCFC and Charging ESS and Diesel Generator [D/G] Off |
| 40% ≤ ESS SOC ≥ 60% | MCFC and ESS Discharging |
| ESS SOC ≤ 40% | MCFC and ESS Discharging and D/G Operation |
| 131 kW ≤ Load ≤ 180 kW | ESS SOC ≤ 35% | MCFC and D/G Operation, ESS limit (≤20 kW) |
| ESS SOC ≤ 30% | MCFC and D/G Operation, ESS limit (≤10 kW) |
| ESS SOC ≤ 25% | MCFC and D/G Operation, ESS off |
Table 11.
Flow conversion formula and CO2 emission calculation formula.
Table 11.
Flow conversion formula and CO2 emission calculation formula.
| Power Source | Calculation Method of Fuel Consumption | Calculation Method of CO2 |
|---|
| Diesel generator | Kgoe/h = flow (L/h) × 0.901 | CO2 = 0.857 × flow (L/h) × (3.206 + 0.3 + 0.08) |
| Fuel cell | Kgoe/h = flow (m3/h) × 1.043 | CO2 = 0.631 × Electric Energy (kWh) |
Table 12.
Conversion standard of energy calorific value.
Table 12.
Conversion standard of energy calorific value.
| Fuel | Unit | Gloss Calorific Value | Net Calorific Value |
|---|
| MJ | kcal | 10−3 TOE | MJ | kcal | 10−3 TOE |
|---|
| Diesel | L | 37.7 | 9010 | 0.901 | 35.2 | 8420 | 0.842 |
| LNG | Nm3 | 43.6 | 10,430 | 1.043 | 39.4 | 9420 | 0.942 |
Table 13.
CO2 emission reduction rates in the commercial diesel generator vs. the hybrid power source.
Table 13.
CO2 emission reduction rates in the commercial diesel generator vs. the hybrid power source.
| | Fuel Consumption (kgoe/h) | CO2 Emissions (kgCO2/h) |
|---|
| Diesel generator | 43.5 | 148.5 |
| Hybrid power source | 35.6 | 57.7 |
| CO2 reduction rate | 61% |
Table 14.
Load scenario according to the ship type.
Table 14.
Load scenario according to the ship type.
| Vessels | Operation Mode | Power Sources |
|---|
| 5500 TEU Reefer Container | Normal seagoing (w/o reefer) | Fuel Cell |
| Normal seagoing (w/reefer) | Fuel Cell + Battery + D/G |
| Port in/out (w/o thruster) | Fuel Cell |
| Port in/out (w/ thruster) | Fuel Cell + Battery + D/G |
| Load/Unload | Fuel Cell + Battery + D/G |
| 13,000 TEU Container | Normal seagoing | Fuel Cell |
| Port in/out (w/o thruster) | Fuel Cell + Battery |
| Port in/out (w/ thruster) | Fuel Cell + Battery + D/G |
| Load/Unload | Fuel Cell |
| Harboring | Fuel Cell |
| 40 k DWT Bulk Carrier | Normal seagoing | Fuel Cell |
| Port in/out | Fuel Cell + Battery + D/G |
| Loading (shore crane) | Fuel Cell + Battery |
| Loading (crane) | Fuel Cell + Battery + D/G |
| Harboring | Fuel Cell |
| 130 k DWT LNG Carrier | Normal seagoing | Fuel Cell |
| Port in/out | Fuel Cell + Battery + D/G |
| Port discharging | Fuel Cell + Battery + D/G |
| Port loading | Fuel Cell + Battery + D/G |
| Port idle gas free | Fuel Cell |
| 300 k DWT VLCC | Normal seagoing | Fuel Cell |
| W/I.G.S Topping up | Fuel Cell + Battery |
| Tank cleaning | Fuel Cell + Battery + D/G |
| Port in/out | Fuel Cell + Battery + D/G |
| Load/Unload | Fuel Cell + Battery + D/G |
Table 15.
Cumulative CO2 emissions and reductions at load scenario.
Table 15.
Cumulative CO2 emissions and reductions at load scenario.
| Case | CO2 Emissions (kgCO2) | Fuel Consumption (kgoe) | CO2 Reduction Rate | Experiment Time (h:m:s) |
|---|
| Diesel Generator | Hybrid Power Source | Diesel Generator | Hybrid Power Source |
|---|
| 5500 TEU Reefer Container | 205.6 | 56.8 | 60.3 | 54.1 | 72 | 2:50:59 |
| 13,000 Container | 233.9 | 69.5 | 68.6 | 57.8 | 70 | 4:01:01 |
| 40 k DWT Bulk Carrier | 184.9 | 49.8 | 54.2 | 52.0 | 73 | 2:01:07 |
| 130 k DWT LNG Carrier | 217.7 | 59.6 | 63.8 | 54.9 | 73 | 2:00:23 |
| 300 k DWT VLCC | 238.5 | 62.8 | 69.9 | 55.8 | 74 | 2:00:20 |


