Article

Application of the Design of Experiments and Computational Fluid Dynamics to Bow Design Improvement

1
Department of Naval Architecture and Ocean Engineering, Seoul National University, Seoul 08826, Korea
2
Hyundai Heavy Industries Co. Ltd., Seoul 03058, Korea
3
Department of Naval Architecture and Ocean Engineering, Chungnam National University, Daejeon 34134, Korea
4
Research Institute of Marine Systems Engineering, Seoul 08826, Korea
*
Author to whom correspondence should be addressed.
J. Mar. Sci. Eng. 2019, 7(7), 226; https://doi.org/10.3390/jmse7070226
Submission received: 18 June 2019 / Revised: 12 July 2019 / Accepted: 16 July 2019 / Published: 17 July 2019
(This article belongs to the Section Ocean Engineering)

Abstract

:
Techniques of the design of experiments (DOE) and computational fluid dynamics (CFD) were applied for improving the bow shape of a tanker hull. Through this, a hull that could reduce the added resistance in waves was derived. The key design elements of the bow shape were selected as parameters for design optimization and added resistance in the short-wavelength region was interpreted through CFD considering the operational condition of the full scale ship. For design parameter changes, the number of analyses was minimized by applying DOE. The regression equation for calculating added resistance was derived using bow-shape design parameters by applying the response surface method and regression analysis to obtain the optimal hull with minimal added resistance was derived. The methodology was applied to an Aframax tanker hull form, and the derived added resistance regression equation and the added resistance value obtained through CFD analysis showed a difference of approximately 1%. The model test results of the improved hull form showed that the added resistance was reduced by 52% in comparison to that obtained for the original hull form.

1. Introduction

With the increased global interests in eco-friendliness, the Energy Efficiency Design Index (EEDI) adopted by the International Maritime Organization (IMO) in 2013 regulates greenhouse gas (GHG) emission of maritime industries. The demand for improved fuel efficiency, low emissions and optimized operation, which are of interest to IMO, resulted in the introduction of EEDI. The effect of ship size on the EEDI requirements for large container ships was elaborated on by Vladimir et al. [1]. Ancic et al. [2] proposed an approach in the EEDI definition for bulk carriers which would provide a fair basis for the comparison of different ships and encourage the application of innovative energy efficient technologies.
In general, a ship’s hull form is developed to reduce the resistance in calm water. However, to increase the operational performance in real seas, the added resistance in waves must also be evaluated. In particular, a low-speed full ship has a blunt bow to maximize freight-loading in the operation speed. The blunt bow accompanies the drag by wave reflection of the incident waves, resulting in added resistance in short waves. As the short wave is common in the operation of ships, bow design to reduce the added resistance in short waves is required to improve the resistance performance of a ship in actual operational sea conditions.
To take into account the nonlinearity in added resistance analysis in short waves, computational fluid dynamics (CFD) methods based on the Reynolds-averaged Navier–Stokes (RANS) equations are increasingly adopted. CFD results demonstrated comparable accuracy to model test measurements in the added resistance problems [3]. Simonsen et al. [4] compared the model test results with the CFD results concerning motion response and added resistance in waves for a container carrier hull form. It was shown that motions were in fair agreement with the measured data, but larger differences were observed for the resistance magnitude. Kim et al. [5] conducted CFD analysis on the added resistance of a very large crude oil carrier (VLCC) in waves and verified the effects on the energy-saving device through comparison with the model test results.
In addition to the prediction of added resistance in waves, there are studies on the effect of the hull form variation on the added resistance. Hirota et al. [6] studied the effect of the bow shape above the water surface on the reduction of added resistance and proposed the so-called “Ax-bow” and “Leadge-bow.” Kim et al. [7] showed the effects of different bow shapes on the added resistance in head seas by utilizing a CFD method.
To date, most studies focused on predicting the added resistance of a ship in waves and systematic evaluations on various hull form parameters to reduce the added resistance in waves. Based on these studies, the present study attempted to find main hull form parameters and correlations between them, which is a prerequisite for hull form optimization to reduce added resistance in waves. In this process, the design of experiments (DOE) was applied to systematically and effectively perform CFD analyses.
DOE derives optimal results through a minimum number of analysis cases by arranging and interpreting some of the main cases. Sudarsanam and Ravindran [8] addressed this problem by DOE results with Linear Stochastic Bandits, which seek to find the best treatment asymptotically, while minimizing cumulative regret in the online environment. This can be particularly useful in environments where there are few resources for outright offline experimenting, which could exist due to constraints on the downtime a system can take or the constraints on cost and technology in replicating the system through a model.
A model-based DOE approach was proposed to minimize the number of trials and resources required for model identification. The use of this approach in an experimental case study allowed for a dramatic reduction of the experimentation time from 1080 min to 30–60 min corresponding to a single optimal batch desalination experiment [9].
DOE is being adopted in the field of shipbuilding as well. Im [10] analyzed the design parameter contribution and the correlation of the propeller hub appendage of a container ship through DOE and analysis of variance. As a result, an optimal shape for improving the propulsive efficiency was derived. Seo and Kim [11] used DOE to find the optimal combination of appendages installed on the planing high-speed craft and showed that it was possible to dramatically reduce the time and cost needed for model tests.
In the present study, DOE was applied to the optimization process of bow shapes to reduce the added resistance in waves. The main hull form parameters were derived by reviewing the past research cases. The changes in the added resistance for the derived parameters were analyzed through CFD analyses. Added resistance reduction was confirmed by applying the developed technique to an actual hull form. In the following section, the application process of DOE for bow shape design is explained. The CFD techniques used herein are followed. Then, the process and results of analyses on the actual bow shape are described. Finally, the results are summarized, and conclusions are presented.

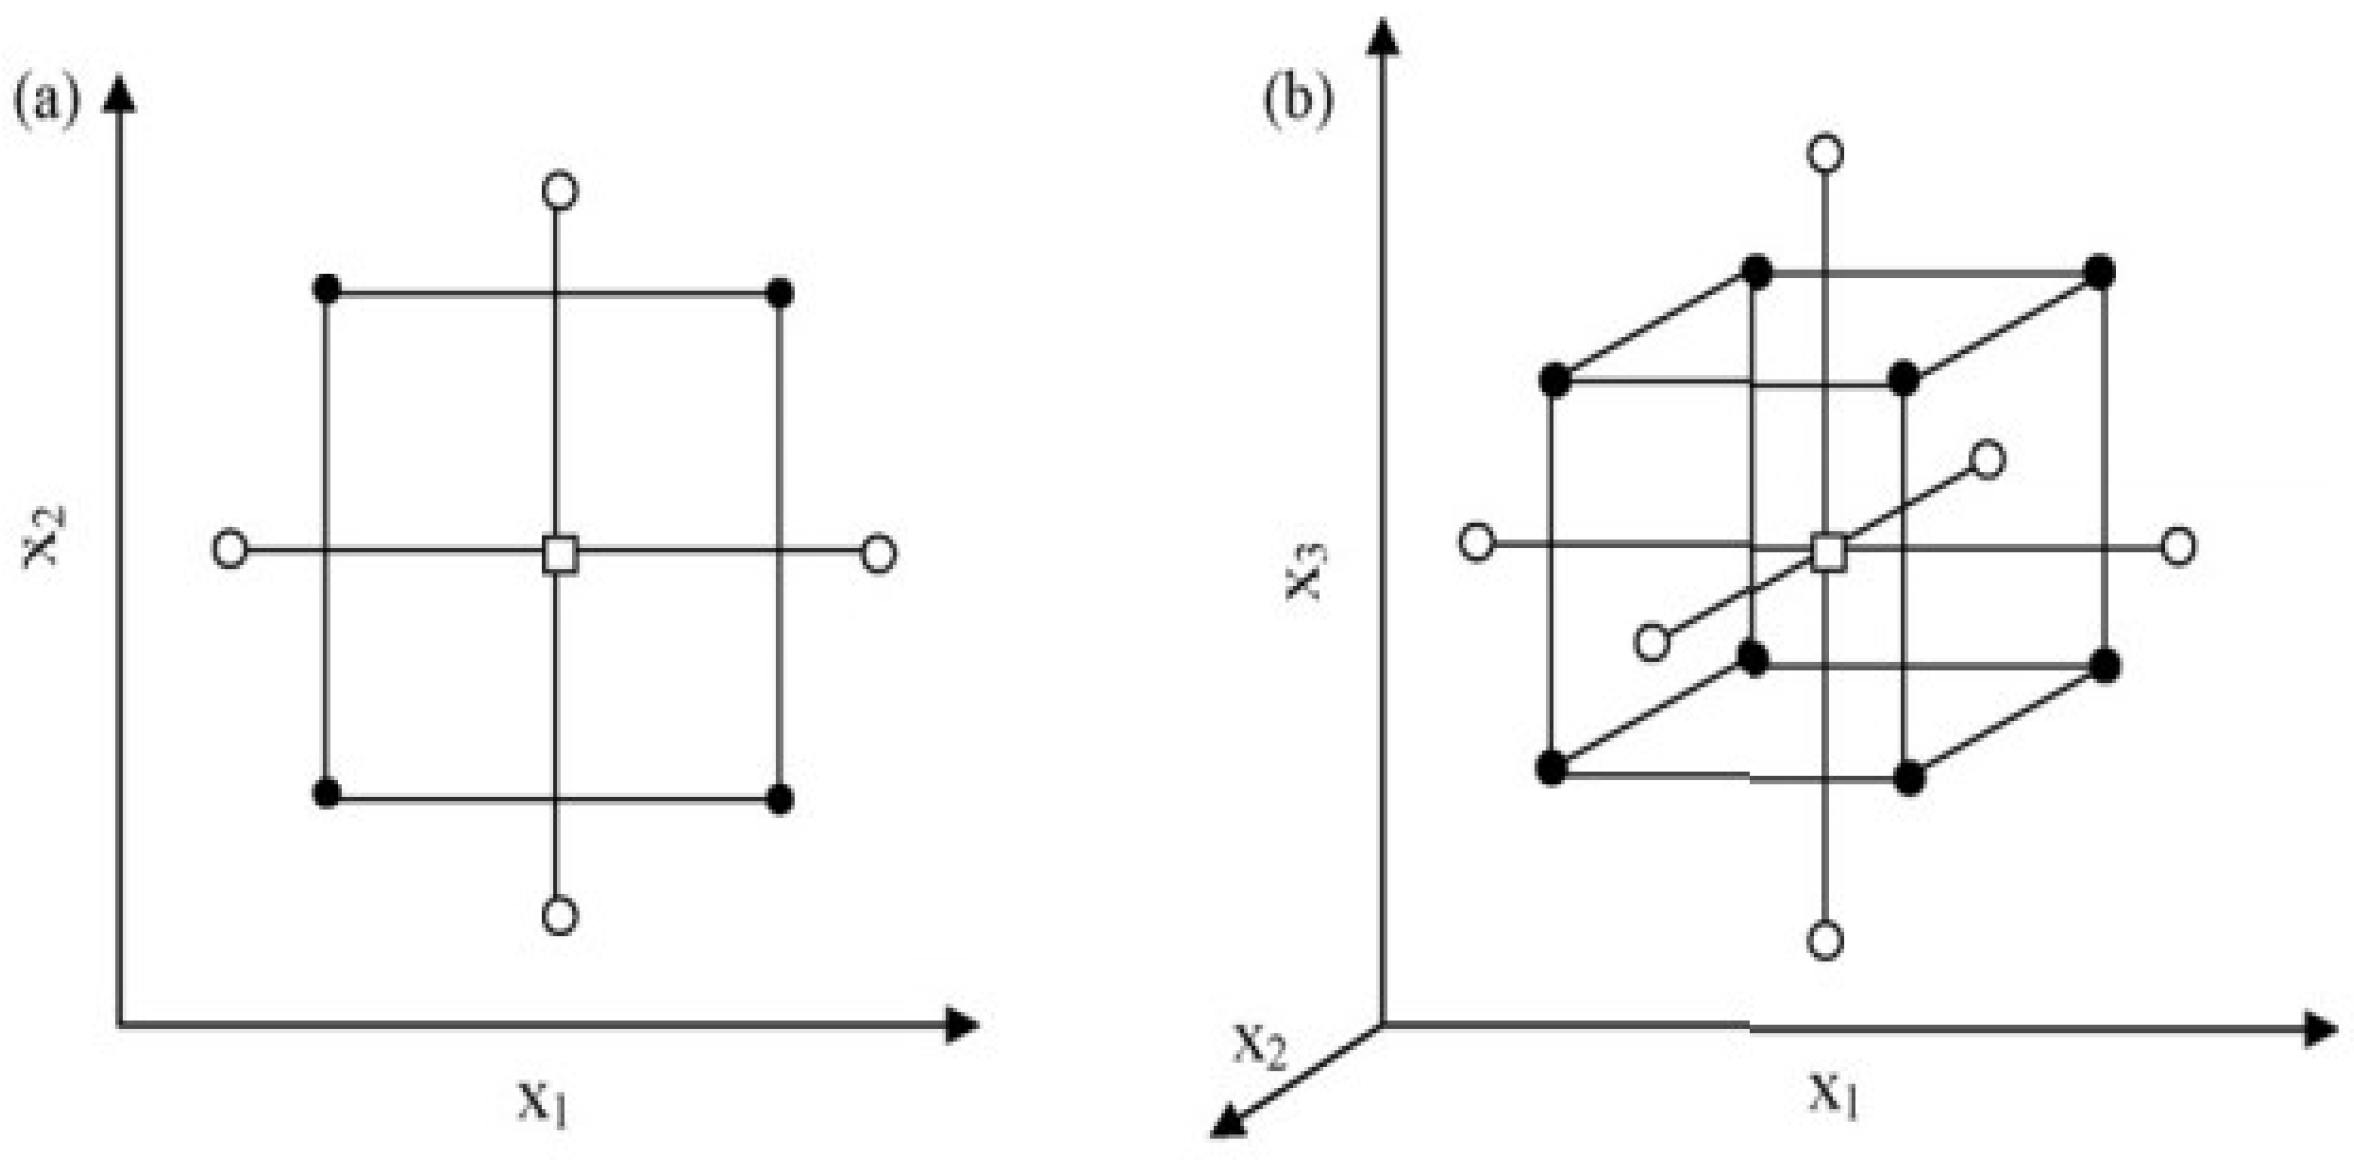
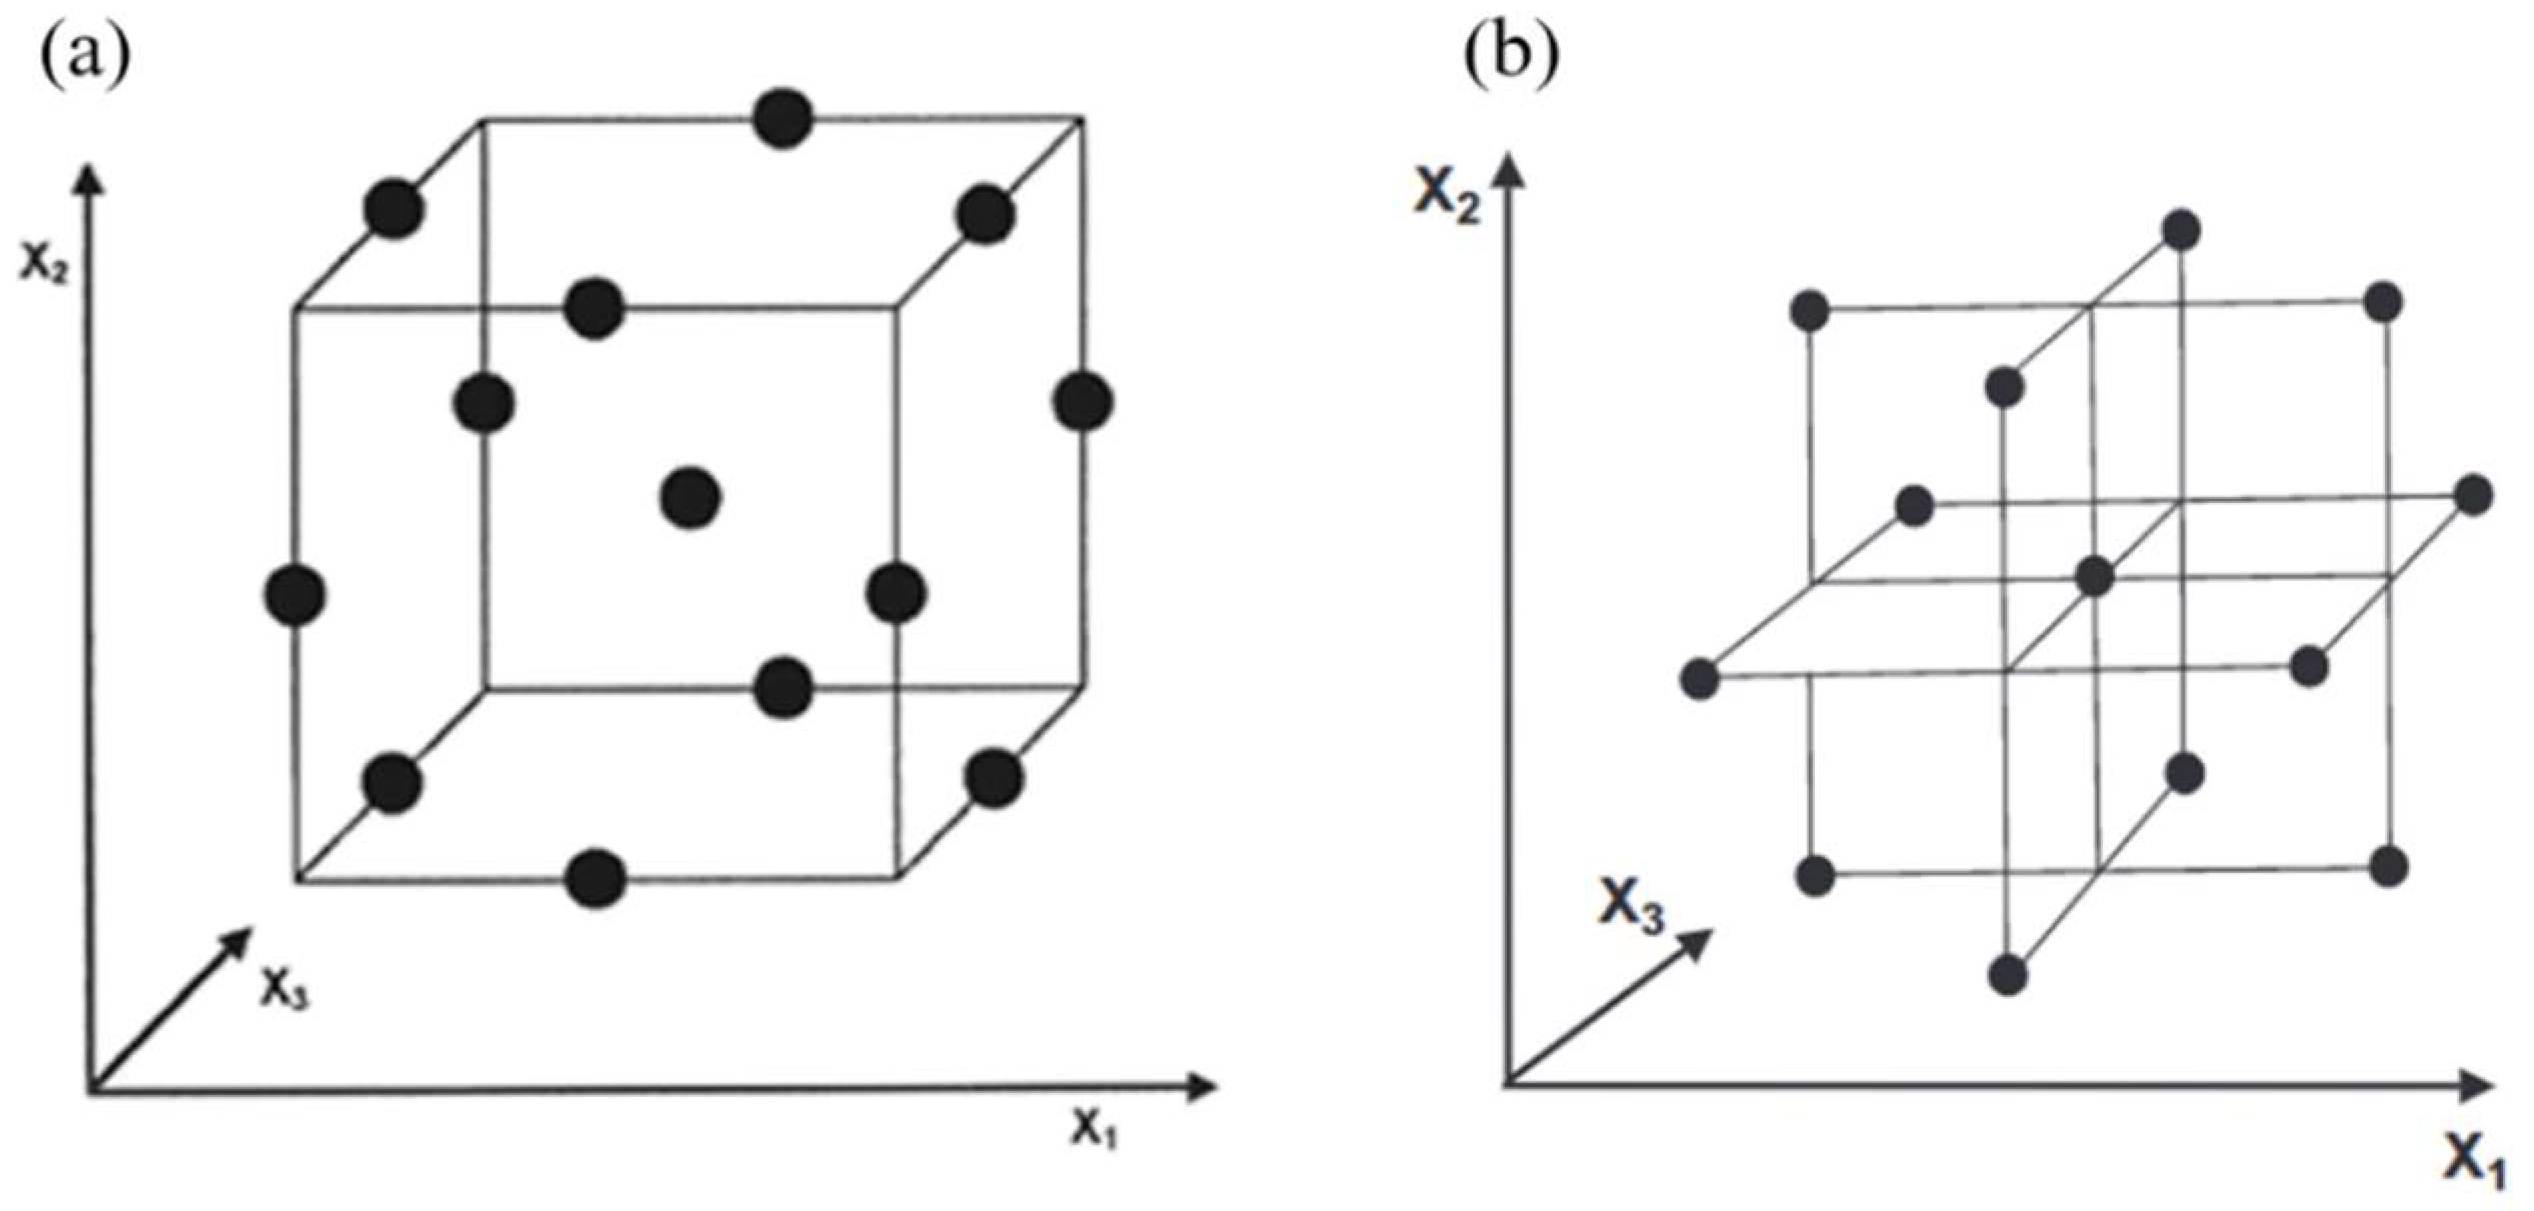
2. Optimization Methods

By literature review, key parameters of the bow design for added resistance were identified. Traditionally, a full parametric study was conducted for optimal bow design, but this process demanded a huge amount of computational time and resources. To overcome this issue, the fractional factorial design method was used to select some combinations of the design parameters associated with DOE and determine the influence of the design parameters on the goal, added resistance reduction.
In the present study, the response surface method (RSM) and fractional factorial design method were adopted to find the optimal point of the previously selected parameters. RSM is a type of DOE; it obtains regression functions that represent outputs by combining the inputs that are adequately planned as part of DOE. RSM also finds the optimal value through using these functions to reduce the number of tests or analyses. Among various RSMs, the most widely used DOE technique is central composite design (CCD). CCD formed a virtual regular hexahedron, consisting of three parts: vertices, center points, and axial points, as shown in Figure 1.
Another technique of RSM analysis is Box-Behnken design (BBD). This method uses a secondary model as an efficient, three-level experimental design and performs the experiment under some experimental conditions under the three-level factorial method. BBD design requires an experiment number according to N = k 2 + k + c p , where k is the factor number and c p is the replicate number of the central point [12]. Viewed as a cube in Figure 2a, it consists of a central point and the middle points on the edges [12]. However, it can also be viewed as consisting of three interlocking 2 2 factorial designs and a central point, as shown in Figure 2b [12]. It has been applied for optimization of several chemical and physical processes as well [12]. The biggest difference from the central composite design is that the tests are performed at 22 (±1, ±1) levels with two vertices, and the remaining variables are fixed at zero, the center of the level. As the BBD often have fewer design points than central composite design, they are less expensive than implementing a central composite design with the same number of factors. However, it is not suitable for sequential experiments because it does not include intrinsic factor design. Figure 2 shows a Box–Behnken design with three variables.

3. Design Parameter Variation

Key parameters that affect the added resistance in waves was selected by reviewing previous studies on added resistance of ship hulls. Matsumoto [13] reported that the added resistance in waves was reduced by 20–30% on a bulk carrier with Ax-bow geometry. In the study of Hirota et al. [6], it was shown that the added resistance of the bulk carrier was reduced by 19% with Leadge-bow, with similar design approach to that of Matsumoto [13]. From previous studies, it was revealed that the bluntness of the bow takes an essential role in added resistance reduction. The bow bluntness was controlled by five design parameters in the present study: design waterline length (DWL), bulbous bow height (BBH), bow entrance angle (BEA), bulbous bow volume (BBV), and bow flare angle (BFA). The design parameters are selected among the important factors to consider in the initial design of bow shape for a tanker, based on of the authors’ field experiences. Certainly, an exceedingly sharp bow may reduce the added resistance significantly, but it also reduces the freight capability, the most important design parameter of the ship. Table 1 shows the range of five design parameter variation of the tanker used in the present study. The range of five design parameters was selected and did not disturb the mooring arrangement and reduce the freight load of the ship. The displacement change by the design parameter variations was within 0.1%, and it changes the bow geometry only. As the cargo hold size is not affected by the design modification of the bow, the freight capacity of the ship is irrelevant to the bow design variation.
The bow shape changes by the parameter variation are shown in Figure 3. DWL is defined as the length where the ship is designed to float. The upper limit of DWL was 6m from the end of the original bulb. The range of BBH was selected within 1.5 m, making the bulbous bow not to pierce the water surface. BEA is the angle at the end of the design water line. BEA was reduced to 45° from the original design (75°). BBV is defined as the ratio of the cross-sectional area to that of the midship. BFA is the only design parameter that changes the bow geometry over the calm water surface.

4. Design Parameter Variation

Computational Method

STAR-CCM+, the commercial CFD software was used in the present study. The numerical analysis program dealt with unsteady, incompressible, and two-phase flow. The governing equations of the numerical methods for the present study are the continuity and Reynolds-averaged Navier–Stokes equation for the mass and momentum conservation, respectively. For the two-phase flow analysis, the volume of fluid method was utilized, as follows.
u ¯ i x i = 0
α t + x i ( α u ¯ i ) = 0
( ρ u ¯ i ) t + ( ρ u i u j ¯ ) x i = p ¯ x i + x j ( μ u ¯ i x j ρ u i u j ¯ )
where u ¯ i and p ¯ are time-averaged velocity and pressure. α, μ and ρ are volume fraction, dynamic viscosity and density of the fluid, respectively. For α = 0, the fluid is completely air, while α = 1 denotes the water. The Reynolds stress model was used to treat the Reynolds stress term, ρ u i u j ¯ , in the RANS equation. For the turbulence near the hull surface, the standard wall function was utilized. The governing equations are temporally discretized by an upwind scheme with second-order accuracy. For spatial discretization, the second-order central difference scheme is used for the velocity and turbulence properties. Pressure velocity coupling is implemented using SIMPLE, which stands for semi-implicit method for pressure-linked equations, algorithm [14].
The test model for design optimization is an Aframax tanker with 114 K dead weight tonnage. The principal particulars of the test model are shown in Table 2.
Figure 4 shows the computational domain and grid used for analysis. The Cartesian coordinate system is used for the computational domain. The streamwise, starboard, and upward direction is defined as x-, y-, and z-directions, respectively. The upstream and downstream boundaries of the computational domain are 0.7 LBP from the fore perpendicular of the hull and 2.0 LBP from the aft perpendicular, respectively. The side boundary of the domain is 1.0 LBP from the center of the hull.
For the cells near the hull surface, the trimmed cells with prism layers were used. The trimmed cells show an advantage of reducing the total number of cells by setting grids with high spatial resolution in flow region where complicated flow behavior is expected. The total number of the computational cells was approximately 3 million. The prism layer cells were used to improve the accuracy of boundary layer flow analysis, by applying five layers parallel to the hull surface.
In the present study, only one wave condition was selected, which is expected to be encountered most frequently in practical operations. The wave length, period and height in full scale are summarized in Table 3.
The wave period represents a short-wave condition where the wave length was half of LBP. During the computation, the surge motion of the hull in waves was fixed, while heave and pitch motion were set free. The dynamic fluid body interaction (DFBI) technique, provided by STAR CCM+ that allows fluid-structure interaction between a rigid body and flow around it, was used to enable the motions of the ship in waves. The regular waves were generated using the Euler overlay method (EOM), which blends the CFD solution and undisturbed wave solution. It is used to prevent the waves generated from the hull from reflecting on the boundary of the computational domain and returning to the ship. The EOM region was ranged from 0.2 LBP to 0.7 LBP from the fore perpendicular as shown in Figure 4.
For the time step of the unsteady computation, 0.02 s was applied. The total computation time was 90 s, approximately ten waves passed the ship model during the computation. Once the hull resistance fluctuation became regular and periodic after 60 s of the computation time, the average of the resistance till 90 s was acquired as the mean hull resistance in waves.

5. Results and Discussion

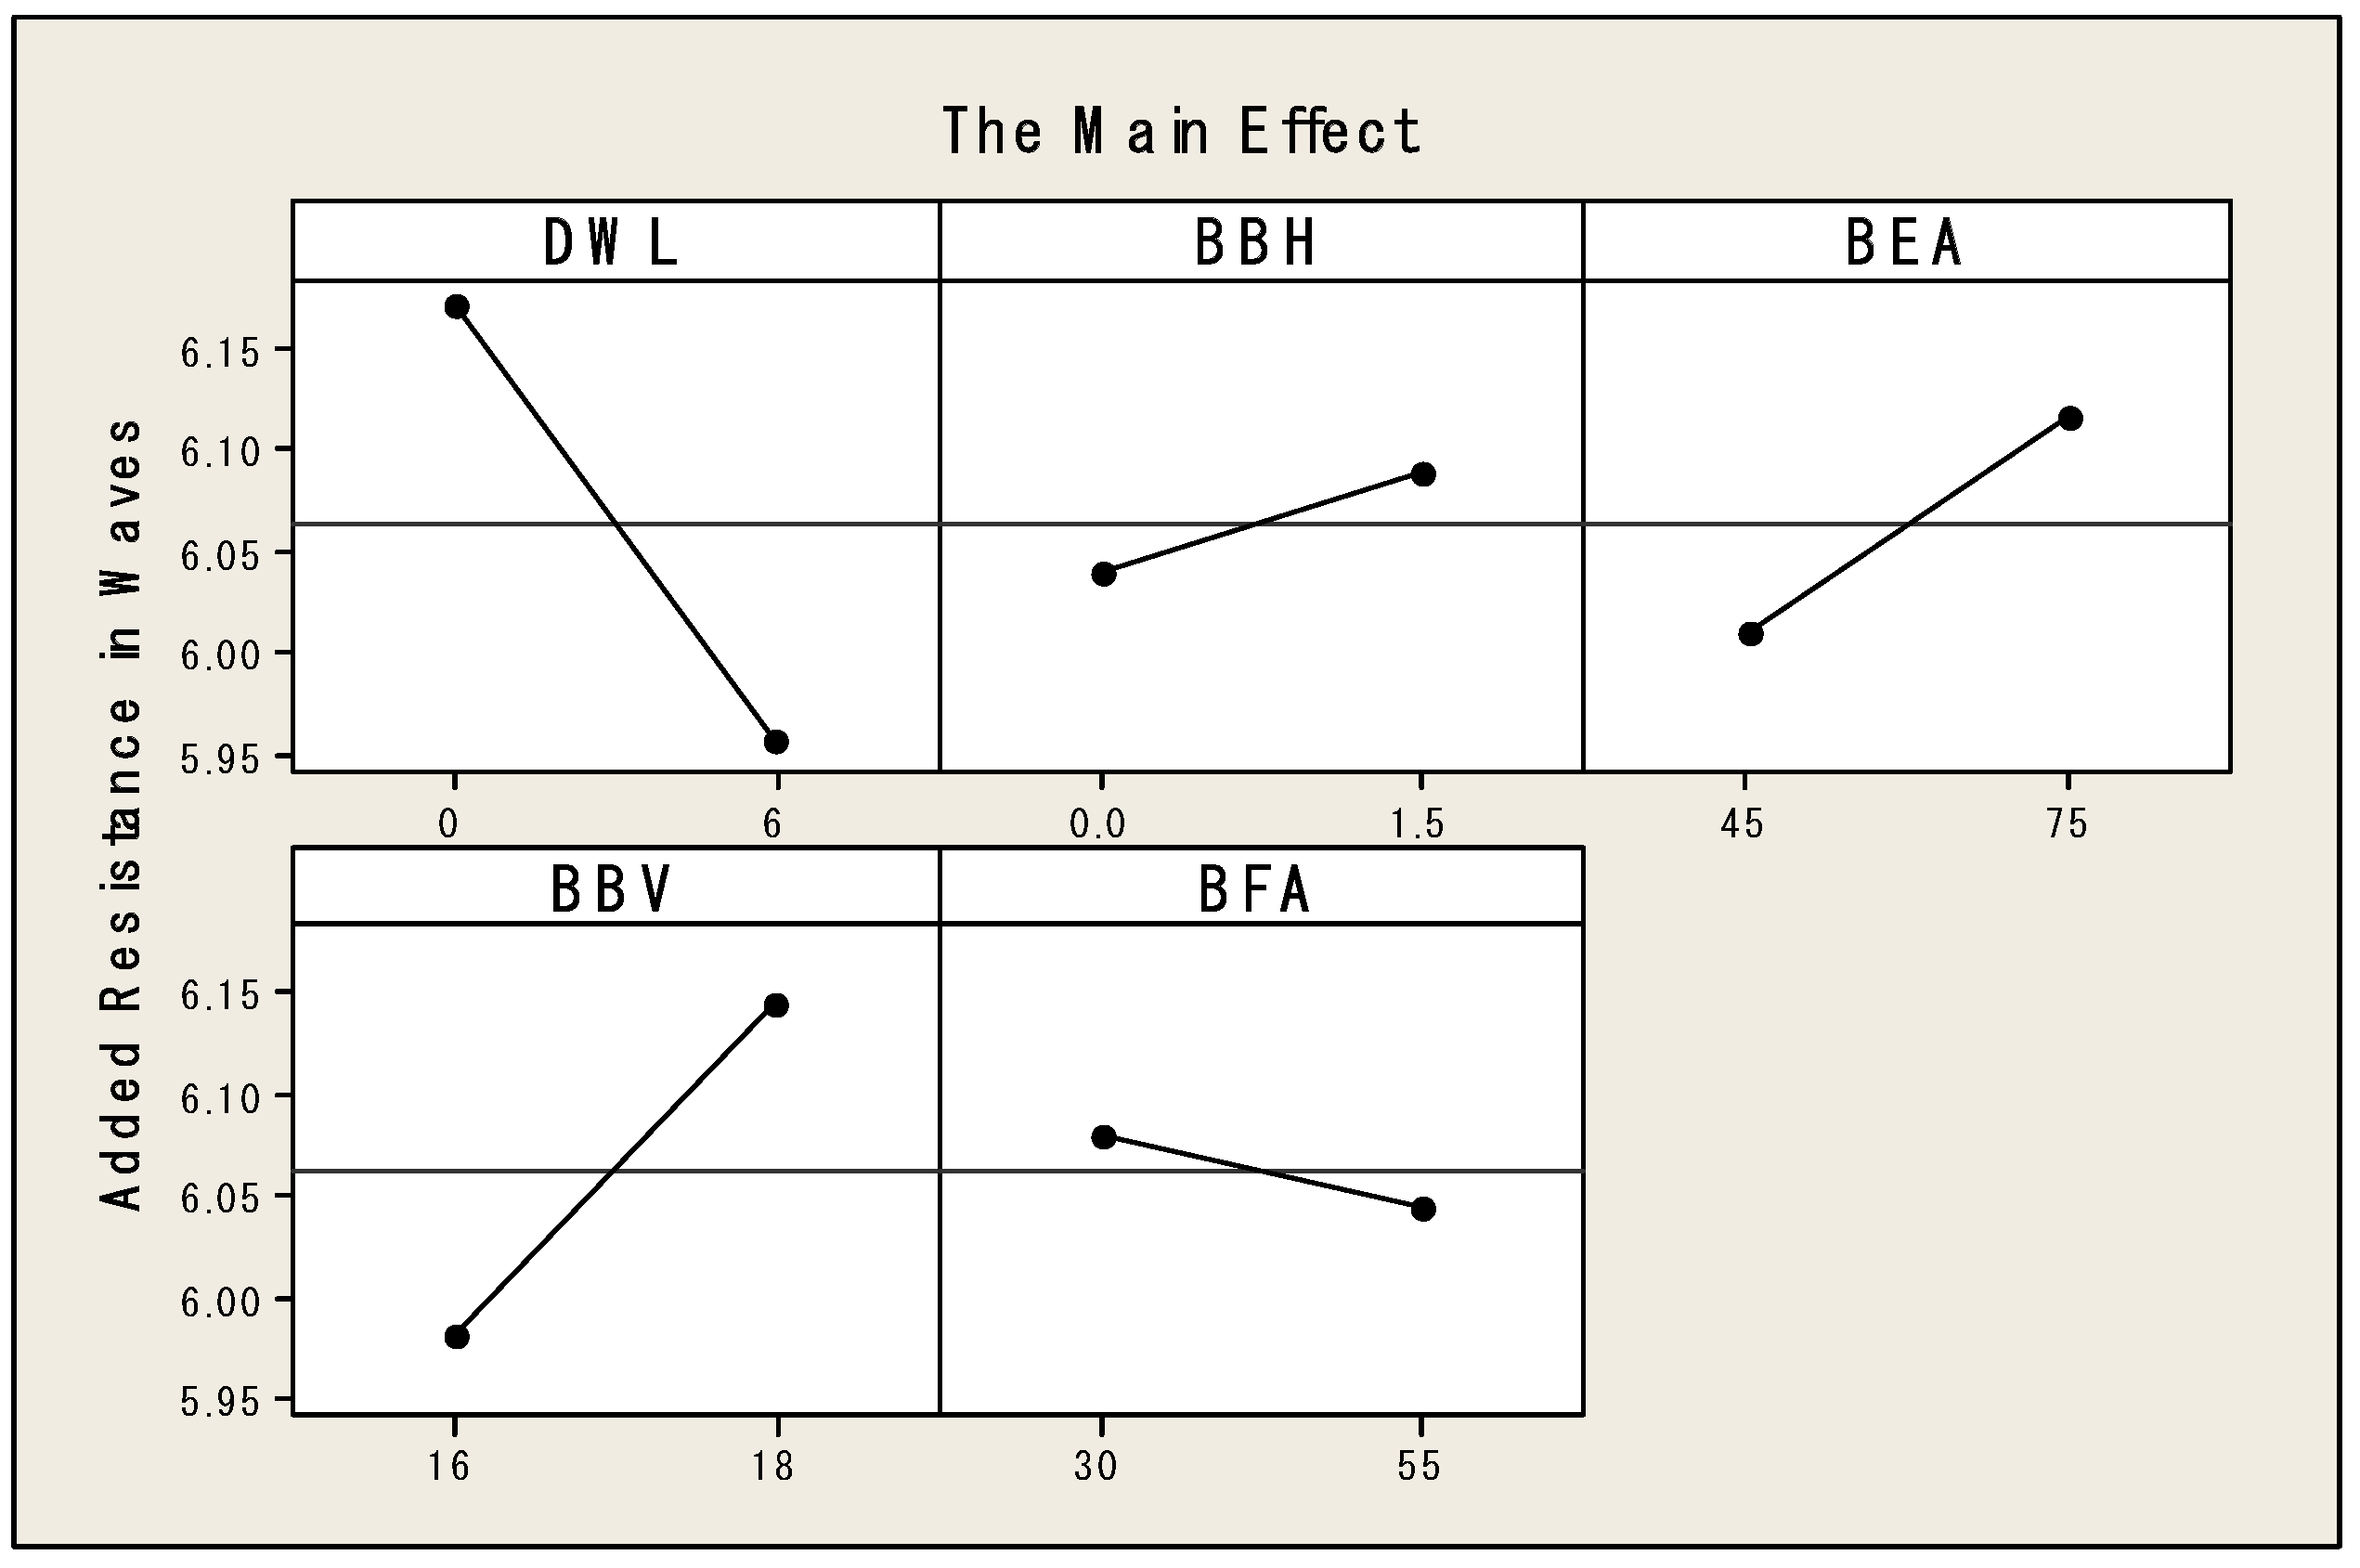
5.1. Effects of Design Parameter Variations

It is critical to select the least number of factors to produce the best outcome from the experiments. In the case of two levels and five factors which were determined for the minimization of added resistance in waves, there are 32 (=25) cases of test combinations. However, if there is no interest in high-order interactions, the effect of parameters can be studied in terms of time and cost using the fractional factorial design method from DOE. The fractional factorial design is often used in screening for determining the main parameters in the early stage of the experiment [15].
In this study, the 1/2 fractional factorial design was used to conduct the hull design and CFD analysis on 16 cases out of 32 cases. For detailed information on the fractional factorial design, it is best to refer to Mathews [16] on the application of DOE. Table 4 summarizes the results of comparing the values of added resistance in waves by conducting CFD analysis in the short waves for the 16 cases that are selected according to the 1/2 fractional factorial design. The deviation was defined as the difference of the raw resistance between the baseline hull and the hull variation.
Figure 5 shows the hull pressure contours of two cases with large amount of change based on the CFD results summarized in Table 4. CASE 1 is a combination of smaller BEA and BBV in comparison with those in CASE 6. Accordingly, the reflected waves near the bow seem to be spreading out to both sides. Therefore, the height of the waves near the bow is also low. This led to a reduction in resistance due to the reflected waves near the bow, resulting in improved added resistance in waves.
Based on the results of CFD, the main parameters among the five bow hull design parameters that have significant effects on the added resistance in waves were identified using Minitab, a commercial statistical analysis program. In addition, the two-way interaction between each parameter was also analyzed.
Figure 6 shows the added resistance results with the main parameter variations. A linear relationship between the added resistance and the parameters is assumed at the beginning of the analysis. The nonlinear effects will be discussed with the RSM results in the coming section. Parameters with the relatively greater slope of the line seemed to be the design parameters that have a significant influence on the added resistance. Therefore, it was confirmed that DWL, BBV, and BEA were the main design factors. This shows that increasing DWL and decreasing BEA and BBV is a design direction that reduces added resistance, which is consistent with the CFD results shown before. On the other hand, BBH and BFA had little effects on the added resistance in waves.
In Figure 7, the level of interaction among the five design parameters was compared. Of each combination of design factors, the more parallel red and black lines mean that there is no interaction between the factors. The combinations that have two-way interaction with added resistance in waves are DWL–BFA, DWL–BEA, DWL–BBV, and BBH–BBV. The combination that has the most significant effect on the result of added resistance among the four combinations with interaction is DWL–BFA.
In this case, the design direction must be set to decrease BFA when DWL increases and vice versa to reduce the added resistance. BFA was the design parameter with a less significant effect on the added resistance compared to other parameters. However, based on the result of the two-way interaction review, it seems to have a significant effect on added resistance when it changes with DWL. This means that the flare angle around the incident wave changes along with the change in the length of the design water line, and this shape change affects the reflected waves of the bow. Thus, in the next section, bow shape optimization will be performed by including BFA.

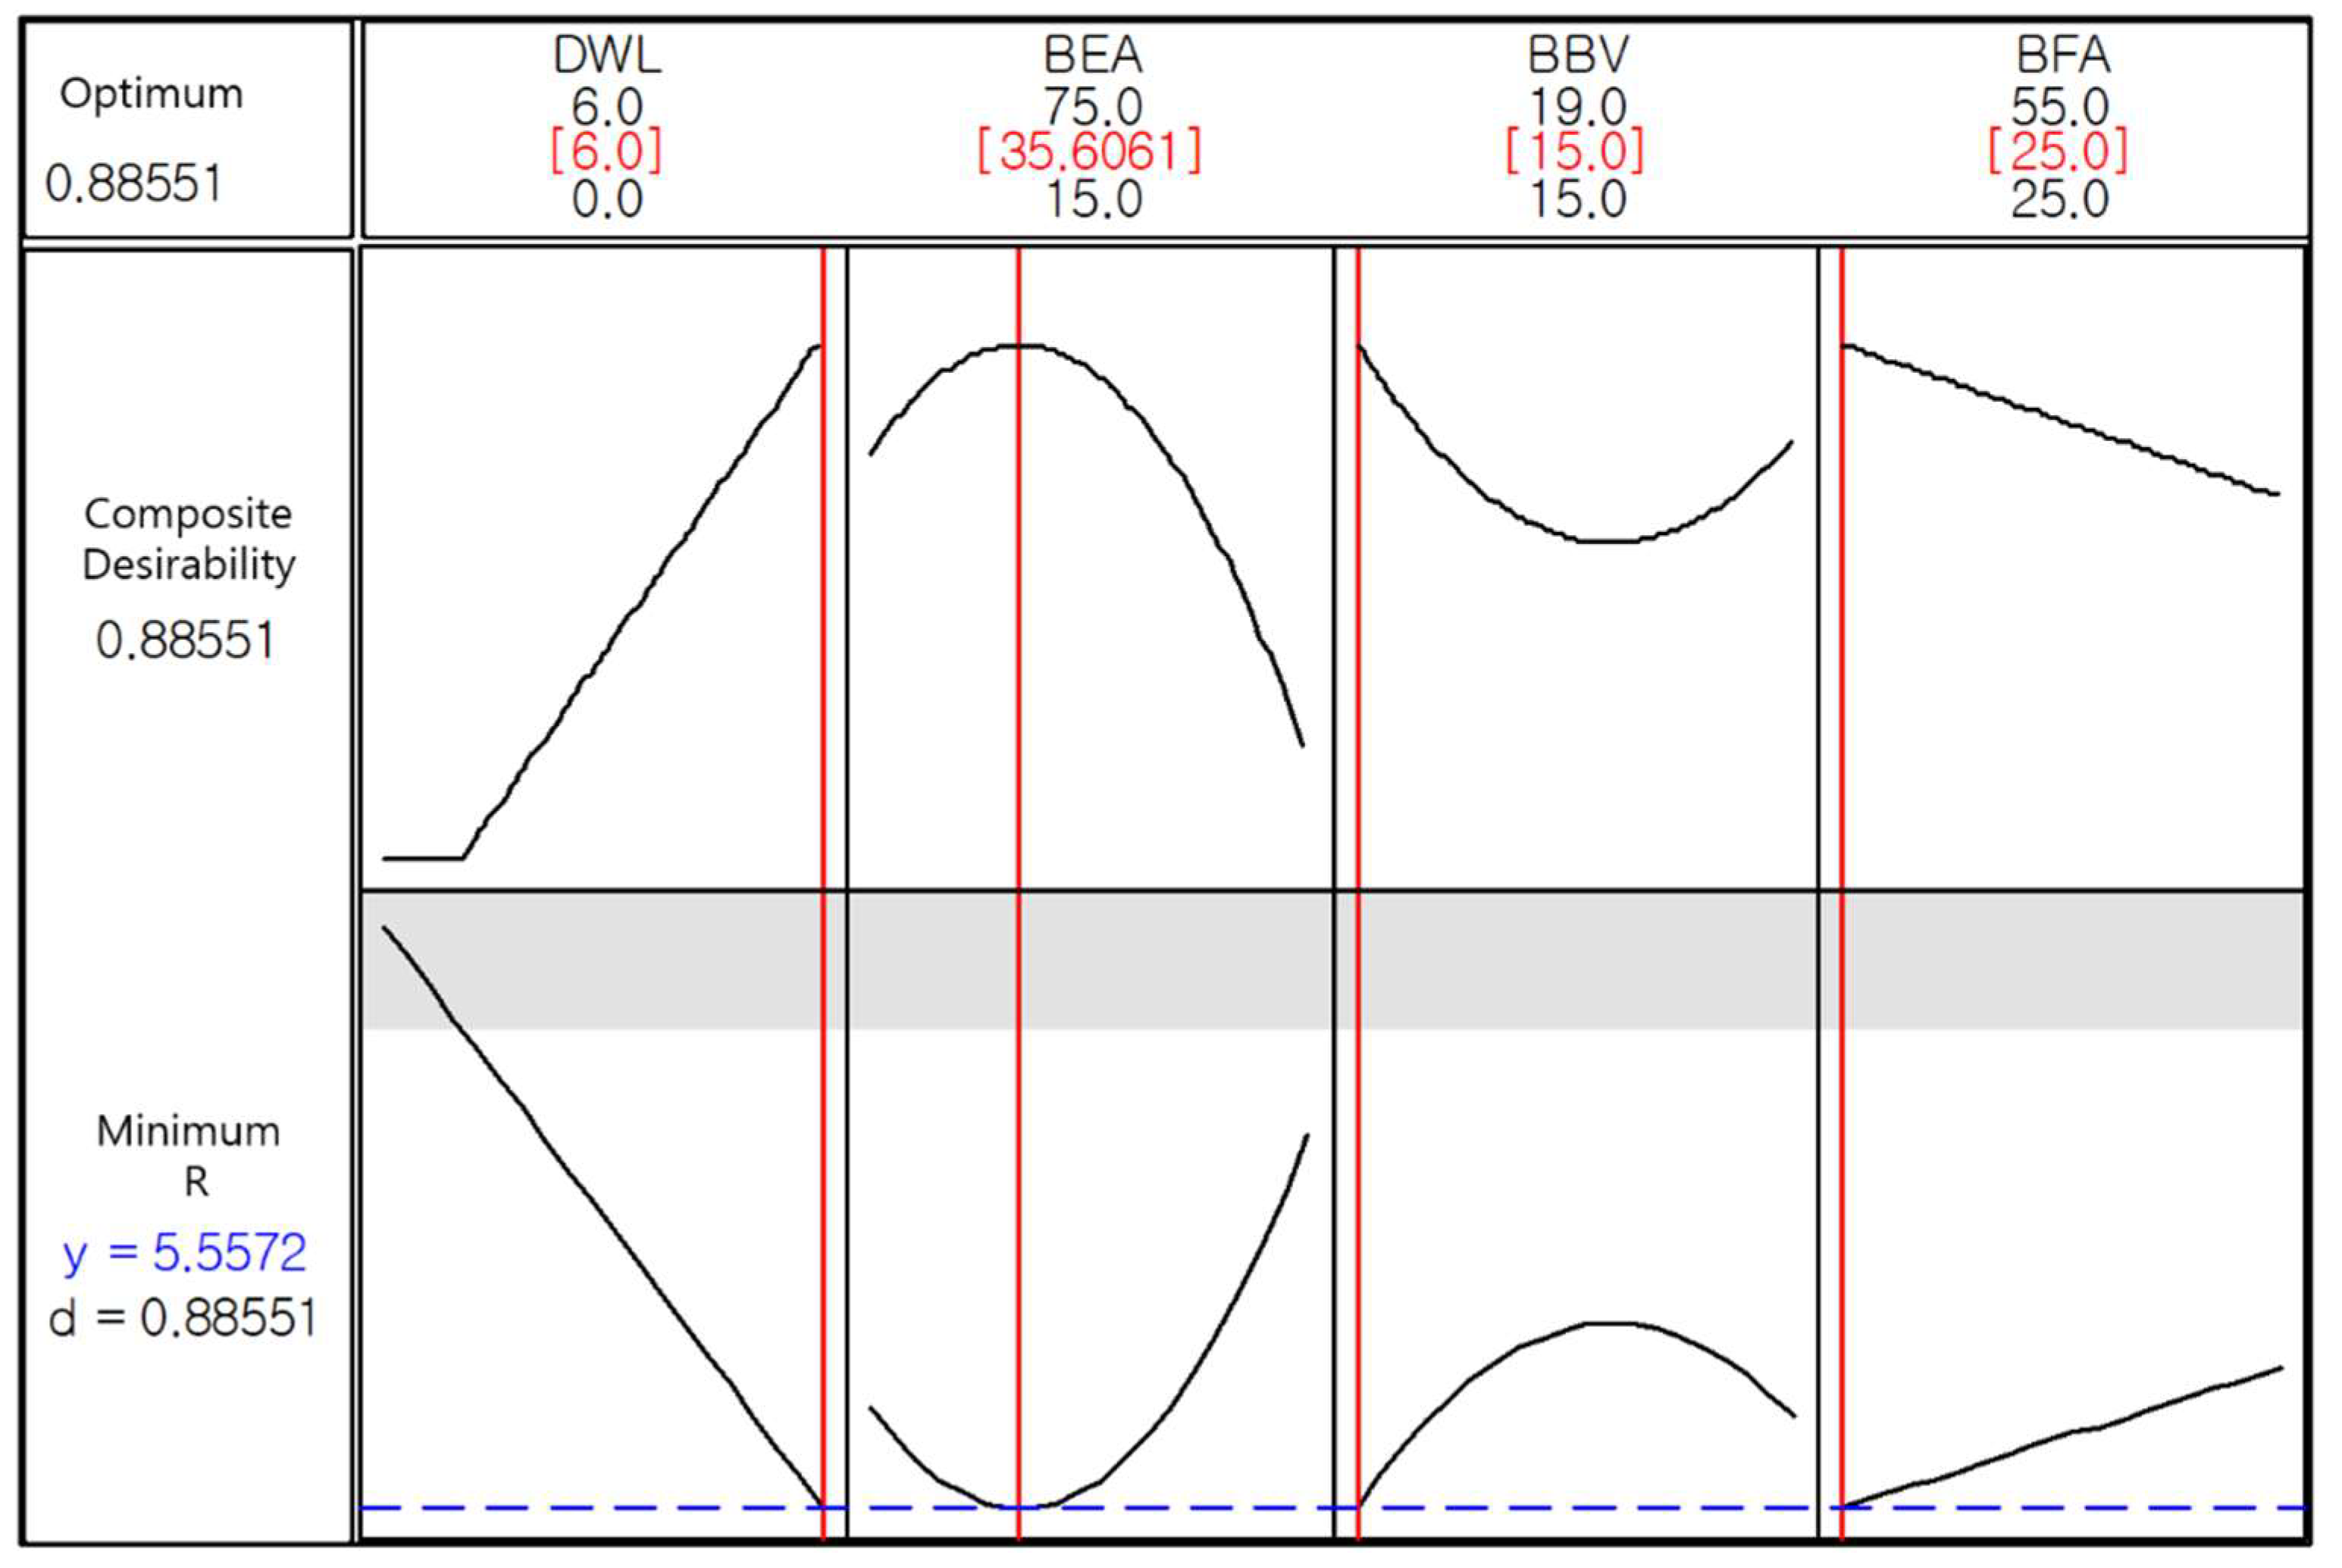
5.2. Bow Shape Optimization

Bow shape optimization was performed using RSM [16] on DWL, BBV, BEA, and BFA selected in Section 5.1 among the various bow design parameters that affect the added resistance in waves. These parameters were confirmed through the 1/2 fractional factorial design. Three levels were chosen from the range of the design parameter variation, as shown in Table 5. Based on the two-factor interaction effect shown in Figure 7, notable combinations were selected, and the design parameter range was expanded from Table 1.
Thirty cases of the bow shapes derived with RSM were designed, CFD analyses were performed for the designed bow shape variations in the short waves. Analysis of variance was performed to derive the RSM. During the process, the terms that are not significant to the added resistance in waves were eliminated and analysis of variance was repeatedly performed.
The final RSM is as follows.
( RSM ) = 6.3607 0.08197 × ( DWL ) 0.0282 × ( BEA ) + 0.051889 × ( BBV ) 0.05294 × ( BFA ) + 0.000425 × ( BFA ) 2 + 0.0005 × ( DWL ) × ( BEA ) 0.00625 × ( DWL ) × ( BBV ) + 0.003003 × ( DWL ) × ( BFA ) + 0.000127 × ( BEA ) × ( BFA )
Using the RSM, the response surface of two design parameters when DWL = 6, BEA = 15, BBV = 15, and BFA = 25 are shown in Figure 8. It is possible to identify the optimum set of each design parameter which produces the minimum added resistance, R. However, since it is difficult to evaluate the level of optimization only with the response surface, as shown in Figure 8, the optimization tool provided by Minitab was used to check the values of each design parameter.
The composite desirability (D) in Figure 9 represents the extent to which the corresponding setting optimizes various response parameters in general. The range of desirability is from 0 to 1. 1 indicates the ideal case and 0 indicates that more than one response exceeds the allowable limit. The D value of 0.88551 in Figure 9 is close to 1, which means the range of parameters show a generally satisfactory result for four hull bow design parameters.
As a result, the added resistance in waves was the lowest when DWL = 6, BEA = 35.6, BBV = 15, and BFA = 25 were within the design range and the added resistance value of the design was 5.5572 N. To find the validity of the values derived from the response surface model, the hull design at the optimal point was conducted and compared with the CFD result. The reduction of the added resistance confirmed by CFD analysis was 8%. The shapes of the two bows were compared and shown in Figure 10. The result of the added resistance derived from the response surface model showed about 1.2% difference from the CFD result, which is an insignificant difference. It implies that RSM used in the present study is reliable for predicting the added resistance with bow design variation.
To investigate the cause of the added resistance reduction of the optimal bow in waves, the waveforms of the two bows by CFD analysis were compared, as shown in Figure 11. It is shown that the reflected waves around the conventional bow spread in the forward direction, but the reflected waves of the optimum bow are smoothly spread, showing the decrease in total energy consumed by the reflected waves. This shows that the optimum bow is better in terms of added resistance performance in waves.

6. Conclusions

In this study, a hull form design technique was developed with an aim to reduce the added resistance in waves using DOE and CFD. The process of selecting the main bow shape design parameters and finding the optimal value were applied to a 114K DWT Aframax tanker. Our conclusions are summarized as follows:
  • It was possible to systematically and effectively determine the main design parameters and interactions between each of the design parameters using DOE for performing hull optimization to reduce the added resistance in waves.
  • The single parameters that have a significant effect on the added resistance among the five bow shape design parameters of the ship were DWL, BBV, and BEA; the two-way interaction was predominant in BWL–BFA.
  • To verify whether the added resistance value estimated from the response surface module is valid, it was compared with the CFD analysis results of the same condition, through which the validity of the results derived from the response surface model was confirmed.
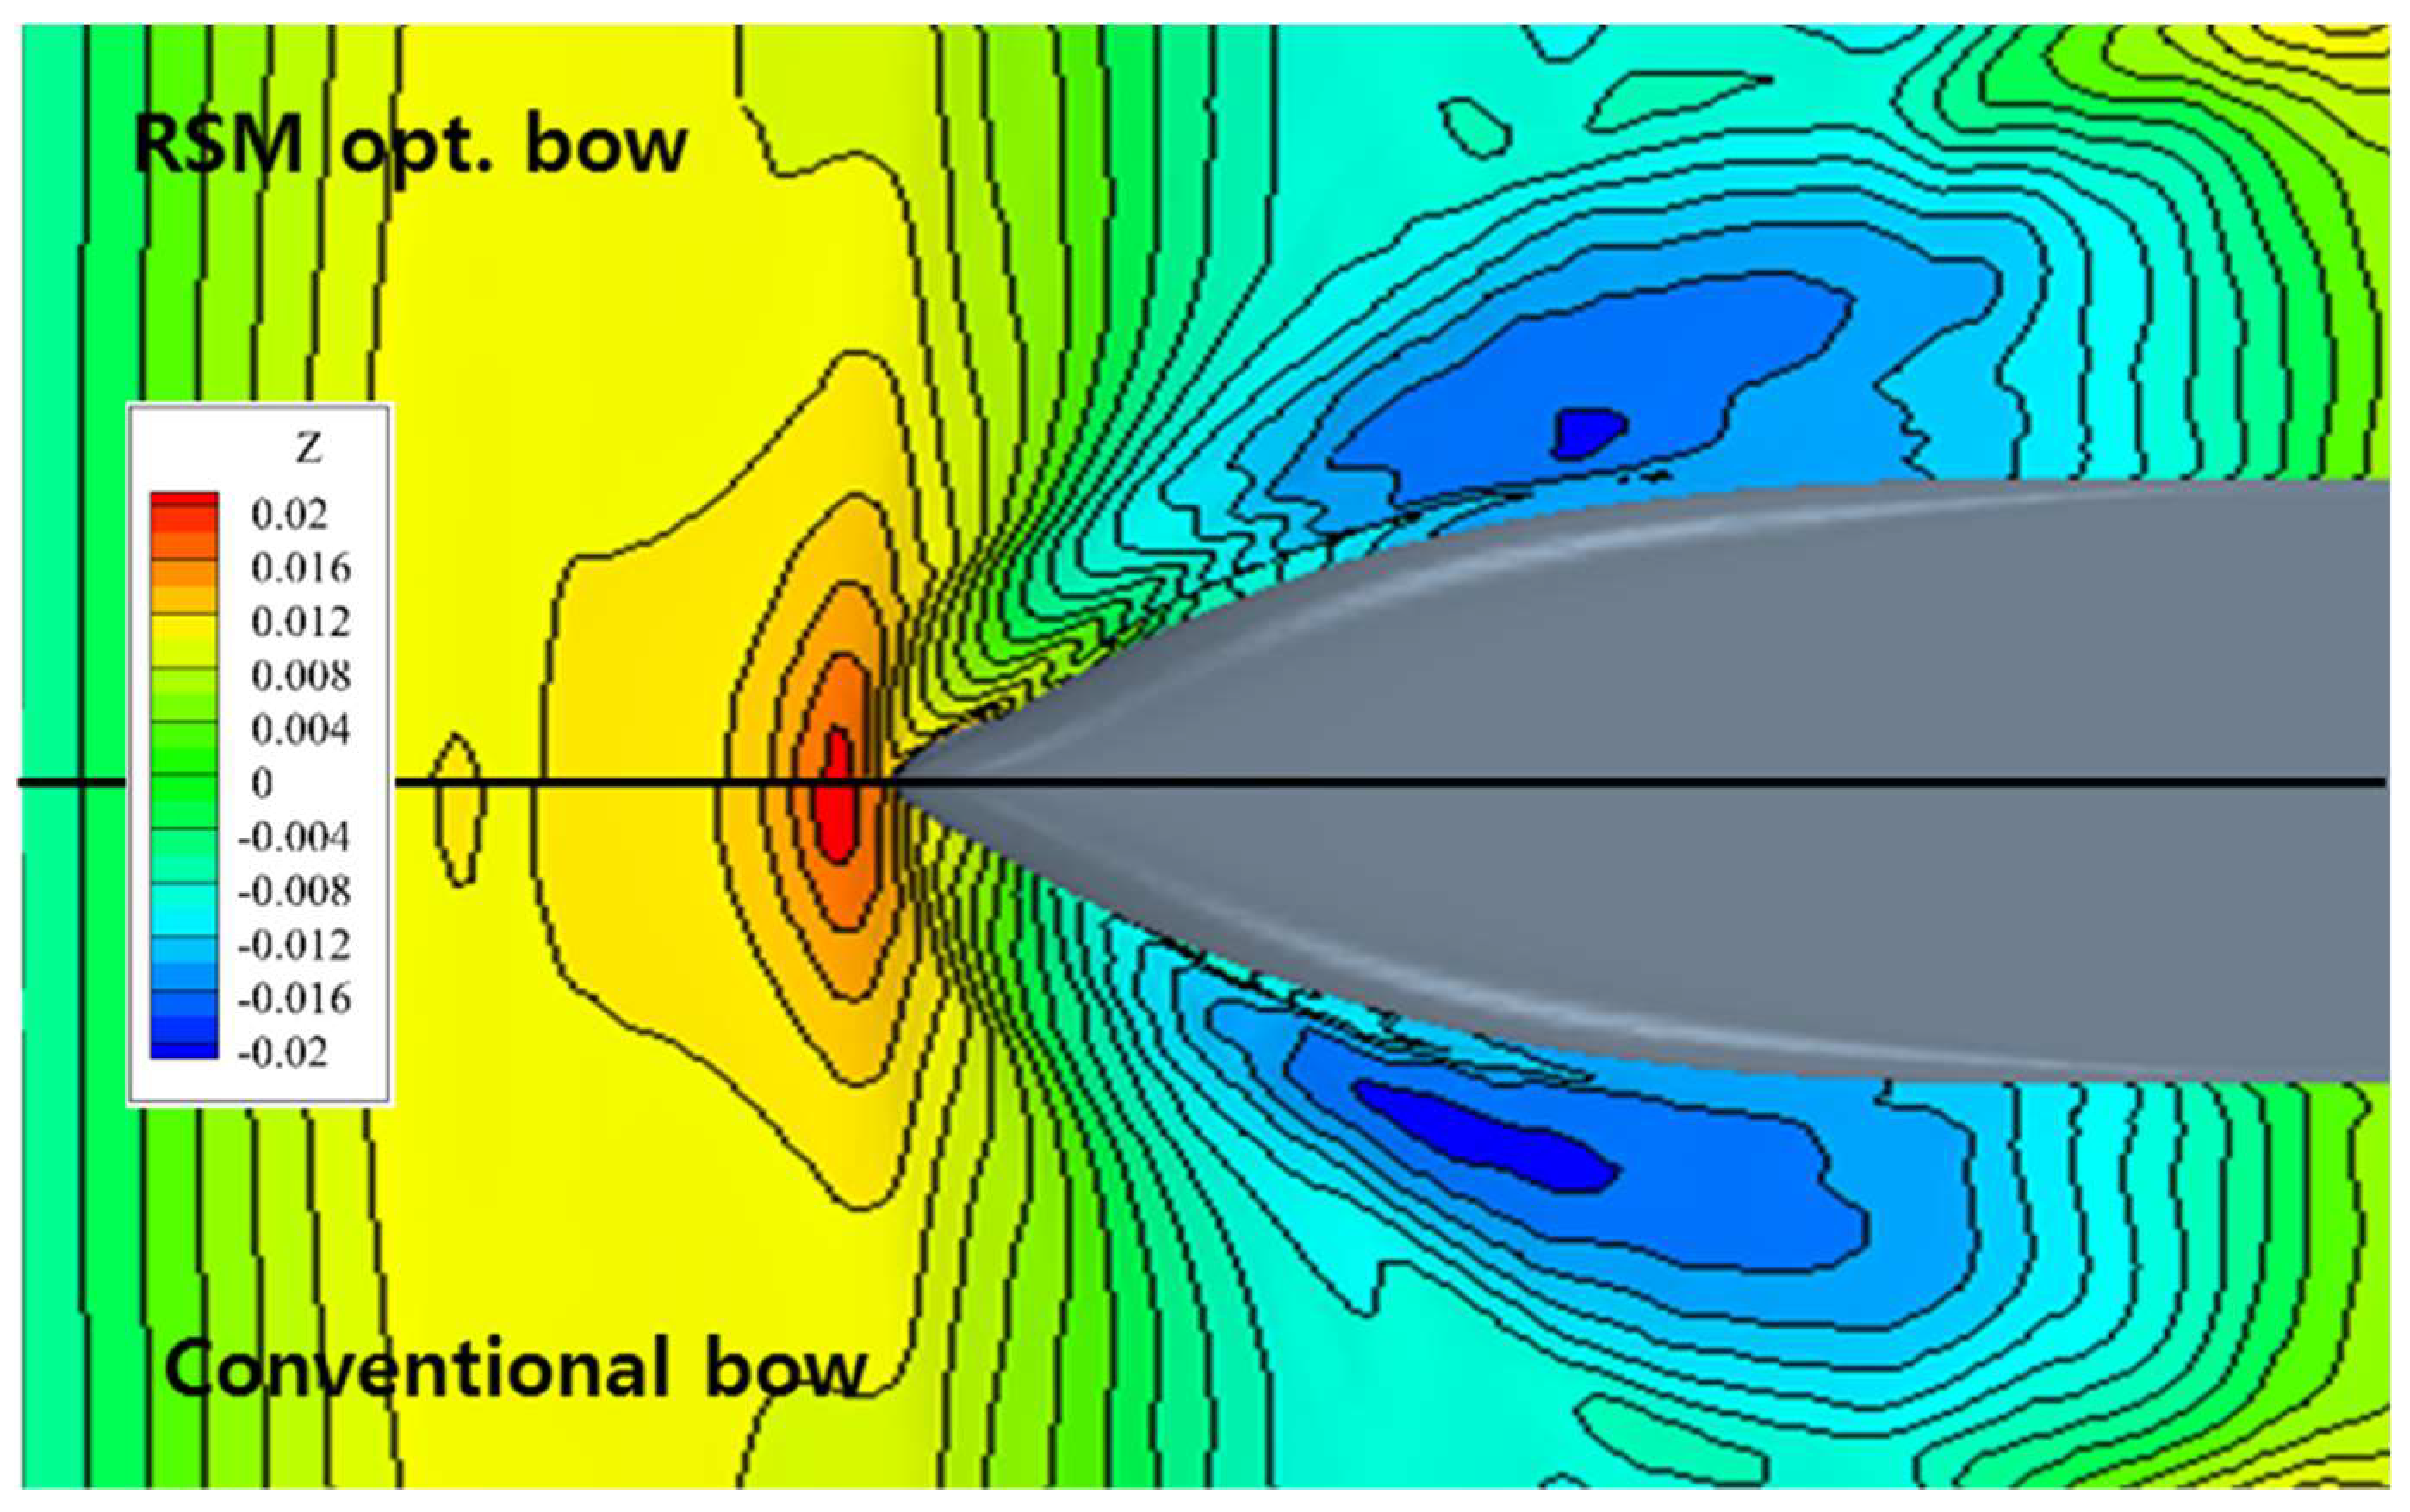
  • Through the CFD analysis on the optimum hull, it was possible to confirm the reduction of added resistance by the reflected wave around the bow smoothly spread to the side.
The results of correlation between the hull design parameters and added resistance in waves using DOE are expected to be used as basic data for future research on hull form optimization for reduction of the added resistance in waves. The optimization method will be applied to the ship design, and sampling-based uncertainty quantification will be performed through the verification process based on the model test. After ensuring sufficient reliability, this method will be applied to ship design at full scale. In the end, it is expected that the design cost and time can be saved and respond quickly to the ship owner’s requirements.

Author Contributions

Conceptualization, G.H.K. and S.H.R.; methodology, W.S. and G.H.K.; investigation, W.S. and J.S.; writing—original draft preparation, W.S.; supervision, S.H.R.

Funding

This research was supported by the National Research Foundation of Korea (Grant Nos. 2016R1DsA1A09917670 and 2018R1A6A3A11049664) and National Research Council of Science & Technology (CMP-16-03-KISTI).

Conflicts of Interest

The authors declare no conflict of interest.

References

  1. Vladimir, N.; Ancic, I.; Sestan, A. Effect of ship size on EEDI requirements for large container ships. J. Mar. Sci. Technol. 2018, 23, 42–51. [Google Scholar] [CrossRef]
  2. Ancic, I.; Theotokatos, G.; Vladimir, N. Towards improving energy efficiency regulations of bulk carriers. Ocean Eng. 2018, 148, 193–201. [Google Scholar] [CrossRef] [Green Version]
  3. El Moctar, O.; Oberhagemann, J.; Schellin, T.E. Free surface RANS method for hull girder springing and whipping. In Proceedings of the SNAME Annual Meeting, Houston, TX, USA, 16–18 November 2011. No. A56. [Google Scholar]
  4. Simonsen, C.D.; Otzen, J.F.; Joncquez, S.; Stern, F. EFD and CFD of KCS heaving and pitching in regular head waves. J. Mar. Sci. Technol. 2013, 18, 435–459. [Google Scholar] [CrossRef]
  5. Kim, J.-H.; Choi, J.-E.; Choi, B.-J.; Chung, S.-H.; Seo, H.-W. Development of energy-saving devices for a full-slow-speed ship through improving propulsion performance. Int. J. Nav. Arch. Ocean Eng. 2015, 7, 390–398. [Google Scholar] [CrossRef]
  6. Hirota, K.; Matsumoto, K.; Takagishi, K.; Yamasaki, K.; Orihara, H.; Yoshida, H. Development of bow shape to reduce the added resistance due to waves and verification of full scale measurement. In Proceedings of the First International Conference on Marine Research and Transportation, Ischia, Italy, 19–21 September 2005. [Google Scholar]
  7. Kim, Y.-C.; Kim, K.-S.; Kim, J.; Kim, Y.; Park, I.-R.; Jang, Y.-H. Analysis of added resistance and seakeeping responses in head sea conditions for low-speed full ships using URANS approach. Int. J. Nav. Arch. Ocean Eng. 2017, 9, 641–654. [Google Scholar] [CrossRef]
  8. Sudarsanam, N.; Ravindran, B. Using linear stochastic bandits to extend traditional offline designed experiments to online settings. Comput. Ind. Eng. 2018, 115, 471–485. [Google Scholar] [CrossRef]
  9. Galvanin, F.; Marchesini, R.; Barolo, M.; Bezzo, F.; Fidaleo, M. Optimal design of experiments for parameter identification in electrodialysis models. Chem. Eng. Res. Des. 2016, 105, 107–119. [Google Scholar] [CrossRef]
  10. Im, S.S. Design and Manufacturing Technique of Energy Saving Subsidiary Propulsion Device for Eco-friendly High Efficient Container Ships. Ph.D. Thesis, Department of Mechanical Engineering, Pusan National University, Busan, Korea, 2014. [Google Scholar]
  11. Seo, G.H.; Kim, H.C. A study on the appendages optimization of a high speed semi-planing monohull using DOE. J. Soc. Nav. Arch. Korea 2014, 51, 184–192. [Google Scholar] [CrossRef]
  12. Souza, A.S.; dos Santosm, W.N.; Sergio Ferreira, L.C. Application of Box-Behnken design in the optimization of an on-line pre-concentration system using knotted reactor for cadmium determination by flame atomic absorption spectrometry. Spectrochim. Acta Part B 2005, 60, 737–742. [Google Scholar] [CrossRef]
  13. Matsumoto, K. Ax-Bow: A new energy-saving bow shape at sea. NKK Tech. Rev. 2002, 86, 46–47. [Google Scholar]
  14. Oh, S.Y.; Kim, S.-C.; Lee, D.-W.; Kim, S.; Ahn, S.K. Magnus measurements of spin-stabilized projectile using design of experiments. In Proceedings of the AIAA Atmospheric Flight Mechanics Conference, Chicago, IL, USA, 10–13 August 2009. [Google Scholar]
  15. Ferziger, J.H.; Peric, M. Computational Methods for Fluid Dynamics; Springer Science & Business Media: Berlin, Germany, 2012. [Google Scholar]
  16. Mathews, P.G. Design of Experiments with MINITAB; ASQ Quality Press: Milwaukee, WI, USA, 2005. [Google Scholar]
Figure 1. Central composite design with variables: (a) Two variables; (b) three variables.
Jmse 07 00226 g001
Figure 2. Box-Behnken design. (a) The design as derived from a cube; (b) Representation as interlocking 2 2 factorial experiments (Adopted from Reference [12], have got the permission from Elsevier).
Jmse 07 00226 g002
Figure 3. Definition of design parameters.
Jmse 07 00226 g003
Figure 4. Computational domain around the hull: (a) Regular wave generation zone of which length is 0.7 L was located in front of the hull; (b) Grid near the hull surface and air-waver interface was refined.
Jmse 07 00226 g004
Figure 5. Comparison of hull pressure distribution in CASE 01 (Dev. = −5.3%) and CASE 06 (Dev. = 6.7%) in short waves (λ/L = 0.5). The hull surface pressure was non-dimensionalized by 0.5 ρV2.
Jmse 07 00226 g005
Figure 6. Comparison of added resistance in short waves (λ/L = 0.5) with single design parameter variations.
Jmse 07 00226 g006
Figure 7. Comparison of added resistance in short waves (λ/L = 0.5) with design parameter variation in two-way interaction.
Jmse 07 00226 g007
Figure 8. Response surface with design parameter variation. The baseline case is DWL = 6, BEA = 15, BBV = 15, BFA = 25: (a) BEA and BBV, (b) BEA and BFA, (c) BBV and BFA, (d) DWL and BEA, (e) DWL and BBV, (f) DWL and BFA.
Jmse 07 00226 g008
Figure 9. Optimum point acquisition by design parameter variation.
Jmse 07 00226 g009
Figure 10. Comparison of bow shape: (a) conventional bow of the baseline hull; (b) Optimum bow.
Jmse 07 00226 g010
Figure 11. Comparison of wave pattern in short waves (λ/L = 0.5).
Jmse 07 00226 g011
Table 1. Design parameters and level.
Design ParametersSymbolUnitLevel 1Level 2
Design Waterline LengthDWLm06
Bulbous Bow HeightBBHm01.5
Bow Entrance AngleBEA°4575
Bulbous Bow VolumeBBV%1618
Bow Flare AngleBFA°3055
Table 2. Principal particulars of the test model.
Principal ParticularsSymbolUnitFull ScaleModel Scale
Length overallLOAm2506.87
Length between perpendicularsLBPm2396.57
Beam m441.21
Design draft m13.60.374
Advance speed m/s7.4591.236
Table 3. Test condition in regular head waves.
Test ConditionSymbolUnitFull ScaleModel Scale
Wave length ratioλ/L 0.5
Wave height m4.00.110
Wave period s8.7481.45
Table 4. Resistance results by CFD analysis with bow design parameter variation.
Run No.DWL (m)BBH (m)BEA (m)BBV (m)BFA (m)Res. (N)Dev. (%)
CASE 100.04516555.720−5.3
CASE 2+60.07516555.932−1.8
CASE 3+6+1.54518305.949−1.5
CASE 4+60.07518305.908−2.2
CASE 50+1.57516556.054+0.2
CASE 600.07518556.446+6.7
CASE 70+1.54518556.007−0.6
CASE 800.04518306.339+4.9
CASE 9+6+1.57518556.071+0.5
CASE 10+60.04518556.024−0.3
CASE 1100.07516306.196+2.6
CASE 12+6+1.57516305.910−2.2
CASE 13+60.04516305.741−5.0
CASE 140+1.57518306.409+6.1
CASE 15+6+1.54516556.102+1.0
CASE 160+1.54516306.192+2.5
Table 5. Design parameter levels for optimization.
Design ParametersSymbolUnitLevel 1Level 2Level 3
Design waterline lengthDWLm036
Bow entrance angleBEA°154575
Bulbous bow volumeBBV%151719
Bow flare angleBFA°254055

