Article

Contribution of Infragravity Waves to Run-up and Overwash in the Pertuis Breton Embayment (France)

1
Hydraulic Engineering, Delft University of Technology, 2628 CN Delft, The Netherlands
2
UMR 7266 Littoral, Environment and Societies, CNRS-University of La Rochelle, 17000 La Rochelle, France
3
Water Science and Engineering, IHE-Delft Institute for Water Education, 2611 AX Delft, The Netherlands
4
Laboratory of Research in Geosciences and Energies, University of the French West Indies, 97157 Pointe-à-Pitre, Guadeloupe, France
*
Author to whom correspondence should be addressed.
J. Mar. Sci. Eng. 2019, 7(7), 205; https://doi.org/10.3390/jmse7070205
Submission received: 20 May 2019 / Revised: 27 June 2019 / Accepted: 28 June 2019 / Published: 2 July 2019
(This article belongs to the Special Issue Selected Papers from Coastlab18 Conference)

Abstract

:
Wave run-up and dune overwash are typically assessed using empirical models developed for a specific range of often-simplistic conditions. Field experiments are essential in extending these formulae; yet obtaining comprehensive field data under extreme conditions is often challenging. Here, we use XBeach Surfbeat (XB-SB)—a shortwave-averaged but wave-group resolving numerical model—to complement a field campaign, with two main objectives: i) to assess the contribution of infragravity (IG) waves to washover development in a partially-sheltered area, with a highly complex bathymetry; and ii) to evaluate the unconventional nested-modeling approach that was applied. The analysis shows that gravity waves rapidly decrease across the embayment while IG waves are enhanced. Despite its exclusion of gravity-band swash, XB-SB is able to accurately reproduce both the large-scale hydrodynamics—wave heights and mean water levels across the 30 × 10 km embayment; and the local morphodynamics—steep post-storm dune profile and washover deposit. These findings show that the contribution of IG waves to dune overwash along the bay is significant and highlight the need for any method or model to consider IG waves when applied to similar environments. As many phase-averaged numerical models that are typically used for large-scale coastal applications exclude IG waves, XB-SB may prove to be a suitable alternative.

1. Introduction

1.1. Background

Extreme wave run-up is the maximum landward point that storm waves can reach as they break and move up a natural beach profile or structure. It is the combined result of the time-averaged water surface elevation at the shoreline (setup) and the time-varying fluctuations about that mean (swash). This swash may be further classified by frequency into infragravity (low-frequency, see Bertin et al. [1] for a recent review) and gravity (high-frequency) bands. The relative contribution of these frequency bands to the total wave run-up is dependent on offshore wave conditions and local bathymetry.
As a proxy for the potential impact related to a given storm, the accurate prediction of wave run-up and the identification of its individual components are essential for effective coastal engineering and coastline management. Considering the widely-cited storm impact scale of Sallenger [2], the extent of the morphological impact to a beach-dune system during a storm may be directly related to the magnitude of wave run-up. This is described by four regimes:
  • Swash regime, where run-up is limited to the foreshore and any storm related erosion is recovered post-storm (net effect is zero);
  • Collision regime, where the run-up exceeds the threshold of the base of the foredune ridge and is no longer confined to the foreshore area. The swash is then able to erode the dune (net erosion effect);
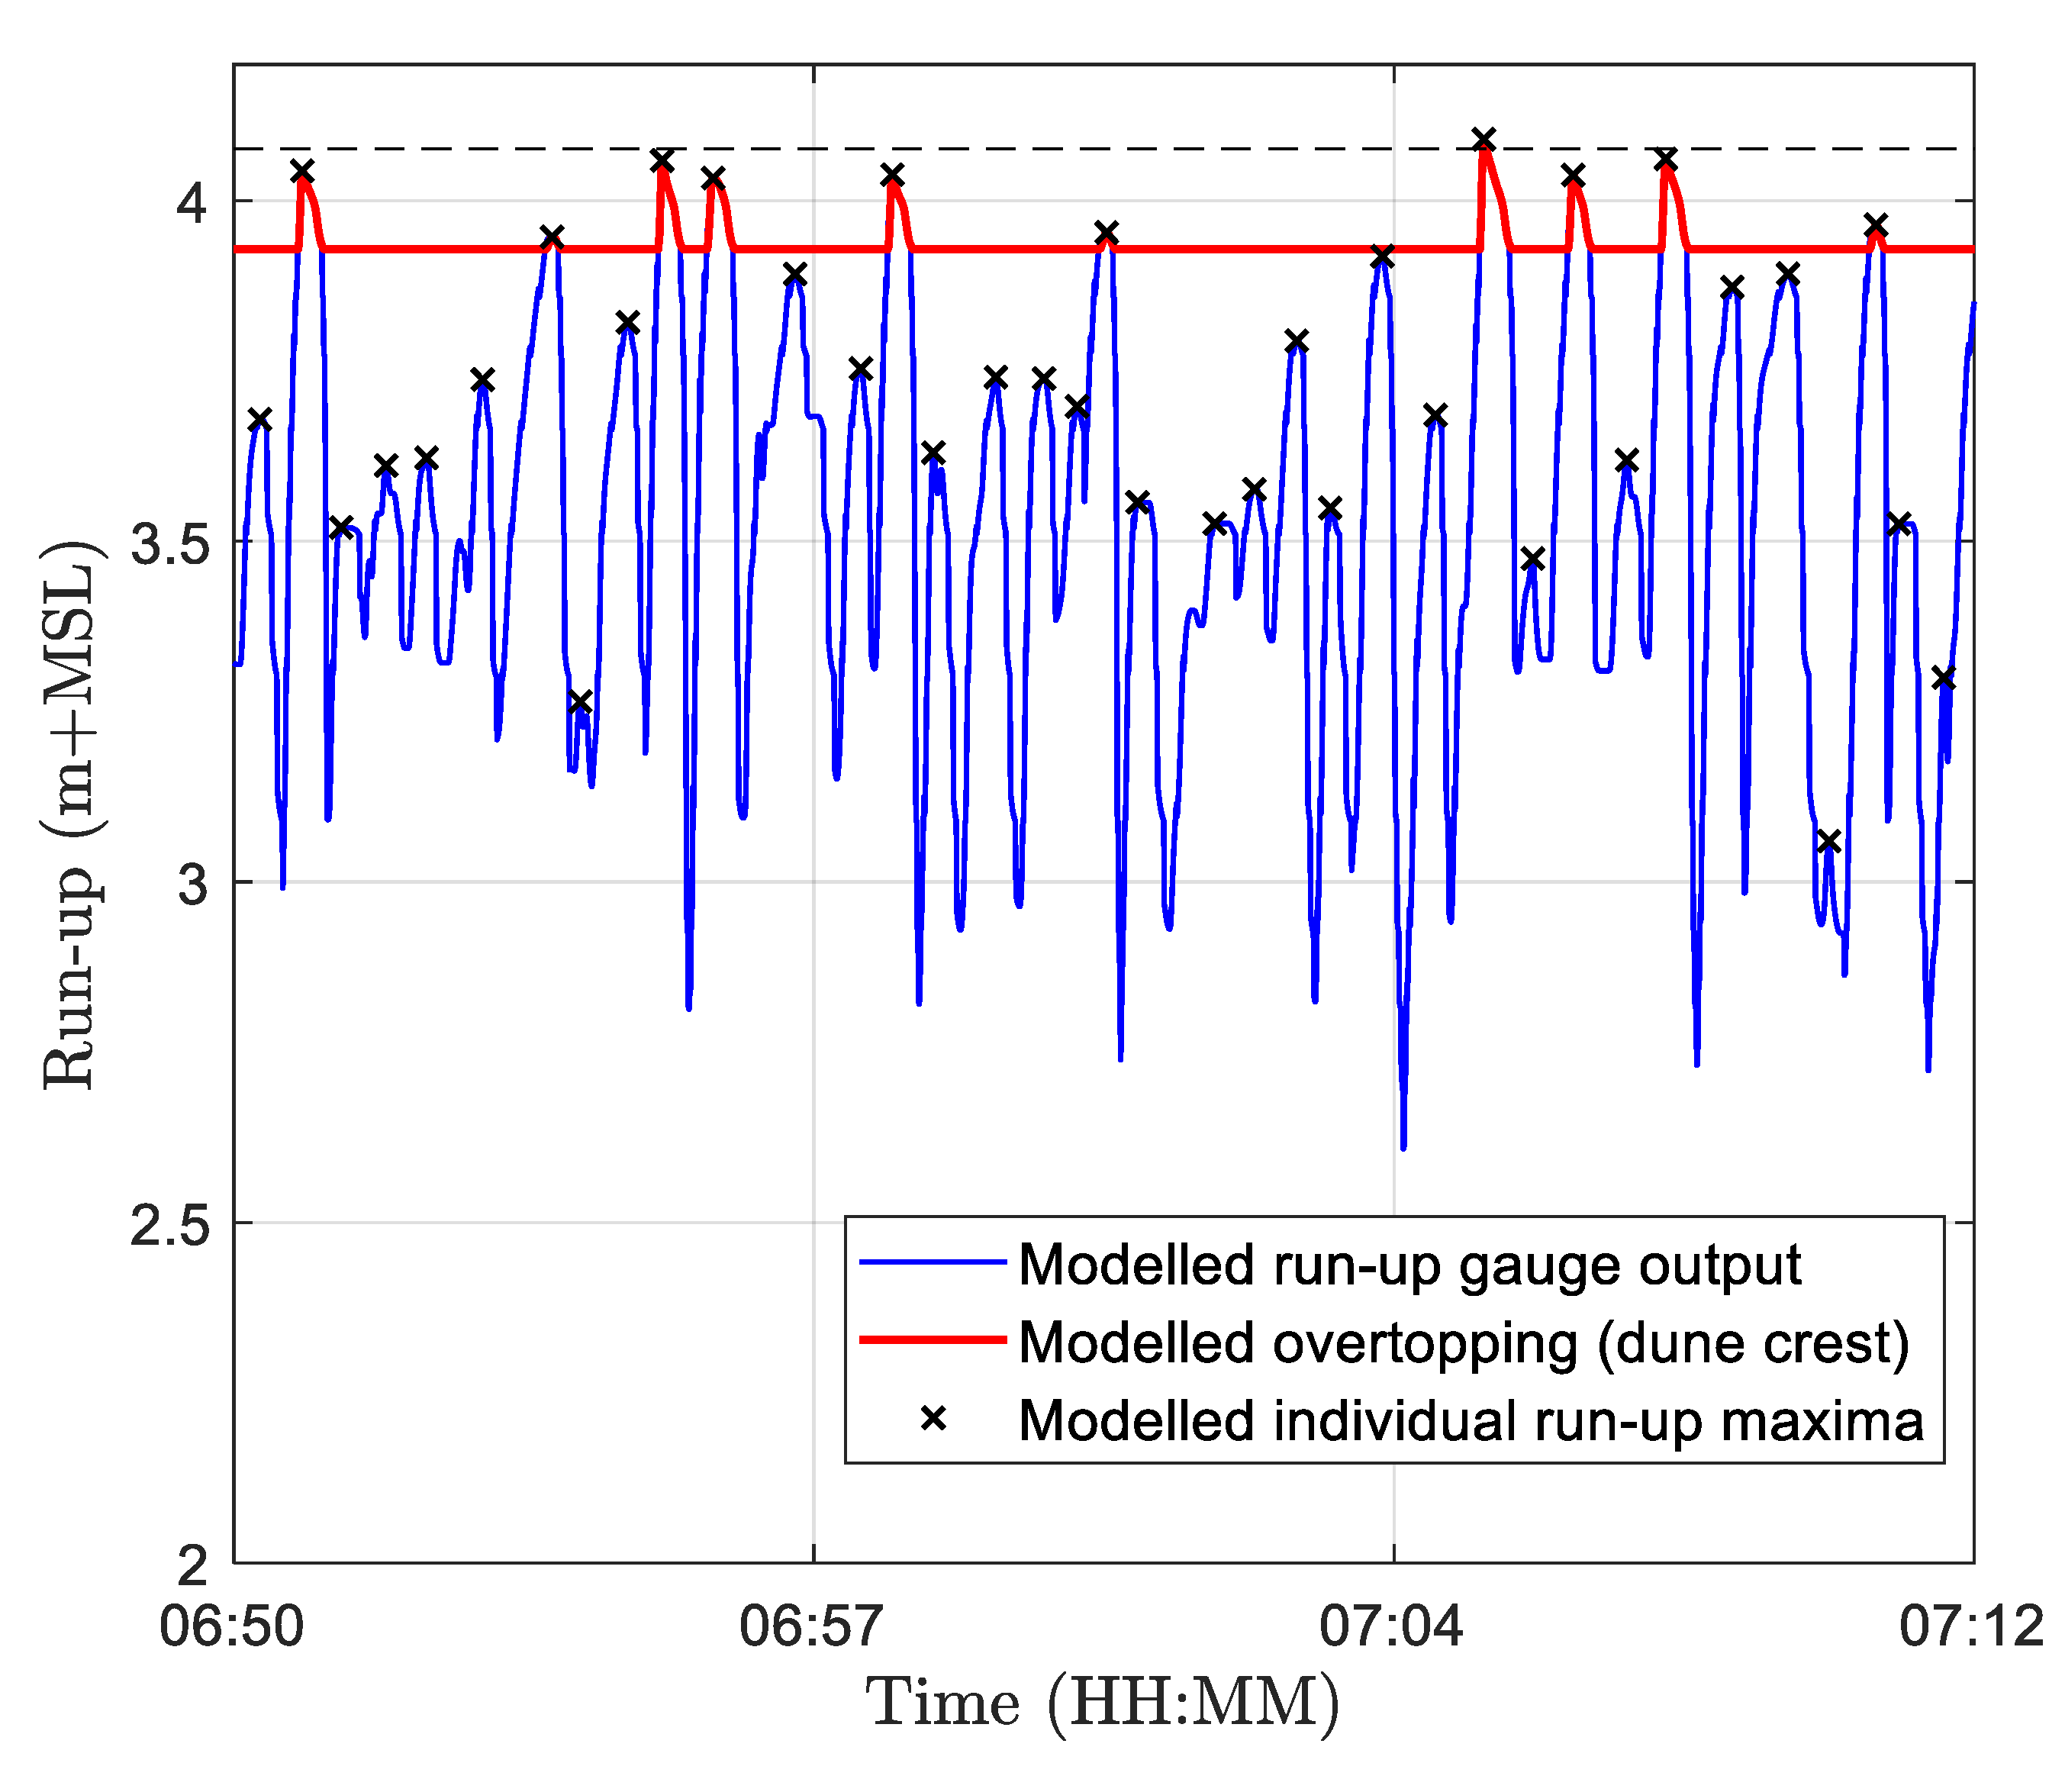
  • Overwash regime, where the run-up overtops the berm or foredune ridge and a net landward transport of sediment occurs. This regime often results in washover deposits of sediment; and
  • Inundation regime, where the combined effect of surge, tide and wave run-up is sufficient to completely and continuously submerge the beach or dune area.
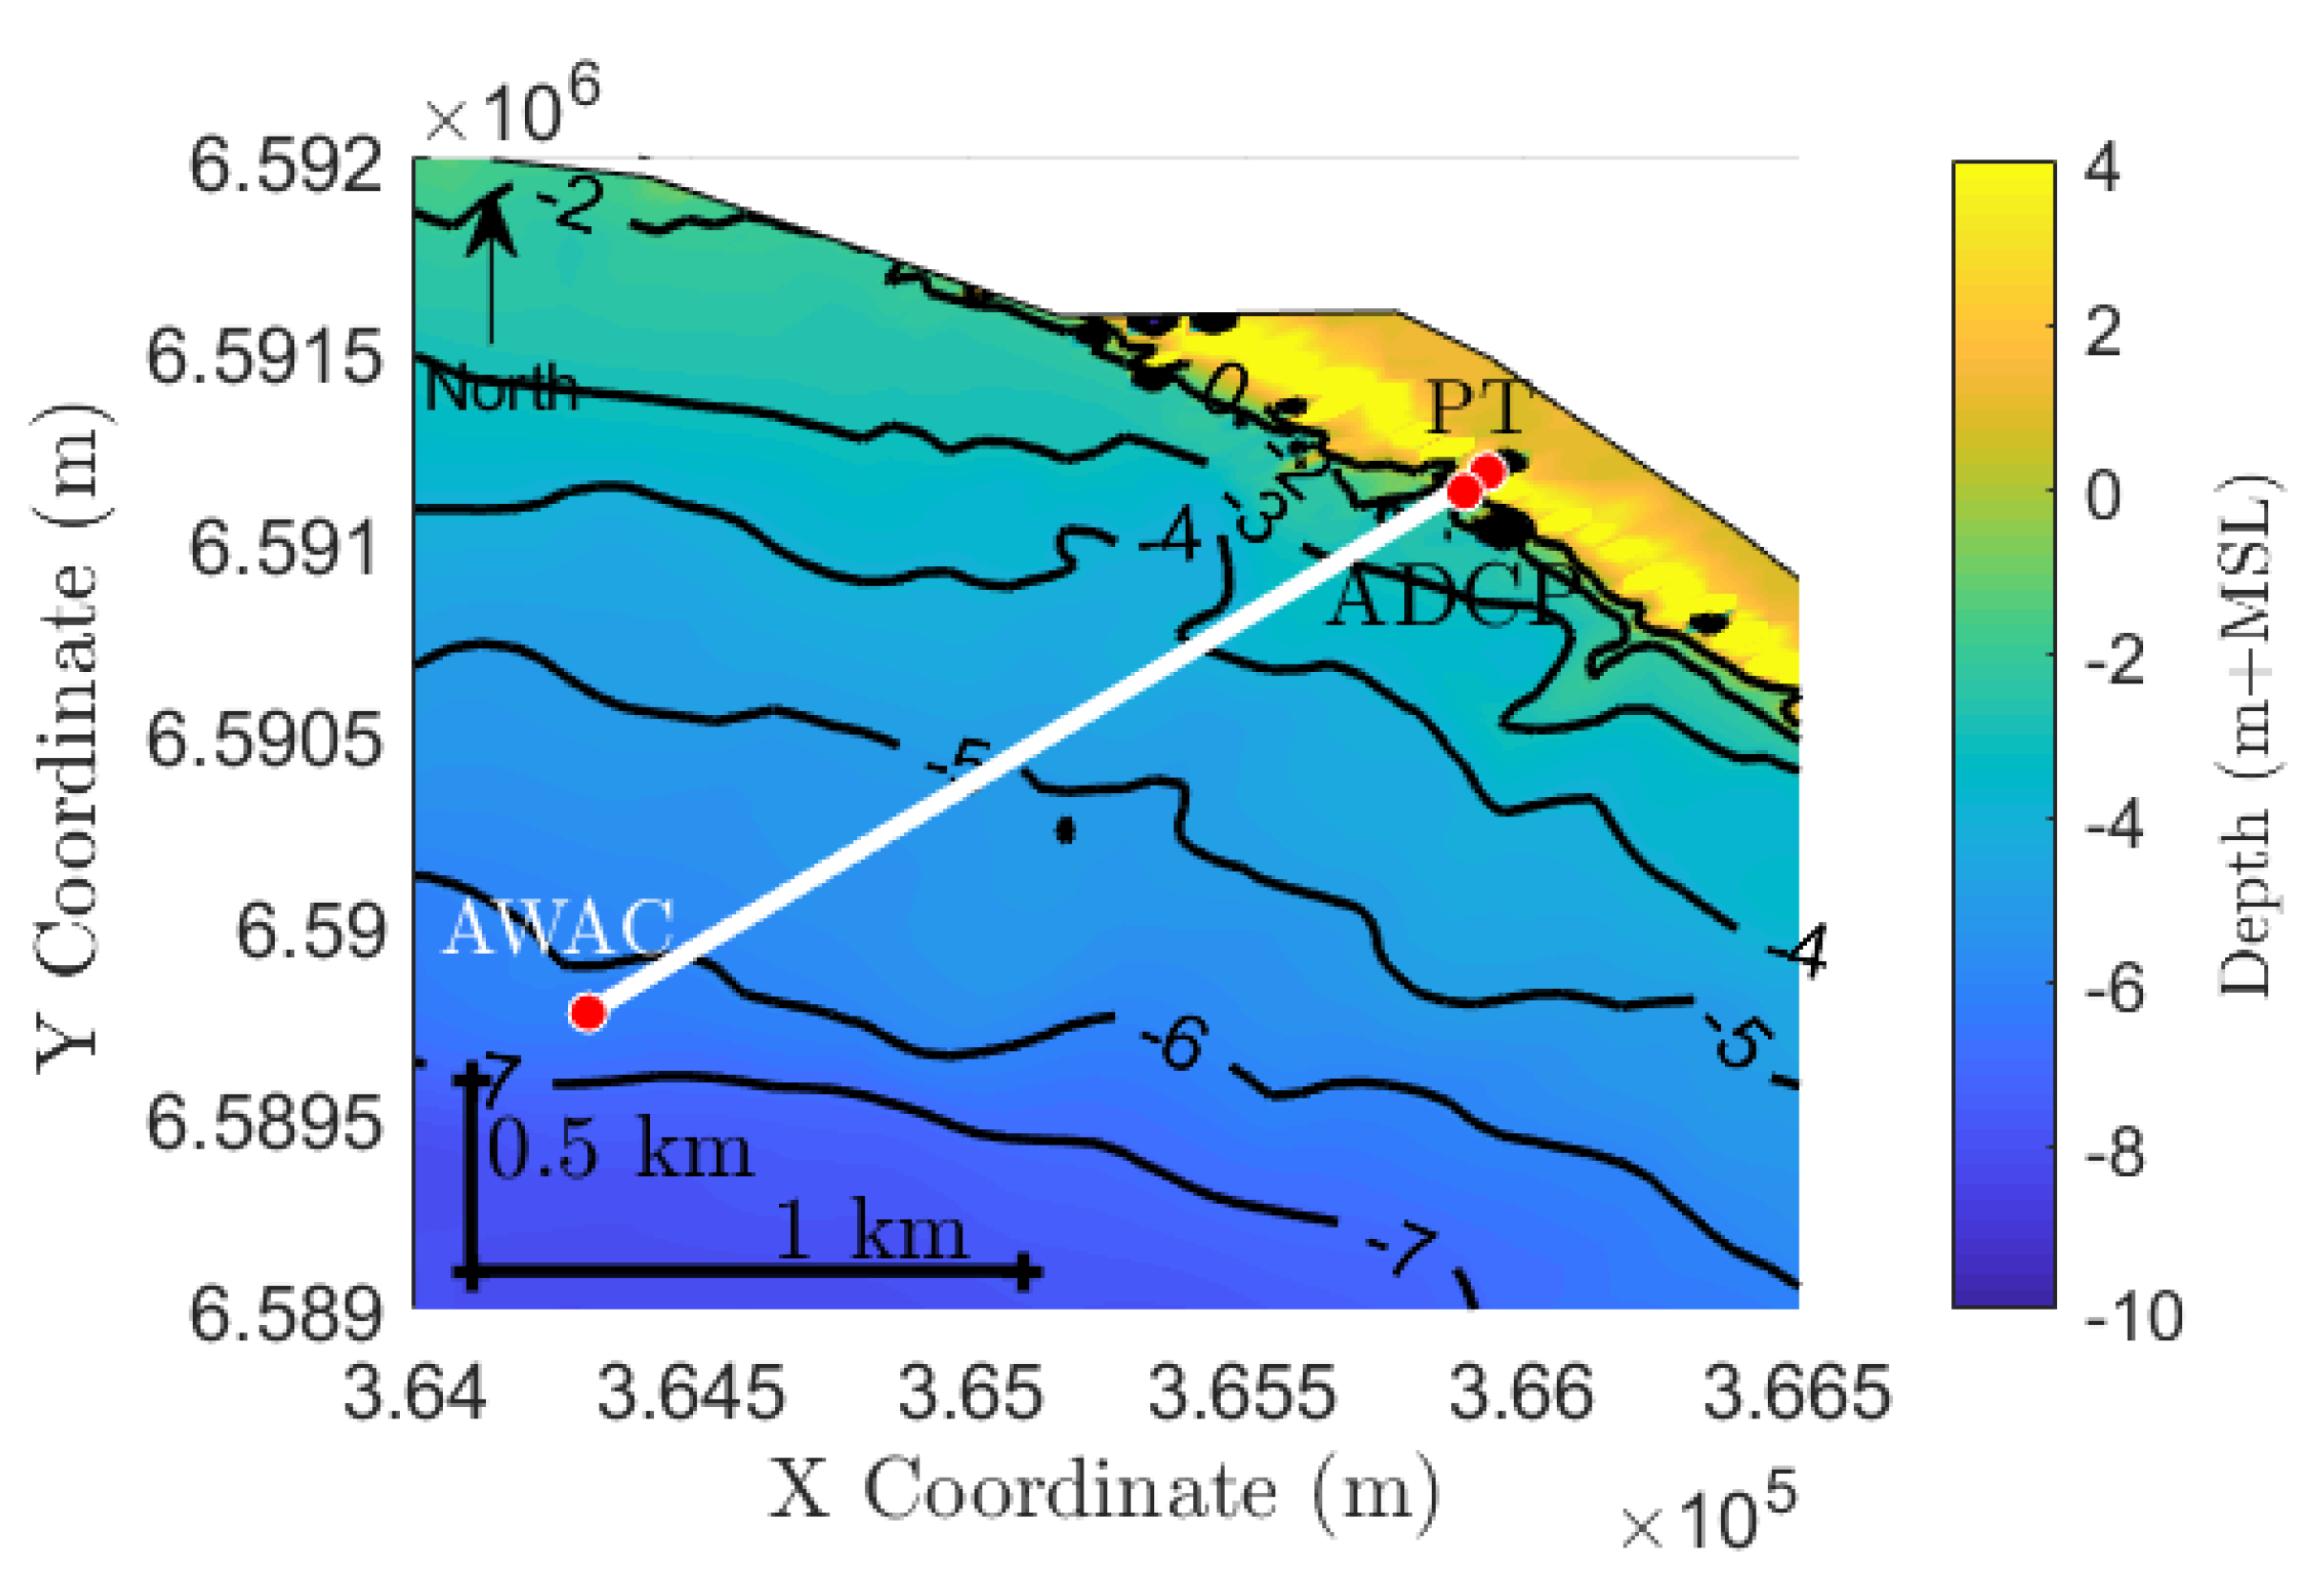
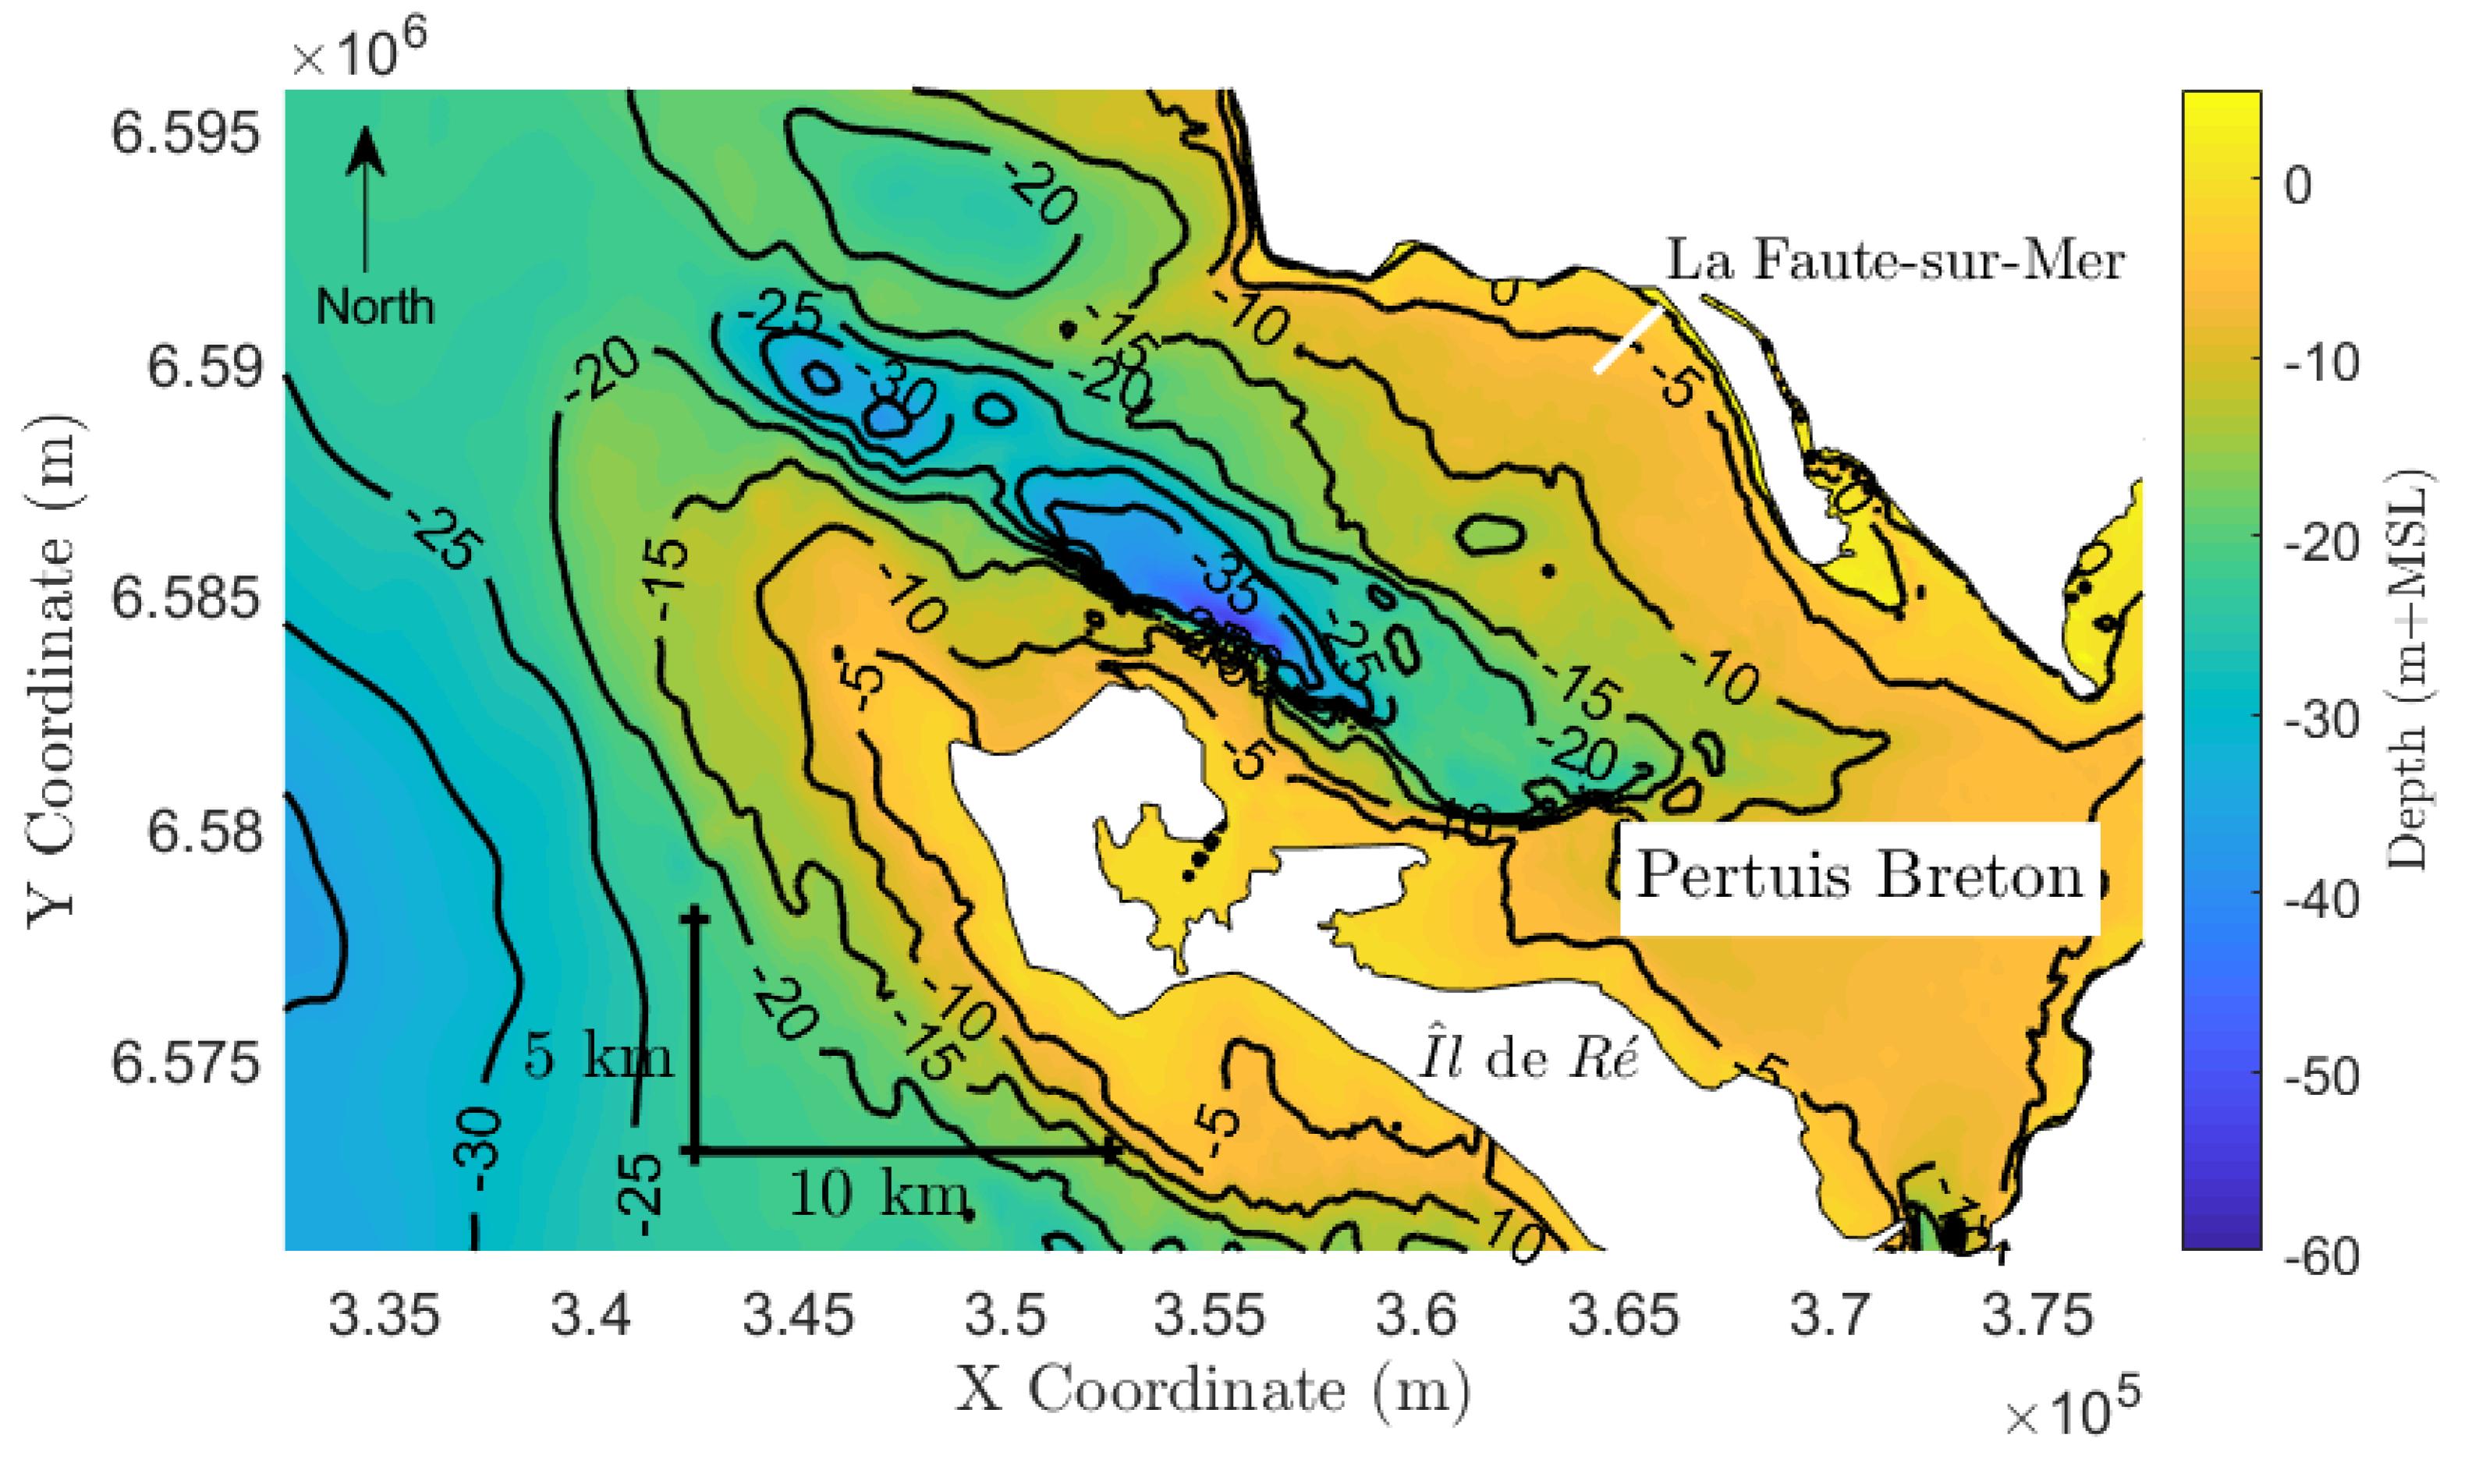
In this paper, we focus on the overwash regime which can be seen as a precursor to dune breaching and coastal inundation. The ability to estimate the location and extent of dune overwash is of significant importance to many coastal communities in low-lying areas who rely on dunes as natural flood defences. In light of this, several empirical formulations to estimate wave run-up on coastlines have been developed [3,4,5,6,7,8,9]. These formulae—often developed using laboratory experiments or with data specific to a particular beach, under mild to moderate conditions—may perform well on relatively straight, open coasts where the hydrodynamics are somewhat predictable [10]. However, their applicability to other coastline types—such as, embayments or those fronted by reefs—is highly uncertain, as each section of the beach is not necessarily exposed to the same incident wave conditions [7]. Likewise, the individual contributions of the gravity and IG components of wave run-up may also vary considerably.
These limitations, acknowledged in several studies [10,11,12,13], are associated with the difficulty in obtaining comprehensive field measurements under extreme conditions. Energetic waves and significant beach change can shift or damage observation equipment and introduce uncertainties in the data collected. In light of this, numerical models—such as XBeach [14]—are now widely used in complex coastal environments (e.g., references [15,16,17,18,19,20,21]) and have shown sufficient capability in handling not only the hydrodynamics, but also the morphological response to extreme events. Hence, these models may be used to complement field campaigns with limited data, towards a more comprehensive analysis of a particular phenomenon [13].
In the present study, we combine field measurements and the XBeach Surfbeat (XB-SB) numerical model to assess the contribution of IG waves to washover development in the Pertuis Breton Embayment (France) under storm conditions during the winter of 2013–2014. Additionally, as XB-SB is applied using an unconventional nesting approach, we also assess the general performance of the approach. In Section 1.2 of this paper, a brief description of the study area is provided. Section 2 describes the field experiment and numerical modeling approach applied; and describes the data post-processing and the error metrics used to assess model accuracy. In Section 3, the combined results of the field experiment and numerical modeling are presented with a discussion on the hydro-morphodynamics of the area and the importance of low-frequency motions. Section 4 concludes the paper by noting the strengths, limitations and potential application of the method to future research.

1.2. Study Area

The coastal village of La Faute-sur-Mer, situated in the Bay of Biscay (France) is particularly vulnerable to dune erosion, overwash and coastal flooding because it is an urbanized low-lying coastal community. The village is established on a sandy spit between the ocean and the Lay River in the inner part of the so-called Pertuis Breton embayment. The area is further characterized by a highly complex bathymetry that is somewhat sheltered from the sea by the island, Île de Ré (Figure 1). The 30 km × 10 km embayment has depths of approximately 25–30 m at its seaward boundary, to a maximum depth of 58 m which then shoals eastwards to a typical depth of 5 m. With over 60% of the foreshore being less than 10 m deep, the area may be considered to be shallow [22]. To further add to its complexity, the sediment characteristics of the area include a mixture of bedrock, gravel sands and mud. Moving seaward (westerly) from La Faute-sur-Mer, one first encounters fine sand and mud, followed by gravels and finally bedrock at the entrance of the area [23].
The area experiences a semi-diurnal tide, which ranges from less than 2 m (neap) to over 6 m (spring). The wave climate is generally quite energetic at the entrance of the embayment; with significant wave heights ( H m 0 ) temporarily exceeding 8 m during annual winter storms [24]. However, this wave energy rapidly decreases inside the estuary due to refraction, diffraction and dissipation by depth-limited breaking and bottom friction. In 2010, a unique combination of storm surge and high spring tides resulted in severe flooding along the French Atlantic Coast. This extreme event resulted in loss of life and significant damage to property in la Faute-sur-Mer, with reported water levels in the village as high as 3 m [25]. More recently, the winter of 2013–2014 produced an unusually high-energy wave climate in the Bay of Biscay, consisting of six successive extreme events with offshore H m 0 in the range of 5–12 m and peak period ( T p ) exceeding 15 s. These extreme conditions resulted in the development of several washover deposits along the barrier bounding La Faute-sur-Mer to the West.

2. Methods

2.1. Field Experiment

The field campaign, conducted from 30 January to 11 March 2014, captured several of the before-mentioned events. In the present study we focus on an event which occurred on 2 February 2014 resulting in washover development. This was captured by means of an Acoustic Waves and Currents (AWAC) sensor on the shoreface, an Acoustic Doppler Current Profiler (ADCP) positioned 69 m seaward of the dune crest and a pressure transducer (PT) on the dune crest (Figure 2). It should be noted that the AWAC was displaced some 50 m—due to the severity of the weather conditions—and approached a steel mooring chain during the storm, which biased the compass. Thus, only 1D spectral analyses were performed on the measured data (see Section 2.3 for details on the data processing). In addition to the hydrodynamic data collected, a differential global positioning survey was carried out on the beach following the overwash event to capture the extent of the washover deposit.

2.2. Numerical Modeling

XBeach is an open-source, two-dimensional numerical model in the horizontal plane (2DH) which solves equations for wave propagation, mean flow including long waves, sediment transport and morphological changes. Here, we apply the Surfbeat mode (XBeachX release) which solves short-wave (gravity) motions using a reduced wave-action equation where the mean wave directions ( θ ¯ ) are first calculated and then the short-wave energy is propagated along these directions [26]:
A t + c g c o s θ ¯ A x + c g s i n θ ¯ A y = D w + D f σ ,
A ( x , y , t , θ i ) = S w ( x , y , t , θ i ) σ ( x , y , t ) ,
σ = g k   t a n h   k h ,
where the wave action, A is given by Equation (2), S w is the wave energy density in each directional bin, σ is the intrinsic wave frequency given by Equation (3), h is the local water depth, k is the wave number, θ i is the angle of incidence with respect to the x-axis; and D w and D f are dissipation terms which take into account wave breaking and bottom friction, respectively; and c g is the group velocity. D w is computed using the Daly et al. [27] parameterization, while D f is determined by a specified short-wave friction coefficient, f w [28].
On the other hand, flow motions at the scale of the wave group (infragravity motions) are solved directly using the nonlinear shallow water equations:
η t + h u L x + h v L y = 0 ,
u L t + u L u L x + v L u L y f v L v h ( 2 u L x 2 + 2 u L y 2 ) = τ s x ρ h τ b x E ρ h g η x + F x ρ h ,
v L t + u L v L x + v L v L y f u L v h ( 2 v L x 2 + 2 v L y 2 ) = τ s y ρ h τ b y E ρ h g η y + F y ρ h ,
where u L and v L are the Lagrangian velocities, F x and F y are wave-induced stresses (derived from the wave action model), v h is the horizontal viscosity, f is the Coriolis coefficient, τ s x and τ s y are wind shear stresses; and τ b x E and τ b y E are bed shear stresses (based on Eulerian velocities) determined here by a specified Chézy coefficient, C .
The model approach adopted in this study followed a somewhat uncommon nesting procedure within XBeach itself. It comprised a large-domain (45 × 25 km) 2DH hydrodynamic model of the embayment (the entire area shown in Figure 1) to simulate the transformation of the waves from deep water (seaward of the mouth of the embayment) to the shoreface (AWAC location) and a nested 1D morphodynamic model to simulate wave run-up and dune overwash at the coast of La Faute-sur-Mer. The objectives of the 2DH model were to determine the direction of wave attack in the shoreface—as the movement of the AWAC during the storm period disallowed the collection of directional data—and to generate surface elevation ( z s ) (including IG motions) and short-wave energy ( E ) time series to be used as boundary conditions for the nested, higher-resolution 1D model.

2.2.1. Hydrodynamic 2DH Model Setup

For the 2DH model, a constant grid spacing in the cross-shore direction, d x = 12.5 m and in the longshore direction, d y = 25 m were used; resulting in a 3600 × 1000 node grid (45 × 25 km domain). At the open boundary (seaward of Pertuis Breton in 30 m water depth), XBeach was forced with time-varying directional wave spectra and mean water levels obtained from the storm surge modeling system described by Bertin et al. [24] (Figure 3)—forced by fields of sea-level pressure and wind speed originating from the Climate Forecast System Reanalysis (CFSR) [29]. Consistent with typical winter storms [30,31], these deep-water wave conditions showed an energetic event with H m 0 > 5 m and T p > 17 s (Figure 3b,c) under spring-tide conditions. The mean wave direction ( θ ) varied between 260° and 270° with an average of 268° (Figure 3c). The 2DH model was then calibrated by optimizing the friction parameters; a combination of f w = 0.06 and C = 75 m1/2s−1 provided the best agreement between the observed and modeled data. As the main purpose of the 2DH model was to investigate wave transformation across the embayment, morphology and sediment transport formulations were switched off.

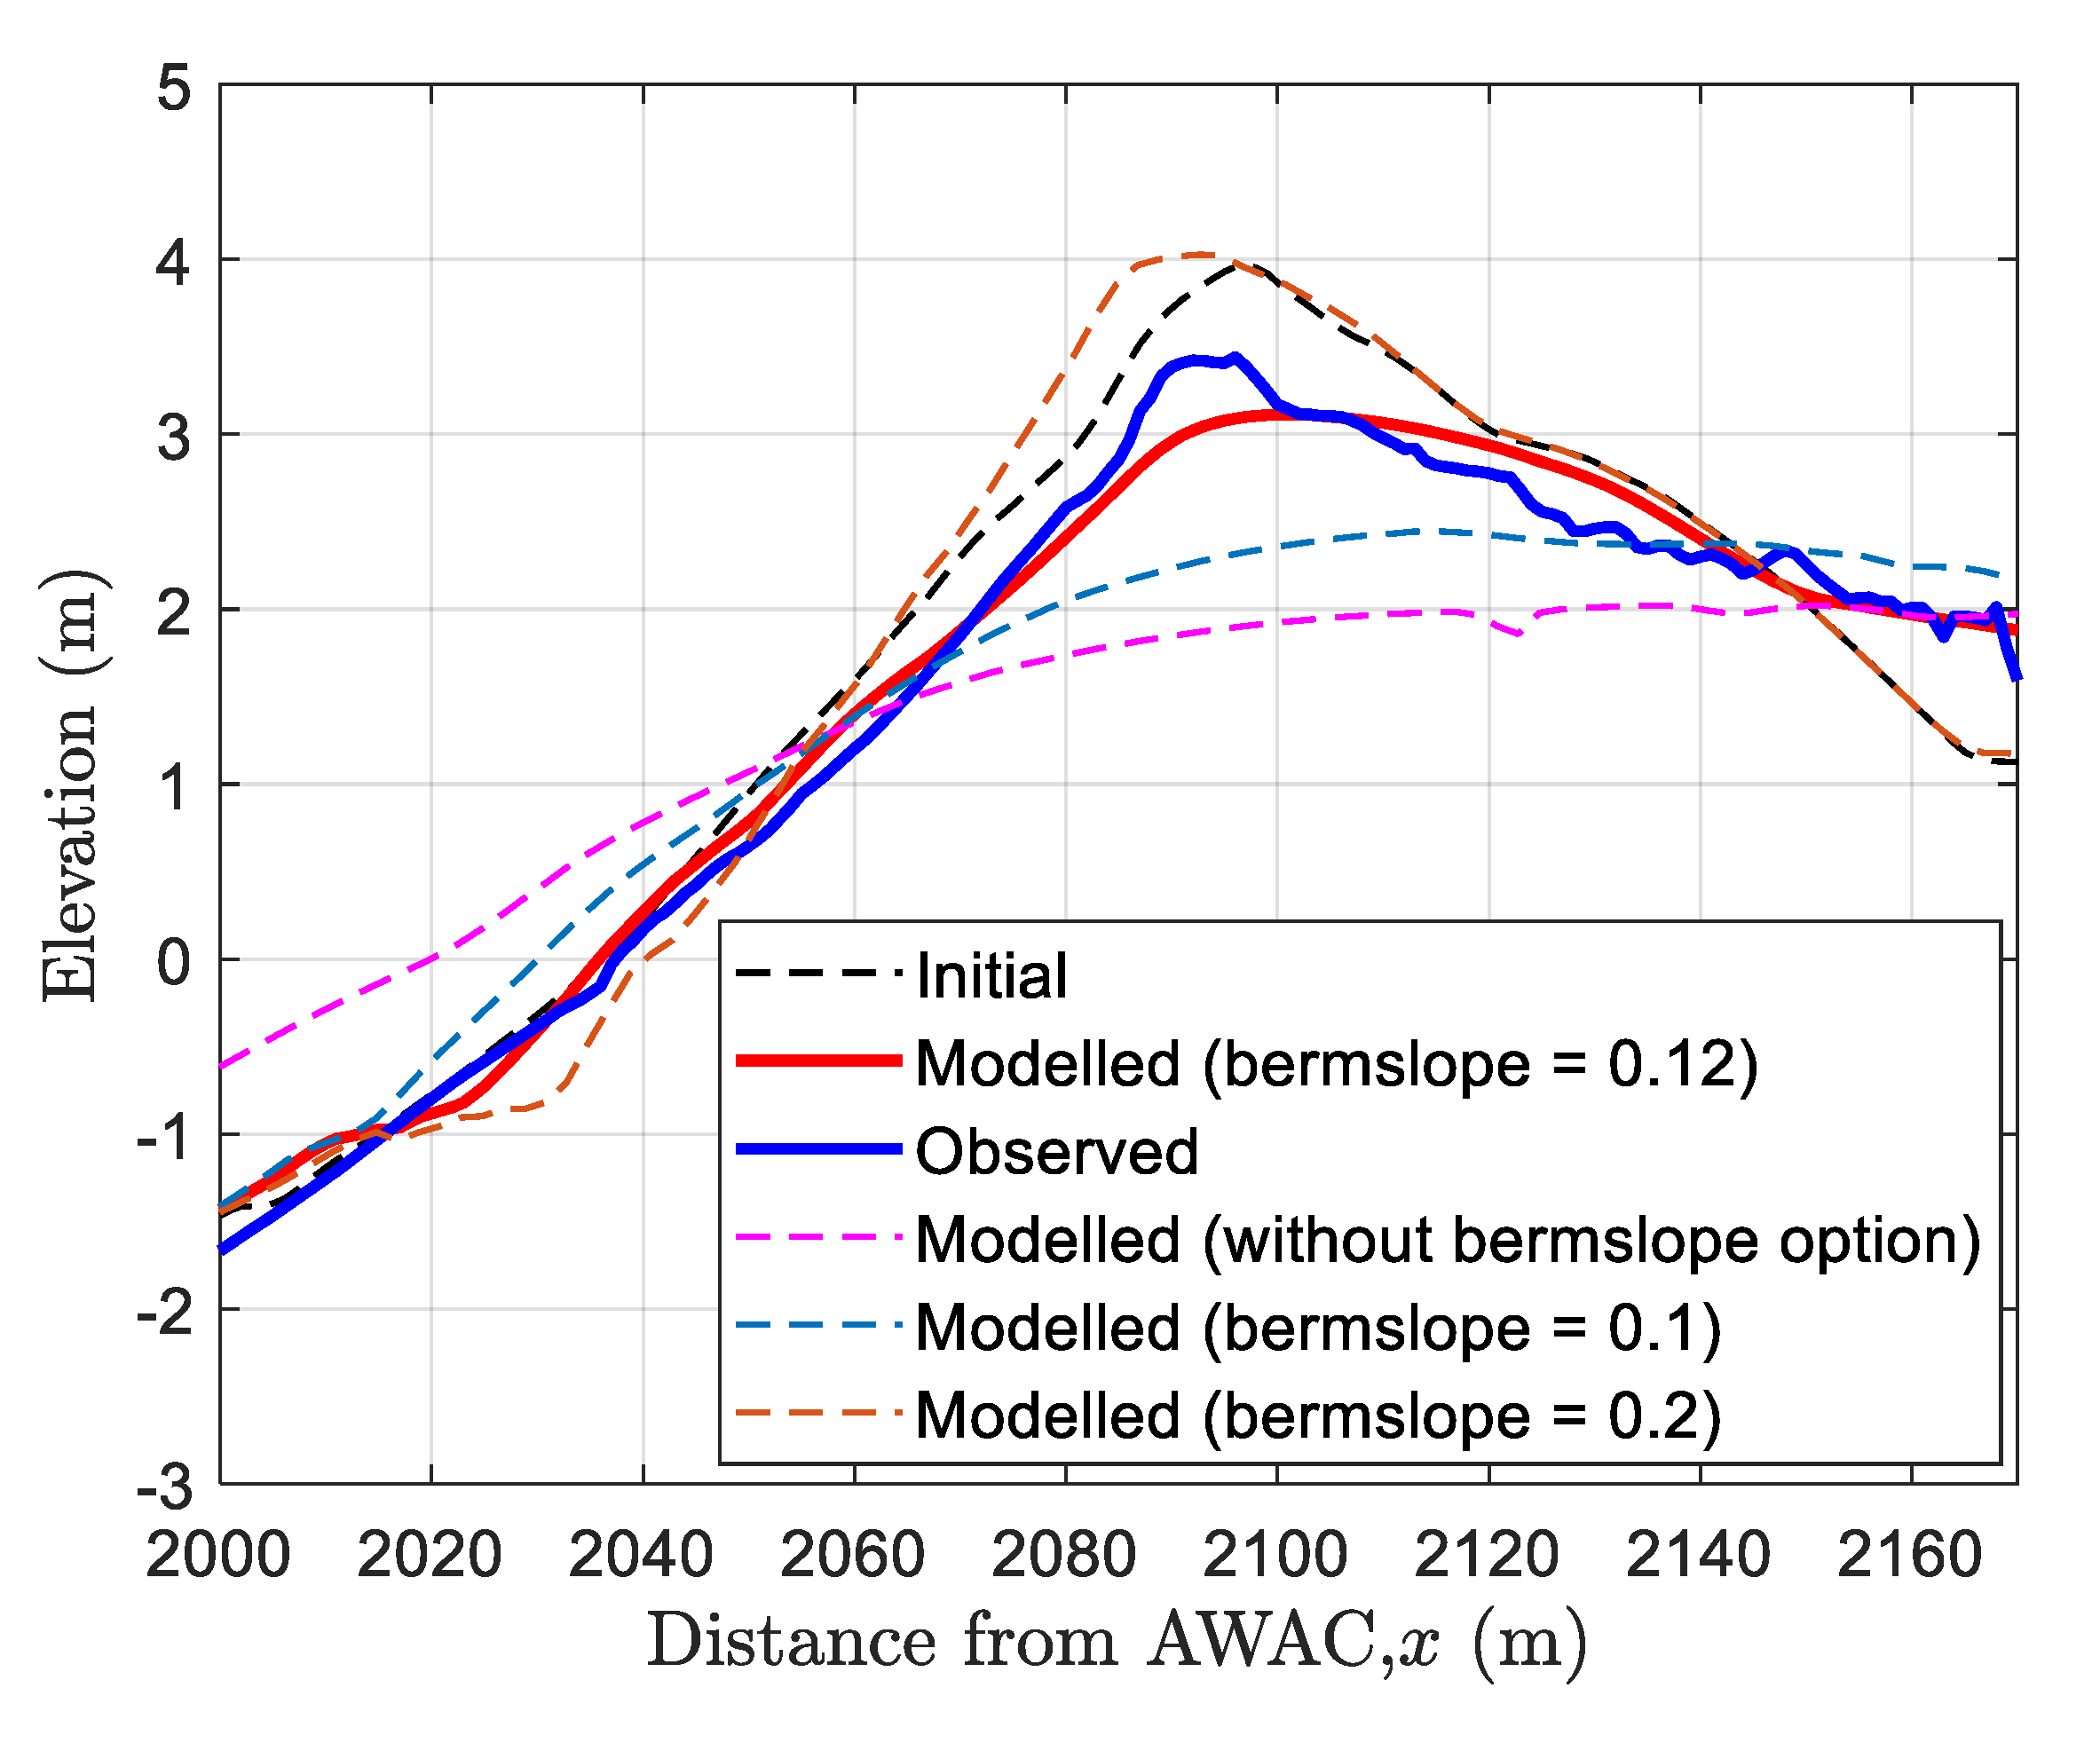
2.2.2. Morphodynamic 1D Model Setup

The nested higher-resolution model was set up as a transect across the dune with its offshore boundary at the AWAC location (2 km domain shown by the white lines in both Figure 1 and Figure 2). The cross-shore grid spacing ( d x ) was varied from 5 m offshore to 2 m at the coast to ensure that the steeply-sloping dune was correctly captured. The model was forced with long-wave surface elevation ( z s ) and short-wave energy, ( E ) time series obtained from the 2DH hydrodynamic model to simulate wave transformation to the nearshore (ADCP location) and dune (PT location). In order to model the eroding dune and washover development, sediment transport and morphology formulations were switched on. With respect to physical parameters, a median grain size (D50) = 0.0035 m was specified; the ratio of breaking waves to local water depth was set to 0.4; and the critical bed slope for wet areas was set to 1.1. Additionally, a transport term is added in XBeach which is proportional to the difference between the actual slope and a prescribed value (hereinafter referred to as “bermslope”) to better represent conditions where the dune is known to maintain a relatively steep profile. The coefficient of this term is set to 10 times the usual bed-slope term, which produces a strong local onshore transport when the actual slope is less than the prescribed value. This term is only applied in a narrow region where the wave height to water depth ratio is > 1 [32]. A bermslope value of 0.12 provided the best agreement between the modeled and observed dune profiles.

2.3. Data Analysis

2.3.1. Separation of Gravity and Infragravity Waves

A spectral analysis was performed in order to identify the relative importance of infragravity waves with respect to gravity waves. All field pressure measurements were first corrected for the atmospheric pressure variations. Pressure energy density spectra were computed by applying the Welch’s average periodogram with five Hamming-windowed segments (50% maximum overlap). These pressure spectra were then converted into surface elevation spectra, C η η using linear wave theory. The significant wave heights in both the infragravity ( H m 0 , I G ) and gravity ( H m 0 , G ) frequency bands were then determined as follows:
H m 0 , I G = 4 0.005 f s p l i t C η η   d f ,
H m 0 , G = 4 f s p l i t 0.5 C η η   d f ,
where a split frequency ( f s p l i t ) of 0.03 Hz is used to separate the infragravity and gravity bands. This choice of cut-off frequency—which is approximately equal to half the average peak frequency ( f p = 1 / T p ) of the offshore waves (Figure 3c)—is based on the tendency that, in deep water, the majority of gravity-wave energy is found at frequencies > f p / 2 , while the majority of IG-wave energy lies at frequencies < f p / 2 [33].
XBeach uses a representative single frequency for the gravity-band wave energy and therefore does not produce the gravity-band spectra. Modeled H m 0 , G was obtained directly from computed short-wave energy; while H m 0 , I G was obtained from the simulated long-wave surface elevation time series using Equation (7). In addition to significant wave heights, the modeled mean water levels ( η ¯ ), maximum run-up ( R m a x ) and post storm bed level ( z b ) were also assessed and compared to observations.

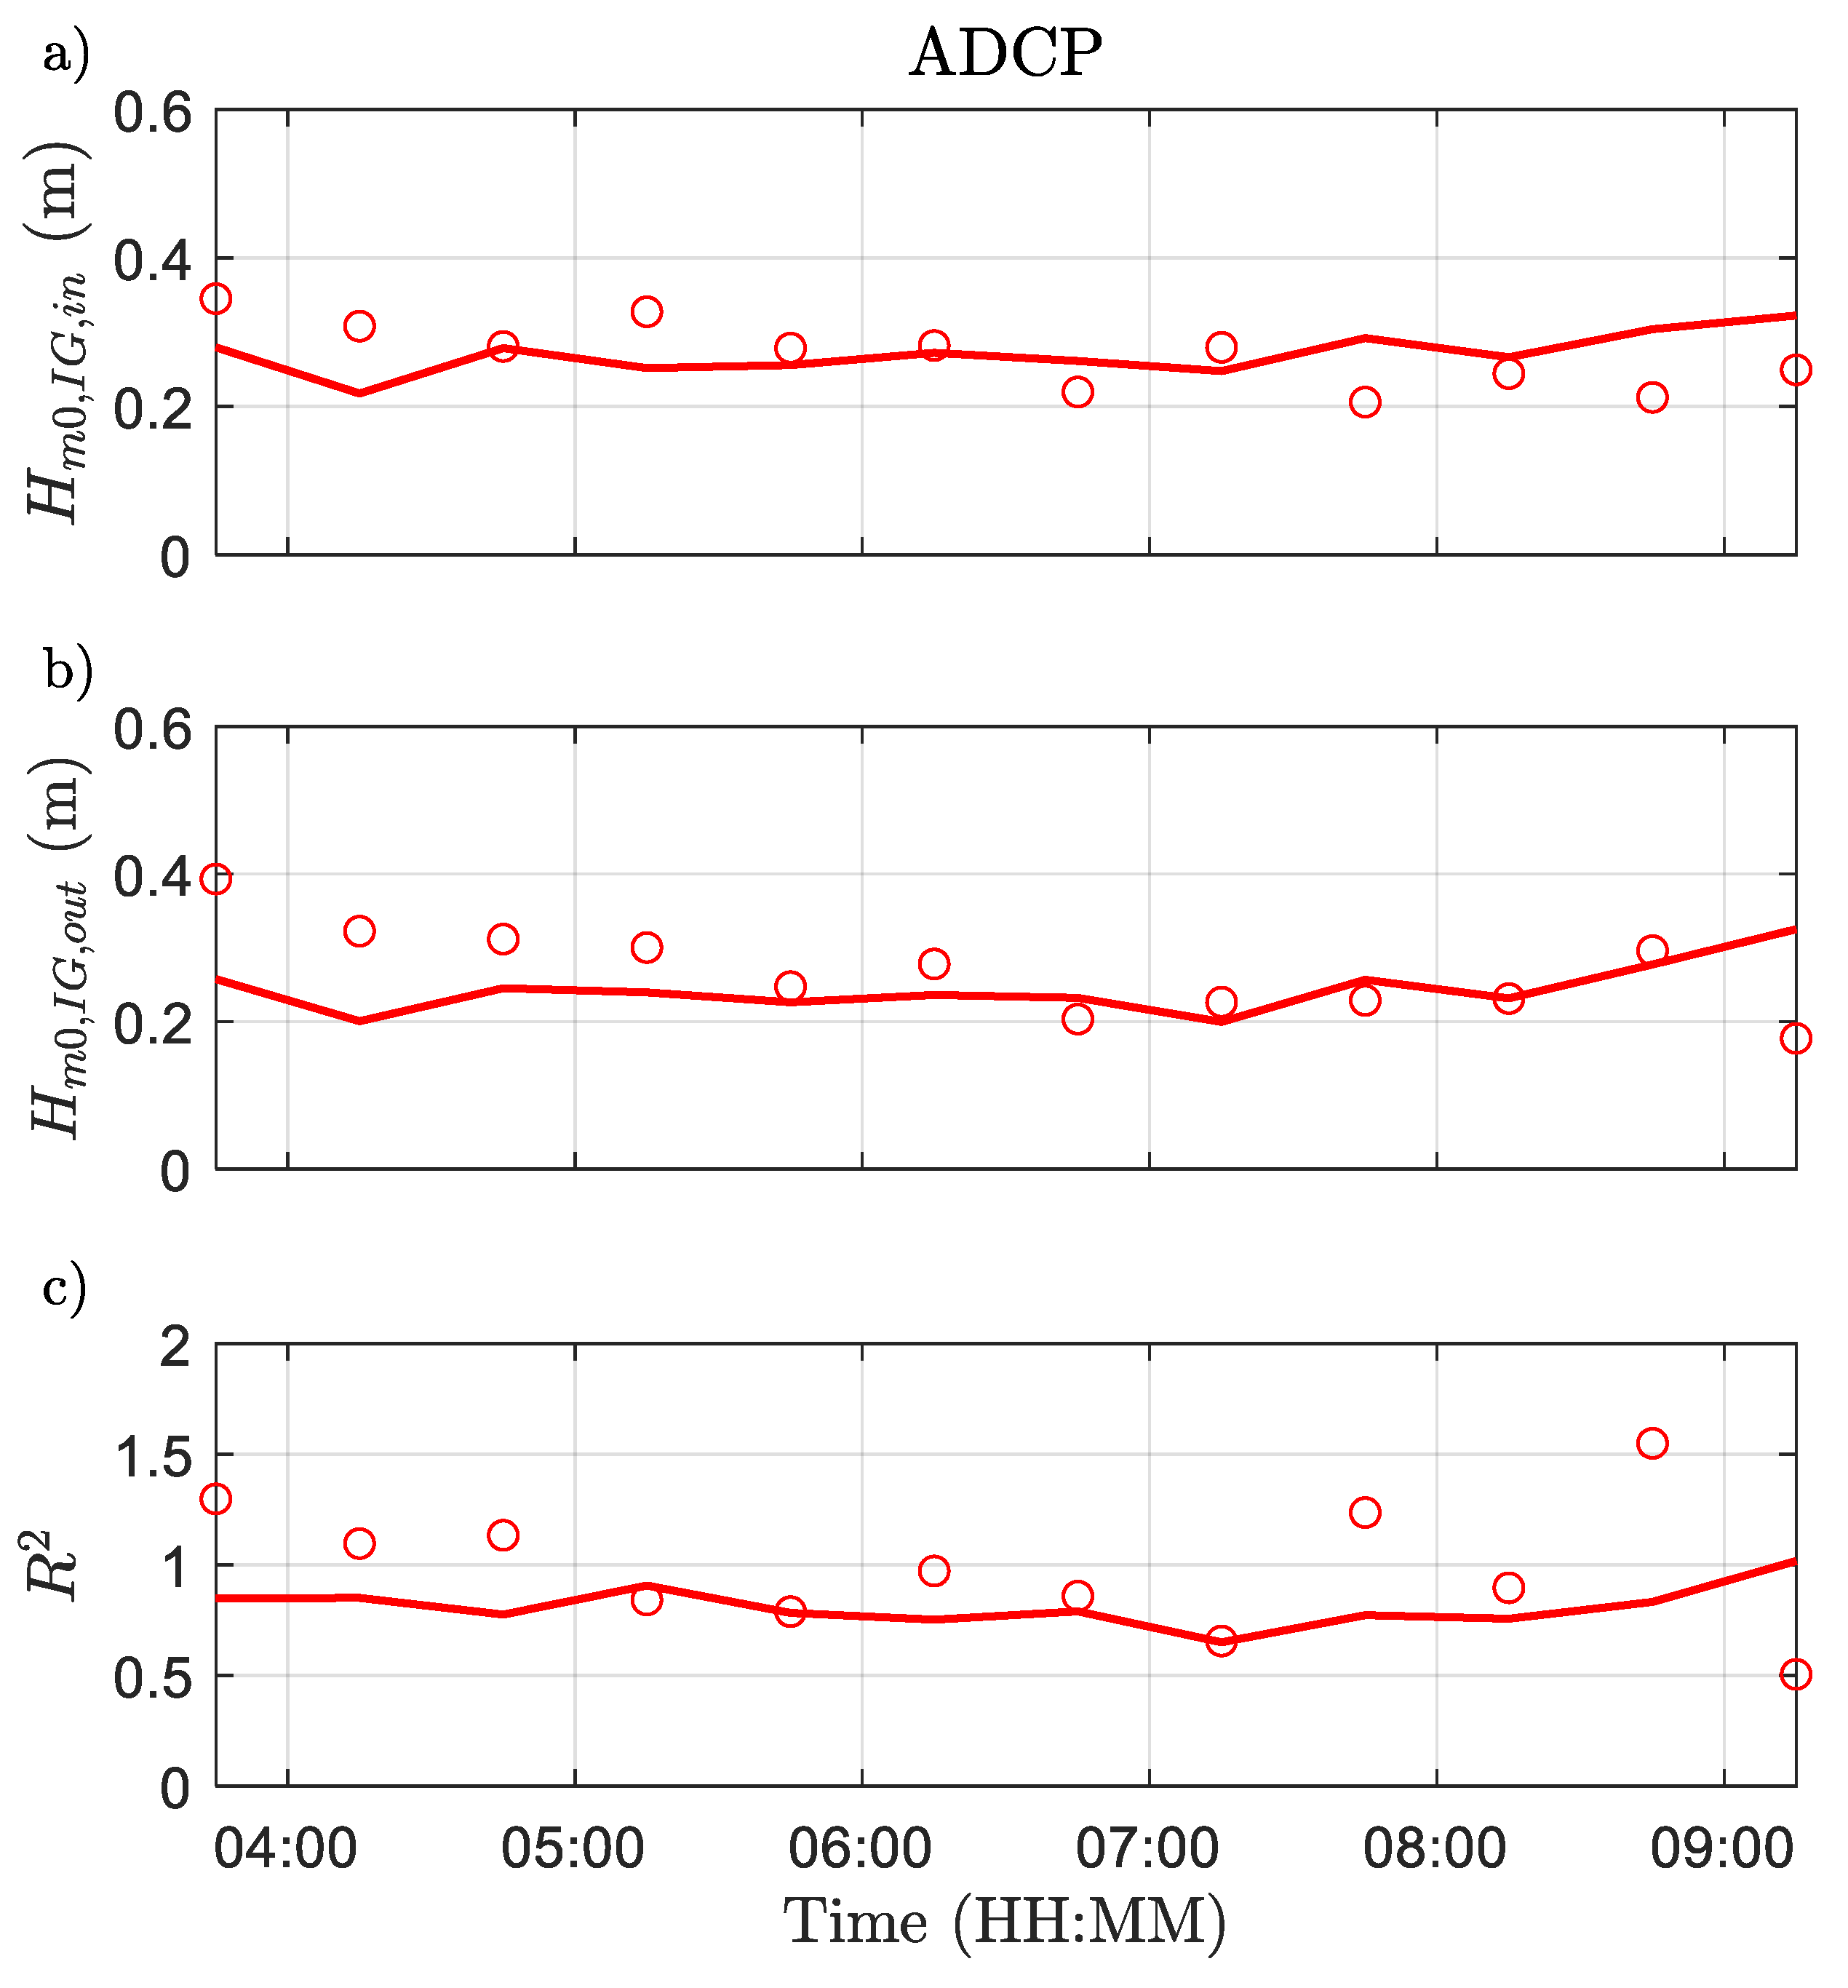
2.3.2. Separation of Incoming and Outgoing Signals

To assess the reflection of IG waves at the dune, the modeled and observed total long-wave surface elevation signals ( z s ) were separated into incoming ( z s i n ) and outgoing ( z s o u t ) components as follows [34]:
z s i n = z s + h g u 2 ,
z s o u t = z s h g u 2 .
This method, developed for normally-incident shallow-water waves, requires co-located measurements of surface elevation ( z s ) and currents ( u )—by means of an ADCP, for example—in order to decompose the total signal into seaward (outgoing) and shoreward (incoming) propagating components [34]. These signals were then used to calculate the incoming and outgoing IG significant wave heights ( H m 0 , I G , i n and H m 0 , I G , o u t ) using Equation (7).

2.4. Error Metrics

The model-data comparisons were carried out by applying the Root-mean-square Error ( R M S E ), Relative Bias ( R e l .   b i a s ) and Brier-Skill Score ( B S S ) error metrics; where Ψ is used as a stand-in for the parameter under consideration in a sample size N :
R M S E = 1 n i = 1 N ( Ψ X B e a c h i Ψ o b s e r v e d i ) 2 ,
R e l .   b i a s = i = 1 N ( Ψ X B e a c h i Ψ o b s e r v e d i ) i = 1 N Ψ o b s e r v e d i ,
B S S = 1 1 n i = 1 N ( Ψ X B e a c h i Ψ p o s t   s t o r m i ) 2 1 n i = 1 N ( Ψ i n i t i a l i Ψ p o s t   s t o r m i ) 2 .

3. Results and Discussion

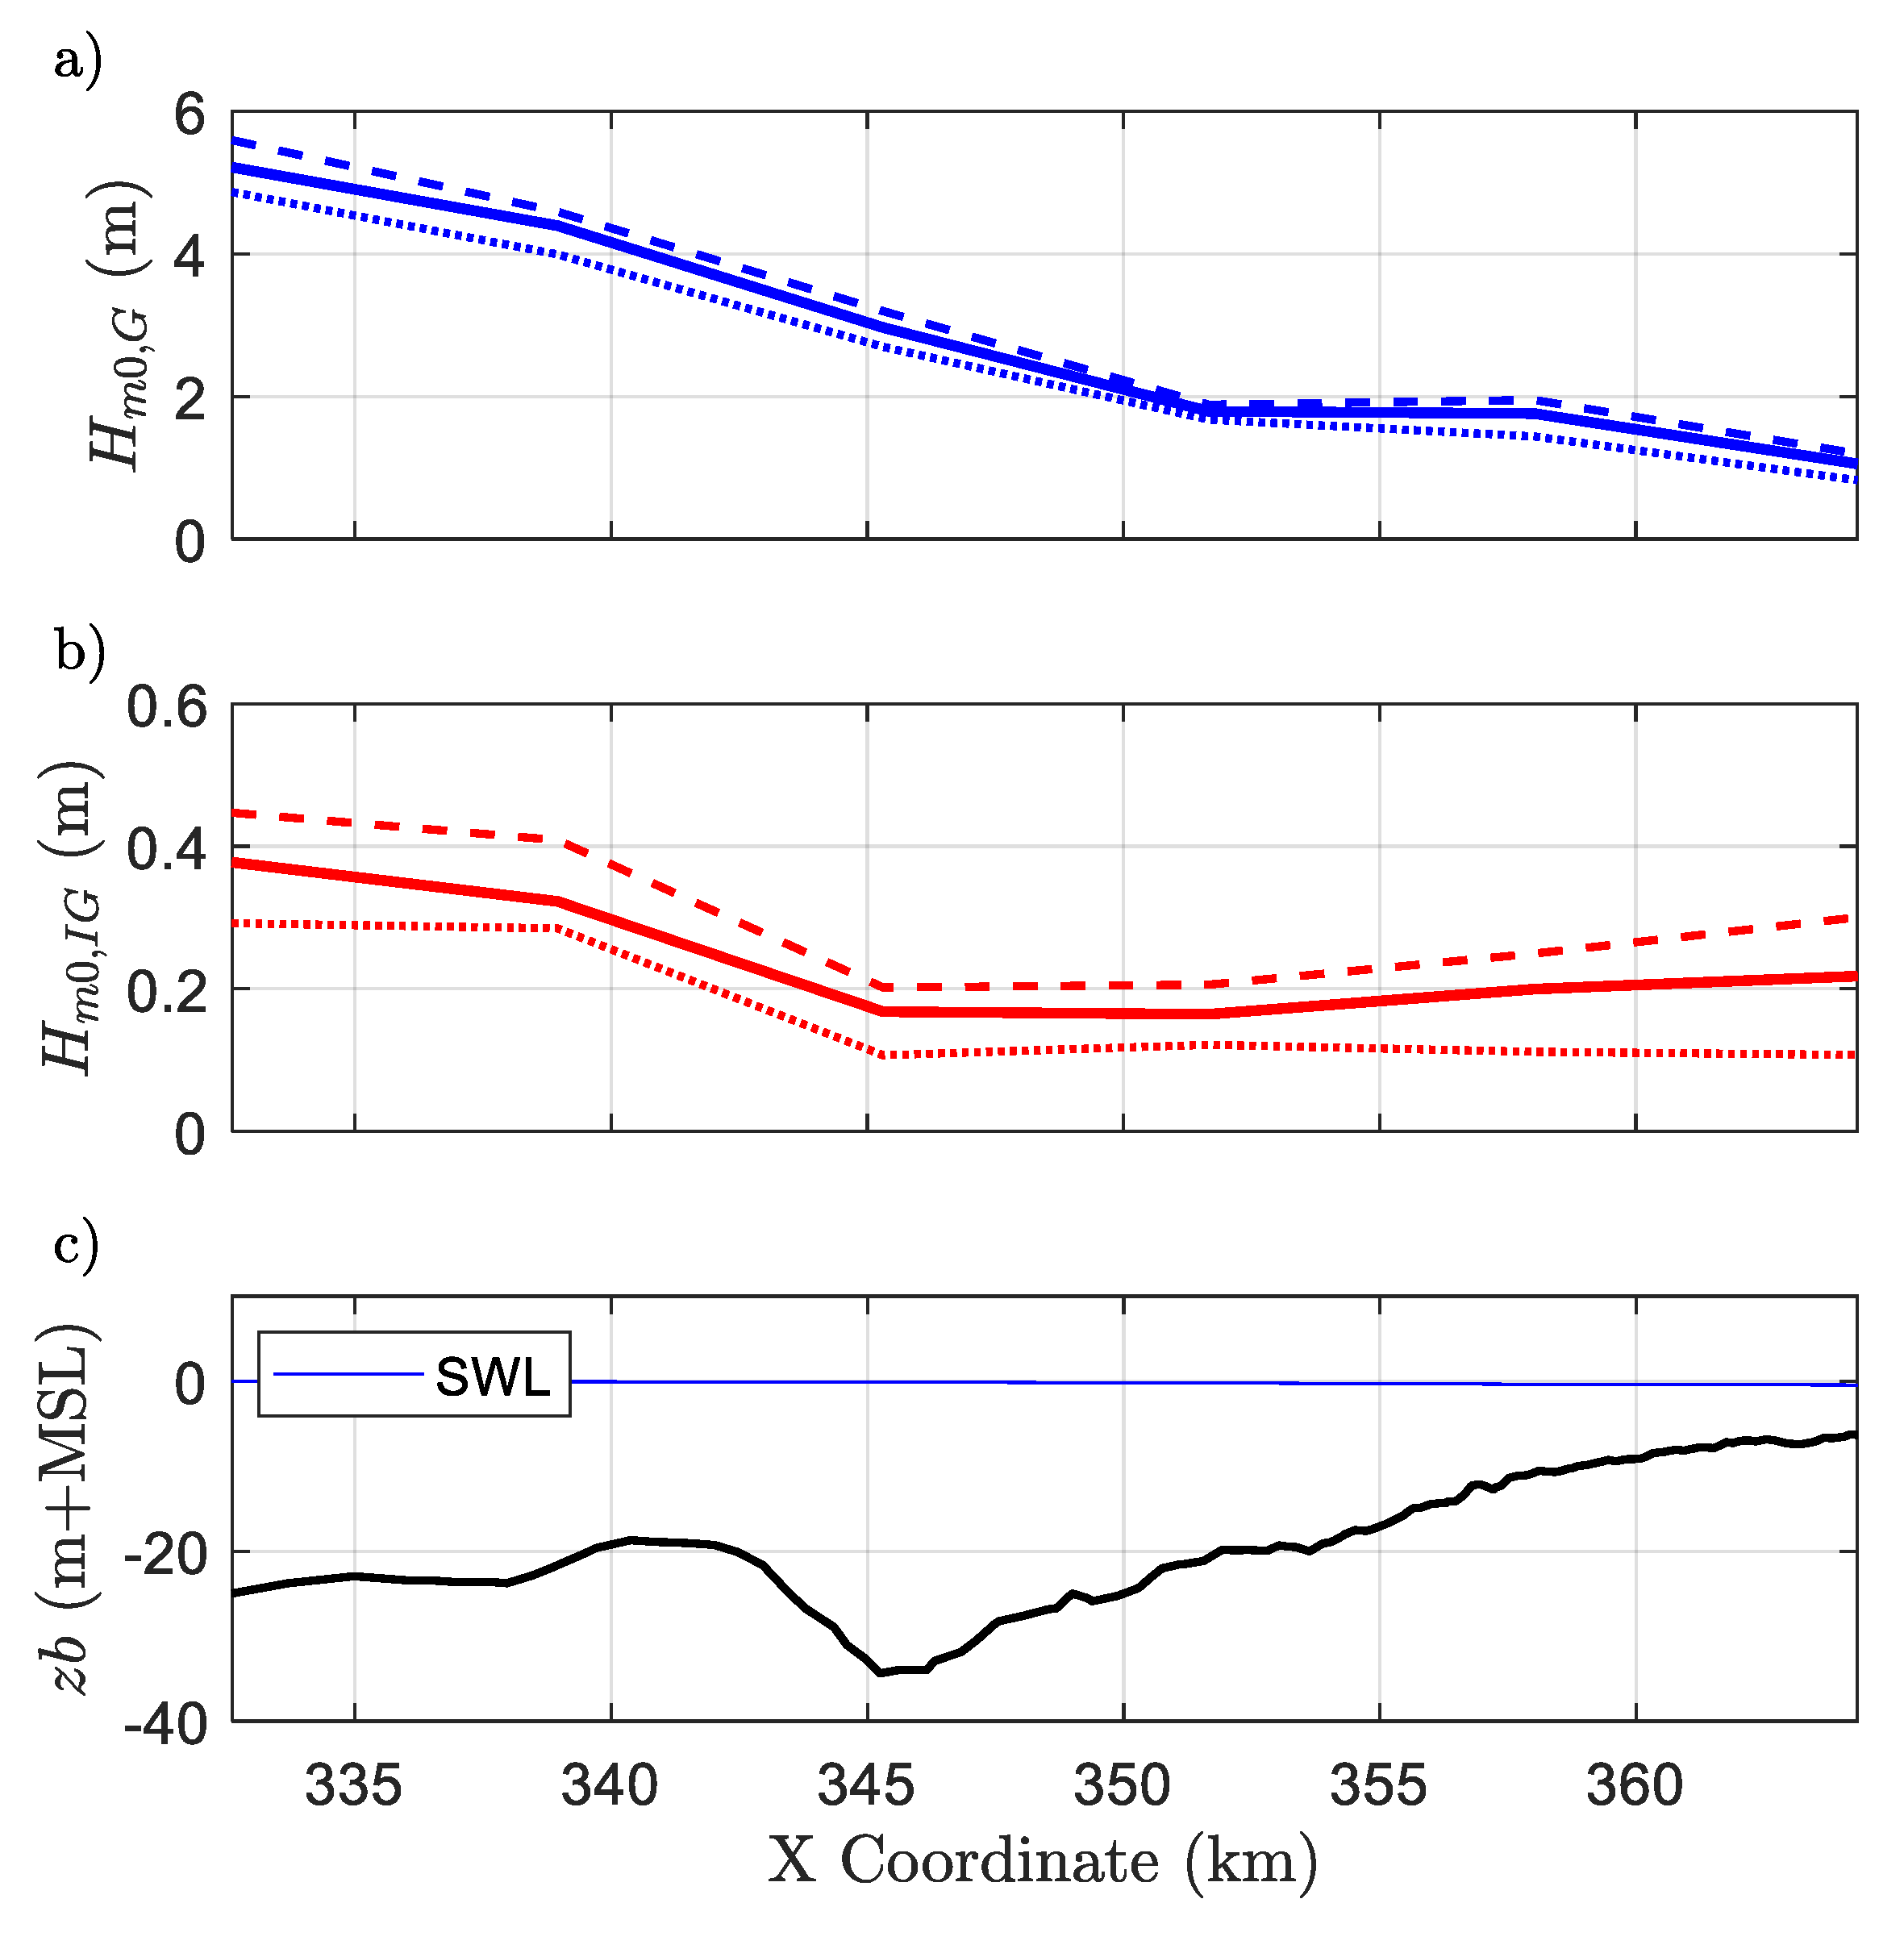
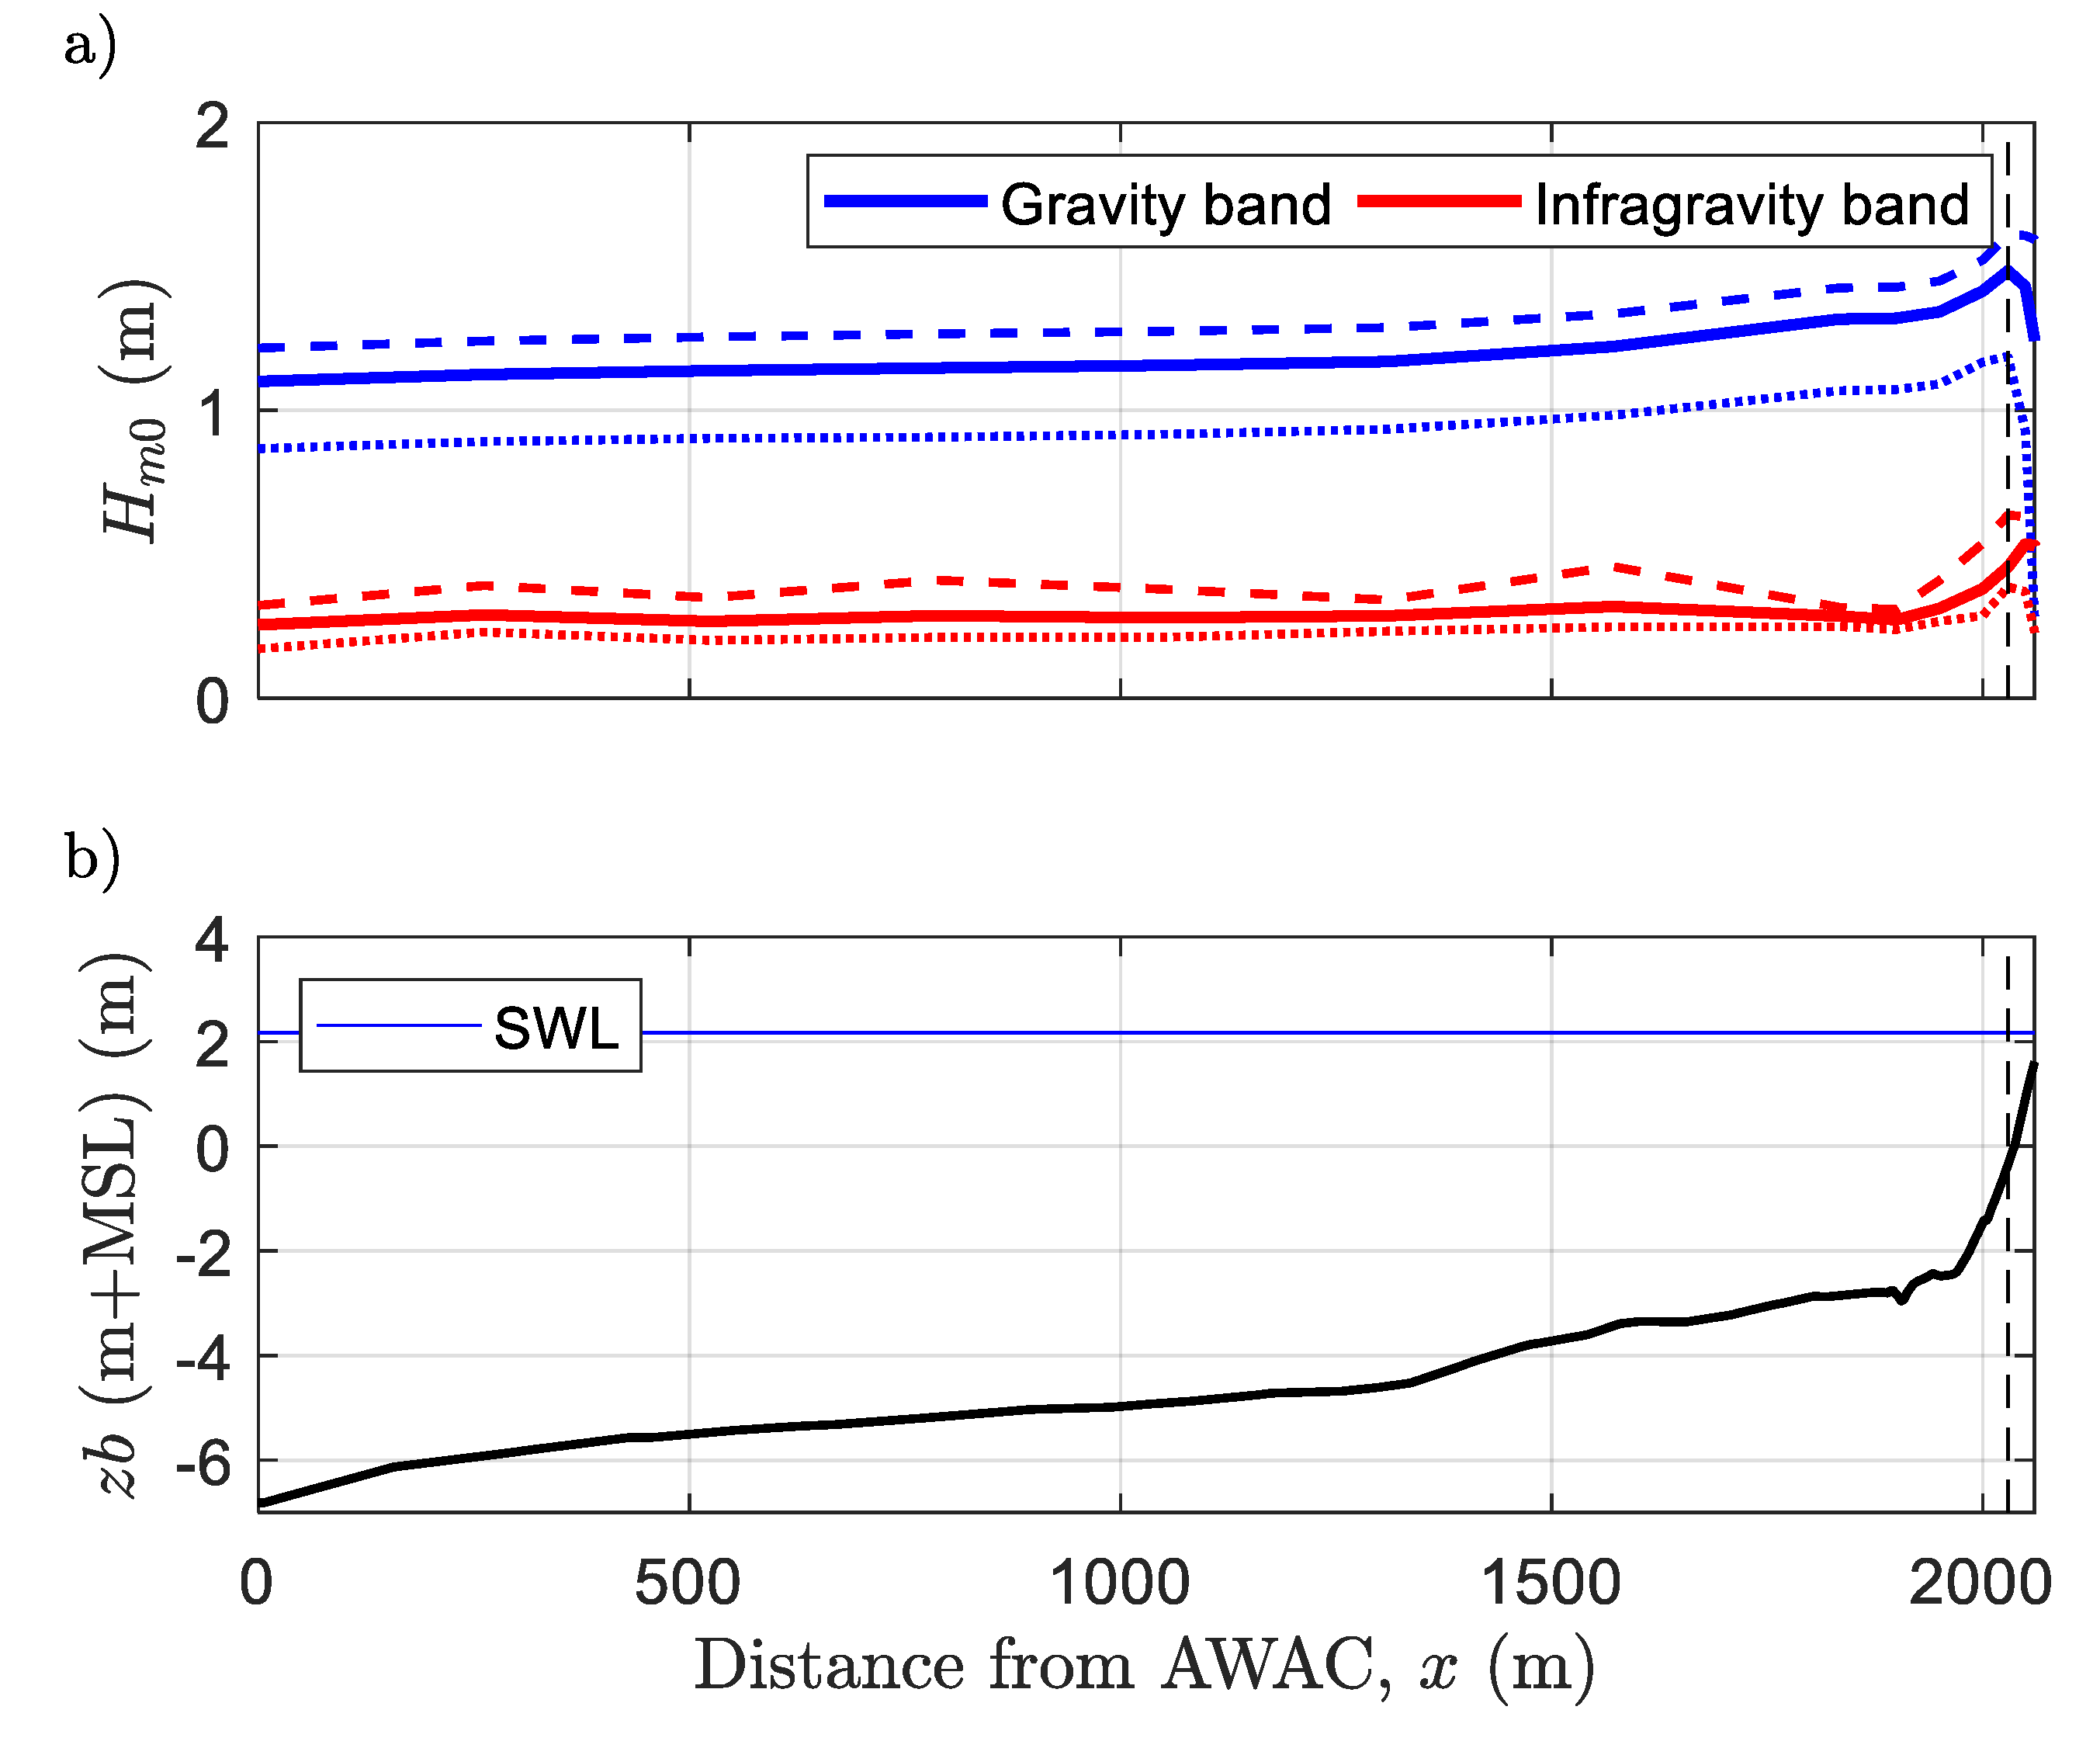
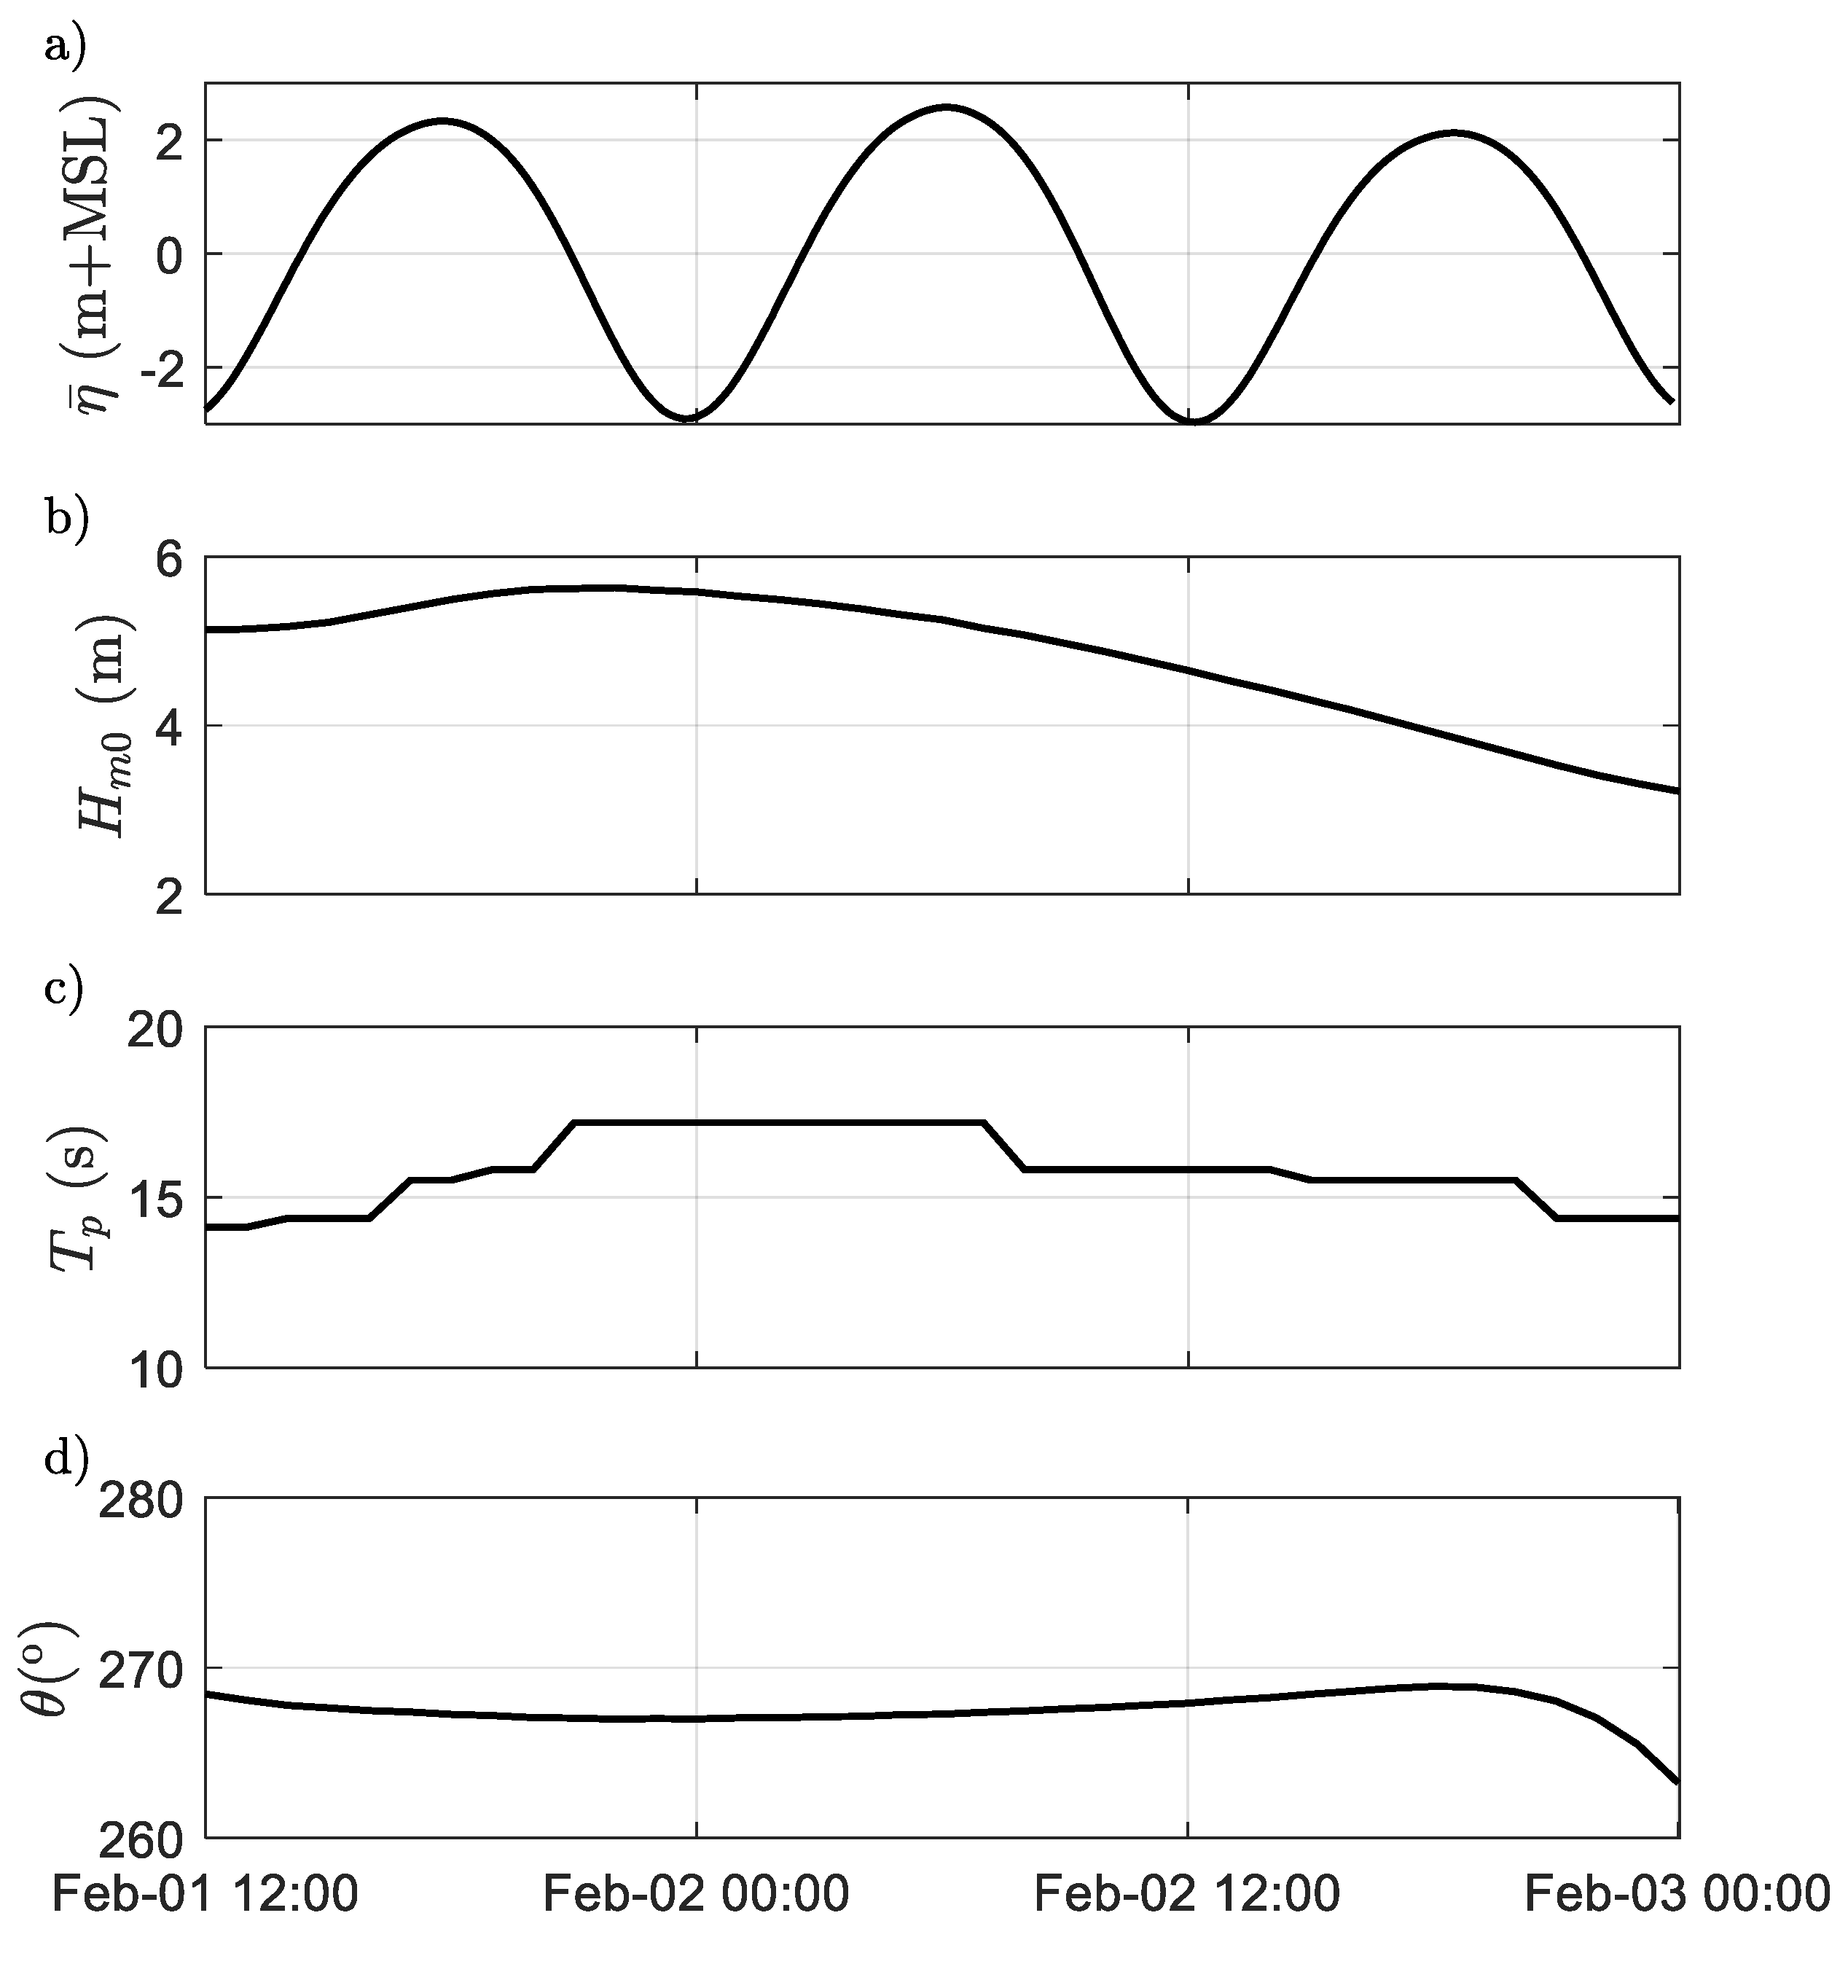
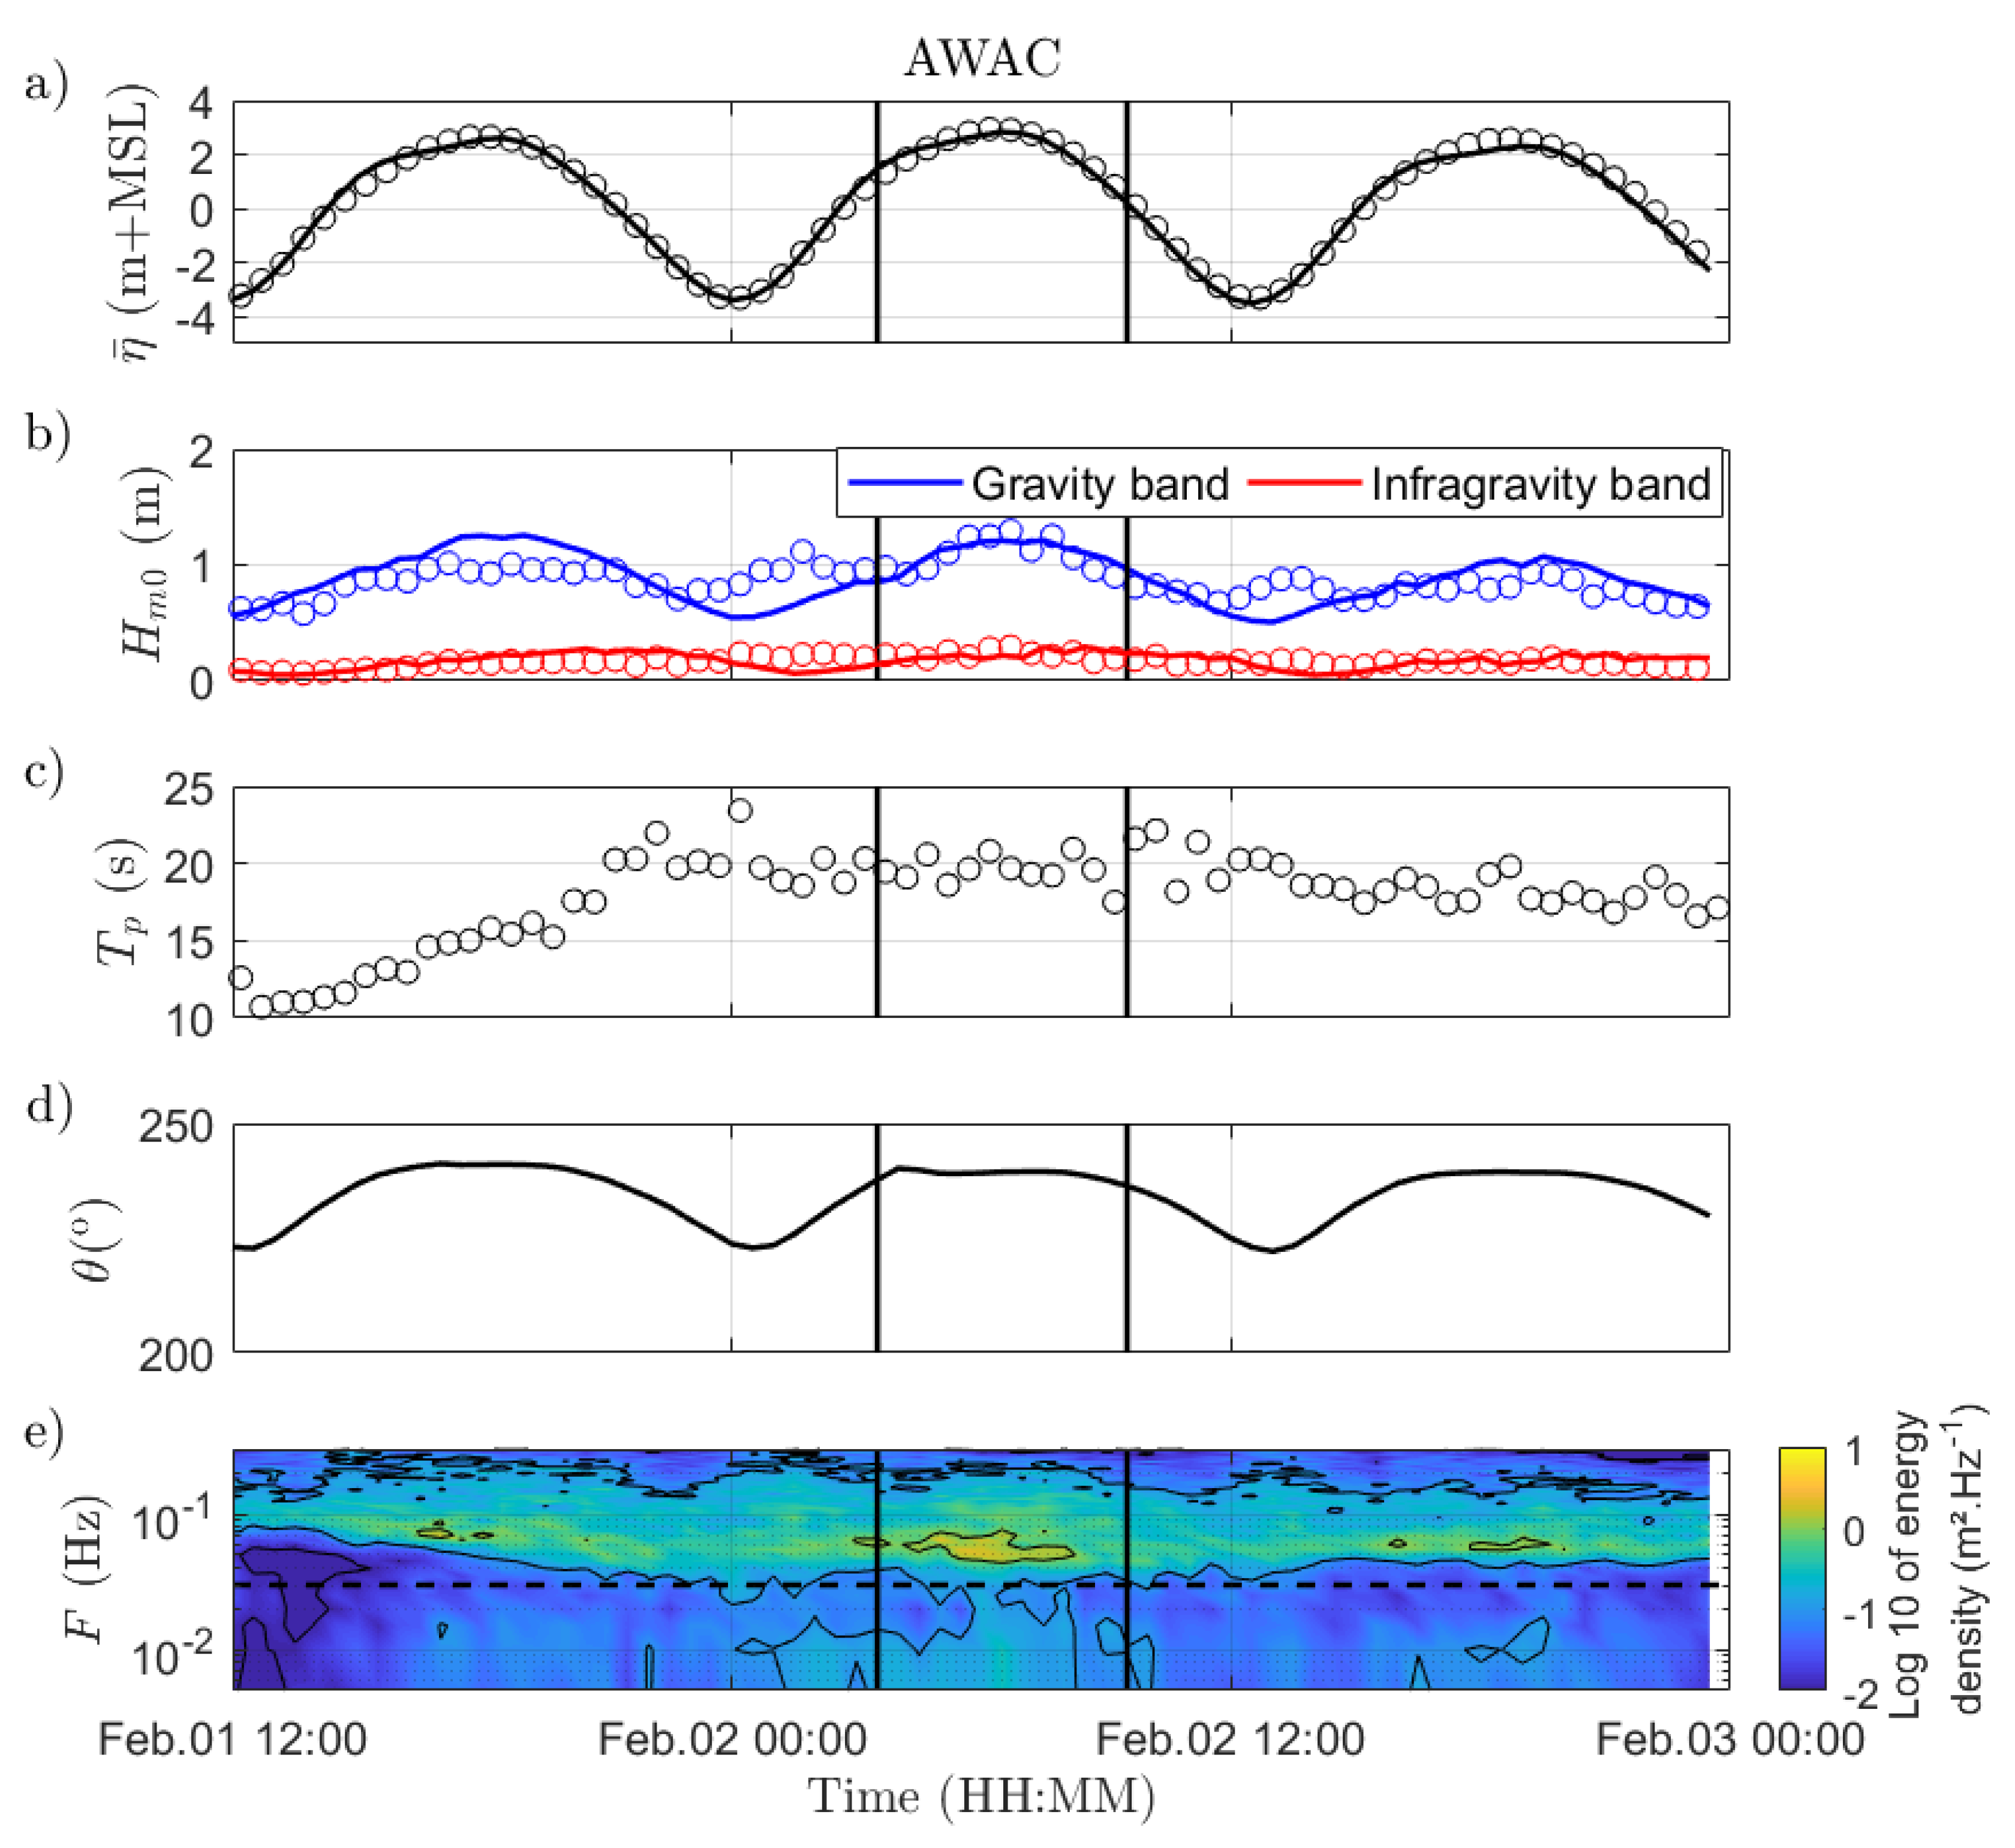
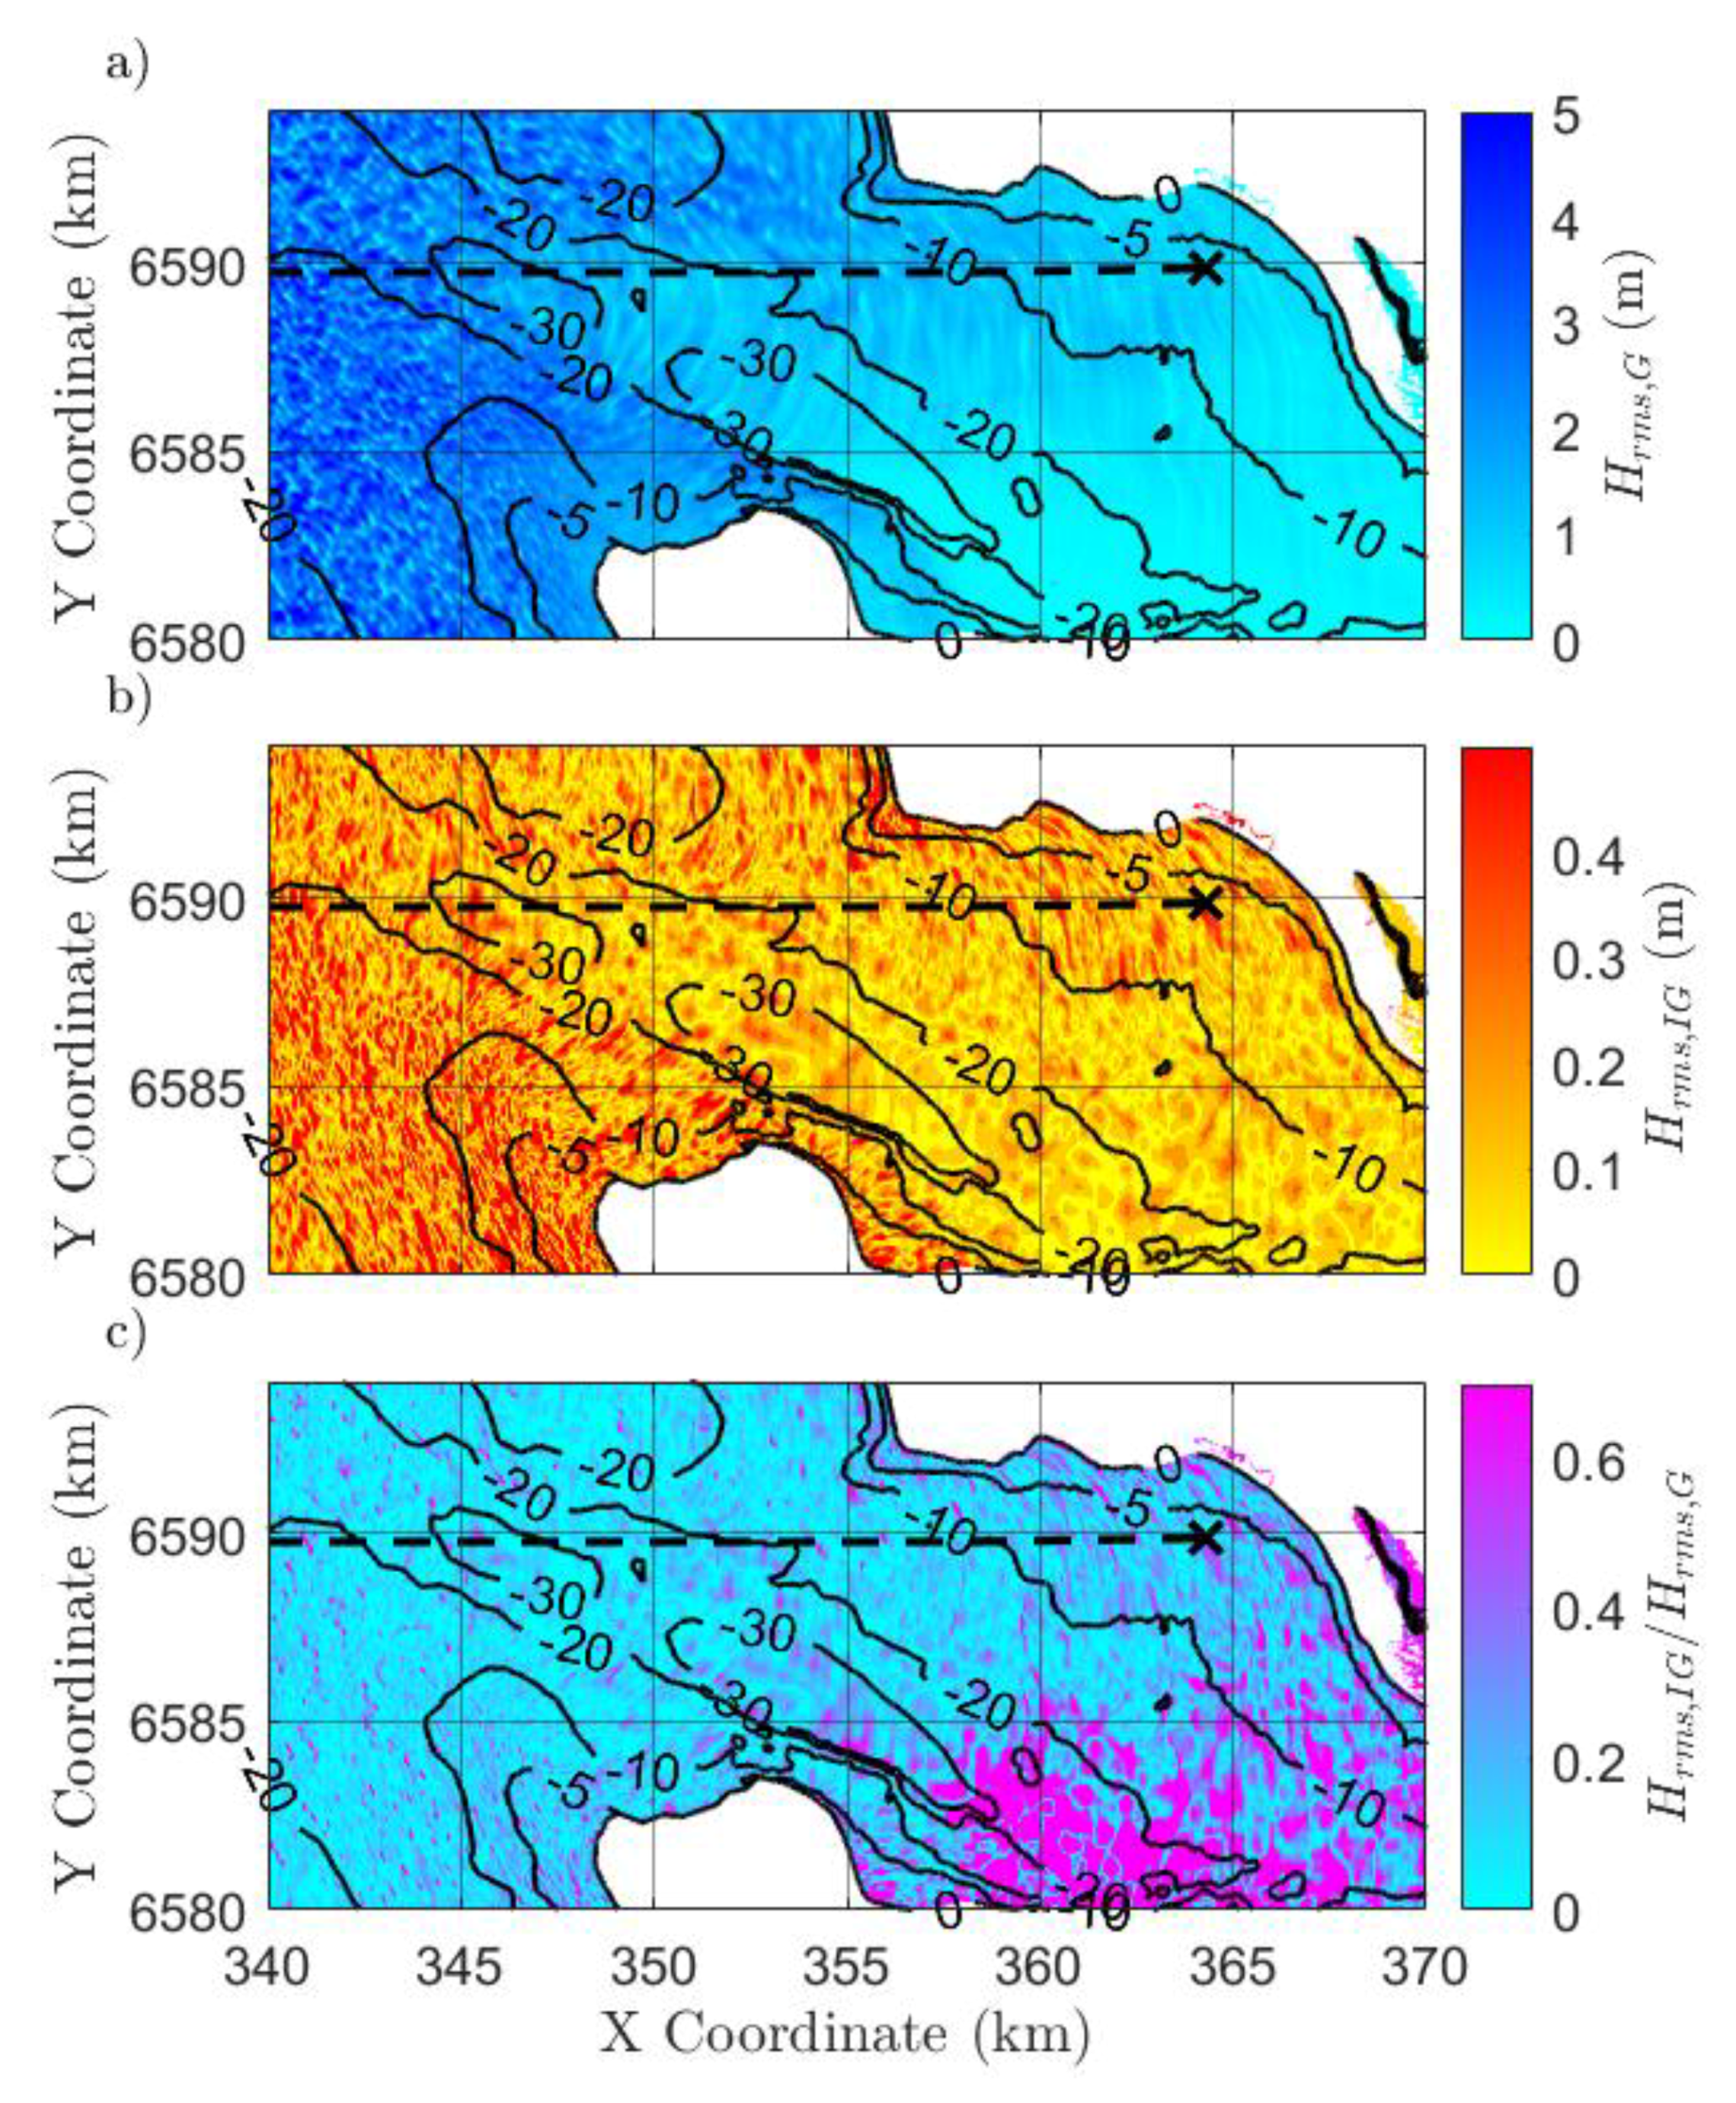
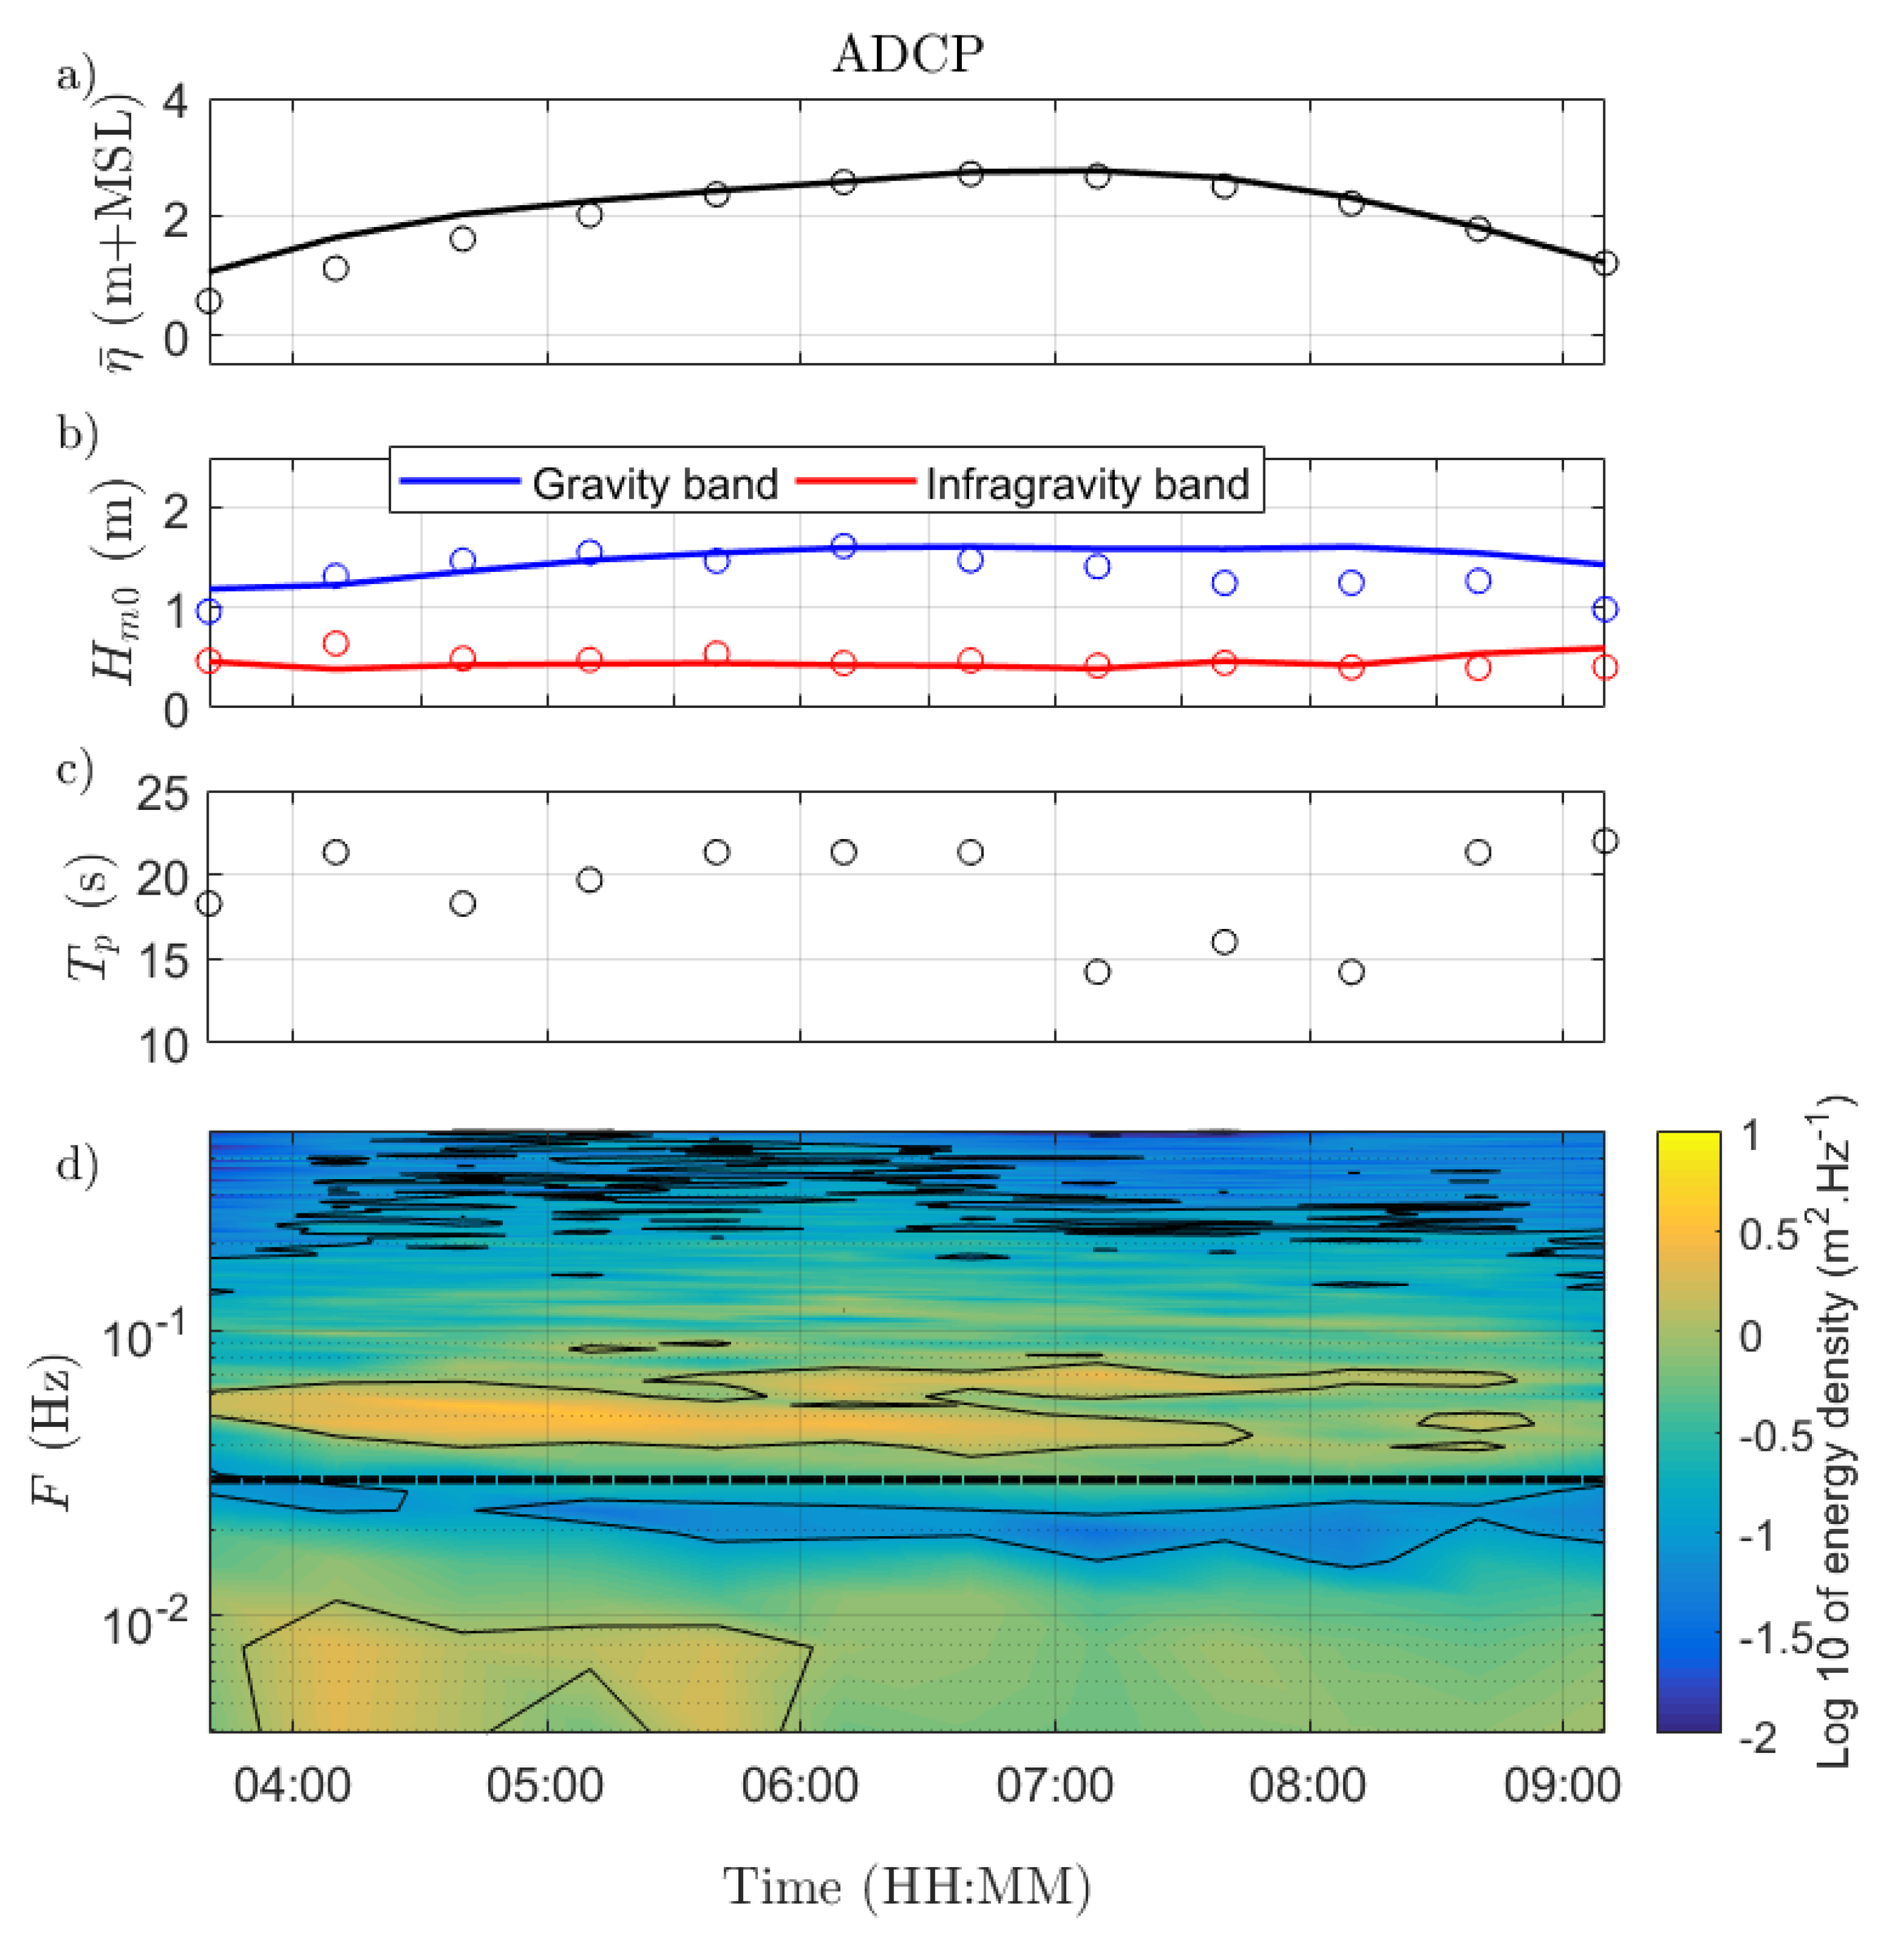
3.1. Wave Propagation Across the Embayment

In order to assess the accuracy of the 2DH model, the predicted η ¯ , H m 0 , G and H m 0 , I G were compared to the AWAC observations for the February 2nd event (Figure 4). The R M S E values for these parameters were 0.2 m, 0.17 m and 0.07 m, respectively. The underestimation of H m 0 , G at low tide is possibly due to the influence of local wind, which were not included in the hydrodynamic model. The three metrics showed R e l .   b i a s values of: −0.03, 0.02 and 0.03 for η   ¯ , H m 0 , G and H m 0 , I G , respectively; suggesting relatively unbiased predictions of each parameter. To supplement the missing directional data in the nearshore, the model was used to compute the mean wave direction ( θ ). An average θ of 238° was found in the shoreface (Figure 4d); confirming that waves approached the coast of La Faute-sur-Mer with near-perpendicular incidence.
In general, the 2DH hydrodynamic model showed reasonable agreement with the observations at the AWAC location; indicating that it was a suitable tool to investigate the hydrodynamic processes at the scale of the Pertuis Breton Embayment. A further analysis of the model results shows energetic offshore gravity waves which decrease in magnitude rapidly at the mouth of the embayment (Figure 5 and Figure 6). While entering the embayment, these waves refract towards the coastlines of La Faute-sur-Mer and Île de Ré as the water depth became increasingly shallower. While the gravity waves significantly decrease in amplitude from offshore to the AWAC location—by depth-induced breaking and bottom friction (Figure 5a)—the IG waves appear to propagate across the embayment relatively unchanged (Figure 5b). The result is an increase in the relative contribution of the IG waves ( H r m s , I G / H r m s , G ) in the nearshore (Figure 5c).
A closer look at the transect in Figure 6 (offshore to the shoreface) confirms that H m 0 , G is significantly reduced (80%) compared to a 44% reduction in H m 0 , I G , on average. These IG waves decayed at the entrance of the embayment (X ~ 340 to 350 km) concurrently with the higher frequency waves that force them; however, as the water depth became shallower, they experienced amplitude growth through the continuous transfer of energy from the gravity waves as they shoal over the mildly-sloping bathymetry (Figure 6b). On the other hand, the gravity waves continued to dissipate in shallow water (Figure 6a).
Ultimately, the results of the 2DH model were used as input for the nested 1D morphological model. This input comprised time series of: mean water levels ( η ¯ ); short-wave energy ( E ), as a measure of the gravity waves; the long-wave surface elevation ( z s ), as measure of the infragravity component; and the mean wave direction ( θ ). The results of which are presented and discussed in the following section.

3.2. Wave Run-up and Overwash of the Dune at La Faute-sur-Mer

In order to assess the performance of the 1D model, the predictions of η   ¯ (Figure 7a), H m 0 , G and H m 0 , I G (Figure 7b) were compared to observations. R M S E values were 0.26 m, 0.23 m and 0.11 m for the three metrics, respectively with corresponding R e l .   b i a s values of 0.09, 0.11 and −0.04, respectively. Overall, the model showed reasonable agreement with the observations of the ADCP which—together—indicate that IG waves were indeed significant, with H m 0 , I G exceeding 0.5 m during the storm (observed maximum of 0.64 m).
Though 1D, the model allowed for refraction (according to Snell’s law) and the generation of longshore currents. Furthermore, as the area is quite uniform in the alongshore direction (Figure 2) the 1D model can be seen as representative of actual conditions; however, with the exception that it excludes high-frequency swash at the shoreline. XB-SB is also able to simulate the reflection of the IG waves at the dune (Figure 8), with the incoming component ( H m 0 , I G , i n ) and outgoing component ( H m 0 , I G , o u t ) each estimated with reasonable accuracy: R M S E values of 0.06 m and 0.08 m, respectively; and R e l .   b i a s values of ~0 and −0.09, respectively. The underprediction of H m 0 , I G , o u t —though minor—does, however, result in the understimation of the bulk squared infragravity reflection coefficient ( R 2 = H m 0 , I G , o u t 2 / H m 0 , I G , i n 2 ) with R M S E = 0.35 and R e l .   b i a s = −0.18. This understimation of R 2 indicates that the model overestimated the nearshore IG wave dissipation [35].
The nested model was also run with morphology and sediment transport formulations disabled to assess the modeled run-up and overtopping of the dune without any erosion. The simulated run-up time series shows that at the peak of the storm (between 6:30 and 7:30), the run-up reaches and overtops the dune crest (elevation 3.92 m+MSL) (Figure 9). The maximum modeled run-up ( R m a x ) of 4.09 m corresponded well with that observed by the PT (4.08 m) on the dune. As XBeach excludes high-frequency swash at the shoreline, these findings highlight the significance of low-frequency motions in dune overwash at La Faute-sur-Mer and similar coastlines.
With morphology and sediment transport enabled, the model accurately simulated the lowering and development of a washover deposit behind the dune (Figure 10) with a B S S of 0.78, which is considered good [36]. It is also worth noting that the model—without the bermslope option—completely overestimates the volume of erosion and is unable to reproduce the steep post-storm dune profile (Figure 10). The sensitivity of the model to the bermslope parameter value is also shown in Figure 10.
A look at the transformation of H m 0 , along the transect to the dune, shows that both gravity and IG-band waves are able to propagate over the mildy-sloping foreshore without further significant change (Figure 11). However, as the water depth becomes shallower at the dune toe (x = 2060 m), waves in both frequency bands experience amplitude growth, resulting in a 11% increase in H m 0 , G and a 109% increase in H m 0 , I G —on average—compared to conditions at the AWAC location (x = 0 m); with the average ratio of IG- to gravity-band wave energy ( H m 0 , I G / H m 0 , G ) equalled to 0.42. While the amplitude growth of the gravity waves is due to shoaling in shallow water, the apparent doubling in amplitude of the IG wave at the dune toe is the combined result of shoaling and—to a greater extend—the superpositioning of the incoming and reflected IG waves. These findings further speak to the importance of accurately representing the infragravity wave component in shallow coastal environments.

4. Conclusions

In the present paper, we demonstrated that the XB-SB numerical model may be confidently applied—on a large scale (45 × 25 km domain)—to simulate the hydro-morphodynamcs of a complex embayment, under extreme conditions. Despite its limitations as a short-wave averaged but wave-group resolving model, the unconvential 2DH/1D approach was able to accurately reproduce both the large-scale hydrodynamics—wave heights and mean water levels across the embayment; and the local morphodynamics—steep post-storm dune profile and washover deposit.
The combined field data and numerical model results showed that offshore energetic gravity waves are significantly reduced by refraction, bottom friction and breaking over the shallow bathymetry; while infragravity waves are able to propagate into shallow water without being extensively changed. Thus, the relative contribution of the IG waves increased from less than 0.2 offshore to over 0.7 along the coast of La Faute-sur-Mer. Findings also showed that the noteworthy amount of IG-wave energy found at the dune toe—with the observed H m 0 , I G as high as 0.64 m—was the result of the superpositoning of the incoming and reflected IG waves. Given that the approach adopted here neglects the influence of gravity-band swash at the shoreline, our findings emphasize the significance of IG waves in washover development along the embayment; as XB-SB was able to accurately reproduce both the observed maximum water level at the dune crest and the extent of the resulting washover deposit.
Our work highlights the need for any method or model to account for IG-wave dynamics when applied to similar environnments. As many of the widely-used large domain phase-averaged models (e.g., SWAN/Delft3D) tend to exclude the often-dominant contribution of IG waves [37,38], the XB-SB coupled 2DH/1D approach described here may prove to be a suitable alternative.

Author Contributions

Conceptualization, C.L. and D.R.; methodology, C.L and X.B.; software, D.R.; validation, C.L.; formal analysis, C.L. and X.B.; investigation, X.B. and G.A.; resources, X.B. and D.R.; data curation, X.B.; writing—original draft preparation, C.L.; writing—review and editing, X.B. and D.R.; visualization, X.B. and C.L.; supervision, D.R. and X.B.; project administration, C.L.; funding acquisition, D.R.

Funding

This work is part of the Perspectief research programme All-Risk with project number B2 which is (partly) financed by NWO Domain Applied and Engineering Sciences, in collaboration with the following private and public partners: the Dutch Ministry of Infrastructure and Water Management (RWS); Deltares; STOWA; the regional water authority, Noorderzijlvest; the regional water authority, Vechtstromen; It Fryske Gea; HKV consultants; Natuurmonumenten; and waterboard HHNK.

Acknowledgments

Preliminary results of the research described here was first presented and published [39] at the Coastlab 2018 conference (May 22–26, Santander, Spain); the conference is acknowledged for providing the platform to present the described research.

Conflicts of Interest

The authors declare no conflict of interest.

References

  1. Bertin, X.; Bakker, A.D.; Dongeren, A.V.; Coco, G.; Andre, G.; Ardhuin, F.; Bonneton, P.; Bouchette, F.; Castelle, B.; Craw, W.C. Infragravity Waves: From Driving Mechanisms to Impacts. Earth-Sci. Rev. 2018, 177, 774–799. [Google Scholar] [CrossRef]
  2. Sallenger, A.H. Storm Impact Scale for Barrier Islands. J. Coast. Res. 2000, 16, 890–895. [Google Scholar]
  3. Hunt, I.A. Design of Seawalls and Breakwaters. J. Waterw. Harb. Div. 1959, 85, 123–152. [Google Scholar]
  4. Holman, R.A. Extreme Value Statistics for Wave Run-up on a Natural Beach. Coast. Eng. 1986, 9, 527–544. [Google Scholar] [CrossRef]
  5. Hedges, T.S.; Mase, H. Modified Hunt’s Equation Incorporating Wave Setup. J. Waterw. Port Coast. Ocean Eng. 2004, 130, 109–113. [Google Scholar] [CrossRef]
  6. Stockdon, H.F.; Holman, R.A.; Howd, P.A.; Sallenger, A.H. Empirical Parameterization of Setup, Swash, and Runup. Coast. Eng. 2006, 53, 573–588. [Google Scholar] [CrossRef]
  7. Mather, A.; Stretch, D.; Garland, G. Predicting Extreme Wave Run-up on Natural Beaches for Coastal Planning and Management. Coast. Eng. J. 2011, 53, 87–109. [Google Scholar] [CrossRef]
  8. Soldini, L.; Antuono, M.; Brocchini, M. Numerical Modeling of the Influence of the Beach Profile on Wave Run-up. J. Waterw. Port Coast. Ocean Eng. 2013, 139, 61–71. [Google Scholar] [CrossRef]
  9. Park, H.; Cox, D.T. Empirical Wave Run-up Formula for Wave, Storm Surge and Berm Width. Coast. Eng. 2016, 115, 67–78. [Google Scholar] [CrossRef]
  10. Mayer, R.; Kriebel, D. Wave Run-up on Composite-slope and Concave Beaches. Coast. Eng. 1994, 1, 2325–2339. [Google Scholar]
  11. Shand, R.D.; Shand, T.D.; McComb, P.J.; Johnson, D.L. Evaluation of Empirical Predictors of Extreme Run-up Using Field Data. In Coasts and Ports 2011: Diverse and Developing: Proceedings of the 20th Australasian Coastal and Ocean Engineering Conference and the 13th Australasian Port and Harbour Conference; Engineers Australia: Barton, Australia, 2011; p. 669. [Google Scholar]
  12. Power, H.E.; Atkinson, A.L.; Hammond, T.; Baldock, T.E. Accuracy of Wave Run-up Formula on Contrasting Southeast Australian Beaches. In Coasts and Ports 2013: 21st Australasian Coastal and Ocean Engineering Conference and the 14th Australasian Port and Harbour Conference; Engineers Australia: Barton, Australia, 2013; pp. 1–6. [Google Scholar]
  13. Stockdon, H.F.; Thompson, D.M.; Plant, N.G.; Long, J.W. Evaluation of Wave Run-up Predictions from Numerical and Parametric Models. Coast. Eng. 2014, 92, 1–11. [Google Scholar] [CrossRef]
  14. Roelvink, D.; Reniers, A.; Dongeren, A.V.; De Vries, J.V.T.; Mccall, R.; Lescinski, J. Modeling Storm Impacts on Beaches, Dunes and Barrier Islands. Coast. Eng. 2009, 56, 1133–1152. [Google Scholar] [CrossRef]
  15. Bellotti, G.; Archetti, R.; Brocchini, M. Experimental Validation and Characterization of Mean Swash Zone Boundary Conditions. J. Geophys. Res. Oceans. 2003, 108, 3250. [Google Scholar] [CrossRef]
  16. Van Santen, R.; Steetzel, H.; De Vries, J.V.T.; Van Dongeren, A. Modeling Storm Impact on Complex Coastlines. Westkapelle, The Netherlands. Coast. Eng. Proc. 2012, 1, 52. [Google Scholar] [CrossRef]
  17. Grzegorzewski, A.S.; Johnson, B.D.; Wamsley, T.V.; Rosati, J.D. Sediment Transport and Morphology Modeling of Ship Island, Mississippi, USA, During Storm Events. Coast. Dyn. 2013, 1505–1516. [Google Scholar]
  18. Van Dongeren, A.; Lowe, R.; Trang, D.M.; Roelvink, D.; Symonds, G.; Ranasinghe, R. Numerical Modeling of Low-frequency Wave Dynamics over a Fringing Coral Reef. Coast. Eng. 2013, 73, 178–190. [Google Scholar] [CrossRef]
  19. McCall, R.T.; Masselink, G.; Poate, T.G.; Roelvink, J.A.; Almeida, L.P. Modeling the Morphodynamics of Gravel Beaches During Storms with Xbeach-g. Coast. Eng. 2015, 103, 52–66. [Google Scholar] [CrossRef]
  20. Bertin, X.; Olabarrieta, M. Relevance of Infragravity Waves in a Wave-dominated Inlet. J. Geophys. Res. Oceans 2016, 121, 5418–5435. [Google Scholar] [CrossRef]
  21. Lashley, C.H.; Roelvink, D.; Van Dongeren, A.; Buckley, M.L.; Lowe, R.J. Nonhydrostatic and Surfbeat Model Predictions of Extreme Wave Run-up in Fringing Reef Environments. Coast. Eng. 2018, 137, 11–27. [Google Scholar] [CrossRef]
  22. Breilh, J.-F.; Bertin, X.; Chaumillon, E.; Giloy, N.; Sauzeau, T. How Frequent is Storm-induced Flooding in the Central Part of the Bay of Biscay? Glob. Planet. Chang. 2014, 122, 161–175. [Google Scholar] [CrossRef]
  23. Nicolle, A.; Karpytchev, M. Evidence for Spatially Variable Friction from Tidal Amplification and Asymmetry in the Pertuis Breton (France). Cont. Shelf Res. 2007, 27, 2346–2356. [Google Scholar] [CrossRef]
  24. Bertin, X.; Li, K.; Roland, A.; Bidlot, J.-R. The Contribution of Short-waves in Storm Surges: Two Case Studies in the Bay of Biscay. Cont. Shelf Res. 2015, 96, 1–15. [Google Scholar] [CrossRef]
  25. Lumbroso, D.M.; Vinet, F. A Comparison of the Causes, Effects and Aftermaths of the Coastal Flooding of England in 1953 and France in 2010. Nat. Hazards Earth Syst. Sci. 2011, 11, 2321–2333. [Google Scholar] [CrossRef]
  26. Roelvink, D.; McCall, R.; Mehvar, S.; Nederhoff, K.; Dastgheib, A. Improving Predictions of Swash Dynamics in Xbeach: The Role of Groupiness and Incident-band Runup. Coast. Eng. 2018, 134, 103–123. [Google Scholar] [CrossRef]
  27. Daly, C.; Roelvink, D.; Van Dongeren, A.; De Vries, J.V.T.; McCall, R. Short Wave Breaking Effects on Low Frequency Waves. Coast. Eng. Proc. 2011, 1, 20. [Google Scholar] [CrossRef]
  28. Ruessink, B.G.; Miles, J.R.; Feddersen, F.; Guza, R.T.; Elgar, S. Modeling the Alongshore Current on Barred Beaches. J. Geophys. Res. Oceans. 2001, 106, 22451–22463. [Google Scholar] [CrossRef]
  29. Saha, S.; Moorthi, S.; Pan, H.L.; Wu, X.R.; Wang, J.D.; Nadiga, S.; Tripp, P.; Kistler, R.; Woollen, J.; Behringer, D.; et al. The NCEP Climate Forecast System Reanalysis. Bull. Am. Meteorol. Soc. 2010, 91, 1015–1058. [Google Scholar] [CrossRef]
  30. Castelle, B.; Marieu, V.; Bujan, S.; Splinter, K.D.; Robinet, A.; Senechal, N.; Ferreira, S. Impact of the Winter 2013–2014 Series of Severe Western Europe Storms on a Double-barred Sandy Coast: Beach and Dune Erosion and Megacusp Embayments. Geomorphology 2015, 238, 135–148. [Google Scholar] [CrossRef]
  31. Masselink, G.; Scott, T.; Russell, P.; Davidson, M.; Conley, D. The Extreme 2013/2014 Winter Storms: Hydrodynamic Forcing and Coastal Response Along the Southwest Coast of England. Earth Surf. Process. Landf. 2016, 41, 378–391. [Google Scholar] [CrossRef]
  32. Roelvink, D.; Costas, S. Beach Berms as an Essential Link Between Subaqueous and Subaerial Beach/Dune Profiles. IX J. Geomorfol. Litoral 2017, 17, 79–82. [Google Scholar]
  33. Roelvink, J.A.; Stive, M.J.F. Bar-generating Cross-shore Flow Mechanisms on a Beach. J. Geophys. Res. Oceans (1978–2012) 1989, 94, 4785–4800. [Google Scholar] [CrossRef]
  34. Guza, R.; Thornton, E.; Holman, R. Swash on Steep and Shallow Beaches. In Proceedings of the 9th International Conference on Coastal Engineering, Houston, TX, USA, 3–7 September 1984. [Google Scholar]
  35. Rijnsdorp, D.P.; Ruessink, G.; Zijlema, M. Infragravity-wave Dynamics in a Barred Coastal Region, a Numerical Study. J. Geophys. Res. Oceans 2015, 120, 4068–4089. [Google Scholar] [CrossRef]
  36. Sutherland, J.; Peet, A.H.; Soulsby, R.L. Evaluating the Performance of Morphological Models. Coast. Eng. 2004, 51, 917–939. [Google Scholar] [CrossRef]
  37. Buckley, M.; Lowe, R.; Hansen, J. Evaluation of Nearshore Wave Models in Steep Reef Environments. Ocean Dyn. 2014, 64, 847–862. [Google Scholar] [CrossRef]
  38. Roeber, V.; Bricker, J.D. Destructive Tsunami-like Wave Generated by Surf Beat Over a Coral Reef During Typhoon Haiyan. Nat. Commun. 2015, 6, 7854. [Google Scholar] [CrossRef] [PubMed]
  39. Lashley, C.H.; Bertin, X.; Roelvink, D. Field Measurements and Numerical Modeling of Wave Run-up and Overwash in the Pertuis Breton Embayment, France. In Proceedings of the 7th International Conference on the Application of Physical Modelling in Coastal and Port Engineering and Science (Coastlab18), Santander, Spain, 22–26 May 2018. [Google Scholar]
Figure 1. Bathymetric plot of the study area. Data sources: Service Hydrographique et Océanographique de la Marine (outer part of the estuary); Littoral Environnement et Sociétés (LIENSs) single beam sounder (shoreface); and Light Detection and Ranging (LIDAR originating from the Litto3D project) (supratidal zone). The white line shows the transect of instrument locations.
Jmse 07 00205 g001
Figure 2. Instrument locations (red dots) in the nearshore. Solid white line corresponds to that in Figure 1, for reference.
Jmse 07 00205 g002
Figure 3. Offshore (a) mean water level; (b) significant wave height; (c) peak period; and (d) mean wave direction as modeled by WWIII (boundary conditions for the 2DH XBeach model) for February 1st to 3rd 2014.
Jmse 07 00205 g003
Figure 4. Modeled (solid) and observed (circles): (a) mean water levels; (b) significant wave heights; (c) peak periods; (d) mean wave direction; and (e) observed energy density, for the 2 February 2014 event (bounded by vertical lines) at the AWAC location. Contours in panel ‘e’ indicate areas of equal energy density and the dashed line separates gravity and IG frequencies.
Jmse 07 00205 g004
Figure 5. Snapshots of modeled instantaneous root-mean-square wave heights ( H r m s ) in both the (a) gravity and (b) IG bands; with (c) relative contribution of the IG waves ( H r m s , I G / H r m s , G ) across the embayment at the peak of the February 2nd event (at time = 06:00). Dashed lines correspond to transect in Figure 6 and ‘X’ represents the AWAC location. Depth contours are provided for reference.
Jmse 07 00205 g005
Figure 6. Transect across embayment showing the transformation of modeled maximum (dashed), mean (solid) and minimum (dotted): (a) gravity waves; and (b) infragravity waves, with (c) bed level for reference, for the February 2nd event (from time = 03:30 to 09:30).
Jmse 07 00205 g006
Figure 7. Modeled (solid lines) and observed (circles): (a) mean water level; (b) significant wave heights in the gravity and infragravity bands; (c) peak wave period; and (d) observed energy density, for the 2 February 2014 event taken at the ADCP location. Contours in panel ‘d’ indicate areas of equal energy density and the dashed line separates gravity and IG frequencies.
Jmse 07 00205 g007
Figure 8. Modeled (solid lines) and observed (circles): (a) incoming and (b) outgoing IG significant wave heights; and (c) bulk squared IG reflection coefficient, for the 2 February 2014 event taken at the ADCP location.
Jmse 07 00205 g008
Figure 9. Modeled surface elevation at the shoreline (blue), run-up maxima (circles) for the 2 February 2014 event. Red line highlights the overtopping events. Dashed black line corresponds to the observed R m a x The elevation of the dune crest is 3.92 m+MSL, for reference.
Jmse 07 00205 g009
Figure 10. Modeled and observed dune erosion for the 2 February 2014 event.
Jmse 07 00205 g010
Figure 11. Transect across foreshore corresponding to Figure 2 showing the transformation of modeled maximum (dashed), mean (solid) and minimum (dotted): (a) gravity and infragravity waves, with (b) bed level for reference, for the February 2nd event (from time = 03:30 to 09:30). Dashed vertical lines indicate ADCP location.
Jmse 07 00205 g011

