Article

Mapping the Sandy Beach Evolution Around Seaports at the Scale of the African Continent

1
Faculty of Civil Engineering and Geosciences, Delft University of Technology, PO Box 5048, 2600 GA Delft, The Netherlands
2
Department of Harbour Coastal & Offshore Engineering, Deltares, PO Box 177, 2600 MH Delft, The Netherlands
3
School of Earth and Environmental Sciences, University of Queensland, St Lucia, Brisbane, QLD 4072, Australia
4
Faculty of Technology, Policy and Management, Delft University of Technology, PO Box 5015, 2600 GA Delft, The Netherlands
5
Institute for Water Research, Rhodes University, PO Box 94, Grahamstown 6140, South Africa
*
Author to whom correspondence should be addressed.
J. Mar. Sci. Eng. 2019, 7(5), 151; https://doi.org/10.3390/jmse7050151
Submission received: 19 April 2019 / Revised: 6 May 2019 / Accepted: 13 May 2019 / Published: 16 May 2019
(This article belongs to the Section Coastal Engineering)

Abstract

:
In Africa, several new seaport developments are being considered. In sedimentary environments, such port developments can have adverse impacts on the evolution of adjacent coastlines. To learn from past port engineering practice, we created a unique database containing the coastline evolution and characteristics of 130 existing African seaports. Whereas the systematic mapping of coastal impacts was previously hampered by data availability, innovative automated satellite image processing techniques have enabled us to intercompare ports at an unprecedented continental scale. We found large geographical differences with respect to the beach evolution. The total detected changes in the beach area between 1984 and 2018 totaled 44 km2, of which ca. 23 km2 is accretion and ca. 21 km2 is erosion. The top 10% “hotspot” ports account for more than 65% of these changes. These hotspots exhibit common characteristics, namely: they are located on open coastlines, have large alongshore sediment transport potential, and have large cross-shore breakwaters. Although these driving characteristics are well established in coastal engineering theory, our results indicate that the beaches adjacent to the existing seaports have been and remain seriously affected by these drivers. Our results can be used to inform beach maintenance strategies for existing seaports and to support planners and engineers to minimize long-term coastal impacts of port expansions and new port developments in Africa in the future.

1. Introduction

Port throughput in Africa is expected to grow from 265 million tons in 2009 to over 2 billion tons in 2040 [1]. To facilitate this growth in throughput, several new seaport developments are being planned and constructed [1]. At the same time, awareness of the need to harmonize seaports with ecosystems and society is growing [2,3,4,5]. In sedimentary environments, the adverse impacts of port structures on the evolution of the adjacent coastline are often of concern [6,7,8,9,10,11]. These adverse impacts potentially threaten livelihoods and ecological habitats adjacent to the port as well as the operability of the port itself.
The potential hazards associated with the coastline evolution around seaports are of concern to port planning and decision making. Coastal erosion can cause the undermining of coastal infrastructures, increased flood risk, economic losses, and decline of natural habitats [7,9,12,13]. Coastline accretion can lead to increased siltation of the port’s access channel and basin, and increase maintenance dredging requirements [9,10,14,15]. Coastline evolution is affected by both natural and anthropogenic processes including the littoral drift, geomorphological features (e.g., natural headlands, spits and barrier islands), sediment sources and sinks (e.g., rivers, tidal inlets, nourishments and sand extractions), and coastal protection structures (e.g., revetments, breakwaters and groins). In the well-known case of shore-normal port breakwaters on a straight sandy coastline, the breakwaters block the natural littoral drift [6,8]. This results in up-drift accretion and down-drift erosion. Wave sheltering and diffraction in the shadow zones of the breakwaters [8,16] as well as sediment transport gradients due to the presence of navigation channels [8,10,14] can also affect the coastline evolution. Consequently, seaports can induce cross-shore coastline changes of tens to hundreds of meters to an alongshore extent of tens of kilometers on timescales of years to decades [8,9,10,11].
The systematic mapping of the coastal impacts of African seaports has previously been hampered by (in-situ) data availability. Therefore, previous studies on the coastline evolution around African seaports have mostly focused on a single or a limited number of seaport(s) based on satellite imagery [9,11,17,18,19,20,21], sometimes in combination with numerical models [11,20]. Each of the studies contributed significantly to the understanding of the coastline evolution around individual African seaports. However, it is difficult to compare these studies and derive general lessons, as the studies focused on a small number of ports and used different methods, imagery sources, and time frames. The recent launch of Google Earth Engine (GEE) enabled the automated image processing of thousands of satellite images. This means that assessing and comparing the decadal-scale coastline evolution has become possible at a large spatial scale [22,23,24]. This has enabled the uniform mapping and comparison of the beach changes adjacent to many ports on the continental scale undertaken in this paper.
In seeking to rigorously compare the coastal evolution near seaports at continental scale, we follow the engineering science tradition of collating in-situ evidence on the ubiquity of geomorphological systems or features (e.g., tidal inlets, intermittently closed/open lakes and lagoons), natural conditions, and infrastructural interventions [25,26,27,28]. Each of these studies sought to learn from real life examples, so as to reflectively inform science and engineering theory and practice. Accordingly, in this study we examine the sandy beach evolution around existing African seaports to gain insights in past port engineering practice and to inform the planning, design, and (beach) maintenance of existing and new African seaports.
To this end, we map and quantify the historic and present coastline evolution around 130 existing African seaports using more than 76,000 publicly available Landsat images from the past 34 years. These data are analyzed in combination with information on the infrastructure characteristics of the ports and their physical environment, such as breakwater length, construction date, and longshore sediment transport potential. This resulted in a unique “Pan-African Seaports Database” with port characteristics and decadal coastline evolution information at a continental scale (freely available at https://data.4tu.nl/, doi:10.4121/uuid:183697fc-afe2-4607-be0a-e63a042ff628). Together with the rigorous mapping method this provides a new means of assessing the potential causes (or “drivers”) of the beach changes around (African) seaports and facilitates the identification of hotspots. The results reveal that the long-term impacts of many African seaports on their adjacent coasts are significant and ongoing. Our results could help to inform beach maintenance requirements and strategies for existing seaports as well as to support improved site selection and design of port expansions and new port developments in Africa to minimize long-term coastal impacts in the future.

2. Methods

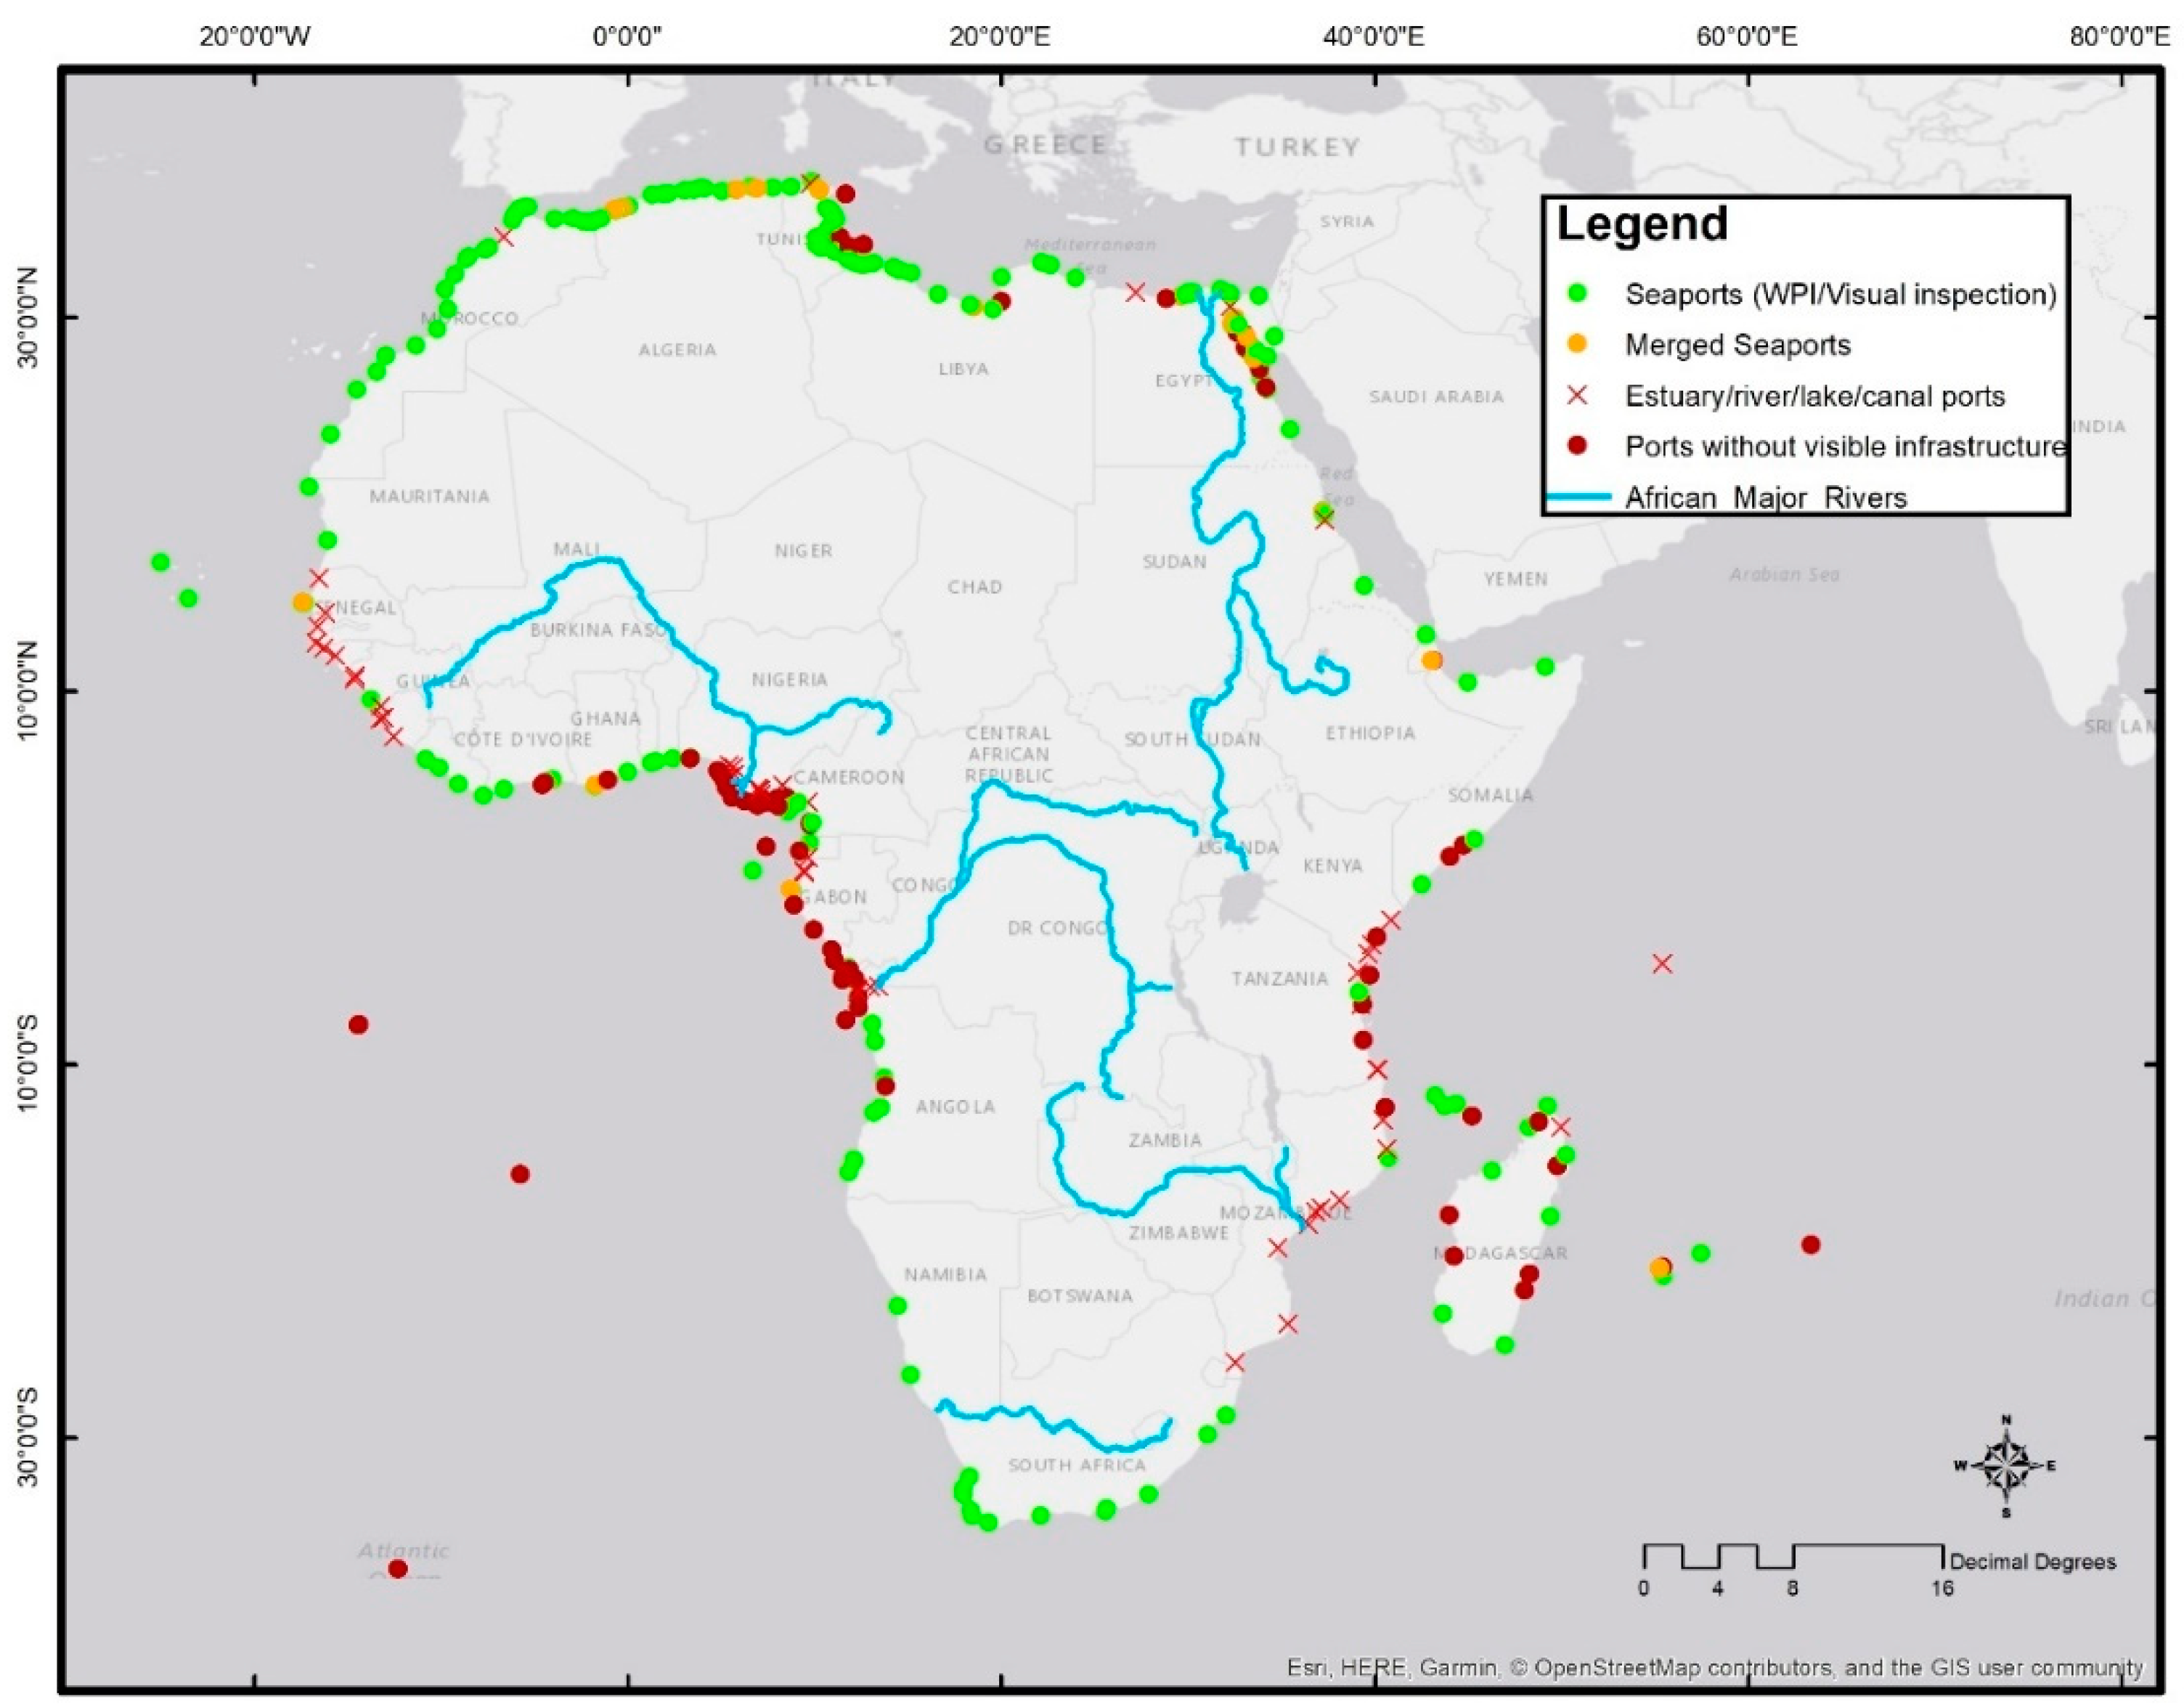
2.1. Selection of African Seaports

African seaports are defined here as maritime facilities that provide access to seagoing ships located on the coast of the African continent. As an initial dataset to select African seaports, we used the World Port Index (WPI) 2017 [29], which provided the location, characteristics, facilities, and available services of a large number of ports worldwide. The WPI contained 271 ports with an African country code. By visual inspection of recent Google Earth (GE) satellite imagery [30], 36 additional seaports were identified. Combining both sources resulted in 307 ports in total. Based on our definition of a seaport, we excluded 53 ports located on rivers, canals, lakes or estuaries. An additional 71 ports or facilities located offshore or without visible port structures on the latest high-resolution imagery from GE [30] were excluded from this study. Finally, 22 of the identified seaports were located so close to each other (i.e., less than 15 km apart) that they could affect each other’s coastline evolution. These ports were treated as a single port for the purposes of this study. After this filtering process, the dataset for further analysis consisted of 161 African seaports (see Figure 1).

2.2. Automated Beach Change Detection from Landsat Satellite Imagery

To assess the beach evolution around the African seaports, we analyzed publicly available Landsat 5, 7 and 8 satellite imagery between 1 January 1984 and 1 January 2018 using Google Earth Engine (GEE) [22]. To detect the coastlines, we used the automated satellite derived shoreline (SDS) algorithm of Hagenaars et al. [23]. This algorithm detects the coastline based on the normalized difference water index (NDWI) [31] in combination with the unsupervised greyscale classification method of Otsu [32]. Although the coastline detection for individual images may be hampered by clouds, waves, soil moisture and sensor errors, Hagenaars et al. [23] showed that these inaccuracies can largely be overcome by using composite images [33,34]. We removed the images with cloud cover metadata values larger than 30% and applied the same composite method. Within a 360-day moving average time window we used the 15th percentile value of the green and near-infrared (NIR) top of atmosphere (TOA) reflectance of images to compose each pixel in the composite image. To obtain a gradual shoreline, the SDS coordinates were smoothed using 1D Gaussian smoothing. Hagenaars et al. [23] demonstrated that the accuracy of the thus detected coastlines is of subpixel precision, which is about half the image pixel size (i.e., 15 m for Landsat imagery).
Hagenaars et al. [23] and Luijendijk et al. [24] reported satisfactory coastline detection for a 360-day composite window for sandy coastlines based on validation with in-situ measurements for beaches in the Netherlands, USA and Australia. However, automated detection of coastline dynamics for non-sandy coastlines, such as muddy and rocky coasts, can be complex [24,35]. Therefore, we limited ourselves to coastline detection adjacent to African seaports located on sandy coastlines. Seaports located on muddy (18 ports) and rocky (12 ports) coastlines were filtered out of our initial dataset by means of visual inspection of the recent high-resolution imagery from GE [30] (see Figure 2). In this filtering process, seaports located in headland-bay systems, with rocky headlands and sandy bays, were classified as sandy. The number of composite images available for each port depended on the geographical location (i.e., number of satellite revisits) and cloud cover. Generally, around the equator the number of satellite revisits was smaller and the cloud cover higher than for locations more northward and southward. Therefore, the number of available composite images was generally less for the ports around the equator (see Figure 2). Due to the limited composite images available for the port of Kribi in Cameroon (constructed in 2013), this port was also filtered out of the dataset, because a reliable trend analysis would not be obtained. After this filtering, we applied the SDS algorithm to the remaining 130 African seaports.
To analyse the coastline evolution around the seaports, we calculated the changes in beach area up-drift and down-drift of the port over time using the first available SDS after the port’s construction date as a baseline. For ports constructed before 1984 (i.e., before Landsat imagery was available), the baseline was derived from the first available composite image after 1 January 1984. For these ports the beach changes observed since 1984 could be less than the changes that took place since their construction date, as the most significant coastline changes typically take place in the first years after port construction. Depending on the image availability and cloud cover, the first available composite of sufficient quality (i.e., not affected by clouds or sensor distortions) could be a couple of years later than the actual construction date. Subsequently, the beach area change over time was determined by the area difference between each SDS in time compared to the baseline (see Figure 3 and Figure 4). Particularly for seaports in Western Africa, such as Cotonou (Benin) and Lagos (Nigeria), the high cloud cover hampered accurate coastline detection prior to 2000. Hence, for these ports only the beach changes over the last 20 years were analysed. Nevertheless, for most other ports in the Pan-African Seaports Database we could analyse the entire period since the first available SDS after 1 January 1984 or after port construction.
Before applying the SDS algorithm we used the study of Bruun [8] to estimate the “area of influence” of the port structures on the coastline evolution to select appropriate alongshore coastal boundaries for each port. Based on a comparative study of the coastline evolution of several field cases with littoral drift barriers, Bruun [8] reported movement rates of the down-drift erosion front varying from 0.3–0.5 km/year. We adopted the upper limit of these rates (i.e., 0.5 km/year) to estimate the extent of the alongshore boundaries. Based on the study period of about 30 years, we applied a distance of 15 km up-drift and down-drift of the port breakwaters (i.e., 30 km in total). However, based on visual inspection, we detected coastline changes beyond this alongshore extent for the ports of Lomé (Togo), Cotonou (Benin), and Monrovia (Liberia). Therefore, the boundaries of these ports were adjusted to accommodate the actual extent of coastline changes in the analysis.
The ports were analyzed in terms of net and gross beach area change. To this end, we defined the gross accretion ( A a c c ; g r o s s ) and erosion ( A e r o ; g r o s s ) as the sum of the absolute values of the accretion and erosion areas, respectively. For the example provided in Figure 3 this implies A a c c ; g r o s s = A 1 + A 2 and A e r o ; g r o s s = A 3 . The net beach area change is defined as A n e t = A a c c ; g r o s s A e r o ; g r o s s , where positive values of A n e t indicate net accretion and negative values net erosion.
We performed trend fitting of the beach area changes in time ( t ) for A g r o s s for all available composite images and distinguished between historic and present changes. The total historic (gross) accretion or erosion was defined as the cumulative beach area change from the first available to the last available SDS. For the present areal change rate, we used the derivative of the trend line on 1 January 2018. Hagenaars et al. [23] and Luijendijk et al. [24] analysed the coastline changes in time (in m/year) by means of ordinary least squares (OLS) linear trend fitting. However, around ports an asymptotic or exponential trend is generally more appropriate, because it better reflects the coastline evolution towards a (new) equilibrium [37]. As we did not know in advance whether the coastline evolution would be significantly affected by the presence of the port, both linear (Equation (1)) and exponential (Equation (2)) trends were fitted to the time series of both A a c c ; g r o s s ( t ) and A e r o ; g r o s s ( t ) (for simplicity referred to as A ( t ) in the equations below) using non-linear least squares fitting. To determine the goodness-of-fit, we used the coefficient of determination ( R 2 , see Equations (3)–(5)). For each port, the trend line with the highest R 2 value was selected as the best fit. Figure 5 provides a schematic illustration of the (exponential) trend fitting.
Linear trend fitting is based on
A ( t ) = a t + b ,
where A ( t ) is the erosion/accretion area at time instance t (in years), a (in km2/year) is the linear areal change rate and b (in km2) the erosion/accretion area at the origin. Exponential trend fitting is based on
A ( t ) = a 2 ( 1 e t b 2 ) + c 2 ,
where a 2 (in km2) is the asymptote of A ( t ) (i.e., an indicator of the equilibrium state), b 2 (in years) is the exponential areal change rate (i.e., an indicator of the morphological timescale), and c 2 (in km2) is the value of A at the origin.
For the dataset of t values of A in time, each value of A t can be associated with a predicted value of A ( t ) . We use the coefficient of determination ( R 2 ) to determine goodness-of-fit, which is expressed as follows:
R 2 1 S S r e s S S t o t ,
where the total sum of squares ( S S t o t ) defined as
S S t o t = t ( A t A ¯ ) 2 ,
where A ¯ (km2) is the mean of A ( t ) and the residual sum of squares ( S S r e s ) is defined as
S S r e s = t ( A t A ( t ) ) 2 .
The above trend fitting procedure succeeded for 128 ports. For two ports, Casablanca (Morocco) and Arzew (Algeria), the SDS exhibited a significant trend reversal owing to port extensions or adjacent coastal protection structures. The trend reversal was not well captured by the linear nor by the exponential fit. To overcome this issue, the time series of these ports were divided into two segments. For each time segment the fitting procedure as described above was applied and the fit with the highest value of R 2 was selected per segment.

2.3. Mapping Characteristics of the Ports

To better understand and intercompare the causes of the coastline evolution adjacent to the ports, we mapped the infrastructural characteristics of the ports and their physical environment in relation to the beach changes. The challenge of such continental-scale mapping is that not all relevant information is available for each site. Therefore, we constrained ourselves to characteristics that can be obtained from existing global databases or (visually) detected from satellite imagery, namely: (1) longshore sediment transport (LST) potential, (2) presence of visible sediment sources & sinks (i.e., rivers and tidal inlets), (3) natural sheltering setting (i.e., open sandy coast, headland-bay coast or barrier island/spit coast), (4) visible coastal protection or stabilization works (i.e., groins, breakwaters and revetments), (5) shore-normal length of the port breakwaters, and (6) port construction date. Table 1 provides an overview of the parameters, methods and timeframe used in the analysis of these characteristics. The subsequent sub-sections present the methods used in determining each of the characteristics in more detail.

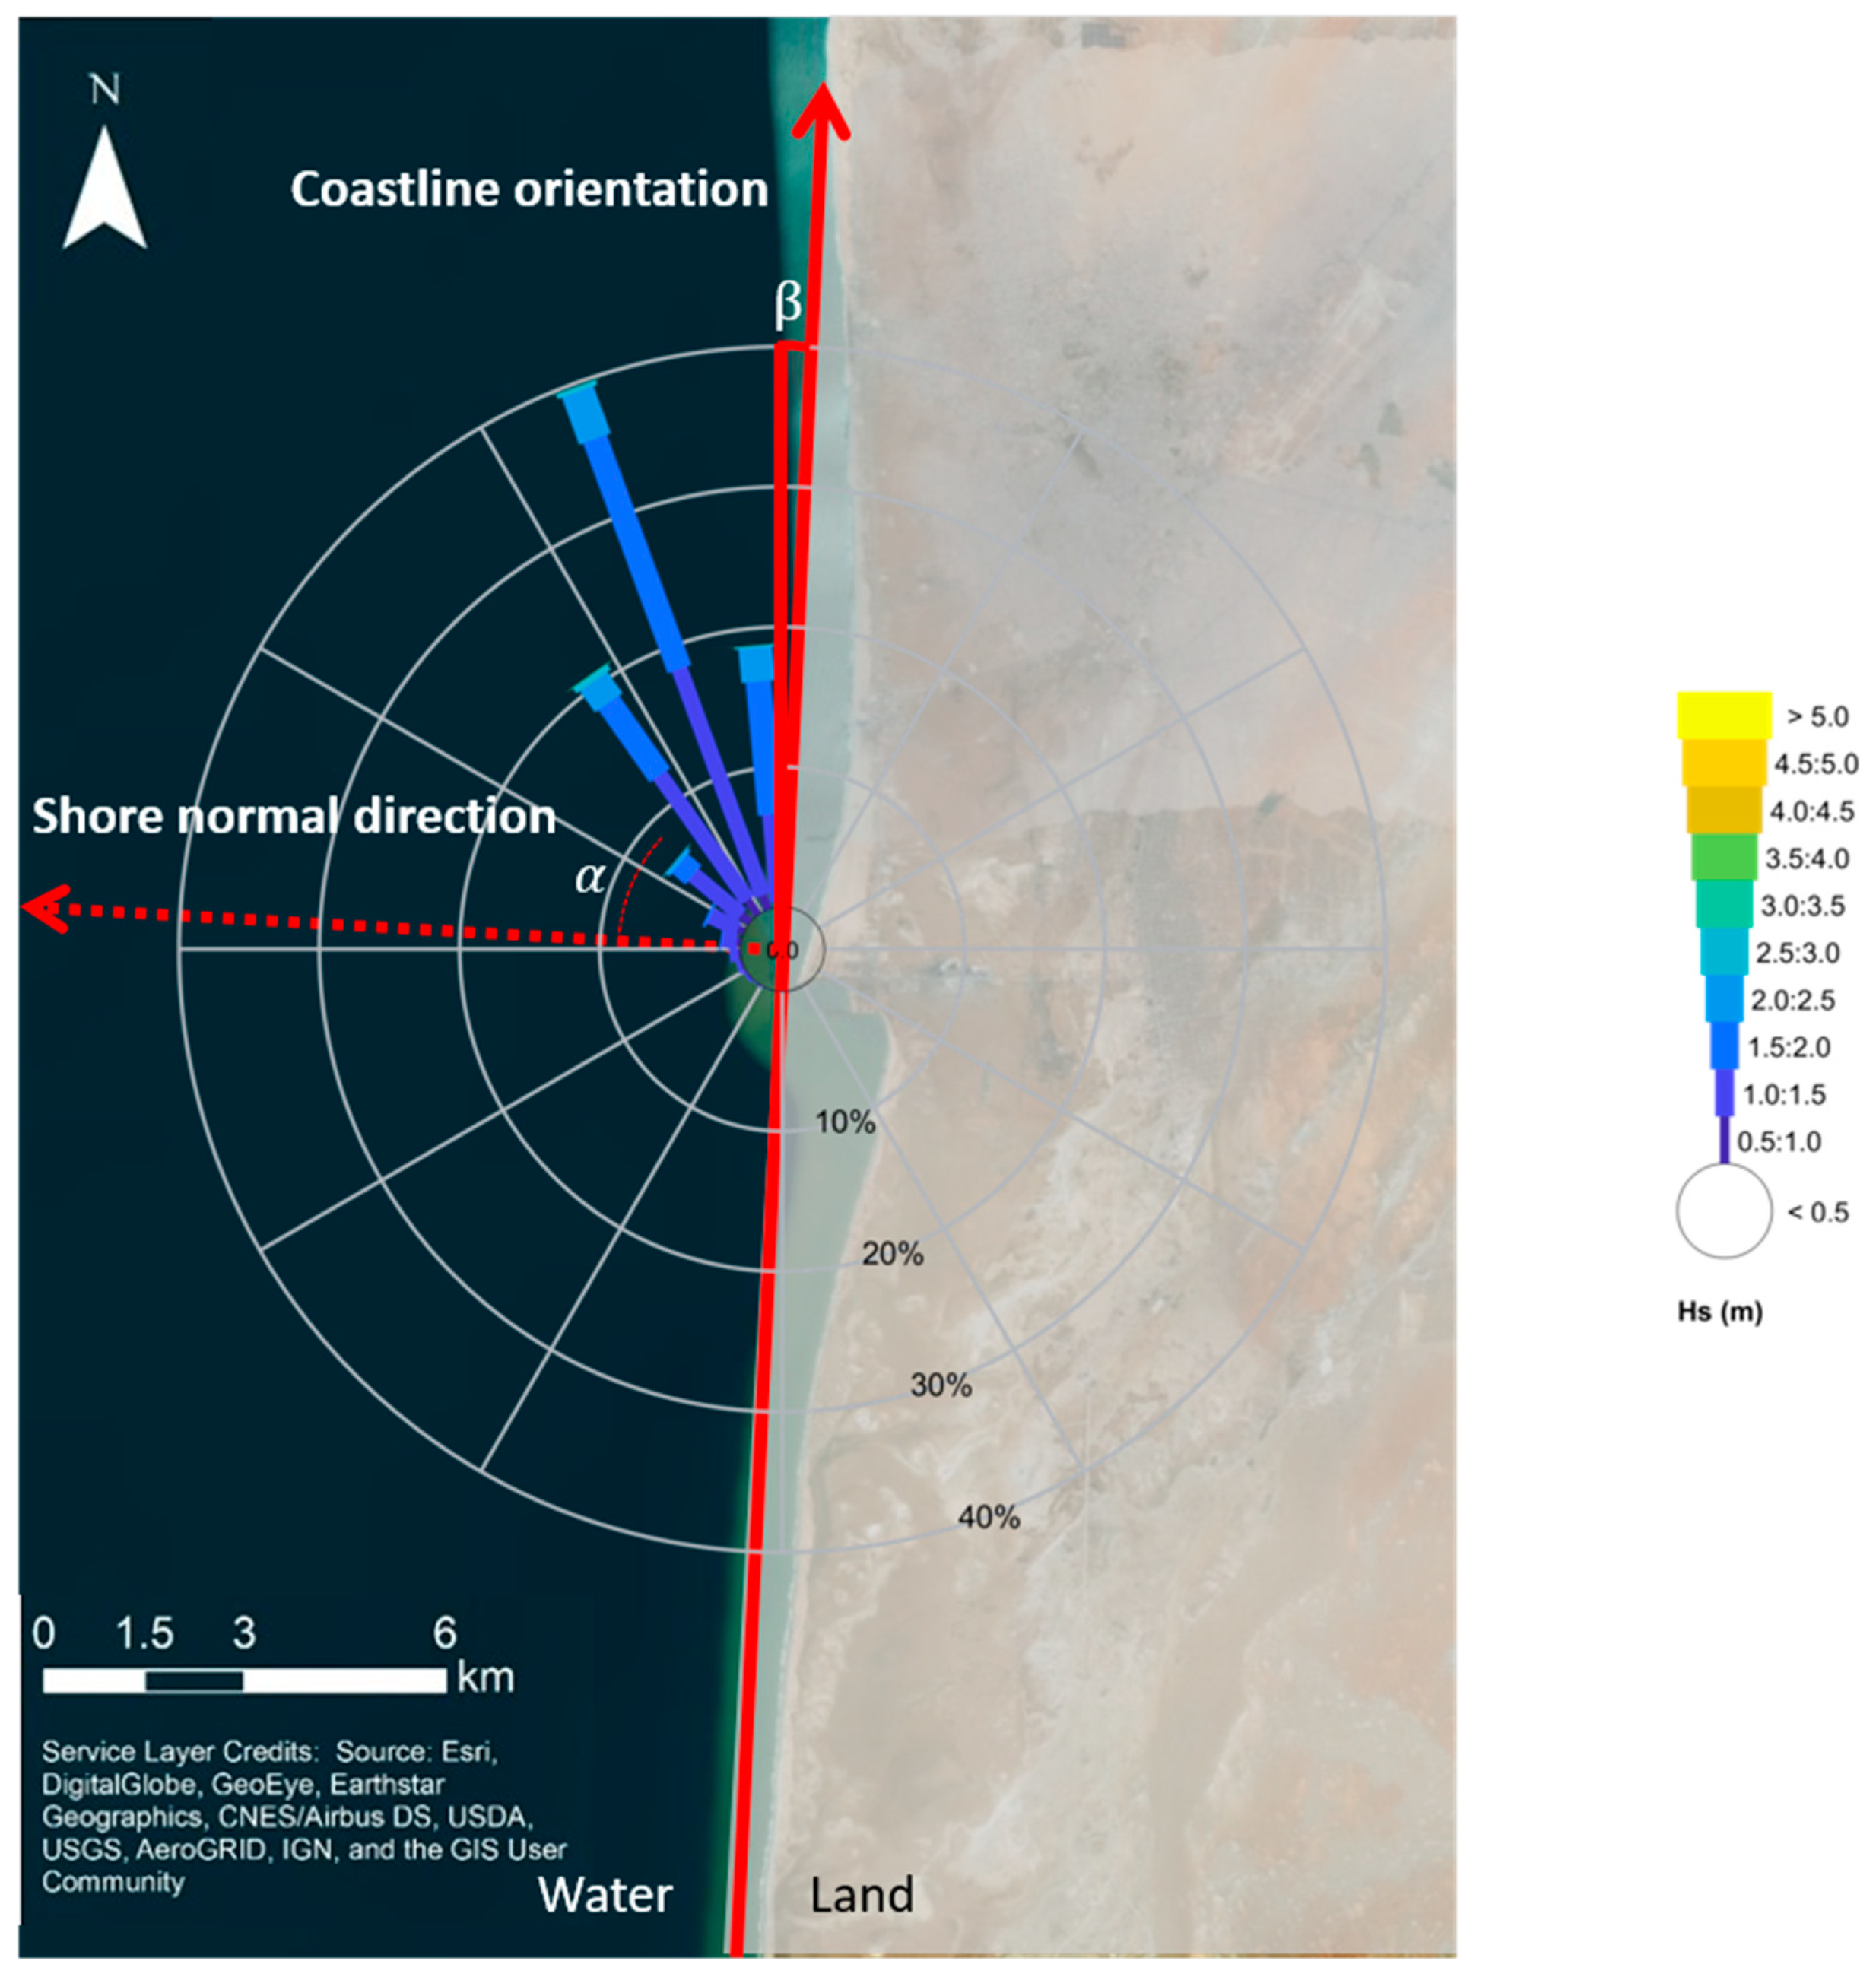
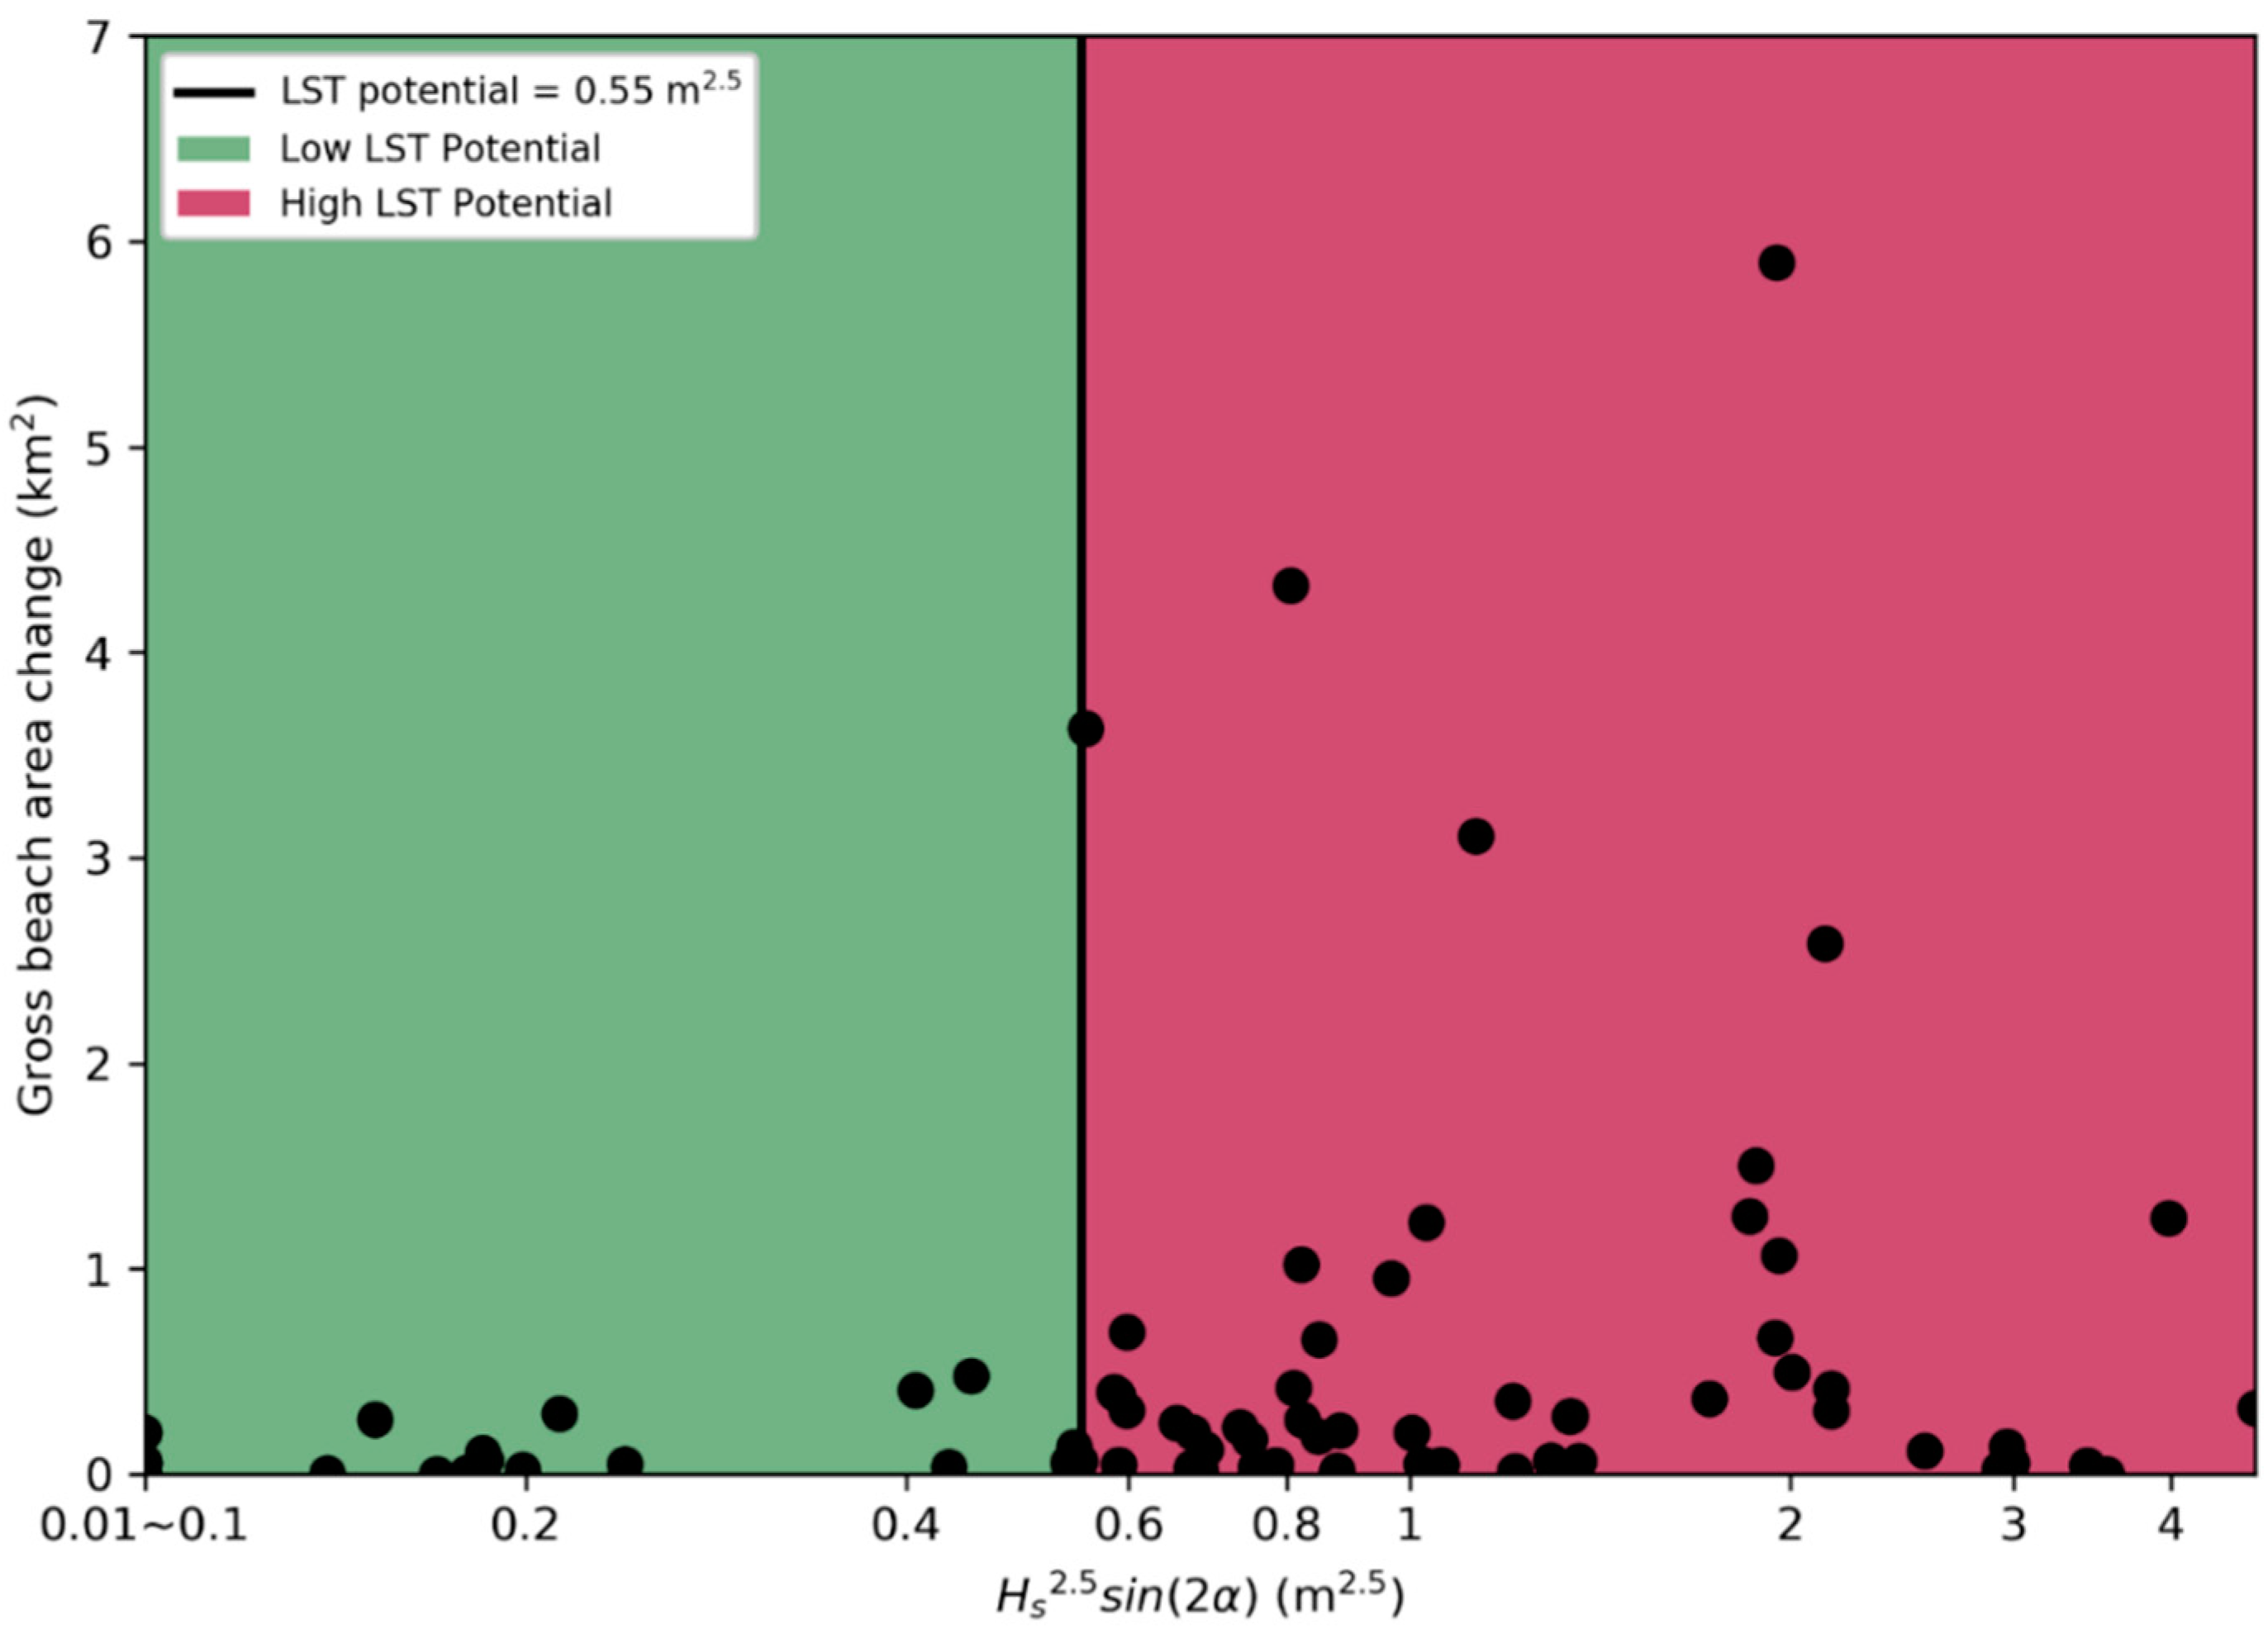
2.3.1. LST Potential

The longshore component of the wave power (or wave energy flux) was used as an indicator for the littoral drift and, hence, the longshore sediment transport (LST) potential. In the CERC (Coastal Engineering Research Center) sediment transport formula [39], the wave power is approximated by
P ~ H s ; b 2.5 sin ( 2 α b ) ,
where P is the longshore wave power (in m2.5), H s ; b is the significant wave height at breaking (in m), and α b is the mean wave angle of incidence compared to the shore-normal at breaking (in °). The wave characteristics were obtained from the global atmospheric European Centre for Medium-Range Weather Forecasts Reanalysis-Interim (ERA-Interim) dataset, which contains a six-hourly reanalysis of meteorological variables on a global grid of 0.75 by 0.75 degrees from 1984 to present [38]. The large-scale coastline orientation was derived manually from the latest available GE image [30], ignoring small-scale interruptions in the coastline, such as the port itself. As an example, Figure 6 illustrates the coastline orientation for the port of Nouakchott (Mauritania). Although we recognize that nearshore wave characteristics at breaking would provide a more representative estimate of the LST potential, we used the offshore wave characteristics as a first estimate in this study. The reason for this is that, due to its coarse resolution, the ERA-Interim dataset is not reliable in the nearshore. In addition, we lacked accurate nearshore bathymetry information to downscale the offshore wave characteristics to the breaker zone with a numerical model. Instead, we selected the closest ERA-Interim grid point that is at least 3 km offshore of the coast and retrieved the wave data from 1 January 1984 to 1 January 2018. These data were binned into 11 classes for H s and 24 classes for mean wave direction (i.e., 264 classes in total). The number of data points in each of the bins divided by the total number of data points represents the frequency of occurrence of the wave bin (see Figure 6). We excluded directional bins with offshore (i.e., seaward) directed waves, as they do not contribute to the nearshore sediment transport. For the remaining directional bins, we calculated H s 2.5 sin ( 2 α ) . The overall value of H s 2.5 sin ( 2 α ) is the weighted sum of H s 2.5 sin ( 2 α ) of each bin, based on the frequency of occurrence of the conditions in that bin.

2.3.2. Visible Sediment Sources and Sinks (Rivers and Inlets)

Although quantitative information on sediment sources and sinks for the entire African continent is not available, the presence of rivers and tidal inlets nearby the ports can serve as an indicator. The presence of rivers and inlets was visually identified from the latest available GE image [30]. Similar to the extent of the coastline detection, detecting rivers and inlets was constrained by an extent of 15 km up-drift and/or down-drift of the ports (see Section 2.2). We recognize that also beach nourishments and sand extractions are potential sources and sinks. However, the presence of these activities could not be visually detected from satellite imagery. Moreover, public databases with quantitative information on these sources and sinks are not available. Therefore, nourishments and sand extractions were not included in this study.

2.3.3. Natural Sheltering Setting

The natural sheltering setting of the port (e.g., open sandy coast, headland-bay coast, or behind a natural barrier such as a barrier island or spit) can affect the nearshore hydrodynamics and sediment transport potential and, hence, the coastline evolution. To the best of the authors’ knowledge, there is no universal database that classifies coastal stretches according to these features. Therefore, we classified the coastlines adjacent to the selected ports based on visual inspection of the most recent GE image [30]. We distinguished three classes: (1) open sandy coast, (2) headland-bay coast, and (3) coast behind a natural barrier. An example from each of the classes is provided in Figure 7.

2.3.4. Visible Coastal Protection Structures

Coastal protection structures adjacent to the ports can affect the coastline evolution. It is likely that coastal erosion problems were already mitigated in the past, especially near ports that were constructed a long time ago. As it is complex to detect coastal structures automatically from satellite imagery, we established the presence of coastal protection structures within 15 km up-drift and/or down-drift of the ports by visually inspecting the latest GE imagery [30]. We distinguished ports with predominantly cross-shore (e.g., shore-normal breakwaters and groins) from ports with longshore (e.g., shore-parallel revetments) structures adjacent to the port itself. Coastal structures that may have been removed during the period under study were not analyzed.

2.3.5. Port Breakwater Length

The port breakwater length affects the extent of up-drift coastline accretion as well as the blockage or by-passing of sediments to the down-drift side of the port. We determined the port breakwater length from the latest available GE aerial image [30] by measuring the shore-normal distance between the landward and seaward tips of the port breakwater(s) (Figure 8). For ports with multiple breakwaters, we mapped the breakwater with the largest cross-shore length.

2.3.6. Port Construction Date

We consider the port construction date as the year in which the first breakwater was constructed. The construction date of the first breakwater determines how much time has passed since the interruption of the longshore sediment transport. Therefore, it provides an indication of the duration of coastline evolution since port construction and, hence, of how close the coastline is to its (new) equilibrium state. We could not determine all port construction dates from literature. Even when we found a construction date, it was often not clear whether this represented the start of construction, the end of construction, or the breakwater construction. Therefore, we defined the construction date as the year of construction of the first breakwater as determined visually from the series of Landsat images available for each port [22]. The construction dates of the ports that were constructed before the first available Landsat imagery (i.e., 1984) could not be identified in this way. We labeled the construction dates of those ports as “before 1984”.

3. Results

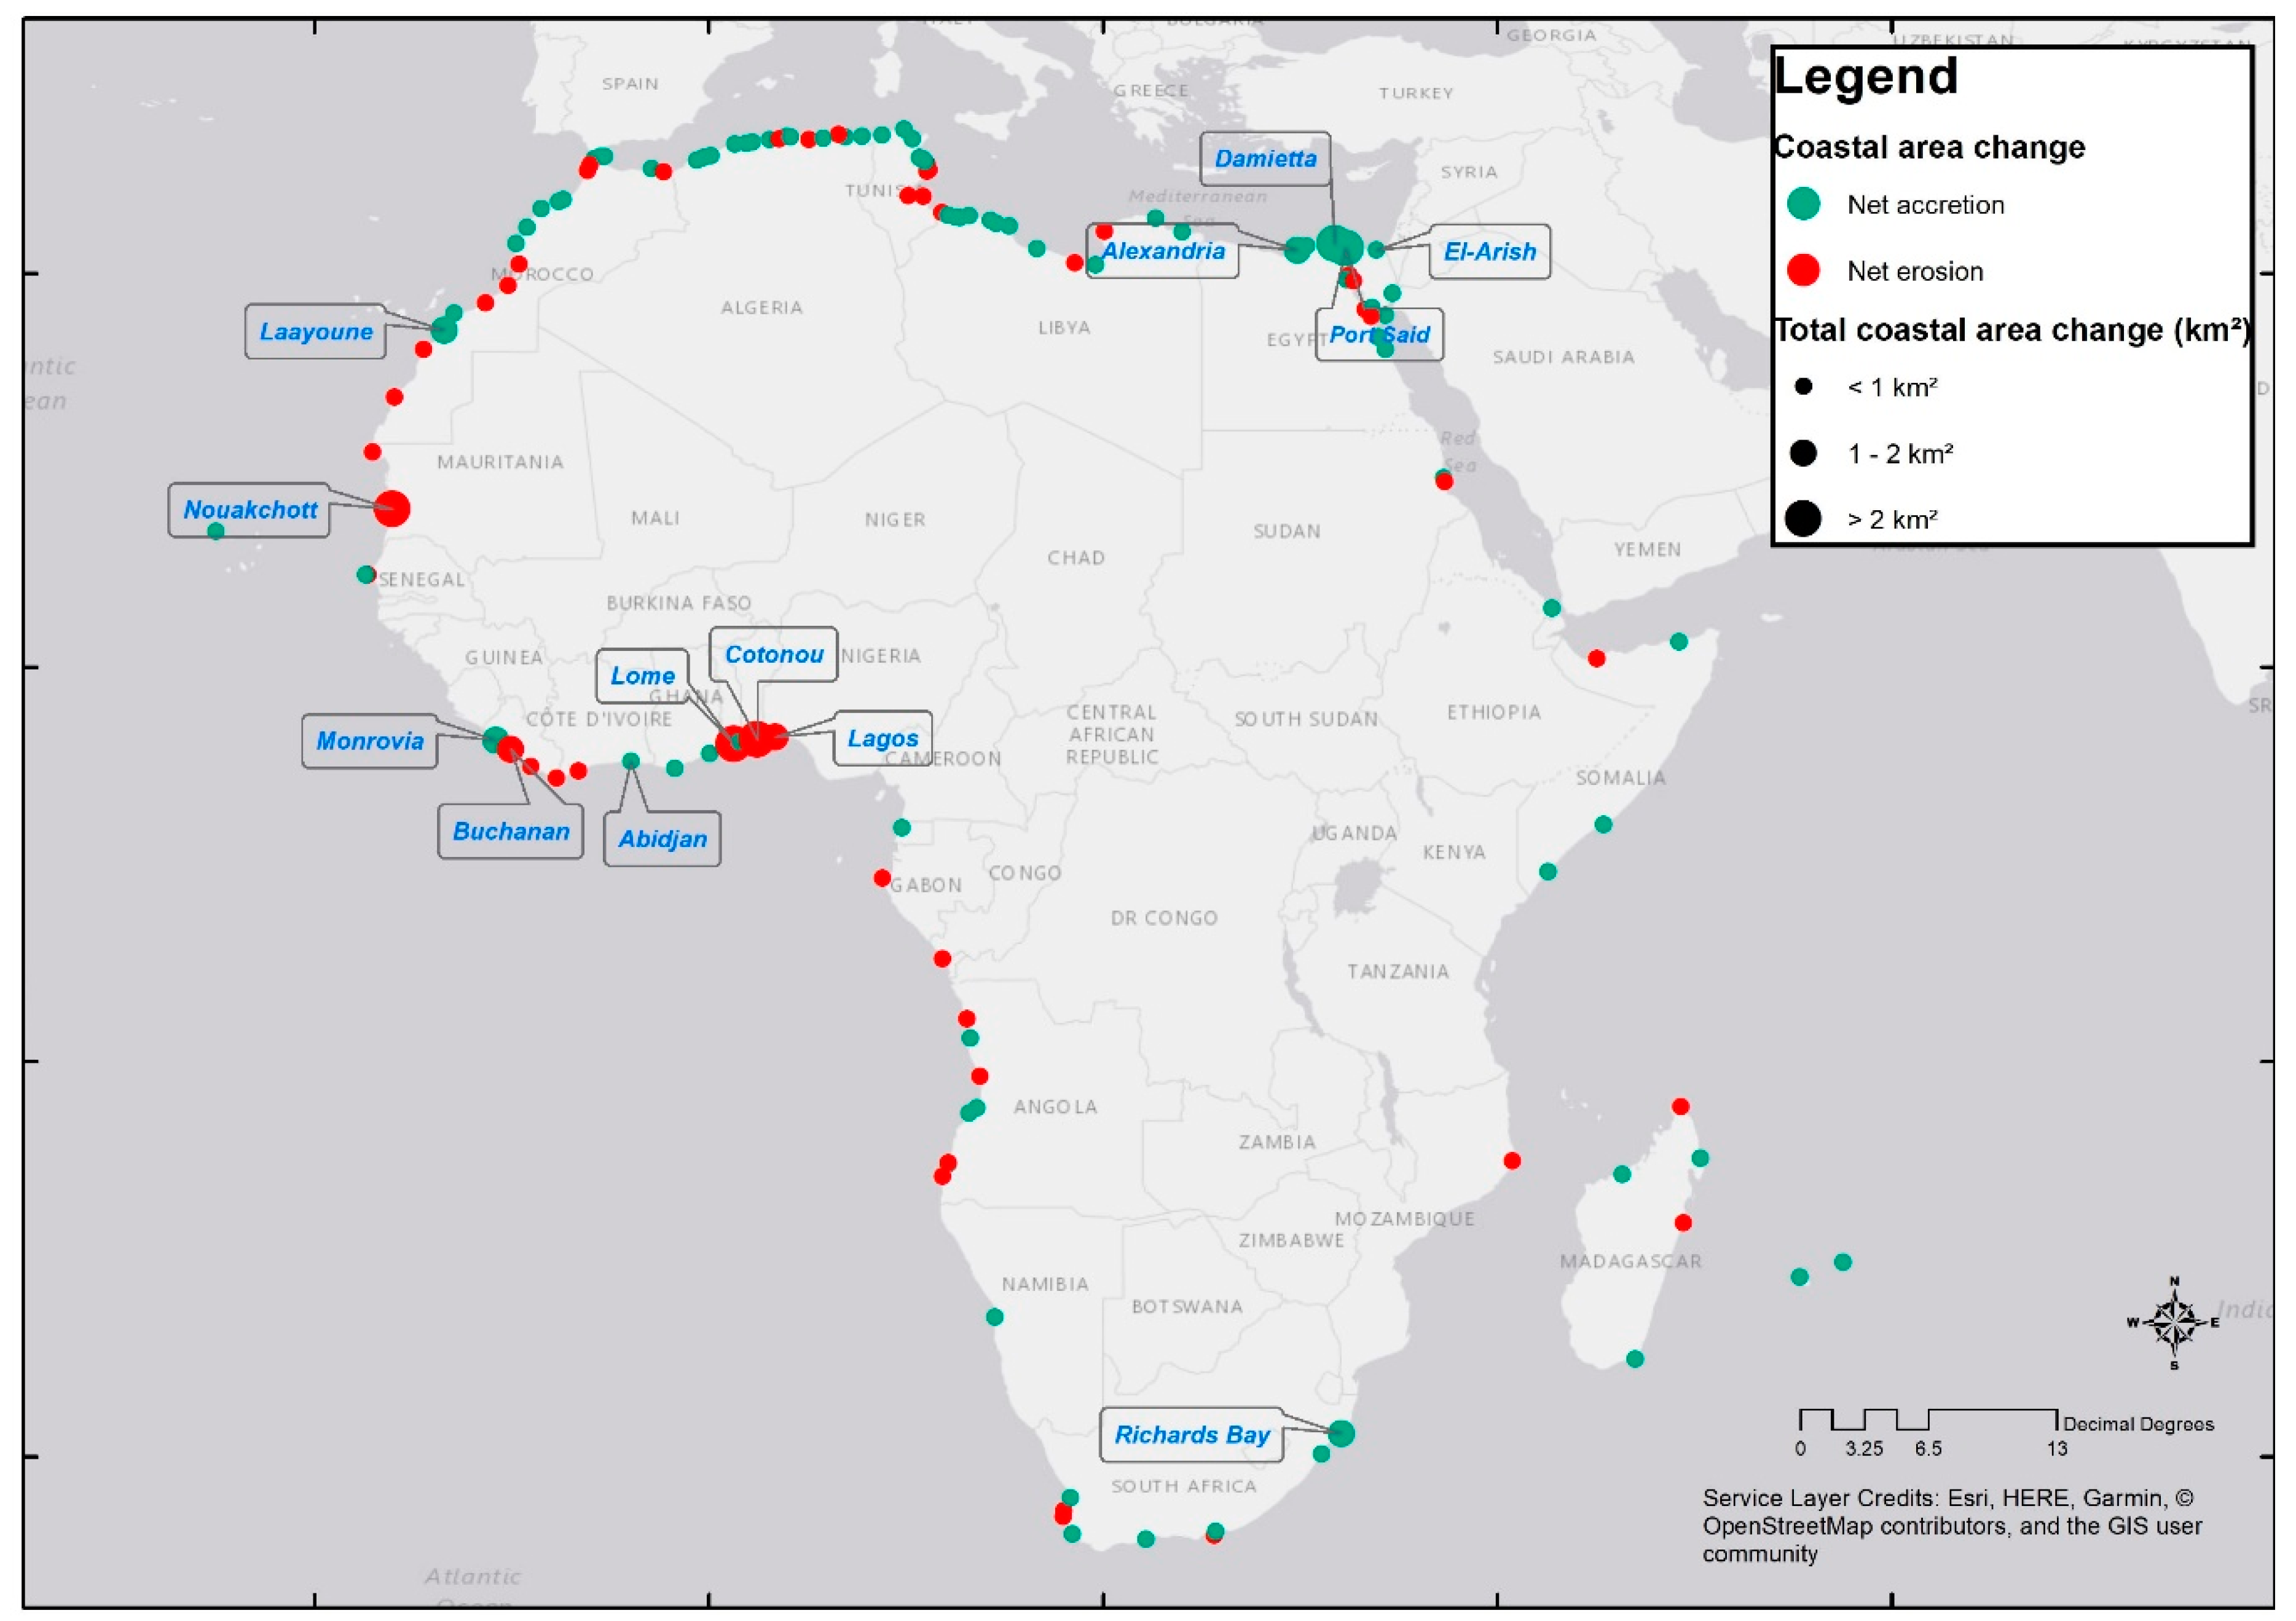
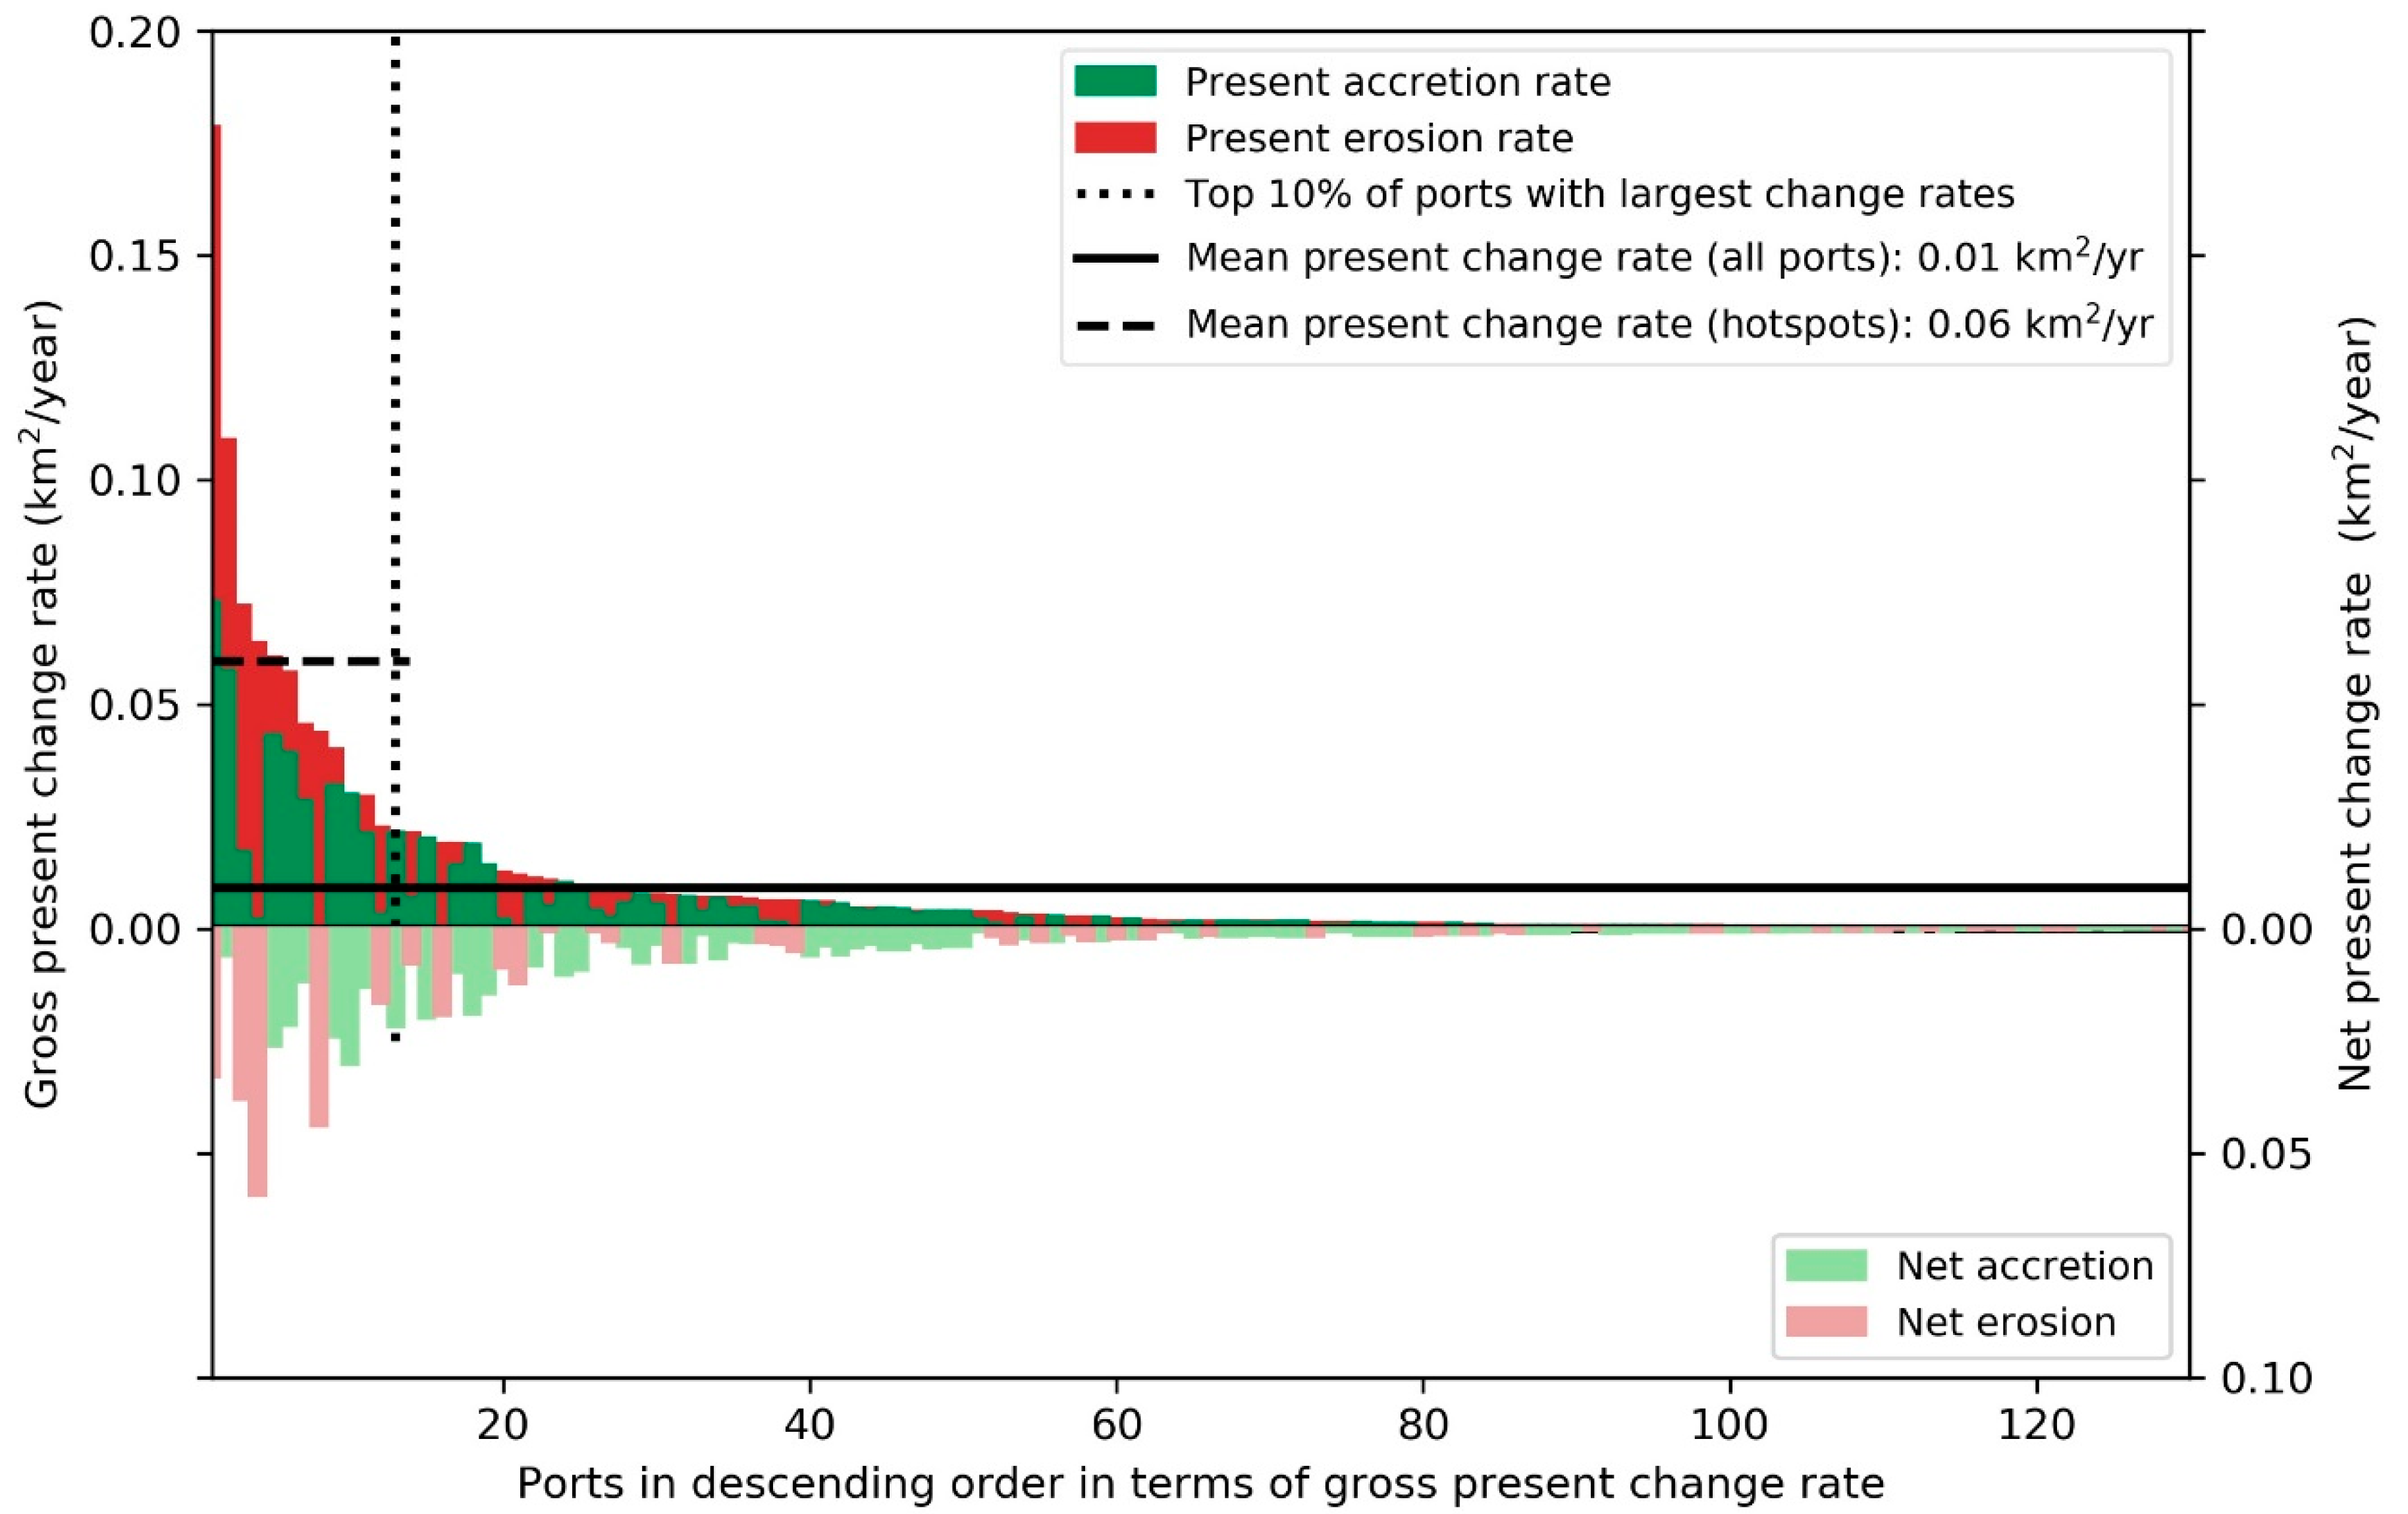
3.1. Historic and Present Beach Changes around African Seaports

The historic beach area changes near 130 African seaports since 1984 vary considerably in magnitude (Figure 9). For ports constructed before 1984 the total beach area changes since their construction could be even higher than indicated in Figure 9, as beach changes before 1984 were not analyzed in this study. The top 10% of the ports with the largest gross beach changes (i.e., the sum of accretion and erosion) are defined as hotspots. and the beach changes for the top 10 hotspots are summarized in Table 2. Most of the hotspots are located on the West African coast and near the Nile river delta. In contrast, ports located on the East African coast, the Red Sea, and the Mediterranean coasts (excluding the Nile delta), generally exhibited small beach area changes. No definitive relationship between the geographical port location and the tendency towards net erosion or accretion can be distinguished. However, it seems that West African ports predominantly experienced erosion (e.g., especially in the Bight of Benin) and that Mediterranean ports predominantly experienced accretion (e.g., especially around the Nile delta).
The beach area changes adjacent to the ports over the past 34 years totaled 44.1 km2, of which 23.4 km2 is accretion and 20.8 km2 is erosion (i.e., net accretion of about 2.6 km2). The hotspots account for approximately 65% of the total changes, while the port with the largest beach changes (i.e., Nouakchott in Mauritania) accounts for 13% of the total (Table 3). Hence, a relatively small number of ports are responsible for a large share of the total beach changes. Overall, the seaports have a tendency towards net accretion, reflected in the positive accretion-erosion ratios (see Table 3). However, accretion and erosion are generally more balanced at the hotspots and individual ports can have a strong tendency towards net erosion, such as the port of Nouakchott. To indicate what the areal changes mean in terms of cross-shore coastline shifts, we derived the longshore averaged changes (i.e., the cross-shore change per m coastline length). The mean cross-shore change over the entire 34 years period is 23 m (i.e., 0.67 m/year) for all ports, 67.5 m (i.e., 1.99 m/year) for the hotspots, and 178 m (5.24 m/year) for Nouakchott (Table 3). Note that these changes are averaged and can be much larger locally, possibly impacting the spatial planning and use of the coastal zone.
Figure 10 reveals that the present beach change rates are also dominated by a small number of ports. The hotspots have an average beach change rate of 60,000 m2/year, whereas the highest ranked port has a rate of 180,000 m2/year. These rates are considerably higher (i.e., a factor 6 to 18) than the average change rate of 10,000 m2/year per port based on all ports. Assuming that the present change rates are valid for the next five years, the total coastline change adjacent to the 130 African seaports is expected to increase by ca. 6.2 km2. This is significant compared to the total change of 44.1 km2 over the last 34 years.
The hotspots in terms of their change rates at present largely overlap with the historic ones: 7 ports appear in both top 10 rankings (Table 2). On the one hand, this is not surprising as ports located on dynamic coastlines can have both large historic changes and large present evolution rates. On the other hand, one could argue that in time the coastline should approach a (new) equilibrium and the evolution should slow down. The ratio between the average historic and the present change rates is depicted in Figure 11 for all 130 seaports. The average change rates were calculated as the total beach area change divided by the number of years between the first available SDS and 1 January 2018. The higher the ratio between the average and present rates, the closer the coastline is to its equilibrium state. Figure 11 shows the mean value of the ratio is lower for ports constructed after 1984 than for ports constructed before 1984. This indicates that coastlines adjacent to ports constructed longer ago tend more towards equilibrium than ports constructed more recently, which aligns with coastal engineering theory [37].

3.2. Mapping Driving Characteristics of Beach Changes around African Seaports

We related the historic beach changes to the characteristics of the port infrastructure and their physical environment (see Table 4) to assess the underlying causes or drivers of the sandy beach evolution around the African seaports. Different categories were defined for each characteristic. For the qualitative characteristics (i.e., sheltering setting, presence of sediment sources and sinks, and presence of coastal protection structures), we attributed each port to the categories defined in Section 2.3. For the LST potential, we categorized the ports into environments with high and low LST potential. To this end, we plotted the LST potential against the total beach area change for open coasts (see Figure 12). We did this for open ports only, because in sheltered regions the offshore wave climate is not likely to be a representative indicator for the nearshore LST potential. We found an increase in the gross coastline change for H s 2.5 sin ( 2 α ) 0.55   m 2.5 . The increase in coastline change is not visible for all ports as the actual LST was probably also influenced by other parameters such as sediment availability and coastal protection schemes. For the analysis, we distinguished between ports with H s 2.5 sin ( 2 α ) 0.55   m 2.5 (i.e., high LST potential) and ports with H s 2.5 sin ( 2 α ) < 0.55   m 2.5 (i.e., low LST potential). By means of a similar analysis, we distinguished between ports with large and small breakwater lengths ( B W l e n g t h ) using B W l e n g t h 400   m (i.e., large) and B W l e n g t h < 400   m (i.e., small). With respect to the port construction date, ports were categorized in those constructed before and after 1984 (i.e., the date of the first available Landsat imagery).
By mapping the mean beach changes for each category from 1984 to 2018, we found that the presence of one or multiple of the following drivers led to larger beach changes (see Table 4): large LST potential, open coasts, presence of sediment sources and sinks, presence cross-shore protection structures, constructed before 1984, and large breakwaters. The mean beach changes were considerably smaller for the other characteristics. These findings are in line with general coastal engineering theory on coastline evolution around shore-normal breakwaters [6,8,41,42,43]. However, to the best of our knowledge, this is the first time that we can support this theory with evidence at such a continental scale.
Apart from the ports sheltered by natural barriers, the majority of the ports experienced net accretion (i.e., about 44–86%) and the minority (i.e., about 14–56%) net erosion for each characteristic (Table 4). This is coherent with the overall finding that coastline accretion is larger than erosion for the ports in the Pan-African Seaports Database (see Section 3.1). A small majority of the ports sheltered by natural barriers experienced net coastal erosion. This may be related to the morphodynamics of the natural barriers themselves. Ports with coastal protection schemes nearby or in headland-bay systems showed a stronger tendency towards net accretion (i.e., about 75–86% of the ports) than the other categories. This is an indication that coastal protection schemes and natural erodibility constraints (i.e., rocky headlands) limit coastal erosion and, hence, result in net coastal accretion.
All hotspot ports have the following driving characteristics in common: large LST potential, located on open coastlines, and large breakwater lengths (Table 5). The presence of these drivers is more persistent for the hotspots than for the other ports in the Pan-African Seaports Database (Table 6). This suggests that these characteristics (i.e., the presence of these drivers) are potentially suitable as indicators of large adjacent beach changes. Although these drivers are well established in coastal engineering theory, our results reveal that past port engineering design practice has meant that the beaches adjacent to existing African seaports have been and still are seriously impacted by these drivers.
The differences between the hotspots and the other ports in the Pan-African Seaports Database are less distinct for the other potential drivers (i.e., presence of sediment source and sinks, coastal protection structures, and port construction date). This suggests that these drivers were not the main underlying causes of the historic beach changes around the African ports, and are hence less suitable for use as indicators of expected beach changes around ports.

4. Discussion

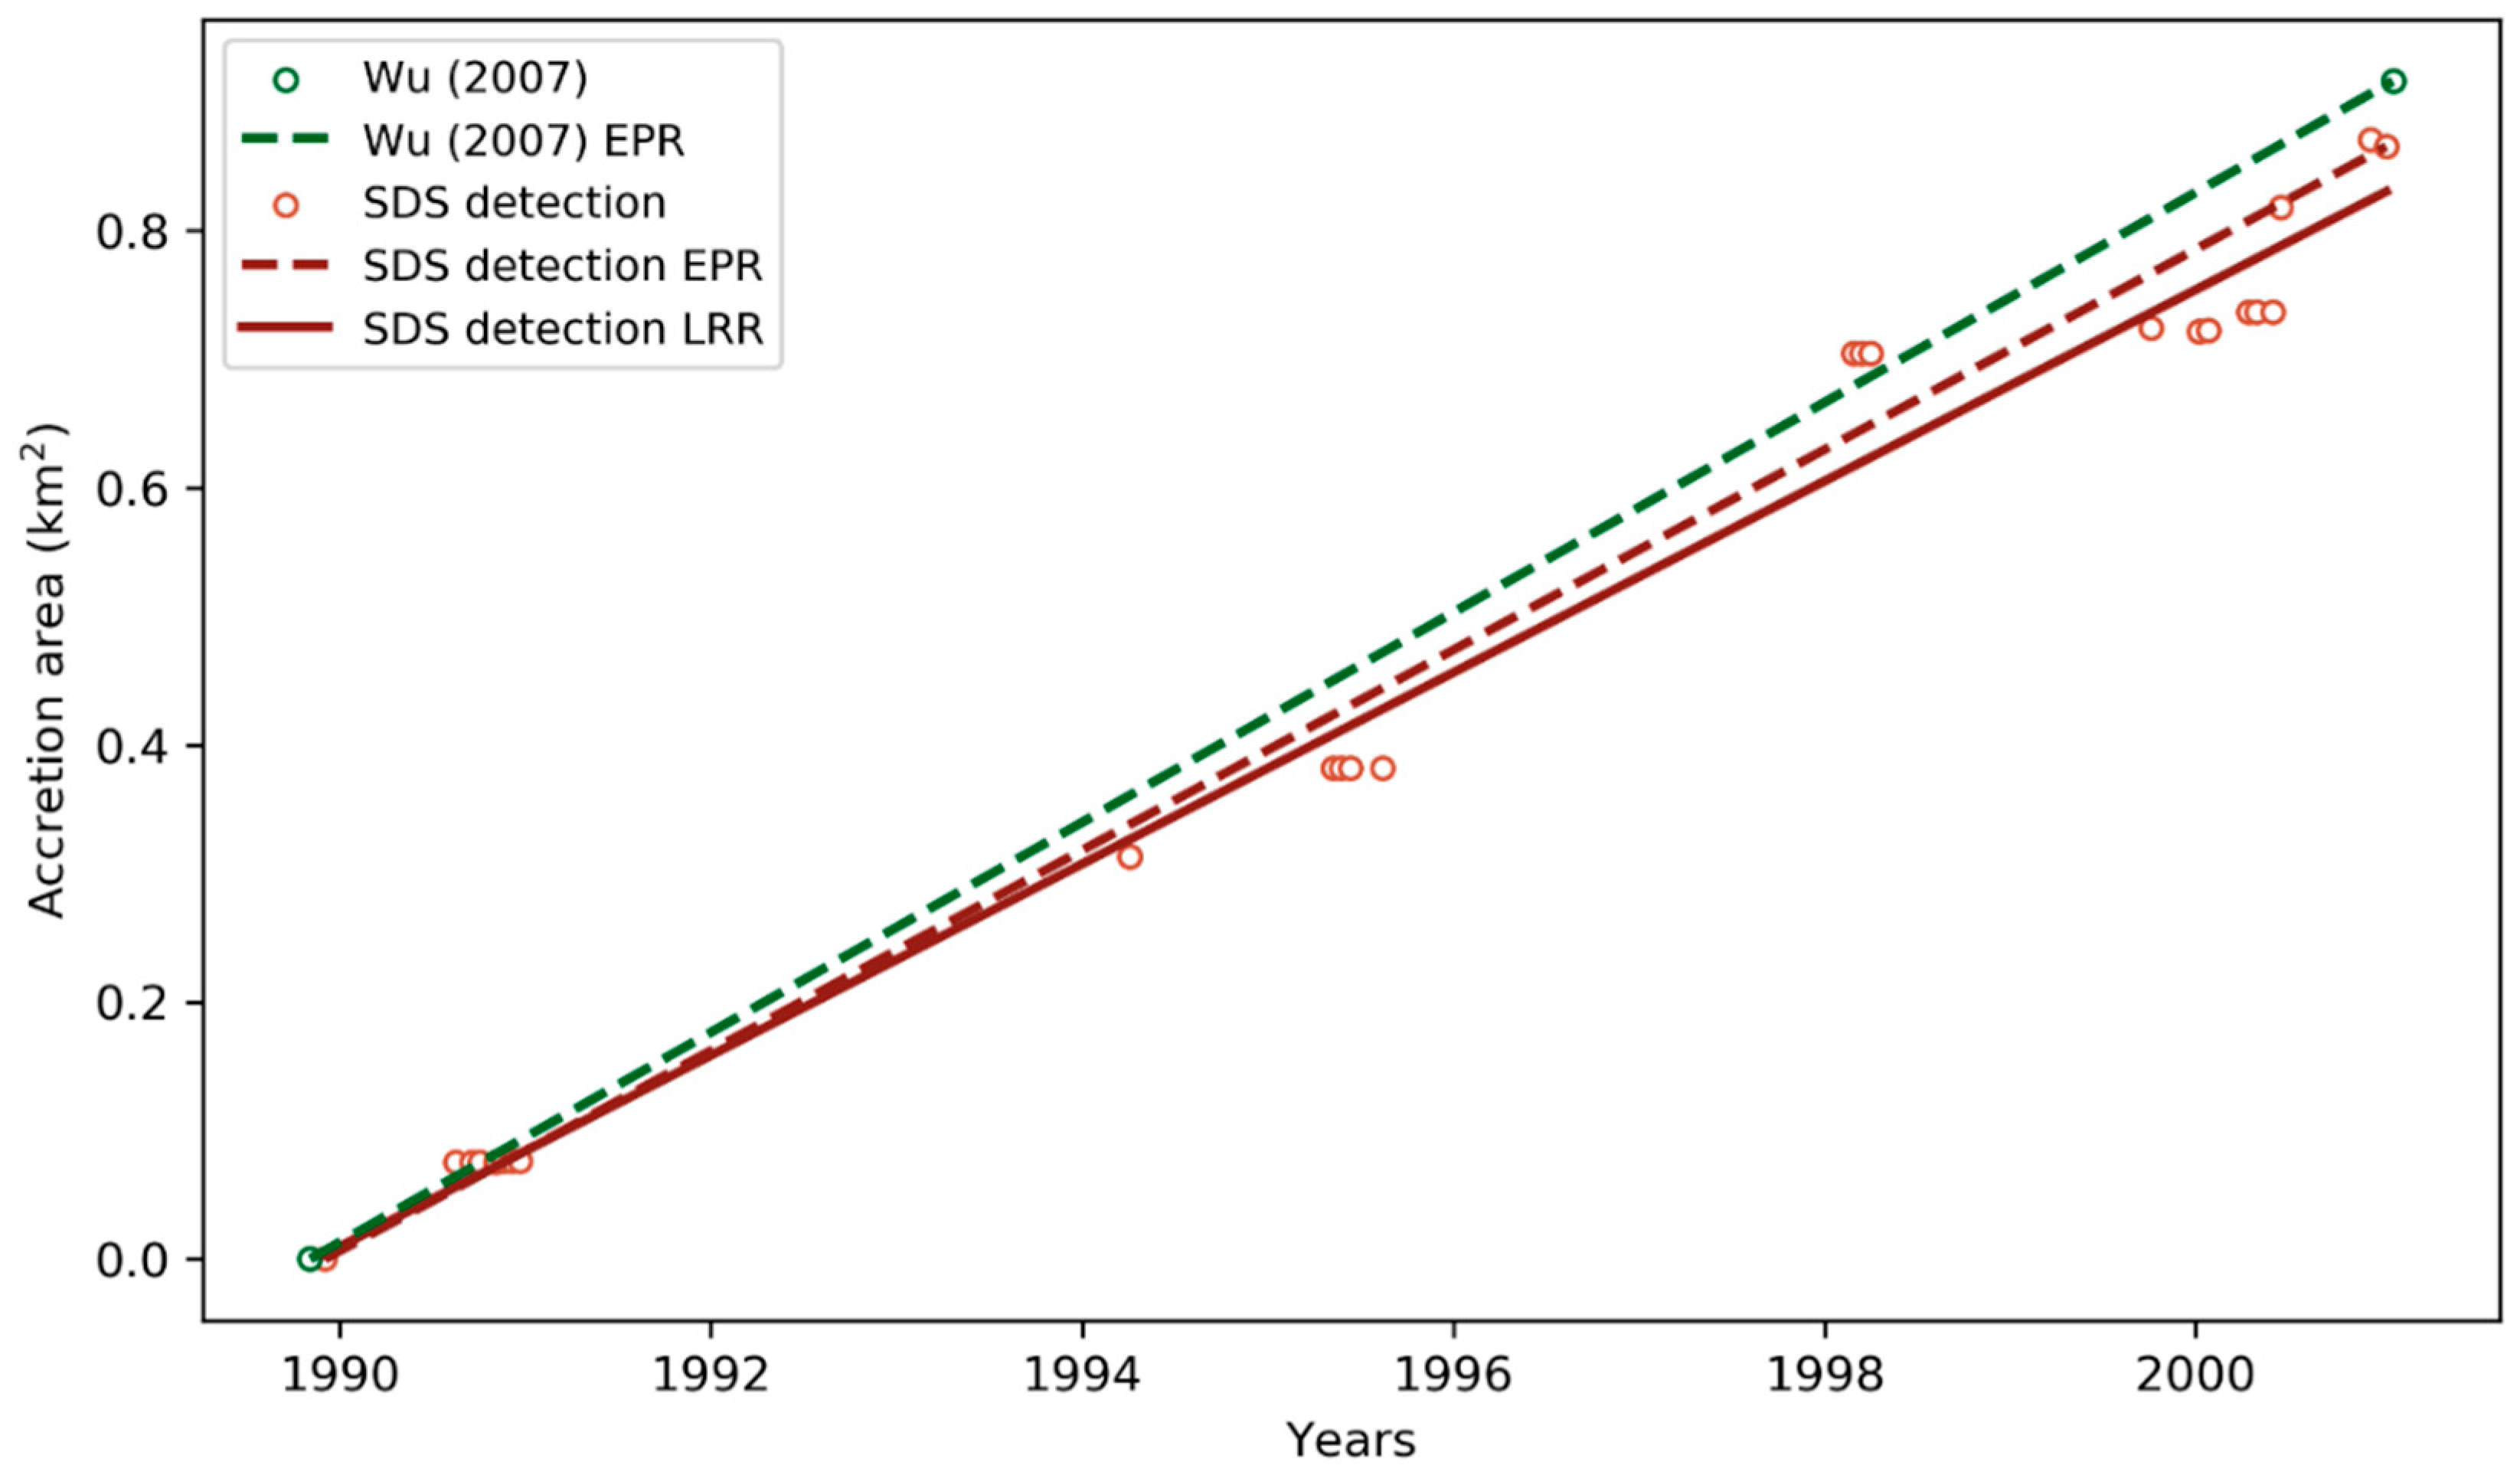
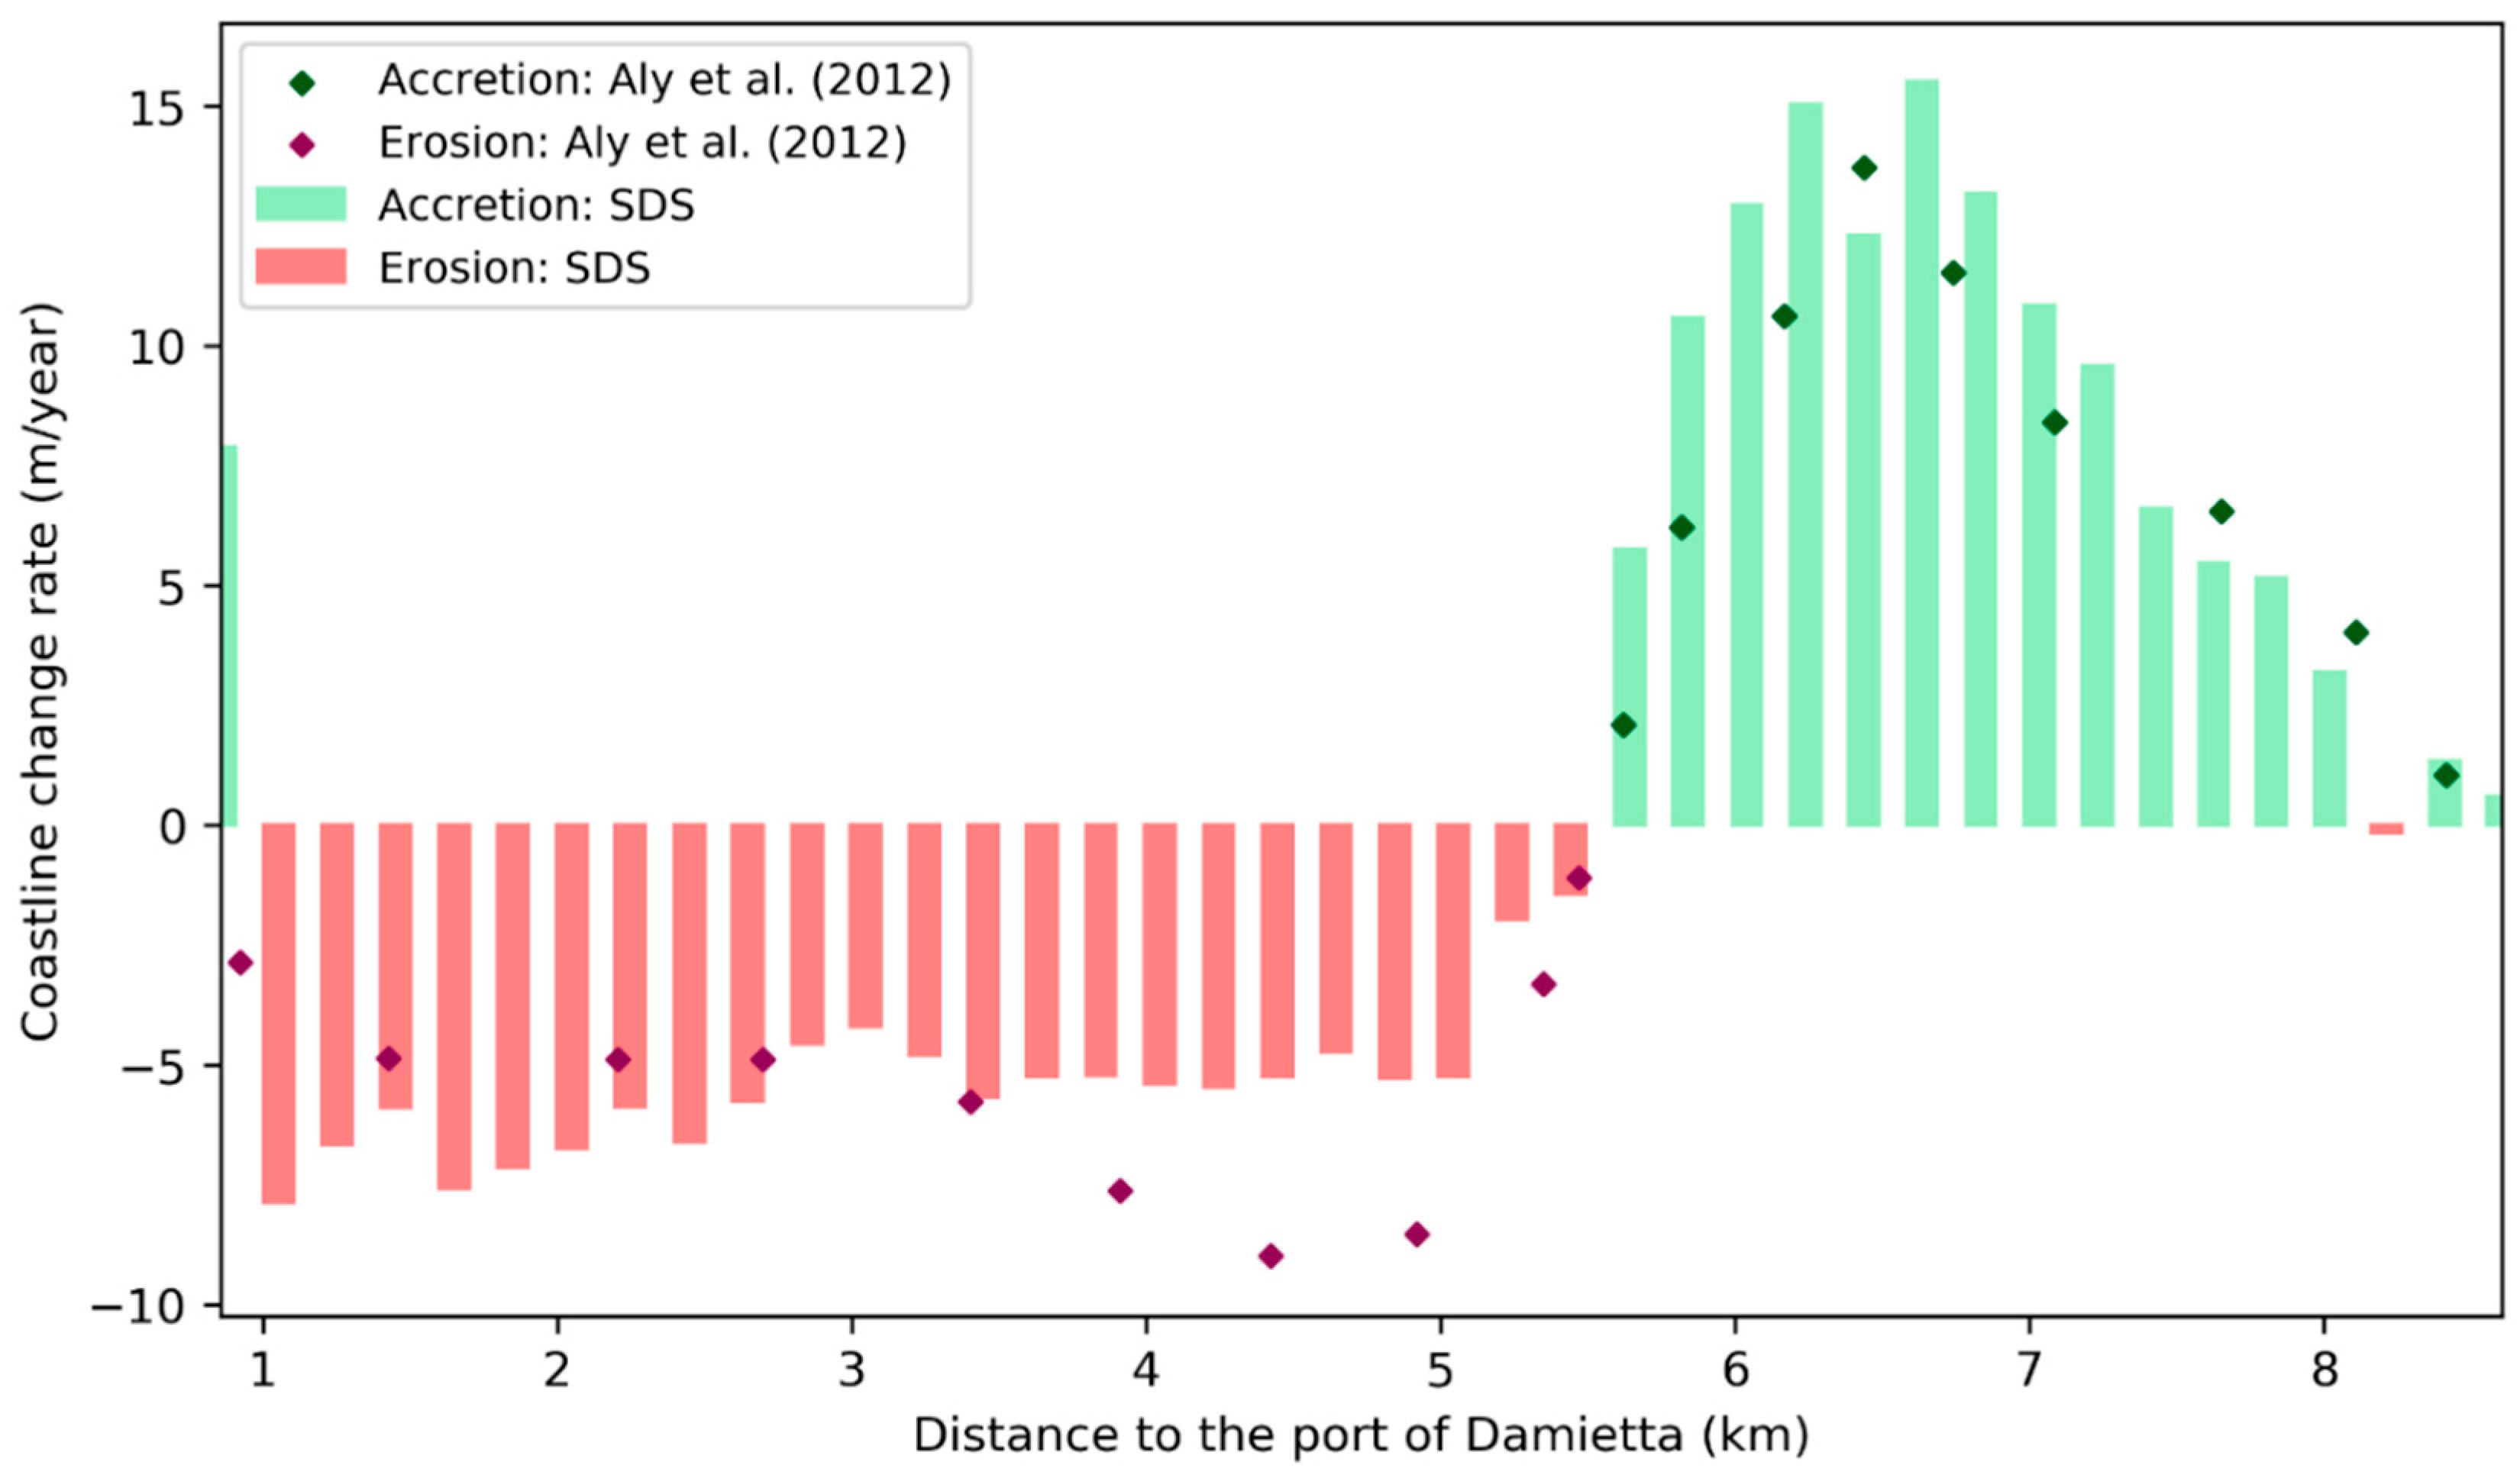
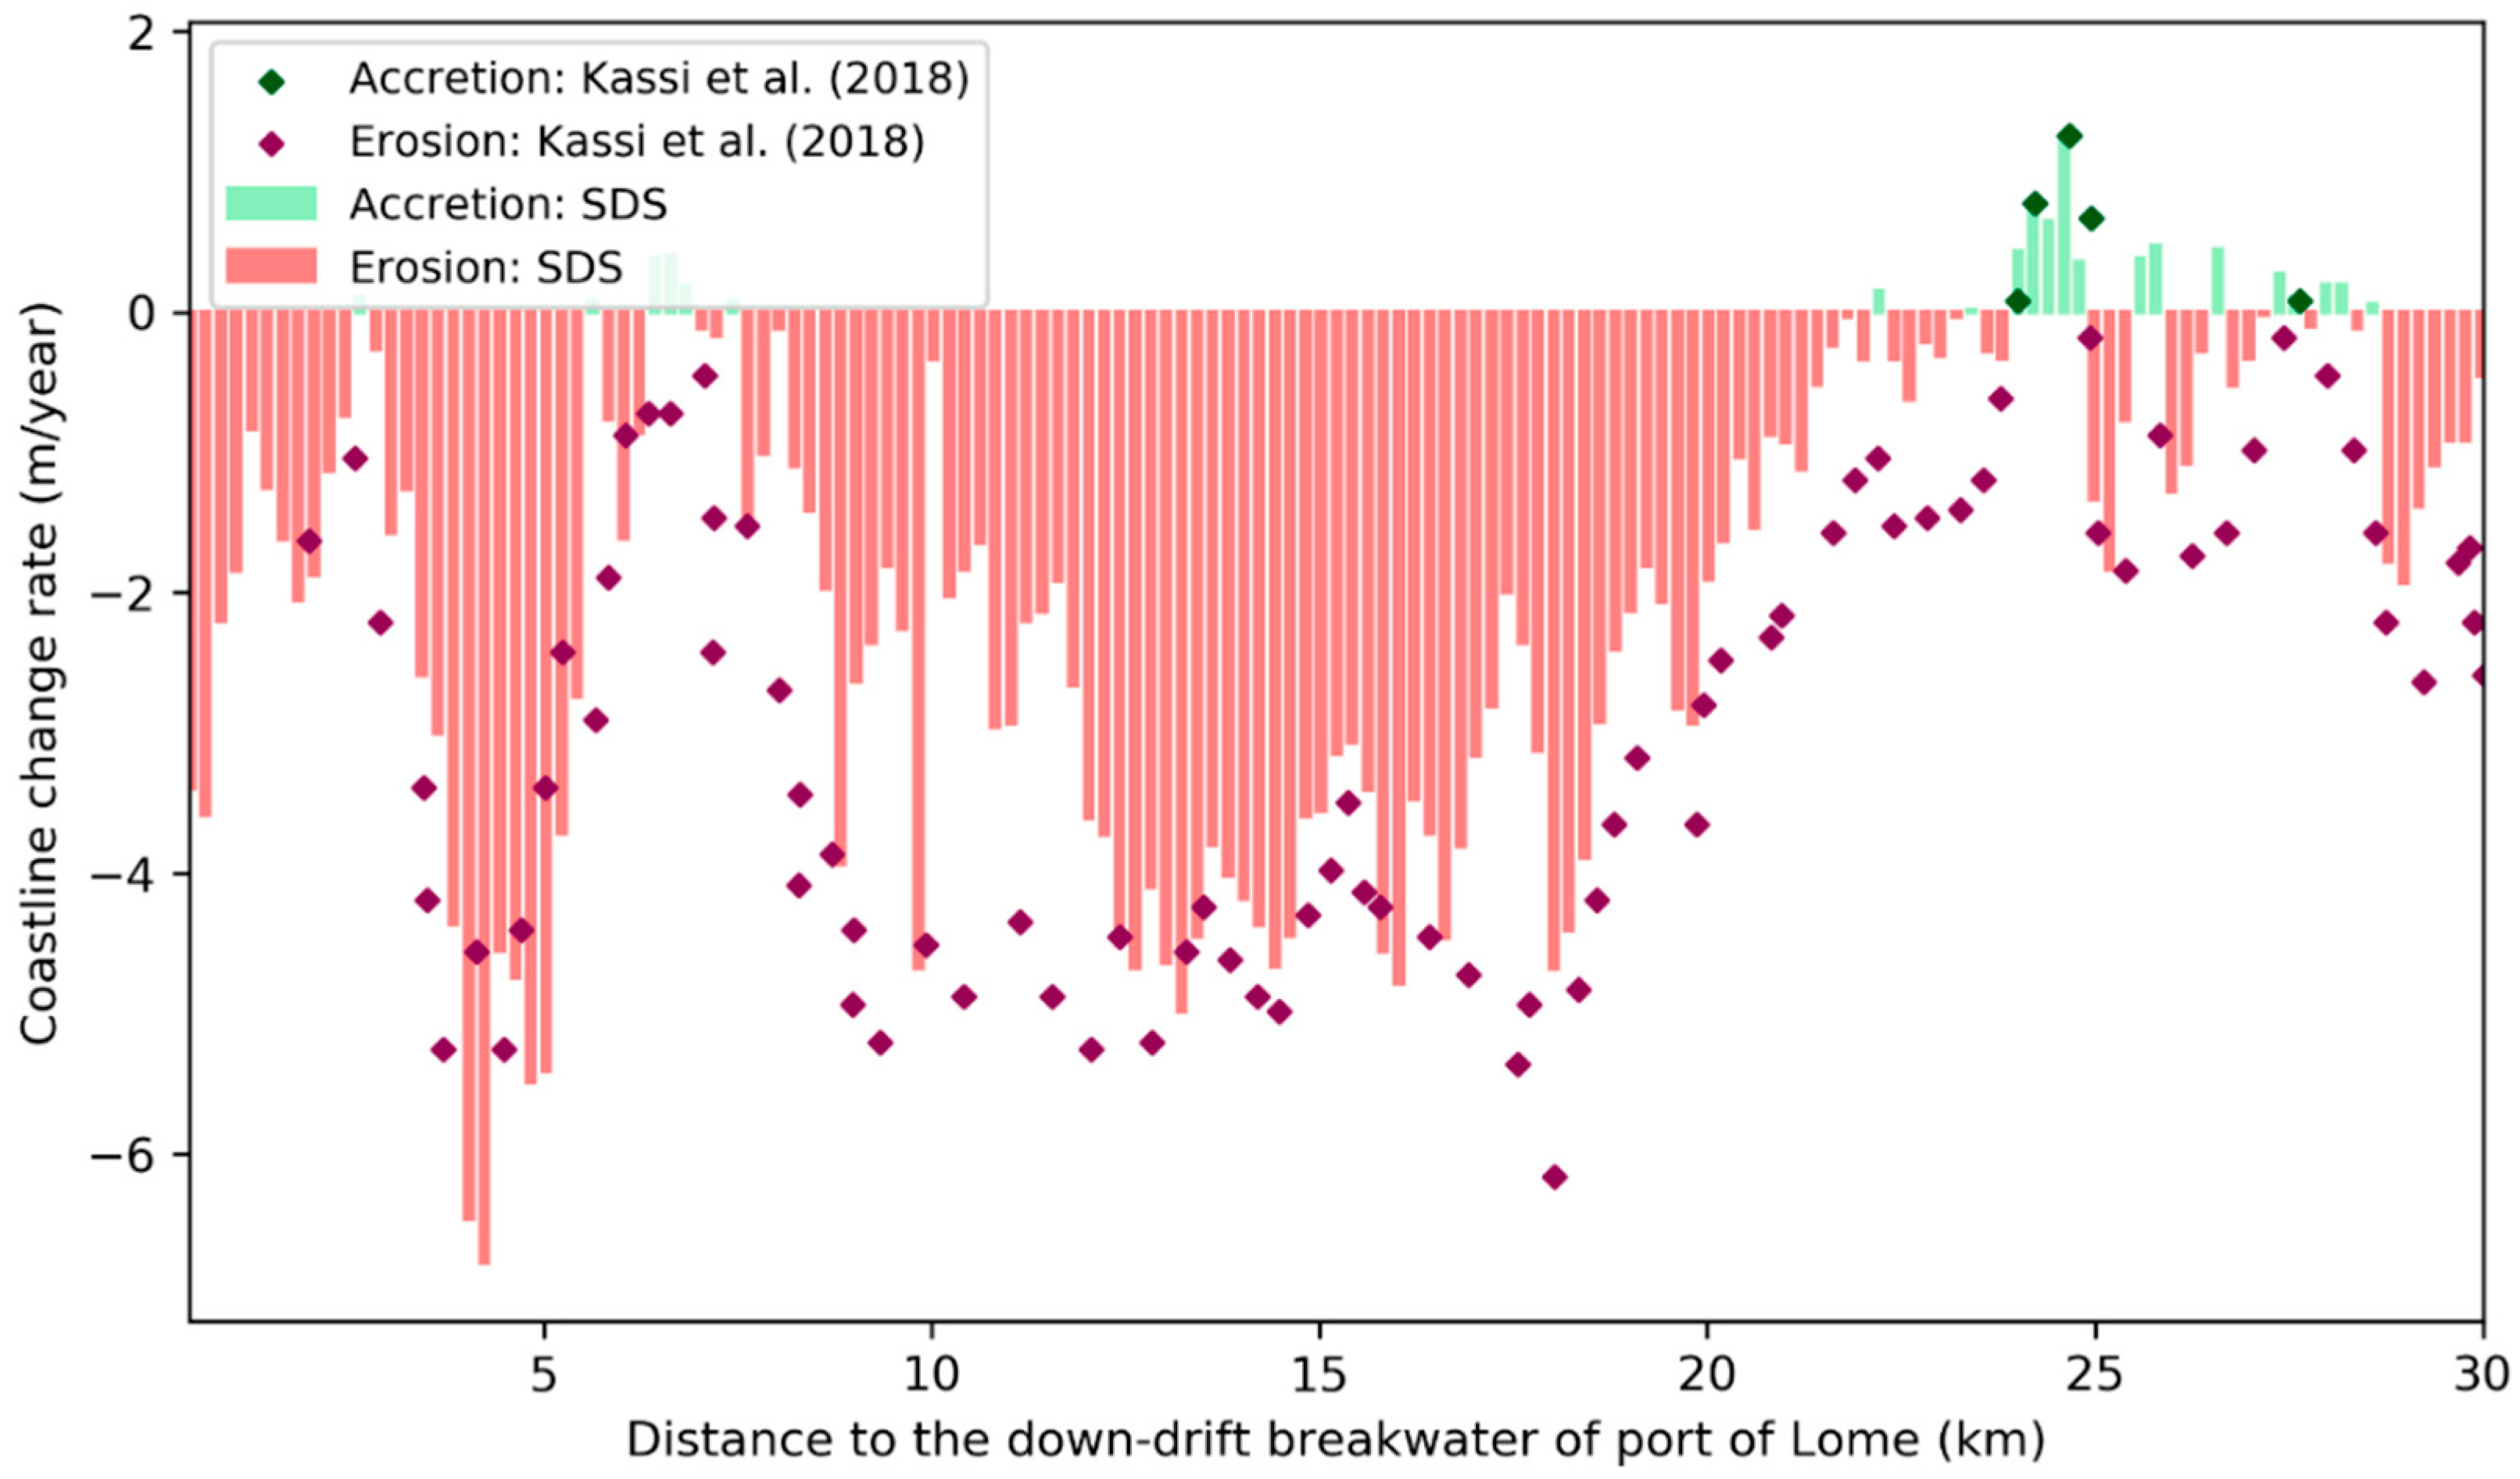
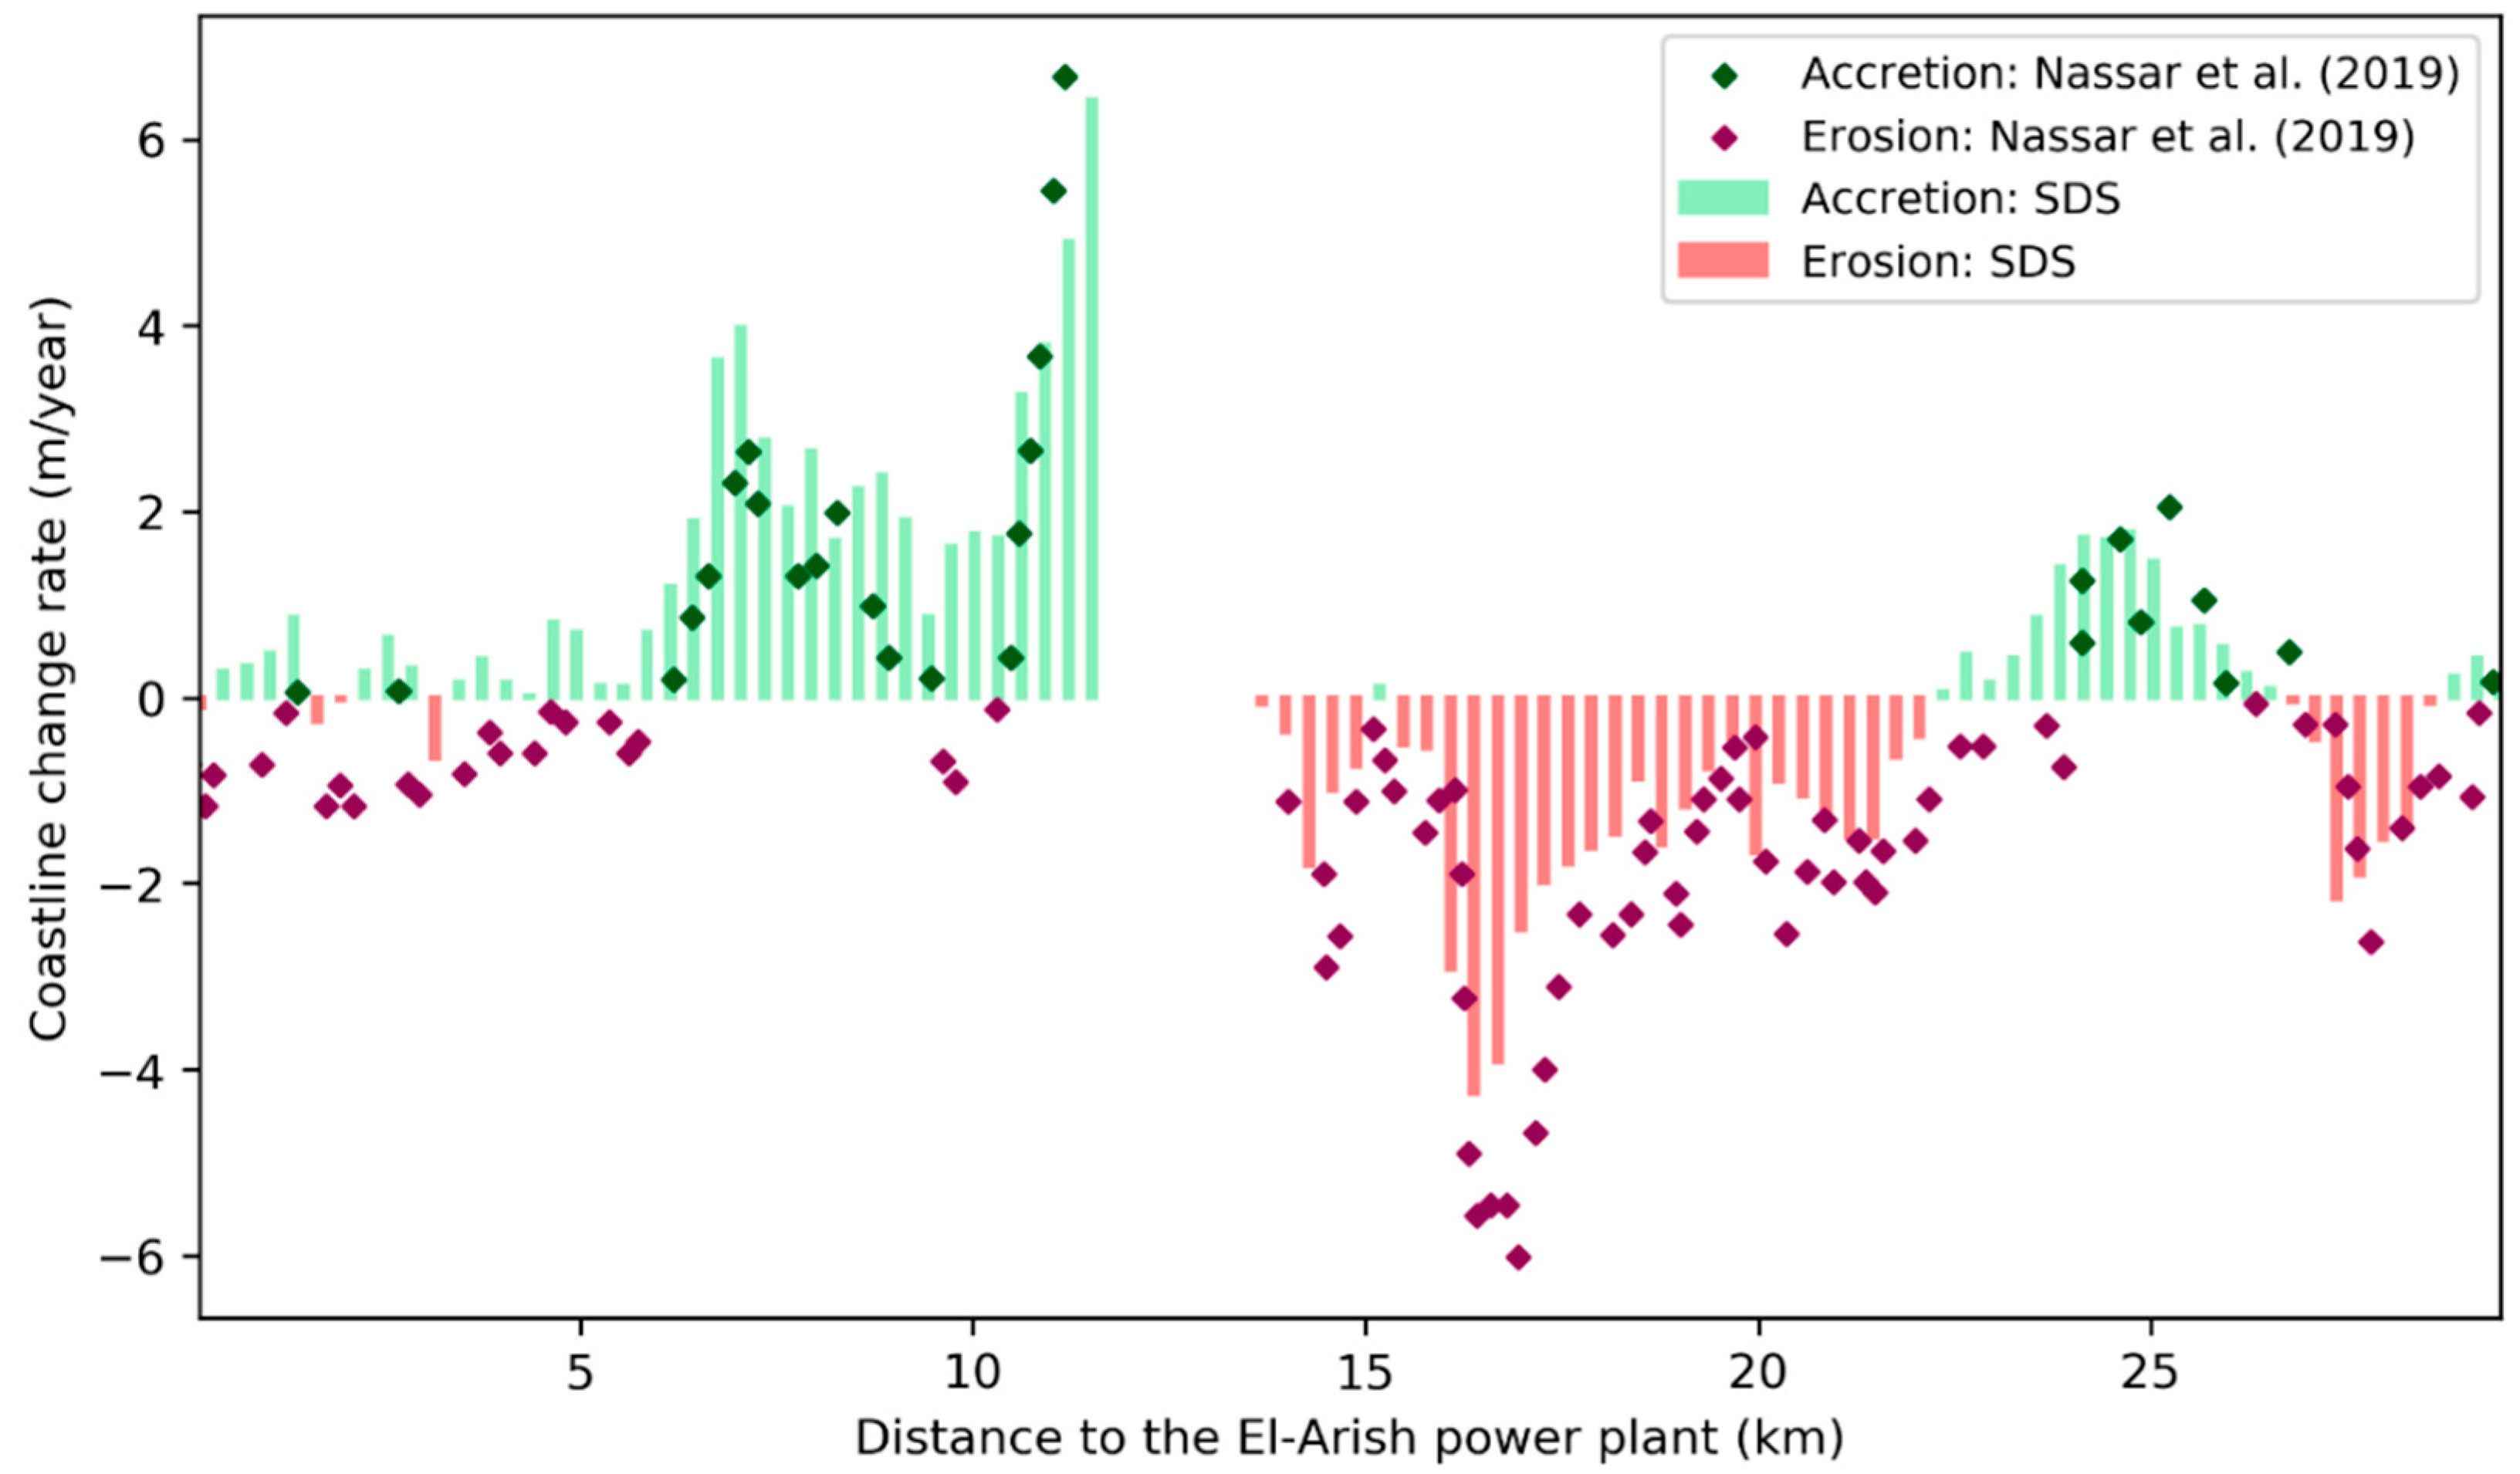
4.1. Accuracy of the Beach Change Detection

In this paper we developed a Pan-African Seaports Database and rigorously applied a promising new technique to map the beach area changes adjacent to African seaports at a continental scale. Because insufficient in-situ data were available to allow the employed method to be verified across all ports, we draw on recent studies from the literature for our verification.
The accuracy of our results depends fundamentally on the accuracy of the composite SDS algorithm to detect coastlines. The composite SDS algorithm was validated with accurate field data in recent studies for cases in the Netherlands, the United States and Australia [23,24]. Luijendijk et al. [24] obtained correlation coefficients ranging from 0.85 to 0.99 between the SDS and in-situ shoreline positions. Furthermore, RMSE values ranging from 0.5 to 1 pixel (i.e., 15–30 m for Landsat images) were obtained. The positional accuracy of the algorithm was found to be less in cases with persistent wave-induced foam on the satellite images or in regions with a large tidal range. However, the algorithm was considered suitable to analyse relative coastline changes over time [24].
Next, we focused on the hotspot ports to verify our most extreme findings against recent studies reported in the literature. Table 7 provides an overview of available studies on coastline evolution adjacent to 8 of the 13 hotspots. Most of these studies were also based on satellite data and, hence, do not provide ground-truth information (Table 7). The following considerations need to be borne in mind in comparing with the literature:
  • exact area of interest (AOI): the exact area of interest was often not indicated precisely in the available literature. Therefore, this information had to be derived manually from figures presented in these studies and may be subject to error.
  • image acquisition dates: the image acquisition dates in our study did not always match the ones in the literature, because (1) the exact date of the image acquisition was not mentioned, (2) different satellite missions were used, or (3) insufficient cloud free Landsat images were available to generate composite images.
  • transect definition: the location and orientation of the cross-shore transects that were used in literature to derive the coastline change rates were not always specified and, hence, could differ from the definitions that we used in our study.
  • manual vs. automated coastline detection: most studies detected the coastlines manually from individual cloud free images. This is more sensitive to human errors and instantaneous water levels at the time of the image acquisition than the automated coastline detection from composite images that we applied.
  • number of available images within the study period: most of the studies derived coastline trends from a limited number of images (i.e., order 2–5) using end point rates (EPR; using only the first and the last image). In contrast, we used an exponential or linear regression rate based on 10–100 times more images.
A strong point of the mapping method employed in this paper is that we used the same method for all 130 ports, which minimized the influence of the error sources described in the considerations above. To minimize the risk of the error sources in verifying our results against literature, we focused on the studies with unsupervised coastline detection techniques. These are the studies of Wu [9] for Nouakchott in Mauritania, Aly et al. [18] for Damietta in Egypt, Kassi et al. [21] for Lomé in Togo, and Nassar et al. [47] for El-Arish in Egypt. We derived the AOI from the publications and performed the composite SDS detection for the same time frame. In cases where the time frame could not exactly be matched with literature (e.g., due to different image sources), we used the composite images either closest to the image acquisition date specified in literature or, if no exact date was provided, the first composite image of the year specified in literature. We used the fitting method that was described in the literature (i.e., EPR or LRR) when comparing our results to those in the literature.
Overall, our results show good qualitative and quantitative similarity to the results of the four selected verification studies (see Figure 13, Figure 14, Figure 15 and Figure 16 and Table 8). The coastal accretion up-drift of Port of Nouakchott matches well with the study of Wu [9] with differences in the order of 0.02–0.03 km2 for cumulative changes and 0.002 km2/year for change rates (see Figure 13). For the down-drift erosion these differences were slightly larger: ca. 0.09 km2 cumulative change versus ca. 0.008 km2/year. Whereas the study of Wu [9] only provided information on the total beach area changes, the other studies also allowed us to verify the spatial distribution in coastline change rates. As these studies used locally defined longshore coordinates (e.g., based on the distance to or from the port), it was not a trivial task to match the coastline changes spatially. Therefore, we used either the port location (i.e., zero coastline change) or the point of maximum coastline change as a reference to match the alongshore coordinates. The resulting spatial patterns for the ports of Damietta, Lomé and El-Arish are presented in Figure 14, Figure 15 and Figure 16, respectively. Table 8 provides the mean and standard deviation of the differences. The results show that the patterns in terms of coastline accretion and retreat match qualitatively for all three ports. The mean difference is in the order of 1–2 m/year, which results in an offset in the absolute coastline position of 16–38 m for the time frames of the studies. This difference is in the order of 0.5 to 1 pixel (i.e., 15-30 m for Landsat imagery), which is comparable to the accuracy found by Hagenaars et al. [23] and Luijendijk et al. [24]. The accuracies obtained serve to validate the employed method.

4.2. Isolating Port-Induced Coastline Changes from Other Causes

Since the detected coastline changes were driven by a combination of natural and anthropogenic processes, it is not trivial to isolate the port-induced changes. For example, the coastline changes around Richards Bay (South Africa) were mainly determined by the changes to the Mhlatuze estuary mouth, located just south of the port. One could argue that these changes were natural. However, the new estuary mouth was dredged because of the port construction [50]. Hence, the anthropogenic influence of the port cannot be ignored in assessing the coastline changes. In our detection of beach changes, we did not distinguish between port-induced and other natural (i.e., the autonomous evolution) or anthropogenic causes (e.g., river damming, land reclamations and coastal protection works).
We tried to assess the influence of some natural and anthropogenic causes (i.e., infrastructural characteristics of the ports and their physical environment) by linking their presence to the magnitude of detected coastline changes. The results indicated that both natural and anthropogenic characteristics have affected the historic coastline evolution. The ports with the largest changes were affected by natural characteristics such as a large LST potential, limited natural sheltering, and the presence of nearby sediment sources and sinks (e.g., river mouths or tidal inlets). Also, anthropogenic characteristics, such as the presence of cross-shore coastal protection structures and long port breakwaters, influenced the historic coastal changes. Nevertheless, our analysis could not provide conclusive results on the relative importance of the natural and anthropogenic causes and, hence, could not isolate the purely port-induced effects.
One option to isolate port-induced effects could be to analyse the coastline evolution before and after the port construction, provided that these data are available. However, it is likely that for these two periods not only the port construction affected the coastline evolution, but also changes in the natural conditions and other human interferences took place. Another option could be to analyse a similar coastal stretch close to the port as a reference for the autonomous case. However, it will be difficult to find coastal stretches that are not affected by the port’s presence and, at the same time, have similar characteristics in terms of wave climate, beach profile, and coastline orientation. Alternatively, numerical models could be used to analyse and isolate the driving processes determining the coastline evolution. For example, Giardino et al. [11] used a coastline model to isolate port-induced impacts from natural causes for the port of Lomé (Togo).

4.3. Implications for Present and Future African Seaports

Our analysis indicates that the beach changes around seaports can be large, resulting in total beach area changes up to 5.9 km2 and cross-shore coastline changes up to hundreds of meters for individual ports. Although the majority of the analyzed ports were constructed decades ago, most of the adjacent coastlines are still changing considerably. This suggests that several existing ports, especially the hotpots, have experienced and still are experiencing beach changes that may have compromised other user functions, such as urban development, beach recreation, and tourism. With the growing African population and economies [1], the competition for space and user functions in the coastal zone is likely to increase even further in the near future.
The results can be used to inform beach maintenance requirements and strategies for existing ports. To mitigate coastal erosion adjacent to existing seaports, the authorities could consider coastal protection works or sediment bypassing schemes. For ports that are located on coasts with large littoral drifts, coastal protection works may be able to mitigate coastal erosion locally. However, these ‘hard’ structures are likely to induce new coastal erosion problems further down-drift and, hence, could result in a cascade of coastal protection works. Examples of such cascades of structures can be found adjacent to the Volta Delta in Ghana, down-drift of Lomé in Togo, and at the Lobito spit in Angola. Alternatively, sediment bypassing schemes could be considered [51,52]. The bypassing schemes could be based on dredging strategies using sediments trapped in navigation channels [53] or artificial sediment traps [51], or pumping systems such as applied for the Tweed river bypass in Australia [52].
Our analysis provides insights relevant for existing seaports that are considering expansion. Ports with large historic and present coastline changes, for example those located in West Africa and around the Nile delta, are likely to experience more beach changes when they expand. Our analysis indicates that especially ports located on open coasts with large LST potential need to consider the (potential) coastal impacts of an expansion carefully. Furthermore, the likelihood of coastal impacts increases if the port is located close to rivers or tidal inlets. Ports that were constructed after 1984 and did not experience significant beach changes over the past years, are less likely to face major coastline impacts when they consider expansion. This does not necessarily apply to ports that were constructed before 1984, as the adjacent coastline may have reached an equilibrium before the period of our study. For these particular ports, the recent coastline changes may not be a good indicator for the expected coastline changes of a future expansion.
For new African port developments our analysis provides a first indication of the geographical regions where substantial or more limited adjacent beach changes can be expected. For example, our study shows that substantial beach changes can be expected in West Africa and around the Nile delta. For new port developments in these regions, the feasibility studies need to address this through appropriate site selection and layout design of the ports. Furthermore, our analysis indicates, that even in more energetic coastal environments, adjacent beach changes can be reduced by selecting locations behind natural barriers or adjacent to headlands or other non-erodible parts of the coast.

4.4. Validity and Applicability of Coastline Evolution Drivers

The dominant drivers of coastline evolution for the African seaports are likely to also apply to seaports on other continents. Our findings in terms of driving characteristics confirm coastal engineering theory [6,8,41,42,43]. As this theory is generally applicable, it is likely that these drivers also determine the coastal changes around ports on other locations on Earth. The number of drivers that we identified is restricted by the information that we included in the Pan-African Seaports Database. As described in Section 2 the coastline detection was restricted to sandy environments (Section 2.2), and the characteristics were limited by the information that could be derived from satellite imagery or global databases (Section 2.3). Therefore, the identified drivers are probably incomplete. For example, muddy coastlines, which were not included in the present study, may have other drivers, such as offshore sediment concentrations, tidal amplitude, and presence/absence of vegetation. This implies that a port located in an environment lacking the coastline evolution drivers analysed as relevant in this study, may still experience significant adjacent coastline evolution, and vice versa. Therefore, practitioners should be cautious in deriving conclusions solely based on the characteristics investigated in this study. Nevertheless, the presence of the drivers found in this study, certainly provides a first indication that significant coastline evolution can be expected. Indeed, an assessment of the presence of these drivers could inform the (pre-)feasibility stages of port planning and design in terms of site selection and layout design.

4.5. Opportunities for Future Applications

We have demonstrated that earth observation data can be used to perform a large continental-scale study of coastline evolution for environments where the availability of in-situ measurements is limited or non-existent. The SDS data offered information on the historic coastline evolution spanning decades and covering the continent. With the increasing spatial resolution and shorter revisiting times associated with the latest satellite missions, the accuracy of the SDS data will probably improve in future and its applicability for coastal monitoring and analysis is likely to increase. Given the global availability of satellite imagery, the SDS technique can potentially be applied to coastline evolution assessments and monitoring on the other continents.
The earth observation data can also be used to calibrate and validate the numerical models used to predict future coastline evolution trends. The power of models is that they allow us to make predictions of future coastline evolution under changing natural forcing (e.g., sea level rise, increasing storminess) and to isolate the influence of human interventions. With the continuous information that is becoming available from earth observations even hybrid data-model solutions for coastline evolution studies, in which data is continuously assimilated into the model predictions, may become feasible.

5. Conclusions

In sedimentary environments, port developments can have adverse impacts on the adjacent beach evolution. In this study we employed an innovative method to map the sandy beach evolution adjacent to 130 African seaports over the past 34 years based on automated processing of satellite imagery, resulting in a unique “Pan-African Seaports Database” with port characteristics and decadal coastline evolution information at a continental scale. This not only enabled us to map the coastline evolution around many ports for which limited in-situ data are available, but also allowed us to intercompare and learn from the observed beach changes and relate them to classes of potential causes (or “drivers”).
The results revealed large geographical differences in the magnitudes of historic beach changes. Overall, we found that the total beach area changes (i.e., the sum of accretion and erosion) adjacent to the 130 African seaports were more than 44 km2 since 1984, of which ca. 23 km2 is accretion and ca. 21 km2 is erosion. The total beach area change since the construction of the ports is likely to be even larger, as most of the analyzed ports were constructed before 1984, and beach changes before this year were not accounted for in this study. A relatively small number of ports is responsible for the majority of the total changes with the top 10% “hotspot” ports, mainly located in West Africa and close to the Nile river delta, accounting for more than 65% of the changes. Whereas beach erosion and accretion are almost in balance overall, the beaches around individual ports can be strongly dominated by either accretion or erosion. The mean cross-shore coastline changes over the entire 34-year period are 67.5 m (i.e., 1.99 m/year) for the hotspots, and 178 m (5.24 m/year) for Nouakchott, the port with the largest beach changes. Locally, these changes can be even larger and, hence, may impact spatial planning and the use of the coastal zone.
Although the majority of the African seaports were designed and constructed decades ago (i.e., 71% before 1984), most of the adjacent coastlines are still changing. The seaports with the highest present beach change rates largely overlap with the hotspots in terms of historic changes. Based on the present rates, a total of 6.2 km2 beach change is expected for the coming 5 years. This is significant compared to the changes detected over the last 34 years. This illustrates that coastline changes adjacent to ports occur over long timescales and that these effects are highly relevant to the planning and design of new port developments.
We found three persistent underlying causes or ‘drivers’ for sandy beach changes adjacent to the hotspot ports: they are located on open coastlines, have large alongshore sediment transport potential, and have large cross-shore breakwaters. Ports that were constructed earlier had the largest contribution to the total historic beach evolution, whereas more recently constructed ports showed larger average present beach change rates. Although the drivers of sandy beach evolution are well established in coastal engineering theory, our evidence indicates that the beaches adjacent to the existing African seaports have been and still are seriously impacted by these drivers. This suggests that the mapping method and analysis could support port planners and engineers in learning from past port designs. Our results could help to inform beach maintenance requirements and strategies for existing seaports as well as to support improved site selection and design of port expansions and new port developments in Africa to minimize long-term coastal impacts in the future.

Author Contributions

W.d.B. conceived the idea for the study; W.d.B., Y.M. and G.H. developed the methodology and analyzed the results; S.d.V. contributed to the analysis of the results; W.d.B. prepared the manuscript; Y.M., G.H., S.d.V., J.S. and T.V. contributed to the editing and improving of the manuscript; T.V. and J.S. acquired the funding for the work.

Funding

This work was supported by the project “Integrated and Sustainable Port development in Ghana within an African context (W07.69.206) within the Urbanizing Deltas of the World program of The Netherlands Organization for Scientific Research (NWO) and the Deltares strategic research program “Future-proof Coastal Infrastructure and Offshore Renewable Energy”.

Conflicts of Interest

The authors declare no conflict of interest.

References

  1. United Nations Conference on Trade and Development (UNCTAD). Review of Martime Transport; United Nations: New York, NY, USA; Geneva, Switzerland, 2013. [Google Scholar]
  2. Odum, H.T.; Odum, B. Concepts and methods of ecological engineering. Ecol. Eng. 2003, 20, 339–361. [Google Scholar] [CrossRef]
  3. World Association for Waterborne Transport Infrastructure (PIANC). ‘Sustainable Ports’ a Guide for Port Authorities; PIANC: Brussels, Belgium, 2014. [Google Scholar]
  4. De Vriend, H.J.; Van Koningsveld, M.; Aarninkhof, S.G.J.; De Vries, M.B.; Baptist, M.J. Sustainable hydraulic engineering through building with nature. J. Hydro-Environ. Res. 2015, 9, 159–171. [Google Scholar] [CrossRef]
  5. Nebot, N.; Rosa-Jimenez, C.; Ninot, R.P.; Perea-Medina, B. Challenges for the future of ports. What can be learnt from the Spanish Mediterranean ports? Ocean Coast. Manag. 2017, 137, 165–174. [Google Scholar] [CrossRef]
  6. Pelnard-Considere, R. Essai de Theorie de L’evolution des Formes de Rivage en Plages de Sable et de Galets; Les Energies de la Mer: Compte Rendu Des Quatriemes Journees de L’hydraulique, Paris 13, 14 and 15 Juin 1956; Question III, rapport 1, 74-1-10; Société Hydrotechnique de France: Paris, France, 1956; pp. 289–298. [Google Scholar]
  7. Meinesz, A.; Lefevre, J.R.; Astier, J.M. Impact of coastal development on the infralittoral zone along the southeastern Mediterranean shore of continental France. Mar. Pollut. Bull. 1991, 23, 343–347. [Google Scholar] [CrossRef]
  8. Bruun, P. The development of downdrift erosion. J. Coast. Res. 1995, 11, 1242–1257. [Google Scholar]
  9. Wu, W. Coastline evolution monitoring and estimation—A case study in the region of Nouakchott, Mauritania. Int. J. Remote Sens. 2007, 28, 5461–5484. [Google Scholar] [CrossRef]
  10. Mangor, K.; Brøker, I.; Deigaard, R.; Grunnet, N. Bypass harbours at littoral transport coasts. In Proceedings of the PIANC MMX Congress, Liverpool, UK, 10–14 May 2010. [Google Scholar]
  11. Giardino, A.; Schrijvershof, R.; Nederhoff, C.; De Vroeg, H.; Brière, C.; Tonnon, P.-K.; Caires, S.; Walstra, D.; Sosa, J.; Van Verseveld, W. A quantitative assessment of human interventions and climate change on the West African sediment budget. Ocean. Coast. Manag. 2017, 156, 249–265. [Google Scholar] [CrossRef]
  12. Liu, L.; Xu, W.; Yue, Q.; Teng, X.; Hu, H. Problems and countermeasures of coastline protection and utilization in China. Ocean. Coast. Manag. 2018, 153, 124–130. [Google Scholar] [CrossRef]
  13. Williams, A.T.; Rangel-Buitrago, N.; Pranzini, E.; Anfuso, G. The management of coastal erosion. Ocean. Coast. Manag. 2018, 156, 4–20. [Google Scholar] [CrossRef]
  14. Santos-Ferreira, A.; Santosa, C.; Cabrala, M. Local hydrodynamics and the siltation of Vila Praia de Âncora harbor. Procedia Eng. 2015, 116, 932–938. [Google Scholar] [CrossRef]
  15. Sarma, K.G.S. Siltation and Coastal Erosion at Shoreline Harbours. Procedia Eng. 2015, 116, 12–19. [Google Scholar] [CrossRef]
  16. Goda, Y. Random Seas and Design of Maritime Structures; University of Tokyo Press: Tokyo, Japan, 1985. [Google Scholar]
  17. Kaki, C.; Laïbi, R.A.; Oyédé, L.M. Evolution of Beninese coastline from 1963 to 2005: Causes and consequences. Br. J. Environ. Clim. Chang. 2011, 1, 216–231. [Google Scholar] [CrossRef]
  18. Aly, M.H.; Giardino, J.R.; Klein, A.G.; Zebker, H.A. InSAR study of shoreline change along the Damietta Promontory, Egypt. J. Coast. Res. 2012, 28, 1263–1269. [Google Scholar] [CrossRef]
  19. Laïbi, R.A.; Anthony, E.J.; Almar, R.; Castelle, B.; Senechal, N.; Kestenare, E. Longshore drift cell development on the human-impacted Bight of Benin sand barrier coast, West Africa. J. Coast. Res. 2014, 78–83. [Google Scholar] [CrossRef]
  20. Almar, R.; Kestenare, E.; Reyns, J.; Jouanno, J.; Anthony, E.J.; Laibi, R.; Hemer, M.; Du Penhoat, Y.; Ranasinghe, R. Response of the Bight of Benin (Gulf of Guinea, West Africa) coastline to anthropogenic and natural forcing. Part 1: Wave Climate variability and impacts on the longshore sediment transport. J. Cont. Shelf Res. 2015, 110, 48–59. [Google Scholar] [CrossRef]
  21. Kassi, A.J.-B.; Affo Djobo, A.; Kouame, A.K.D. Comparative Analysis of DSAS and MobiTC in Coastal Coastline Dynamics of Baguida and Agbodrafo Cantons (South-East Togo) from 1986 to 2017. Int. J. Comput. Trends Technol. 2018, 56, 32–37. [Google Scholar] [CrossRef]
  22. Gorelick, N.; Hancher, M.; Dixon, M.; Ilyushchenko, S.; Thau, D.; Moore, R. Google Earth Engine: Planetary-scale geospatial analysis for everyone. Remote Sens. Environ. 2017, 202, 18–27. [Google Scholar] [CrossRef]
  23. Hagenaars, G.; De Vries, S.; Luijendijk, A.P.; De Boer, W.P.; Reniers, A.J.H.M. On the accuracy of automated shoreline detection derived from satellite imagery: A case study of the Sand Motor mega-scale nourishment. Coast. Eng. 2018, 133, 113–125. [Google Scholar] [CrossRef]
  24. Luijendijk, A.; Hagenaars, G.; Ranasinghe, R.; Baart, F.; Donchyts, G.; Aarninkhof, S. The State of the World’s Beaches. Nat. Sci. Rep. 2018, 8. [Google Scholar] [CrossRef]
  25. Bruun, P.; Gerritsen, F. Stability of Coastal Inlets; North-Holland Publishing Co.: Amsterdam, The Netherlands, 1960; p. 123. [Google Scholar]
  26. Hayes, M.O. General morphology and sediment patterns in tidal inlets. Sediment. Geol. 1980, 26, 139–156. [Google Scholar] [CrossRef]
  27. Hayes, M.O.; FitzGerald, D.M. Origin, Evolution, and Classification of Tidal Inlets. J. Coast. Res. 2013, 69, 14–33. [Google Scholar] [CrossRef]
  28. McSweeney, S.L.; Kennedy, D.M.; Rutherfurd, I.D.; Stout, J.C. Intermittently Closed/Open Lakes and Lagoons: Their global distribution and boundary conditions. Geomorphology 2017, 292, 142–152. [Google Scholar] [CrossRef]
  29. National Geospatial-Intelligence Agency. World Port. Index; National Geospatial-Intelligence Agency: Springfield, VA, USA, 2017.
  30. Google Earth Pro. Available online: http://www.google.com/earth/index.html (accessed on 18 August 2018).
  31. McFeeters, S.K. The use of the normalized difference water index (ndwi) in the delineation of open water features. Int. J. Rem. Sens. 1996, 17, 1425–1432. [Google Scholar] [CrossRef]
  32. Otsu, N.A. A Threshold Selection Method from Gray-Level Histograms. IEEE Trans. Syst. Man Cybern. 1979, 9, 62–66. [Google Scholar] [CrossRef]
  33. Hansen, M.C.; Potapov, P.V.; Moore, R.; Hancher, M.; Turubanova, S.A.; Tyukavina, A.; Thau, D.; Stehman, S.V.; Goetz, S.J.; Loveland, T.R.; et al. High-resolution global maps of 21st-century forest cover change. Science 2013, 342, 850–853. [Google Scholar] [CrossRef]
  34. Donchyts, G.; Baart, F.; Winsemius, H.; Gorelick, N.; Kwadijk, J.; Van De Giesen, N. Earth’s surface water change over the past 30 years. Nat. Clim. Chang. 2016, 6, 810–813. [Google Scholar] [CrossRef]
  35. Wang, L.; Hou, C.; Li, P.; Qu, H.; Zhang, J. Study on Rocky Coastline Extraction of High-Spatial-Resolution Remote Sensing Images. In Proceedings of the International Conference on Computer and Information Technology Application, Shenzhen, China, 18–19 April 2016. [Google Scholar] [CrossRef]
  36. Harris, I.; Jones, P.D.; Osborn, T.J.; Lister, D.H. Updated high-resolution grids of monthly climatic observations—The CRU TS3.10 Dataset. Int. J. Climatol. 2014, 34, 623–642. [Google Scholar] [CrossRef]
  37. Stive, M.J.F.; Aarninkhof, S.G.J.; Hamm, L.; Hanson, H.; Larson, M.; Wijnberg, K.M.; Nicholls, R.J.; Copabianco, M. Variability of shore and shoreline evolution. Coast. Eng. 2002, 47, 211–235. [Google Scholar] [CrossRef]
  38. Dee, D.P.; Uppala, S.M.; Simmons, A.J.; Berrisford, P.; Poli, P.; Kobayashi, S.; Andrae, U.; Balmaseda, M.A.; Balsamo, G.; Bauer, P.; et al. The ERA-Interim reanalysis: Configuration and performance of the data assimilation system. Q.J.R. Meteorol. Soc. 2011, 137, 553–597. [Google Scholar] [CrossRef]
  39. U.S. Army Corps of Engineers. Shore Protection Manual, 4th ed.; Coastal Engineering Research Center, Department of the Army: Waterways Experiment Station, Corps of Engineers; Coastal Engineering Research Center: Vicksburg, MI, USA, 1984. [Google Scholar]
  40. Eko Atlantic. Available online: https://www.ekoatlantic.com/ (accessed on 20 December 2018).
  41. Van Rijn, L.C. Principles of Coastal Morphology; Aqua Publications: Amsterdam/Oldemarkt, The Netherlands, 1998. [Google Scholar]
  42. Kamphuis, J.W. Introduction to Coastal Engineering and Management; World Scientific: Singapore, 2010. [Google Scholar]
  43. U.S. Army Corps of Engineers. Coastal Engineering Manual (CEM), Engineer Manual 1110-2-1100; U.S. Army Corps of Engineers: Washington, DC, USA, 2002.
  44. Elmoustapha, A.O.; Levoy, F.; Monfort, O.; Koutitonsky, V.G. A Numerical Forecast of Shoreline Evolution after Harbour Construction in Nouakchott, Mauritania. J. Coast. Res. 2007, 23, 1409–1417. [Google Scholar] [CrossRef]
  45. El-Asmar, H.M. Short Term Coastal Changes Along Damietta-Port Said Coast Northeast of the Nile Delta, Egypt. J. Coast. Res. 2002, 18, 433–441. [Google Scholar] [CrossRef]
  46. Akinluyi, F.O.; Adebola, A.O.; Adeseko, A.A. Assessment of Shorelines and Associated Landuse/Land cover Changes alng Part of Lagos Coastline, Nigeria. Contemp. Trends. Geeosci. 2018, 7, 59–70. [Google Scholar] [CrossRef]
  47. Nassar, K.; Mahmod, W.E.; Fath, H.; Masria, A.; Nadaoka, K.; Negm, A. Shoreline change detection using DSAS technique: Case of North Sinai coast, Egypt. Mar. Georesources Geotechnol. 2019, 37, 81–95. [Google Scholar] [CrossRef]
  48. Wognin, A.I.V.; Coulibaly, A.S.; Akobe, A.C.; Monde, S.; Aka, K. Morphologie du littoral et cinématique du trait de côte de Vridi à Grand-Bassam (Côte d’Ivoire). J. Environ. Hydrol. 2013, 21, 1–10. [Google Scholar]
  49. Touré, B.; Kouamé, K.F.; Souleye, W.; Collet, C.; Affian, K.; Ozer, A.; Rudant, J.P.; Biémi, J. L’influence des actions anthropiques dans l’évolution historique d’un littoral sableux à forte dérive sédimentaire: La baie de Port-Bouët (Abidjan, Côte d’Ivoire). Géomorphologie Relief Process. Environ. 2012, 18, 369–382. [Google Scholar] [CrossRef]
  50. Jerling, H.L. The Zooplankton Community of the Mhlathuze (Richards Bay) Estuary: Two Decades After Construction of the Harbour. Afr. J. Mar. Sci. 2003, 25, 289–299. [Google Scholar] [CrossRef]
  51. Bruun, P.; Willekes, G. Bypassing and backpassing at Harbors, Navigation Channels, and Tidal Entrances: Use of Shallow-Water Draft Hopper Dredgers with Pump-Out Capabilities. J. Coast. Res. 1992, 8, 972–977. [Google Scholar]
  52. Cox, R.; Howe, D. Tweed River entrance and bypass sediment dynamics. In Proceedings of the International Conference on Coastal Engineering, Santander, Spain, 1–6 July 2012. [Google Scholar]
  53. Zwaborn, J.A.; Fromme, G.A.W.F.; FitzPatrick, J.B. Underwater mound for the protection of Durban’s beaches. In Proceedings of the Conference on Coastal Engineering, Washington, DC, USA, 13–18 September 1970; pp. 975–994. [Google Scholar] [CrossRef]
Figure 1. Overview of the geographical locations of the African ports that were initially identified. The seaports included in this study are indicated in green, consisting of seaports from the World Port Index complemented with additional ports identified from recent satellite imagery (green dots), and merged seaports (orange dots). Ports excluded from this study are indicated in red, consisting of ports located at rivers, lakes or canals (red crosses), and ports without clearly visible structures on the latest high-resolution satellite imagery (red dots).
Jmse 07 00151 g001
Figure 2. Overview of the African seaports classified in terms of sedimentary characterization of the adjacent coastline. The seaports on sandy coastlines (yellow dots) are included in this study whereas the ports located on muddy (red dots) or rocky (marked red dots) coastlines are excluded. The size of the dots represents the number of available Landsat images in the study timeframe (i.e., 1984–2018). The cloud cover percentage map for 2006 (from [36]), which co-determines image availability, is plotted as reference.
Jmse 07 00151 g002
Figure 3. Schematic example of the up-drift and down-drift beach evolution adjacent to a port with shore-normal breakwater structures. The satellite derived shoreline (SDS) after several years of evolution (in blue) is compared to the baseline (in purple). Beach accretion is indicated by the green surface areas (A1 and A2) whereas beach erosion is indicated by the red surface area (A3). The orange dots indicate the intersections of the shorelines with each other, the up-drift and down-drift boundaries, and the port structures.
Jmse 07 00151 g003
Figure 4. Example of the beach area change detected for the port of Nouakchott (Mauritania) between January 1984 and December 2017 with a close-up zoom of the areal changes near the port. As in Figure 3, the baseline is indicated in purple, the latest satellite derived shoreline (SDS) in blue, the erosion area in red, the accretion area in green, and the intersections by orange dots.
Jmse 07 00151 g004
Figure 5. Schematic illustration of the fitting of the exponential trend line to the Satellite Derived Shoreline (SDS) data over the study period. Trend lines are fitted separately for the gross accretion and erosion areas. The historic beach evolution is determined from the cumulative beach area change between the first and last available SDS. The present beach evolution rate is estimated from the derivative of the SDS on 1 January 2018.
Jmse 07 00151 g005
Figure 6. Example of the offshore wave rose for Port of Nouakchott (Mauritania), the coastline orientation β (red arrow), the shore-normal orientation (dotted red arrow), and the angle of incidence α . In the wave rose the length of the bars indicates the cumulative percentage of occurrence of each directional bin, as presented on the circular axis. The colours indicate the H s classes, as presented in the legend. The number in the centre of the rose indicates the percentage of wave conditions in the lowest H s class.
Jmse 07 00151 g006
Figure 7. Examples of ports with different sheltering settings. Left—open sandy coast (Port of Nouakchott, Mauritania); middle—headland-bay coast (Port of Amboim, Angola); right—coast behind natural barrier (Port of Luanda, Angola).
Jmse 07 00151 g007
Figure 8. Illustration of the method used to determine the shore-normal breakwater length for the Port of Nouakchott (Mauritania).
Jmse 07 00151 g008
Figure 9. Geographical overview of the gross coastal areal changes adjacent to 130 African seaports. The size of the dots represents the gross beach area change and the colour represents whether this is dominated by accretion (green) or erosion (red). The top 10% hotspot ports in terms of gross historic changes are indicated by the text boxes.
Jmse 07 00151 g009
Figure 10. Present gross (left y-axis) and net (right y-axis) areal change rates (in km2/year) for all 130 seaports in descending order based on the gross change rates. The bars show the gross (above x-axis) and net (below x-axis) accretion (green) and erosion (red) rates. The present mean coastal change rates for all ports and the top 10% are indicated by the solid and dashed black lines, respectively.
Jmse 07 00151 g010
Figure 11. The ratio of the average and present gross areal change rates for all 130 ports in descending order. Orange and blue colours indicate the ratios for the ports constructed before and after 1984, respectively. The mean ratios are represented by the dashed lines.
Jmse 07 00151 g011
Figure 12. The LST potential (i.e., H s 2.5 sin ( 2 α ) ) plotted against the present beach accretion rates (km2/year) for all ports located at open coasts.
Jmse 07 00151 g012
Figure 13. Relative accretion area detection compared to the first analysed image northward of port of Nouakchott in Mauritania based on Wu [9] (in green) and our study (in red). The dots represent the relative accretion areas in time, the dashed lines the trend line based on end point rate (EPR) and the solid line the linear regression rate (LRR).
Jmse 07 00151 g013
Figure 14. Spatial accretion (in green) and erosion (in red) patterns expressed in coastline change rates (m/year) for shore-normal transects eastward of Damietta port between 1993 and 2000. The results of Aly et al. [18] are represented by dots and our results are represented by bars.
Jmse 07 00151 g014
Figure 15. Spatial accretion (in green) and erosion (in red) patterns expressed in coastline change rates (m/year) for shore-normal transects down-drift of Lomé between 1986 and 2017. The results of Kassi et al. [21] are represented by dots and our results by bars.
Jmse 07 00151 g015
Figure 16. Spatial accretion (in green) and erosion (in red) patterns expressed in coastline change rates (m/year) for shore-normal transects down-drift of El-Arish power plant between 1989 and 2016. The results of Nassar et al. [47] are represented by dots and our results by bars.
Jmse 07 00151 g016
Table 1. Overview of the characteristics obtained for the African seaports in the Pan-African Seaports Database as well as the methods and time frames used in the analysis of these characteristics.
#CharacteristicParameters/ClassificationMethod/SourceTimeframe
1LST potential ( H s 2.5 sin ( 2 α ) ) H s : Wave climate ( H s , mean wave direction)ERA-Interim reanalysis data [38]1984–2018
α : Coastline orientationManually from GE image [30]2018
2Sediment sources & sinksPresence of rivers/inletsVisually from GE image [30]2018
3Sheltering settingOpen coastsVisually from GE image [30]2018
Headland-bay coasts
Natural barriers
4Coastal protectionDominated by Cross-shore (CS) structuresVisually from GE image [30]2018
Dominated by Longshore (LS) structures
None
5Breakwater lengthShore-normal distance between the landward and seaward breakwater tipsManually from GE image [30]2018
6Construction dateConstruction date of port structuresVisually from historical Landsat satellite images [22,30]1984–2018
Table 2. Top 10 ports in terms of gross historic (left) and present (right) areal change (rate).
Top 10 Historic EvolutionTotal Historic Areal Change (km2)Top 10 Present EvolutionPresent Areal Change Rate (km2/year)
Nouakchott, Mauritania5.9Nouakchott, Mauritania0.18
Cotonou, Benin4.3Cotonou, Benin0.11
Port Said, Egypt3.6Lagos, Nigeria *0.07
Damietta, Egypt3.1Lomé, Togo0.06
Lomé, Togo2.6Monrovia, Liberia0.06
Monrovia, Liberia1.5Port Said, Egypt0.06
Laayoune, Morocco1.3Idku, Egypt0.05
Richards Bay, South Africa1.2Ambriz, Angola0.04
Lagos, Nigeria *1.2Damietta, Egypt0.04
Buchanan port, Liberia1.1Alexandria, Egypt0.03
* The evolution rates around Lagos exclude the land reclamation for Eko Atlantic [40].
Table 3. Overview of the results for all 130 ports, the top 10% and the top 1% in terms of total gross beach area changes. For all these categories the total and mean gross beach area changes are provided as well as the mean cross-shore changes and the accretion-erosion ratios.
Ports (#)Total Gross Beach Area (km2)Mean Gross Beach Area (km2)Mean Cross-Shore Change per m (m)Ratio Accretion/Erosion (-)
All (130)44.20.34231.13
Top 10% (13)28.52.267.51.01
Top 1% (1)5.95.91780.69
Table 4. Mapping of the 130 African seaports over the categories of each characteristic (in % of occurrence), their share in the gross beach areal change (%), the mean ( μ ) beach areal change (km2), and the percentage of ports with net accretion and net erosion.
CharacteristicsNumber of Ports (%)Gross Beach Areal ChangeShare of Ports with Net Accretion (%)Share of Ports with Net Erosion (%)
∑ (%) μ (km2)
Wave power—LST potential
<0.55 (m2.5)5%10%0.0960%40%
≥0.55 (m2.5)65%90%0.4866%34%
Sheltering setting
Open coast56%88%0.5460%40%
Headland-Bay30%9%0.1079%21%
Behind natural barriers14%3%0.0744%56%
Sources & sinks
Yes37%58%0.5352%48%
No63%42%0.2371%29%
Protection structures
No structure68%40%0.2057%43%
Longshore structures11%5%0.1686%14%
Cross-shore structures21%55%0.8675%25%
Construction date
After 198429%25%0.2950%50%
Before 198471%75%0.3670%30%
Breakwater length
<400 (m)28%7%0.0851%49%
≥400 (m)72%93%0.4469%31%
Table 5. Characteristics of hotspot ports in terms of coastline evolution.
Name H s 2.5 sin ( 2 α ) ( m 2.5 ) Sheltering SettingNearby Rivers/InletsCoastal Protection StructuresConstruction DateBreakwater Length (m)
Nouakchott≥0.55Open coastNoCross-shoreAfter 1984≥400
Cotonou≥0.55Open coastYesCross-shoreBefore 1984≥400
Port Said≥0.55Open coastYesCross-shoreBefore 1984≥400
Damietta≥0.55Open coastYesCross-shoreBefore 1984≥400
Lomé≥0.55Open coastNoNoBefore 1984≥400
Monrovia≥0.55Open coastYesNoBefore 1984≥400
Laayoune≥0.55Open coastNoNoBefore 1984≥400
Richards Bay≥0.55Open coastYesNoBefore 1984≥400
Lagos≥0.55Open coastYesCross-shoreBefore 1984≥400
Buchanan≥0.55Open coastYesNoBefore 1984≥400
Alexandria≥0.55Open coastNoCross-shoreBefore 1984≥400
El-Arish≥0.55Open coastNoCross-shoreAfter 1984≥400
Abidjan≥0.55Open coastYesNoBefore 1984≥400
Table 6. The probability of occurrence of coastline evolution drivers for the hotspots compared to all other ports in the Pan-African Seaports Database.
Ports H s 2.5 sin ( 2 α ) 0.55 ( m 2.5 ) Open CoastNearby Rivers/InletsCross-Shore StructuresBefore 1984Breakwater Length ≥ 400 m
Hotspots100%100%62%54%85%100%
All ports65%56%63%68%71%62%
Table 7. Overview of available literature on the coastline evolution around ports with the considered time frame, number of analysed images, source of imagery, detection method, spatial analysis method, and fitting method.
PortLiteratureTime Frame 1# Images in Literature (Our Study) 1Source of ImageryDetection MethodFitting Method 3
NouakchottWu [9] 21989~20014 (38)SPOTImage processingEPR
Elmoustapha et al. [44]1987~20024 (60)SPOTVisualEPR
CotonouAlmar et al. [20]1985~20146 (56)LandsatVisualEPR
SaidEl Asmar [45]1984~19913 (116)LandsatHybridEPR
DamiettaAly et al. [18] 21993~20002 (225)ERSRadar processingEPR
LoméKassi et al. [21] 21986~20175 (125)LandsatImage processingLRR
LagosAkinluyi et al. [46]1984~20165 (78)LandsatVisualLRR
El-ArishNassar et al. [47] 21989~201610 (695)LandsatImage processingLRR
AbidjanWognin et al. [48]1989~20082 (59)MultiVisualUnclear
Toure et al. [49]2003~20092 (24)MultiVisualEPR
1 The actual timeframe and number of images in literature may exceed the numbers provided in the table, as we only selected the number images within the timeframe of available Landsat imagery (i.e., 1984–2018). 2 Studies selected to verify the detected coastline evolution in this study. 3 EPR stands for End Point Rate, which bases the coastline change rates only on the begin and end coastline position in time (i.e., disregarding coastline positions in the time frame in between); LRR stands for linear regression rate, which bases the coastline change rates on the best linear fit through all shoreline positions in the timeframe.
Table 8. Overview of the differences in coastline change rates (m/year) between literature and our study for the ports of Damietta (Egypt), Lomé (Togo) and El-Arish (Egypt). The differences are expressed in the mean (µ) and standard deviation (σ) of the coastline change rates over all transects as well as the estimated (mean) difference in coastline position over the study time frame.
PortLiteratureTime Frame (year)Difference Coastline Change Rate (m/year)Estimated Positional Difference for Study Timeframe (m)
μΣ
DamiettaAly et al. [18]72.42.916.7
LomeKassi et al. [21]321.20.838.1
El-ArishNassar et al. [47]321.00.732.0

