Experiment and Analysis of Submarine Landslide Model Caused by Elevated Pore Pressure


Abstract
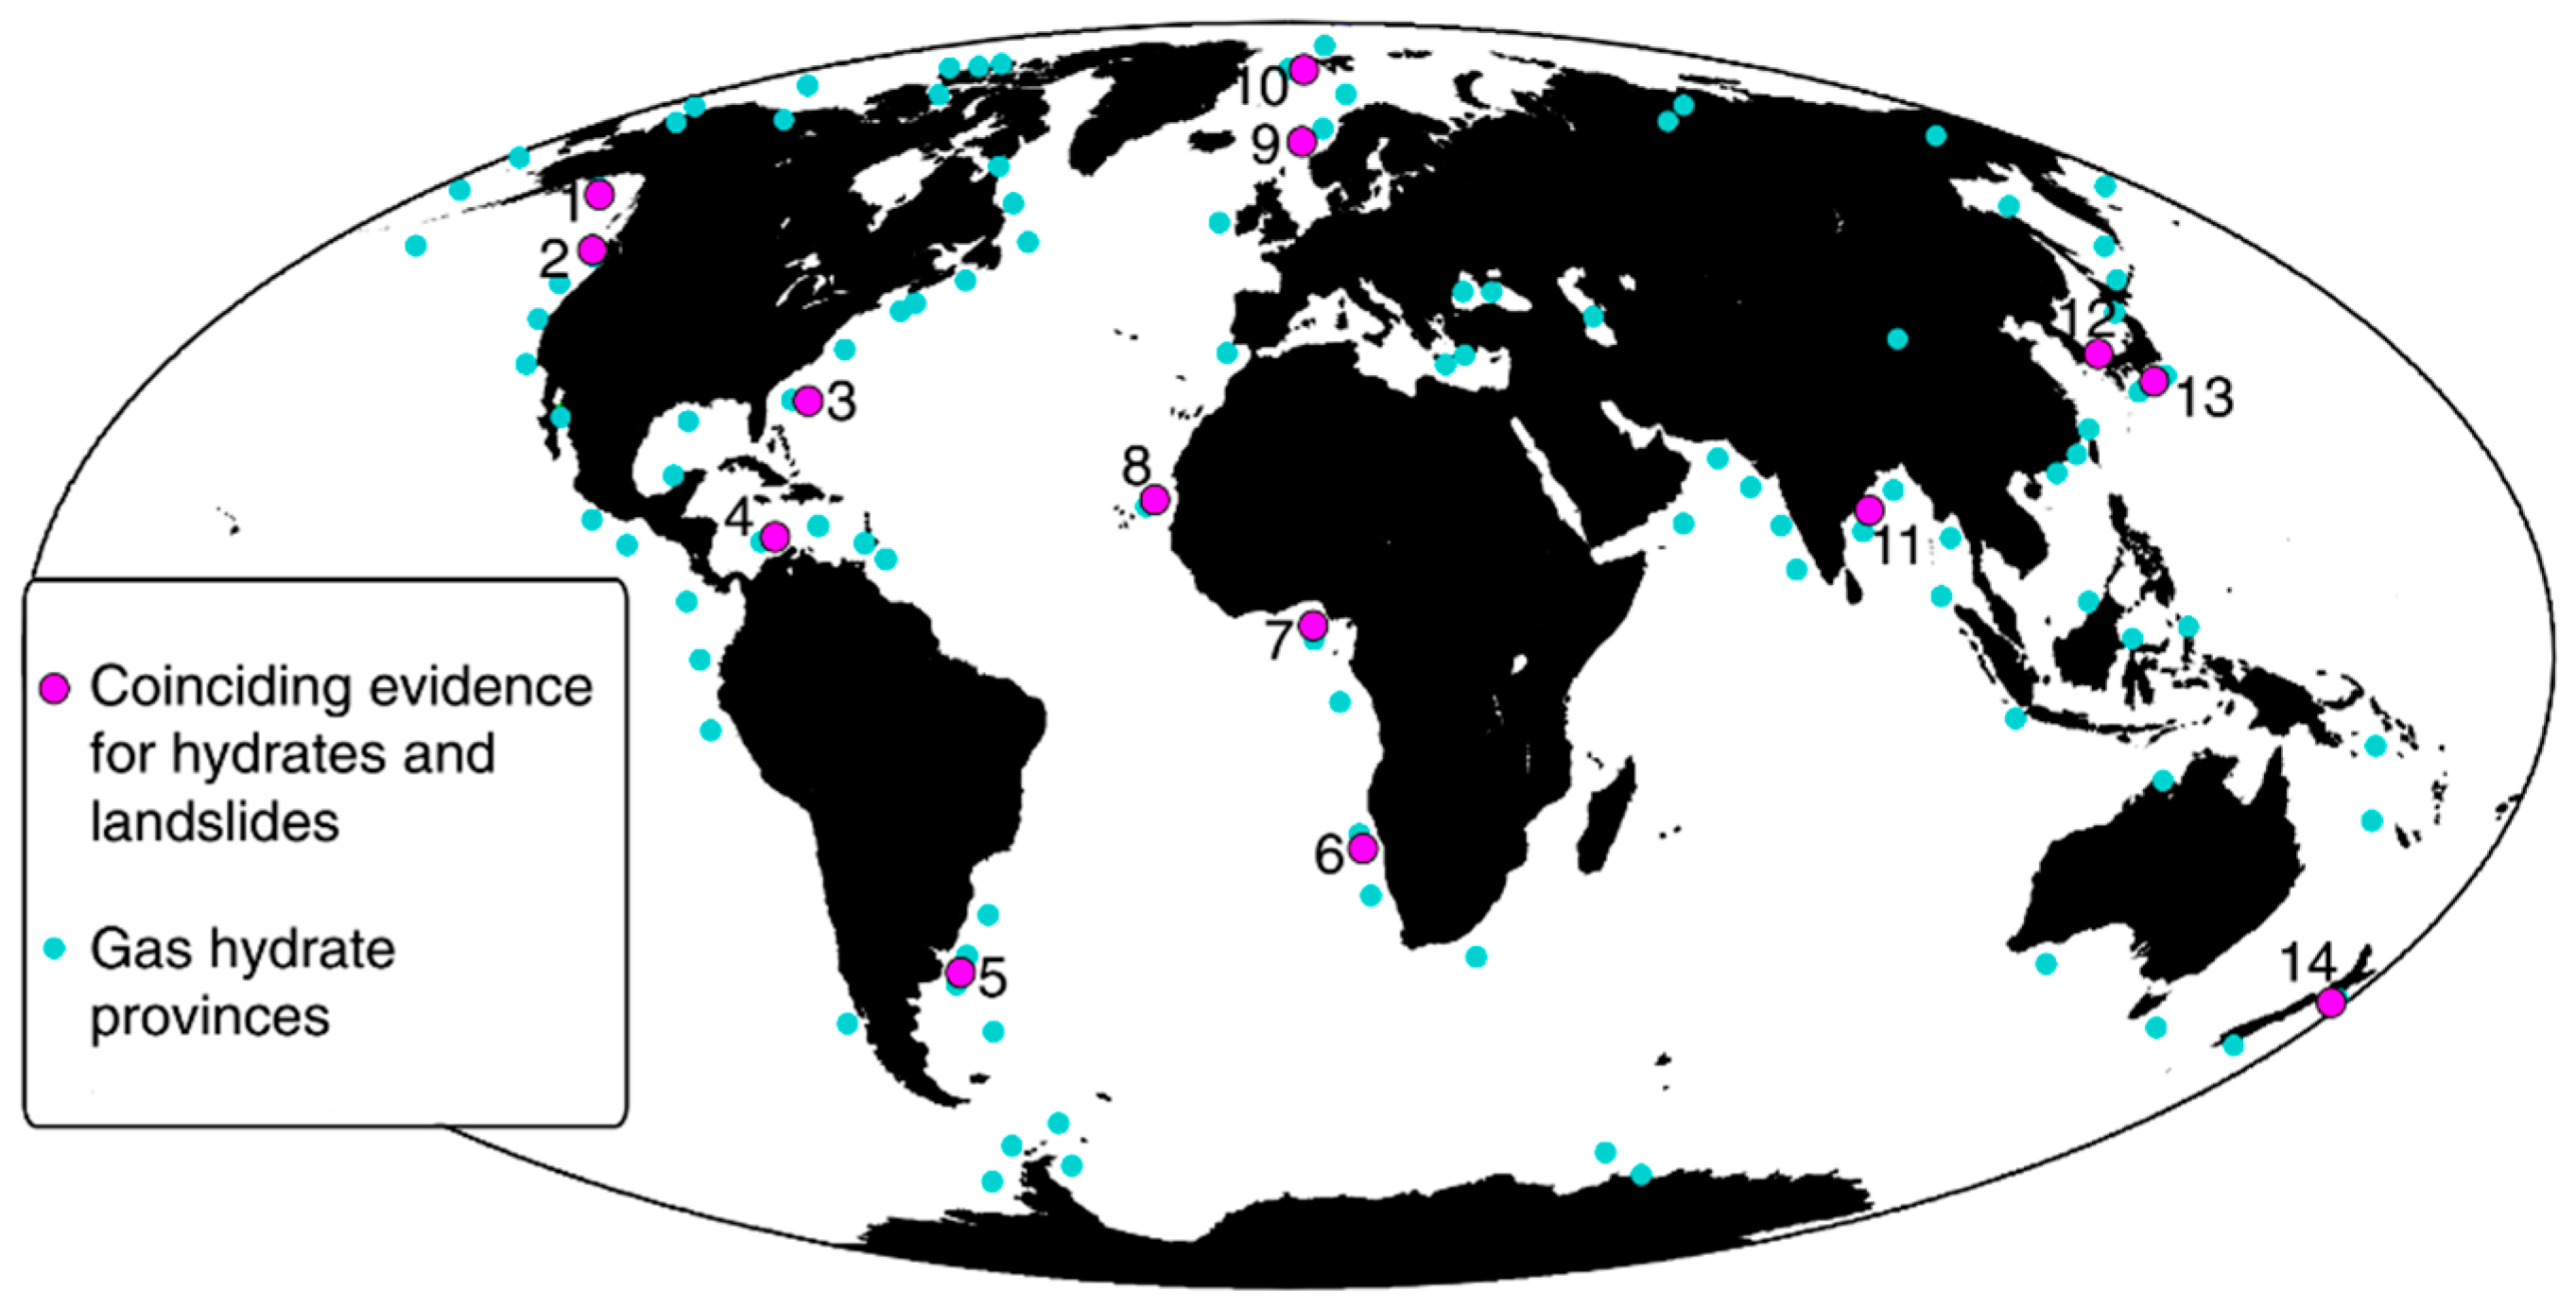
1. Introduction
2. Experimental Models
2.1. Experimental Introduction
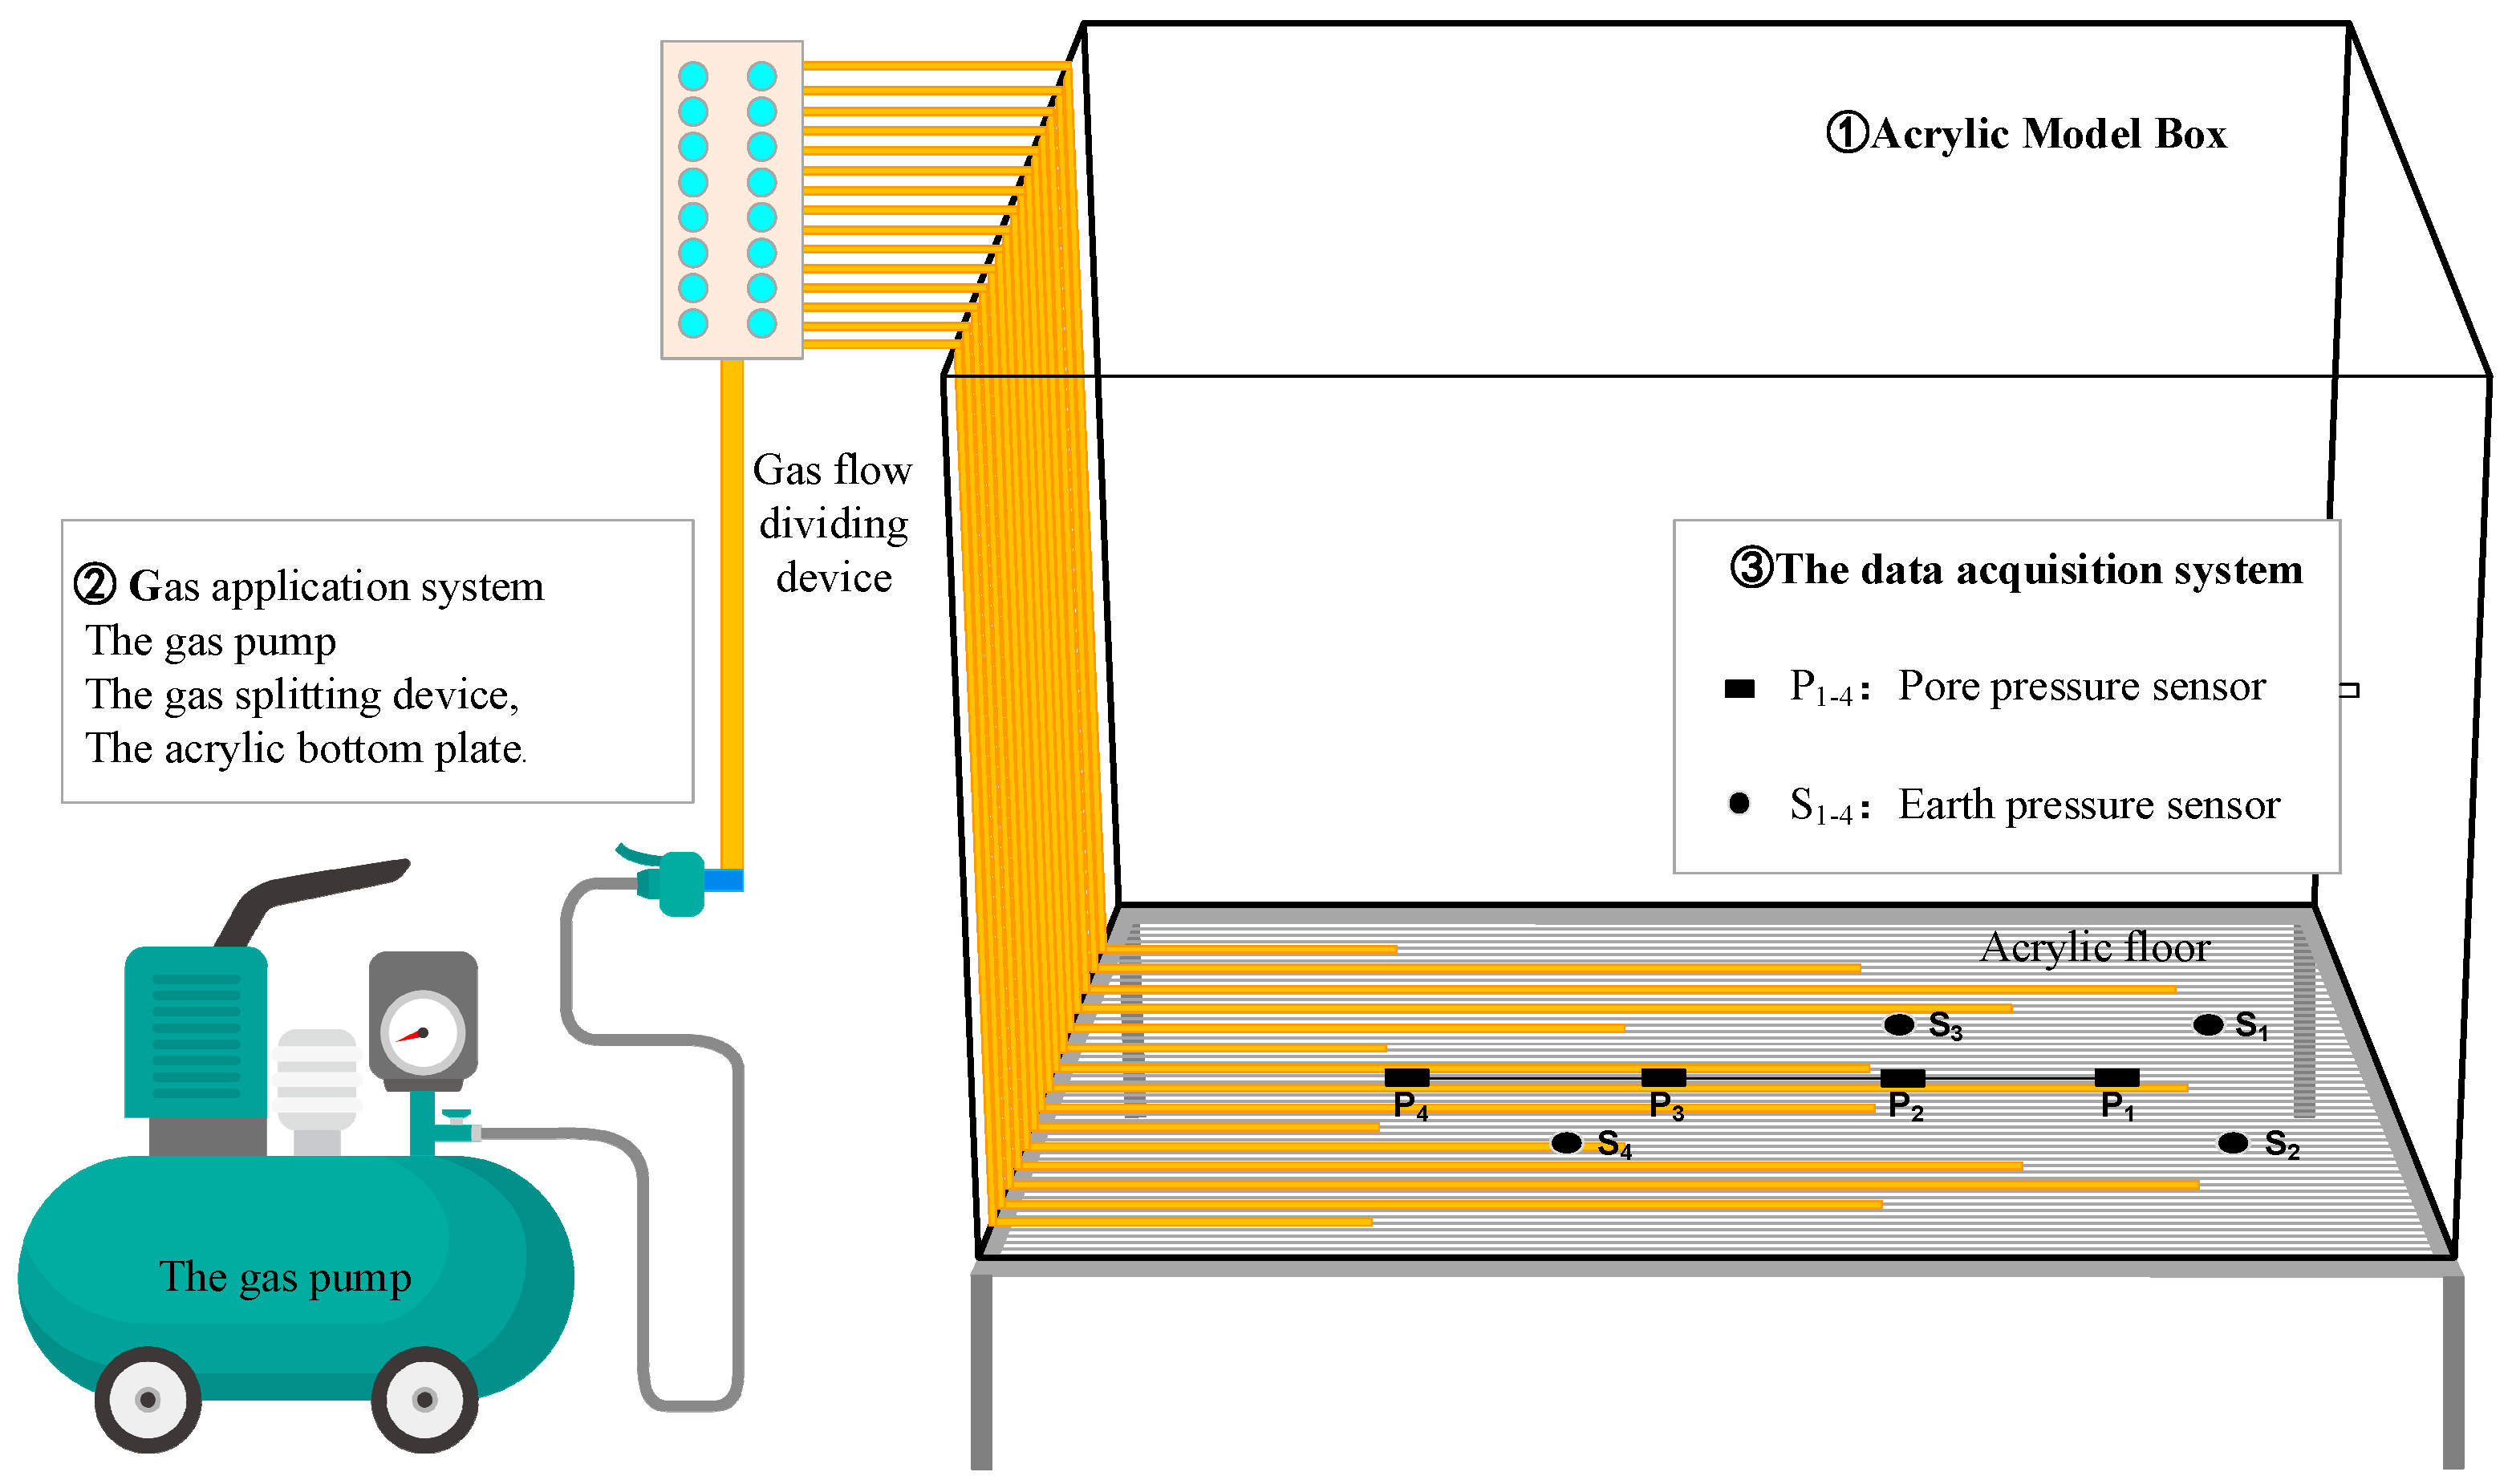
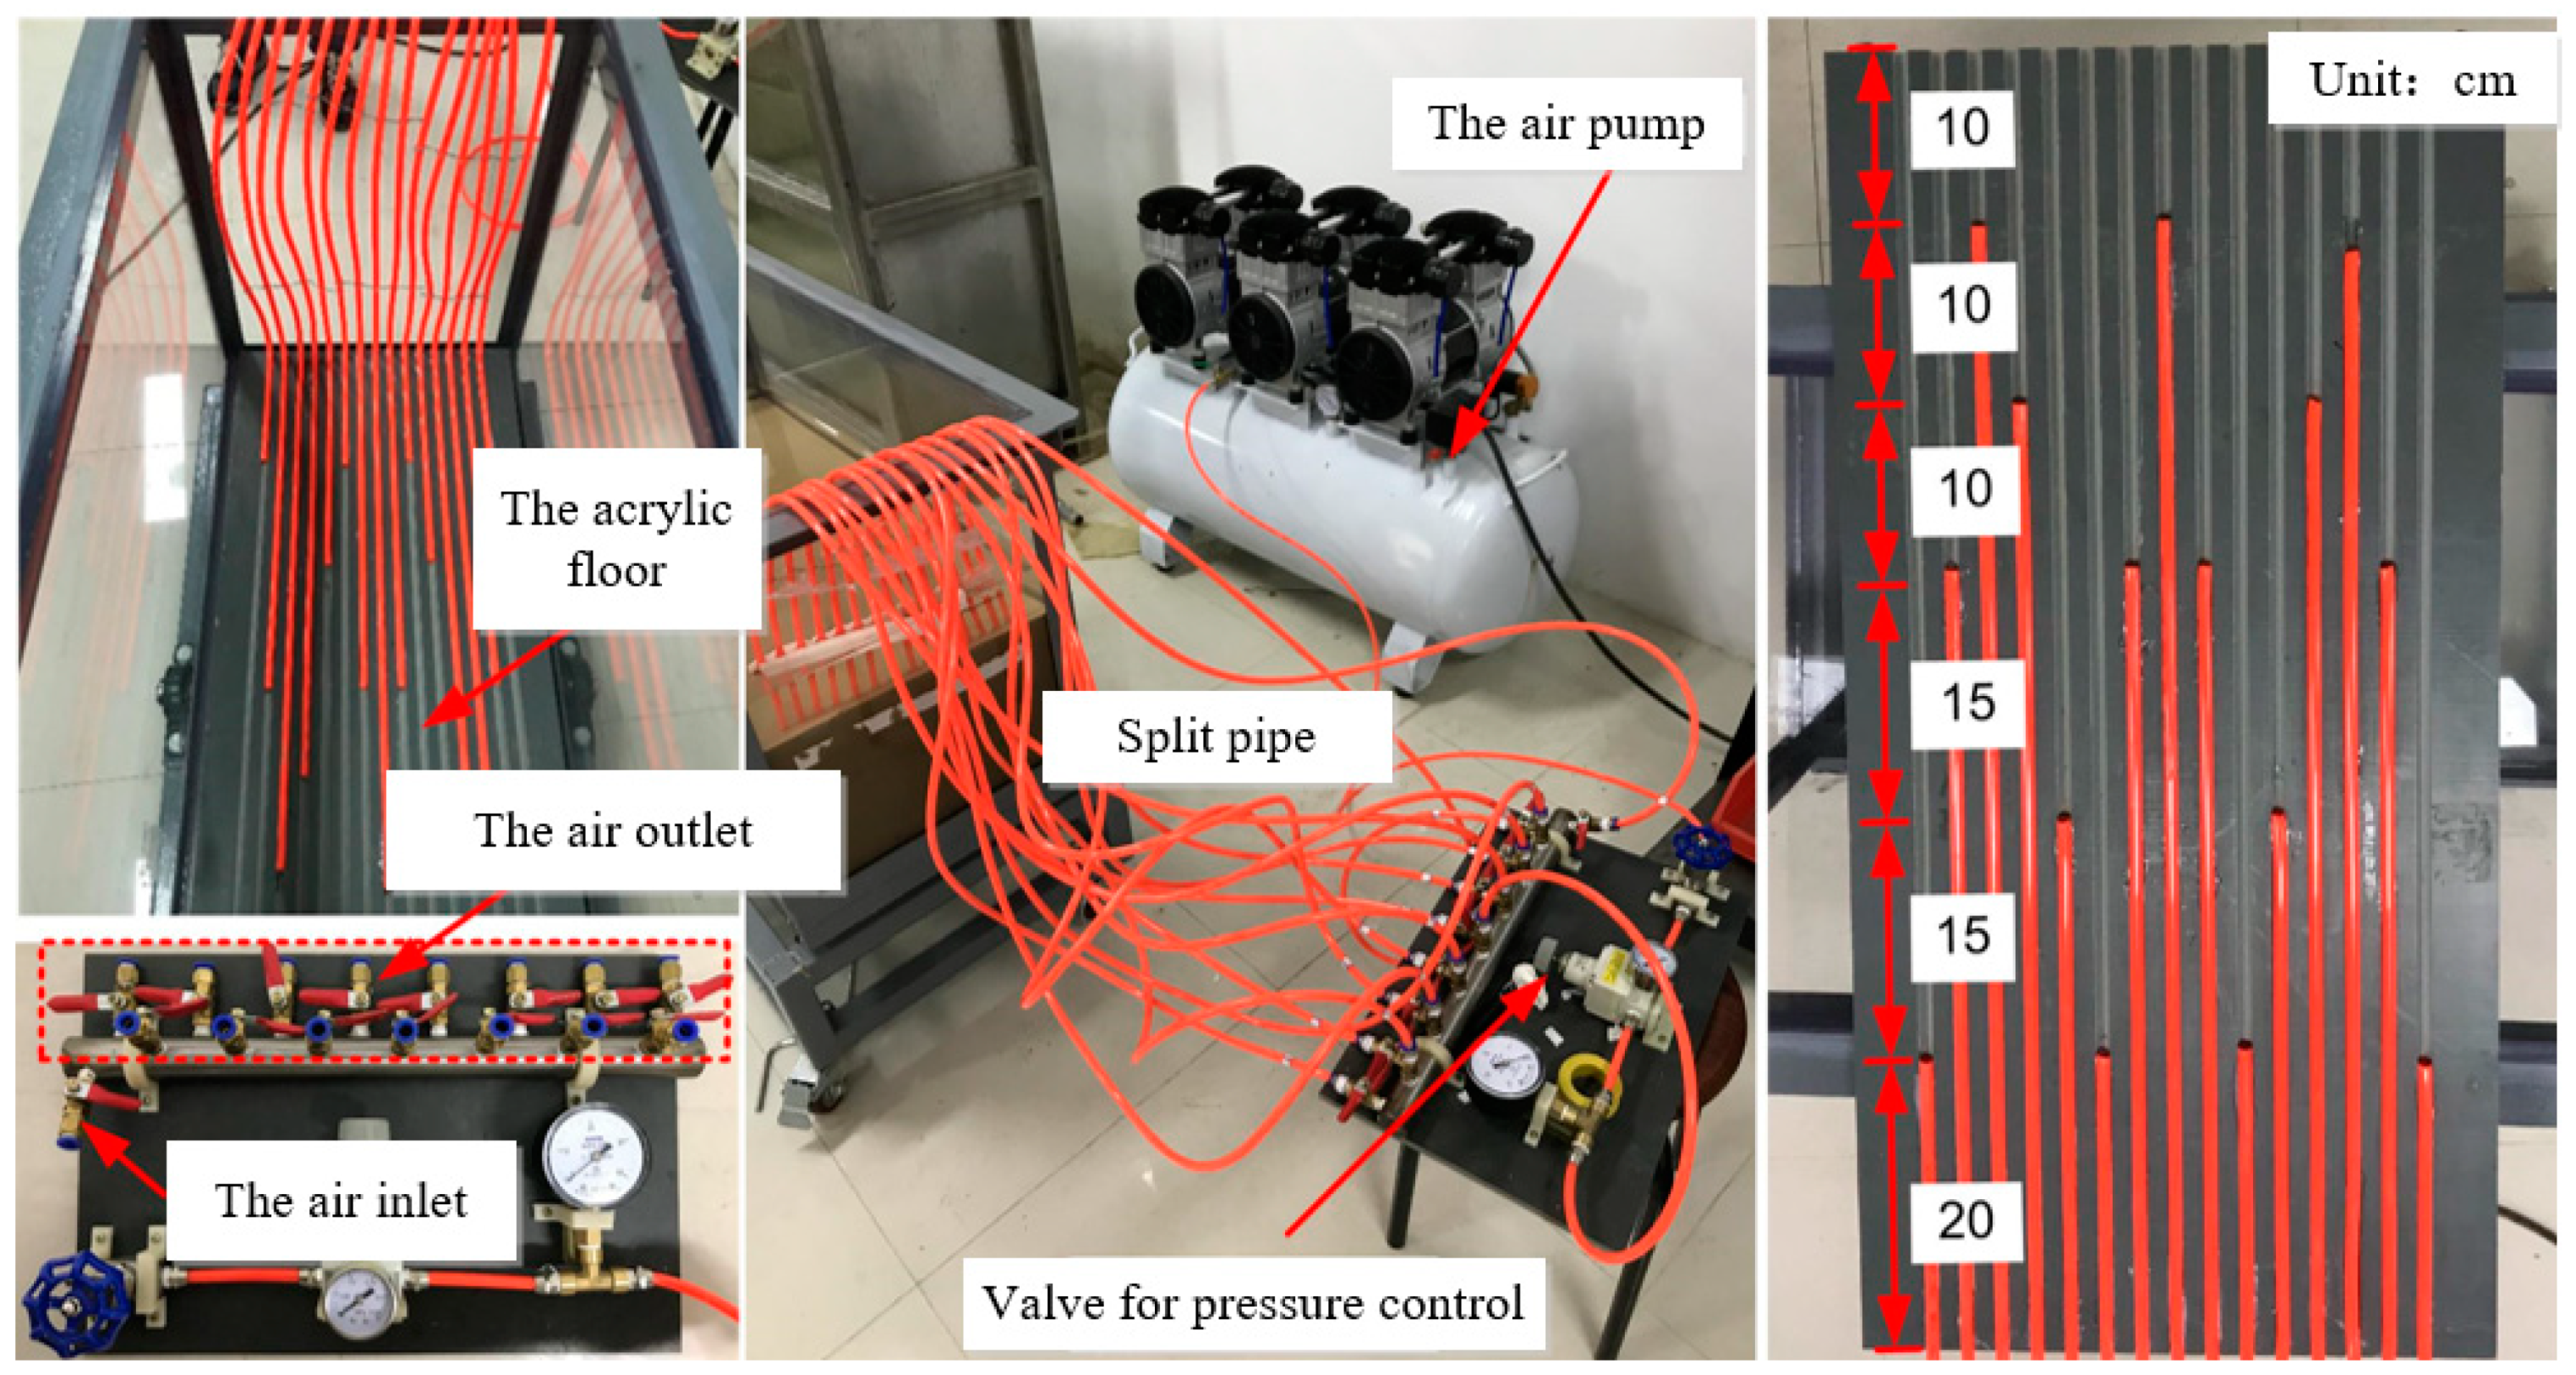
2.2. Experimental Device Design
2.2.1. Acrylic Model Box
2.2.2. Gas application System
2.2.3. Data Acquisition System
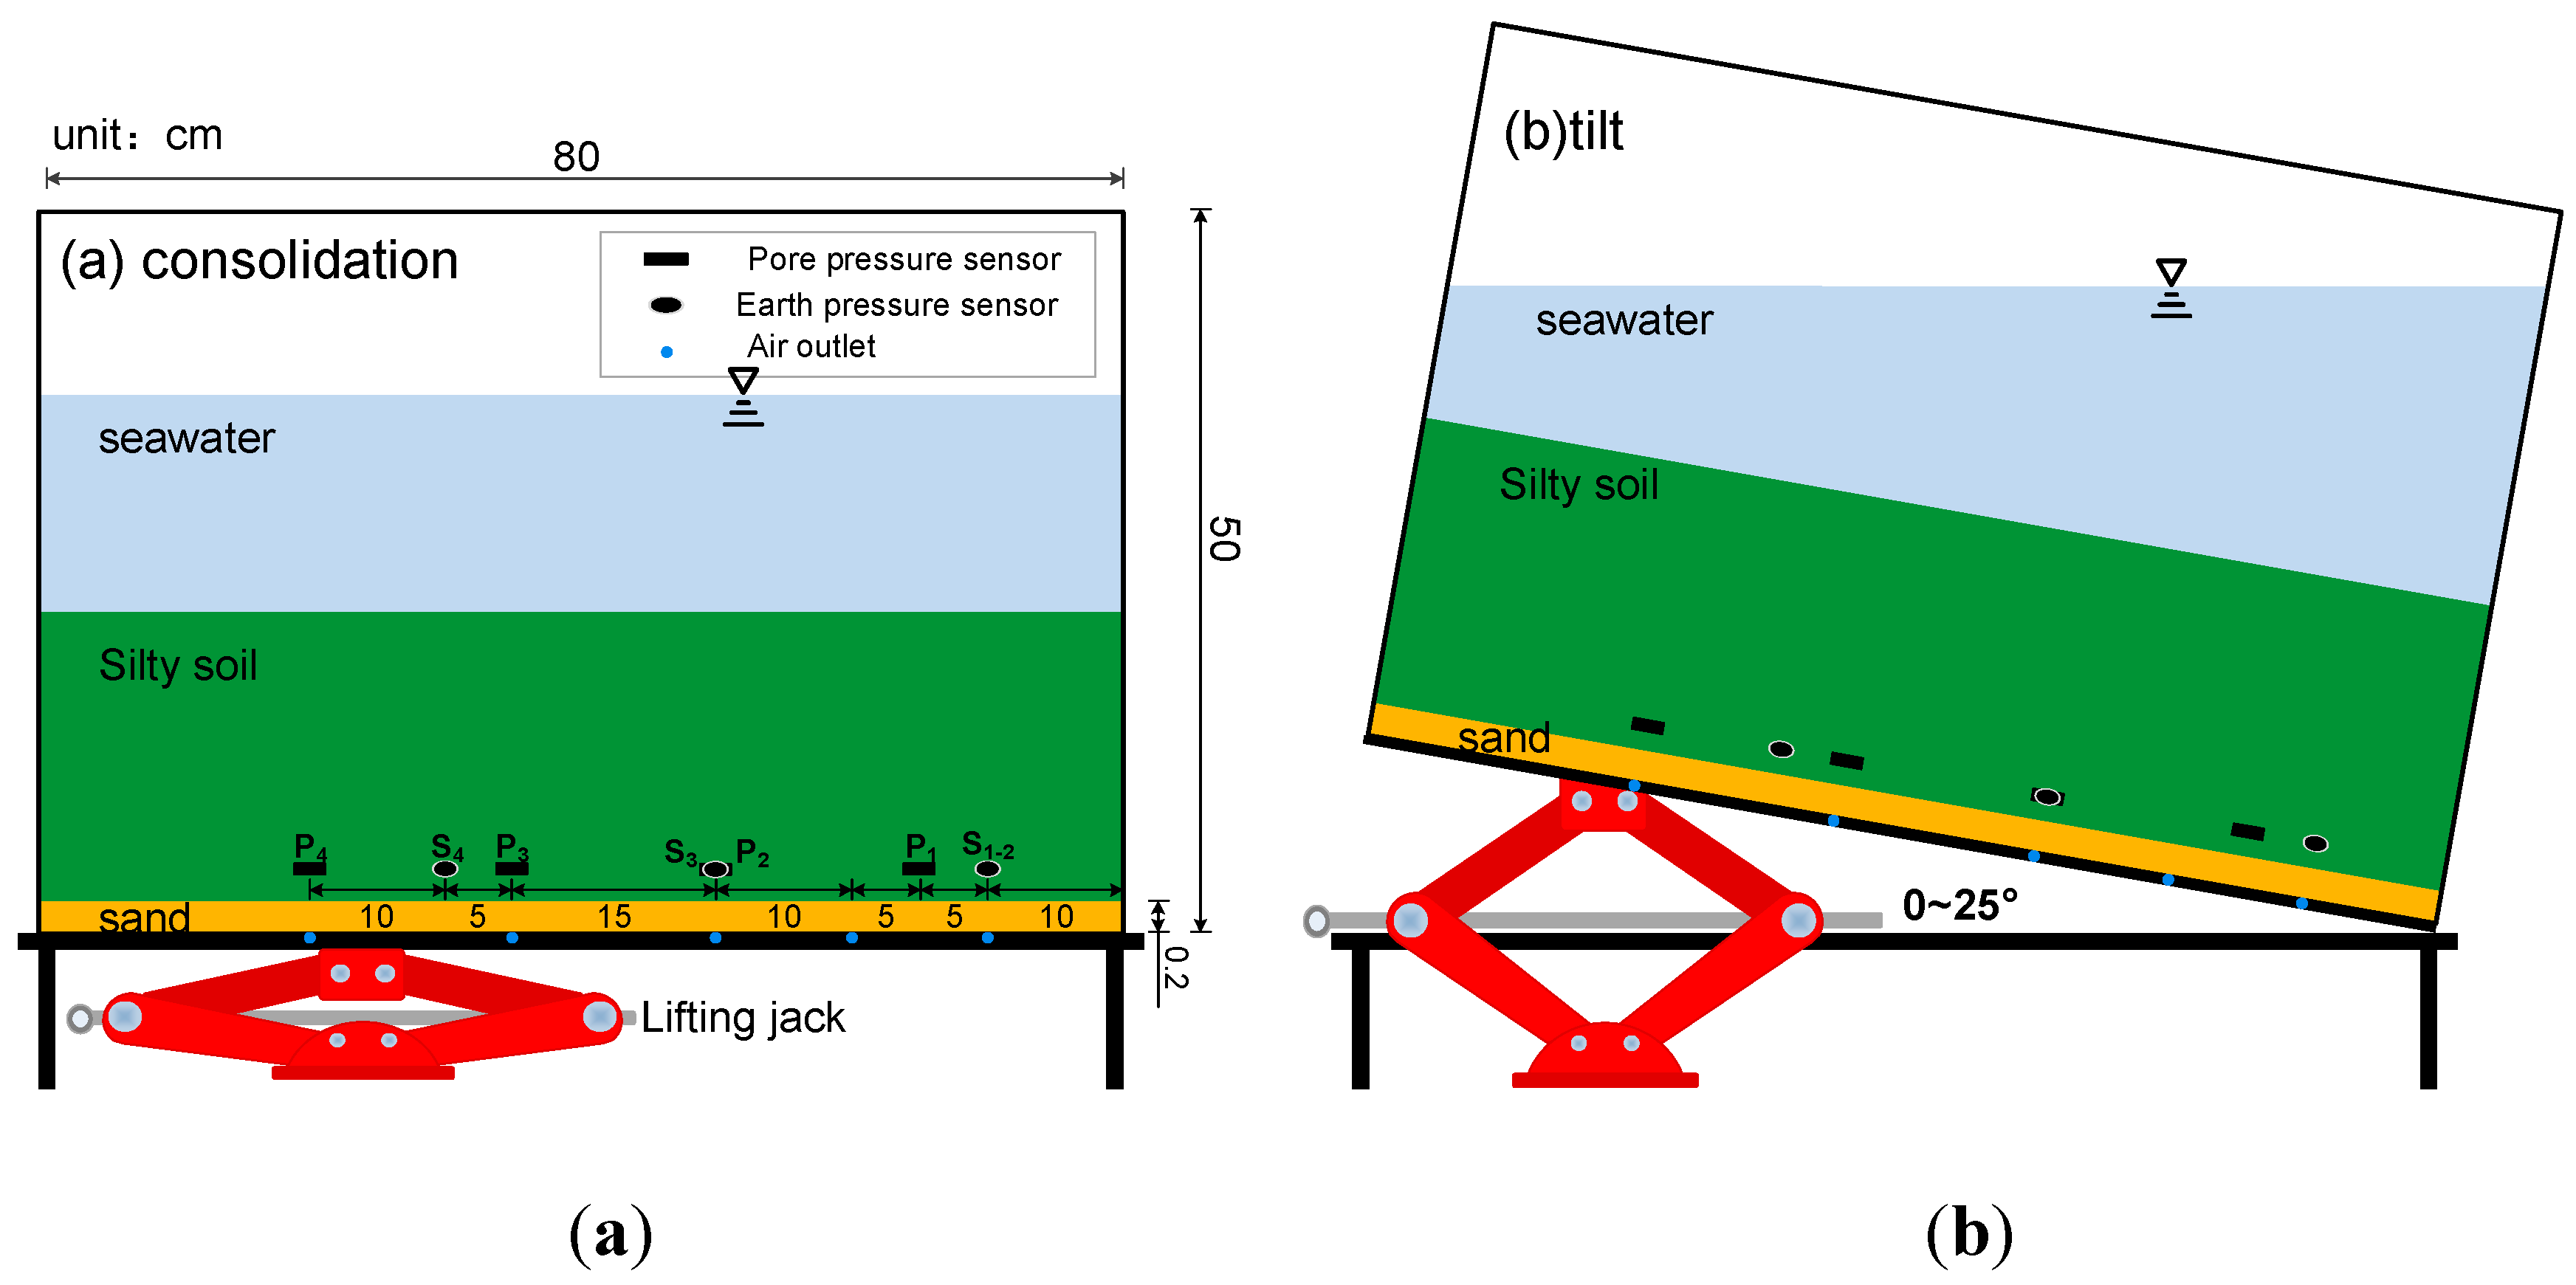
2.3. Description of Model Tests
2.3.1. Experimental Materials
2.3.2. Experimental Procedure
Setting up the Experimental Device
Setting up the Sensors
Preparation of SEABED
Data Acquisition
3. Experimental Results and Phenomena
3.1. Collapse Deformation
3.2. Shear-Slip Failure
4. Discussion of Experimental Phenomena
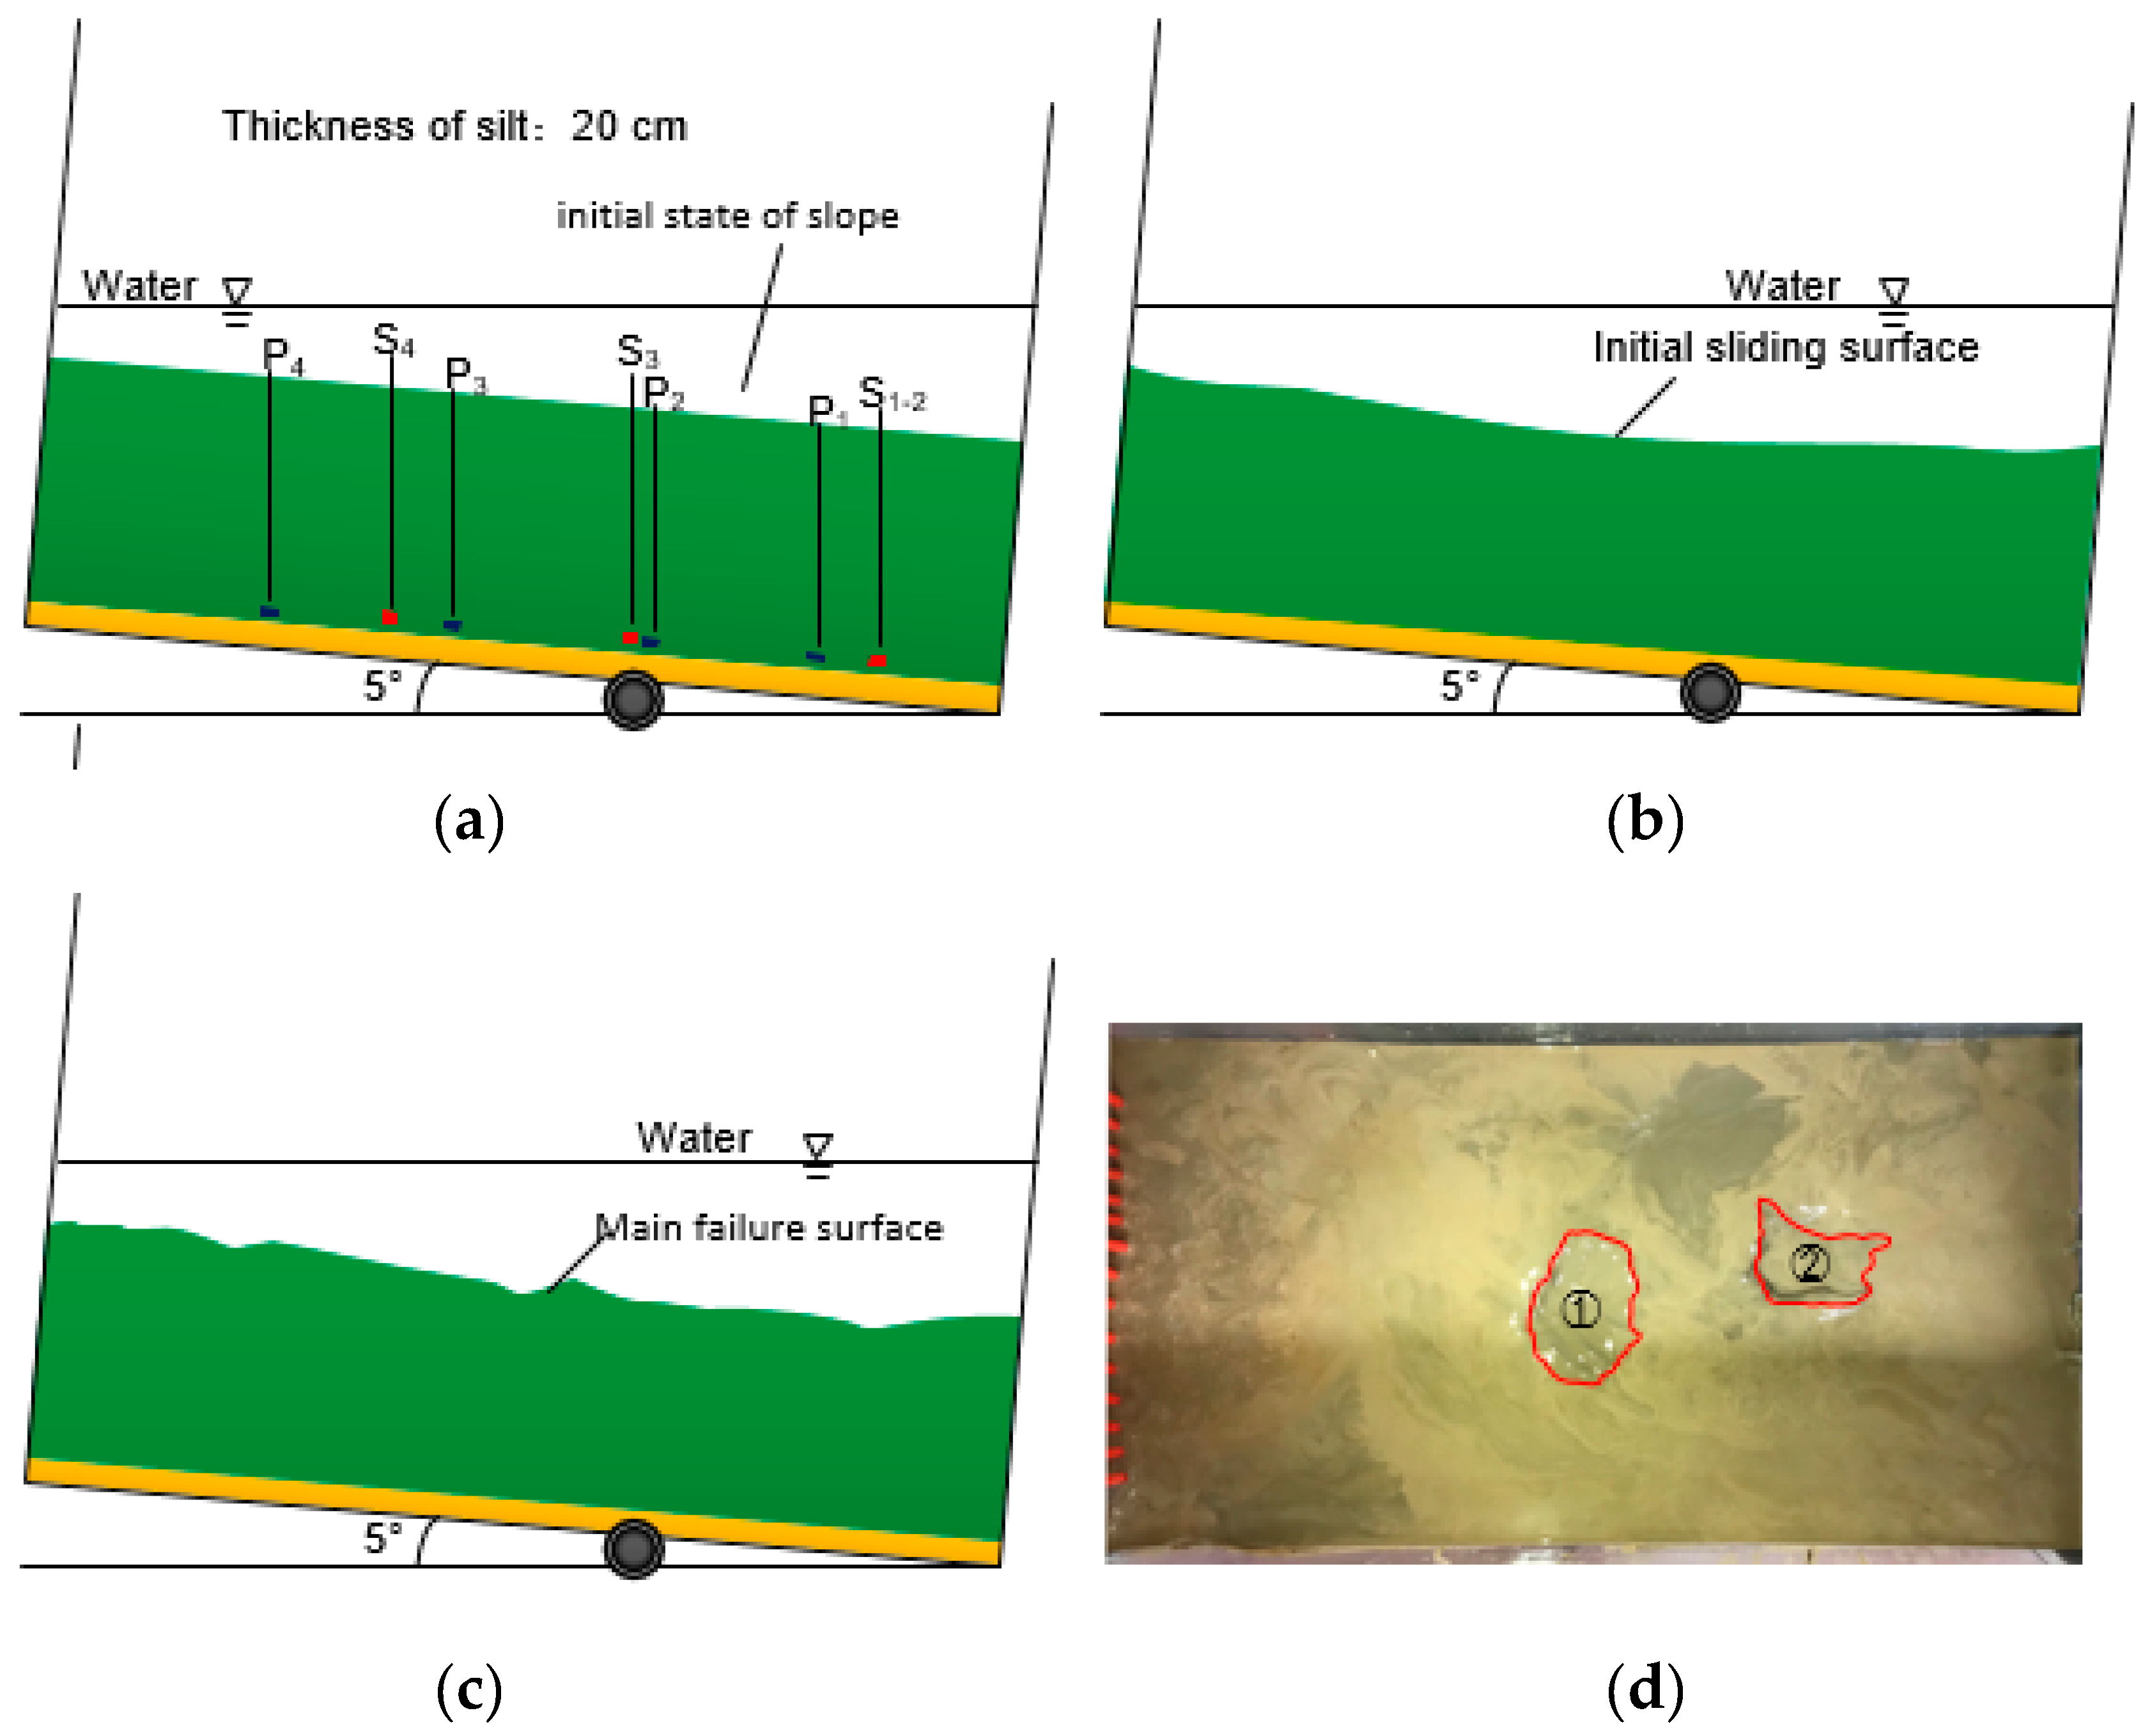
4.1. Collapse Deformation
4.1.1. 20-5 Model
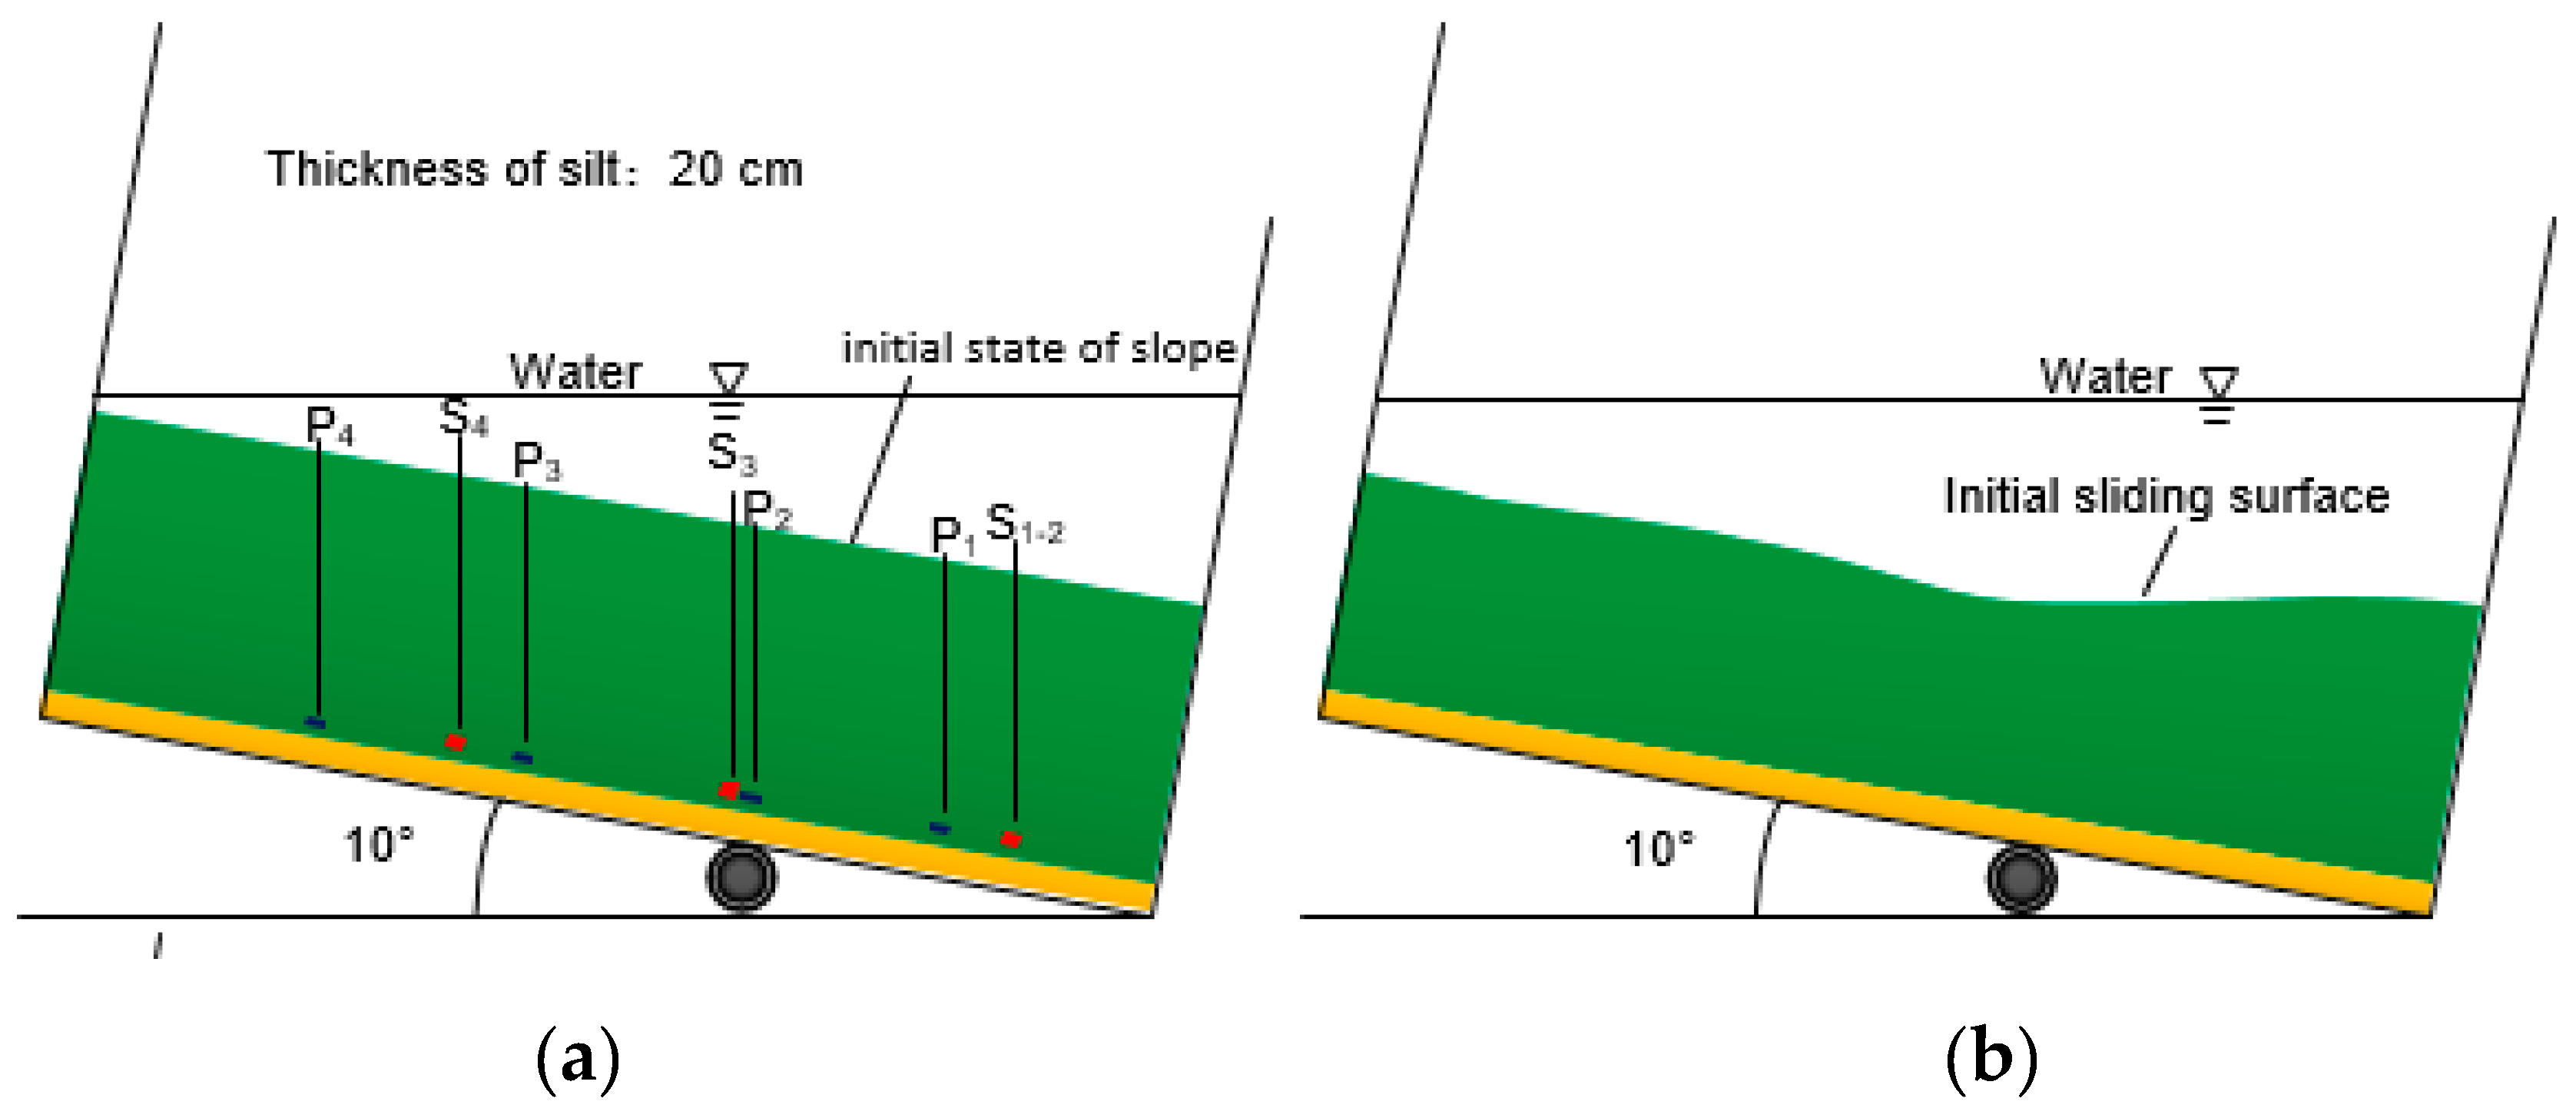
4.1.2. 13-5 Model
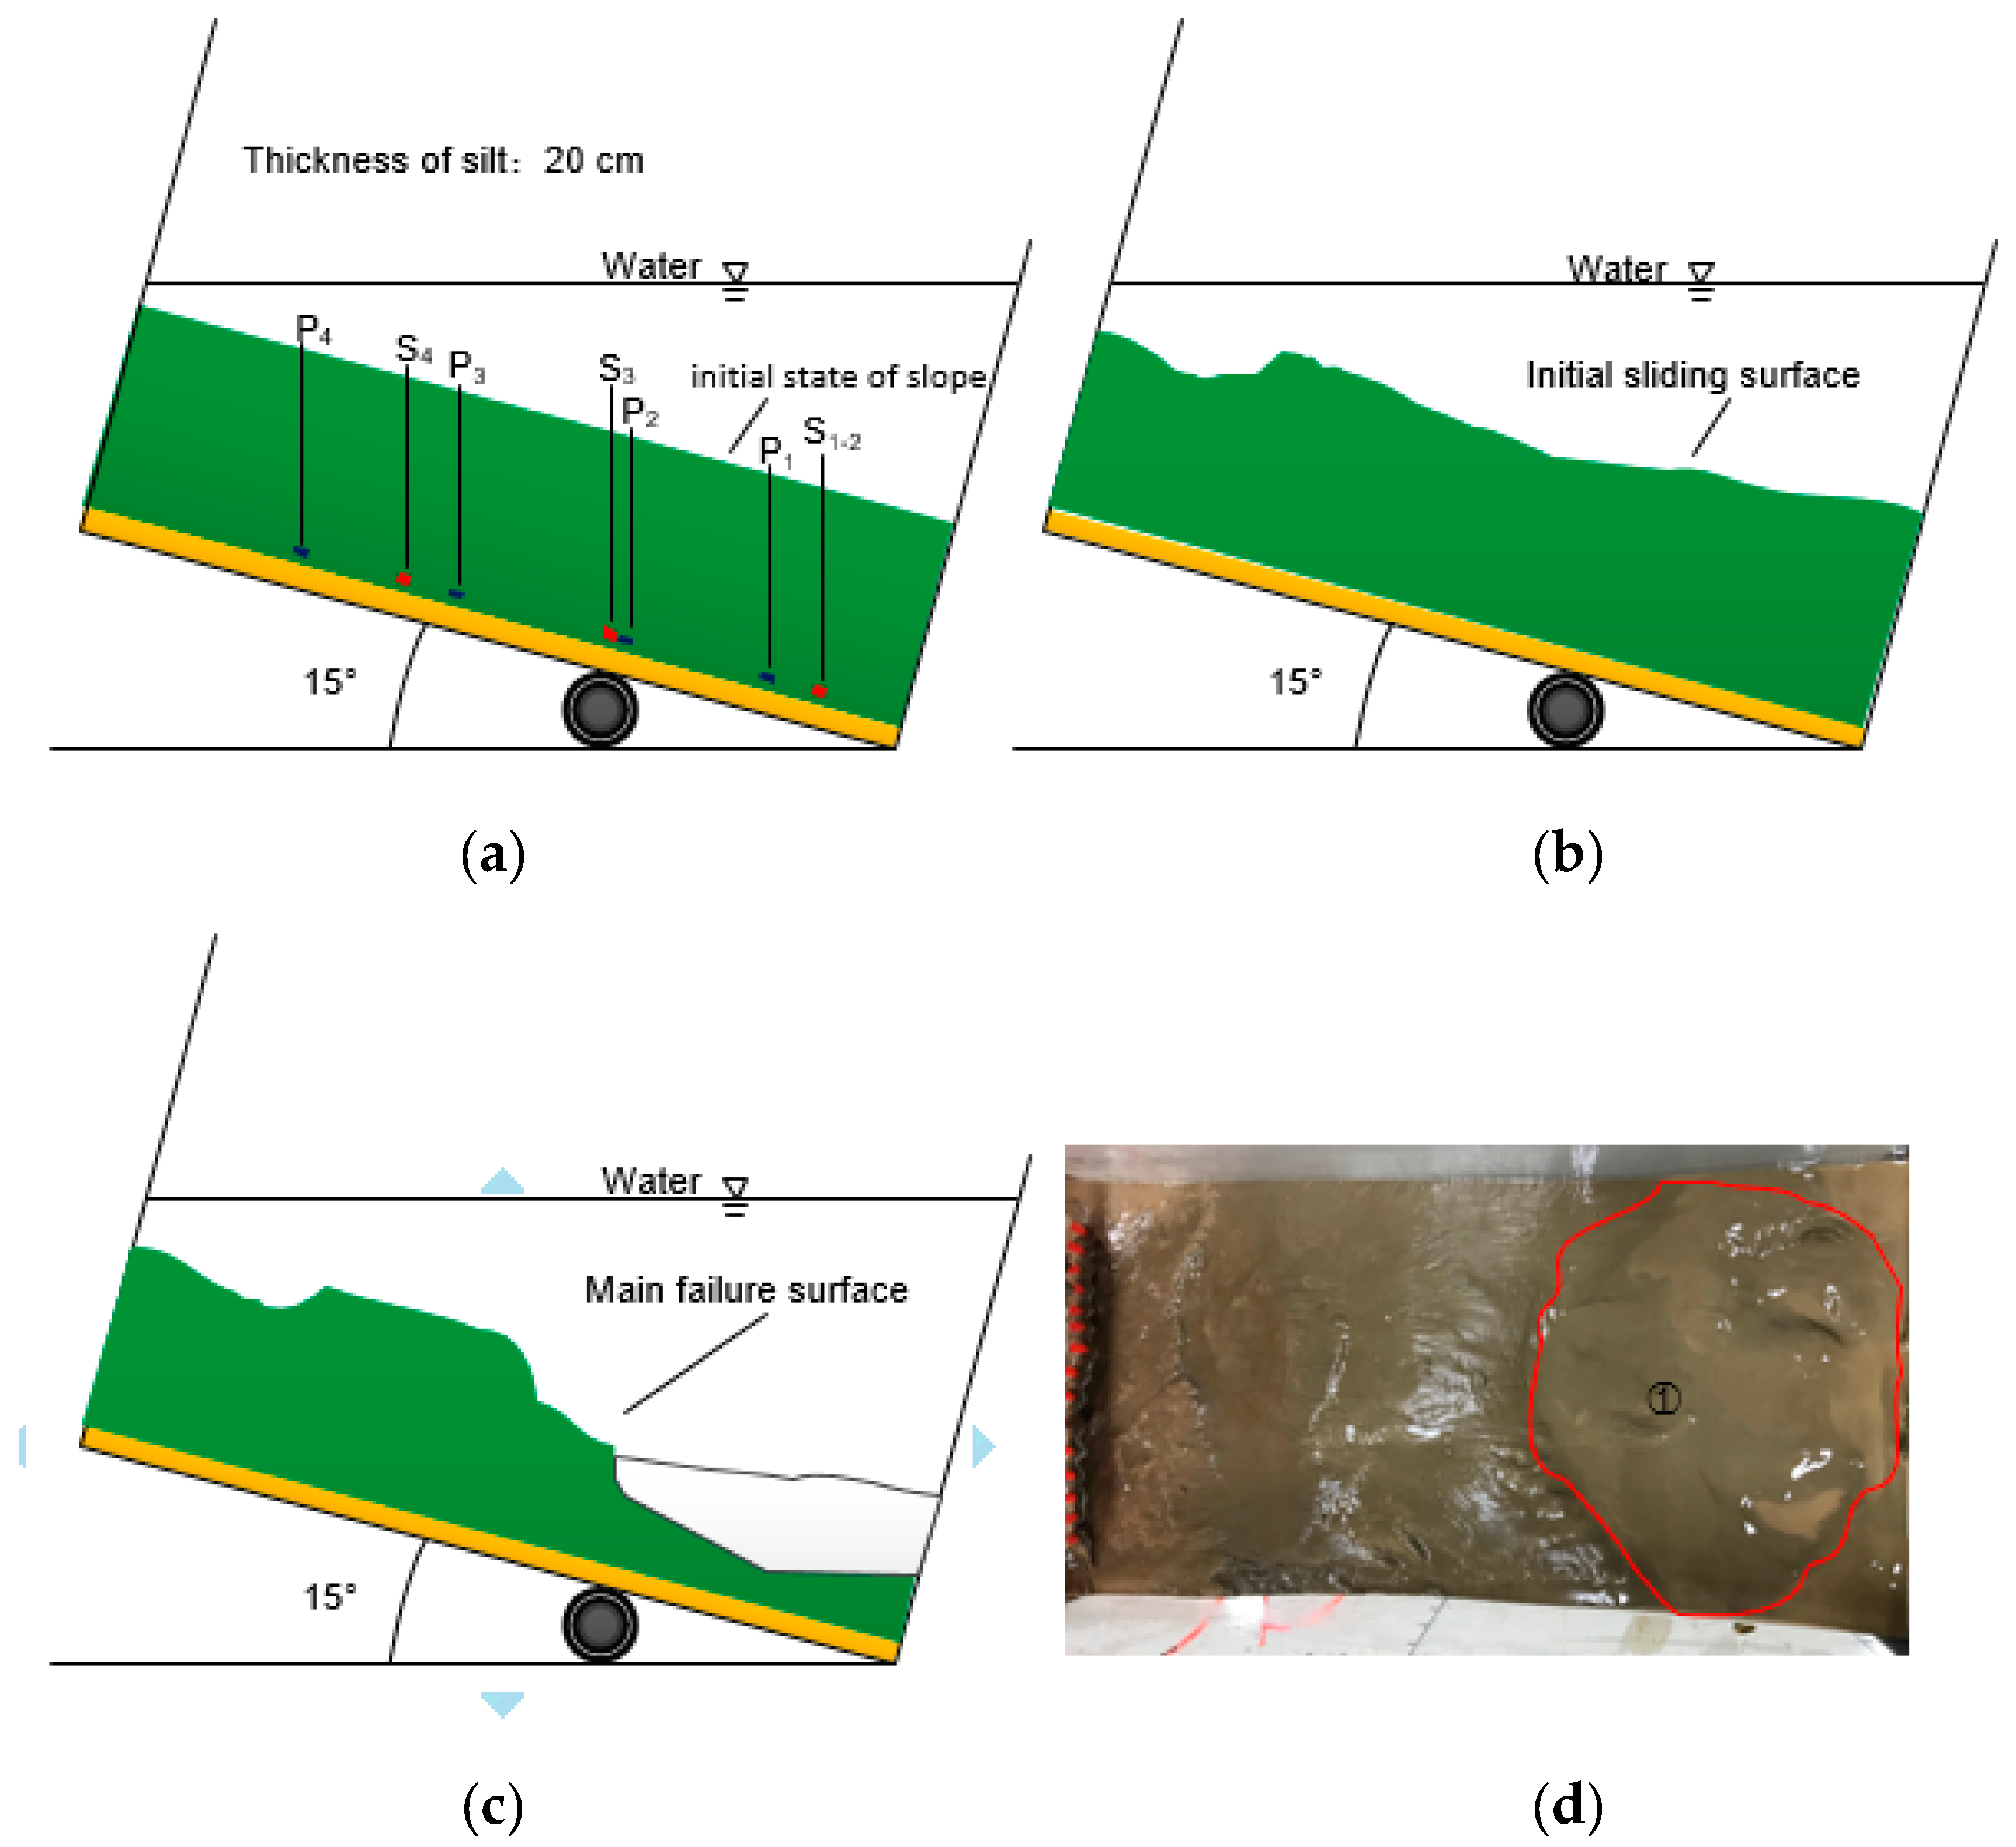
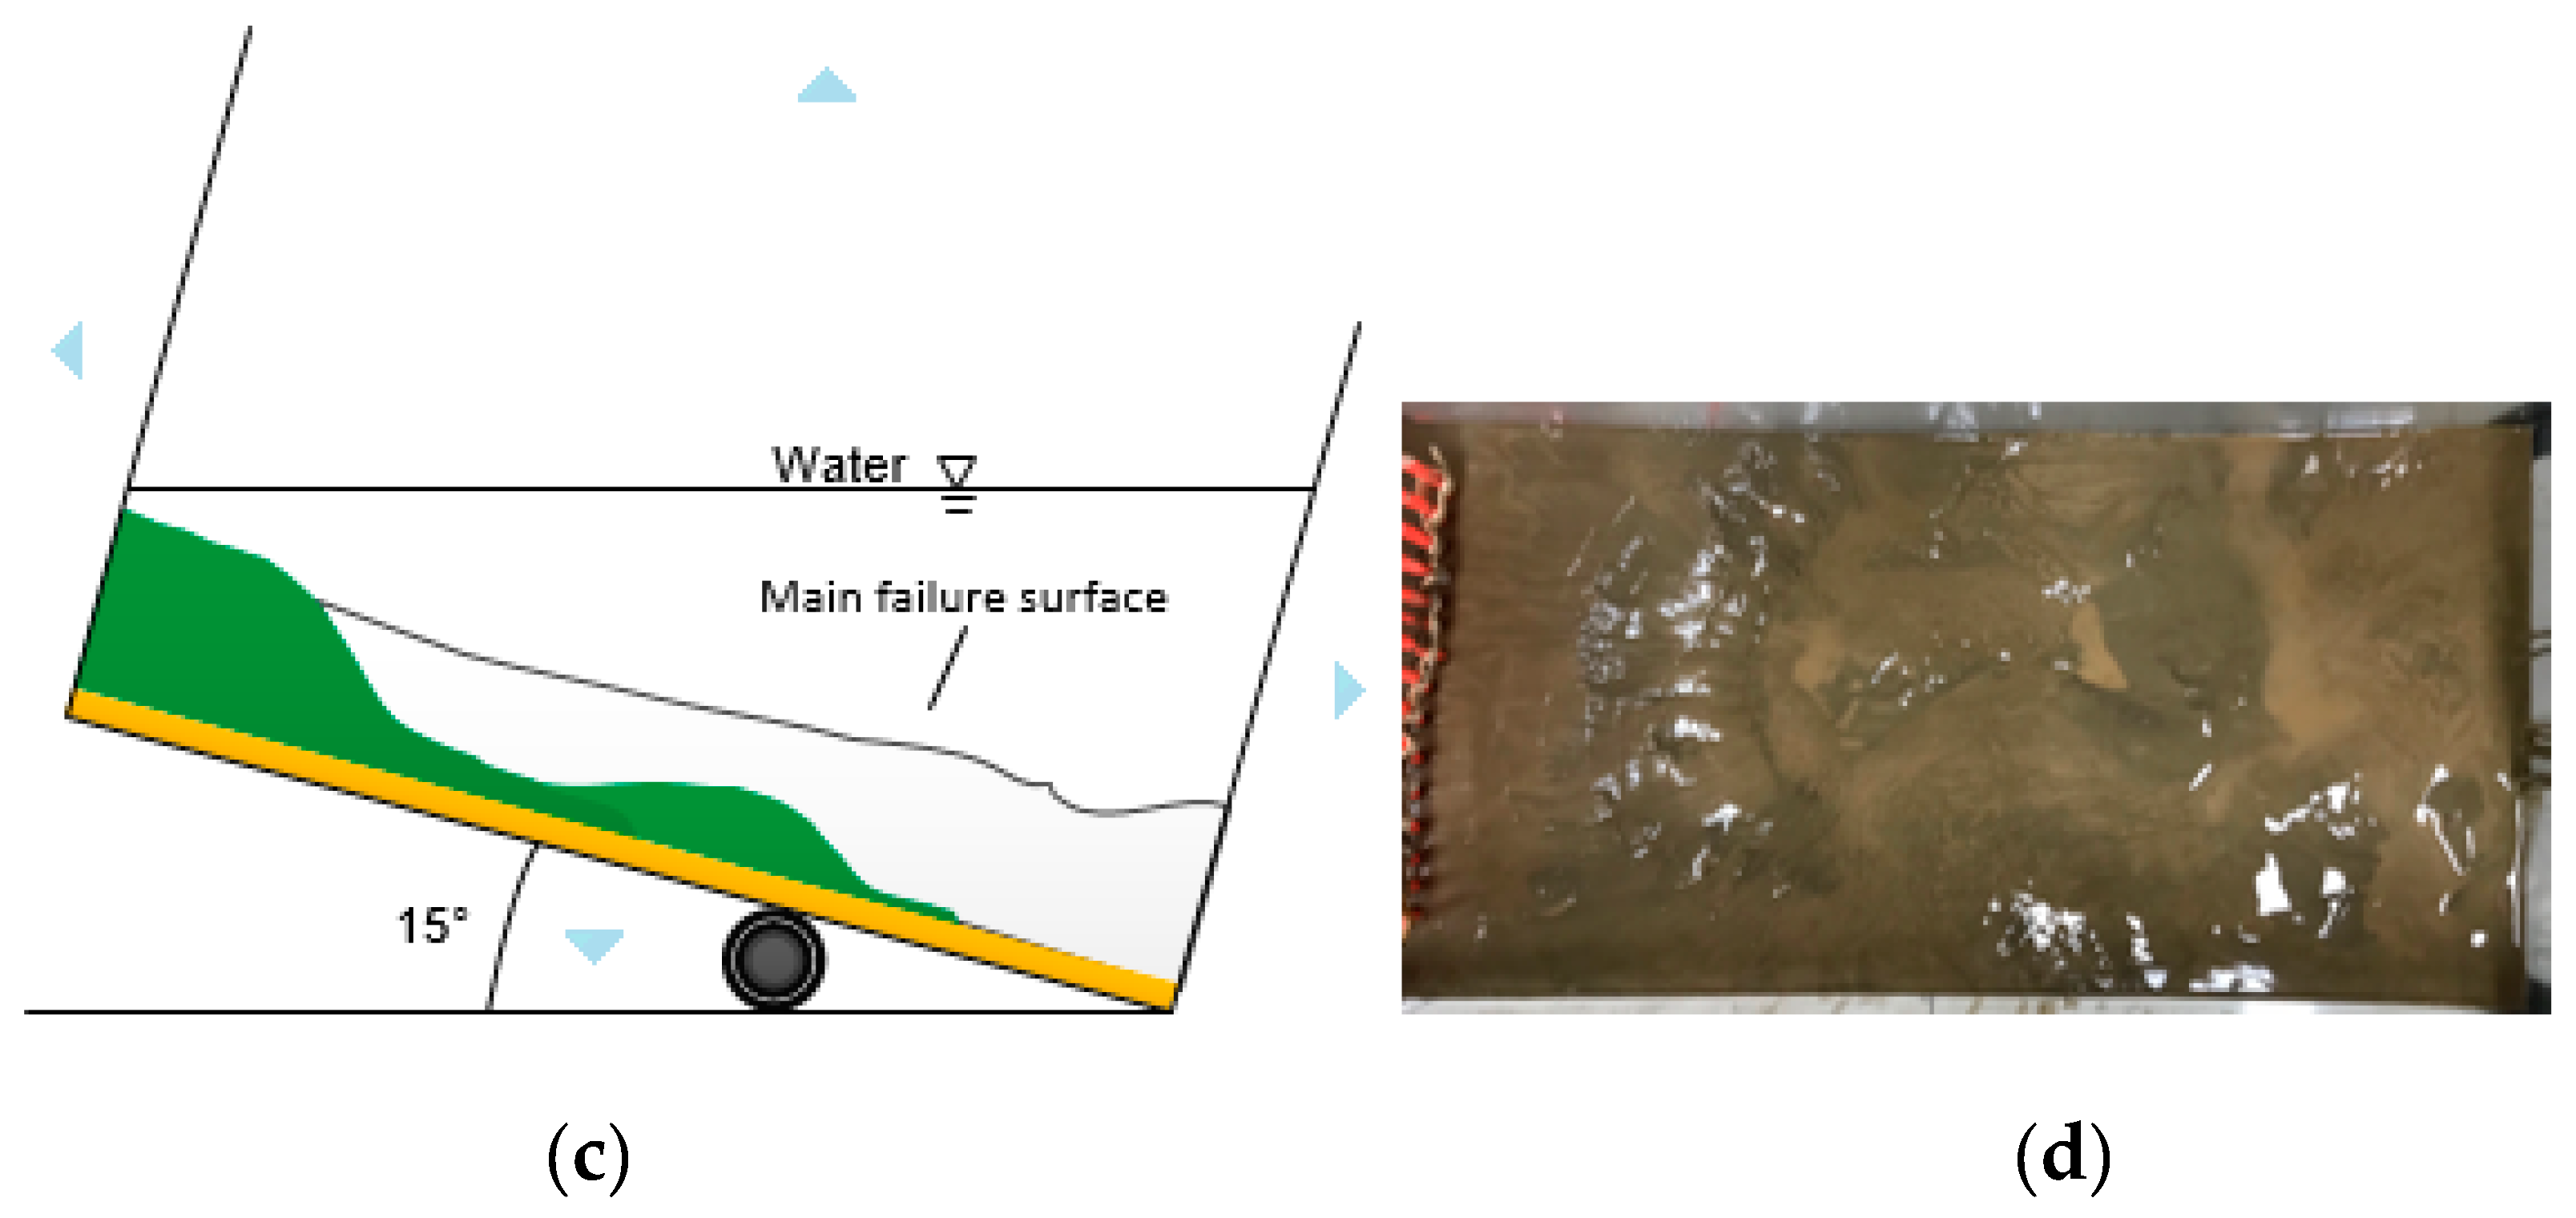
4.2. Shear-Slip Failure
4.2.1. 13-8 Model
4.2.2. 8-10 Model
5. Conclusions
Author Contributions
Funding
Acknowledgments
Conflicts of Interest
References
- Kamath, A.; Godbole, S.P.; Ostermann, R.D. Evaluation of the stability of gas hydrates in northern Alaska. Cold Reg. Sci. Technol. 1987, 14, 107–119. [Google Scholar] [CrossRef]
- Yan, W.T.; Chen, J.W.; Fan, D.J. The relationship between submarine landslide and gas hydrate. Mar. Geol. Lett. 2006, 22, 38–40. [Google Scholar]
- Xu, W.; Germanovich, L.N. Excess pore pressure resulting from methane hydrate dissociation in marine sediments: A theoretical approach. J. Geophys. Res. 2006, 111. [Google Scholar] [CrossRef]
- Yelisetti, S.; Spence, G.D.; Riedel, M. Role of gas hydrates in slope failure on frontal ridge of northern Cascadia margin. Geophys. J. Int. 2014, 199, 441–458. [Google Scholar] [CrossRef]
- Yang, X.Y. Study of Gas Hydrate and Submarine Landslide; China University of Petroleum: Beijing, China, 2010. [Google Scholar]
- Sha, Z.; Yang, M.; Liang, J.; Guo, Y.; Liang, J. The characteristics of the abnormal physiognomys of seabed related to gas hydrate in North Slope, South China Sea. Geol. Stud. South China Sea 2003, 14, 29–34. [Google Scholar]
- Roberts, H.H.; Hardage, B.A.; Shedd, W.W.; Hunt, J.J. Seafloor Reflectivity: An Important Seismic Property for Interpreting Fluid/Gas Expulsion Geology and the Presence of Shallow Gas Hydrate. Lead. Edge 2006, 25, 620–628. [Google Scholar] [CrossRef]
- Elger, J.; Berndt, C.; Rüpke, L.; Krastel, S.; Gross, F.; Geissler, H.W. Submarine slope failures due to pipe structure formation. Nat. Commun. 2018, 9, 715. [Google Scholar] [CrossRef] [PubMed]
- Zhu, C.Q.; Jia, Y.G.; Liu, X.L.; Zhang, H.; Wen, Z.M.; Huang, M.; Shan, H.X. Classification and genetic mechanism of submarine landslide. Mar. Geol. Quat. Geol. 2015, 35, 153–163. [Google Scholar]
- Nixon, M.F. Influence of Gas Hydrates on Submarine Slope Stability; Civil Engineering University of Calgary: Calgary, AB, Canada, 2005. [Google Scholar]
- Hance, J.J. Development of a Database and Assessment of Seafloor Slope Stability Based on Published Literature; University of Texas at Austin: Austin, TX, USA, 2003. [Google Scholar]
- Winters, W.J.; Dallimore, S.R.; Collett, T.S.; Jenner, K.A.; Katsube, J.T.; Cranston, R.E.; Wright, J.F.; Nixon, F.M.; Uchida, T. Relation between Gas Hydrate and Physical Properties at the Mallik 2L-38 Research Well in the Mackenzie Delta. Ann. N. Y. Acad. Sci. 2000, 912, 94–100. [Google Scholar] [CrossRef]
- Waite, W.F.; Winters, W.J.; Mason, D.H. Methane hydrate formation in partially water-saturated Ottawa sand. Am. Mineral. 2004, 89, 1202–1207. [Google Scholar] [CrossRef]
- Hyodo, M.; Nakata, Y.; Yoshimoto, N.; Orense, R. Shear Behavior of Methane Hydrate-Bearing Sand. In Proceedings of the Seventeenth International Offshore and Polar Engineering Conference (ISOPE 2007), Lisbon, Portugal, 1–6 July 2007. [Google Scholar]
- Clayton, C.R.I.; Priest, J.A.; Best, A.I. The effects of disseminated methane hydrate on the dynamic stiffness and damping of a sand. Geotechnique 2005, 55, 423–434. [Google Scholar] [CrossRef]
- Qin, Z.L.; Wu, S.G.; Wang, Z.J.; Li, Q.P. Geohazards and risk of deepwater engineering included by gas hydrate-A case study from oil leakage of deepwarer drilling well in GOM. Prog. Geophys. 2011, 26, 1279–1287. [Google Scholar]
- Zhang, X.H.; Wang, S.; Li, Q.P.; Yhao, J.; Wang, A. Experimental study of mechanical properties of gas hydrate deposits. Rock-soil mechanics. Rock Soil Mech. 2010, 31, 3069–3074. [Google Scholar]
- Shi, Y.H.; Zhang, X.H.; Lu, X.B. Experimental study on the static mechanical properties of hydrate-bearing silty-clay in the South China Sea. Chin. J. Theor. Appl. Mech. 2015, 47, 521–528. [Google Scholar]
- Pearson, C.F.; Halleck, P.M.; McGuire, P.L.; Hermes, R.; Mathews, M. Natural gas hydrate deposits: A review of in situ properties. J. Phys. Chem. 1983, 87, 4180–4185. [Google Scholar] [CrossRef]
- Masui, A.; Haneda, H.; Ogata, Y.; Aoki, K. Mechanical Properties of Sandy Sediment Containing Marine Gas Hydrates in Deep Sea Offshore Japan. In Proceedings of the Seventh Ocean Mining Symposium (ISOPE 2007), Lisabon, Portugal, 1–6 July 2007. [Google Scholar]
- Masui, A.; Haneda, H.; Ogata, Y.; Aoki, K. Effects of Methane Hydrate Formation on Shear Strength of Synthetic Methane Hydrate Sediments. In Proceedings of the Fifteenth International Offshore and Polar Engineering Conference, Seoul, Korea, 19–24 June 2005. [Google Scholar]
- Wang, S.Y.; Lu, X.B. Advances of research on mechanical properties of gas hydrate deposits. Adv. Mech. 2009, 39, 176–188. [Google Scholar]
- Wang, D.; Zhang, H.L.; Wang, X.; Lin, W.J. Advances in acoustic exploration of the gas hydrate. Appl. Acoust. 2005, 24, 72–77. [Google Scholar]
- Wei, W.; Chen, X.D.; Lu, X.B.; Zhang, X.H. Experimental study of the sea floor damage due to gas escape in hydrate dissociation. Mech. Eng. 2013, 35, 30–34. [Google Scholar]
- Zhang, X.; Lu, X.; Wang, S.; Li, Q.P.; Yao, H.Y. Experiments on formation damage caused by rapid heating decomposition of natural gas hydrate. Mar. Geol. Quat. Geol. 2011, 31, 157–164. [Google Scholar] [CrossRef]
- Zhang, X.H.; Liu, Y.H.; Li, Q.P.; Zhao, J.; Wang, A.L. Study on the Decomposition Range of Hydrate Around Thermal Conducting Body in Sediments. Mech. Eng. 2010, 32, 39–41. [Google Scholar]
- Liu, T.; Zhou, L.; Kou, H.; Zhang, M.X. Model test of stratum failure and pore pressure variation induced by THF hydrate dissociation. Mar. Georesour. GeoTechnol. 2018, 1–8. [Google Scholar] [CrossRef]
- Zhang, J.H.; Lin, H.L.; Wang, K.Z. Centrifuge modeling and analysis of submarine landslides triggered by elevated pore pressure. Ocean Eng. 2015, 109, 419–429. [Google Scholar] [CrossRef]
- Zhang, X.H.; Lu, X.B.; Chen, X.D.; Zhang, L.M.; Shi, Y.H. Mechanism of soil stratum instability induced by hydrate dissociation. Ocean Eng. 2016, 122, 74–83. [Google Scholar] [CrossRef]
- Acosta, E.A.; Tibana, S.; de Almeida, M.S.S.; Saboya, J.F. Centrifuge modeling of hydroplaning in submarine slopes. Ocean Eng. 2017, 129, 451–458. [Google Scholar] [CrossRef]
- Gao, F.P.; Han, X.T.; Cao, J.; Sha, Y.; Cui, J.S. Submarine pipeline lateral instability on a sloping sandy seabed. Ocean Eng. 2012, 50, 44–52. [Google Scholar] [CrossRef]
- Wang, W.H. Study on the Influence of Sea Water Salinity Field on Sediment Consolidation Process in the Yellow River Estuary. Ph.D. Thesis, Ocean University of China, Qingdao, China, June 2015. [Google Scholar]


| Experiment Number | Seabed Thickness/D (cm) | Seabed Slope/α (°) | Water Height/h (cm) | Sand Layer Thickness/s (cm) |
|---|---|---|---|---|
| 20-5 | 20 | 5 | 35 | 2 |
| 20-10 | 20 | 10 | 36 | 2 |
| 20-15 | 20 | 15 | 44 | 2 |
| 13-5 | 13 | 5 | 35 | 2 |
| 13-10 | 13 | 10 | 36 | 2 |
| 13-15 | 13 | 15 | 36 | 2 |
| 8-5 | 8 | 5 | 35 | 2 |
| 8-10 | 8 | 10 | 36 | 2 |
| 8-15 | 8 | 15 | 36 | 2 |
| Properties Parameters | Value | |
|---|---|---|
| Moisture content (ω) | 28.3% | |
| Density (ρ) | 2.0 g/cm3 | |
| Dry density (ρd) | 1.55 g/cm3 | |
| Specific gravity (Gs) | 2.7 | |
| Void ratio (e) | 0.75 | |
| Porosity (n) | 43% | |
| Plasticity index (Ip) | 6.9 | |
| Saturated unit weight (γs) | 16.0 kN/m3 | |
| shear strength of uu test | Cohesion (c) | 7 kPa |
| Internal friction angle (φ) | 20° | |
| Number | Thickness/D (cm) | Angle/α (°) | Failure Mode | Failure Time (s) | Failure Level (cm) |
|---|---|---|---|---|---|
| 20-5 | 20 | 5 | Pockmark | 420 | 2; Diameter: 8 × 12.5, 9.6 × 6 |
| 20-10 | 20 | 10 | Pockmark | 380 | 1; Diameter: 29 × 25.3 |
| 20-15 | 20 | 15 | Pockmark | 335 | 1; Diameter: 40 × 35.7 |
| 13-5 | 13 | 5 | Pockmark | 290 | 2; Diameter: 24 × 20.3, 21.5 × 10.2 |
| 13-10 | 13 | 10 | Shear–slip failure | 190 | 2; Width: 5; Slip zone: 27 |
| 13-15 | 13 | 15 | Shear–slip failure | 150 | 1; Width: 9.5; Slip zone: 50 |
| 8-5 | 8 | 5 | Shear–slip failure | 90 | 2; Width: 4.3, 5; Slip zone: 59 |
| 8-10 | 8 | 10 | Shear–slip failure | 80 | 5; Width: 3.5; Slip zone: 62 |
| 8-15 | 8 | 15 | Eruption failure | 20 | Overall liquefaction |
© 2019 by the authors. Licensee MDPI, Basel, Switzerland. This article is an open access article distributed under the terms and conditions of the Creative Commons Attribution (CC BY) license (http://creativecommons.org/licenses/by/4.0/).
Share and Cite
Liu, T.; Lu, Y.; Zhou, L.; Yang, X.; Guo, L. Experiment and Analysis of Submarine Landslide Model Caused by Elevated Pore Pressure. J. Mar. Sci. Eng. 2019, 7, 146. https://doi.org/10.3390/jmse7050146
Liu T, Lu Y, Zhou L, Yang X, Guo L. Experiment and Analysis of Submarine Landslide Model Caused by Elevated Pore Pressure. Journal of Marine Science and Engineering. 2019; 7(5):146. https://doi.org/10.3390/jmse7050146
Chicago/Turabian StyleLiu, Tao, Yueyue Lu, Lei Zhou, Xiuqing Yang, and Lei Guo. 2019. "Experiment and Analysis of Submarine Landslide Model Caused by Elevated Pore Pressure" Journal of Marine Science and Engineering 7, no. 5: 146. https://doi.org/10.3390/jmse7050146
APA StyleLiu, T., Lu, Y., Zhou, L., Yang, X., & Guo, L. (2019). Experiment and Analysis of Submarine Landslide Model Caused by Elevated Pore Pressure. Journal of Marine Science and Engineering, 7(5), 146. https://doi.org/10.3390/jmse7050146