Article

Effect of Girder Spacing and Depth on the Solitary Wave Impact on Coastal Bridge Deck for Different Airgaps

1
Department of Civil Engineering, Indian Institute of Technology Bombay, Mumbai 400076, India
2
Department of Civil and Environmental Engineering, Norwegian University of Science and Technology (NTNU), NO-7491 Trondheim, Norway
*
Author to whom correspondence should be addressed.
J. Mar. Sci. Eng. 2019, 7(5), 140; https://doi.org/10.3390/jmse7050140
Submission received: 16 April 2019 / Revised: 6 May 2019 / Accepted: 7 May 2019 / Published: 11 May 2019
(This article belongs to the Special Issue Computational Fluid Dynamics for Ocean Surface Waves)

Abstract

:
Coastal bridge damage has become a severe issue of concern in the recent past with the destruction of a considerable number of bridges under the impact of waves during tsunami and storm surges. These events have become more frequent, with waves reaching the bridge deck and causing upliftment and destruction. Past studies have demonstrated the establishment of various theoretical equations which works well for the submerged deck and regular wave types but show much scatter and uncertainty in case of a deck that is above still water level (SWL). The present study aims to generate a solitary wave to represent an extreme wave condition like a tsunami in the numerical wave tank modeled using the open source computational fluid dynamics (CFD) model REEF3D and to study the vertical impact force on the coastal bridge deck. A parametric study is carried out for increasing wave heights, girders spacing and depth for varying airgaps to analyze the effect of these parameters on the peak vertical impact force. It is observed that increasing the girder spacing and girder depth is effective in reducing the peak vertical impact force for the cases considered.

1. Introduction

Coastal bridges are subjected to wave impacts due to extreme events like tsunami and storm surges. These extreme events are becoming more frequent (Hansom et al., 2011 [1]) leading to higher expenses on coastal bridge repairs. Thus, a detailed and appropriate study on the total wave force and its impact on the bridge deck will help design stable structures. Combined waves and storm surges cause the worst damage (see reference [1]) to bridge decks. Both vertical and horizontal force are experienced by the deck, in which the vertical loading plays a significant role by acting against the deck self-weight and can cause deck upliftment and finally structural failure.
In the past, several experimental and theoretical works have been reported on wave impact on structures located both in offshore and coastal regions. The initial studies were mainly carried out on wave loads on horizontal slabs without any girders. An experimental study on wave loads due to solitary waves was carried out on an elevated horizontal plate structure by French (1979) [2]. Suchithra and Koola (1995) [3] carried out studies on the impact loads acting on horizontal slabs during wave slamming and concluded that the wave slamming coefficient depends on the air trapped between the deck and the water surface. Kaplan (1992, 1995) [4,5] carried out experiments on horizontal plate structure and developed theoretical equations to find the impact force considering slamming, drag, inertia and buoyancy forces, but it failed to consider the effect of air entrapment. Ren and Wang (2003) [6] carried out an experimental study of irregular wave impact on structures in the splash zone and deduced an empirical expression for the characteristic peak impact pressure and the spectral moment of the impact pressure on the structure. Tirindelli et al. (2002) [7] performed experiments on exposed jetties and compared the pulsating forces with the existing methods of Kaplan (1992). Tirindelli et al. (2003) [8] conducted experiments to find the wave-induced force on key elements of the jetty structure. Later, Cuomo et al. (2003) [9] conducted a large scale experiment in a wave basin to gain insights on the dynamics of wave loading of coastal bridges. The study attempted to find the wave in deck loads on exposed jetties (Cuomo et al., 2007) [10] and the role of air entrapment in the increasing wave in deck loads (Cuomo et al., 2009) [11]. The role of air entrapment and effect of openings in the reduction of wave force is highlighted. Lamberti et al. (2011) [12] carried out a large scale experimental study using regular and irregular waves on close to prototype jetties to deduce the wave-induced horizontal forces on the deck front, and they have evaluated the spacing of pressure transducers effect in obtaining impact force. Gaeta et al. (2012) [13] extended the investigation by including the effect of wave irregularity, air venting and experimental scale factor. The above studies were further extended through numerical investigation (Gaeta et al., 2015 [14]) for wave breaking conditions while considering the air compressibility effect. Seiffert et al. (2014) [15] carried out both numerical and experimental study on a plate structure representing a coastal bridge under the action of solitary waves for different incident wave parameters and air-gap. Hayatdavoodi et al. (2014) [16] further continued the work by considering girders underneath the deck and computed the force on the deck due to air entrapment. Seiffert et al. (2015) [17] also reported a comparison study between the vertical and horizontal forces calculated using compressible and incompressible Euler’s equation and concluded that compressibility has minimal effect on the forces. Azadbakht and Yim (2016) [18] studied air entrapment effects using stokes fifth order wave by placing the structure bottom at SWL to obtain the maximum wave load increase due to air entrapment. Xu et al. (2017) [19] conducted numerical studies using solitary wave force on elevated and submerged decks and developed an expanded equation for solitary wave force. A bridge deck at different submergence levels is studied for varying wave heights and water depths. Most of the earlier studies have not considered higher H/d ratios and the effect of girder spacing and thickness on the vertical impact force at various airgaps. The present study focuses on considering higher wave heights up to breaking and different girder depths and spacing arrangements affecting the impact force. As the effect of girders and air entrapment are mainly contributing to the vertical impact force, the effect of different parameters on vertical impact force is studied. A three-dimensional study could better represent the deck structure and help to capture the wave directionality and spreading effects. However, as the present study deals with the effect of girders and its spacing for different parameters, a two-dimensional study is considered to be sufficient to capture the variations.
A review by Hayatdavoodi et al. (2016) [20] suggested further studies on the investigation of wave loads on elevated decks considering air entrapment. The study on elevated decks is significant as deck levels are currently being increased in designs to avoid bridge submergence in areas having a higher risk of storm surges. Here, the objective is to study the vertical wave impact on partially and fully elevated coastal bridge decks due to solitary wave for different airgaps. First, a study is conducted on flat deck and deck with girders with a solitary wave to quantify the effect of air entrapment due to girders for elevated decks. Then a deck with girders is analyzed with varying girder spacing, girder thickness, with and without railing and overhang at different submergence heights to quantify the effect of these parameters on the peak vertical impact force.

2. Numerical Modeling and Validation

2.1. Numerical Model

A numerical investigation is carried out using the open source CFD model REEF3D (Bihs et al., 2016 [21], Bihs and Kamath [22]) to study the wave load on the bridge deck. The incompressible unsteady Reynolds-Averaged Navier-Stokes (URANS) equations (Equation (2)) along with continuity equation (Equation (1)) are used to solve the flow dynamics including the free surface. The investigations are carried out in a 2D frame work considering the x (direction of wave propagation) and z-directions (along the depth) as shown in Figure 1.
u i x i = 0
u i t + u j u i x j = 1 ρ p x i + x j [ ( ν + ν t ) ( u i x j + u j x i ) ] + g i
where ρ is the fluid density, p is the pressure, u is the velocity over time t, ν is the kinematic viscosity, ϑ t is the eddy viscosity and g the acceleration due to gravity. Turbulence modeling was done using the k-ω model, where the transport equations for the turbulent kinetic energy, k and the specific turbulent dissipation rate, ω are:
k t + u j k x j = x j [ ( ν + ν t σ k ) k x j ] + P k β k k ω
ω t + u j ω x j = x j [ ( ν + ν t σ w ) ω x j ] + ω k α P k β ω 2
where the eddy-viscosity ϑ t = k / ω , PK is the production rate and closure coefficients σ k = 2, σ w = 2, β k = 9/100, β = 3/40 and α = 5/9.
The first step to solve the fluid flow problems represented by differential equations is to discretize the convective terms. Conservative finite differences are used in REEF3D for the discretization of the velocities. The Hamilton-Jacobi formulation of the WENO scheme (Jiang and Shu, 1996 [23]) is employed in the present study for the discretization of turbulence and level set equations. The Total Variance Diminishing (TVD) third-order Runge-Kutta scheme (Shu, 1988 [24]) is used for the discretization of time-dependent terms. To maintain an adequate time step size using explicit methods, the CFL (Courant-Friedrich-Lewy) criterion (Courant et al., 1967 [25]) is used.
The signed distance level set function is employed in REEF3D to capture the free surface air-water interface (Bihs et al., 2016 [21]). The movement of the interface is characterized by the convection of the level set function with an additional reinitialization technique.

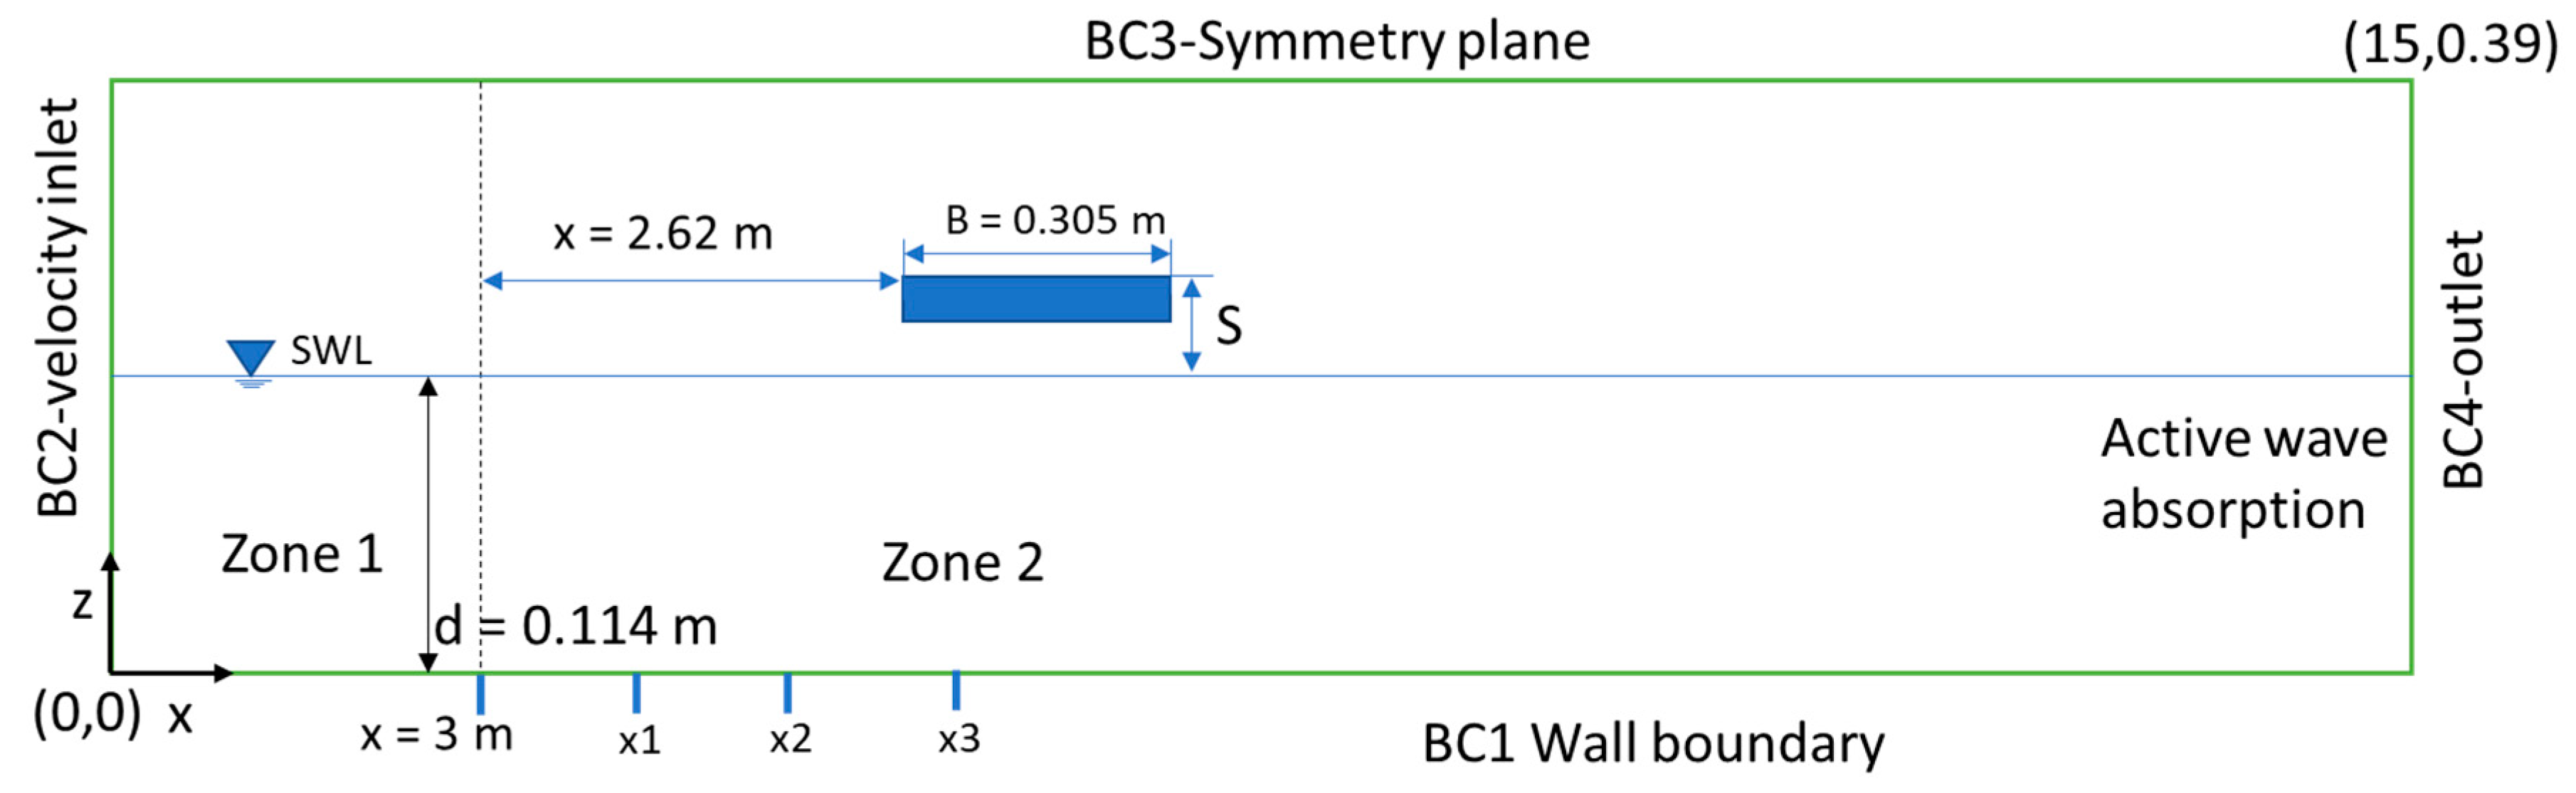
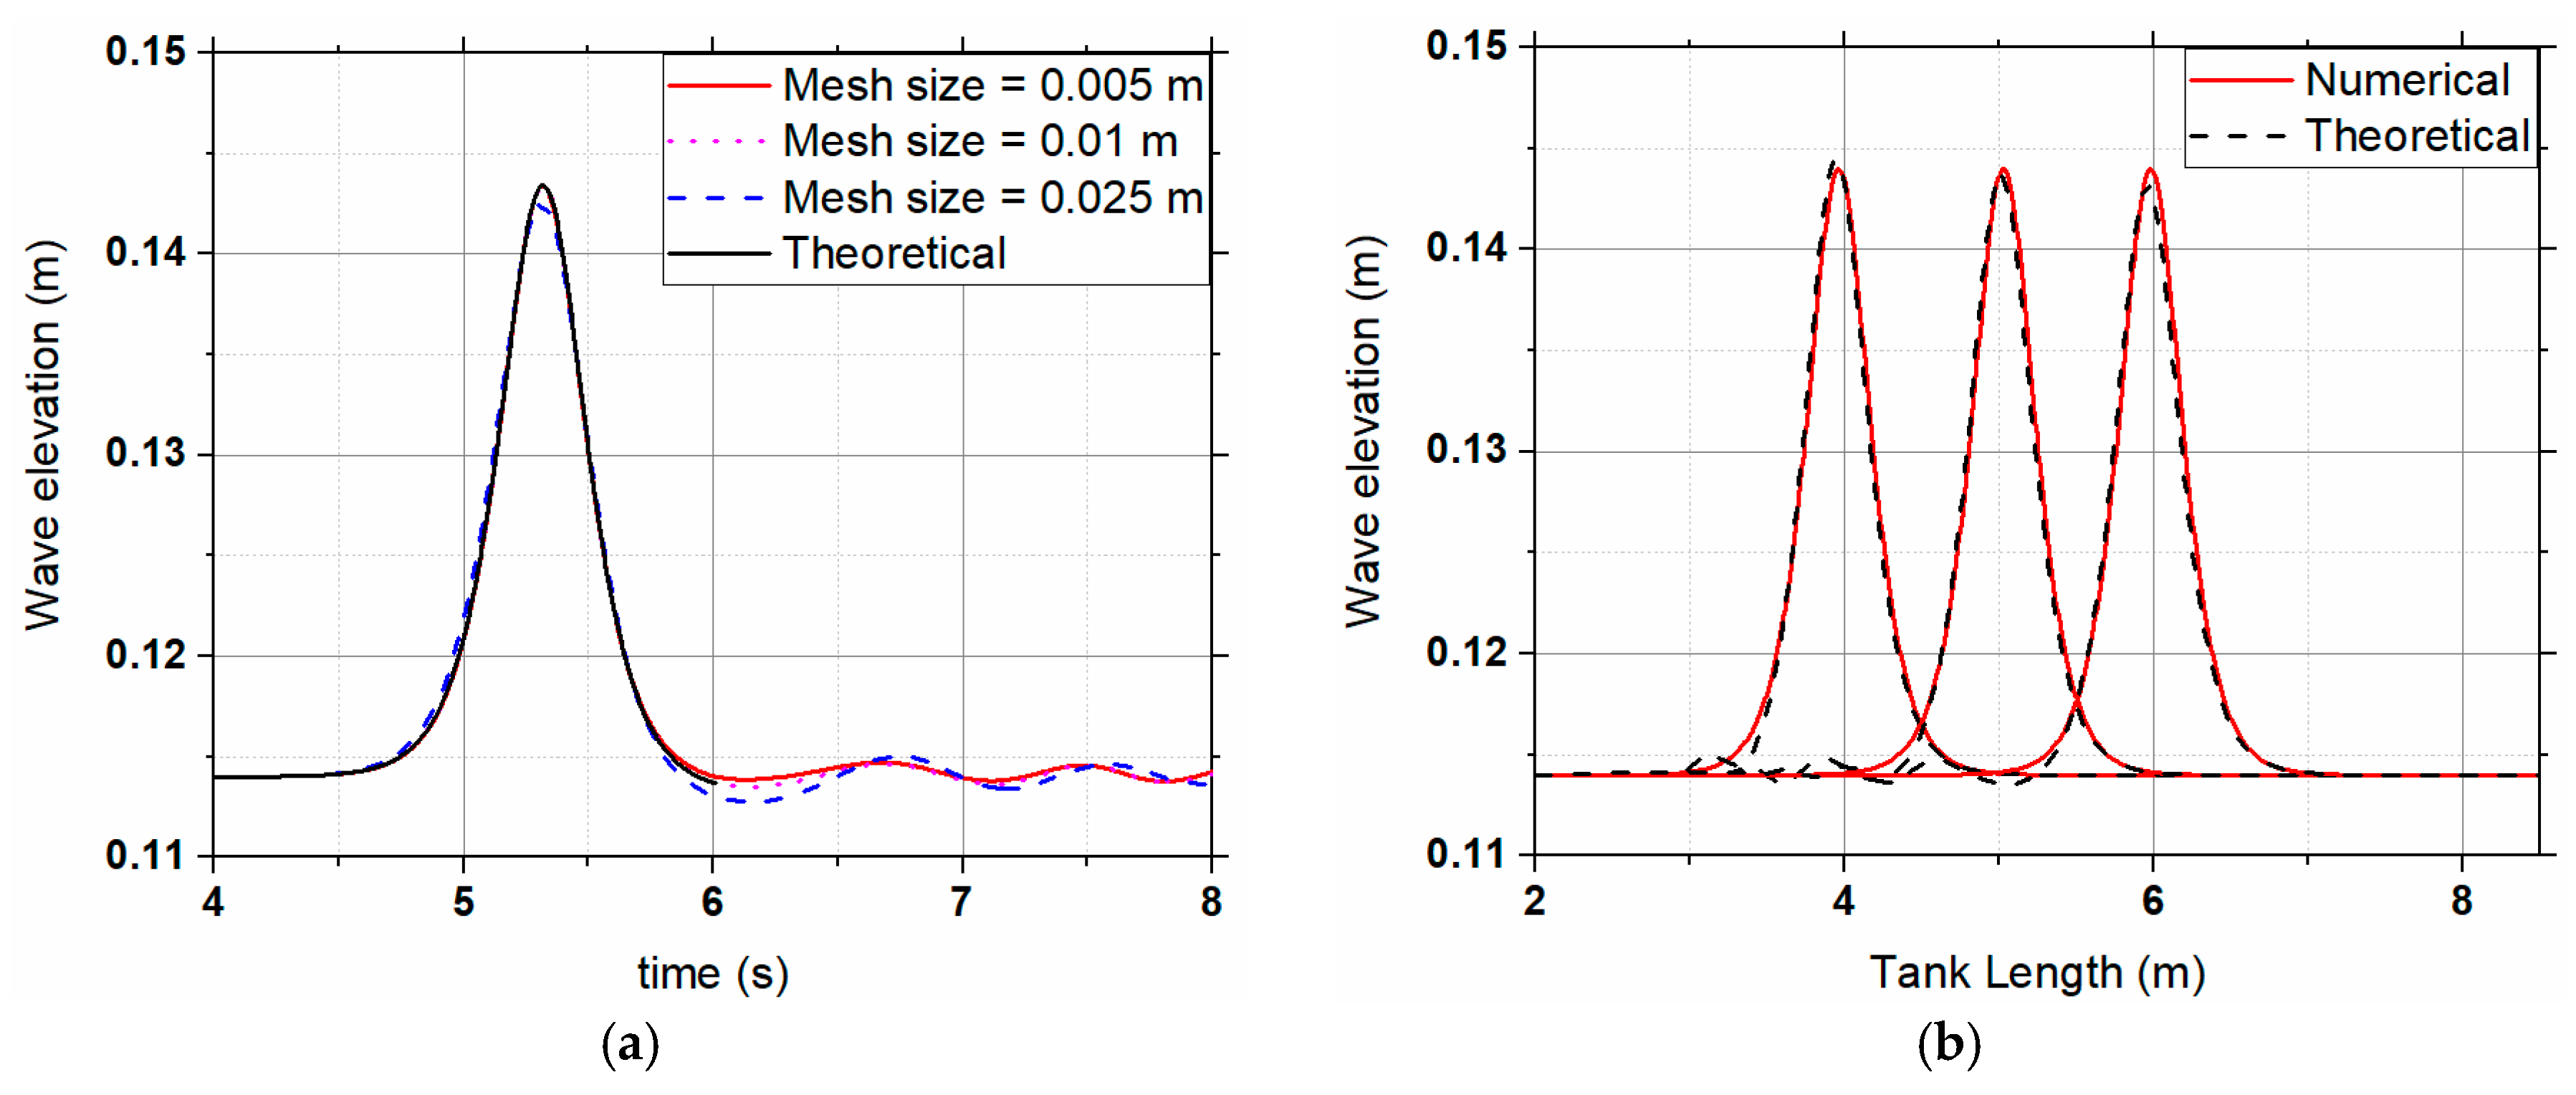
2.2. Model Domain and Mesh Sensitivity Study

A 2D numerical wave tank (NWT) was generated as shown in Figure 1 and modeled using REEF3D. A uniform Cartesian staggered grid is used for spatial discretization along the length and height of the NWT, and one mesh size is considered as the width of NWT. The wave tank has a length of 15 m considering the initial wave generation zone (Zone 1) of 3 m and working zone (Zone 2) of 12 m. A wave tank height of 0.39 m, similar to the experimental setup (Seiffert et al., 2014 [17]) is considered as this is the height generally used for validation. The physical processes at the boundaries are represented using appropriate boundary conditions in the numerical wave tank as shown in Figure 1. The active wave absorption technique is used to prevent reflection from the rear end (outlet BC4). The bottom of the numerical wave tank and the deck structure model are solid walls, for which a wall boundary condition (BC1) is applied. For BC1, the normal velocity is set to zero. The wave generation is located at velocity inlet (BC2) using suitable wave theory. The lid and the sides are specified with symmetry boundary conditions (BC3). The free surface (air-water interface) is captured using the level set function, an interface capturing technique. A CFL number of 0.1 is used throughout the simulation for model stability.
The numerical model domain is discretized with uniform mesh considering three mesh sizes, Δx = 0.025 m, 0.01 m, and 0.005 m for carrying out the mesh refinement study. A third-order solitary wave of height, H = 0.03 m is generated using all the three mesh sizes (Δx = 0.025, 0.01 and 0.005 m) and the wave elevations recorded at a distance of 5.62 m are shown in Figure 2a. It can be seen that the wave elevations computed with the mesh sizes of 0.01 m and 0.005 m capture the theoretical profile well compared to 0.025 m. This suggests that a mesh size of 0.01 m can be used for further simulations. The wave profile along the numerical wave tank was captured using the mesh size of 0.01 m and compared with the theoretical profiles for three different time instants (Figure 2b). As the structure is proposed to be placed at a distance of 5.62 m, the time instants were chosen when the wave crest reaches 4 m (x1), 5 m (x2) and 6 m (x3). The comparison between the numerical and the theoretical wave height (H = 0.03 m) when the crest reaches x1, x2 and x3 shows a difference of 0%, 0.09% and 0.15%, respectively (Figure 2b). Although there is a decay of wave elevation as it propagates towards the outlet boundary, the errors are found to be reduced and may not affect the results. Thus, a mesh size of 0.01 m was used for the model studies.

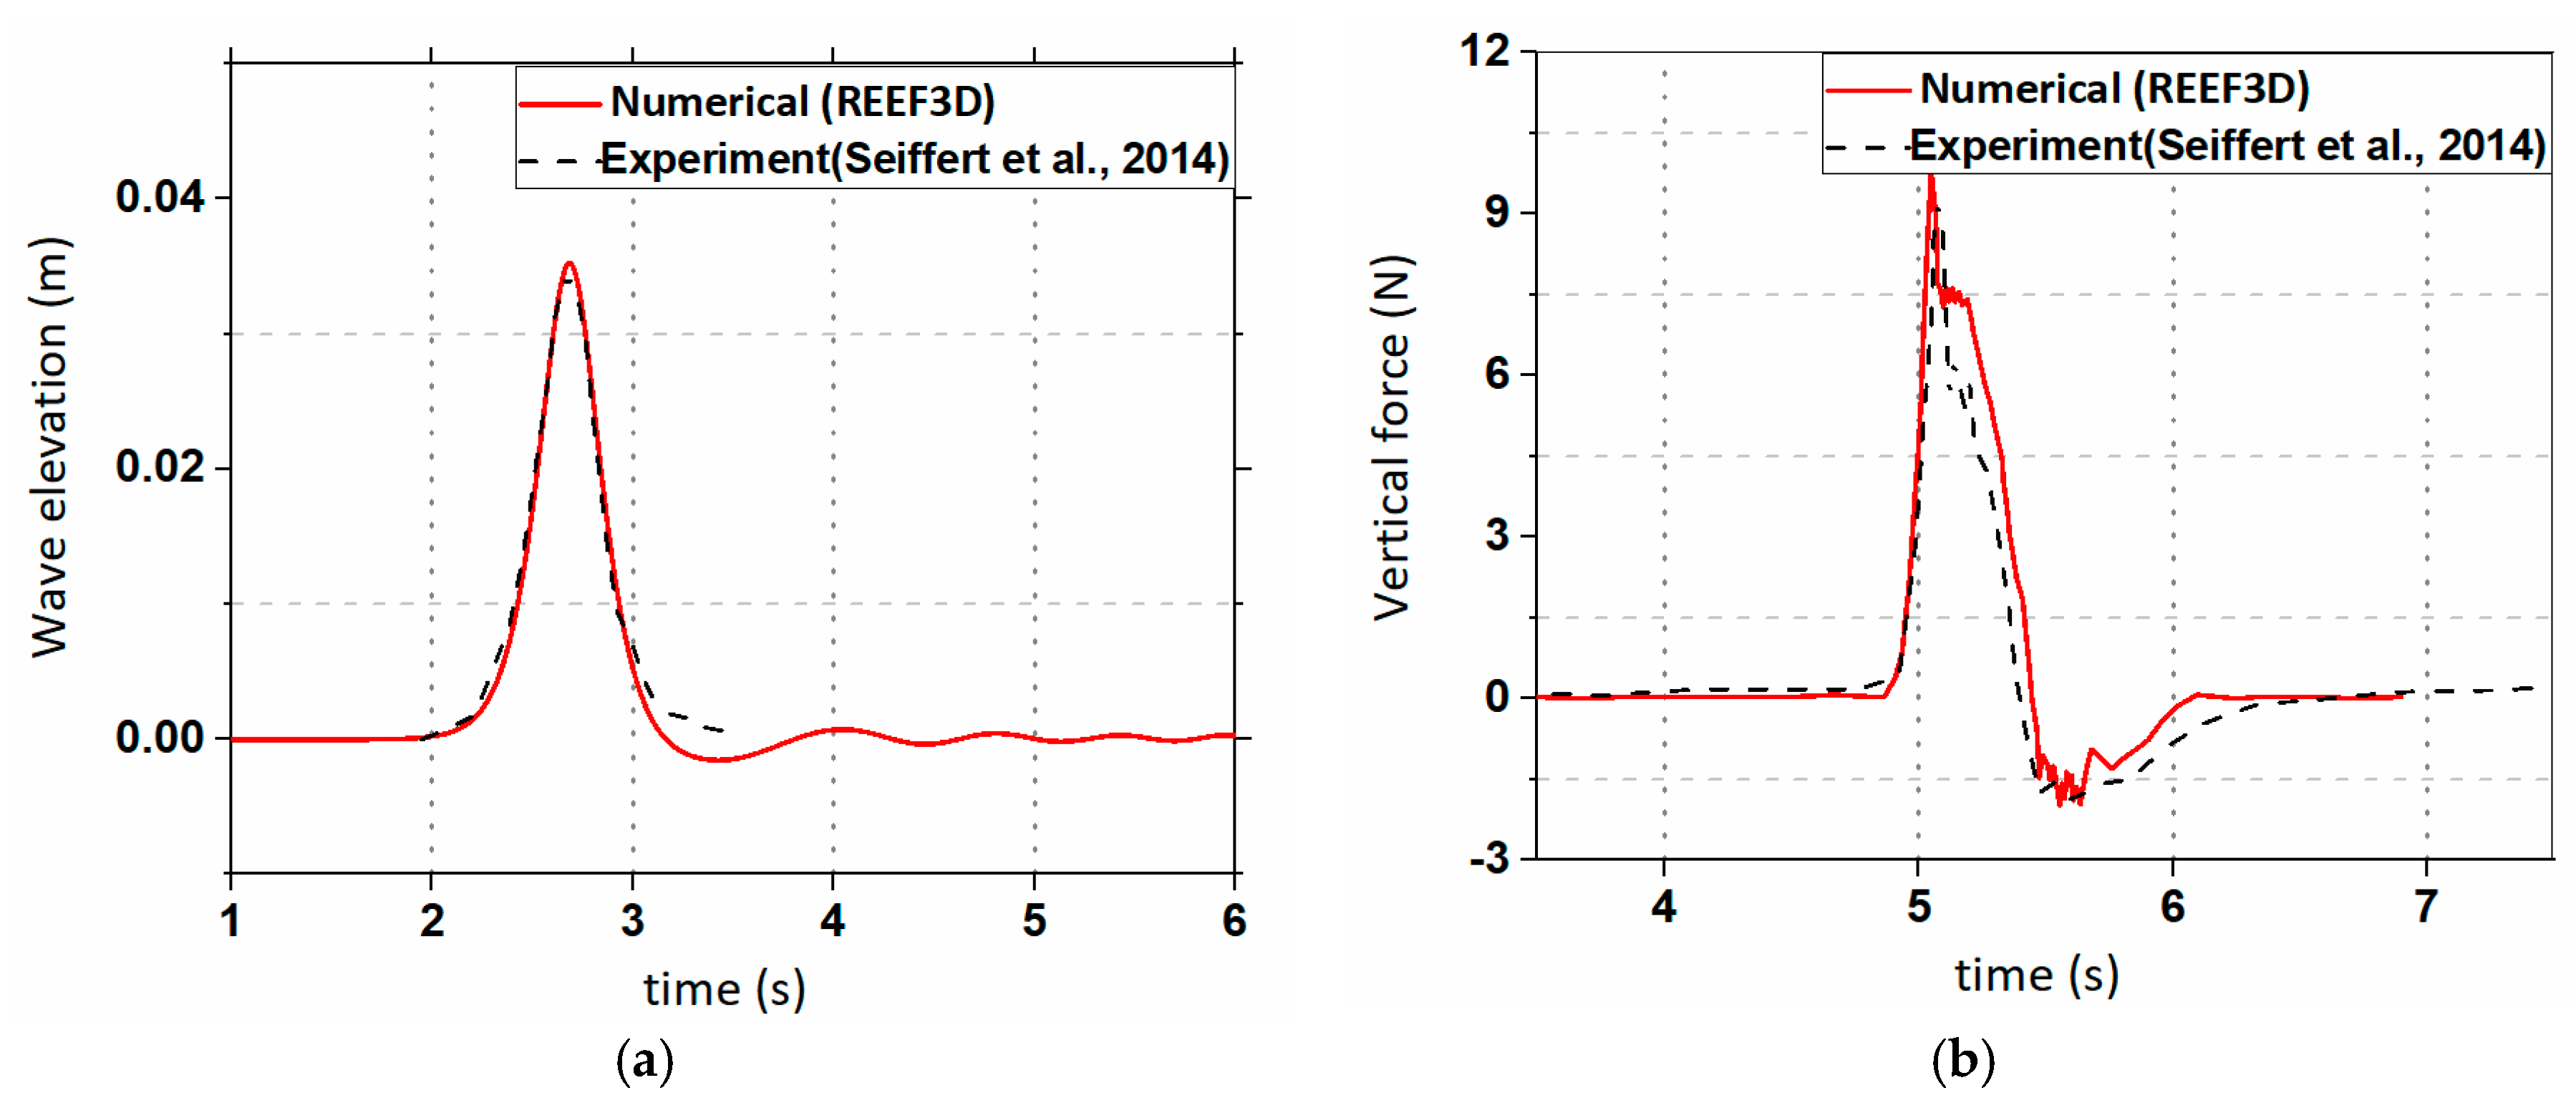
2.3. Validation of Numerical Model

In the present study, a flat deck representing a coastal bridge structure subjected to solitary wave forces is considered in line with the experiment conducted by Seiffert et al. (2014) [15] as a bench mark simulation for the validation of REEF3D. Seiffert et al. (2014) [15] used a wave flume of 9.14 m length, 0.152 m width and 0.39 m height for the 2D analysis. Wave gauges and load cells were used to measure the wave elevations and vertical forces, respectively. A wave gauge is placed at a distance, x = 2.62 m from the wave maker to measure the wave elevation. A flat plate deck model of length Lp = 0.149 m, width B = 0.305 m and thickness tp = 1.27 cm is placed at the location (x = 2.62 m), where the wave elevation is measured. Solitary waves with five amplitudes were tested for different water depths and airgaps. For the present study, one of the scenarios with amplitude, a = 0.03432 m in water depth, d = 0.114 m at normalized airgap, S/d = 0.1 is considered for validation.
The flat deck is placed at a distance of 2.62 m from zone 1. In the present validation study, the experimental tank with a scale of 1: 35 (Seiffert et al., 2014 [17]) has smaller dimensions of the deck and requires a finer mesh size where Δx = 0.005 m is chosen. The experimental condition was simulated using the present numerical model with a third-order solitary wave (a = 0.03432 m) and the wave height at x = 2.62 m (from zone 1) was compared with the experimental results as shown in Figure 3a. It can be seen that the numerical model very well captures the measured wave profile. The vertical wave impact force on the plate is then obtained by integrating the pressure acting on the structure. Figure 3b shows the vertical impact force comparison obtained from the numerical model with the experimental observation of Seiffert et al., 2014. The result shows that the model can capture the magnitude as well as the slamming force along with both negative and positive quasi-static forces as indicated in Figure 3b. This demonstrates that the model can be further used for the investigation of the wave impact on coastal bridge decks.

3. Solitary Wave Impact on Deck

The validated model was used to study the wave force on the coastal bridge deck (Figure 4) for different airgaps. The effect of girders, railings and overhangs are studied for different wave parameters. The airgap (S) considered here is the distance measured from the SWL to the top of the deck as shown in Figure 4. A range of airgaps (S = −0.04, 0, 0.02, 0.04, 0.06, 0.08 and 0.1 m) are considered in the present study where the negative value shows the submerged cases and positive value shows the elevated condition of the top of the deck. The wave loading on the bridge deck with the considered airgaps is tested for varying wave heights. The bridge structure used is of the scale 1:10 and the mesh size of 0.01 m are used for the numerical wave tank. A wave tank of height 1 m is used for all the simulations.

3.1. Effect of Girders Under the Deck

A flat deck and a deck with girders (Figure 5a,b), subjected to solitary wave impact at different airgaps are investigated, and the impact forces are compared to analyze the role of girders in increasing or reducing the vertical impact force. For the same, a solitary wave (H = 0.07 m) is generated in the NWT for water depth, d = 0.35 m. The generated solitary wave is allowed to hit the deck placed with different airgaps and the impact force on the deck is recorded with respect to time. The results are then plotted with respect to the normalized airgap (S/d). The impact force time history for the deck with and without girders for a normalized airgap of 0.17 is plotted as shown in Figure 6a. The force is obtained at each time step. An adaptive time stepping approach is used in the model and the time step depends on courant number. This means that the time step is reduced when there are large velocities in the domain. This is especially the case when the wave interacts with the structure. For S/d = 0.17 where the peak force is obtained, the minimum time step Δt at which force is calculated is 0.00107 s and the maximum time step is 0.00306 s. The vertical force per meter width has been normalized using the following parameter: ρgAv where Av is the vertical projected area of the flat deck. These simulation results have been plotted neglecting the hydrostatic force on deck due to the partial submergence. In the case of a flat deck, the slamming force occurs at t = 3.6 s when the wave hits the deck followed by a slowly varying positive and negative force when the wave leaves the deck. For the deck with girders, Figure 6a shows a slamming force of higher magnitude at t = 3.56 s after which the force reduces. It is noted that the slowly varying quasi-static force shows two small peaks at t = 3.78 s and t = 3.99 s, as the underside of the deck is not smooth and the wave further interacts with the girders. The peak impact force for the deck with girders is twice compared to the flat deck for the same wave height (H = 0.07 m) and airgap (S/d = 0.17) considered. In order to further analyze the effect of the airgap on the peak vertical impact force on the deck with and without girders, a comparison of the peak impact force is shown in Figure 5b for different normalized airgaps (S/d = −0.06, 0, 0.06, 0.12, 0.14, 0.17, 0.2, 0.23, 0.29). The peak impact force obtained for the submerged condition (S/d = −0.06) results in a positive uplift force for both flat deck and deck with girders without accounting for the hydrostatic forces acting on the deck. The vertical impact force on a flat deck and a deck with girders for the normalized airgaps S/d = −0.06, 0 and 0.06 are almost equal in magnitude (Figure 6b), and this result agrees with the comparative study of Hayatdavoodi et al. (2014) [16]. But with the increase of the deck level above the SWL, a sharp increase in the peak vertical impact force is observed from S/d = 0.11 to S/d = 0.14 and 0.17 and a decrease in force is seen thereafter. After S/d = 0.23, the variation in vertical impact force is negligible. The sudden increase in vertical force above the SWL is the result of air entrapment in the chambers between the girders. Further increases in the airgap reduce the impact force as the wave height is not high enough to fill the chambers, reducing the entrapped air. Thus, it is evident that the vertical impact force for the deck with girders is the maximum for the elevated cases and depends on the wave height and airgap. This suggests the significance of more parametric studies on elevated decks to analyze the variation of the vertical impact force.
Figure 7 and Figure 8 show the velocity and pressure distribution, respectively for S/d = 0.17, where the peak vertical impact force is obtained (Figure 6b). The wave hits the side of the deck and fills the chambers, increasing the velocity on the deck and below the girders (Figure 7a). At t = 3.55 s (Figure 7b), the water rises and hits the deck top and the velocity magnitude increases at the last girder and the magnitude increases at t = 3.6 s (Figure 7c). At this point the peak vertical impact force is at its maximum and the water starts leaving from the chambers at t = 3.7 s (Figure 7d). The pressure variations at different time steps show an increase in pressure inside chambers as the wave impacts the deck. Figure 8a shows an increase in pressure inside chamber 2 and the peak occurs at t = 3.55 s (Figure 8b), when the pressure increases in the last chamber. At t = 3.6 s (Figure 8c), pressure is uniform in all the chambers causing a pulsating positive force and further reduces in the first chamber as the water starts leaving the last chamber (Figure 8d).

3.2. Effect of Wave Height

The increase in wave height and its effect on the vertical impact force on elevated decks is studied by considering wave heights up to breaking. The wave height is normalized with the water depth, and H/d ratios are chosen from 0.2 to 0.8 at a water depth of 0.35 m. Five airgap positions are selected for study, as the maximum vertical impact forces were expected at these elevated deck positions as observed in Figure 6b. The increasing wave heights are then applied on a deck with girders at the normalized airgaps S/d = 0.11, 0.17, 0.23, 0.29 and 0.34 to study the maximum impact forces acting on the deck. Figure 9a shows the peak values of the vertical impact force at five airgaps for increasing the H/d ratio and it is seen that the peak impact force increases with the increase in the H/d ratio up to a certain wave height and then reduces for all airgaps except for normalized airgap of S/d = 0.11. This is because for S/d = 0.11, the vertical force is mainly due to the hydrostatic force as air entrapment occurs in this case.
For normalized airgaps (S/d = 0.17, 0.23, 0.29 and 0.34), the peak vertical impact force reduces after attaining the peak. To find the reason behind the decrease, the wave structure interaction at different wave heights and airgaps is investigated. A wave probe located at a distance x = 4.8 m in the NWT is used to plot the wave elevation time history behind the structure. The wave elevation has been normalized with the water depth for plotting the time history. The wave elevation time history (Figure 10) shows the interaction of the wave with the deck at different airgaps. It is seen that the peak vertical impact force depends on both wave height and airgap. For S/d = 0.11, 0.17, 0.23, and 0.29, the peak vertical impact force is obtained for wave heights = 0.8d (Figure 10a), 0.6d (Figure 10b), 0.5d (Figure 10c), and 0.4d (Figure 10d), respectively. Hence, it is understood that the maximum vertical impact force due to air entrapment will occur for a specific wave height for a given airgap. As the wave height increases beyond a certain value for a given airgap, the wave starts hitting the sides rather than the bottom of the deck, resulting in a reduction in air entrapment and in vertical force as seen in Figure 9a and increase in the horizontal force as seen in Figure 9b. The maximum horizontal impact force is observed at around H/d of 0.7 (Figure 9b).

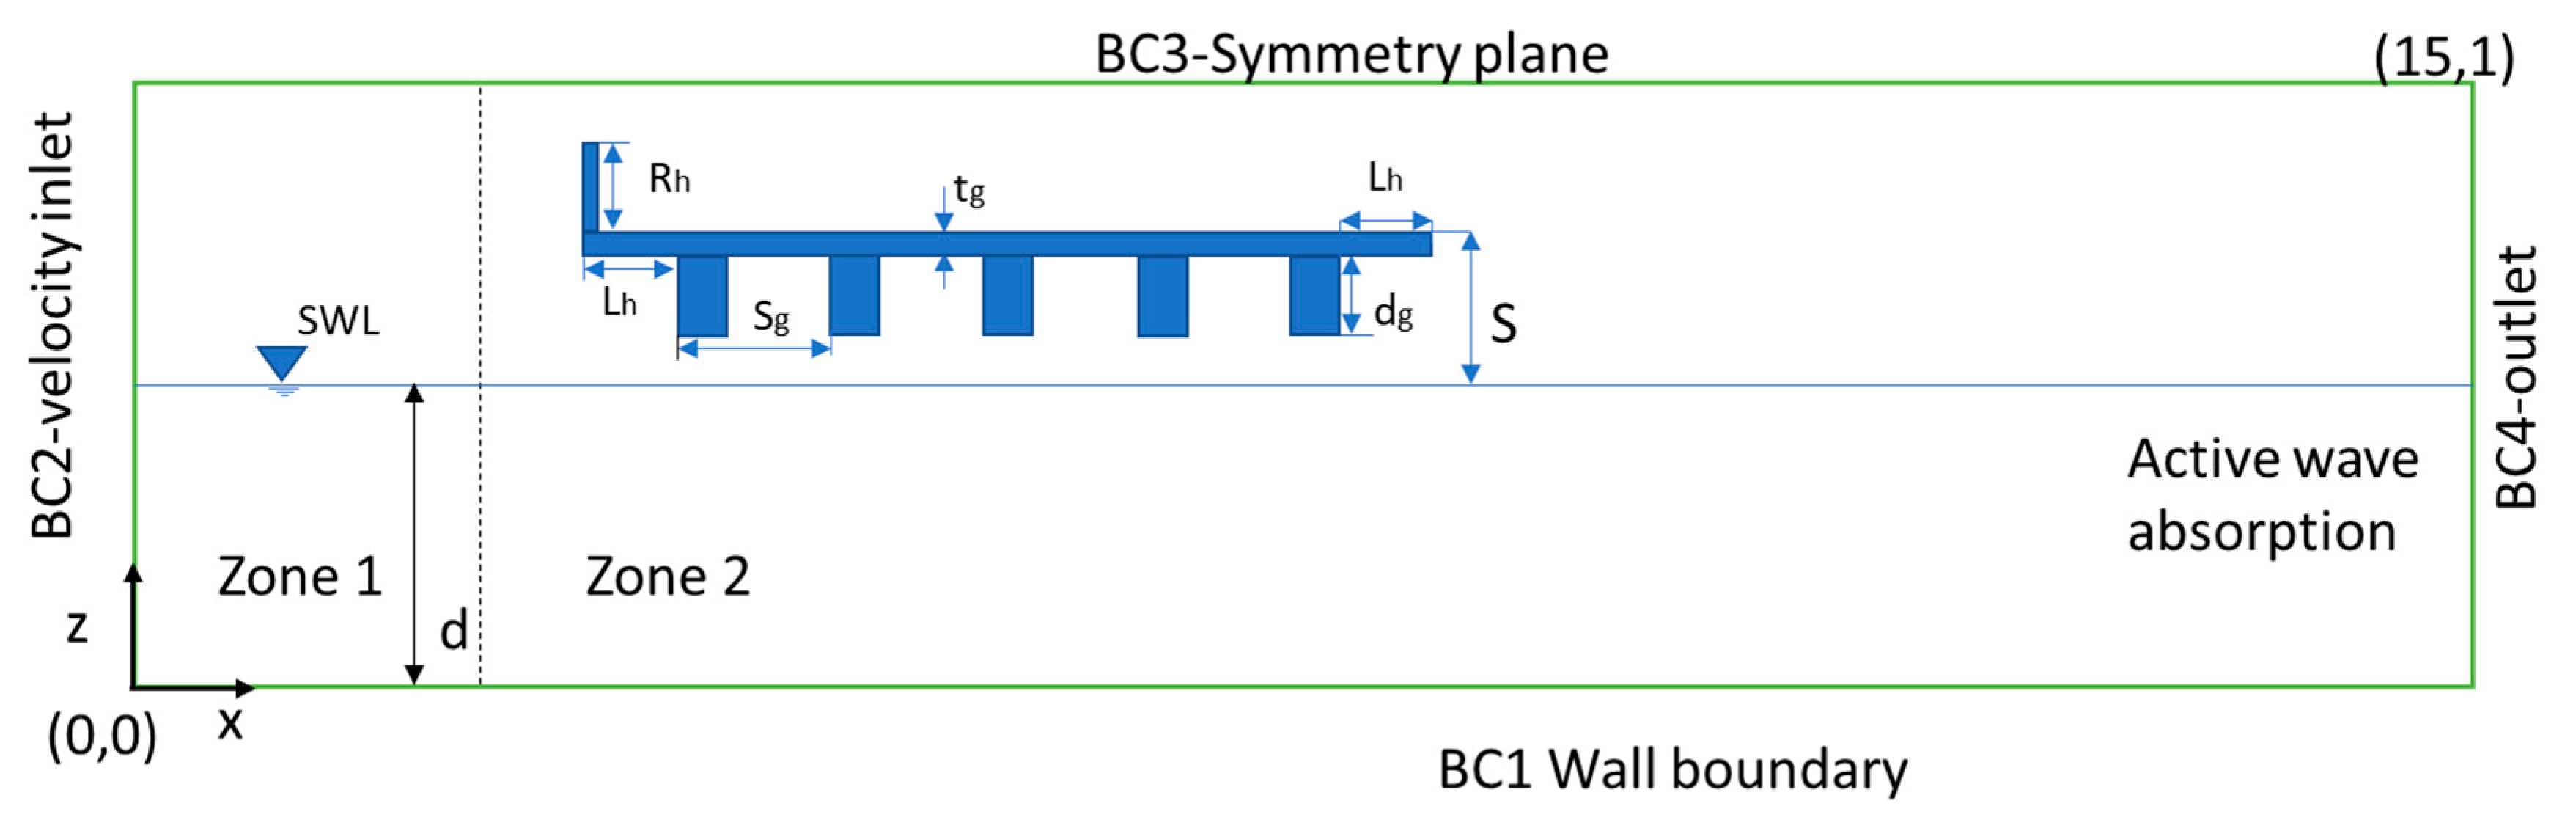
3.3. Effect of Girder Spacing and Thickness

The role of girders in increasing the vertical impact force is discussed in the previous section by comparing the flat deck with the girders. In this section, the effect of girder spacing (Sg) and girder depth (dg) on vertical impact force is studied. First, the study is carried out by changing the girder spacing that is usually uniform across the width and depends on the girder depth. The girder spacing and depth are proportional considering the structural design aspect where for a specific deck width, the number of girders will increase or decrease based on the girder spacing adopted. For the present study, the deck width is kept constant, and the girder spacing is varied (Sg = 0.21, 0.26 and 0.35 m) by changing the number of girders (n = 6, 5, and 4). For each girder spacing, the peak vertical impact force is obtained for three normalized airgaps (S/d = 0.17, 0.23 and 0.29) for wave heights, H = 0.3d to 0.5d. The peak vertical impact force at various girder spacings, Sg at different normalized airgaps is shown in Figure 11. The peak vertical impact force variations for an increase in girder spacing at S/d = 0.17 (Figure 11) are of similar magnitude for the different wave heights. As the S/d ratio increases to 0.23 (Figure 11), the peak vertical impact force is higher for wave height H = 0.4d and is increasing with the reduction in girder spacing and the trend is similar for H = 0.5d, whereas little variation of impact force with respect to girder spacing is seen for H = 0.3d. For S/d = 0.29, the peak vertical impact force is recorded for wave height H = 0.5d and increases at a faster rate with reduction of spacing, whereas the force shows a lower rate of the increasing trend with a reduction in spacing for wave heights, H = 0.3d and 0.4d. The rate of increase in peak vertical impact force is higher for higher airgaps (S/d). This shows that larger wave heights with lesser girder spacing will provide maximum vertical impact force on bridges with girders due to increased air entrapment inside the chambers.
As the spacing and girder depth depend on each other, the vertical impact force due to the variation of girder depth with varying wave height and airgap has been investigated. Girder depth (dg = 0.08, 0.1 and 0.12 m) is considered for the girder spacings (Sg) of 0.21, 0.26 and 0.35 m (n = 6, 5 and 4) for increasing wave heights (H = 0.2 to 0.5d) at different normalized airgaps (S/d = 0.17, 0.23 and 0.3). At S/d = 0.29, the peak vertical impact force at different girder spacing is higher with dg = 0.12 m for H = 0.5d (Figure 12a), whereas, dg = 0.1 m is giving higher impact for H = 0.3d and 0.4d (Figure 12b,c). Further considering S/d = 0.23, the peak vertical impact force is higher for dg = 0.1 m and 0.08 m for reduced girder spacing (Sg = 0.21 and 0.26 m) at H = 0.5d and 0.4d (Figure 12a,b). When the airgap is further reduced (S/d = 0.17), the peak impact is higher for dg = 0.12 for all spacings with increasing wave heights (Figure 12). The rate of peak vertical impact force increase is not altered with different girder depths, suggesting that increasing girder depth does not have a significant effect on the peak vertical impact force. Thus, it can be concluded that larger girder spacing by increasing girder depth can be adopted for maintaining less vertical impact force on deck.
Principal component analysis (PCA) is carried out to obtain the inter dependency of different parameters like the girder depth, spacing and airgap effect on the peak vertical impact force. The analysis is carried out for different Sg/H ratios with varying girder depth at three different airgaps (S/d = 0.17,0.23 and 0.29). Component loadings obtained for the first two principal components (PC) account for the highest amount of total variance and is retained for analysis. The loading plots for the first two PC’s for different airgaps are presented in Figure 13. The PC1 analysis shows that the girder depth, spacing and airgap proportionally increase the peak vertical impact force, whereas PC2 give more weightage to three airgap conditions, S/d = 0.17, 0.23 and 0.29 when the girder depth is 0.08, 0.12 and 0.12, respectively. A positive correlation of three cases shows that reduced spacing and larger girder depth affect the vertical impact force. Peak vertical impact force increases with a decrease in girder spacing and an increase in girder depth depending on the wave height.

3.4. Effect of Railing and Overhang

The effect of railing height (Rh = 0.08 m) and overhang length (Lh = 1 m) of the bridge deck (Figure 4) on the peak vertical impact force is studied by comparing to deck without railing and overhang (Figure 5b). The deck is subjected to solitary waves of heights, H = 0.3d to 0.5d and the peak vertical impact force at different normalized airgaps (S/d = 0.17, 0.23 and 0.29) is plotted (Figure 14).
At S/d = 0.17 (Figure 14a), the peak vertical impact force is higher for the deck with railings and overhang, and increases for larger H/d ratios. For the different wave heights considered, an average increase of 8% is observed in the peak vertical impact force. This increase in peak vertical impact force is expected due to the increased surface area by the railing and overhang. In case of a higher normalized airgap (S/d = 0.23), a higher peak vertical impact force is observed for the deck without railing and overhang for different wave heights (Figure 14b). For S/d = 0.29, the peak vertical impact forces on deck (Figure 14c) with railing and overhang are decreased for increasing wave heights, as the wave impacts the railing first, allowing less water for air entrapment inside the chambers. It is observed that the railing and overhang redistribute the water and reduce the air entrapment inside the chambers, leading to a reduction in the peak vertical impact force. For a higher H/d ratio, the peak vertical impact force is reduced due to less air entrapment inside chambers for a deck with railing and overhang while this, in turn, can increase the horizontal impact force.

4. Conclusions

The vertical impact force on a coastal bridge deck is investigated using REEF3D. A detailed parametric study is carried out to analyze the variation of vertical impact force under different scenarios. The following conclusions were drawn from the present study:
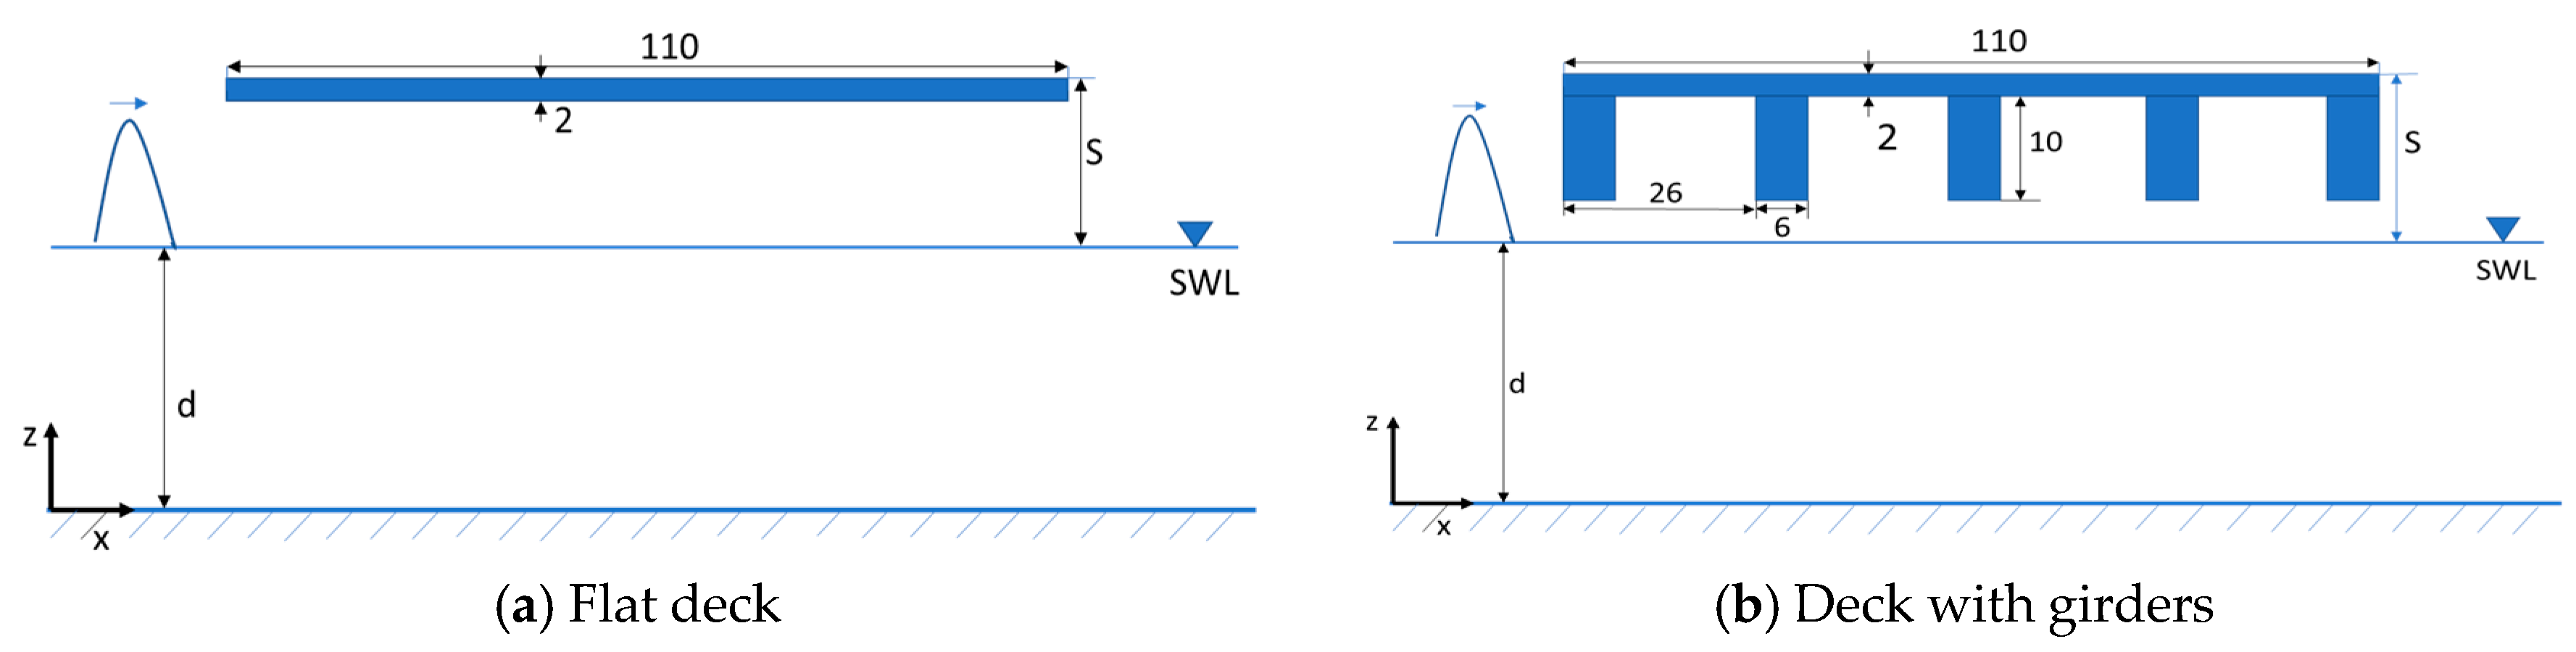
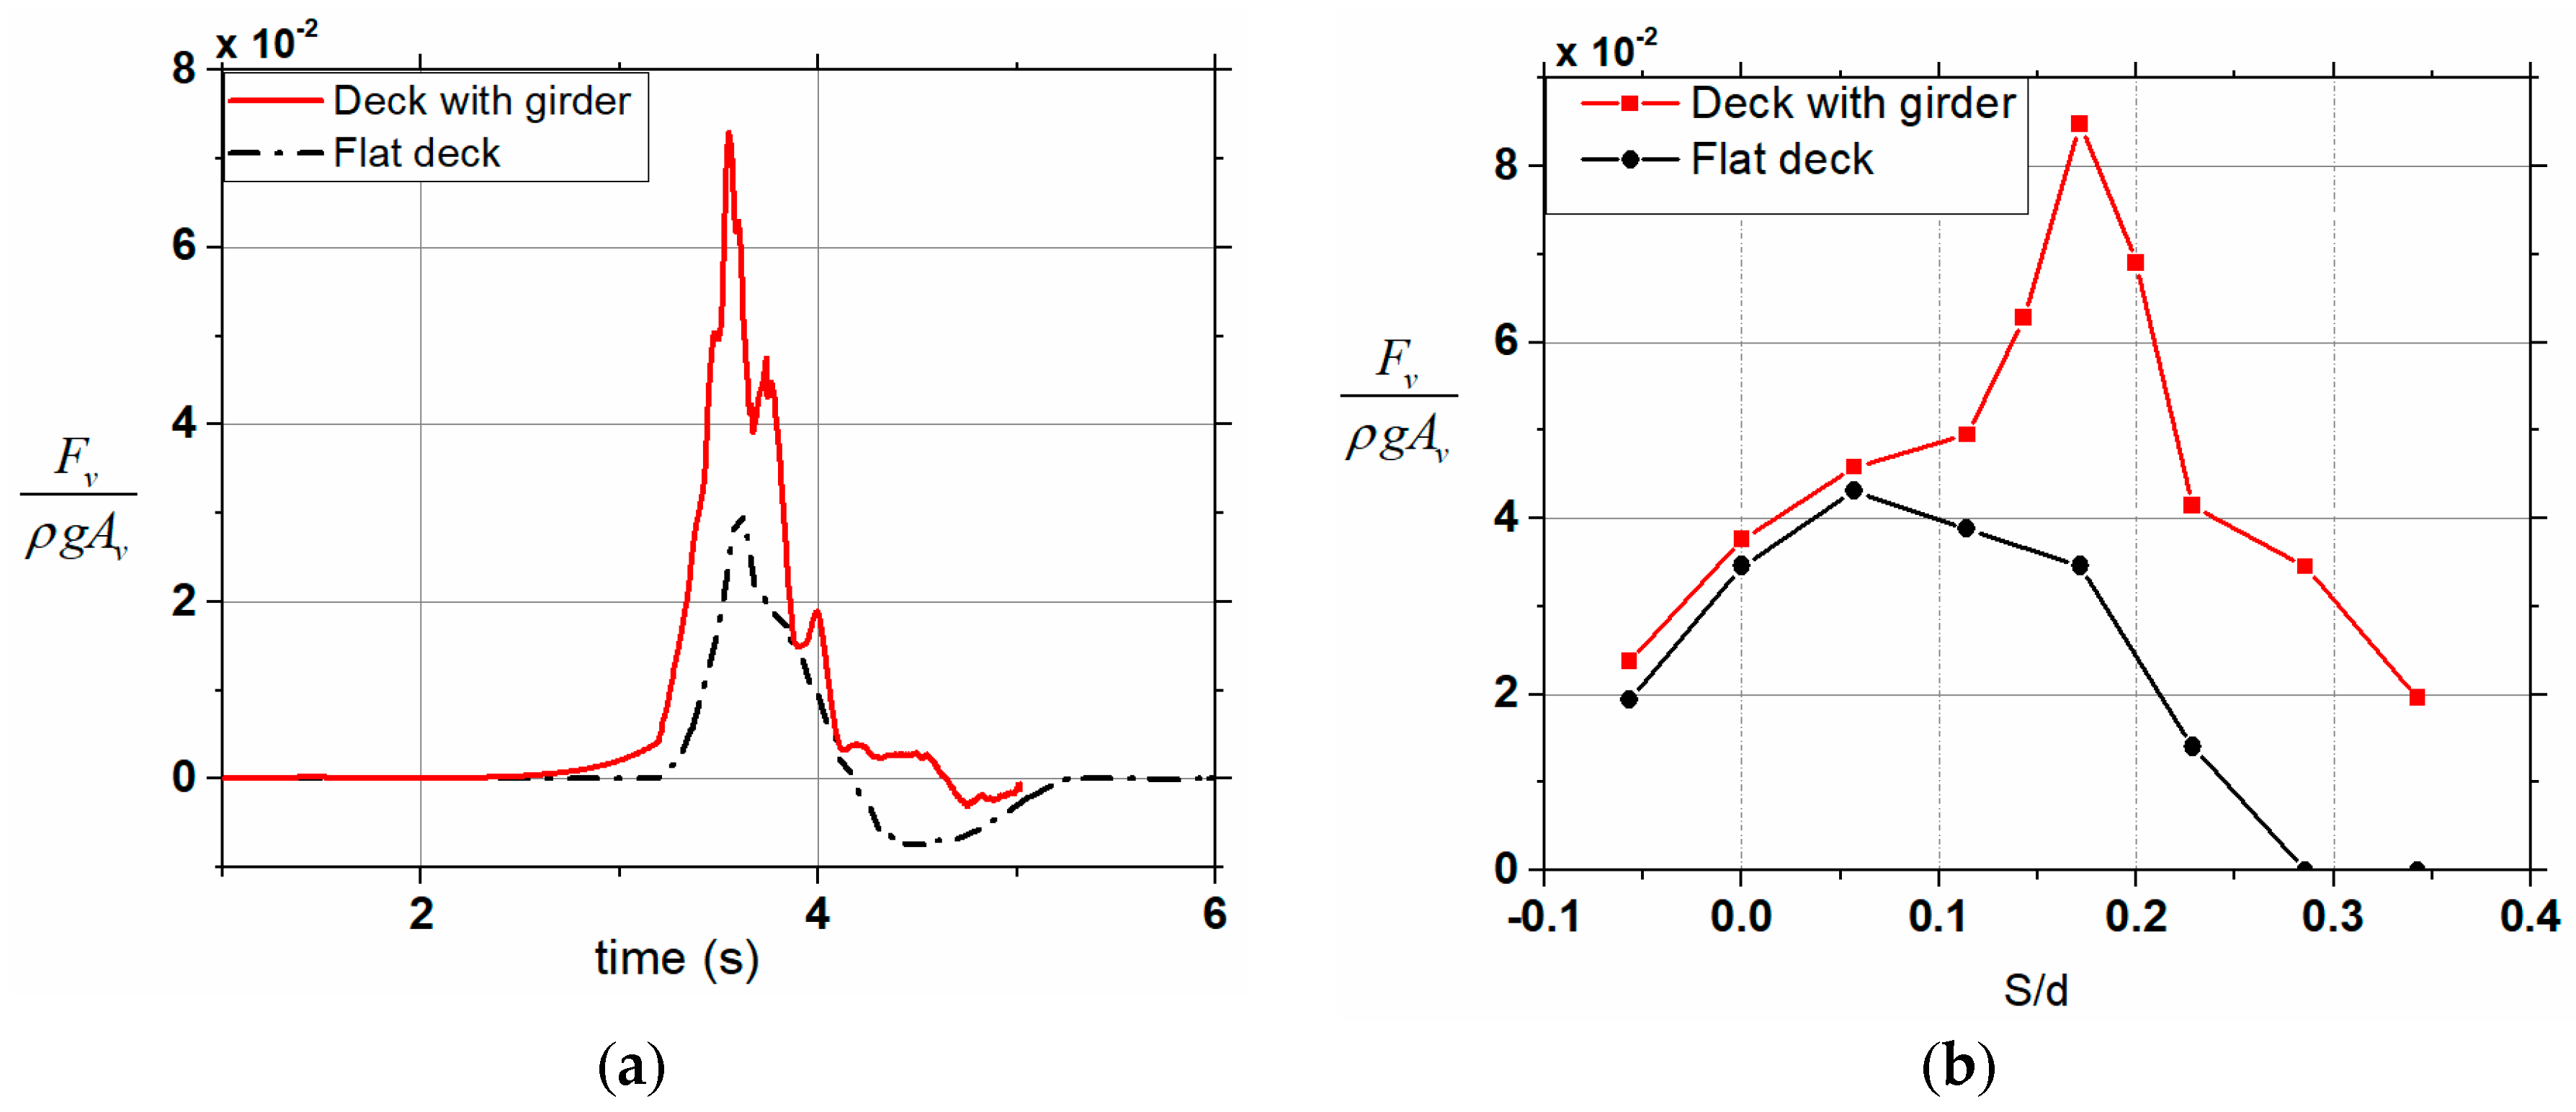
  • The vertical impact force on a flat deck and a deck with girders are observed to be the same under submerged conditions while for elevated cases, decks with girders have a higher impact force due to air entrapment inside chambers. As the airgap increases, there is a sudden increase of vertical impact force for the decks with girders due to air entrapment forces, which reduces with a further increase of the airgap.
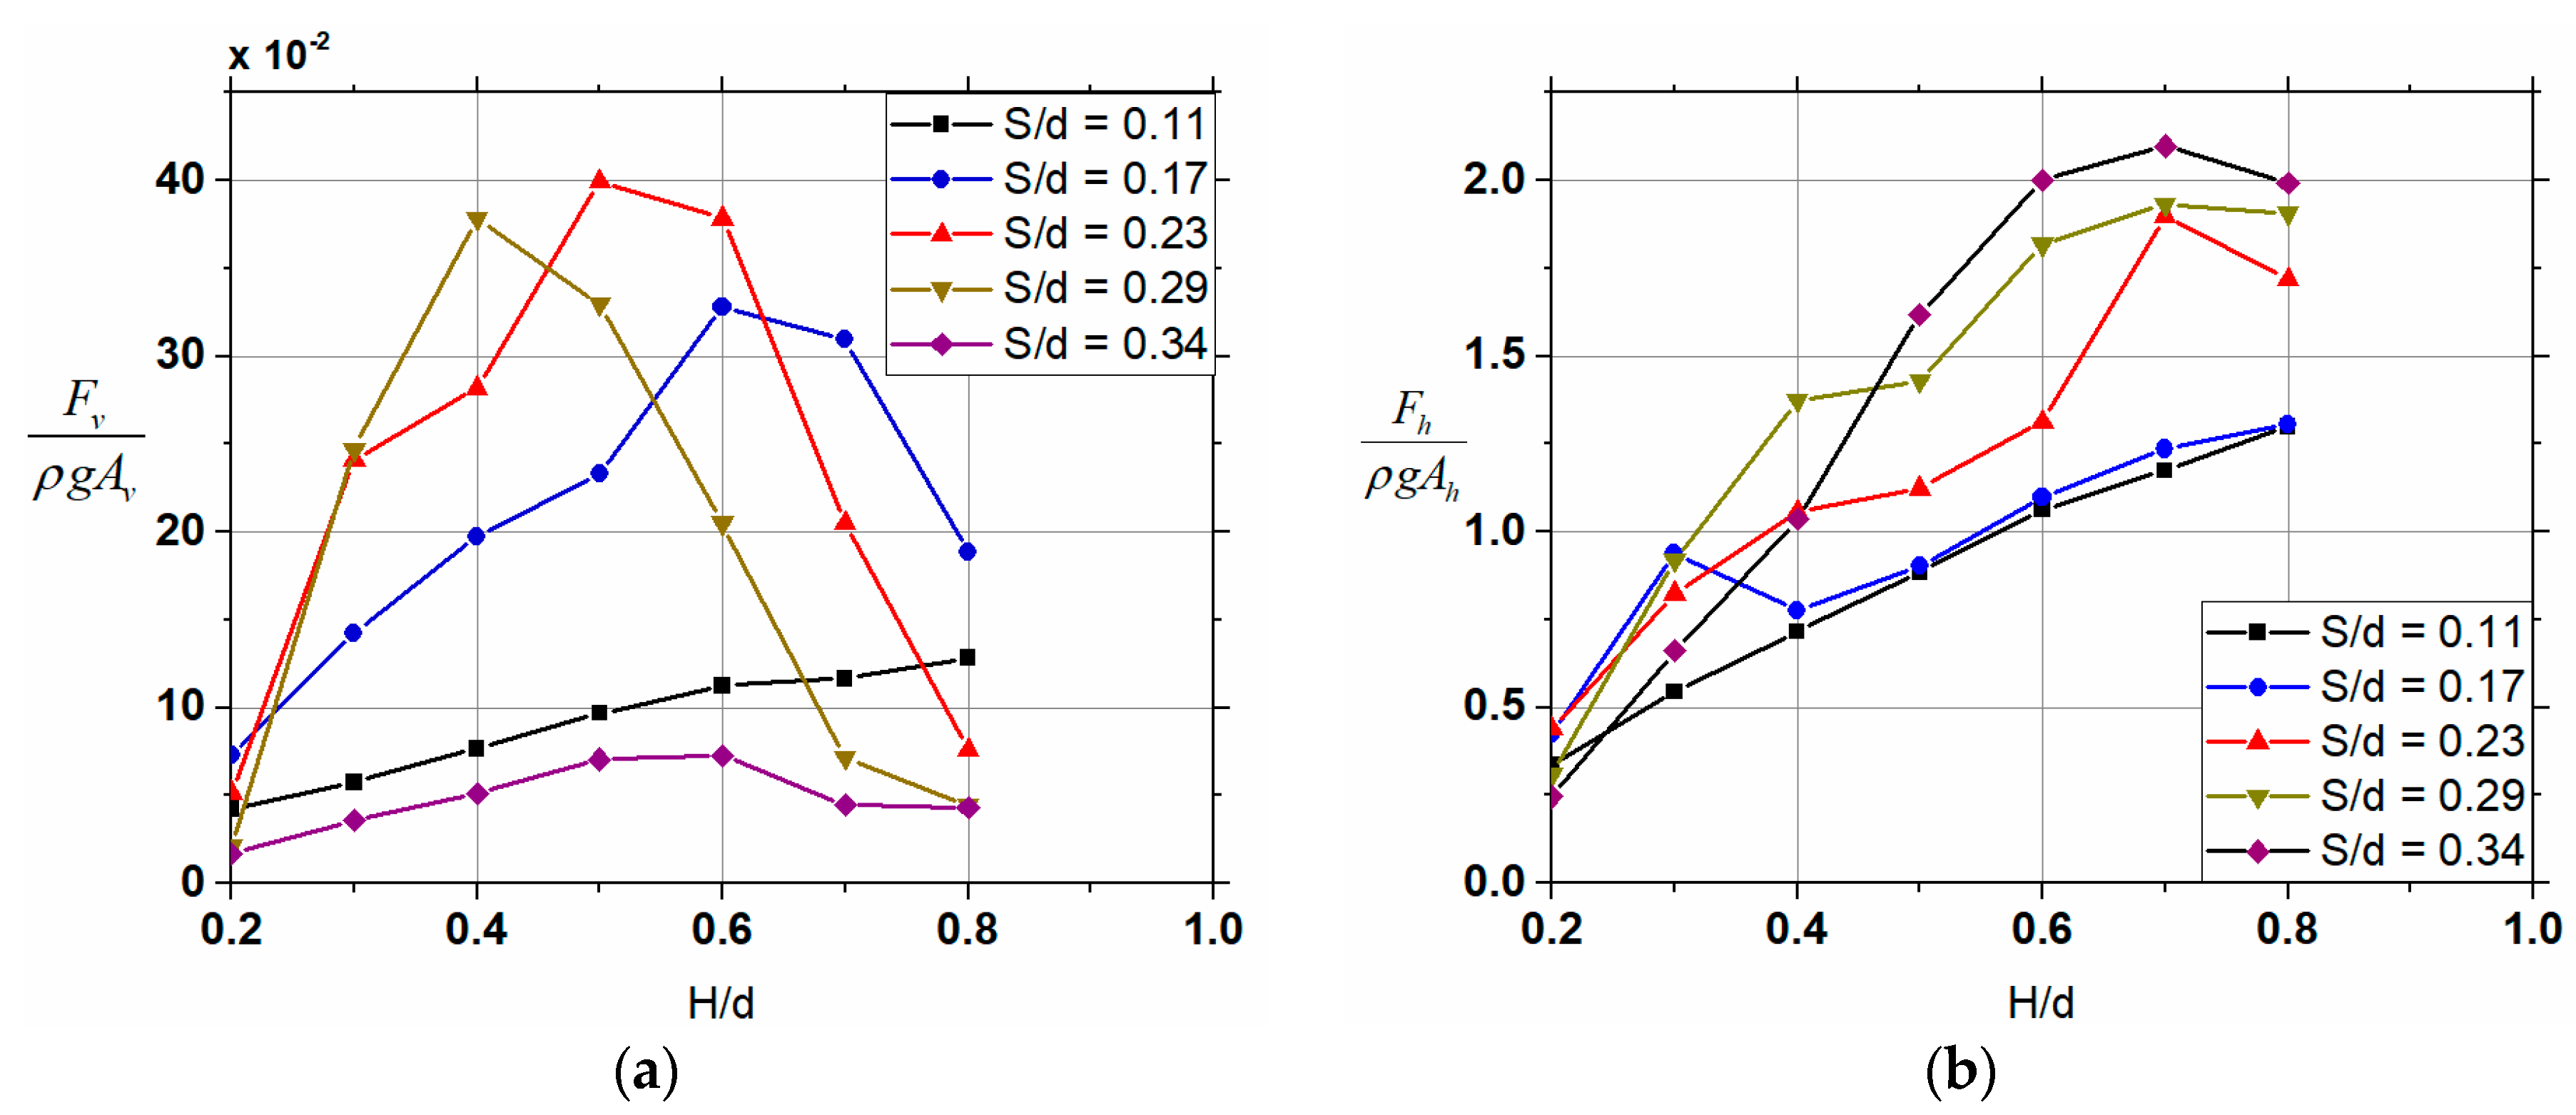
  • The peak vertical impact force increases with the increase in the H/d ratio and reduces afterwards for different airgaps. For larger wave heights, the vertical impact force is reduced at higher airgaps as the sudden impact occurs at the deck sides, increasing the horizontal impact force and reducing the force due to air entrapment.
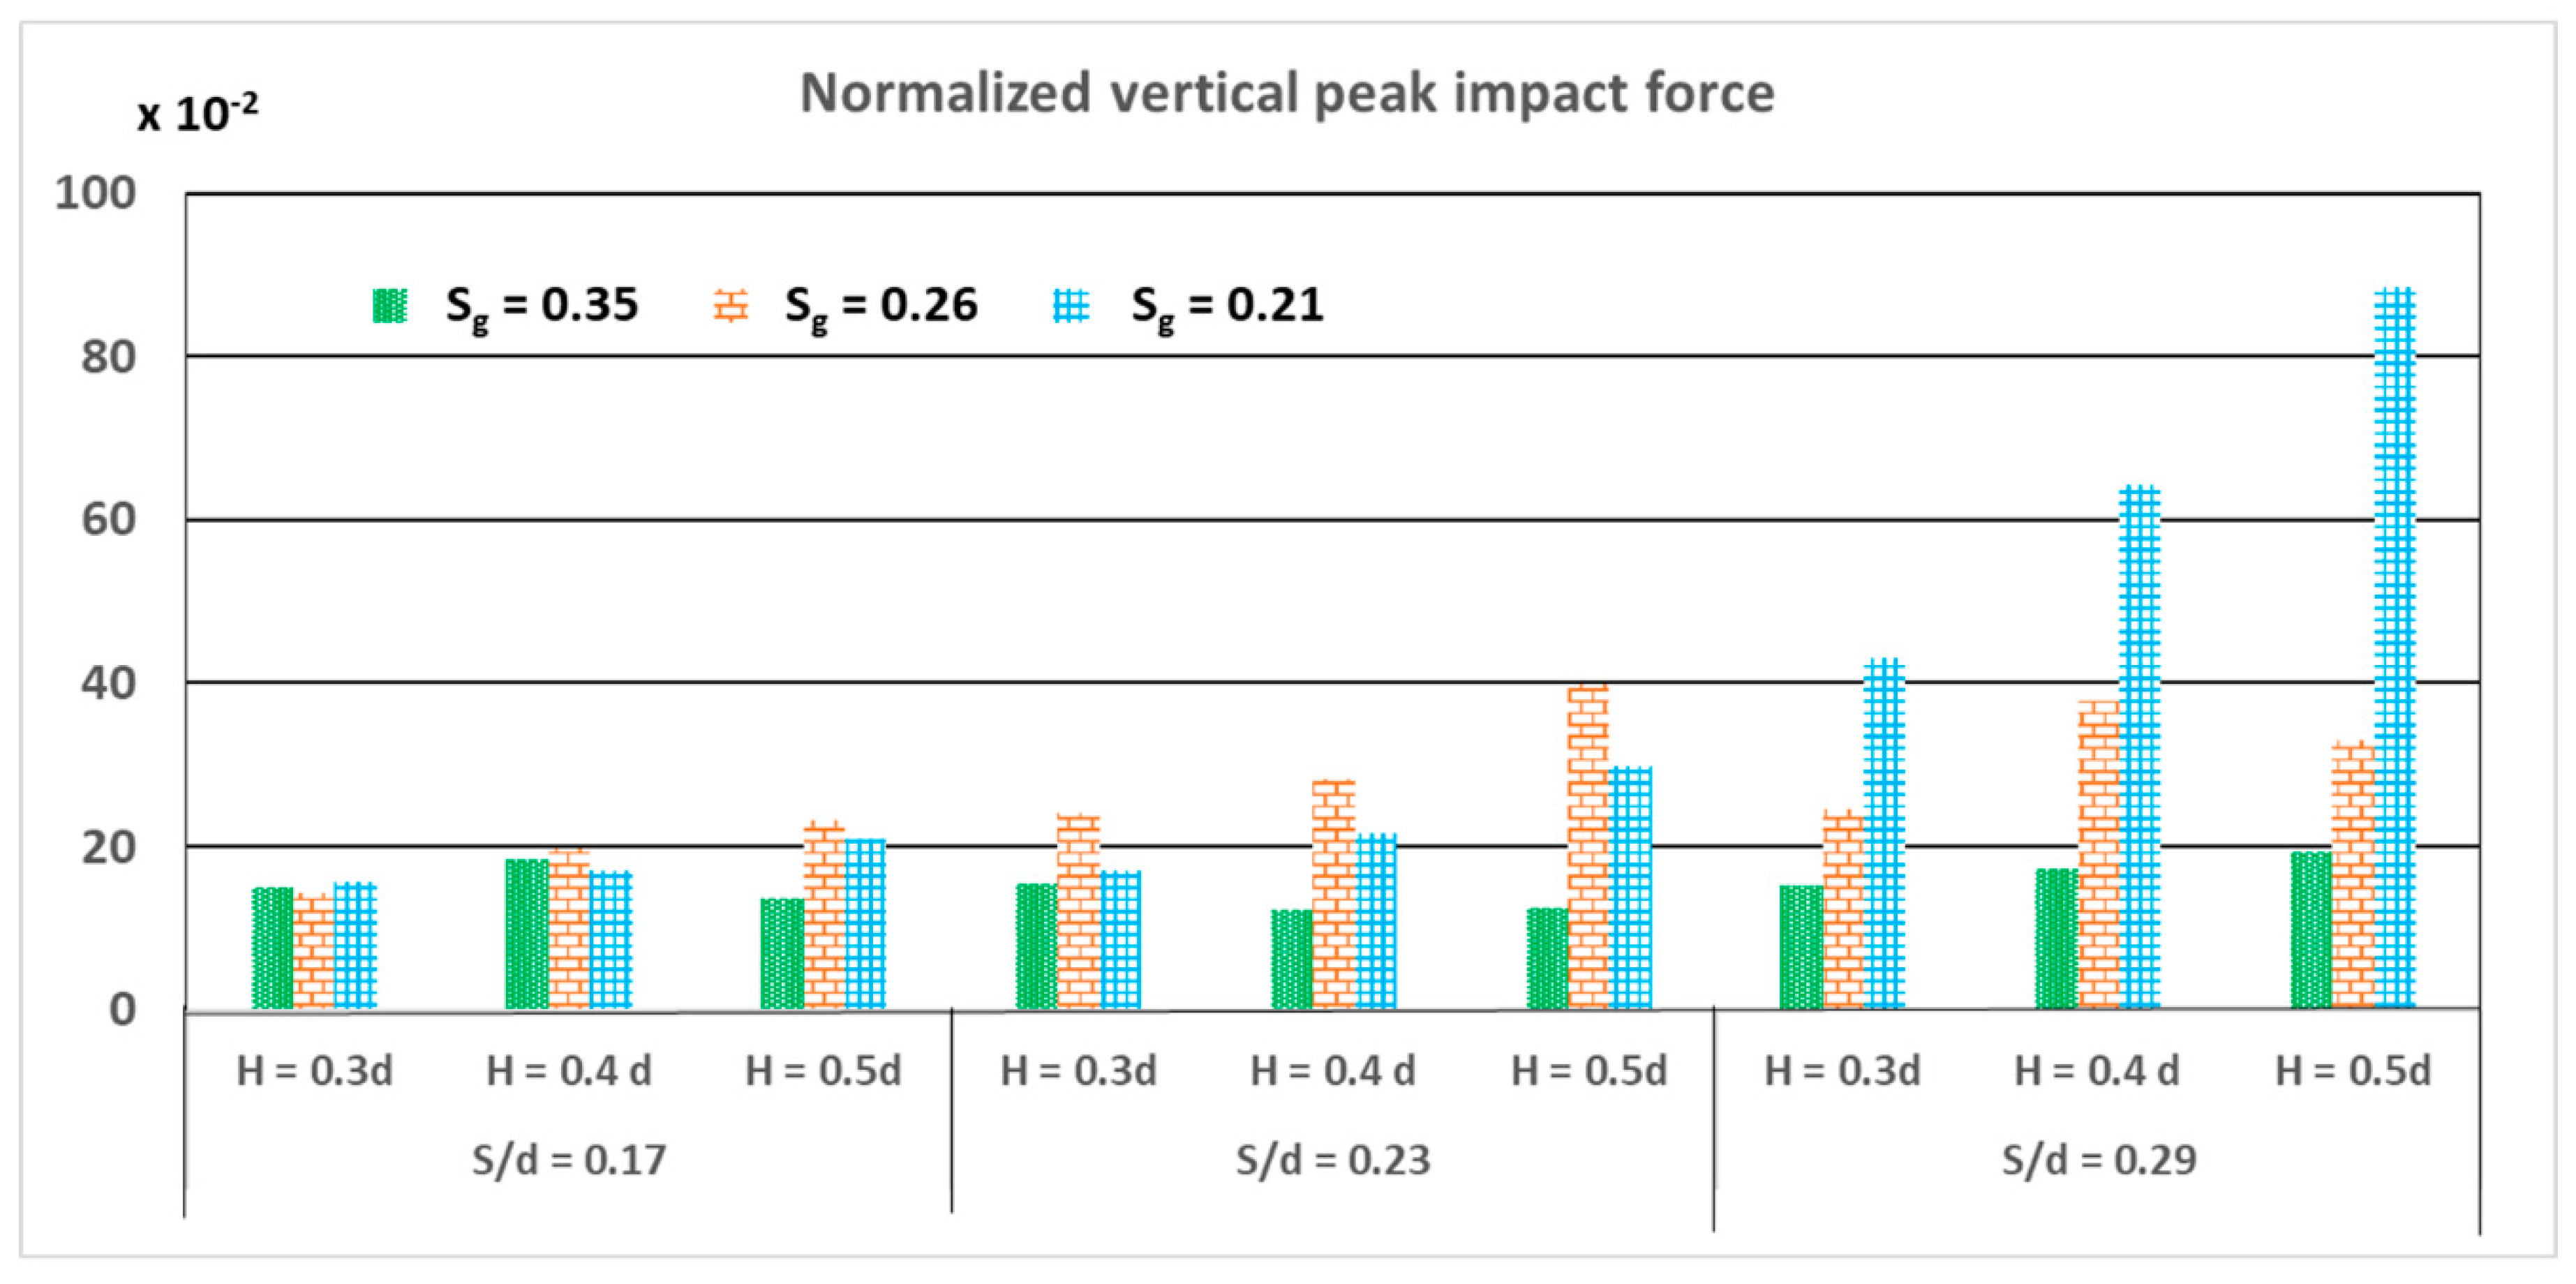
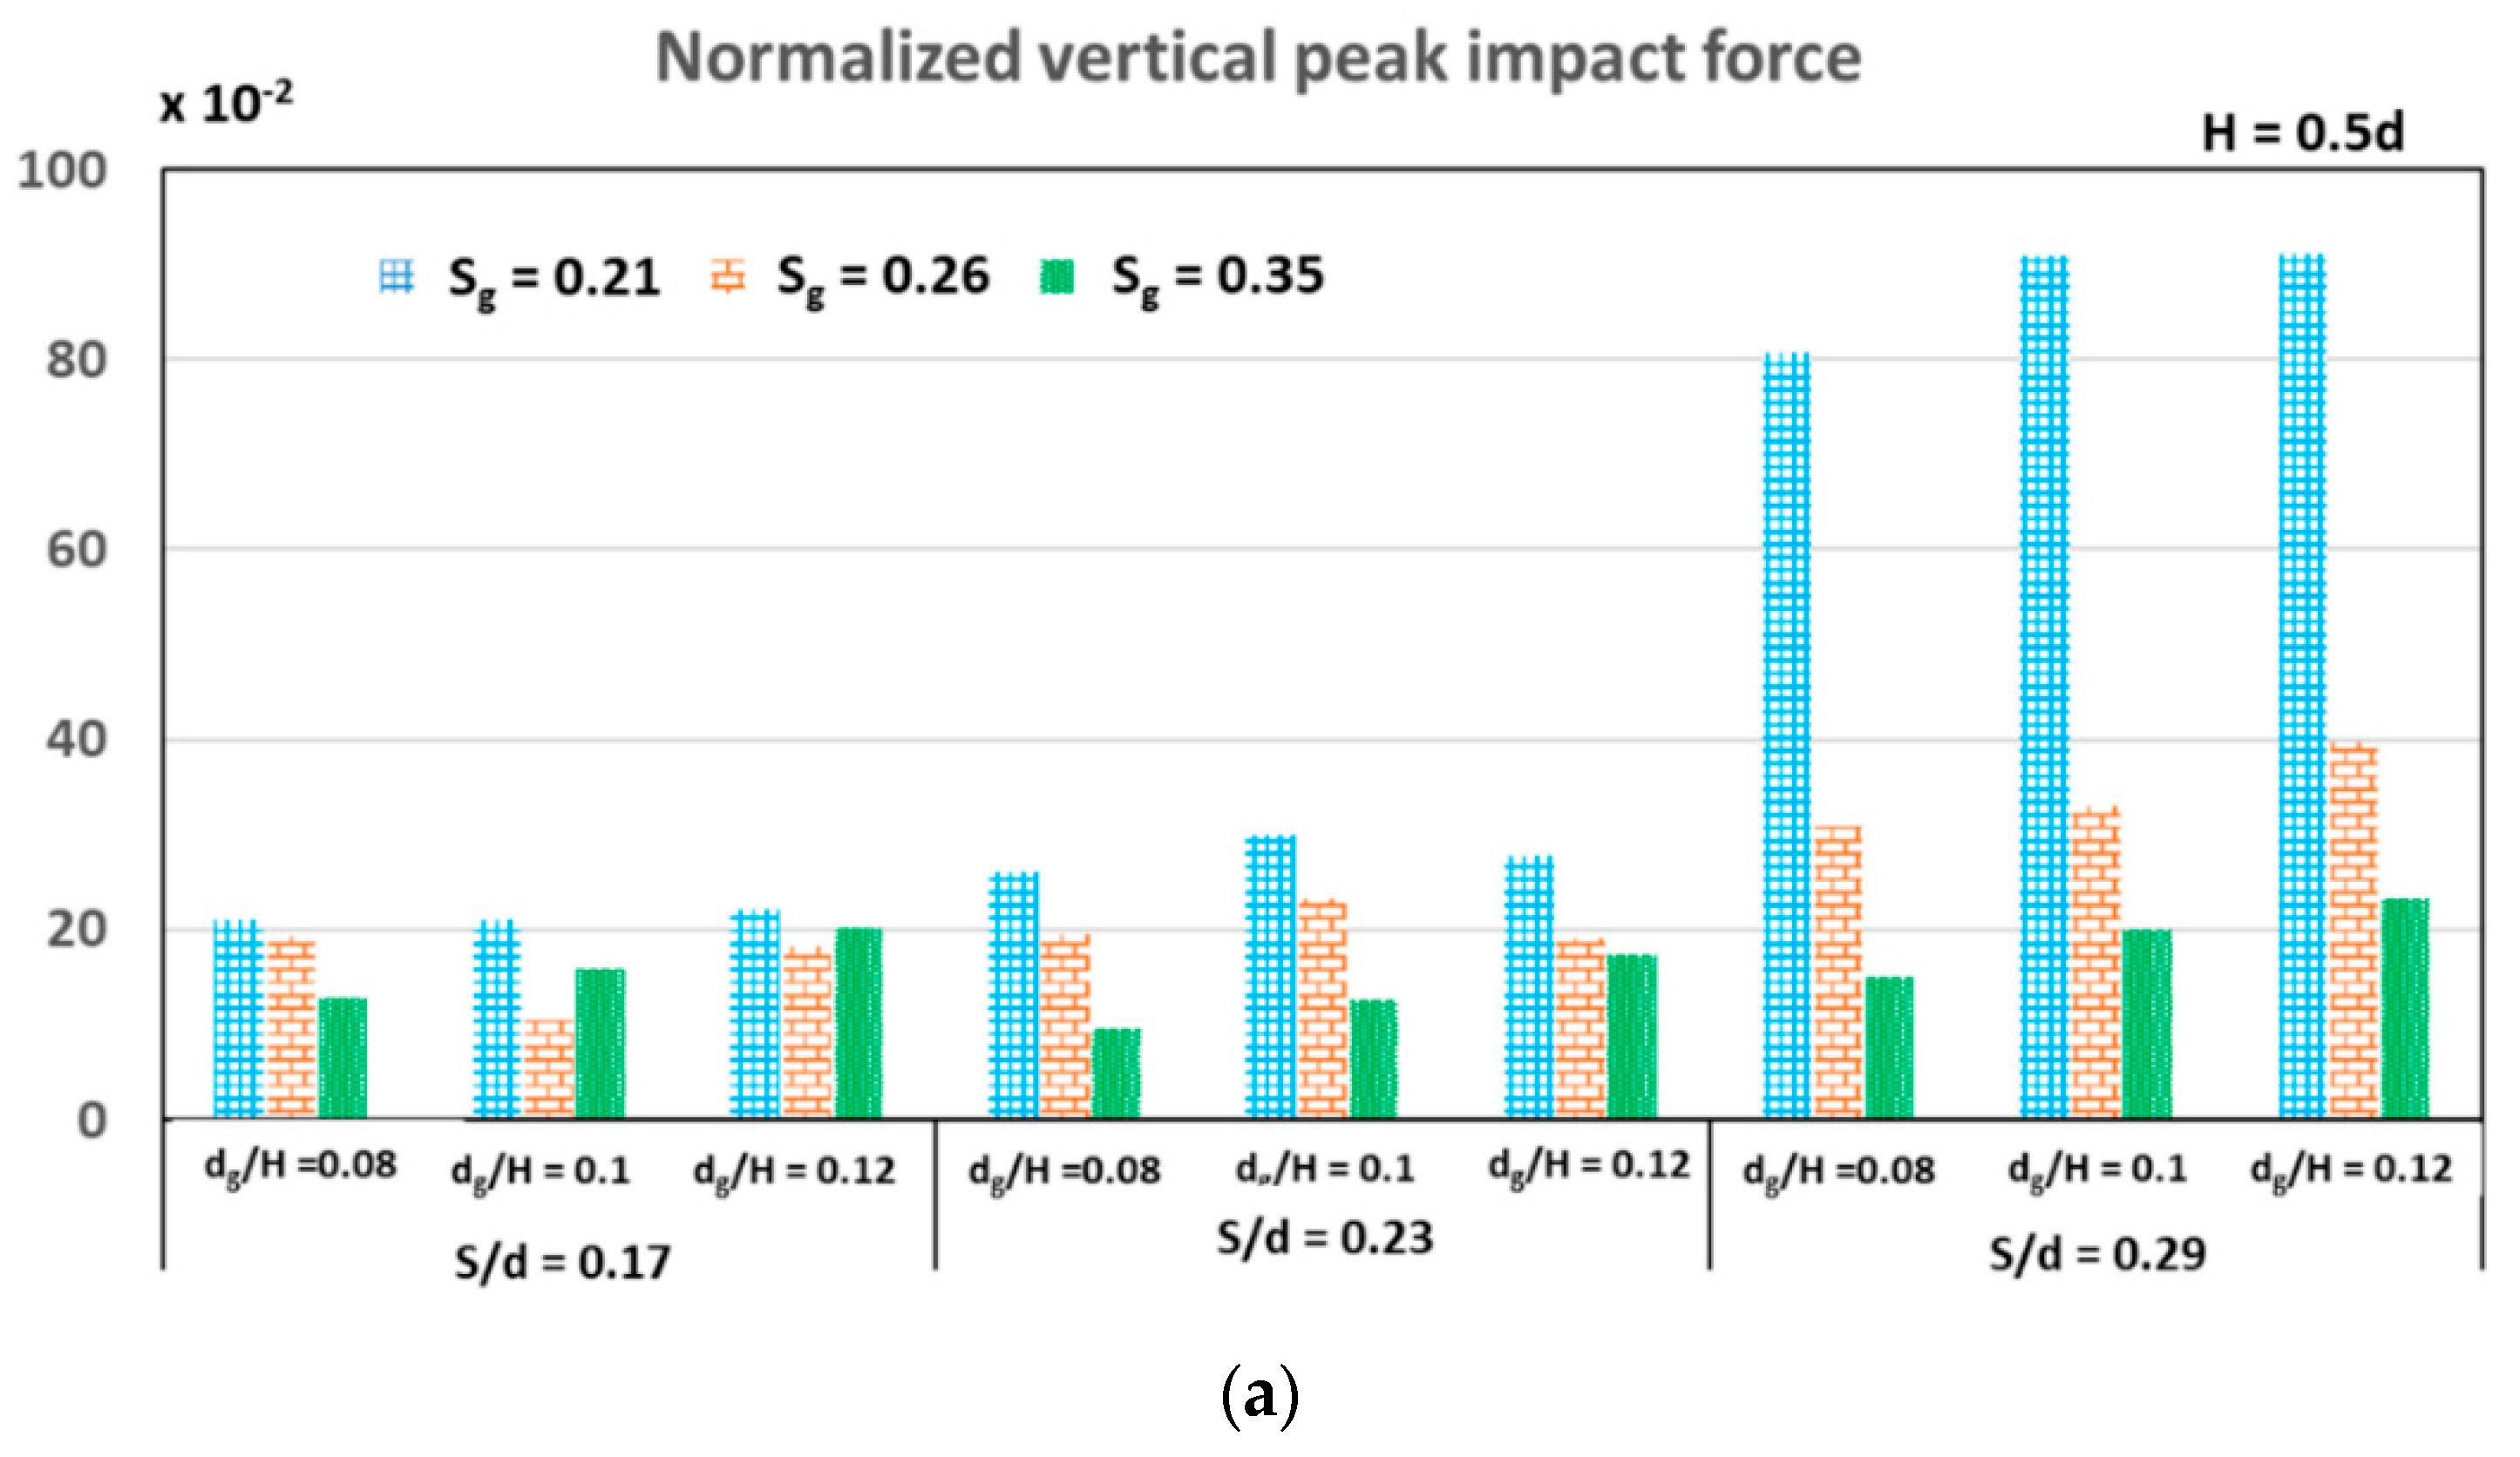
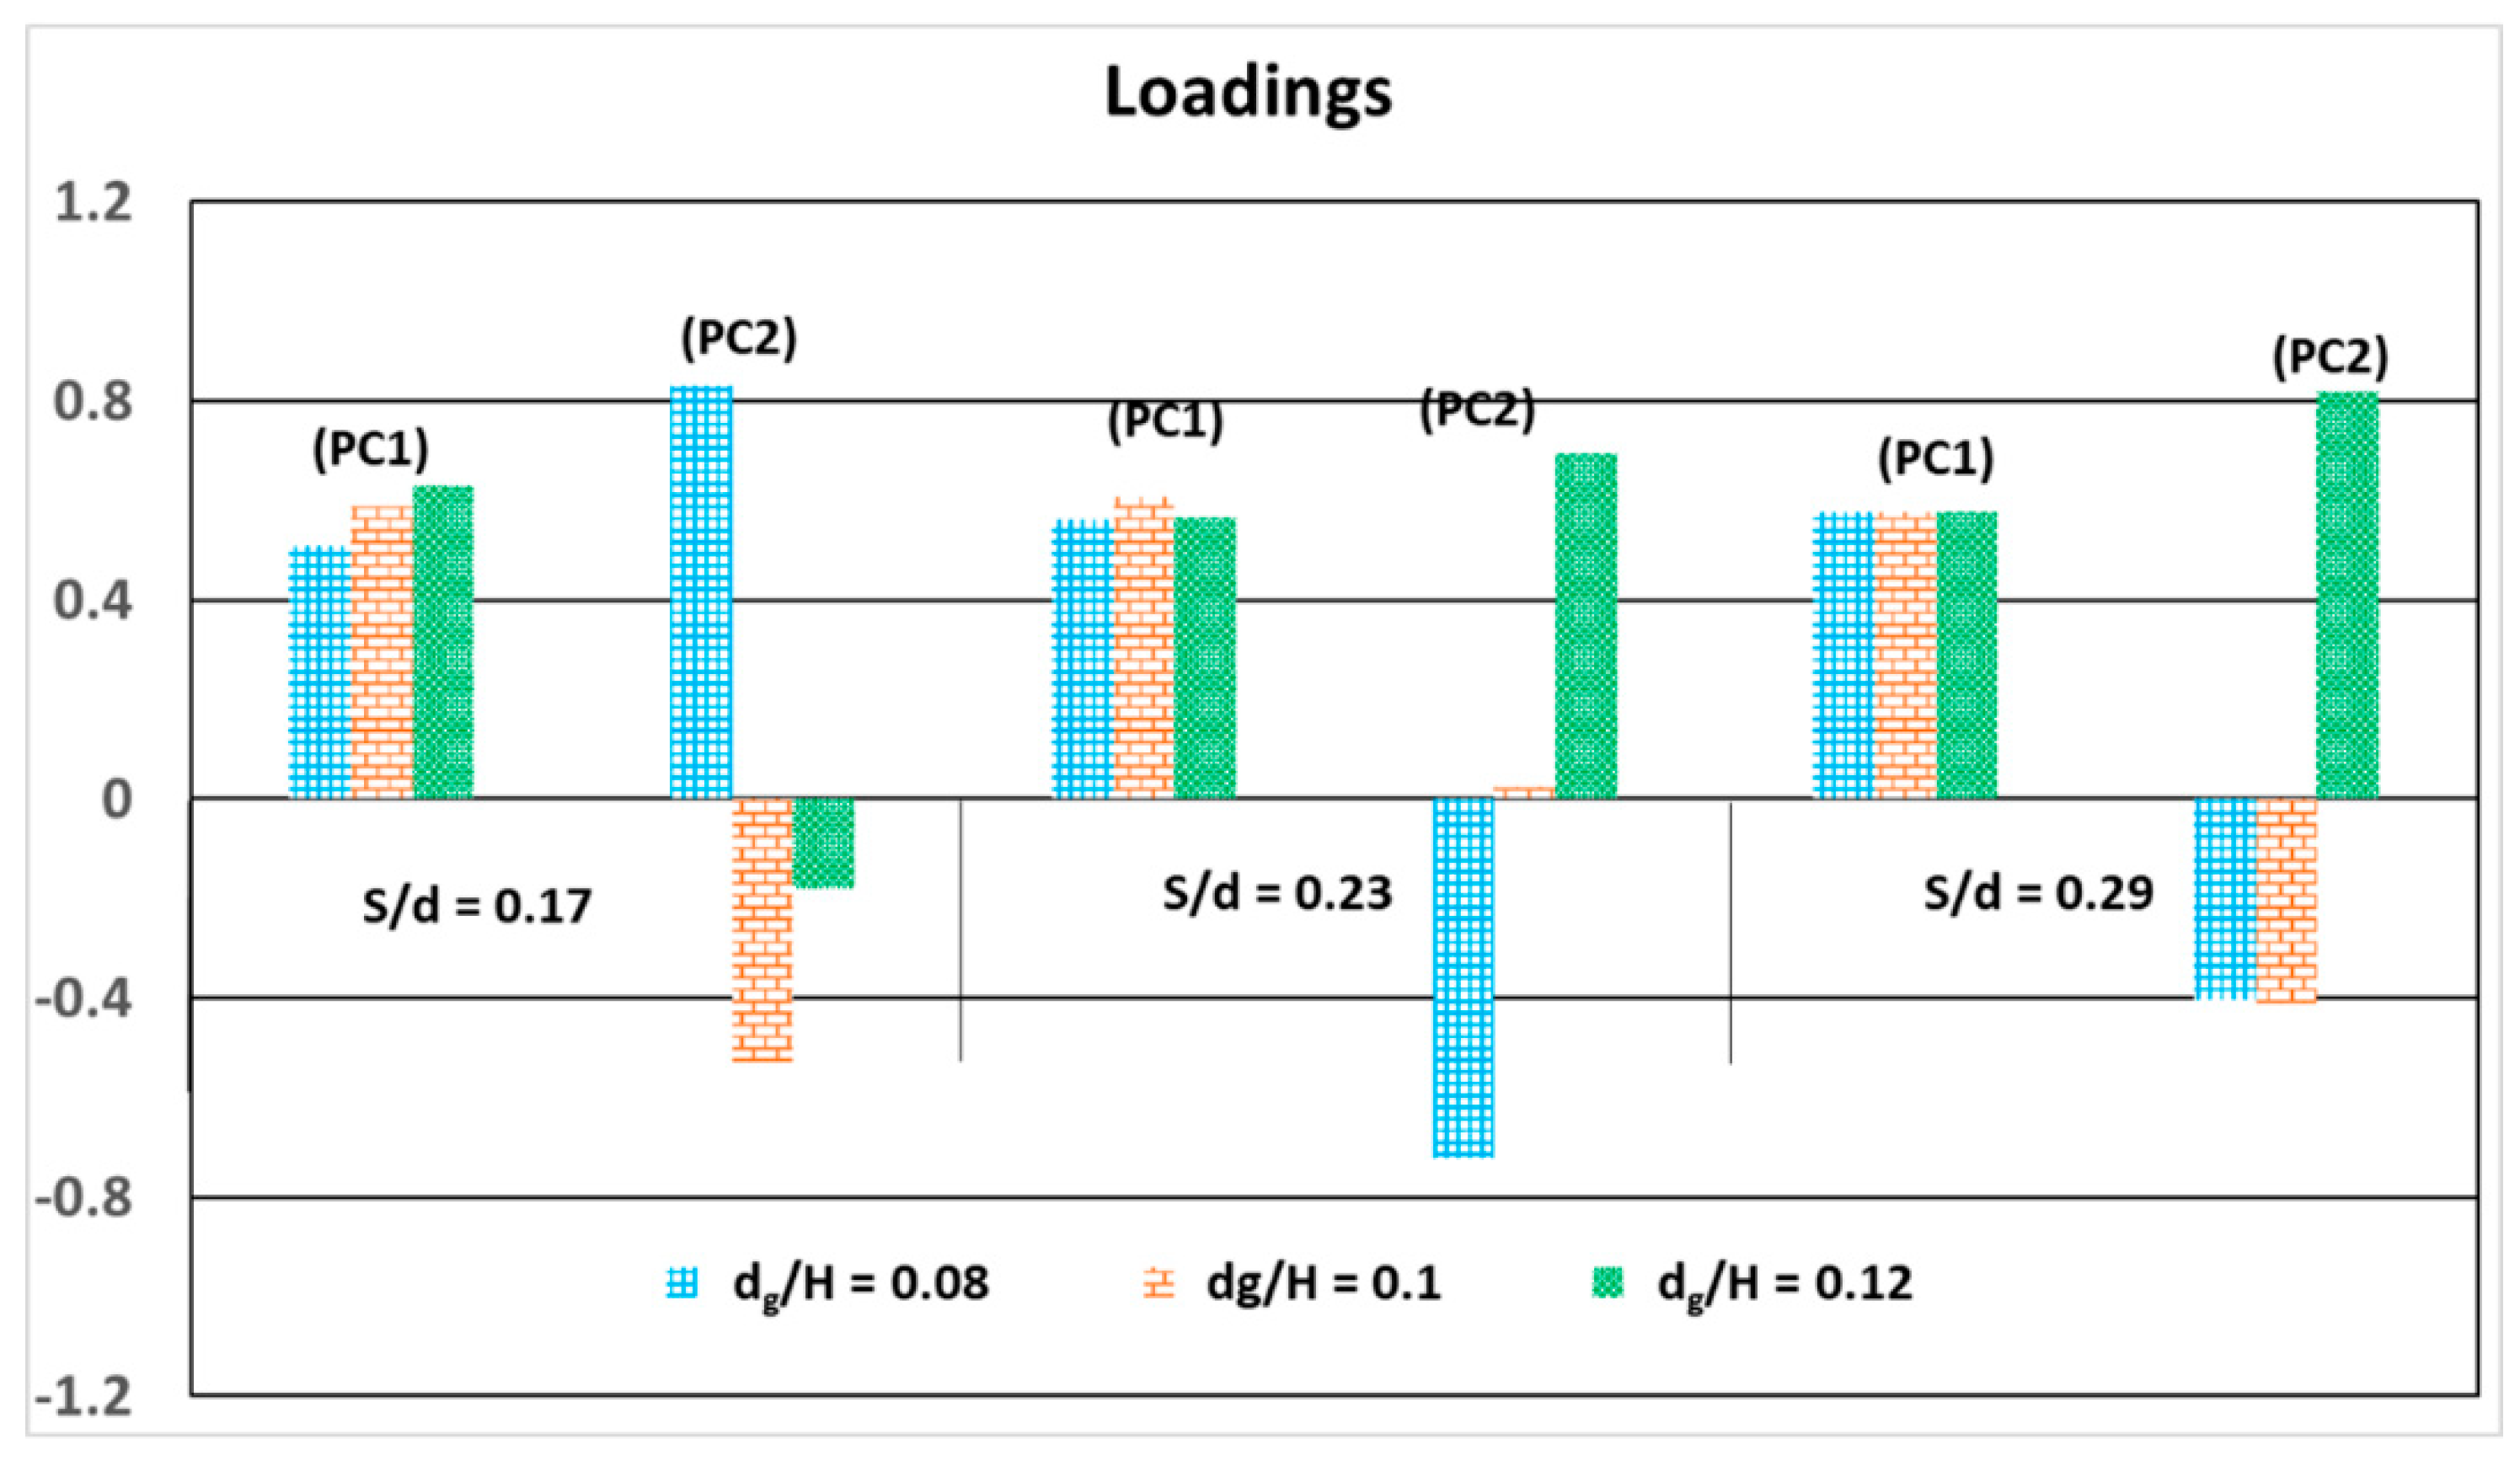
  • The reduction in girder spacing can cause large vertical impact forces on the deck for larger wave heights due to higher air entrapment. It is observed that for Sg/H greater than 2, the peak vertical impact force has less dependence on girder spacing for different airgaps considered and for Sg/H lower than 2, the peak vertical impact force increases drastically for higher airgaps. The PCA analysis carried out to investigate the inter-dependency of parameters shows large variability in the peak vertical impact force with reduced spacing and increased girder depth.
  • The effect of the girder depth on the peak vertical impact force is not substantial. Thus, girders with larger spacing and depths can be adopted in order to reduce the vertical impact force.
  • The provision of railing and overhang on the deck allows less water into the chamber between the girders and reduces the air entrapment.
  • The maximum vertical impact force observed at higher airgaps can be reduced by providing railing and overhang on the deck.
The peak vertical impact force due to non-breaking solitary wave impact on the coastal bridge deck is presented considering the effect of girders, girder spacing and depth with varying airgaps. The study will be useful for design optimization of coastal bridge decks under extreme weather conditions.

Author Contributions

Conceptualization, R.M. and M.R.B.; Methodology, R.M.; software, H.B.; Validation, A.K., R.M. and H.B.; Formal analysis, investigation, writing—original draft preparation, R.M.; writing—review and editing, M.R.B.; Visualization, supervision, M.R.B.

Funding

This research is carried out as part of the PhD Thesis work of Rameeza Moideen with financial assistance from Ministry of Human Resource Development (MHRD), Govt. of India.

Conflicts of Interest

The authors declare no conflict of interest. The funders had no role in the design of the study; in the collection, analyses, or interpretation of data; in the writing of the manuscript, or in the decision to publish the results.

Abbreviation

aamplitude
AhHorizontal Projected area of flat deck
AvVertical Projected area of flat deck
Bwidth of the plate
dwater depth
dggirder depth
FhHorizontal impact force per unit width
FvVertical impact force per unit width
gacceleration due to gravity
Hwave height
LhOverhang Length
LpLength of plate
PPressure
RhRailing height
Sairgap measured from SWL to the top of the deck
SgSpacing of girders
tinstantaneous time
tpplate thickness
xhorizontal distance
ρFluid density
ηWave elevation
Δxmesh size
Δttime step

References

  1. Pile, J.; Hansom, J.D.; Switzer, A.D. Extreme Waves: Causes, Characteristics and Impact on Coastal Environments and Society. In Coastal and Marine Hazards, Risks, and Disasters; Chapter 11; Elsevier: Amsterdam, The Netherlands, 2015; pp. 307–330. [Google Scholar]
  2. French, J.A. Wave Uplift Pressures on Horizontal Platforms. Ph.D. Thesis, California Institute of Technology, Pasadena, CA, USA, 1970. [Google Scholar]
  3. Suchithra, N.; Koola, P.M. A study of wave impact of horizontal slabs. Ocean Eng. 1995, 22, 687–697. [Google Scholar] [CrossRef]
  4. Kaplan, P. Wave impact forces on offshore structures: Re-Examination and New Interpetations. In Proceedings of the Offshore Technology Conference, Houston, TX, USA, 4–7 May 1992. [Google Scholar]
  5. Kaplan, P.; Murray, J.J.; Yu, W.C. Theoretical Analysis of Wave Impact Forces on Platform Deck Structures; American Society of Mechanical Engineers: New York, NY, USA, 1995. [Google Scholar]
  6. Ren, B.; Wang, Y. Experimental study of irregular wave impact on structures in the splash zone. Ocean Eng. 2003, 30, 2363–2377. [Google Scholar] [CrossRef]
  7. Tirindelli, M.; Cuomo, G.; Allsop, W.; McConnell, K. Exposed Jetties: Inconsistencies and Gaps in Design Methods for Wave-Induced Forces. Coast. Eng. Proc. 2003. [Google Scholar] [CrossRef]
  8. Tirindelli, M.; Cuomo, G.; Allsop, W.; Lamberti, A. Wave-in-Deck Forces on Jetties and Related Structures Wave-in-Deck Forces on Jetties and Related Structures. In Proceedings of the Thirteenth International Offshore and Polar Engineering Conference, Honolulu, HI, USA, 25–30 May 2003. [Google Scholar]
  9. Cuomo, G.; Allsop, W.; McConnell, K. Dynamic Wave Loads on Coastal Structures: Analysis of Impulsive and Pulsating Wave Loads. In Proceedings of the 2003 Coastal Structures American Society of Civil Engineers, Portland, OR, USA, 26–30 August 2003; pp. 356–368. [Google Scholar]
  10. Cuomo, G.; Tirindelli, M.; Allsop, W. Wave-in-deck loads on exposed jetties. Coast. Eng. 2007, 54, 657–679. [Google Scholar] [CrossRef]
  11. Cuomo, G.; Shimosako, K.; Takahashi, S. Wave-in-deck loads on coastal bridges and the role of air. Coast. Eng. 2009, 56, 793–809. [Google Scholar] [CrossRef]
  12. Lamberti, A.; Martinelli, L.; Gabriella Gaeta, M.; Tirindelli, M.; Alderson, J. Experimental spatial correlation of wave loads on front decks. J. Hydraul. Res. 2011, 49, 81–90. [Google Scholar] [CrossRef]
  13. Gaeta, M.G.; Martinelli, L.; Lamberti, A. Uplift Forces on Wave Exposed Jetties: Scale Comparison and Effect of Venting. Coast. Eng. 2012, 1, 34. [Google Scholar] [CrossRef]
  14. Gabriella, M.; Lamberti, A. The role of air modeling on the numerical investigation of coastal dynamics and wave-structure interactions. Comput. Fluids 2015, 111, 114–126. [Google Scholar] [CrossRef]
  15. Seiffert, B.; Hayatdavoodi, M.; Ertekin, R.C. Experiments and computations of solitary-wave forces on a coastal-bridge deck. Part I: Flat Plate. Coast. Eng. 2014, 88, 194–209. [Google Scholar] [CrossRef]
  16. Hayatdavoodi, M.; Seiffert, B.; Ertekin, R.C. Experiments and computations of solitary-wave forces on a coastal-bridge deck. Part II: Deck with girders. Coast. Eng. 2014, 88, 194–209. [Google Scholar] [CrossRef]
  17. Seiffert, B.R.; Ertekin, R.C.; Robertson, I.N. Wave loads on a coastal bridge deck and the role of entrapped air. Appl. Ocean Res. 2015, 53, 91–106. [Google Scholar] [CrossRef]
  18. Azadbakht, M.; Yim, S.C. Effect of trapped air on wave forces on coastal bridge superstructures. J. Ocean Eng. Mar. Energy 2016, 2, 139–158. [Google Scholar] [CrossRef]
  19. Xu, G.; Cai, C.; Deng, L. Numerical prediction of solitary wave forces on a typical coastal bridge deck with girders. Struct. Infrastruct. Eng. 2017, 13, 254–272. [Google Scholar] [CrossRef]
  20. Hayatdavoodi, M.; Ertekin, R.C. Review of Wave Loads on Coastal Bridge Decks. Appl. Mech. Rev. 2016, 68, 030802. [Google Scholar] [CrossRef]
  21. Bihs, H.; Kamath, A.; Chella, M.A.; Aggarwal, A.; Arntsen, Ø.A. A new level set numerical wave tank with improved density interpolation for complex wave hydrodynamics. Comput. Fluids 2016, 140, 191–208. [Google Scholar] [CrossRef]
  22. Bihs, H.; Kamath, A. A combined level set/ghost cell immersed boundary representation for floating body simulations. Int. J. Numer. Methods Fluids 2017, 83, 905–916. [Google Scholar] [CrossRef]
  23. Jiang, G.-S.; Shu, C.-W. Efficient Implementation of Weighted ENO Schemes. J. Comput. Phys. 1996, 228, 202–228. [Google Scholar] [CrossRef]
  24. Shu, C.-W. Total-Variation-Diminishing Time Discretizations. Siam J. Sci. Stat. Comput. 1988, 9, 1–8. [Google Scholar] [CrossRef]
  25. Courant, R.; Friedrichs, K.; Lewy, H. On the partial difference equations of mathematical physics. Ibm J. Res. Dev. 1967, 1, 215–234. [Google Scholar] [CrossRef]
Figure 1. Numerical model set up of experimental wave tank (Seiffert et al., 2014) for validation.
Jmse 07 00140 g001
Figure 2. (a) Comparison of wave elevation (H = 0.03 m) at x = 5.62 for Δx = 0.025, 0.01 and 0.005 m with theoretical solitary wave profile (b) Comparison between the numerical and the theoretical wave profile along the NWT when the crest reaches x1, x2 and x3.
Jmse 07 00140 g002
Figure 3. Comparison of wave elevation from numerical model with experimental results of Seiffert et al., 2014 (a) Wave elevation (b) Vertical impact force.
Jmse 07 00140 g003
Figure 4. Numerical wave tank with the boundary condition and the deck with girders and railings.
Jmse 07 00140 g004
Figure 5. Flat deck and deck with girders arrangement in the numerical wave tank (Dimensions in cm).
Jmse 07 00140 g005
Figure 6. (a) Comparison of force-time history of a flat deck and deck with girders due to solitary wave (H = 0.2d) impact at an airgap, S/d = 0.17. (b) Comparison of vertical impact force for a deck with and without girders for a varying S/d ratio.
Jmse 07 00140 g006
Figure 7. Color contour maps showing the variation of velocity (m/s) at different time steps during the solitary wave impact on the deck.
Jmse 07 00140 g007
Figure 8. Color contour maps showing the variation of pressure (N/m2) at different time steps during the solitary wave impact on the deck.
Jmse 07 00140 g008
Figure 9. Peak impact force for the increasing wave height for different airgaps at a constant depth, d = 0.35 m. (a) Vertical impact force (b) Horizontal impact force.
Jmse 07 00140 g009
Figure 10. Wave elevation before hitting the structure at a distance, x = 4.8 m along the NWT for different normalized airgaps (a) S/d = 0.11 (b) S/d = 0.17 (c) S/d = 0.23 and (d) S/d = 0.29.
Jmse 07 00140 g010aJmse 07 00140 g010b
Figure 11. Peak vertical impact force vs. normalized girder spacing for increasing wave heights, H = 0.3d to 0.5d for S/d = 0.17, S/d = 0.23 and S/d = 0.29.
Jmse 07 00140 g011
Figure 12. Peak vertical impact force vs. normalized airgap for different girder depths, dg = 0.08, 0.1 and 0.12 m for wave heights at different normalized airgaps S/d = 0.29, 0.23 and 0.17 (a) H = 0.5d, (b) H = 0.4d and (c) H = 0.3d.
Jmse 07 00140 g012aJmse 07 00140 g012b
Figure 13. Principal component loadings for the first and second component (PC1 and PC2).
Jmse 07 00140 g013
Figure 14. Comparison of peak vertical impact force for deck with and without railing and overhang for different H/d ratios and airgaps (a) S/d = 0.17, (b) S/d = 0.23 and (c) S/d = 0.29.
Jmse 07 00140 g014

