Article

A Quality Control Method for Broad-Beam HF Radar Current Velocity Measurements

Codar Ocean Sensors, 1914 Plymouth St., Mountain View, CA 94043, USA
*
Author to whom correspondence should be addressed.
J. Mar. Sci. Eng. 2019, 7(4), 112; https://doi.org/10.3390/jmse7040112
Submission received: 6 March 2019 / Revised: 14 April 2019 / Accepted: 15 April 2019 / Published: 19 April 2019
(This article belongs to the Special Issue Radar Technology for Coastal Areas and Open Sea Monitoring)

Abstract

:
This paper describes a method to provide quality control for radial velocity maps derived from radar echo voltage cross spectra measured by broad-beam high frequency radars. The method involves the comparison of voltage cross spectra measured at Doppler frequencies in the Bragg region with values predicted from basic equations defining the complex voltage cross spectra in terms of the measured antenna patterns and the radar cross section. Poor agreement at a given Doppler frequency indicates contamination of the spectra, usually due to interference; velocity results from that Doppler frequency are then eliminated. Examples are given of its application to broad-beam radars operating at four sites.

1. Introduction

Crombie [1] first observed and identified the distinctive features of sea-echo in radar Doppler spectra. Barrick [2,3] derived expressions for the high frequency (HF) sea-echo Doppler spectrum in terms of the surface current velocities and the ocean wave height directional spectrum. Methods were then developed to interpret radar sea-echo spectra in terms of Barrick’s equations to give surface current velocity maps [4,5], directional ocean wave spectra and wind direction [6,7,8]. These methods are presently used by commercial, operational systems to give current maps and directional wave information.
The first HF radar systems to be developed were phased arrays, which ideally have narrow radar beams [9,10]. Although the interpretation of narrow-beam signals backscattered from the sea is simpler, the disadvantages of phased-array systems for applications are their large physical size with consequent difficult installation requirements and high operating cost. It is mainly for these reasons that compact, transportable systems were developed in the seventies [11], followed by the SeaSonde (Codar Ocean Sensors, Mountain View, CA, USA) [12,13], which has been available commercially since 1990. The SeaSonde has three small antennas, two crossed loops and a vertical monopole/dipole, all aligned along a single vertical axis. Interpretation of the signal voltages using Barrick’s equations yields both the surface current field and directional ocean wave parameters. Lipa and Barrick derived analysis methods for broad-beam HF radars based on equations defining the complex voltage cross spectra in terms of the antenna patterns and the radar cross section; these can be used to obtain the radial current velocity as a function of range and direction [4]. In this paper, we describe how these equations can provide real-time quality control (QC) for radial current velocities derived from the cross spectra. This is based on internal consistency checks that are used to assess the quality of the radial velocities. Analysis procedures presently implemented in SeaSonde system software are based on the multiple signal classification (MUSIC) algorithm for direction-finding [5], which provides reduced analysis time. The solutions for current velocities from MUSIC are consistent with those from the standard least-squares procedure, which is based on equations for the measured voltage cross spectra that can also be used for QC, as described in this paper.
Operational coastal HF ocean surface wave radar networks have proliferated such that regional and national scale operational networks have been installed in the United States [14], Asia [15], Europe [16] and India [17]. The primary products of these networks are surface current maps used for a variety of scientific and operational applications, including field wave measurement [18,19], search and rescue [20], oil spill response [21,22,23,24], vessel navigation [25], fisheries [26], tsunami detection [27]. With the increase in both extent and operational uses of the HF Radar networks, there is now a greater need for more automated QC of the real-time data products.
A recommended best practice for HF radar operators is to measure and use the antenna response pattern for each station’s receive antenna [28]. Kohut et al. [29] showed that applying measured antenna patterns to the HF radar Doppler spectra analysis improved the surface current data accuracy. Methods for measuring the antenna pattern at SeaSonde stations more easily and more often have progressed to include using aerial drones and passing ships of opportunity [30,31,32]. Most SeaSonde HF Radar systems now operate using a measured antenna pattern.
Several QC methods have been developed for use in real-time software processing, as outlined and referenced in manuals issued by the United States Integrated Ocean Observing System (U.S. IOOS) [33]. Recent studies for broad-band radars have demonstrated site-specific methods real-time QC based on area-averaging, SNR limits and MUSIC signal quality metrics [34,35]. QC methods based on SNR limits for phased array radars are described in [36]. The QC method presented here differs from previous methods as it is based on the fundamental equations for the radar sea echo and measured antenna patterns; previous methods are based on analysis of derived parameters and statistical fluctuations of the echo data.
The paper is organized as follows: Section 2 summarizes the radar spectral theory on which the methods are based; Section 3 outlines the method used for the derivation of radial current velocities; Section 4 outlines the method used to provide QC for radial velocities, based on internal consistency checks supplied by software and applied to measured data from a radar system at Shelter Cove; Section 5 shows typical results from application of these methods to radar data from three radar sites located at Trinidad, Big Creek (California) and Sea Bright (New Jersey).

2. Radar Spectral Theory

In this paper, we focus the analysis on SeaSonde broad-beam systems [13], which operate at several hundred sites. The basic SeaSonde data set consists of complex voltage cross spectra (see for example [4]) measured by the monopole and two crossed-loop antennas. The radar echo spectra from circular range cells over the coverage area consist of dominant peaks produced by first-order Bragg scatter from waves with one-half the radar wavelength, from which current velocities are derived. The first-order peaks are surrounded by sidebands produced by higher-order scatter, as shown in Figure 1. First-order peaks at positive Doppler frequencies are produced by echo from advancing Bragg waves; those at negative Doppler frequencies come from receding Bragg waves.
Barrick [2] derived the following expression for the narrow-beam first-order radar cross section σ 1 ( ω , ϕ ) at radian frequency ω and azimuthal direction ϕ :
σ 1 ( ω , ϕ ) = 2 6 π k 0 4 m = ± 1 S ( 2 k 0 ,   ϕ + ( m + 1 ) π 2 ) ( ω m ω B 2 k 0 v r ( ϕ ) )
where k 0 is the radar wavenumber, S(k, ϕ ) is the directional ocean wave spectrum for angle ϕ and wavenumber k, v r ( ϕ ) is the radial current velocity and ω B is the radian Bragg frequency defined by 2 g k 0 , where g is the gravitational constant.
For a broad-beam system, complex voltage cross spectra from the three antennas V ˜ i V ˜ j * , where i, j = 1,2,3, at a given frequency can be expressed as follows in terms of the antenna patterns and the radar cross section:
| V ˜ 1 | 2 = ϕ 1 ϕ 2 | Z ˜ 1 | 2 σ ( ϕ ) d ϕ
| V ˜ 2 | 2 = ϕ 1 ϕ 2 | Z ˜ 2 | 2 σ ( ϕ ) d ϕ
| V ˜ 3 | 2 = ϕ 1 ϕ 2 σ ( ϕ ) d ϕ
V ˜ 1 V ˜ 3 * = ϕ 1 ϕ 2 Z ˜ 1 ( ϕ ) σ ( ϕ ) d ϕ
V ˜ 2 V ˜ 3 * = ϕ 1 ϕ 2 Z ˜ 2 ( ϕ ) σ ( ϕ ) d ϕ
V ˜ 1 V ˜ 2 * = ϕ 1 ϕ 2 Z ˜ 1 ( ϕ ) Z ˜ 2 * ( ϕ ) σ ( ϕ ) d ϕ
where the angular brackets denote infinite ensemble averages, * indicates a complex conjugate and where Z ˜ 1 ( ϕ ) , Z ˜ 2 ( ϕ ) are the complex antenna pattern functions for Loops 1 and 2, normalized by the monopole value; σ ( ϕ ) is the narrow-beam radar cross section defined by Equation (1); ϕ 1 and ϕ 2 are the angles at which the radar beam is cut off by the coastline.

3. Analysis for Radial Current Velocities

Lipa and Barrick [4] described analysis of broad-beam HF radar Doppler echo spectra to give radial current velocities, assuming ideal antenna patterns. It follows from Equation (1) that the Doppler shift from the positive and negative Bragg frequencies uniquely defines a value of the radial current velocity; interpretation of the data using least-squares methods yields the azimuth angles at which this velocity occurs. It is assumed that each radial velocity can occur at either one or two azimuth angles; standard least-squares methods are used to determine the velocity values and choose between a one-angle or a two-angle solution.
This least-squares analysis is here extended to use measured antenna patterns in the interpretation of the radar cross spectra, and a QC method is identified.
Assuming that the velocity defined by a given Doppler frequency occurs at only one or two azimuth angles leads to the following equations, where the first/second entries define a one/two-angle solutions.
ϕ 1 ϕ 2 | Z ˜ 1 | 2 σ ( ϕ ) d ϕ = p ( ϕ ) | Z ˜ 1 ( ϕ ) | 2   ( O n e a n g l e ) = p ( ϕ 1 ) | Z ˜ 1 ( ϕ 1 ) | 2 + p ( ϕ 2 ) | Z ˜ 1 ( ϕ 2 ) | 2   ( T w o a n g l e )
ϕ 1 ϕ 2 | Z ˜ 2 | 2 σ ( ϕ ) d ϕ = p ( ϕ ) | Z ˜ 2 ( ϕ ) | 2   ( O n e a n g l e ) = p ( ϕ 1 ) | Z ˜ 2 ( ϕ 1 ) | 2 + p ( ϕ 2 ) | Z ˜ 2 ( ϕ 2 ) | 2   ( T w o a n g l e )
ϕ 1 ϕ 2 σ ( ϕ ) d ϕ = p ( ϕ )   ( O n e a n g l e ) = p ( ϕ 1 ) + p ( ϕ 2 )   ( T w o a n g l e )
ϕ 1 ϕ 2 Z ˜ 1 ( ϕ ) σ ( ϕ ) d ϕ = p ( ϕ )   Z ˜ 1 ( ϕ )   ( O n e a n g l e ) = p ( ϕ 1 ) Z ˜ 1 ( ϕ 1 ) + p ( ϕ 2 ) Z ˜ 1 ( ϕ 2 )   ( T w o a n g l e )
ϕ 1 ϕ 2 Z ˜ 2 ( ϕ ) σ ( ϕ ) d ϕ = p ( ϕ )   Z ˜ 2 ( ϕ )   ( O n e a n g l e ) = p ( ϕ 1 ) Z ˜ 2 ( ϕ 1 ) + p ( ϕ 2 ) Z ˜ 2 ( ϕ 2 )   ( T w o a n g l e )
ϕ 1 ϕ 2 Z ˜ 1 ( ϕ ) Z ˜ 2 * ( ϕ ) σ ( ϕ ) d ϕ = p ( ϕ )   Z ˜ 1 ( ϕ ) Z ˇ 2 * ( ϕ )   ( O n e a n g l e )          = p ( ϕ 1 ) Z ˜ 1 ( ϕ 1 ) Z ˇ 2 * ( ϕ 1 ) + p ( ϕ 2 ) Z ˜ 1 ( ϕ 2 ) Z ˇ 2 * ( ϕ 2 )   ( T w o a n g l e )
In Equation (3), the multiplicative factors p ( ϕ ) have the same values for all the equations.
The normalized least-squares sum S ( ω ) at each frequency is then formed. For a one angle solution, S ( ω ) is given by
S ( ω ) = [ | V ˜ 1 | 2 p ( ϕ ) | Z ˜ 1 ( ϕ ) | 2 ] 2 + [ | V ˜ 2 | 2 p ( ϕ ) | Z ˜ 2 ( ϕ ) | 2 ] 2 + + [ V ˜ 1 V ˜ 2 * p ( ϕ ) Z ˜ 1 ( ϕ ) Z ˇ 2 * ( ϕ ) ] 2 / | V ˜ 3 | 2
and the normalized RMS (Root-mean-squared) deviations defined by:
RMS ( ω ) = S ( ω ) / | V ˜ 3 | 2
Minimizing S ( ω ) with respect to p ( ϕ ) and ϕ provides the optimum fit values, leading to radial current velocities.
We then proceed in a similar fashion for the two-angle solution, minimizing the sum of least-squares deviations to give optimum values of ϕ 1 , ϕ 2 , p ( 1 ) , p ( 2 ) . Statistical methods to select between a one- or a two-angle solution are described in [4] Section IIIB.

4. Application of Quality Control for Derived Radial Velocities

The minimum value of the RMS deviations can be used to provide QC for the derived radial velocities: If the deviations are large, this indicates that the model is not a good fit to the data, and the derived velocities for that Doppler bin should be discarded. Large deviations can be due to interference or incorrect boundaries set to define the first-order region. First-order boundaries are set by locating the limits of the strong signal region surrounding the Bragg frequencies. We now illustrate this process by analysis of the contaminated radar spectrum shown in Figure 2, for which interference is clearly masking the negative Bragg region.
To provide a comparison between current velocity results from contaminated and uncontaminated Bragg regions, this spectrum was analyzed to give current velocities, using first only negative- and then only positive-Doppler frequencies. Results are shown in Figure 3.
The radial current velocities shown in Figure 3a are quite erratic due to the interference, whereas Figure 3b indicates a regular pattern. Corresponding normalized RMS deviations are plotted vs. Doppler frequency in Figure 4 for both positive and negative Doppler frequencies.
From Figure 4, the values of the RMS deviations for the uncontaminated spectral points with positive Doppler frequency are usually less than 5. Setting this value as a limit ( S l i m = 5) radial current velocities obtained for which the RMS deviations do not exceed S l i m are plotted in Figure 5.
In practice, a limit S l i m for a given site is determined by applying this method to an extensive array of non-contaminated spectra and identifying a reasonable lower limit. Methods are under development to automate this procedure. Radial current velocities are output only if the RMS deviations are less than S l i m . This eliminates results from the corresponding contaminated Doppler spectral points.

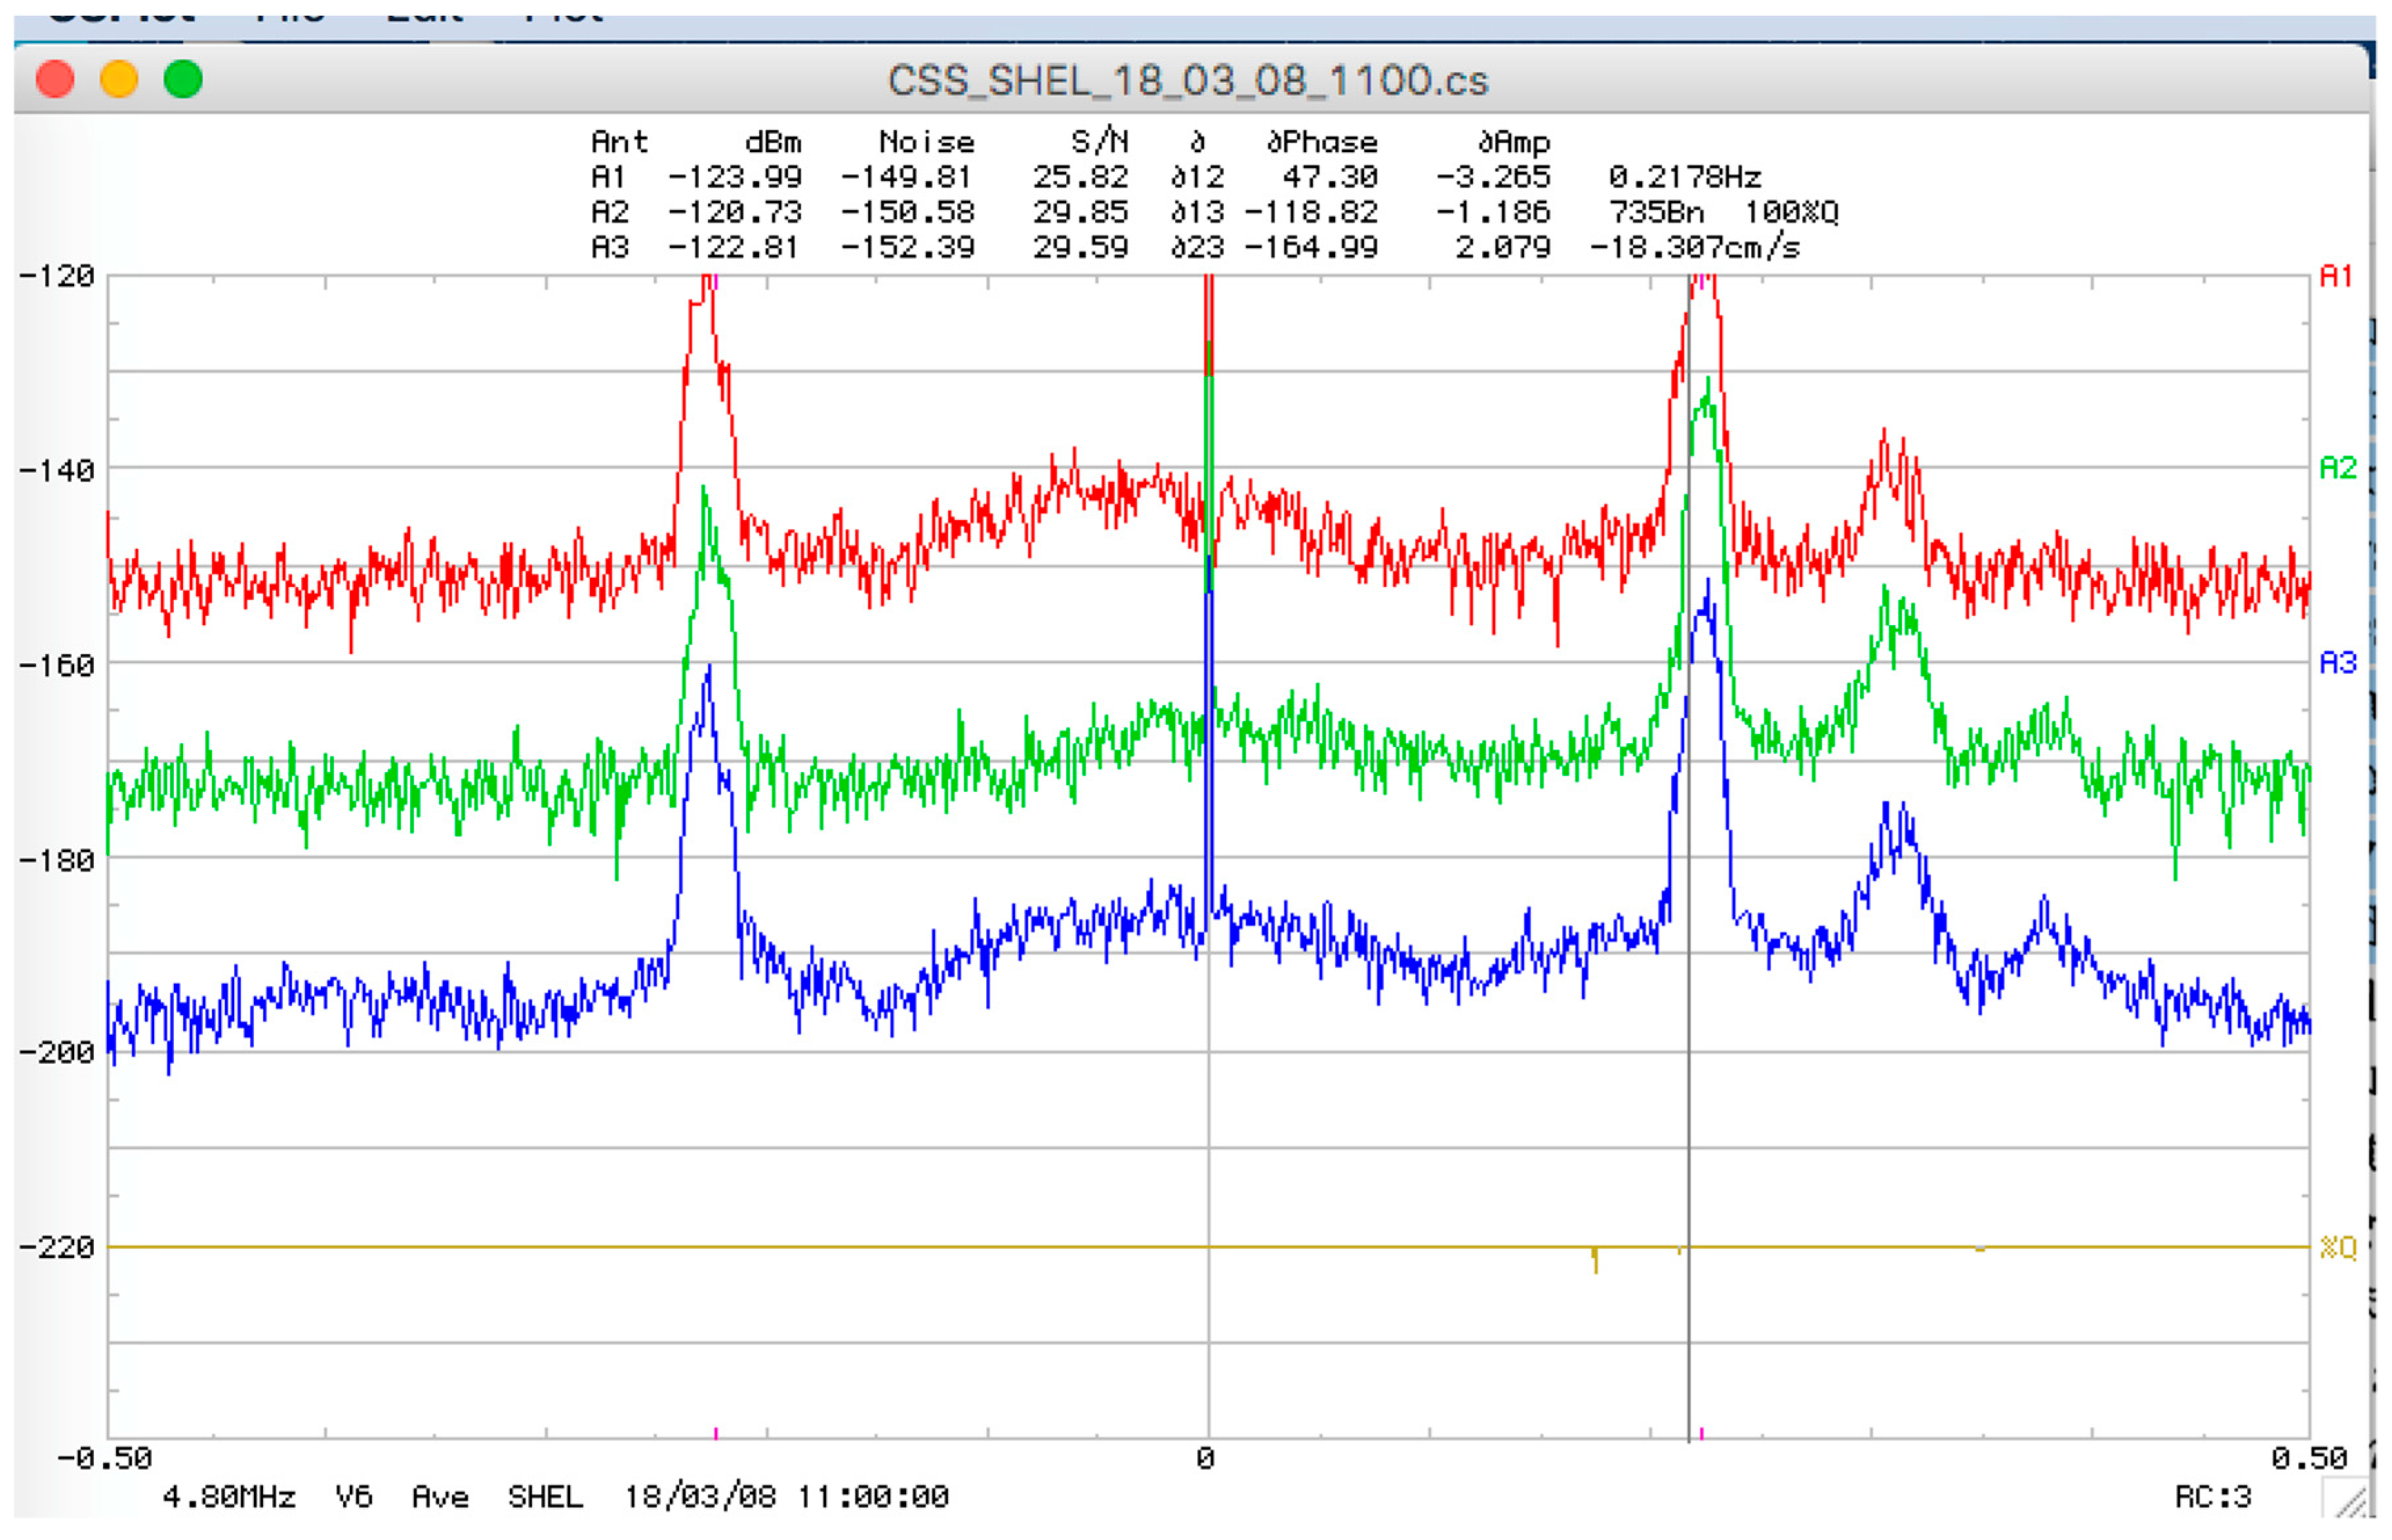
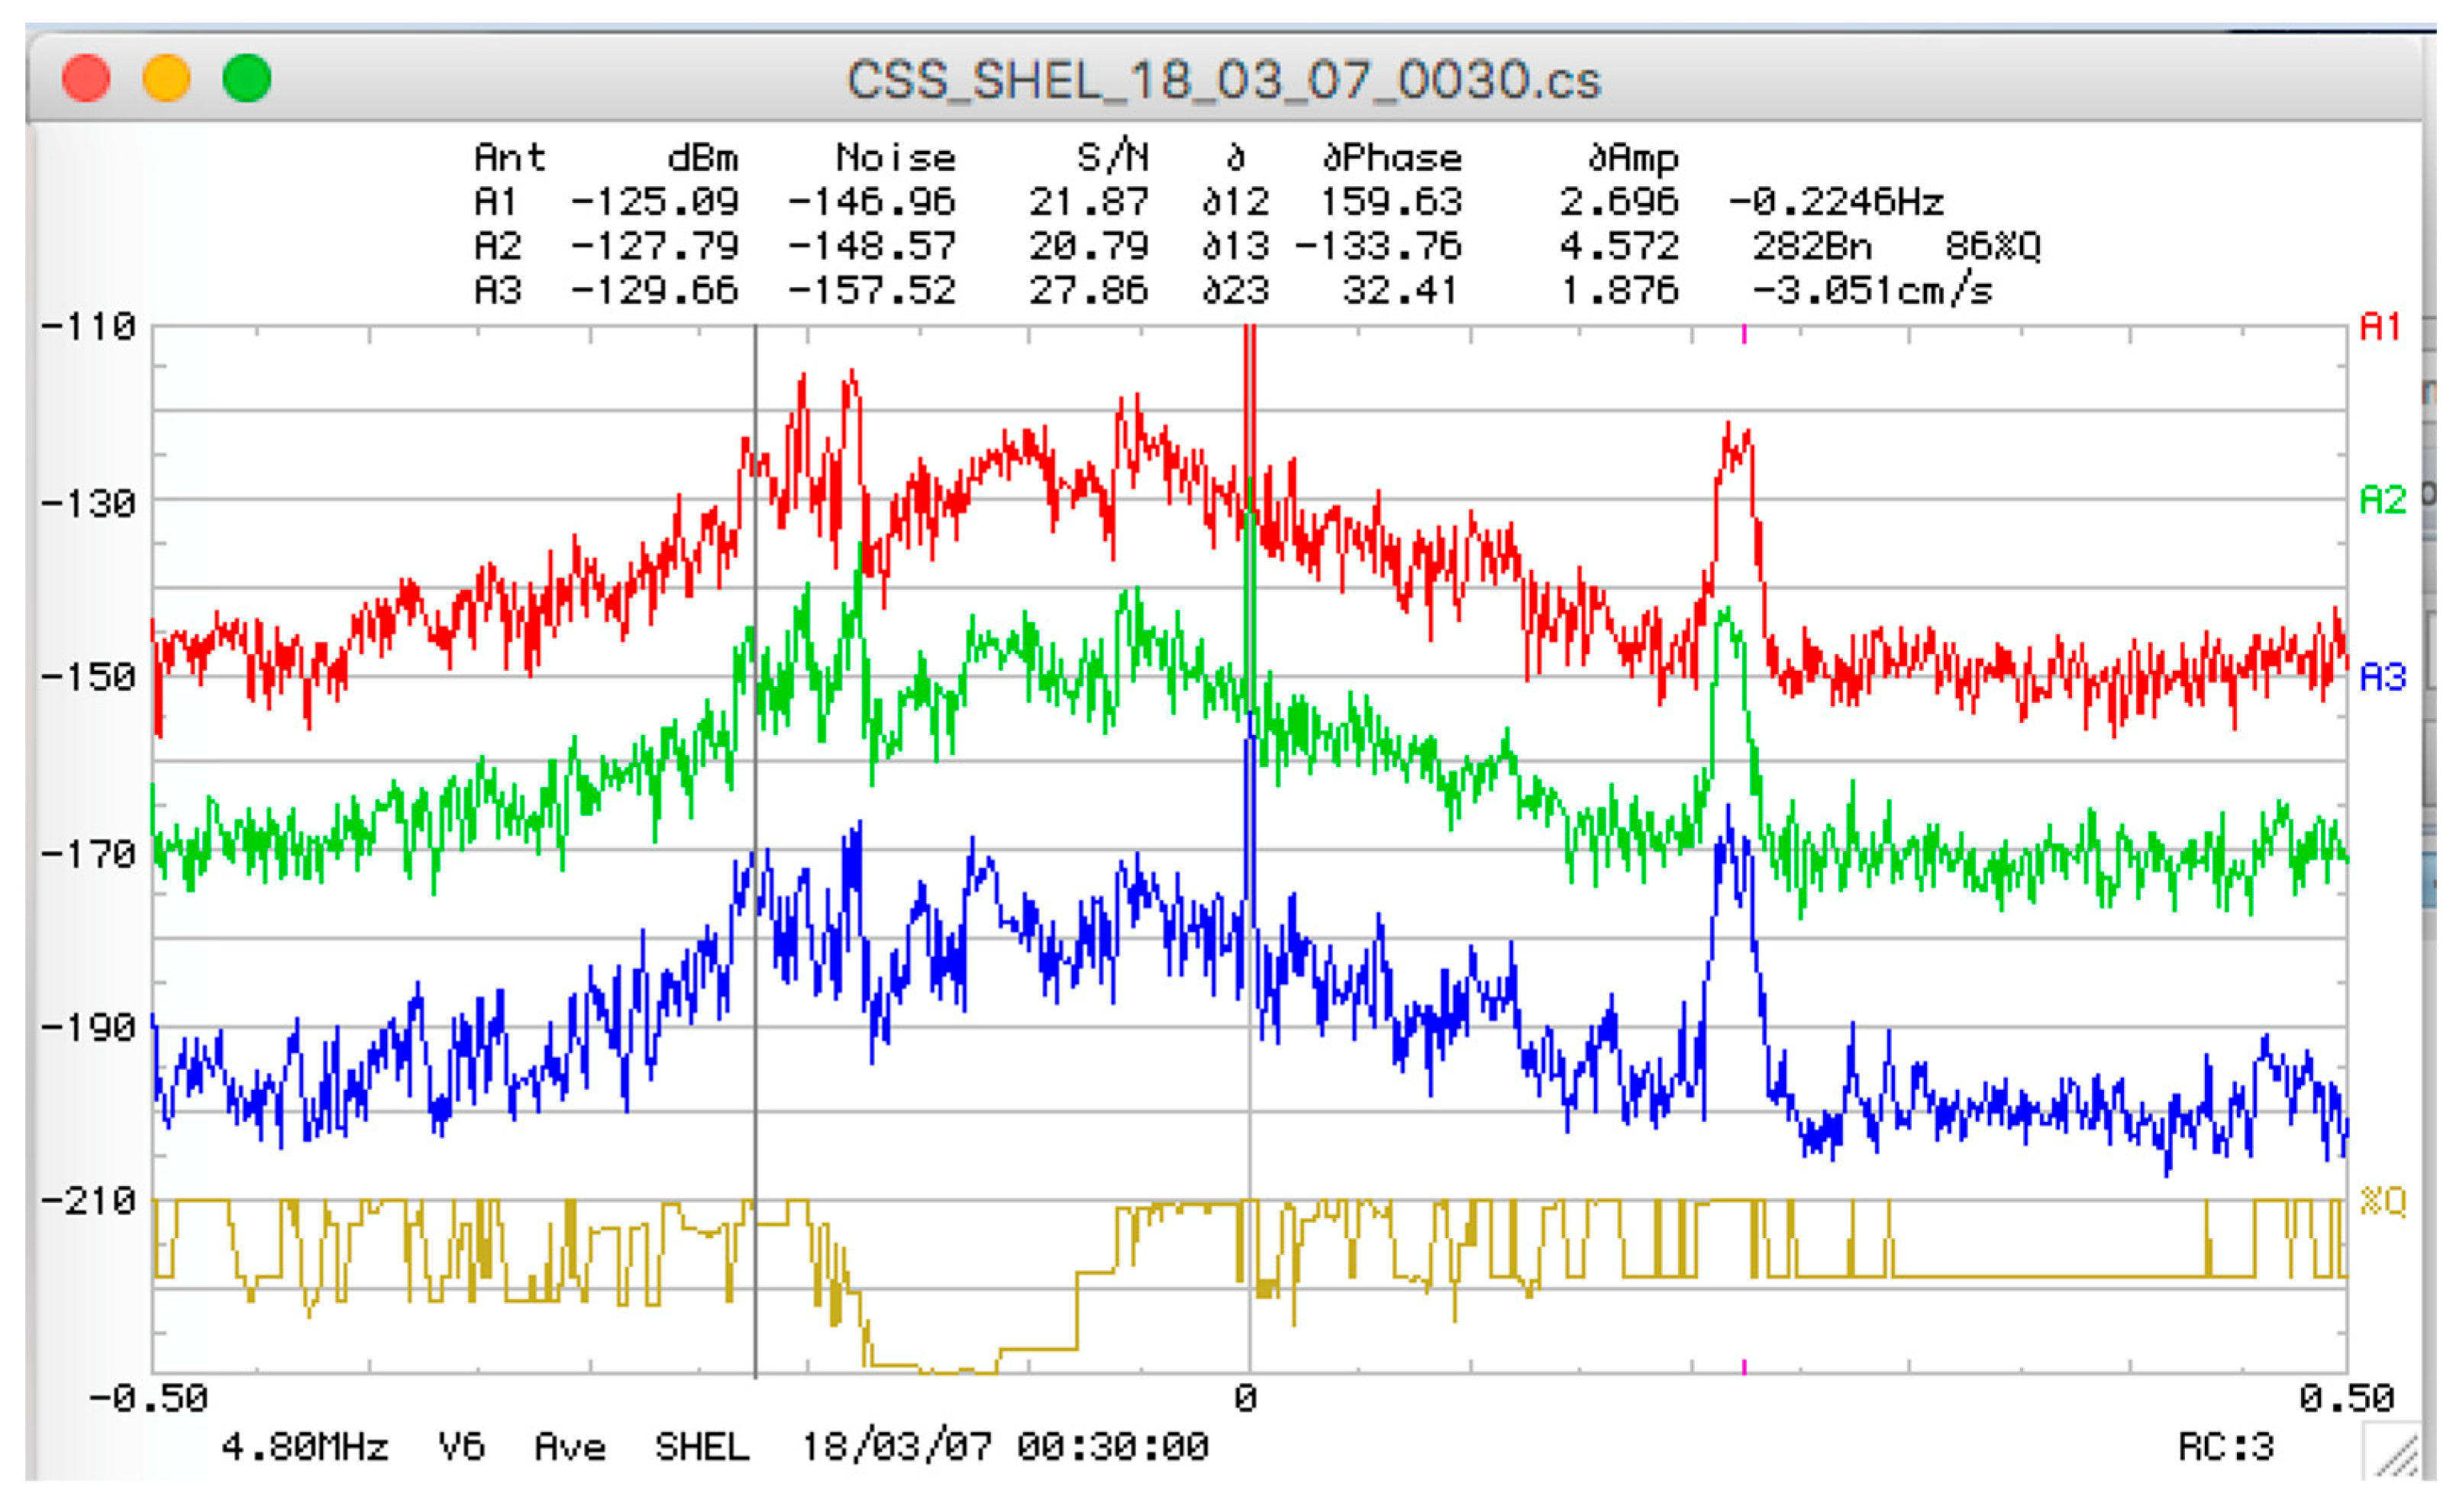
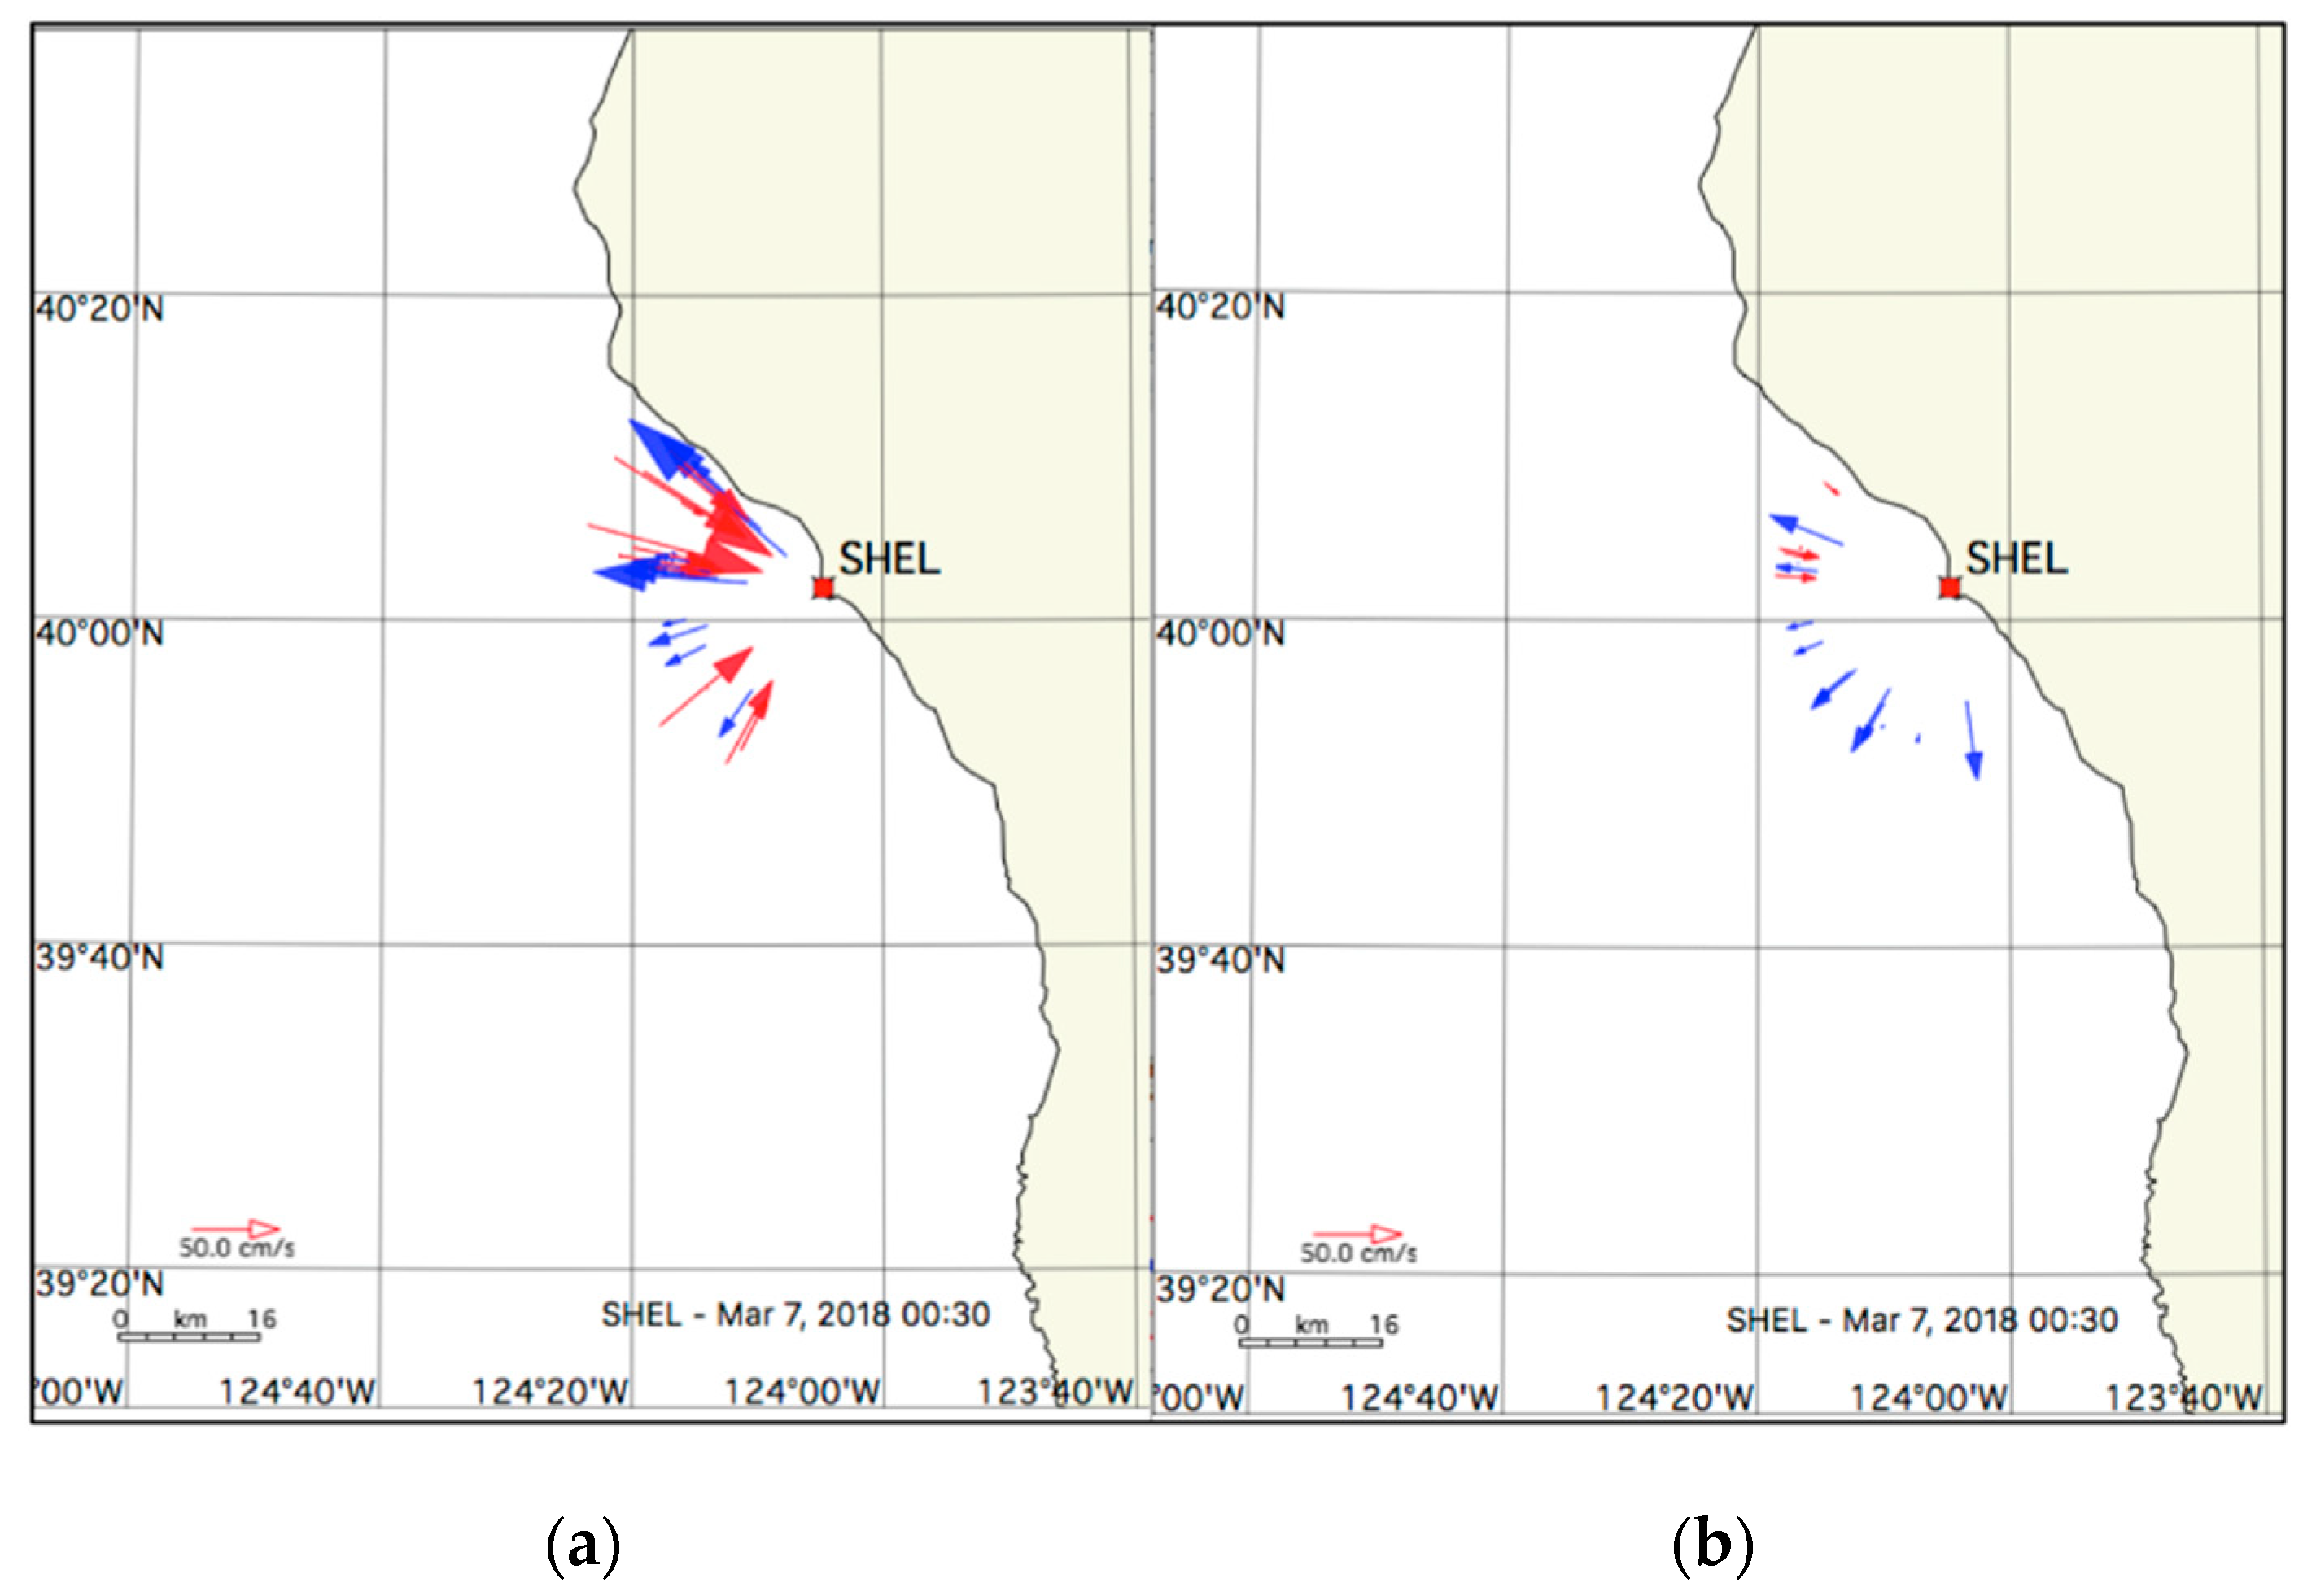
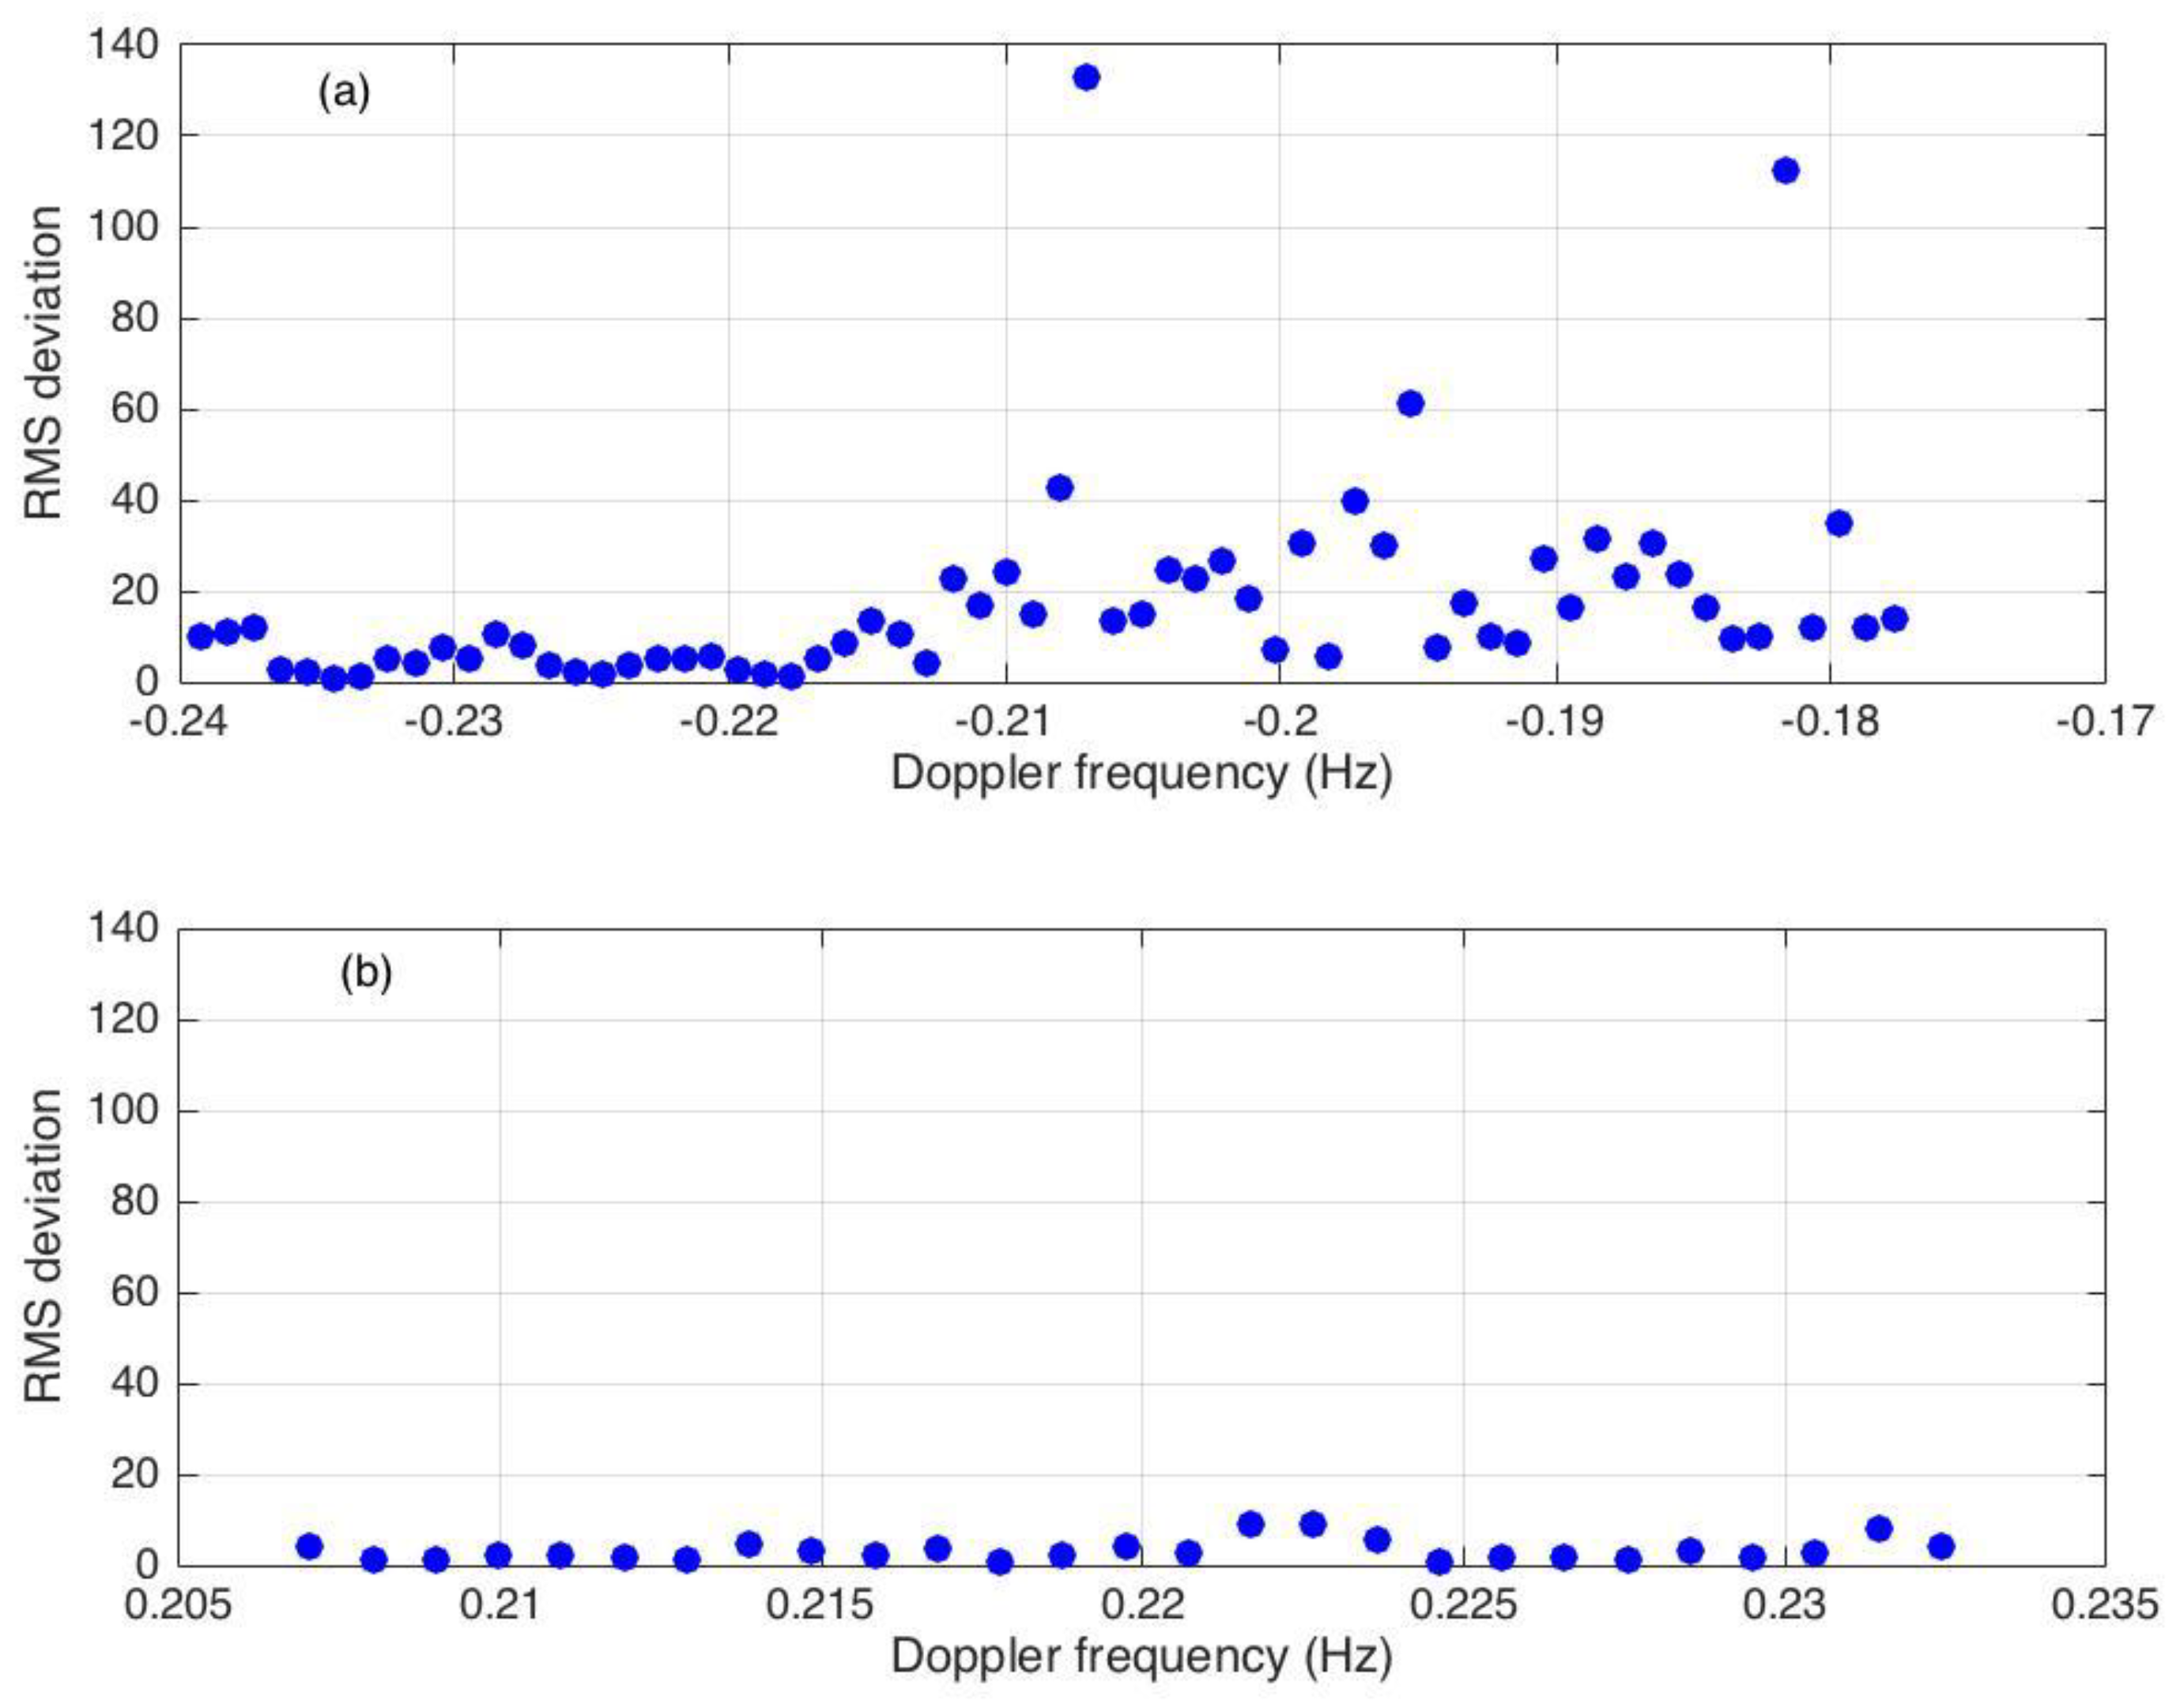
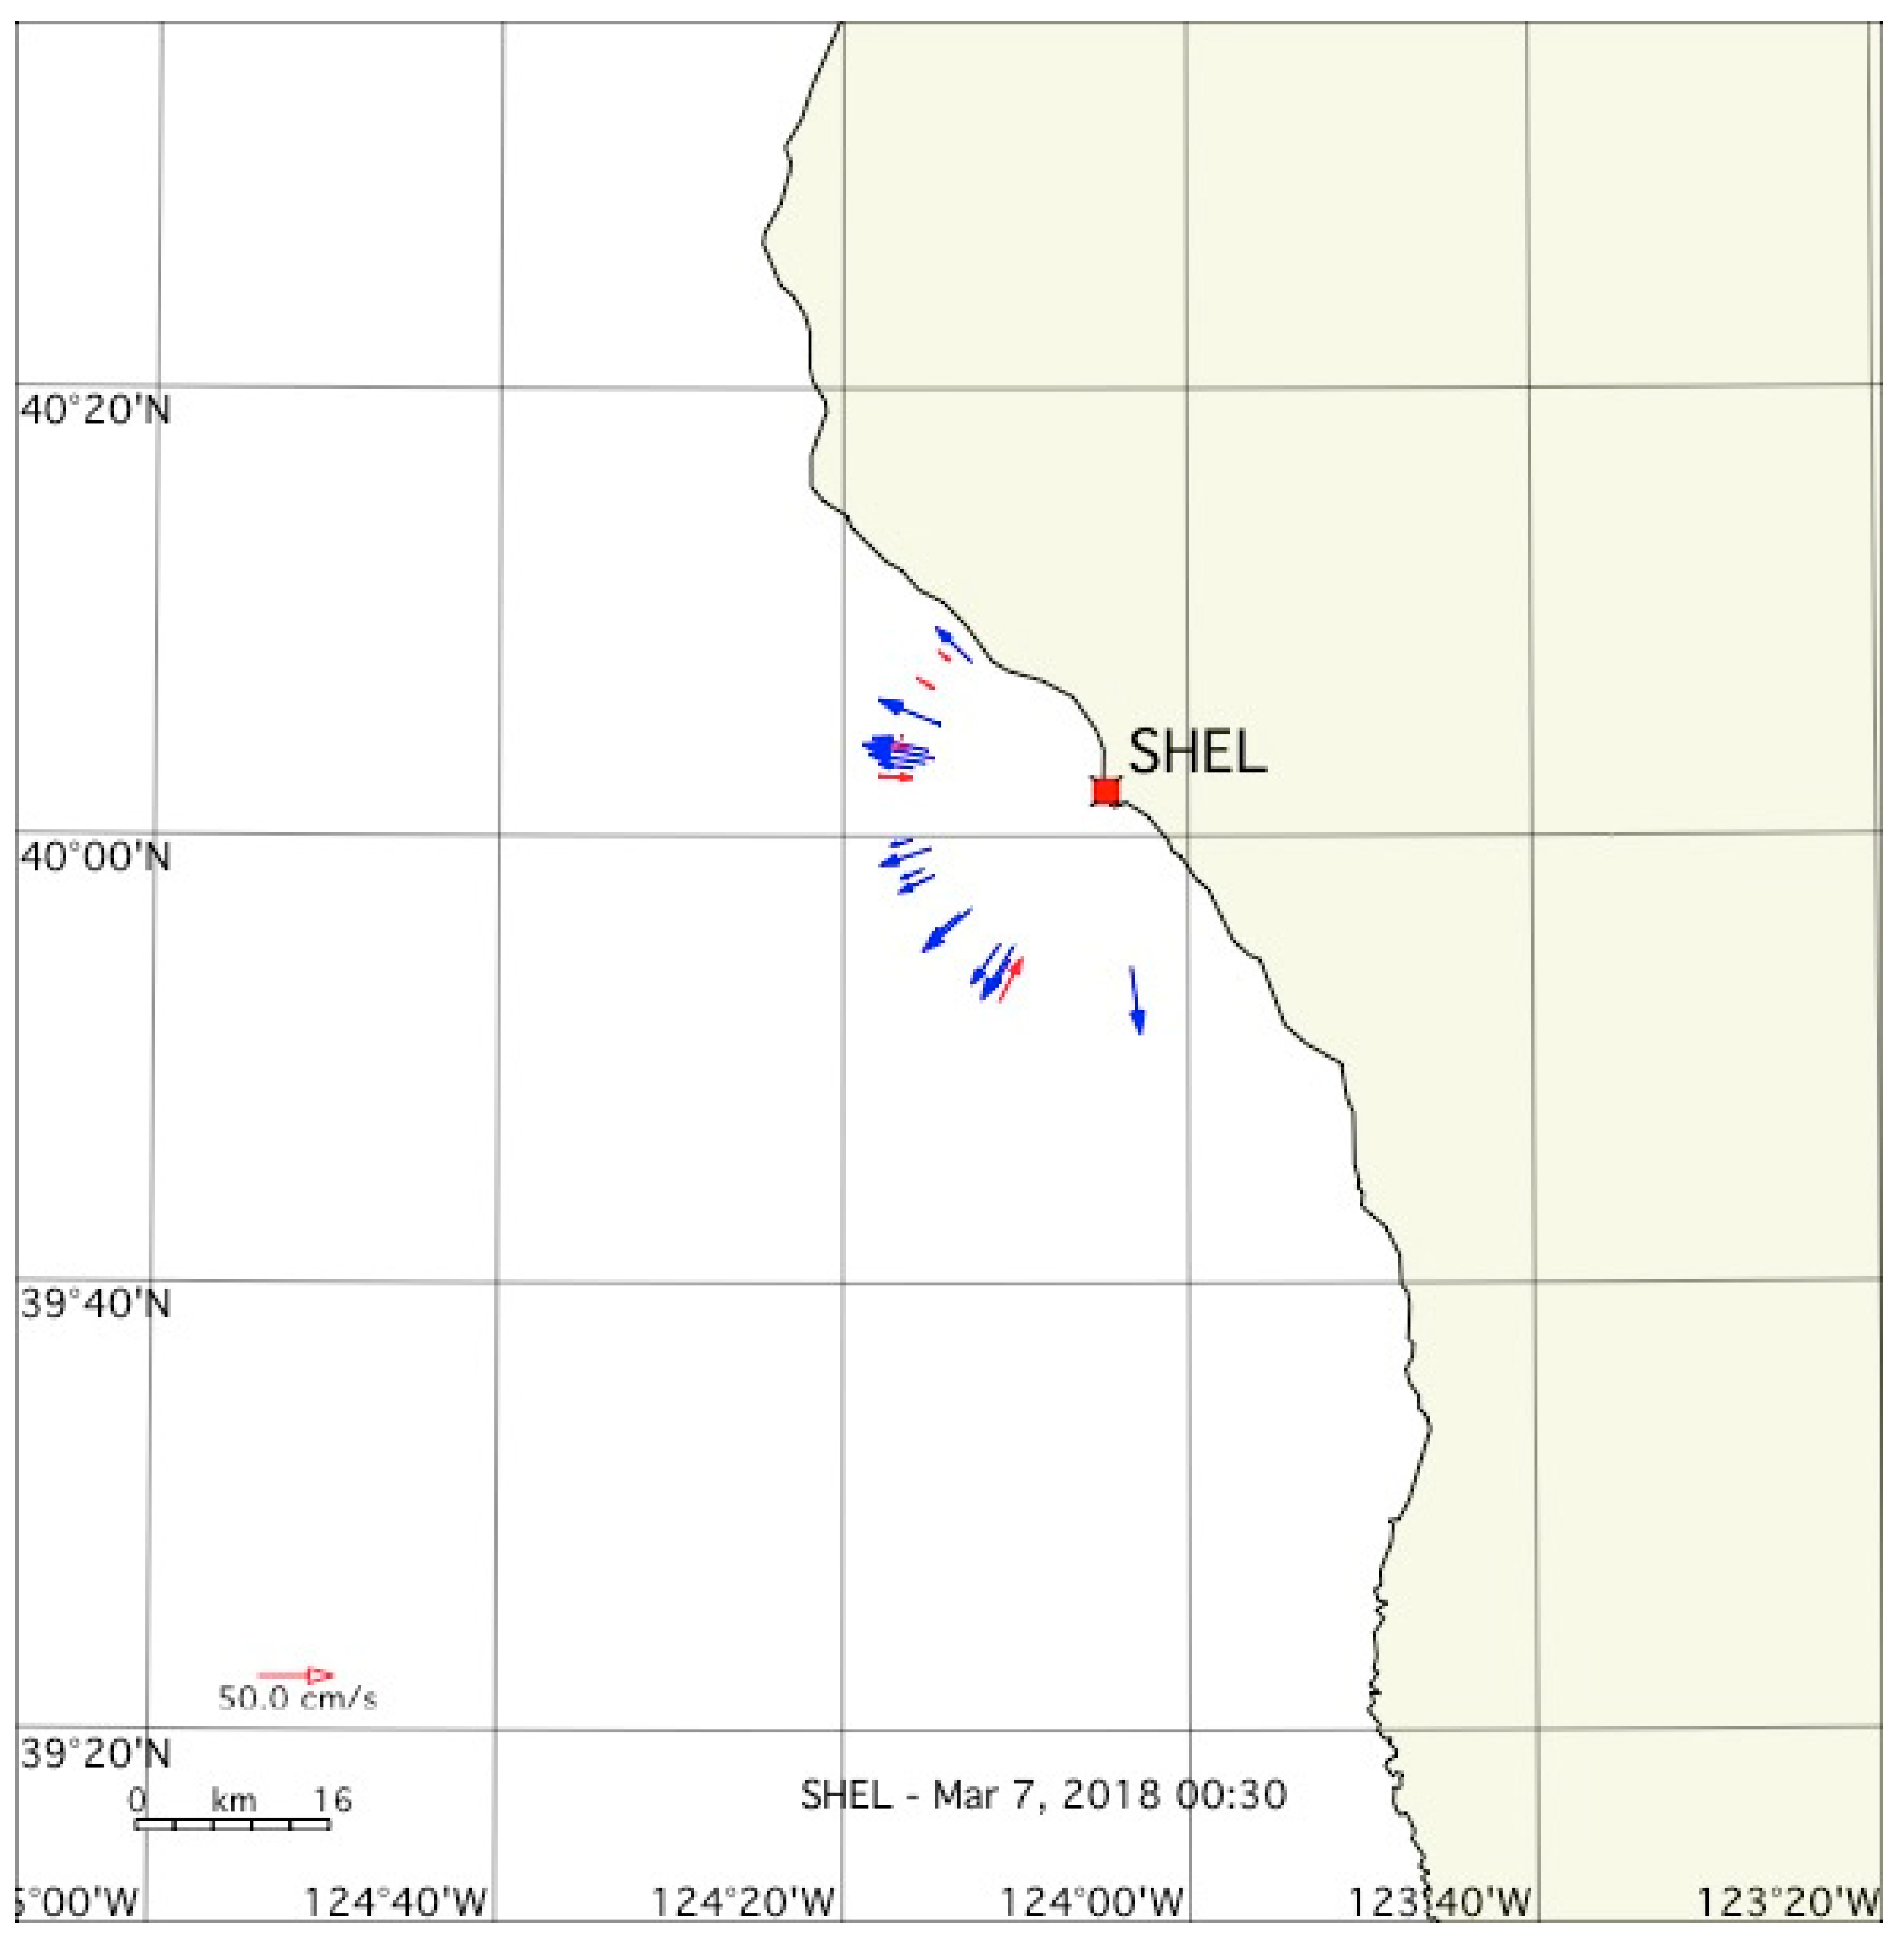
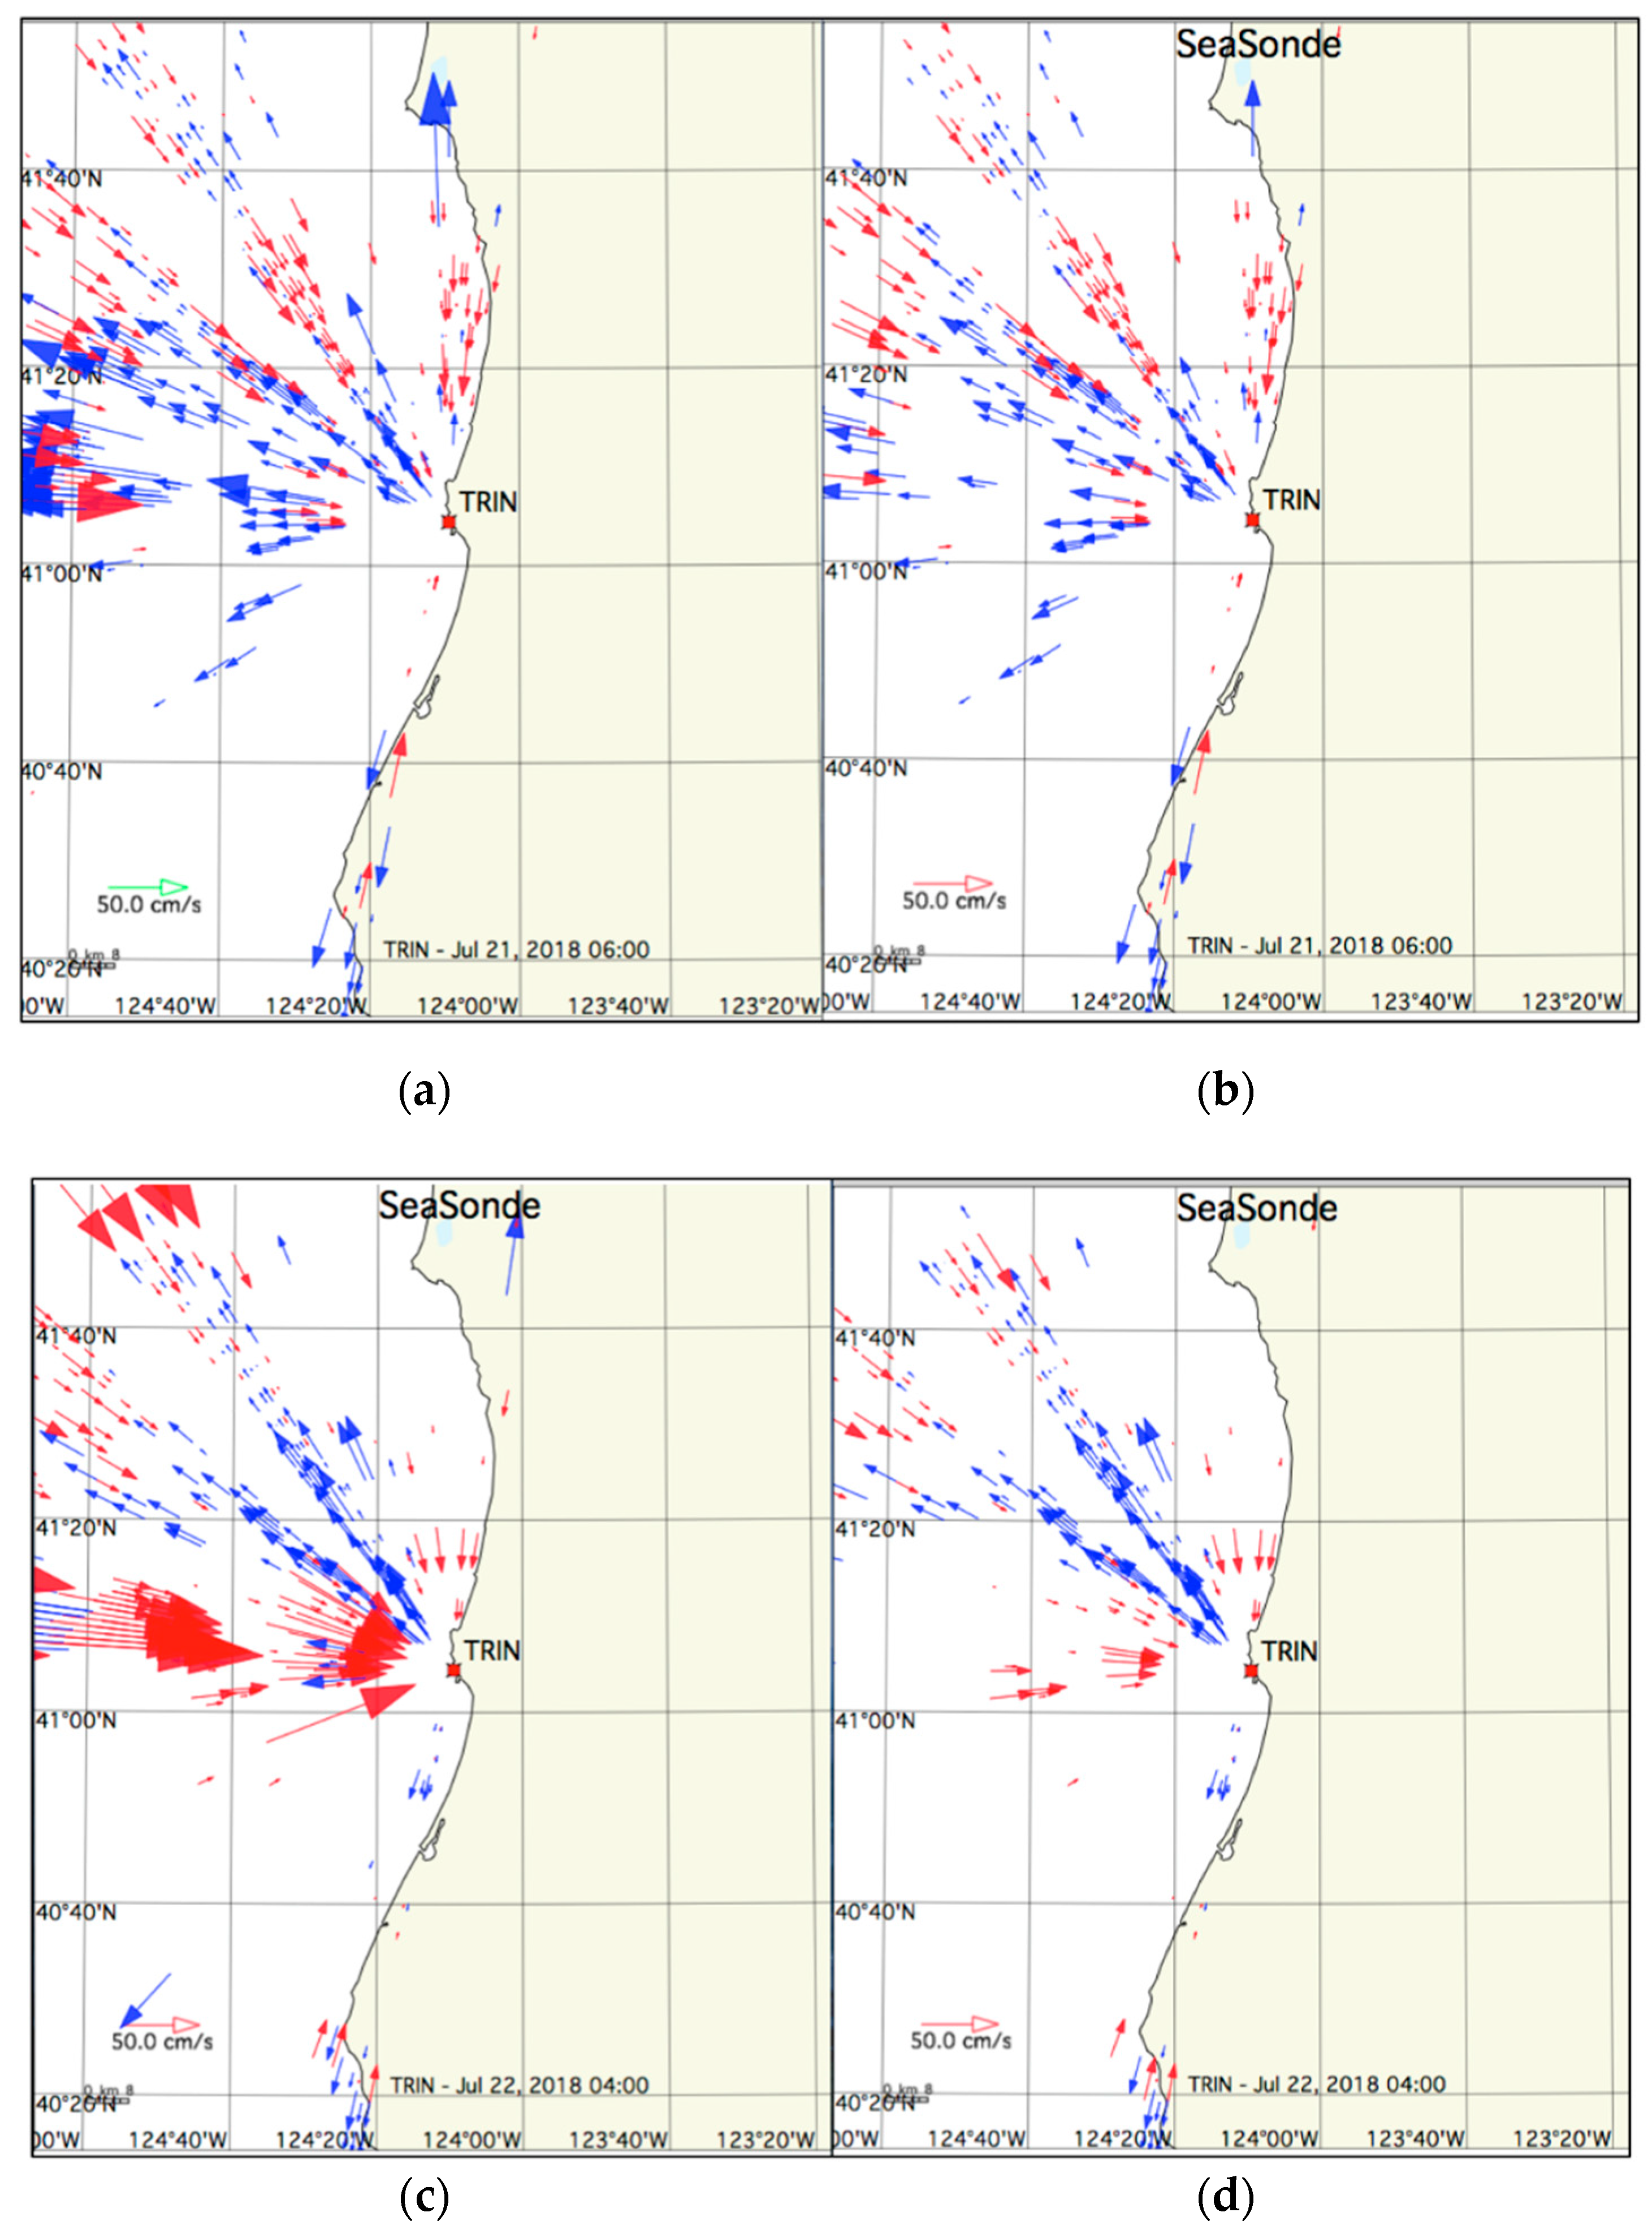
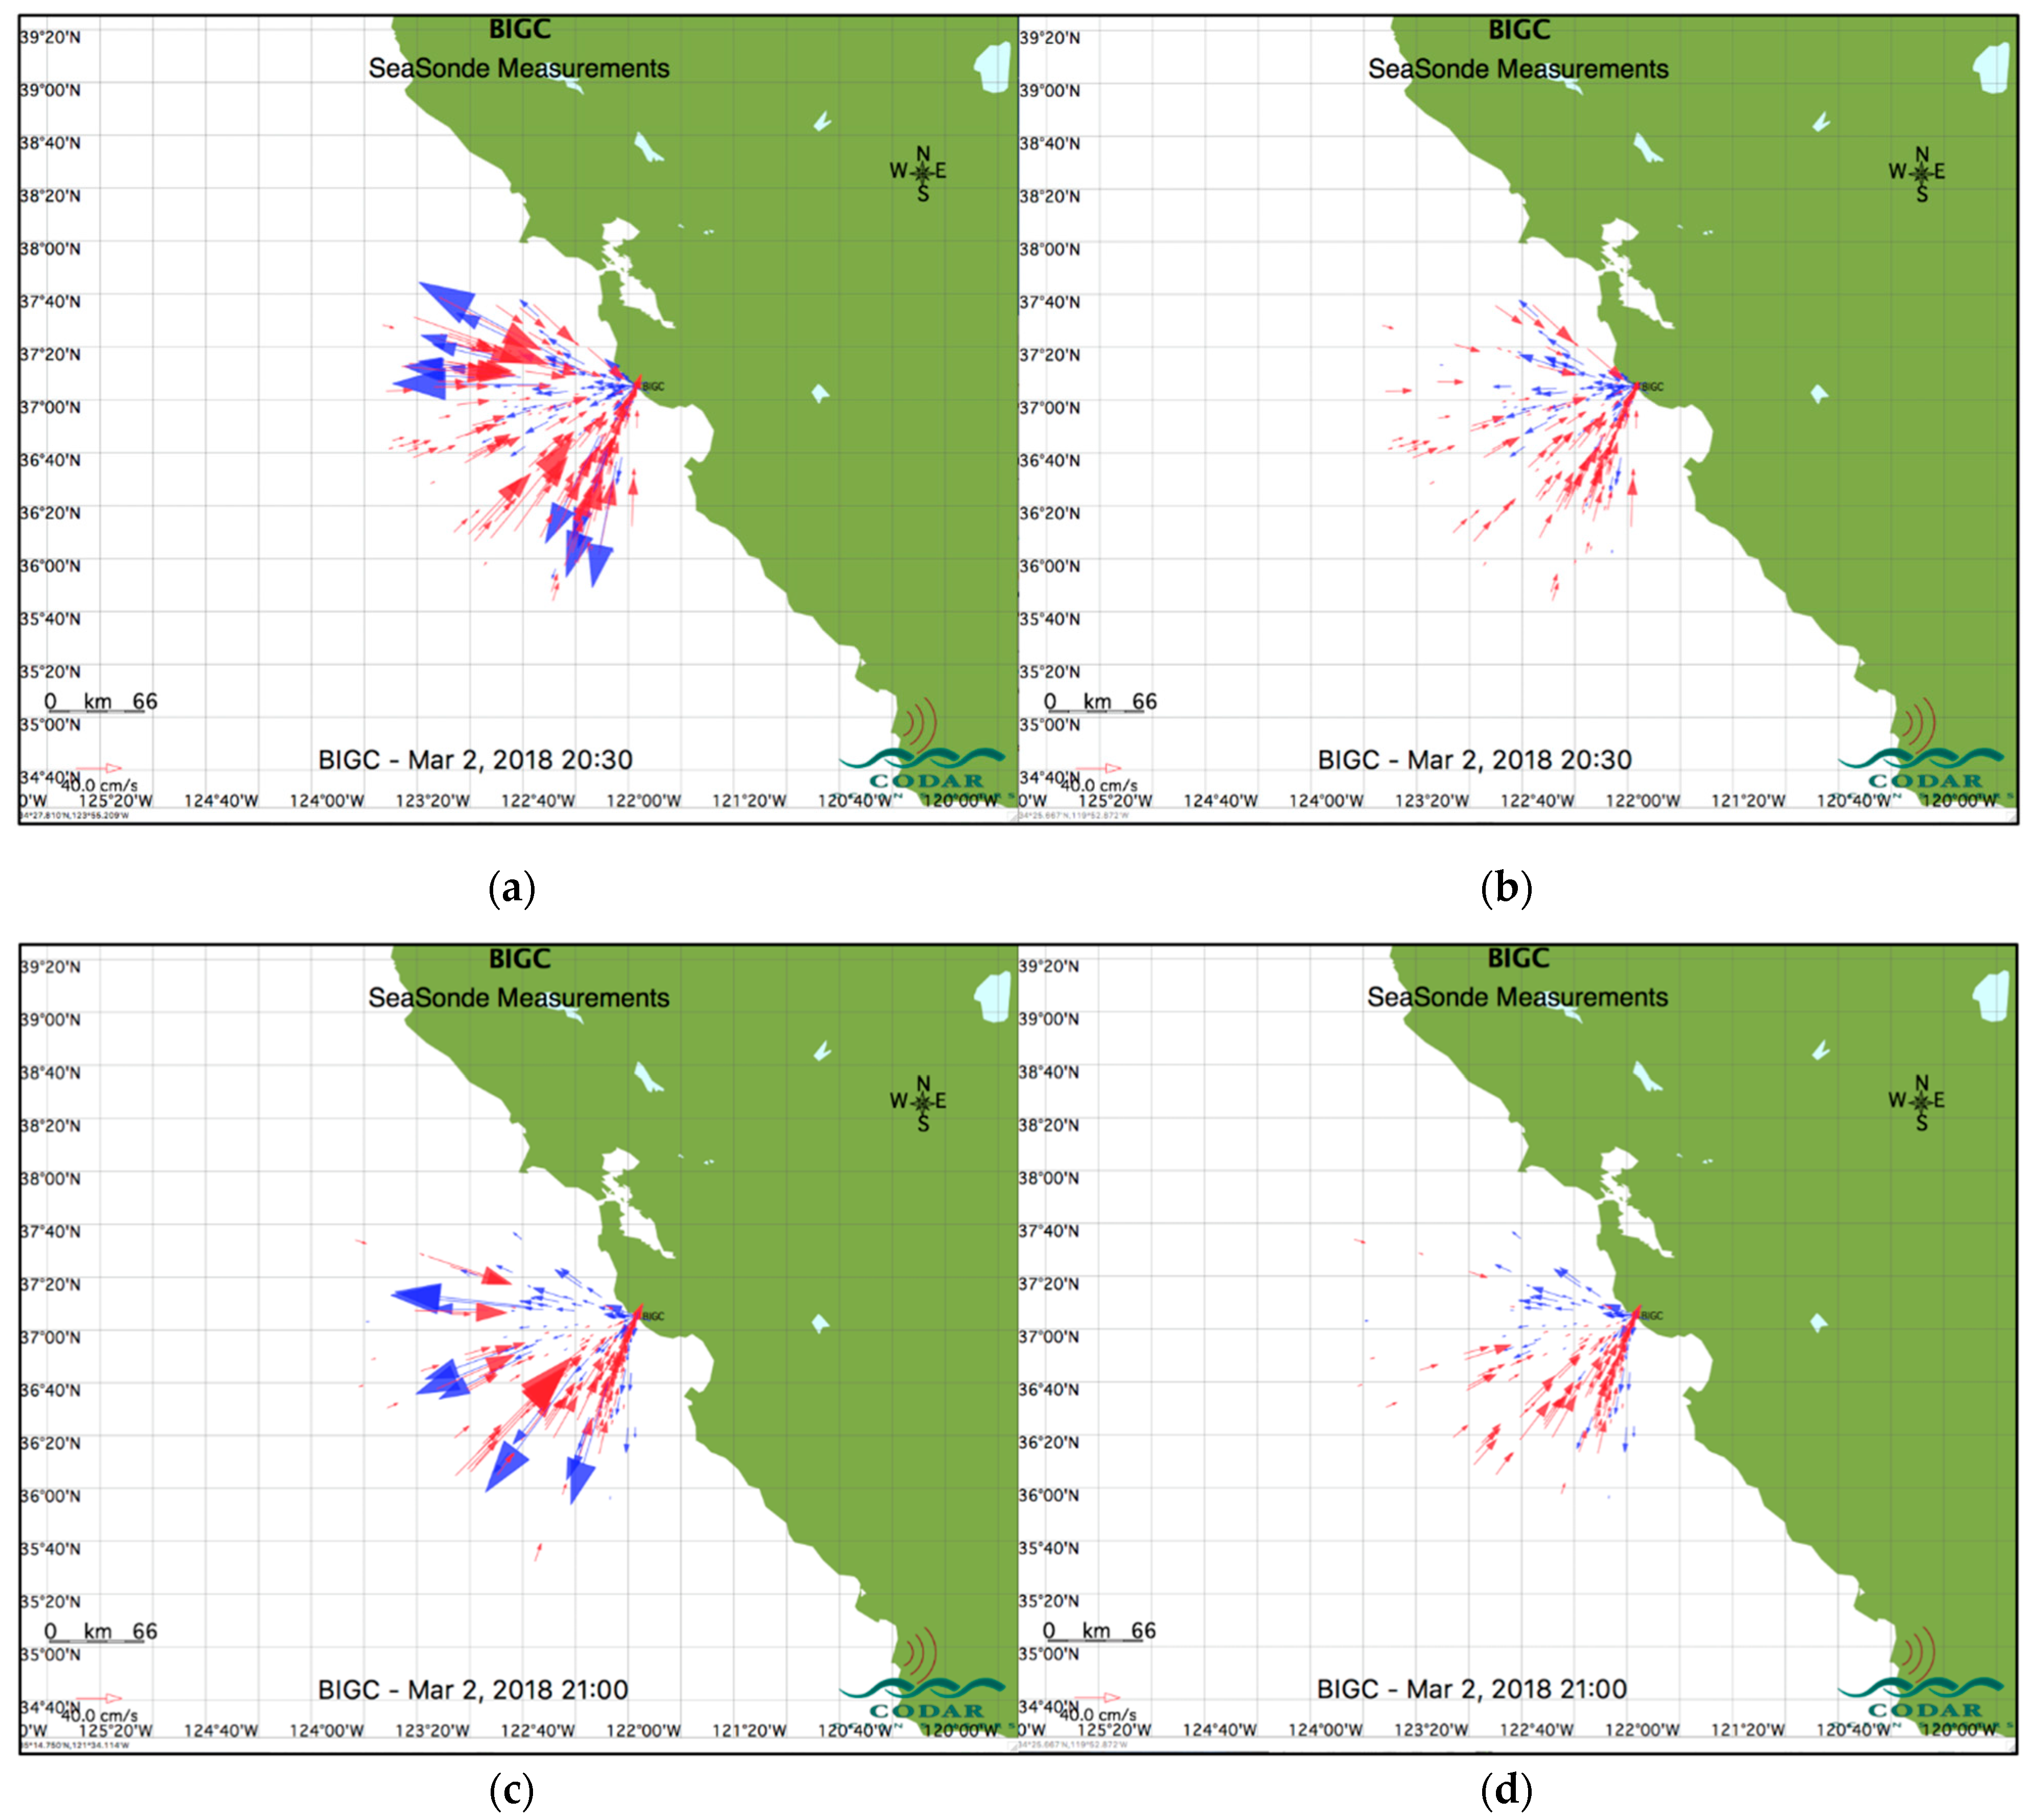
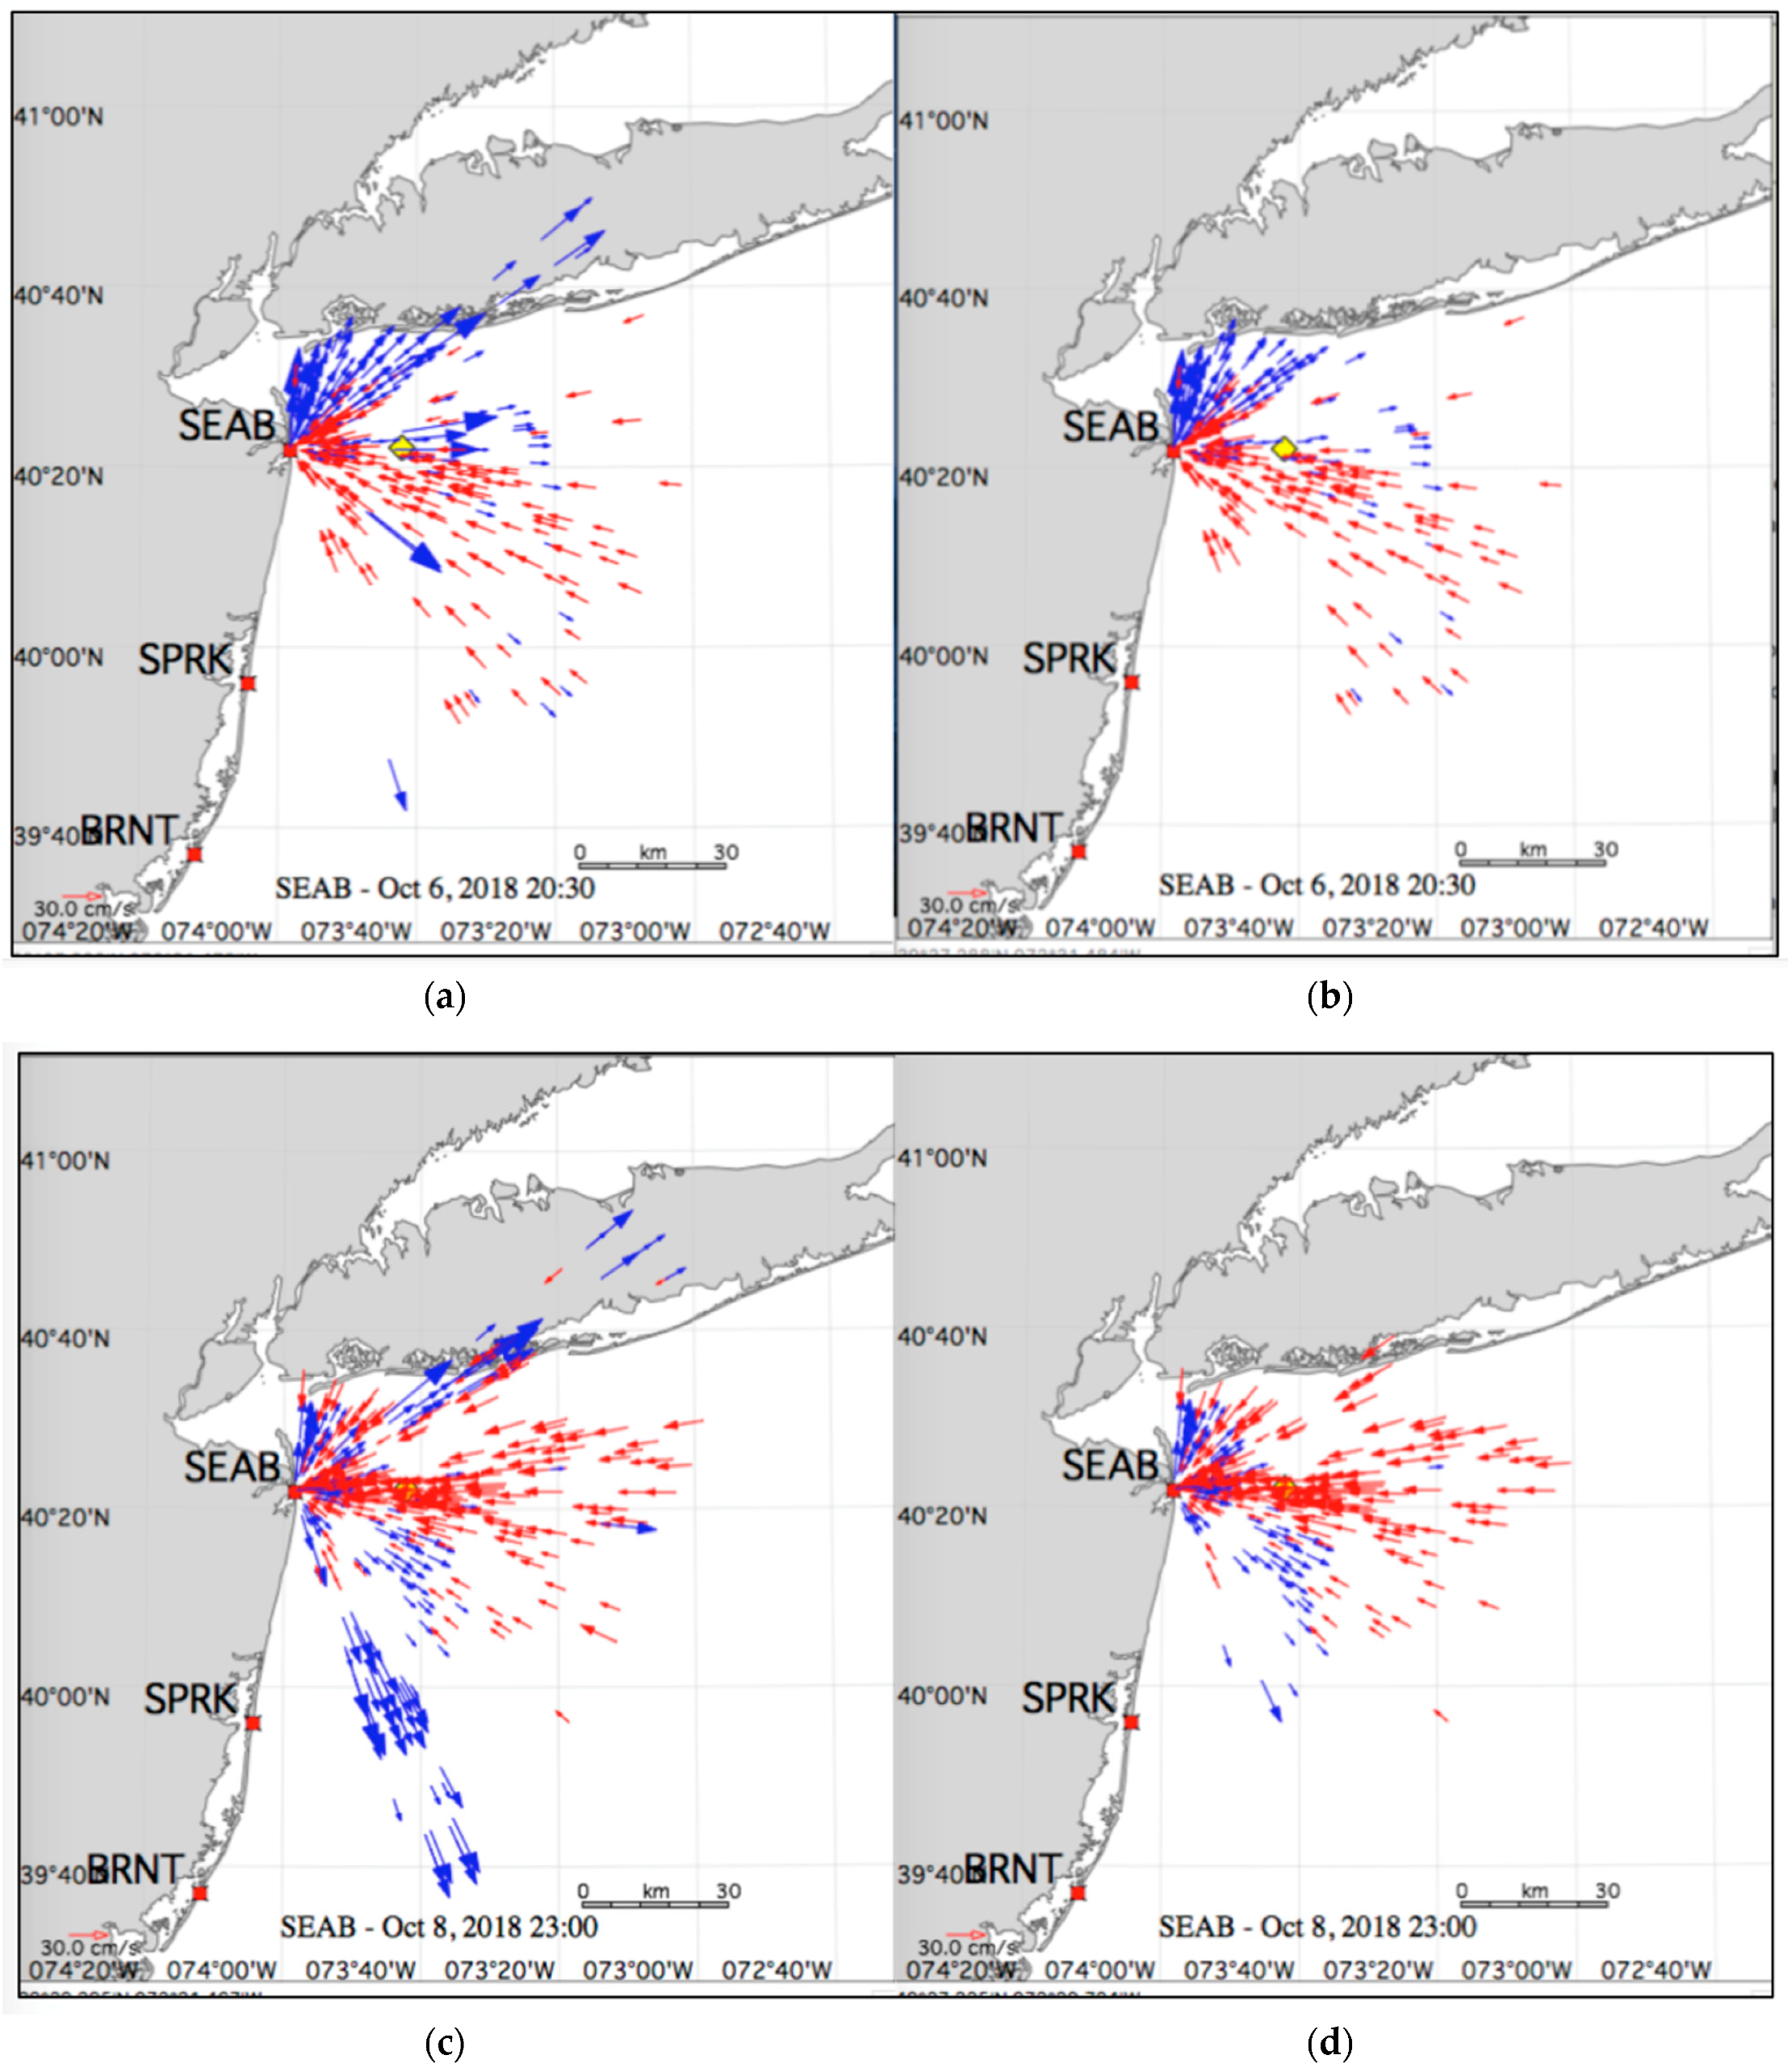
5. Examples of Results

In this section, we give examples of the application of the method described in Section 4 to provide QC for radial velocities from three other radar sites. Current velocities shown are obtained from measured radar spectra, unaveraged over time or distance. Figure 6, Figure 7 and Figure 8 show current velocity maps obtained with and without QC. A quantitative measure of the improvement provided by QC is given by the resulting reduction in the normalized RMS deviations, see Equation (5). The average of this quantity over the map R M S a v is quoted for each case.

6. Conclusions

This paper summarizes a method for improving the quality of radial velocities from broad-beam sea-echo voltage cross spectra, based on the application of a least-squares direction-finding algorithm. This method provides QC for eliminating poor-quality radar spectral points from the analysis, when the least-squares deviations exceed a preset limit. The method is illustrated using data from a radar at Shelter Cove, California. Results are given from application of this method to data from three additional radar sites, including both long-range and standard-range broad-beam systems.
The next step is to automate the method, which can then run on systems in the field to improve output current velocity data quality. Current velocities shown in this paper are obtained from short-term radar spectra, involving minimal averaging at the spectral level. Further processing involves averaging over time and distance. Resulting current velocities from radar sites with significant interference can be validated by comparison with drifters and in situ devices.
A similar method is currently under development to provide QC for output from directional ocean wave spectra.
The majority of HF radars in operational use for ocean-monitoring employ compact broad-beam antennas; other systems rely on beam-forming. In the future it may be possible to determine a common QC procedure for all ocean-monitoring HF radars, since all output results are based on Barrick’s Equation (1) for the narrow-beam first-order radar cross section.

Author Contributions

Conceptualization, B.L., C.W., D.B.; Methodology, B.L.; Software, B.L.; Validation, B.L. Formal Analysis, B.L.; Investigation, B.L.; Resources, B.L., C.W.; Data Curation, B.L., C.W.; Writing-Original Draft Preparation, B.L.; Writing-Review & Editing, D.B., C.W.

Funding

This research received no external funding.

Acknowledgments

We are grateful to Hardik Parikh and Maeve Daugharty for providing data and maps used in the analysis. Radar spectral data came from the Central and Northern California Ocean Observing System (CeNCOOS) and the Mid-Atlantic Regional Association Coastal Ocean Observing System (MARACOOS), both of which receive funding from the U.S. Integrated Ocean Observing System (IOOS®). We are grateful to the individuals who maintain those systems and provided the data: Deedee Shideler and Marcel Losekoot of Bodega Marine Laboratory; Hugh Roarty and Ethan Handel of Rutgers University.

Conflicts of Interest

The authors are involved with the development and sale of SeaSonde systems.

References

  1. Crombie, D.D. Doppler spectrum of sea echo at 13.56 Mc/s. Nature 1955, 175, 681–682. [Google Scholar] [CrossRef]
  2. Barrick, D.E. First-order theory and analysis of MF/HF/VHF scatter from the Sea. IEEE Trans. Antennas Propag. 1972, AP-20, 2–10. [Google Scholar] [CrossRef]
  3. Barrick, D.E. Remote sensing of sea-state by radar. In Remote Sensing of the Troposphere; Derr, V.E., Ed.; U.S. National Oceanic and Atmospheric Administration: Silver Spring, MD, USA, 1972; pp. 12-1–12-46. [Google Scholar]
  4. Lipa, B.J.; Barrick, D.E. Least-squares methods for the extraction of surface currents from CODAR crossed-loop data: Application at ARSLOE. IEEE J. Ocean. Eng. 1983, 8, 226–253. [Google Scholar] [CrossRef]
  5. Lipa, B.; Nyden, B.; Ullman, D.; Terrill, E. SeaSonde Radial Velocities: Derivation and Internal Consistency. IEEE J. Ocean. Eng. 2006, 31, 850–861. [Google Scholar] [CrossRef]
  6. Lipa, B.; Barrick, D. Analysis Methods for Narrow-Beam High-Frequency Radar Sea Echo; Technical Report 420-WP; U.S. Department of Commerce, National Oceanic and Atmospheric Administration, Environmental Research Laboratories: Washington, DC, USA, 1982; Volume 56.
  7. Lipa, B.; Barrick, D. Extraction of sea state from HF radar sea echo: Mathematical theory and modeling. Radio Sci. 1986, 21, 81–100. [Google Scholar] [CrossRef]
  8. Lipa, B.; Nyden, B. Directional wave information from the seasoned. IEEE J. Ocean. Eng. 2005, 30, 221–231. [Google Scholar] [CrossRef]
  9. Stewart, R.; Joy, J. HF radio measurements of surface currents. Deep Sea Res. 1974, 21, 1039–1049. [Google Scholar] [CrossRef]
  10. Barrick, D.; Headrick, J.; Bogle, R.; Crombie, D. Sea backscatter at HF: Interpretation and utilization of the echo. Proc. IEEE 1974, 62, 673–680. [Google Scholar] [CrossRef]
  11. Barrick, D.; Evans, M.; Weber, B. Ocean surface currents mapped by radar. Science 1977, 198, 138–144. [Google Scholar] [CrossRef]
  12. Barrick, D.; Lipa, B. A compact transportable HF radar system fordirectional coastal wave field measurements. In Ocean Wave Climate; Earle, M.D., Malahoff, A., Eds.; Plenum: New York, NY, USA, 1979; pp. 153–201. [Google Scholar]
  13. The SeaSonde. Available online: http://www.codar.com/SeaSonde.shtml (accessed on 10 April 2019).
  14. Harlan, J.; Terrill, E.; Hazard, L.; Keen, C.; Barrick, D.; Whelan, C.; Howden, S.; Kohut, J. The Integrated Ocean Observing System High-Frequency Radar Network: Status and Local, Regional, and National Applications. Mar. Technol. Soc. J. 2010, 44, 122–132. [Google Scholar] [CrossRef]
  15. Fujii, S.; Heron, M.; Kim, K.; Lai, J.-W.; Lee, S.-H.; Wu, X.; Wu, X.; Wyatt, L.; Yang, W.-C. An Overview of Developments and Applications of Oceanographic Radar Networks in Asia and Oceania Countries. Ocean Sci. J. 2013, 48, 69–97. [Google Scholar] [CrossRef]
  16. Rubio, A.; Mader, J.; Corgnati, L.; Mantovani, C.; Griffa, A.; Novellino, A.; Quentin, C.; Wyatt, L.; Schulz-Stellenfleth, J.; Horstmann, J.; et al. HF Radar Activity in European Coastal Seas: Next Steps toward a Pan-European HF Radar Network. Front. Mar. Sci. 2017, 4–8. [Google Scholar] [CrossRef]
  17. Jena, B.; Arunraj, K.; Suseentharan, V.; Tushar, K.; Karthikeyan, T. Indian coastal ocean radar network. Curr. Sci. 2019, 116, 372–378. [Google Scholar]
  18. Saviano, S.; Kalampokis, A.; Zambianchi, E.; Uttieri, M. A Year-Long Assessment of Wave Measurements Retrieved from an HF Radar Network in the Gulf of Naples (Tyrrhenian Sea, Western Mediterranean Sea). J. Oper. Oceanogr. 2019, 1–15. [Google Scholar] [CrossRef]
  19. Daugharty, M.; Lipa, B.; Barrick, D.; Roarty, H.; Dicopoulos, J. Mapping Wave Variation in MARACOOS with SeaSonde Compact HF Radar. In Proceedings of the ORCA Conference, Okinawa, Japan, 2–4 June 2018. [Google Scholar]
  20. Abascal, A.; Castanedo, S.; Fernandez, V.; Medina, R. Backtracking Drifting Objects using Surface Currents from High-Frequency (HF) Radar. Ocean Dyn. 2012, 58, 1–18. [Google Scholar] [CrossRef]
  21. Bellomo, A.; Griffa, S.; Cosoli, P.; Falco, R.; Gerin, I.; Iermano, A.; Kalampokis, Z.; Kokkini, A.; Lana, M.; Magaldi, I.; et al. Toward an integrated HF radar network in the Mediterranean Sea to improve search and rescue and oil spill response: The TOSCA project experience. J. Oper. Oceanogr. 2015, 8, 95–107. [Google Scholar] [CrossRef]
  22. Abascal, A.; Sanchez, J.; Chiri, H.; Ferrer, M.; Cárdenas, M.; Gallego, A.; Castanedo, S.; Medina, R.; Alonso-Martirena, A.; Berx, B.; et al. Operational Oil Spill Trajectory Modelling Using HF Radar Currents: A Northwest European Continental Shelf Case Study. Mar. Pollut. Bull. 2017, 119, 336–350. [Google Scholar] [CrossRef]
  23. Cardenas, M.; Abascal, A.; Castanedo, S.; Chiri, S.; Ferrer, M.; Sanchez, J.; Medina, R.; Turrell, W.; Hughes, S.; Gallego, A.; Berx, B. Spill Trajectory Modeling Based on HF Radar Currents in the North Sea: Validation with Drifter Buoys. In Proceedings of the Thirty Eighth AMOP Technical Seminar, Vancouver, BC, Canada, 2–5 June 2015; pp. 123–142. [Google Scholar]
  24. Whelan, C.; Barrick, D.; Lilleboe, P.; Breivik, Ø.; Kjelaas, A.; Fernandez, V.; Alonso-Martirena, A. Rapid Deployable HF RADAR for Norwegian emergency spill operations. In Proceedings of the Oceans 2010 IEE, Sydney, Australia, 24–27 May 2010; pp. 1–3. [Google Scholar]
  25. Roarty, H.; Smith, M.; Glenn, S.; Barrick, D.; Page, E.; Statscewich, H.; Weingartner, T. Expanding Maritime Domain Awareness Capabilities in the Arctic: High Frequency Radar Vessel-tracking. In Proceedings of the IEEE Radar Conference, Ottawa, ON, Canada, 29 April–3 May 2013; pp. 1–5. [Google Scholar]
  26. Sciascia, R.; Berta, M.; Carlson, D.; Griffa, A.; Panfili, M.; La Mesa, M.; Corgnati, L.; Mantovani, C.; Domenella, E.; Fredj, E.; et al. Linking Sardine Recruitment in Coastal Areas to Ocean Currents Using Surface Drifters and HF Radar: A Case Study in the Gulf of Manfredonia, Adriatic Sea. Ocean Sci. 2018, 14, 1461–1482. [Google Scholar] [CrossRef]
  27. Lipa, B.; Barrick, D.; Isaacson, J. Coastal Tsunami Warning with Deployed HF Radar Systems; Mokhtari, M., Ed.; InTechOpen: Rijeka, Croatia, 2016; Available online: http://www.intechopen.com/books/tsunami/coastal-tsunami-warning-with-deployed-hf-radar-systems (accessed on 10 April 2019). [CrossRef]
  28. Cook, T.; Hazard, L.; Otero, M.; Zelenke, B. (Eds.) Deployment and Maintenance of a High-Frequency Radar (HFR) for Ocean Surface Current Mapping: Best Practices; University of California San Diego, Scripps Institution of Oceanography for SCCOOS: La Jolla, CA, USA, 2008; 19p, Available online: https://www.oceanbestpractices.net/handle/11329/368 (accessed on 10 April 2019).
  29. Kohut, J.; Glenn, S. Improving HF Radar Surface Current Measurements with Measured Antenna Beam Patterns. J. Atmos. Ocean. Technol. 2003, 20, 1303–1316. [Google Scholar] [CrossRef]
  30. Emery, B.; Washburn, L.; Whelan, C.; Barrick, D.; Harlan, J. Measuring Antenna Patterns for Ocean Surface Current HF Radars with Ships of Opportunity. J. Atmos. Ocean. Technol. 2014, 31, 1564–1582. [Google Scholar] [CrossRef]
  31. Washburn, L.; Romero, E.; Johnson, C.; Emery, B.; Gotschalk, C. Measurement of Antenna Patterns for Oceanographic Radars Using Aerial Drones. J. Atmos. Ocean. Technol. 2017, 34, 971–981. [Google Scholar] [CrossRef]
  32. Whelan, C.; Hubbard, M.; Trockel, D.; Parikh, H. Benefits of Multiple Antenna Pattern Measurement Methods for Maintaining a Regional HF Radar Network. In Proceedings of the ORCA Conference, Okinawa, Japan, 2–4 June 2018. [Google Scholar]
  33. U.S. Department of Commerce, National Oceanic and Atmospheric Administration, National Ocean Service, Integrated Ocean Observing System. Manual for Real-Time Quality Control of High Frequency Radar Surface Currents Data: A Guide to Quality Control and Quality Assurance of High Frequency Radar Surface Currents Data Observations. Volume 54, 2016. Available online: https://cdn.ioos.noaa.gov/media/2017/12/HFR_QARTOD_Manual_05_26_16.pdf (accessed on 10 April 2019).
  34. Kirincich, A.; de Paolo, T.; Terrill, E. Improving HF Radar Estimates of Surface Currents Using Signal Quality Metrics, with Application to the MVCO High-Resolution Radar System. J. Atmos. Ocean. Technol. 2012, 29, 1377–1390. [Google Scholar] [CrossRef]
  35. De Paolo, T.; Terrill, E.; Kirincich, A. Improving SeaSonde radial velocity accuracy and variance using radial metrics. In Proceedings of the OCEANS MTS/IEEE Conference, Genoa, Italy, 18–21 May 2015; pp. 1–9. [Google Scholar]
  36. Cosoli, S.; Grcic, B.; de Vos, S.; Hetzel, Y. Improving Data Quality for the Australian High Frequency Ocean Radar Network through Real-Time and Delayed-Mode Quality-Control Procedures. Remote Sens. 2018, 10, 1476. [Google Scholar] [CrossRef]
Figure 1. An example of an uncontaminated radar spectrum obtained from a SeaSonde system, measured at Shelter Cove, California, 8 March, 2018, 11a.m. range 18 km. Radar-echo spectral power (dB) from the three SeaSonde antennas is plotted vs. Doppler frequency for the Loop 1 antenna (A1, red), the Loop 2 antenna (A2, green) and the monopole (A3, blue). The curves are offset by 20 dB for better visibility. The first-order Bragg peaks at Doppler ± 0.22 Hz are surrounded by second-order echo, with the second-order peak especially visible to the right of the positive Bragg peak. The yellow line is an indicator of spectral quality.
Jmse 07 00112 g001
Figure 2. An example of a contaminated radar spectrum, measured at Shelter Cove, California: 7 March, 2018, 00:30 a.m., range 18 km. The radar transmit frequency was 4.8 MHz. For plot details, see the caption of Figure 1.
Jmse 07 00112 g002
Figure 3. Radial velocities obtained from the radar data 7 March, 2018, 00:30 a.m., range 18 km from (a) negative and (b) positive Doppler first-order regions. Red/blue radial vectors approach/recede from radar.
Jmse 07 00112 g003
Figure 4. RMS deviations plotted vs. Doppler frequency for Shelter Cove on 7 March, 2018, 00:30 a.m., range 18 km (a) negative (b) positive Doppler frequencies.
Jmse 07 00112 g004
Figure 5. Radial velocities for which the RMS deviations do not exceed 5, from the radar data 7 March, 2018, 00:30 a.m., range 18 km.
Jmse 07 00112 g005
Figure 6. Comparison of current velocity maps obtained with and without QC (Quality Control) at Trinidad, California. Radar transmit frequency: 4.8 MHz. The threshold S l i m was set to 25. 21 July, 2018, 6:00 a.m.: (a) without QC, R M S a v = 32.2 (b) with QC, R M S a v = 11.2. 22 July, 2018, 4:00 a.m.: (c) without QC, R M S a v = 83.9 (d) with QC, R M S a v = 12.8.
Jmse 07 00112 g006
Figure 7. Comparison of current velocity maps obtained with and without QC at Big Creek, California. Radar transmit frequency 4.5 MHz. The threshold S l i m was set to 8.0. 2 March, 2018, 8:30 p.m.: (a) without QC, R M S a v = 858.6 (b) with QC, R M S a v = 1.9. 2 March, 2018, 21:00: (c) without QC R M S a v = 414.4, (d) with QC R M S a v = 1.6.
Jmse 07 00112 g007
Figure 8. Comparison of current velocity maps obtained with and without QC at Sea Bright, New Jersey. Radar transmit frequency 13.5 MHz. The threshold S l i m was set to 1.4. 6 October, 2018, 20:30, 6:00 a.m.: (a) without QC, R M S a v = 2.9 (b) with QC, R M S a v = 0.48. 8 October, 2018, 11:00 p.m.: (c) without QC R M S a v = 3.2 (d) with QC R M S a v = 0.49.
Jmse 07 00112 g008

