1. Introduction
The growing importance of economic activities in coastal areas highlights the need for the development and implementation of monitoring programs as a support for management and coastal hazard assessment. In this context, remote and in situ observations allow the monitoring of deep water and coastal dynamics and provide crucial data to track their evolution [
1]. However, measurements have two main downsides: first, they usually lack large spatial coverage since data are available at specific locations and in the second place they are unable to foresee evolutions beyond the time of the latest measurement. Operational wave systems based on forecast simulations are able to predict wave conditions a few days in advance and provide conditions over a wide geographical area, thus extending and complementing the information from measurements [
2]. Nowadays, monitoring programs including the combination of measurements and simulations seem to represent the best choice in terms of data reliability, spatial/time coverage and costs [
3]. For this reason they continue to receive an increasing attention from coastal scientists and managers, providing benefits for beach management, risk assessment and coastal planning [
4,
5,
6].
In this work, we assess the performance of an operational wave system in the Mediterranean Sea by comparing computed wave data with three measured wave datasets, one of them obtained in the nearshore and the others in intermediate and deep waters. The nearshore data were collected in the Gulf of Cagliari, Southern Sardinia, where this study focuses. In recent decades, the coastal areas of the Gulf of Cagliari have been experiencing an intense urbanization with the development of the city of Cagliari and its hinterland (about 500,000 inhabitants). Residential development in addition to industrial activities have led to significant human pressure on the two beach systems, Giorgino and Poetto, included in the metropolitan area of Cagliari. A monitoring program, including periodic field surveys and video image acquisition, has been set up and implemented in the last five years at Poetto beach by the Coastal and Marine Geomorphology Group (CMGG) of the University of Cagliari [
7].
As a specific task of the beach monitoring program, a field experiment was carried out in spring 2017 to collect nearshore wave and current data. We use these nearshore data, together with intermediate and deep water buoy data proceeding from the French agencies Cerema and Meteo France, to assess the reliability of an operational wave system running for the entire duration of the experiment. A spectral wave model coupled with an atmospheric model is used to simulate wave propagation over the Mediterranean Sea, with an increased spatial resolution in the coastal waters surrounding the islands of Sardinia and Corsica. This operational wave system, replicable in similar contexts, can serve as a key tool for decision makers and stakeholders in various coastal and maritime sectors. For example, the maritime transport needs accurate wave forecasts in order to secure operations at sea and prevent potential pollution. Moreover, a detailed wave information is valuable to predict vulnerability to storm impacts including flooding risk. For instance, widely-used formulations for maximum runup prediction on beaches rely upon incoming wave parameters measured or computed in coastal waters outside the surf zone [
8,
9]. Thus, wave operational systems appear to be of importance for port authorities, civil protection and coastal managers to anticipate and respond to extreme wave conditions that could interfere in port operations or damage beach infrastructures, potentially leading to safety risks. Another important application concerns scientific and economic aspects linked to the coastal and marine planning projects, operational assistance in coastal development, and monitoring of coastal processes such as beach erosion and sediment transport.
The ultimate goal of this work is to test the viability of incorporating an operational wave system in a beach monitoring program for a Mediterranean urban beach, including remote as well as in situ measurements. Besides, our work aims to extend the current knowledge of the capabilities of operational wave systems in forecasting wave conditions in the Mediterranean Sea. In this study, special attention is devoted to the identification of the model limitations in reproducing coastal wave conditions generated over limited Mediterranean fetches (on the order of hundreds of km) and under the local influence of varying sea breezes. Wave modelling under these environmental conditions has been recognized as particularly challenging by the literature [
10,
11], thus requiring further research.
The paper is structured as follows.
Section 2 describes the monitoring program along with the operational wave system.
Section 3 reports the system validations against measured data.
Section 4 discusses the results and
Section 5 draws some conclusions.
3. Results
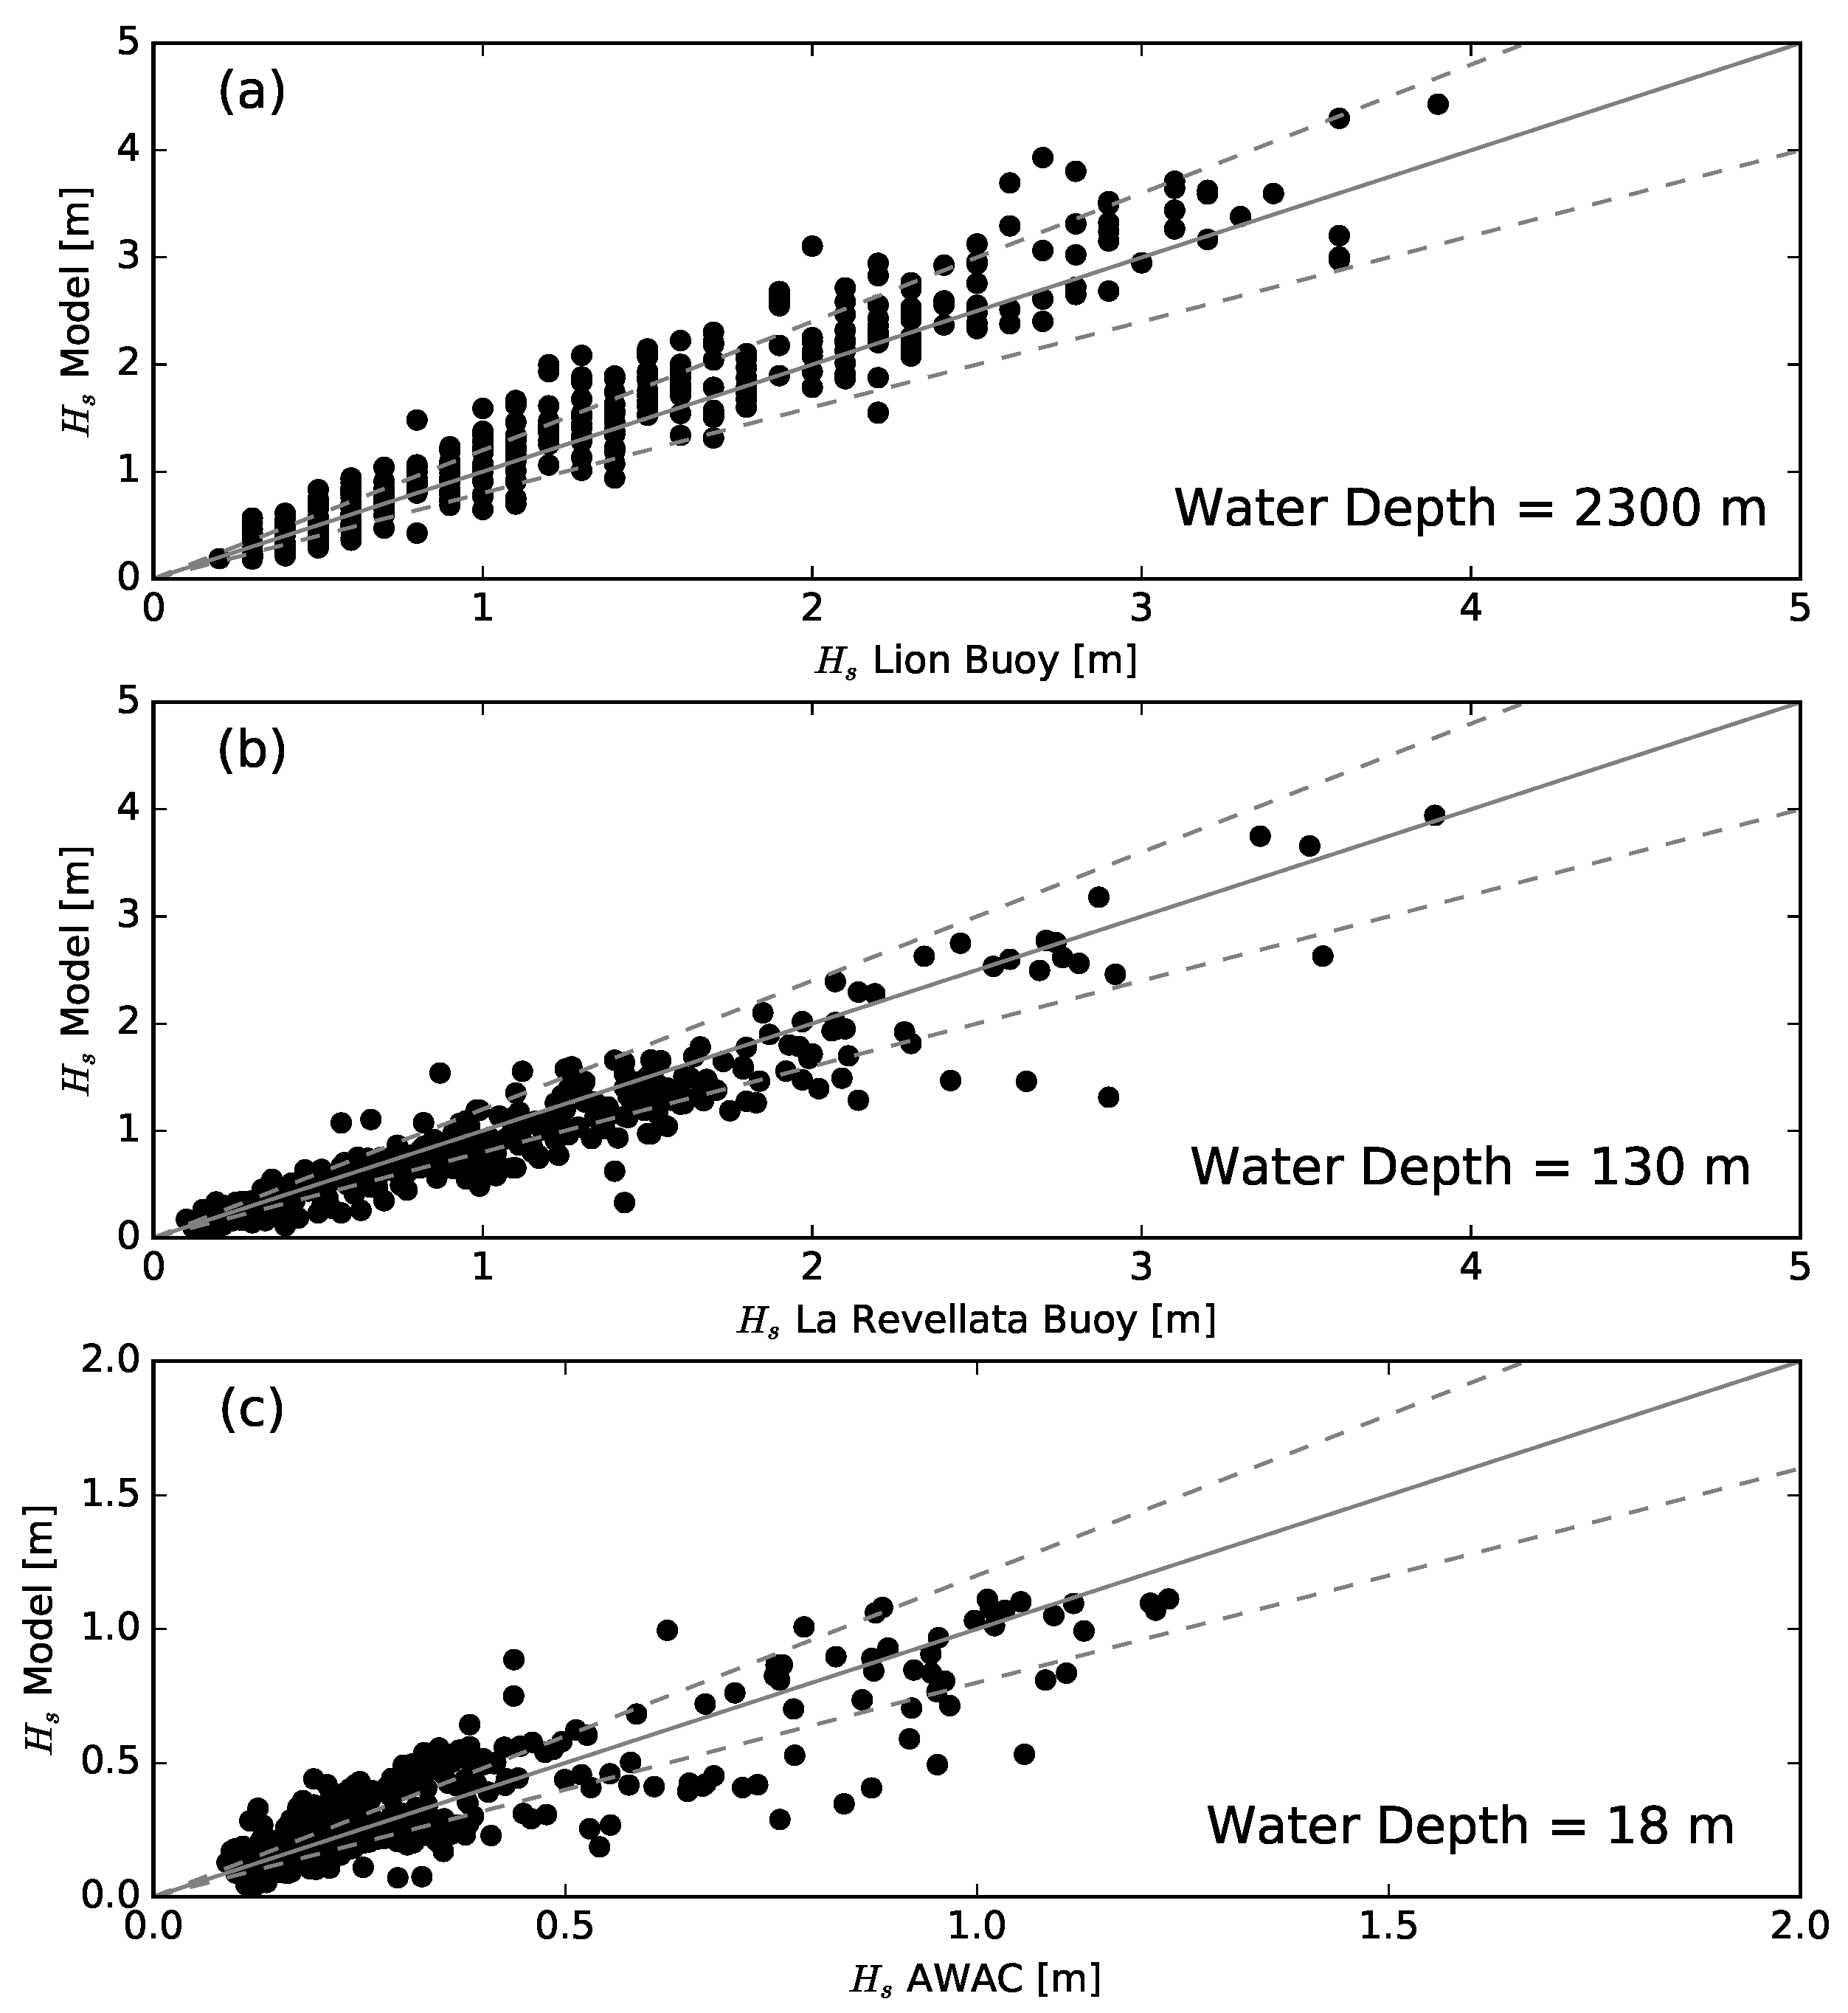
Figure 4 and
Figure 5 show the comparison between measured and computed data of significant wave height
at the Lion buoy (deep water), La Revellata buoy (intermediate water) and AWAC (nearshore) at Poetto. Comparisons of wind data time series are displayed in
Figure 6. Wind measurements are extrapolated to an elevation equal to that of the GFS output (10 m above the mean sea level) by assuming that a logarithmic velocity profile develops within the atmospheric boundary layer:
where
is the wind speed at 10 m above the mean sea level,
C is a friction coefficient obtained with the formulation proposed by Garratt [
36]. The statistical indicators of parameters displayed in
Figure 5 and
Figure 6 are reported in
Table 2. The operational wave system is able to satisfactorily reproduce the evolution of the significant wave height in deep/intermediate waters where the relative error is 17% both at Lion and La Revellata buoys. In addition, the wind evolution is well addressed by the GFS with a relative error (15%) on the same order of magnitude as that of significant wave height at the Lion buoy. Positive bias values suggest that both the predicted wind speed and wave height are slightly overestimated in deep waters. On the other hand, small negative bias values are observed at La Revellata buoy. The correlation coefficients of both wind and significant wave height (0.61 and 0.84) at Poetto beach are lower than those obtained in deep waters (0.91 and 0.93). The relative error of significant wave height exceeding 25% is likely to be related to the inaccuracies in wind speed predictions (relative error of 34%). In contrast with deep waters, nearshore data at Poetto beach are characterized by a pronounced short-period variability with daily peaks in wind speed and significant wave height possibly due to sea breezes (see
Section 4). Although the system reproduces the general wind pattern, some peaks in wind speed are underestimated; see for instance the days following 24 April in which the anemometer measured wind speeds on the order of 20 kts but the GFS predicts speeds lower than 15 kts. As a result, significant wave heights during the same week are underestimated (although with less discrepancies than wind) by the wave model.
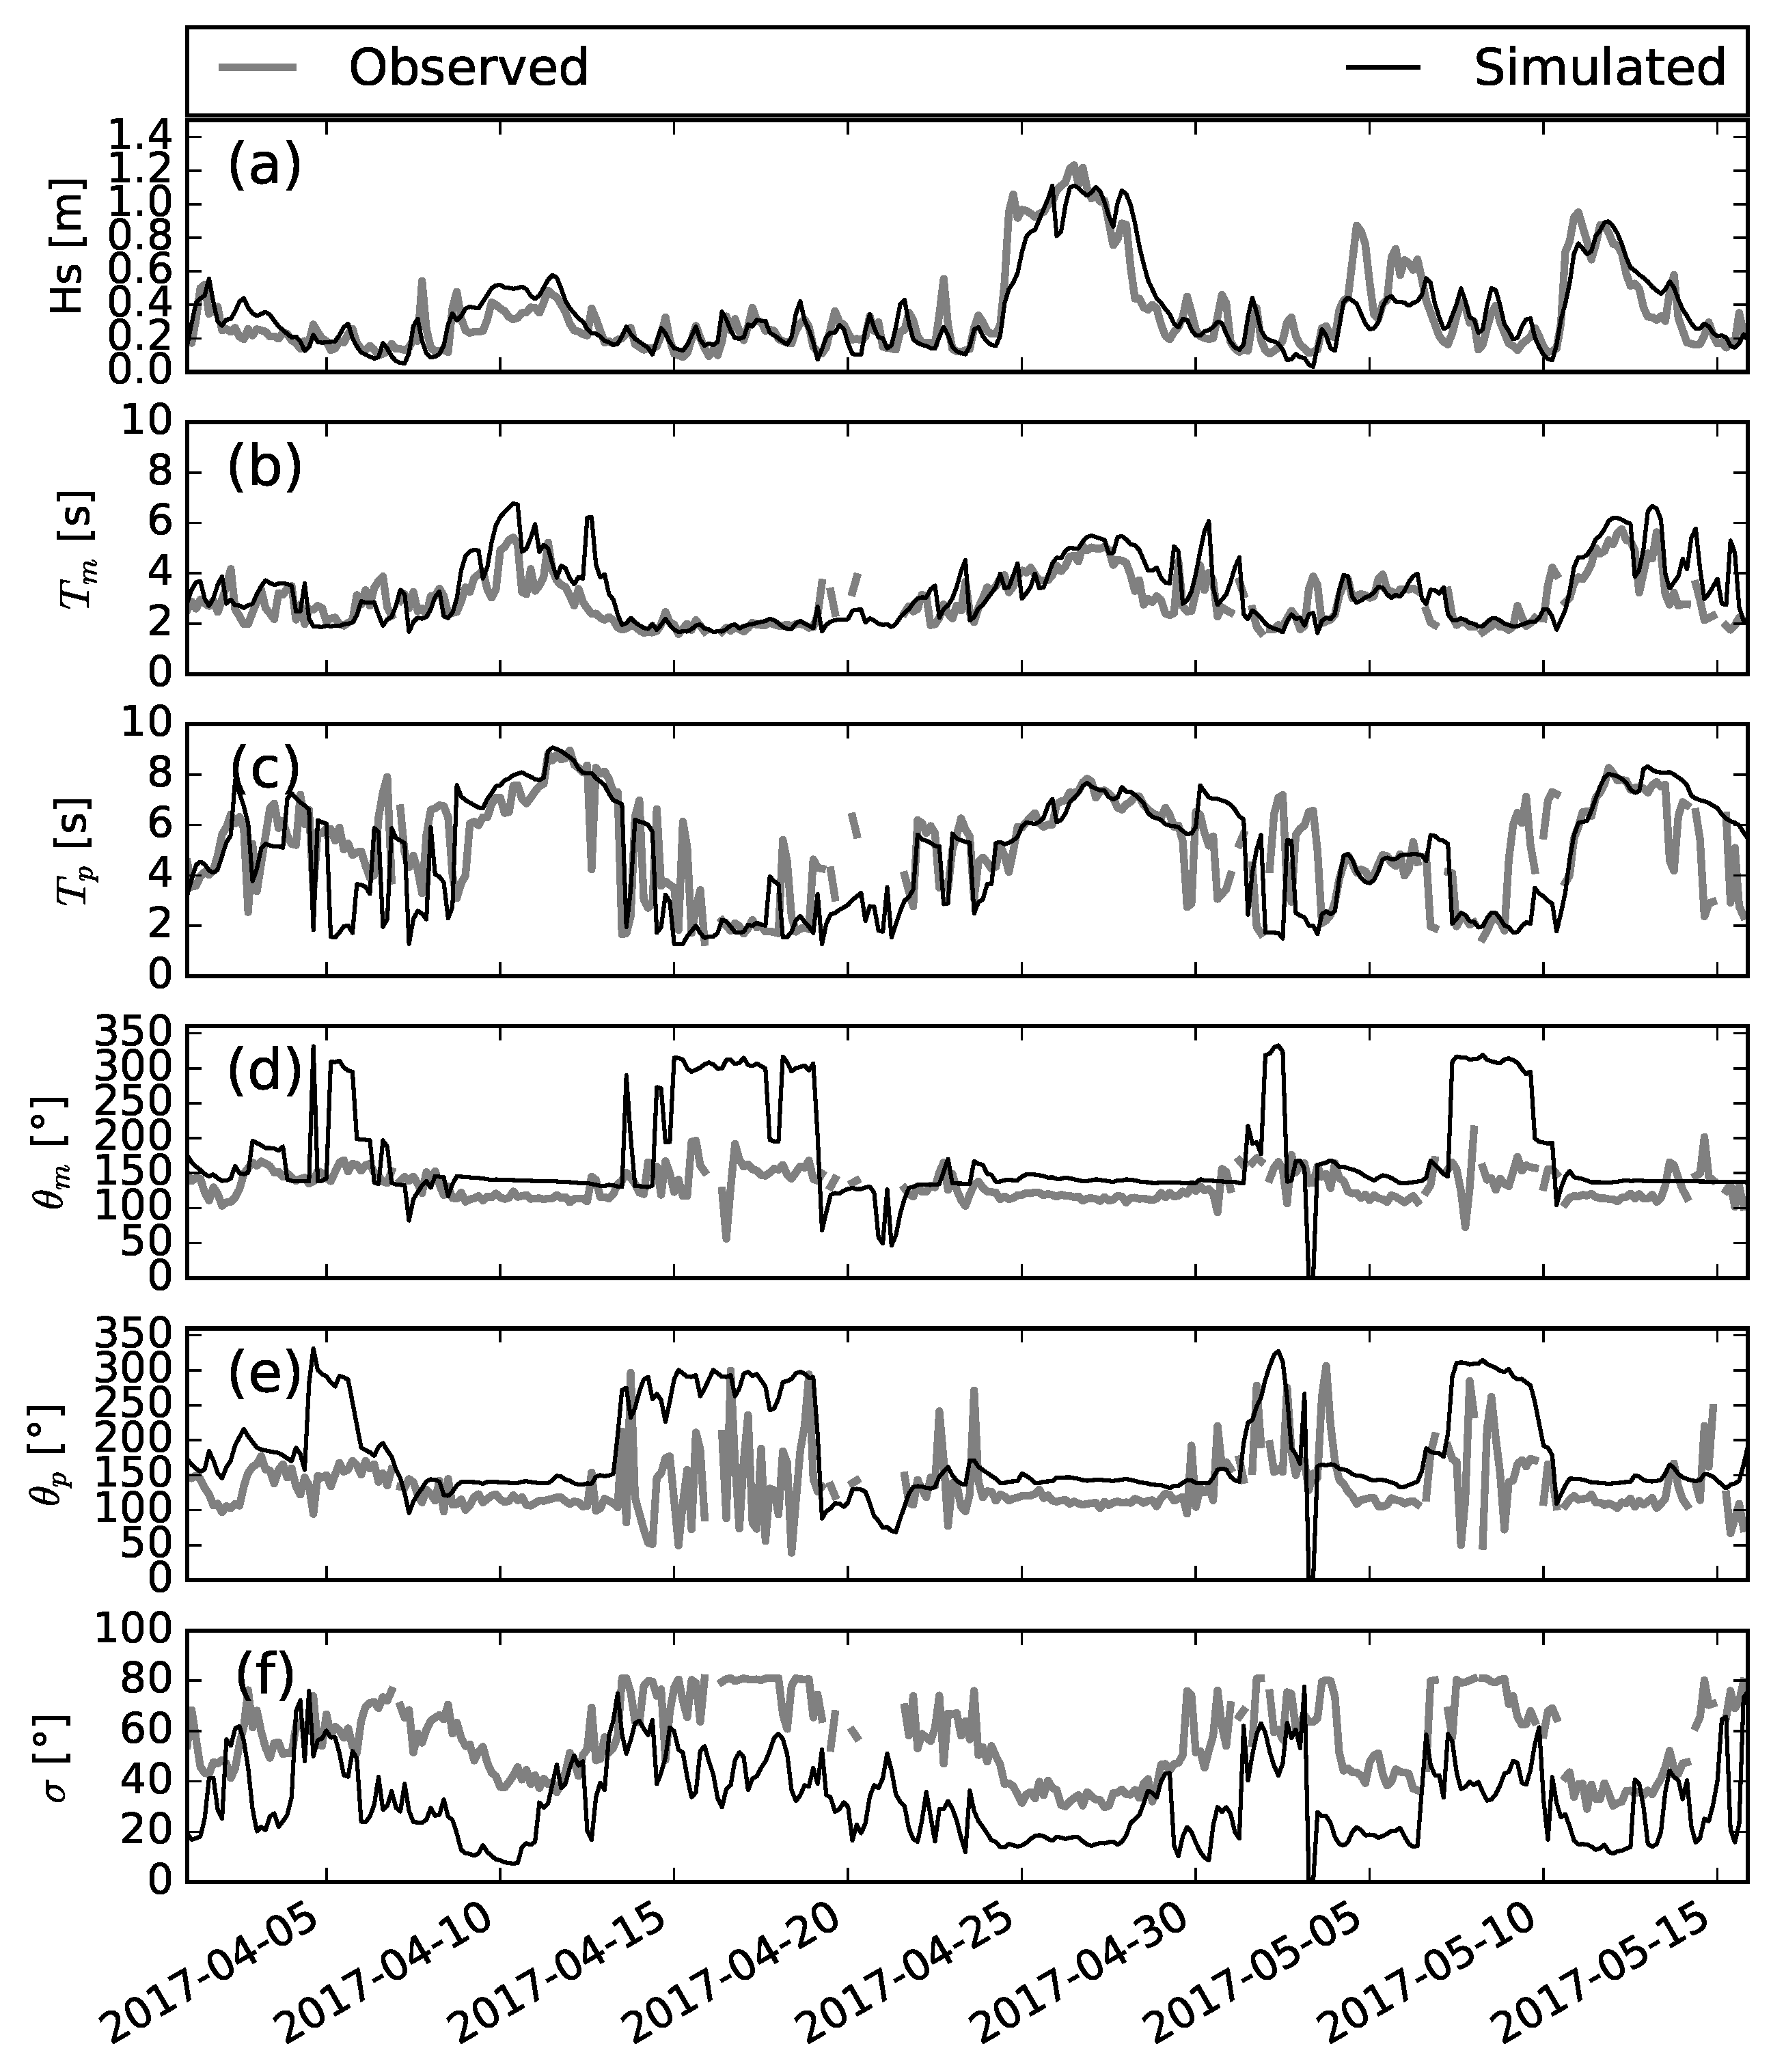
Figure 7 and
Figure 8 plot the time series of measured and predicted bulk wave parameters at La Revellata buoy and in the nearshore at the AWAC location, respectively. The evolution of significant wave height, already presented in
Figure 5, is kept here as a reference. La Revellata buoy (
Figure 7) measured maximum values of the mean period between 6 and 7 s while the peak period reached 10 s under energetic conditions. The model is able to satisfactorily catch the time evolution of mean and peak period (
of both mean and peak period is 0.14 with absolute
B values lower than 0.1 s). The mean wave direction of propagation ranges from West-South-West to North and seems well reproduced by the model. The wave directional spread evolution is poorly caught by the model (
) that, in addition, significantly underestimate its values (
).
In coastal water at Poetto beach (
Figure 8), mean periods (panel b) rise to values on the order of 5 and 6 s during relatively energetic conditions. At the same time, the peak period (panel c) reaches 7 to 8 s under energetic wave states with some abrupt variations due to shifts of the spectrum peak between sea and swell bands. While the wave model seems to correctly address the peak period maximum values (
= 0.27, bias
B is −0.34 s), the mean period remains overestimated especially under energetic conditions (
= 0.22,
s). We will comment about this later in
Section 4. The AWAC recorded incident waves with a mean direction of propagation ranging almost exclusively between East and South-East. On the other hand, the mean wave direction predicted by the model tends to be more South and South-East with some notable inversions to offshore propagation. These inversions with waves coming from the North-West are noticeable also in the measured peak wave direction and are likely to be associated with offshore winds, weak incoming wave energies and small wave periods. Panel (f) of
Figure 8 shows that the system significantly underestimates the values of the wave directional spread in nearshore waters (bias
). Large directional spread values on the order of 80
are recorded when peak wave direction turns to North-West (see panel e) implying the superposition of offshore and onshore propagating spectral components. In addition, the system predicts directional spread values in phase with offshore peak wave directions but with values hardly exceeding 60
. Besides the discrepancies in magnitude, the system is able to catch the main trend of directional spread variation with low values appearing when the mean wave direction is mainly South-East oriented (onshore).
Although the operational wave system gives a prediction five days ahead, up to this point this work has made the assessment of the results for the first day of prediction only (with a temporal extension from 0 to 21 h from the beginning of the simulation). The quality of the prediction is expected to decrease as the time from the start of the simulation (lead-time) increases [
6].
Figure 9 shows how the relative error at the Lion buoy rises from 17% of the first day to 27% of the fourth day of simulation (from 72 to 93 h from the start). Under the same lead-time range, the relative error passes from 17 to 28% at La Revellata buoy and from 28 to 35% at Poetto beach. This deterioration of the wave forecast accuracy with the lead-time is likely to be related to larger uncertainties in the wind forcing fields [
10,
37]. Despite the accuracy loss, the relative error remains under moderate values, confirming the reliability of the prediction for the time window covered by the simulation. The bias
B values at the three locations keep the same sign (positive at Lion buoy and negative at la Revellata) along the days of the time window without showing a clear trend. The analysis of the prediction accuracy as a function of lead-time is not further pursued in this work.
4. Discussion
The results presented in
Section 3 show that the operational wave system performs better in deep waters and intermediate waters than in the nearshore. This outcome is in agreement with Ravdas et al. [
10] who found relatively low correlations at coastal locations. Whereas correlation coefficients for wind speed and significant wave height are 0.91 and 0.93 in deep waters at the Lion buoy site, they drop to 0.62 and 0.85 when computed data are compared with measurements in the nearshore at Poetto beach. The fact that in the nearshore the correlation coefficient of significant wave height is larger than that of the wind speed suggests that local meteorological forcing, playing an important role in wave dynamics, are not completely addressed by the GFS model. The GFS is a global meteorological model that, due to the adopted horizontal resolution (0.25
), may not be the most appropriate tool for forecasting coastal wind dynamics. Besides the fact that complex land topographies play a significant role in the evolution of coastal winds, it is worth mentioning that it is in the spring season that the difference between the sea water temperature and the temperature of the lower layers of the atmosphere is strongest. This leads to intense coastal sea breezes blowing onshore at the central part of the day, resulting in marked daily oscillations in the wind speed and consequently in the significant wave height signals (see
Figure 5 and
Figure 6). These factors together make the prediction of waves in coastal waters particularly challenging, especially in the spring season.
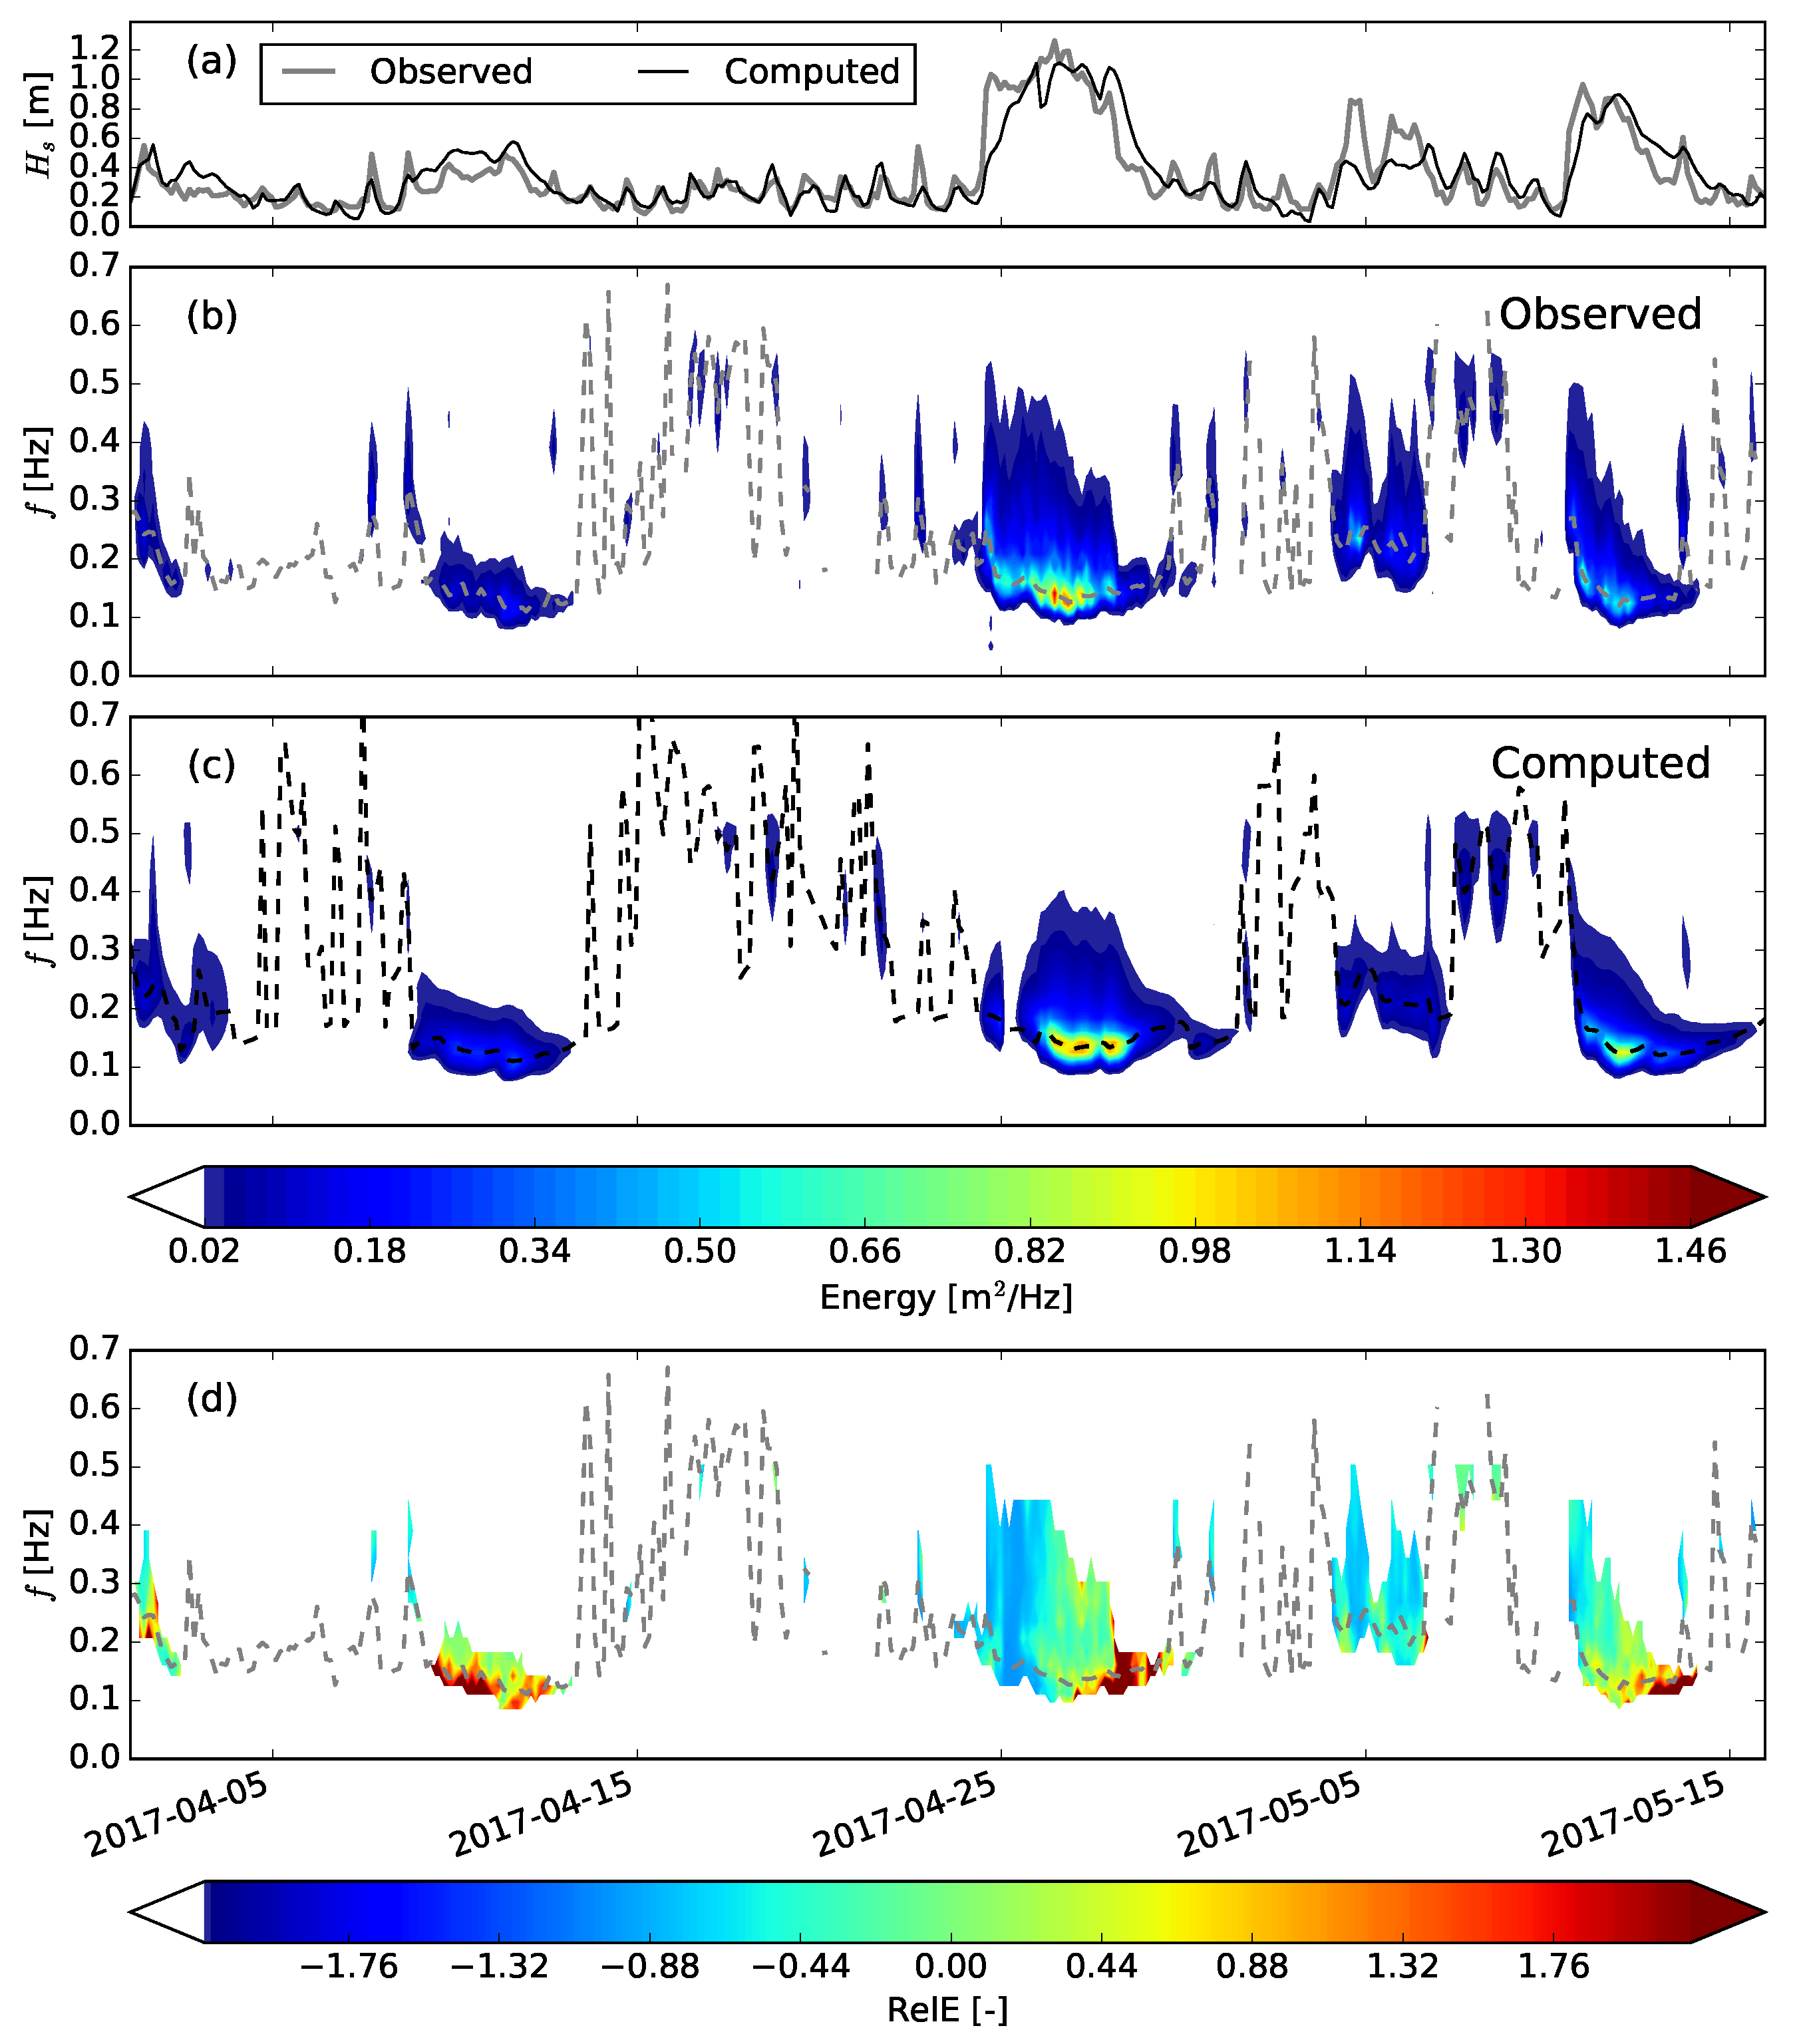
To investigate where the mentioned discrepancies in spectral bulk wave parameters come from,
Figure 10 displays the observed and computed 2D wave spectra in the nearshore at the time instant of the maximum significant wave height recorded during the period of the experiment (see panel d). 1D frequency spectra are shown in the panel (c) of the Figure. The operational system predicts wave conditions with a mean propagation direction more southern oriented with respect to measurements (142
predicted versus 115
measured). This discrepancy is likely to be related to complex coastal bottom features leading to significant refraction processes that cannot be completely addressed even with the adoption of the small scale numerical grid. In fact, the spatial resolution of the fine grid (0.017
) seems to be able to address the main features of the wave propagation pattern in the nearshore but is likely to be unable to catch the detailed wave transformation in shallow waters. The use of a finer grid, proceeding from a detailed bathymetric survey, with a spatial resolution of the order of 100 m is expected to improve the characterization of nearshore and shallow water waves. However, one should bear in mind that this different set-up would bring a drawback represented by an increase of the computational cost. Due to the large number of different strategies and configuration settings that can be adopted to increase the characterization of coastal wave processes, we avoid providing here a quantitative estimation of the required increase of the computational effort.
From the observation of
Figure 10, it is evident how wave energy is spread across a wide range of directions in the observed spectrum whereas computed energy tends to be concentrated around the main peak (simulated wave directional spread is 17.67
whereas the AWAC registered a direction spread of 32.92
). Negative biases in directional spread predictions have been reported by Crosby et al. [
38] who ascribed this discrepancy to a weak computed coastal reflection. In our case, the spectral shape suggests that the directional spread underestimation is likely to be a consequence of the wind underestimation by the GFS model. In fact,
Figure 6 reveals a significant underestimation of wind speed at Poetto when the maximum wave height occurs (morning of 26 April). Note also that the computed 1D spectrum lacks the secondary peak at 0.21 Hz that is clearly observable in the measurements (
Figure 10, panel c). The underestimation of locally generated sea waves is likely to be responsible for the overestimation of the mean period. Since the wave results rely upon wind predictions, the use of a more accurate atmospheric model with a resolution able to address the effects induced by complex coastal topographies is expected to improve the characterization of sea wave components mainly driven by local meteorological forcing.
Relevant insight into the capability of the model to simulate nearshore wave processes can be achieved by the observation of
Figure 11 that plots the time evolution of the measured and computed 1D frequency spectra at Poetto beach. Although discrepancies can be detected, the model satisfactorily reproduces the main evolution patterns of observed frequency spectra. In particular, moderate wave energy at high frequencies that appears in the period with absence of ground swells (see the period from 15 April 2017 to 23 April 2017) is likely to be generated by local wind breezes that blow over a limited fetch. In addition, the distribution of wave energy during the energetic events seems to be well addressed by the model, although the observation of panel (d) reveals that energy tends to be overpredicted at frequencies below the peak frequency. An analogous discrepancy was reported by Rogers and Vledder [
39] who suggested that such overprediction is a common feature of models that implement the Discrete Interaction Approximation (DIA). Finally, the underprediction of high frequency energy is likely to be the result of the poor characterization of wind speed in coastal areas already mentioned.
The magnitude of the statistical error indicators of significant wave height found in the present study in intermediate and deep waters is on the same order of magnitude of that obtained by state-of-the-art wave systems recently developed for the Mediterranean basin [
2,
10]. In particular, Ravdas et al. [
10] reported an averaged scatter index of 0.25 similar to the scatter index we obtained at La Revellata buoy (0.23). In that study, they compared the results of the operation wave system, based on the community Wave Model (WAM) forced by forecast winds from the European Centre for Medium-Range Weather Forecasts (ECMWF), with measured wave data proceeding from regional and national wave buoy nets deployed in water depths in the order of, or larger than, 100 m. Due to extensive measured dataset, they were able to provide assessment metrics for different Mediterranean Sea subregions. In contrast with the methodology followed by Ravdas et al. [
10] who applied a computational grid with constant spatial resolution of 1/24
covering the whole Mediterranean basin, in this study we have nested a coastal fine grid (resolution 1/60
) into a deep-water coarse grid (resolution 1/6
). Our multi-grid approach is intended to improve the characterization of the coastal wave processes relevant for the beach monitoring program.
While most of the wave operational systems present in the literature are tested against data (from wave riders or satellite) retrieved in deep or intermediate water [
2,
6,
10], we include an evaluation of our operational wave system against wave measurements collected at 18 m depth. Among the few examples of operational wave systems tested in shallow waters, we can compare our results with Ponce de Leon and Orfila [
11]. Ponce de Leon and Orfila [
11] used three different wind datasets and two phase-averaged spectral wave models with a grid resolution of 1500 m to simulate waves around Mallorca Island (Spain, Mediterranean Sea) under the effect of fast-changing sea breezes. Thus, their wave conditions, characterized by a combination of moderate Mediterranean swells and locally-generated wind waves, were similar to those we have observed in our experiment at Poetto beach. Testing their system with wave data at a water depth of 135 m, they obtained a scatter index (
= 0.35) higher than that we have obtained at the same depth (
= 0.23 at La Revellata). However, when the evaluation was extended to shallower depths (28 m depth), the performance of their system decreased (
= 0.4). A decrease in precision in shallower depths is also found in our work, but the
for the system presented in this paper remains below 0.35. Although the quality of the predictions in coastal waters is not as excellent as that in intermediate and deep waters, the multi-grid approach adopted in this study allows the specification of the main wave propagation features in the presence of complex shoreline geometries and under the effect of coastal breezes.
5. Conclusions
This work assesses the performance of an operational wave system included in a beach monitoring program for the Poetto beach (Southern Sardinia). The operational wave system aims to extend and complement in situ observations and the information collected by a video camera installation. The wind field from the atmospheric model GFS represents the forcing of the wave model WWIII. The wave model runs once a day to predict the wave evolution for five days ahead in the entire Mediterranean Sea using a multi-grid approach in which high spatial resolution is achieved in the coastal seas surrounding the islands of Sardinia and Corsica. The reliability of the operational system is tested by comparing the computed results with measurements collected at different water depths.
In general terms, the operational wave system presented in this work is able to predict the wave evolution in deep and intermediate waters with excellent accuracy (relative error of significant wave height is equal to 17%). However, the relative error of significant wave height rises to 28% in front of Poetto beach at 18 m depth. Moreover, the model underestimates the directional spread, especially in the nearshore (the bias is −8 in 130 m depth and −25 at 18 m depth). The analysis of spectral results suggest that the implementation of few improvements is advisable to refine the characterization of wave transformation processes in coastal and shallow waters. The main improvements can be identified as: an increased resolution of the computational grid (built from a detailed bathymetric survey) in coastal areas and the coupling with an atmospheric model able to catch local effects. These changes in the system configuration would have the associated drawback represented by an increase of the computational cost. Reducing the error in coastal waters would contribute to the reduction of the uncertainty of the operational wave system applications in coastal hazard and management.
Even with the mentioned limits, the information provided by the operational wave system can integrate measurements collected by in situ and remote systems inside a multi-platform monitoring program. By making this environmental dataset available to coastal scientists and managers, the monitoring program is of crucial importance to plan economical activities in coastal areas with applications including flood and erosion risk assessment, beach management and support to stakeholder activities. The dataset produced through the monitoring tasks is especially important in areas subject to considerable anthropological pressure, such as the beach systems of the metropolitan area of Cagliari, where the knowledge of wave forcing is a key factor to understand and predict short and long-term geomorphological processes.

 ,
, 


