Article

The Effect of Rudder Existence on Propeller Eccentric Force

Samsung Heavy Industries Co., Ltd., 217 Munji-ro, Yuseong-gu, Daejeon 34051, Korea
*
Author to whom correspondence should be addressed.
J. Mar. Sci. Eng. 2019, 7(12), 455; https://doi.org/10.3390/jmse7120455
Submission received: 3 November 2019 / Revised: 2 December 2019 / Accepted: 4 December 2019 / Published: 12 December 2019

Abstract

:
In order to design a safe shafting system in a ship, it is vital to precisely predict load on stern tube bearing. It is well known that load on stern tube bearing is directly influenced by the eccentric force of a propeller. In this paper, the effect of rudder existence on propeller eccentric force was studied based on numerical analysis with a 10,000 TEU class container vessel. To obtain propeller eccentric force, numerical simulations including propeller rotation motion using a sliding mesh technique were carried out. When a ship is turning, propeller eccentric force significantly changes compared to those of straight run. For starboard turning especially, the propeller vertical moment was decreased by about 50% due to the existence of a rudder compared to that without a rudder. In contrast, as for port turning, the results of simulations with and without a rudder were similar to each other. This difference is fundamentally due to the interaction between the direction of propeller rotation and the inflow direction to a propeller. Based on this study, it is inferred that the influence of appendages around a propeller need to be considered to ensure the reliable prediction of propeller eccentric force.

1. Introduction

The safe design of a shafting system on a ship has been a critical issue for a long time. If unexpected problems on a shafting system occur on the voyage under harsh sea conditions, the safety of people on the ship would be at risk. With this reason in mind, a shafting system has been designed conservatively according to the strict guidance of classification societies. A shafting system consists of a propeller, a shaft, bearings and so on. The load on stern tube bearing located in front of a propeller is directly related to the eccentric force of a propeller [1]. Since a propeller rotates in a non-uniform wake field, eccentric force on a propeller is continuously provided and they are changed dramatically during ship turning. Although a number of processes to calculate or check for the design of a shafting system exist, unintended problems, such as stern tube bearing damage, are rarely but still addressed. Moreover, classification societies such as ABS [2] or DNV-GL [3] have published a revised guideline for the safe design of a shafting system. The predicted eccentric force of a propeller from numerical simulations is used to calculate the stern tube bearing load to ultimately secure the safety of a shafting system. For this purpose, detail conditions, including draft and ship speed for reliable numerical simulations, are strictly clarified in the guidelines of most of the classification societies. Besides, some researchers have investigated a safe shafting system for a long time in line with academic interests or engineering needs. Kuroiwa et al. [4] proposed a quasi-steady method to estimate the wake into the propeller during ship turning and showed that the propeller shaft force evaluated by the proposed method was similar to the measured value from the model test. Vartdal et al. [5] analyzed the lateral force on the propeller during ship turning motion by full-scale measurement in various ship types. They calculated the contact pressure in the tail shaft bearing using the FEM simulation. Moreover, they asserted that the CFD simulation can be an effective method of predicting these forces with reasonable accuracy. Ui [1] investigated the influence of propeller force on shaft alignment based on the data from 35 vessels of 10 ship-yards participating in the JIME research committee. He examined two representative trouble cases; (1) A hard turn to starboard side, (2) An extremely shallow draught. Coraddu et al. [6] showed asymmetric propeller behavior obtained by thrust and torque measurement on a twin-screw vessel during a free running test. Different wake distribution into two propellers (leeward and windward) during the ship-turning motion was simulated by numerical method. Based on this wake, the propeller loads were evaluated using BEMT model. Shin [7] studied the effect of propeller force on propeller shaft bearing during straight run and turning. He simulated the nominal wake using commercial RANS solver and evaluated the eccentric force of a propeller using a potential code, MPUF3A. In particular, he considered the hull deflection in the shaft alignment. Ortolani et al. [8] investigated the radial bearing force exerted by the propeller during model ship operation. In particular, a free running test was carried out and the realistic radial bearing forces were measured. Dubbioso et al. [9] analyzed the turning capability of a navy supply vessel with different rudder arrangements; twin rudders with a centerline skeg and single rudder. Due to the centerline skeg in the case of the twin rudders, the inflow to the propeller was fairly different to that of the single rudder during ship turning. Lee et al. [10] investigated the propeller eccentric force and the load of the stern tube bearing on a CRP system, compared to those of conventional single propellers. They implemented the sliding mesh technique to directly obtain the eccentric force on the propeller. They showed the shaft behavior inside the Aft-stern bush bearing in the CRP system. Dubbioso et al. [11] investigated the propeller bearing load of a twin-screw frigate vessel in a straight ahead and steady turning motion. They evaluated the wake distributions using a URANS simulation with an overlapping grid approach. The bearing loads evaluated by the BEMT model and the measurements were compared, and they tended to be similar to each other. Muscari et al. [12] examined the effect of the centerline skeg and the propeller rotation direction on the propeller bearing load in a twin-screw vessel. From their study, it can be inferred that the wake is significantly affected by the appendages around the propeller during ship turning. Ortolani and Dubbioso [13,14] measured the single blade loads on propellers during a free-running operation; a straight ahead and a steady turning motion. Their experimental data provided the insight to understand the interaction between the wake and the propeller.
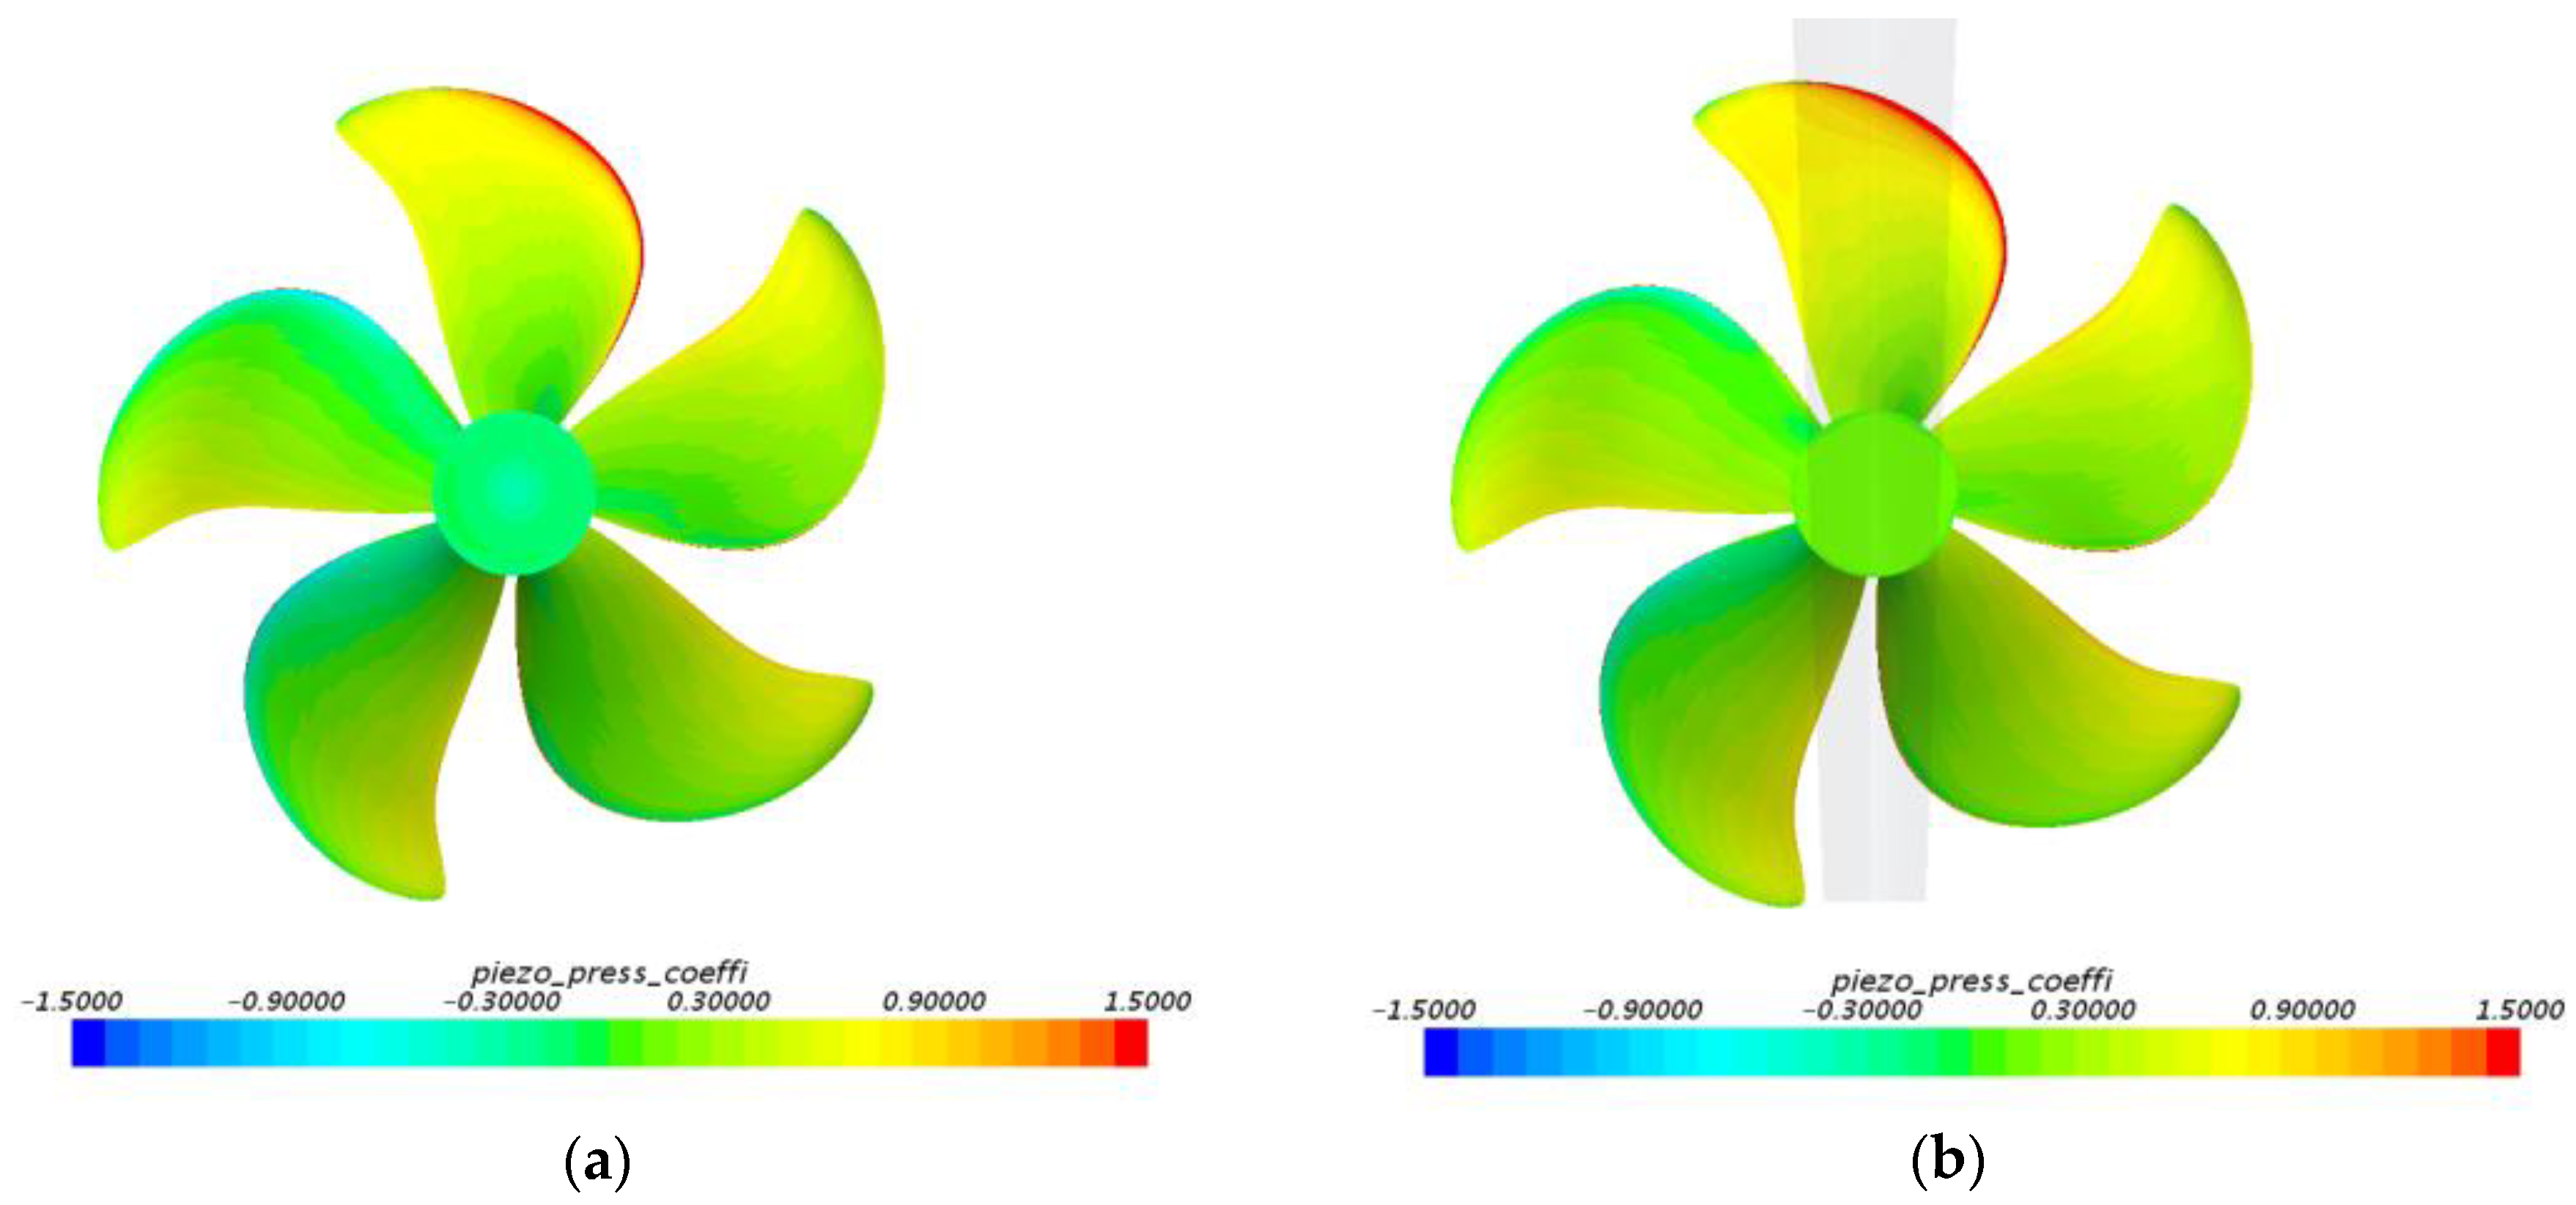
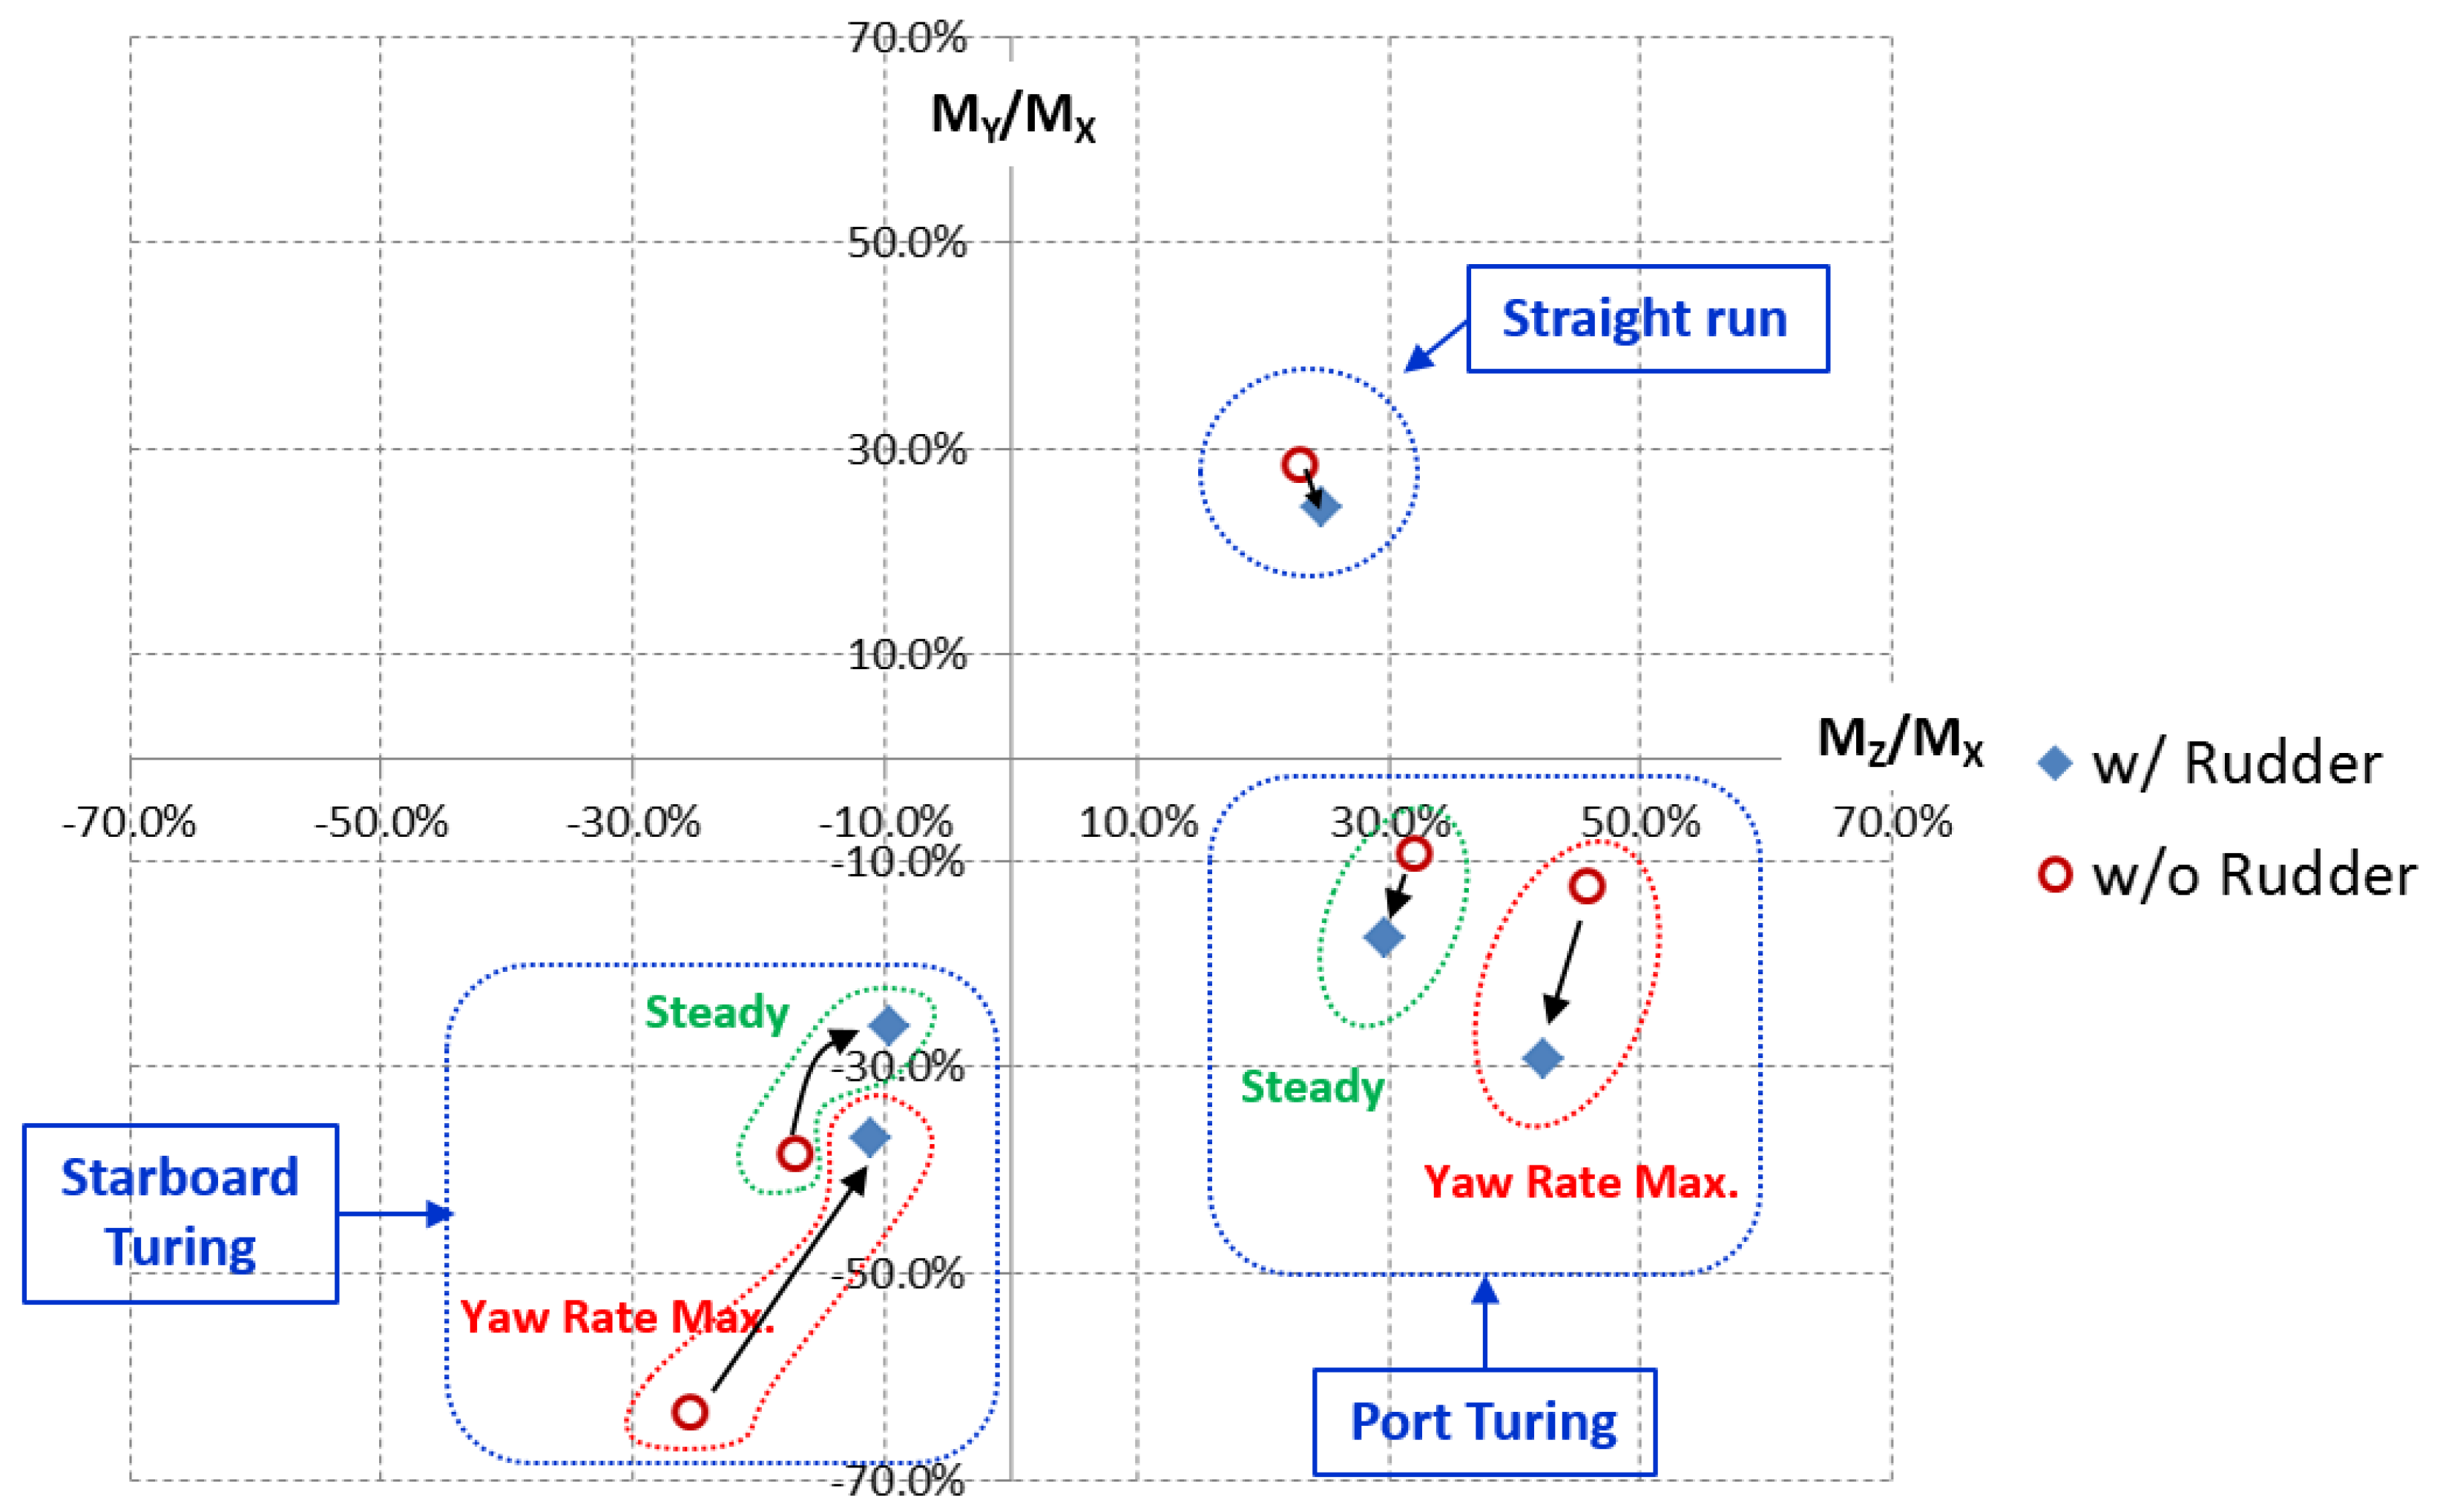
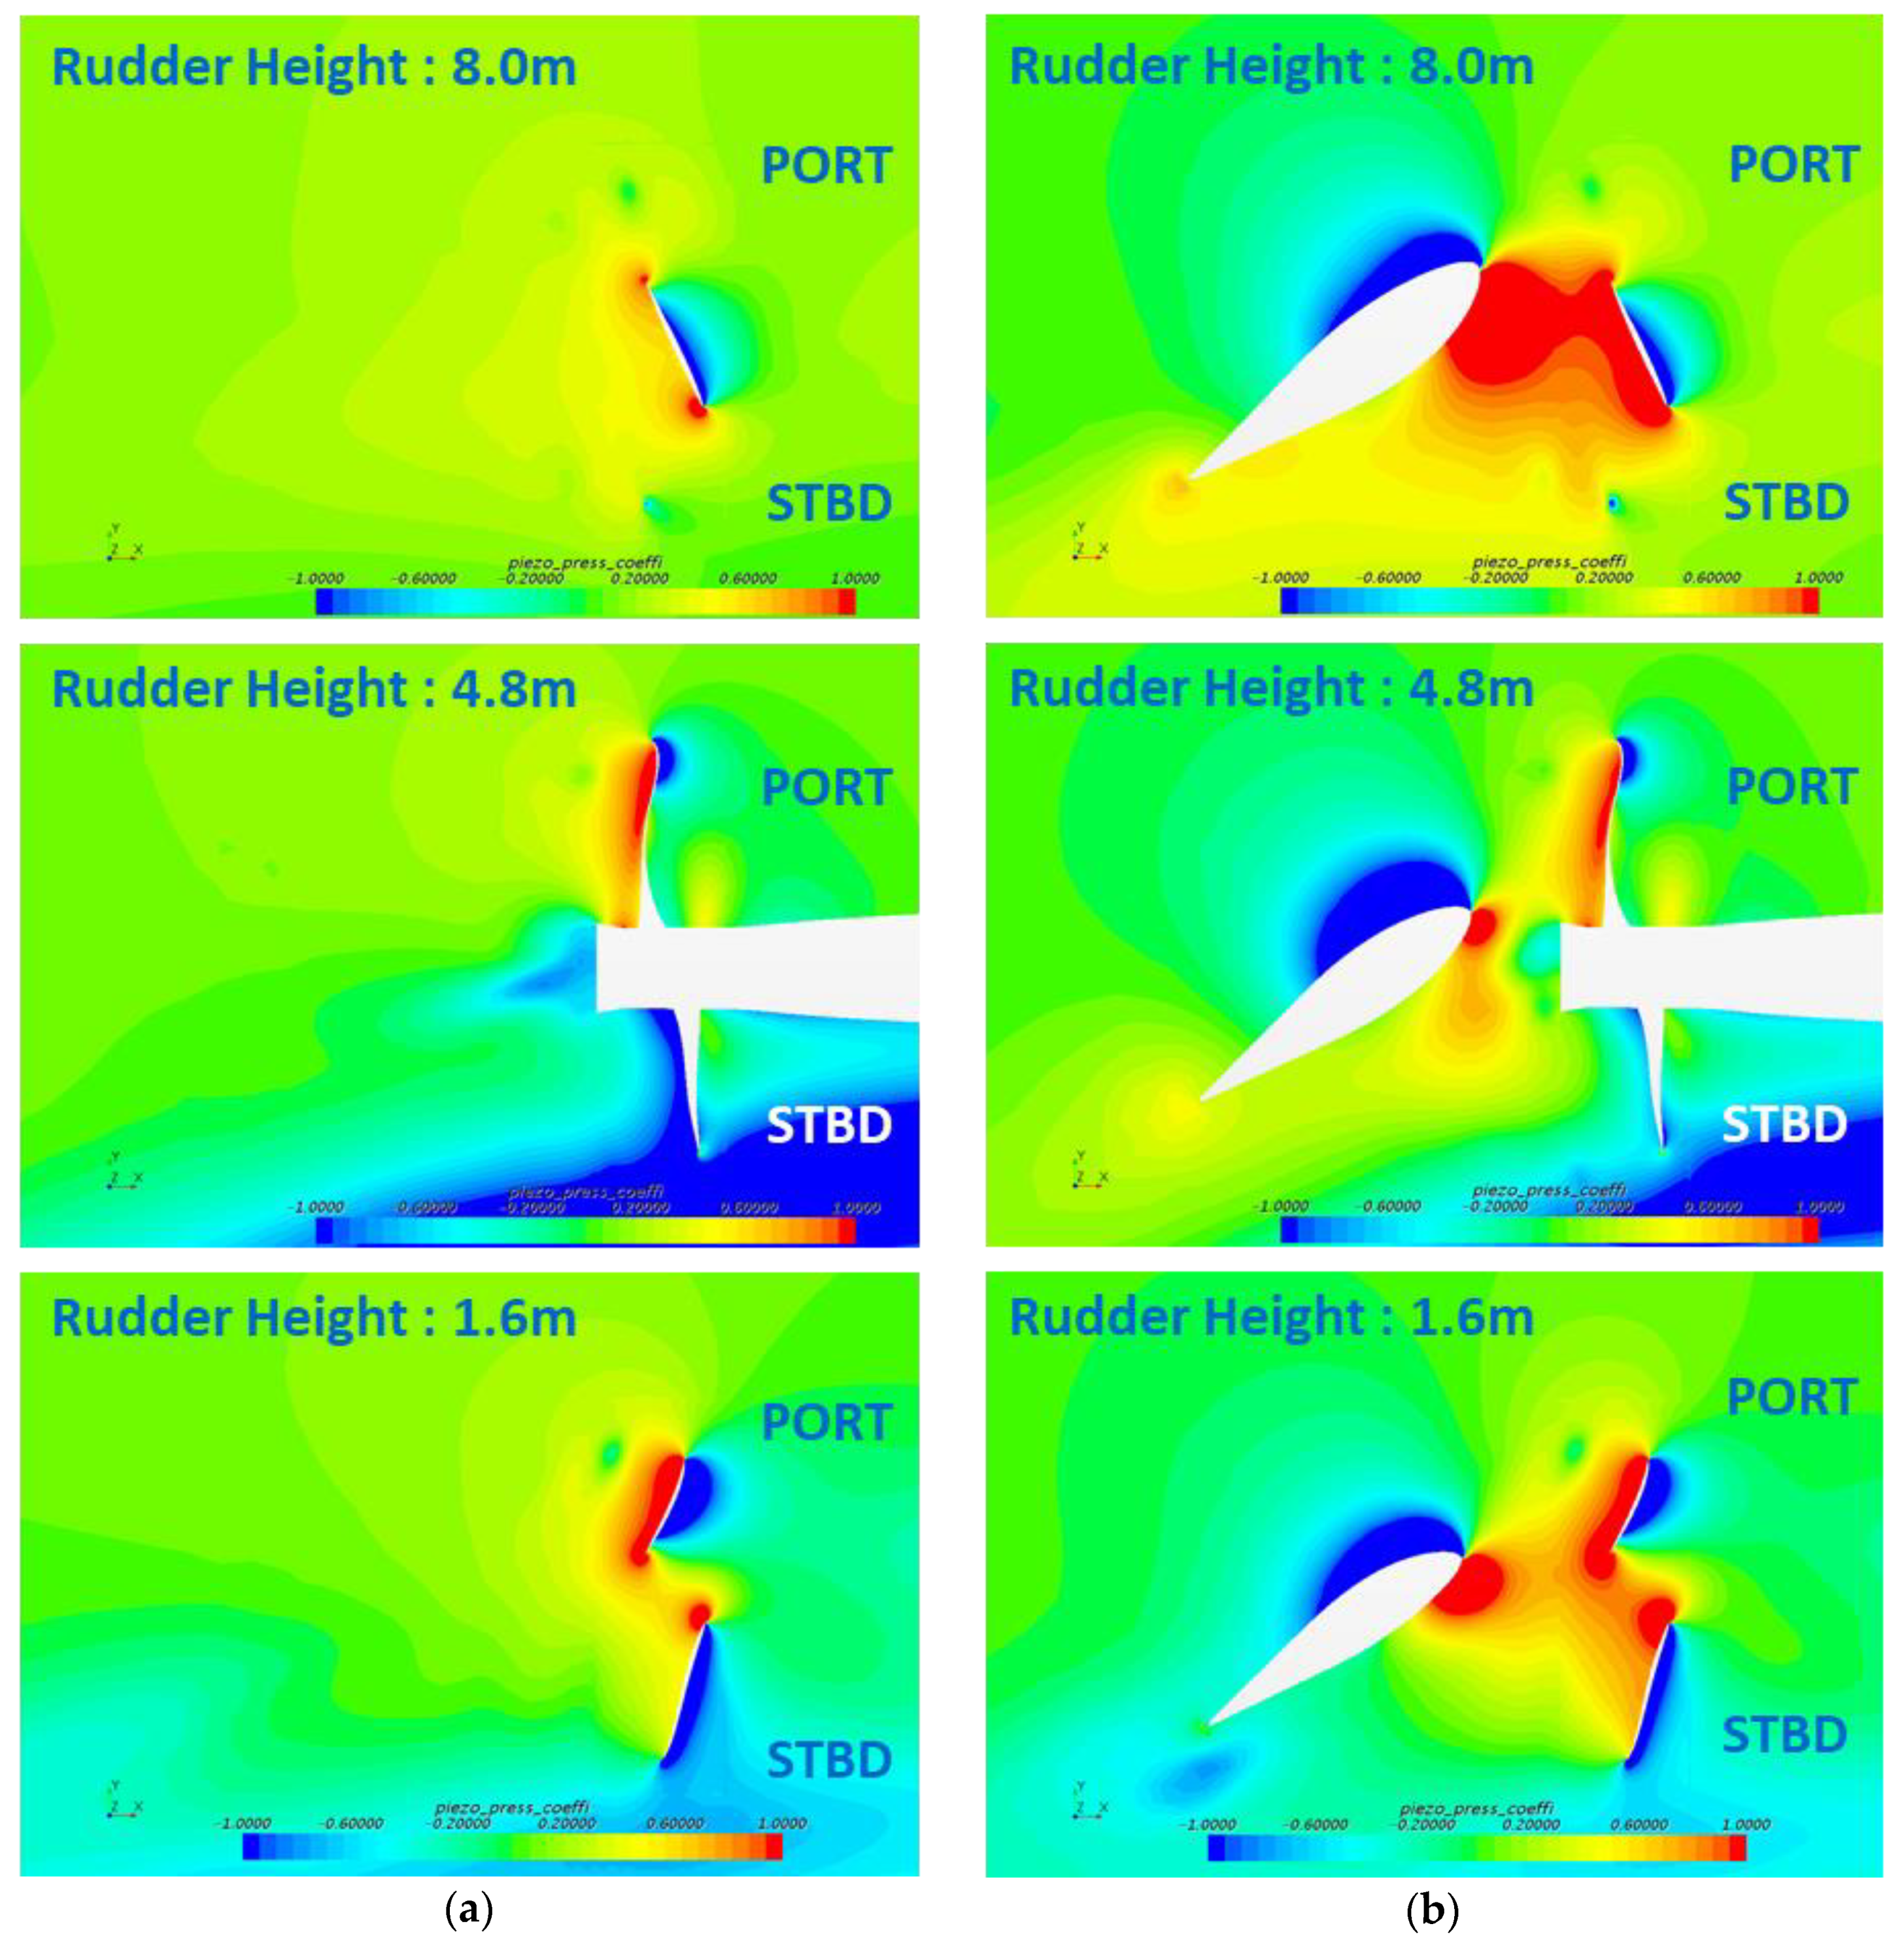
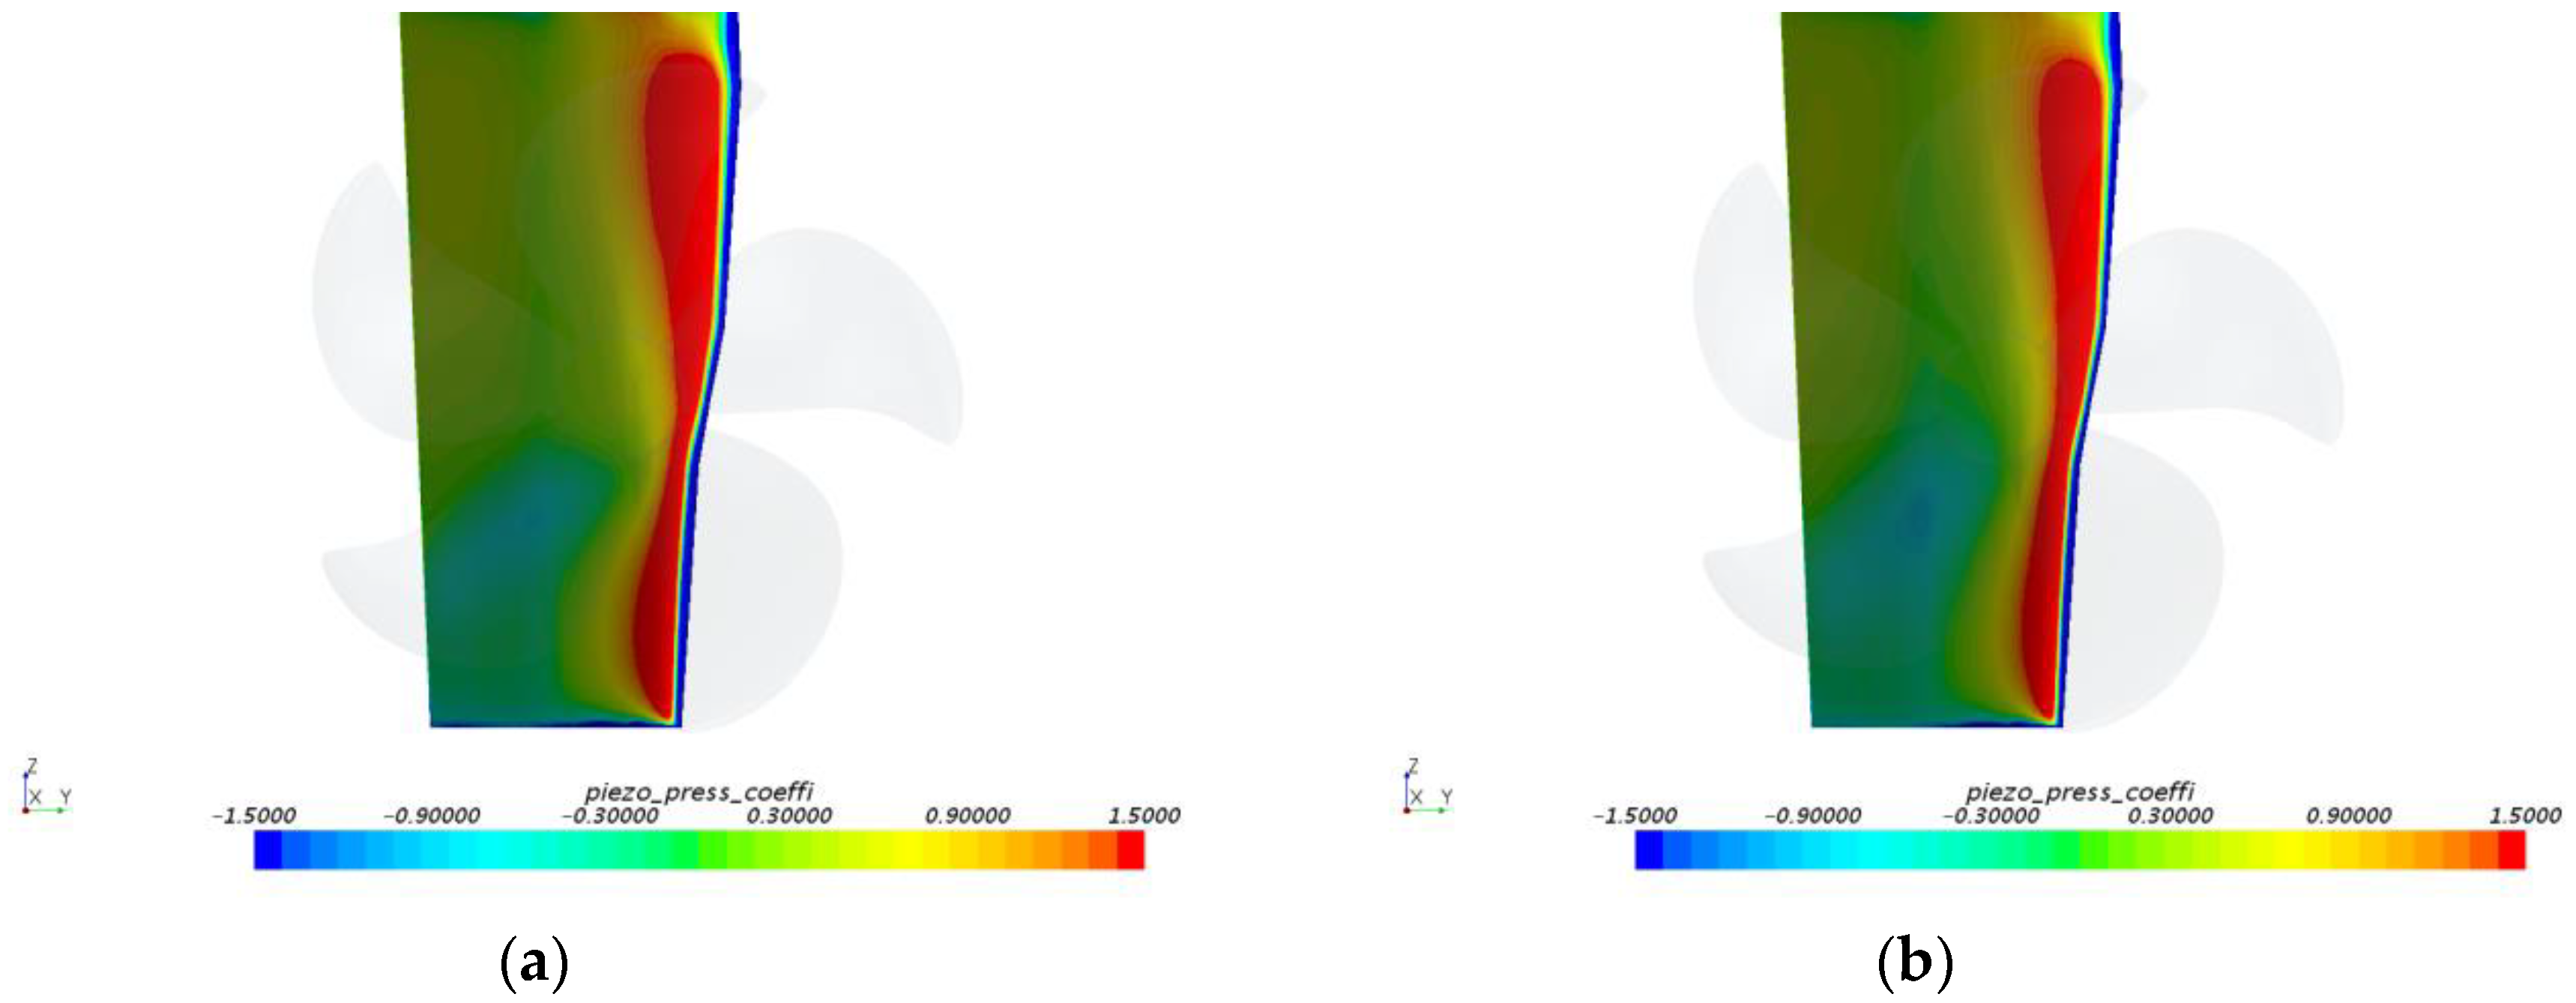
From many previous studies, it can be inferred that several factors are influencing propeller eccentric force. Among them, this paper focused on the effect of a rudder. To analyze the effect of rudder existence, numerical simulations involving two cases with and without a rudder were conducted under the same conditions for straight run or turning motion, and then the propeller eccentric force in these simulations was compared to each other.

2. Numerical Details

In this study, the target vessel was a 10,000 TEU class container ship, constructed in SHI and delivered in 2014. The main particulars of the ship and propeller are briefly summarized in Table 1, and Figure 1 shows the target vessel.

2.1. Numerical Methodology

2.1.1. Numerical Setup

This study was mainly performed by a numerical simulation with the commercial code, STAR-CCM+. The fundamental information used in the numerical simulations is presented in Table 2.

2.1.2. Case I: Resistance Test

At first, the difference of resistance for the target ship between the model test and the numerical simulation was compared in the model scale. As shown in Table 3, the ship speed was defined as from 19 to 23 Kn. For this simulation, the computational domain, boundary condition and grid system are presented in Figure 2, Figure 3 and Figure 4, respectively. To reduce the computational time and cost, half of the hull was modeled and the symmetry condition was defined in the centerline plane. The hexahedral unstructured grid system, called trimmer mesh in STAR-CCM+, was applied and the grids were clustered for the realistic elevation and propagation of waves around a ship. The total number of grids was about 3.2M. The free surface was captured by the VOF method with HRIC scheme. The time step was defined as 0.001 s and total computational time was 80 s. The number of inner iterations per time step was defined as 5. The value of y+ on thew hull surface was defined as 40, which was located in the recommended range to apply the wall function for the high y+ wall treatment model [15,16].
Figure 5 shows the time history of the resistance in the model scale (Rtm) for the 23Kn simulation and we judged that the value was converged at 80 s. As presented in Figure 6, the difference in the effective horsepower (EHP) calculated from the Rtm value between the model test and the numerical simulation in all ship speed range was within 2%. Figure 7 shows that the wave elevation and propagation around the Aft-hull was similar to that observed in the model test. Figure 8 presents the y+ range simulated at 23Kn ship speed; most of y+ value on the hull was distributed in the range of 30 to 50.

2.1.3. Case II: Propeller Open Water (POW) Test

Since the propeller’s eccentric force is the main topic in this study, the accurate prediction of the propeller’s thrust or torque is essential. Thus, the POW test was carried out to check the reliability of the numerical simulation for the target propeller. The computational domain, boundary condition and grid system for the POW simulation are presented in Figure 9, Figure 10 and Figure 11, respectively. In this simulation, the hybrid grid system was implemented. As shown in Figure 9, two regions in the computational domain were defined; the inner part and the outer part. In the inner part, the propeller was modeled and the diameter and width were 1.1 D and 0.25 D, respectively, and the polyhedral unstructured grid system was applied for better presenting the propeller geometry [17]. On the other hand, the trimmer mesh was used likewise for the resistance simulation in the outer part. The total number of grids was about 2.2M and the grids were clustered to describe the leading curvature. The value of y+ on the propeller surface was defined as 40, which was same value on the hull in resistance test in this study. Since the computation domain was modeled as an axis-symmetric shape, likewise a cylinder, the MRF method is a reasonable choice for the POW simulation.
The advance ratio, generally denoted by J, was defined from 0.1 to 1.0. The KT, KQ and EtaO from the numerical simulation were compared to those from the model test in Figure 12 and Table 4. The results from the numerical simulation agreed well with experimental data. The differences of KT, KQ and EtaO were less than 2% in most of the J range (0.1–0.8), respectively.
Based on the previous two simulations; CASE I: resistance test and CASE II: POW test, it can be concluded that the numerical setup applied in this study is reliable to predict the eccentric force on the propeller.

2.2. Definition for Maneuvering Condition

As mentioned above, a propeller during ship turning experiences continuous change in inflow. To simply describe this circumstance, the quasi-steady approach suggested by Kuroiwa et al. [4] was applied. It is a method to define a flow angle against a propeller plane at a specific instant during ship turning by calculating an actual drift angle. The actual drift angle is calculated by Equation (1). The definition of variables in Equation (1) is schematically presented in Figure 13.
α = β + t a n 1 ( X p V s · r ) β + X p V s · r
Figure 14 and Figure 15 show measured values, including ship speed, yaw rate, and propeller rpm of a full-scale ship during the turning circle test in an official sea trial, respectively. The rotation angle of the rudder was +35° or −35°. From these figures, it can be recognized that a ship in turning motion reaches to the point of maximum yaw rate status, called “yaw rate max.”, in a short period of time just after a turning test starts. About 300 s later, the yaw rate converges, and ship speed also becomes stable. This status is called “steady”. It is known that inflow conditions to a propeller of these two situations are quite different from that of a straight run, also making eccentric force induced by a propeller be different. Table 5 represents the inflow conditions.
Numerical simulations for the prediction of propeller eccentric force in these conditions were carried out based on methodologies presented in the previous Section 2.1. Approach ship speed and the propeller’s rotation speed were determined by referring to official sea trial data in Figure 14 and Figure 15. Although the wave around the ship is naturally generated in the straight run and turning of a ship, the free surface effect on the propeller eccentric force didn’t consider several previous studies [7,10] on reducing the computational time. In this regard, the boundary condition on the plane representing a design draught was defined as the symmetry condition. The computational domain was expanded by reflecting the symmetric plane used in the previous resistance test to consider a propeller behind the hull, therefore the total number of grids became about 7.2M. The rotation of a propeller is realized by implementing a sliding technique, and the propeller eccentric force could be directly calculated during the simulation. Unlike previous studies with high-speed navy vessels [6,8,9,11,12,13,14], the target vessel had a relatively low speed and was operated conservatively meaning that, ship motion such as a heeling during the turning was not considered. The rudder angle for each turning direction in the numerical simulation was defined as being the same as the value of official turning circle test.

2.3. Rudder Configuration

The schematic diagram of an asymmetric spade rudder installed on a target vessel is presented in Figure 16. The section shape differs on the rudder’s upper part and lower part in order to prevent cavitation at the leading edge of the rudder. Energy-saving devices such as rudder bulb or post-swirl stator were not considered.

2.4. Coordinate System

A coordinate system used for the analysis of propeller eccentric force was defined as shown in Figure 17.

3. Results

To investigate rudder effect on propeller eccentric force, simulation cases were categorized into two conditions: straight run and turning motion, including starboard and port turning. In addition, propeller lateral force and moment were evaluated by averaging for the last one revolution of a propeller. The propeller’s rotation angle per time step was defined as 1° for realistic simulation.

3.1. Straight Run

Nominal wake distributions evaluated by numerical simulations and measured by model tests on the straight run are compared in Figure 18. In model tests, a rudder does not exist due to measuring equipment consisting of a pitot tube and traverse system. To compare the rudder effect, two numerical simulations were carried out with and without a rudder.
As can be seen in Figure 18, the wake distribution in the upper part of a propeller (from 9 o’clock to 3 o’clock) is quite similar to the numerical simulation without a rudder and model tests. If a rudder exists, axial velocity is decelerated on the vertical center line. In Table 6, the thrust and torque of a propeller with and without a rudder were presented, respectively.
The thrust and torque of a propeller with a rudder were larger than those of a propeller without a rudder. Due to rudder existence, inflow velocity to the propeller was reduced, consequently making the angle of attack of a propeller relatively larger. Since the increment of thrust was bigger than that of the torque with a rudder, the propulsive efficiency of a propeller would be increased. Figure 19 shows instantaneous pressure distribution normalized by Pd; ½ρVs2 on a propeller face side as well as the difference. Moreover, the pressure on the propeller cap-end surface is also increased. This is a well-known phenomenon, known as the “wake effect”.

3.2. Turning Condition

The ratio of propeller lateral force and moment in the turning condition for thrust and torque in the straight run is presented in Figure 20, Figure 21, Figure 22 and Figure 23, including the sets with and without a rudder.
During starboard turning with a rudder, the change of the Mz directly related to load of stern tube bearing is remarkable compared to those without a rudder. Due to the existence of a rudder, the Mz was reduced by about 50%, and this is effective for alleviation of load on stern tube bearing. This tendency is similar regardless of turning status (yaw rate max. or steady). In contrast, during port turning, the Mz with a rudder is almost similar to that without a rudder. As indicated in the results above, it can be summarized that the effect of rudder existence on the Mz is asymmetric in line with turning direction. This is schematically presented in Figure 24 to show the asymmetric effect of rudder on the Mz in the case of the ship changing direction.
This is because of the interaction between the direction of the propeller’s rotation and inflow direction. During the starboard turning motion, the direction of flow into a propeller is from the port side to the starboard side. Since a propeller rotates clockwise, it continuously experiences a count-swirl flow in the lower part of a propeller (from 3 o’clock to 9 o’clock) during ship turning motion. Figure 25 presents the instantaneous pressure distribution on the face side of a propeller without a rudder in both turning status, and it is known that the thrust center of a propeller is naturally located in the lower part of a propeller.
If a rudder exists, in contrast, the pressure on the upper part of a propeller was much increased, as shown in Figure 26. The pressure on the lower part of a propeller was somewhat increased, but the effect was limited, as the upper region of the rudder is relatively close to the propeller due to the sweep angle of the rudder. This tendency is similar regardless of turning status, namely, yaw rate max. or steady. Figure 27 shows the instantaneous pressure distribution on a plane defined at several heights above a baseline in yaw rate max. condition. Notably, the difference of results simulated with and without a rudder is clearly contrasted at the upper region of a rudder.
During port turning motion, the direction of the flow into a propeller is from the starboard side to the port side. Due to propeller rotation direction, a propeller experiences a count-swirl flow in the upper part of a propeller during ship turning motion. Consequently, as shown in Figure 28, it is inferred that the center of thrust is located in the upper part of the propeller without a rudder, and the Mz essentially works on reducing the bearing load of the stern tube in this condition.
As shown in Figure 29, the pressure on the upper part of a propeller was also increased by rudder, similar to in the starboard turning cases. Although the pressure on the lower part of a propeller was also increased, the effect by a rudder was relatively less than that of the starboard turning cases. This can be explained by Figure 30. During port turning, the pressure on the lower section of a rudder is not significantly increased, unlike Figure 27, at yaw rate max. status.
Moreover, the My of a propeller is more sensitive to rudder effect rather than Mz for ship turning motion. If a rudder is operating for the starboard or port turning motion of a ship, a rudder area facing a propeller is larger, and the rudder is respectively weighted to a propeller, as shown in Figure 27 and Figure 29. In this context, the pressure distribution on the part of a propeller blade facing the biased rudder is mainly changed, and the My is consequently affected. During starboard turning, this value is reduced by 20% by the rudder; however, it is increased about two times during port turning, as represented from Figure 20, Figure 21, Figure 22, Figure 23 and Figure 24.
As mentioned in Section 2.3, the rudder used in this study was composed of different sections along the rudder height to prevent rudder cavitation. This characteristic is also related to the asymmetrical effect of a rudder on propeller eccentric force at each turning direction. The comparison between Figure 31 and Figure 32 would explain why the rudder’s effect on propeller eccentric force is asymmetrical as per the turning direction of a ship. The instantaneous pressure distributions around the leading edge of the rudder were clearly different to the turning direction (port and starboard). In contrast, the turning status, represented by yaw rate max. or steady, did not significantly affect the pressure distribution on the rudder in each turning direction.

4. Conclusions

In this study, numerical simulations were performed to investigate the effect of rudder existence on propeller lateral forces and moments. A target vessel, about a 10,000TEU class container ship, was chosen. For the straight run, the thrust and torque of a propeller were increased due to rudder existence and the propulsive efficiency on a propeller was improved by the wake effect of a rudder. The effect of a rudder on propeller eccentric force was different in the turning direction. The Mz directly related to the bearing load of a stern tube was diminished by about 50% owing to the existence of a rudder for starboard turning, while the values were similar to each other regardless of rudder existence for port turning. This difference basically results from the interaction between the direction of a propeller’s rotation and the inflow direction to a propeller. In particular, the effect of a rudder on propeller lateral force and moment depends on where flow straightness behind a propeller is relatively strong or weak. Although the center of thrust on a propeller was located in the lower part of a propeller for starboard turning, the magnitude of the Mz was compensated by rudder effect in the upper part of a propeller. In contrast, the center of thrust on a propeller is already located in the upper part of a propeller for port turning so the effect of a rudder was relatively limited on propeller eccentric force. Additionally, a rudder affects the My of a propeller, consequently, that value with rudder showed similar level regardless of the ship’s turning direction. A rudder’s main configurations, including the leading-edge sweep angle, aspect ratio, section shape or distance between a propeller and a rudder, might have an impact on propeller eccentric force. Furthermore, appendages located around a propeller, including a rudder and various energy saving devices, need to be considered in order to estimate reliable propeller eccentric force.

Author Contributions

Conceptualization, G.S.; validation, G.S., and T.L.; analysis, G.S., and T.L.; writing—original draft preparation, G.S.; writing—review and editing, T.L. and H.P.; supervision, H.P.; project administration, H.P.

Funding

This research received no external funding.

Acknowledgments

This research was carried out as part of an internal research project.

Conflicts of Interest

The authors declare no conflict of interest.

Nomenclature

BBreath [m]BEMTBlade Element and Momentum Theory
DPropeller diameter [m]CFDComputational Fluid Dynamics
Eta OPropeller efficiencyCRPContra-Rotating Propeller
FrFroude numberEHPEffective Horse Power
KTThrust coefficientFEMFinite Element Method
KQTorque coefficientFxThrust of the propeller
KnKnotsFyForce to the vertical axis
LLength Between Perpendiculars [m]FzForce to the horizontal axis
PdDynamic pressure [Kg/(m∙s2)]HRICHigh Resolution Interface Capturing
rRate of turn [°/s]JIMEJapan Institute of Marine Engineering
sSecondMRFMoving Reference Frame
TdDesign draught [m]MxMoment based on the propeller-shaft axis
VsShip speed [Kn]MyMoment based on the vertical axis
xpDistance from the propeller to the gravitational center of the hull [m]MzMoment based on the horizontal axis
ZNumber of bladesPOWPropeller Open Water
αWater flow angle against propeller plane [°]RtmTotal resistance in model scale
βDrift angle [°]SIMPLESemi-Implicit Method for Pressure Linked Equations
δRudder angle [°]TEUTwenty-foot Equivalent Unit
ρDensity of fluid [Kg/m3]URANSUnsteady Reynolds Averaged Navier-Stokes
VOFVolume of Fluid

References

  1. Ui, T. Influence of propeller force to shaft alignment. In Proceedings of the International Symposium on Marine Engineering (ISME), Kobe, Japan, 17–21 October 2011. [Google Scholar]
  2. American Bureau of Shipping (ABS). Guide for Enhanced Shaft Alignment; American Bureau of Shipping: Houston, TX, USA, 2018. [Google Scholar]
  3. Det Norske Veritas-Germanischer Lloyd (DNV-GL). Shaft Alignment, DNVGL-CG-0283; Det Norske Veritas-Germanischer Lloyd: Høvik, Norway, 2018. [Google Scholar]
  4. Kuroiwa, R.; Oshima, A.; Nishioka, T.; Tateishi, T.; Ohyama, T.; Ishijima, T. Reliability improvement of stern tube bearing considering propeller shaft forces during ship turning. Mitshbishi Heavy Ind. Ltd. Tech. Rev. 2007, 44, 1–5. [Google Scholar]
  5. Vartdal, B.J.; Gjestland, T.; Arvidsen, T.I. Lateral propeller forces and their effects on shaft bearings. In Proceedings of the First International Symposium on Marine Propulsors, Trondheim, Norway, 22–24 June 2009; pp. 475–481. [Google Scholar]
  6. Corraddu, A.; Dubbioso, G.; Mauro, S.; Viviani, M. Analysis of twin screw ship’s asymmetric propeller behavior by means of free running model tests. Ocean Eng. 2013, 68, 47–64. [Google Scholar] [CrossRef] [Green Version]
  7. Shin, S.H. Effects of Propeller Forces on the Propeller Shaft Bearing during Going Straight and Turning of Ship (in Korean). J. Soc. Nav. Archit. Korea 2015, 52, 61–69. [Google Scholar] [CrossRef] [Green Version]
  8. Ortolani, F.; Mauro, S.; Dubbioso, G. Investigation of the radial bearing force developed during actual ship operation. Part 1: Straight ahead sailing and turning maneuvers. Ocean Eng. 2015, 94, 67–87. [Google Scholar] [CrossRef]
  9. Dubbioso, G.; Durante, D.; Di Mascio, A.; Broglia, R. Turning ability analysis of a fully appended twin screw vessel by CFD. Part II: Single vs. twin rudder configuration. Ocean Eng. 2016, 117, 259–271. [Google Scholar] [CrossRef]
  10. Lee, T.; Song, G.; Park, H. Effect of Propeller Eccentric Forces on the Bearing Loads of the Complicated Shafting System for Large Container Ships. In Proceedings of the Fifth International Symposium on Marine Propulsors, Helsinki, Finland, 12–15 June 2017. [Google Scholar]
  11. Dubbioso, G.; Muscari, R.; Ortolani, F.; Di Mascio, A. Analysis of propeller bearing loads by CFD. Part I: Straight ahead and steady turning maneuvers. Ocean Eng. 2017, 130, 241–259. [Google Scholar] [CrossRef]
  12. Muscari, R.; Dubbioso, G.; Ortolani, F.; Di Mascio, A. CFD analysis of the sensitivity of propeller bearing loads to stern appendages and propulsive configurations. Appl. Ocean Res. 2017, 69, 205–219. [Google Scholar] [CrossRef]
  13. Ortolani, F.; Dubbioso, G. Experimental investigation of single blade and propeller loads by free running model test. Straight ahead sailing. Appl. Ocean Res. 2019, 87, 111–129. [Google Scholar] [CrossRef]
  14. Ortolani, F.; Dubbioso, G. Experimental investigation of single blade and propeller loads: Steady turning motion. Appl. Ocean Res. 2019, 91, 101874. [Google Scholar] [CrossRef]
  15. De Luca, F.; Mancini, S.; Miranda, S.; Pensa, C. An extended verification and validation study of CFD simulations for planning hulls. J. Ship Res. 2016, 60, 101–118. [Google Scholar] [CrossRef]
  16. CD-Adapco. STAR-CCM+ User’s Guide Version 10.06, CD-Adapco: Plano, TX, USA, 2015.
  17. Krasilnikov, V. CFD modeling of hydroacoustic performance of marine propellers: Predicting propeller cavitation. In Proceedings of the 22nd Numerical Towing Tank Symposium, Tomar, Portugal, 29 September–1 October 2019. [Google Scholar]
Figure 1. The target vessel.
Jmse 07 00455 g001
Figure 2. Computational domain (side view and front view).
Jmse 07 00455 g002
Figure 3. Boundary conditions.
Jmse 07 00455 g003
Figure 4. Grid system for the resistance simulation.
Jmse 07 00455 g004
Figure 5. Time history of the resistance at the model scale (Rtm) at 23Kn.
Jmse 07 00455 g005
Figure 6. The difference of effective horsepower (EHP) between the model test and the CFD simulation at various ship speeds.
Jmse 07 00455 g006
Figure 7. Wave pattern around Aft-hull at 24Kn in the (a) model test; (b) CFD simulation.
Jmse 07 00455 g007
Figure 8. Ranges of wall y+ values at 23Kn ship speed in resistance test (a) side view; (b) bottom view.
Jmse 07 00455 g008
Figure 9. Computational domain (side view and front view).
Jmse 07 00455 g009
Figure 10. Boundary conditions for POW simulation.
Jmse 07 00455 g010
Figure 11. Grid system for POW simulation.
Jmse 07 00455 g011
Figure 12. Comparison of KT, 10 KQ and EtaO from the model test and the CFD simulation at various advance ratios (J).
Jmse 07 00455 g012
Figure 13. Reproduced from [4], with permission from Mitsubishi Heavy Industries, Ltd., 2007.
Jmse 07 00455 g013
Figure 14. Ship motion during the turning circle test (starboard turning) in the sea trial.
Jmse 07 00455 g014
Figure 15. Ship motion during the turning circle test (port turning) in the sea trial.
Jmse 07 00455 g015
Figure 16. Asymmetric rudder configurations (a) Side view; (b) three-dimensional (3D) view.
Jmse 07 00455 g016
Figure 17. The coordinate system for propeller lateral forces and moments.
Jmse 07 00455 g017
Figure 18. Nominal wake distribution. (a) Measurement; (b) simulation without rudder; (c) simulation with rudder.
Jmse 07 00455 g018
Figure 19. Instantaneous normalized pressure distribution on the propeller face side (looking upstream) during the straight run (a) without a rudder; (b) with a rudder.
Jmse 07 00455 g019
Figure 20. Propeller lateral force and moment during the starboard turn (without rudder).
Jmse 07 00455 g020
Figure 21. Propeller lateral force and moment during the starboard turn (with rudder).
Jmse 07 00455 g021
Figure 22. Propeller lateral force and moment during the port turn (without rudder).
Jmse 07 00455 g022
Figure 23. Propeller lateral force and moment during the port turn (with rudder).
Jmse 07 00455 g023
Figure 24. The rudder effect on the propeller’s lateral moment during the straight run or the turning motion.
Jmse 07 00455 g024
Figure 25. Instantaneous normalized pressure distribution on the propeller face side without rudder during starboard turning (a) At yaw rate max.; (b) at steady.
Jmse 07 00455 g025
Figure 26. Instantaneous normalized pressure distribution on the propeller face side with rudder during starboard turning (a) At yaw rate max.; (b) at steady.
Jmse 07 00455 g026
Figure 27. Instantaneous normalized pressure distributions on a plane at three different heights during starboard turning at yaw rate max. status (a) without rudder; (b) with rudder.
Jmse 07 00455 g027
Figure 28. Instantaneous normalized pressure distribution on the propeller face side without rudder during port turning (a) At yaw rate max.; (b) at steady.
Jmse 07 00455 g028
Figure 29. Instantaneous normalized pressure distribution on the propeller face side with rudder during port turning (a) at yaw rate max.; (b) at steady.
Jmse 07 00455 g029
Figure 30. Instantaneous normalized pressure distributions on a plane at three different heights during port turning at yaw rate max. status (a) without a rudder; (b) with a rudder.
Jmse 07 00455 g030
Figure 31. Instantaneous normalized pressure distributions on a rudder during starboard turning (a) At yaw rate max. (b) at steady (looking downstream).
Jmse 07 00455 g031
Figure 32. Instantaneous normalized pressure distributions on a rudder during port turning. (a) At yaw rate max., (b) at steady turning (looking downstream).
Jmse 07 00455 g032
Table 1. Main particulars of target vessel and propeller.
ItemsValues
L 286.0
B 48.2
Td12.5
D9.4
Z5
Table 2. Numerical Setup.
ItemsDescription
CodeSTAR-CCM+ Ver. 10.06
Governing equationRANS
Temporal discretization1st order
Convection term2nd order upwind
Gradient methodGreen-Gauss
Pressure–Velocity couplingSIMPLE
Turbulence modelReynolds stress model
Wall treatmentWall function
Table 3. Ship speed and the Froude number for the resistance test in the numerical simulation.
VsFr
190.185
210.205
230.224
240.234
250.243
Table 4. The accuracy of the POW test results from the numerical simulation and model test.
JKT (CFD/EXP.)10KQ (CFD/EXP.)EtaO (CFD/EXP.)
0.1098.4%99.8%98.6%
0.2099.0%100.8%98.2%
0.3099.7%101.4%98.3%
0.4099.8%101.0%98.8%
0.5099.8%100.4%99.4%
0.55100.0%100.4%99.6%
0.60100.2%100.5%99.7%
0.65100.3%100.7%99.6%
0.70100.2%100.8%99.4%
0.7599.9%100.9%99.0%
0.8099.2%100.9%98.3%
0.8598.3%100.8%97.6%
0.9097.4%100.9%96.5%
1.0096.3%103.5%93.1%
Table 5. Information of the turning rate at three representative inflow conditions.
Turning StatusTurning Directionrα
Straight run-0.000.00
Yaw rate max.Port turn−1.0122.45
Starboard turn0.99−22.15
SteadyPort turn−0.8027.04
Starboard turn0.79−26.20
Table 6. Change of thrust and torque by rudder existence on the straight run.
ItemWith RudderWithout Rudder
Fx112%100%
Mx107%100%

