Article

Nearshore Dynamics of Storm Surges and Waves Induced by the 2018 Typhoons Jebi and Trami Based on the Analysis of Video Footage Recorded on the Coasts of Wakayama, Japan

1
Department of Civil Engineering, The University of Tokyo, Tokyo 113-8656, Japan
2
Research Fellow of Japan Society for the Promotion of Science, Tokyo 102-0083, Japan
*
Author to whom correspondence should be addressed.
J. Mar. Sci. Eng. 2019, 7(11), 413; https://doi.org/10.3390/jmse7110413
Submission received: 30 September 2019 / Revised: 5 November 2019 / Accepted: 11 November 2019 / Published: 13 November 2019
(This article belongs to the Special Issue Observation, Analysis, and Modeling of Nearshore Dynamics)

Abstract

:
In this study, field surveys along the coasts of Wakayama Prefecture, Japan, were first conducted to investigate the coastal damage due to storm surges and storm-induced waves caused by the 2018 Typhoons Jebi and Trami. Special focus was placed on the characteristic behavior of nearshore waves through investigation of observed data, numerical simulations, and image analysis of video footage recorded on the coasts. The survey results indicated that inundation, wave overtopping, and drift debris caused by violent storm-induced waves were the dominant factors causing coastal damage. Results of numerical simulations showed that heights of storm-induced waves were predominantly greater than storm surge heights along the entire coast of Wakayama in both typhoons. However, computed gradual alongshore variations in wave and surge heights did not explain locally-concentrated inundation and run-up heights observed along the coasts. These results indicate that complex nearshore hydrodynamics induced by local nearshore bathymetry might have played a significant role in inducing such local wave characteristics and the associated coastal damage. Analysis of video footage recorded during Typhoon Jebi, for example, clearly showed evidence of amplified infragravity wave components, which could enhance inundation and wave run-up.

1. Introduction

Tropical cyclone disasters are one of the major natural disasters in the world, as cyclone-induced winds, rain, waves, and surges cause catastrophic damage in urban areas (e.g., Hurricanes Katrina, Sandy, Irma, and Maria, and Typhoon Haiyan) [1,2,3,4,5]. Intense tropical cyclones, categorized into high-intensity classes (i.e., Categories 4 and 5), are expected to occur more frequently as global warming increases [6,7]. Therefore, individual damages induced by past tropical cyclones in each region should be thoroughly investigated to understand the mechanisms of damage generation and develop better disaster mitigation plans and strategies for the future.
Japan has suffered major disasters induced by storms such as Typhoons Vera, Nancy, and Mireille [8,9,10,11]. Storm surges and storm-induced waves during a typhoon, as well as winds and rain, largely affect the country’s long coastlines. For example, Typhoon Vera, which crossed over the Kansai region, the western part of the main island of Japan, is known as one of the most disastrous storm-surge typhoons in Japan; the maximum surge height was approximately 3.6 m at Nagoya near the head of Ise Bay [12]. Countermeasures for storm surges along the coast in the Kansai region have been discussed using virtual typhoon scenarios based on Typhoons Vera and Nancy [12,13]. Wakayama Prefecture is one of the most affected areas by storm surges and storm-induced waves in this region because it has long coastlines facing the open Pacific Ocean, extending for several hundred kilometers. In 2018, two large typhoons, Jebi and Trami, passed near the coast of Wakayama and made landfall on the prefecture and generated extremely damaging storm surges and waves on the coasts (Figure 1). Many structures and houses near the coast were inundated and damaged during these typhoons, as reported by Mori et al. [13]. The observed heights of storm surges at certain tide gauge stations in Wakayama were the highest in recorded history during either Typhoon Jebi or Typhoon Trami [14,15]. Consequently, these typhoons and the resulting damages may have been the most disastrous events on the coast of Wakayama in the last several decades. Therefore, we investigated coastal damage in Wakayama induced by these two typhoons based on a post-event field survey to understand the overall nearshore hydrodynamic characteristics induced by storm surges and storm-induced waves. Additionally, in this study, data analysis, numerical simulations, and image analysis of the video footage recorded on the coasts were performed to estimate them during the two typhons.

2. Post-Event Surveys after the Typhoons

2.1. Damage Caused by Typhoon Jebi

Typhoon Jebi passed near the coast of Wakayama during 11:00–13:00 JST (UTC + 9 h) on September 4, 2018, with a central pressure of approximately 950 hPa and the lowest central pressure dropping to 915 hPa [16] (Figure 1). This typhoon caused a large disaster because of winds, rain, surges, and waves, not only on the coast of Wakayama but also along the coastal areas of Osaka Bay [13] (Figure 1). Japan Society of Civil Engineers (JSCE) immediately organized a joint survey team, the 2018 Typhoon Jebi Coastal Disaster Survey Team, after the typhoon passed; this team surveyed the overall damage mainly on the coasts of Osaka, Hyogo, and Wakayama in the Kansai region [13,17]. Storm surges had a dominant influence near the inner part of Osaka Bay, with maximum inundation heights of + 4.0 and + 9.2 m, including wave run-up effects, from the mean sea level near the head of Tokyo Bay (i.e., Tokyo Peil, TP) [13]. The coasts of Wakayama were also severely damaged by storm surges and storm-induced waves during the typhoon. The authors conducted field surveys during 11 to 13 September and 19 to 21 September 2018, several weeks after the event, to determine the damage generated on the coasts. Horizontal coordinates and elevations of the observed drift-debris, destroyed structures, and witnessed watermarks, due to inundation and wave run-up, were measured by leveling from sea level and using a real-time kinematic global positioning system (RTK-GPS). The authors conducted this survey as part of the JSCE joint survey team, and most of the measured heights can be found in the dataset presented by Mori et al. [13]. The findings of this field survey after Typhoon Jebi are summarized as follows.
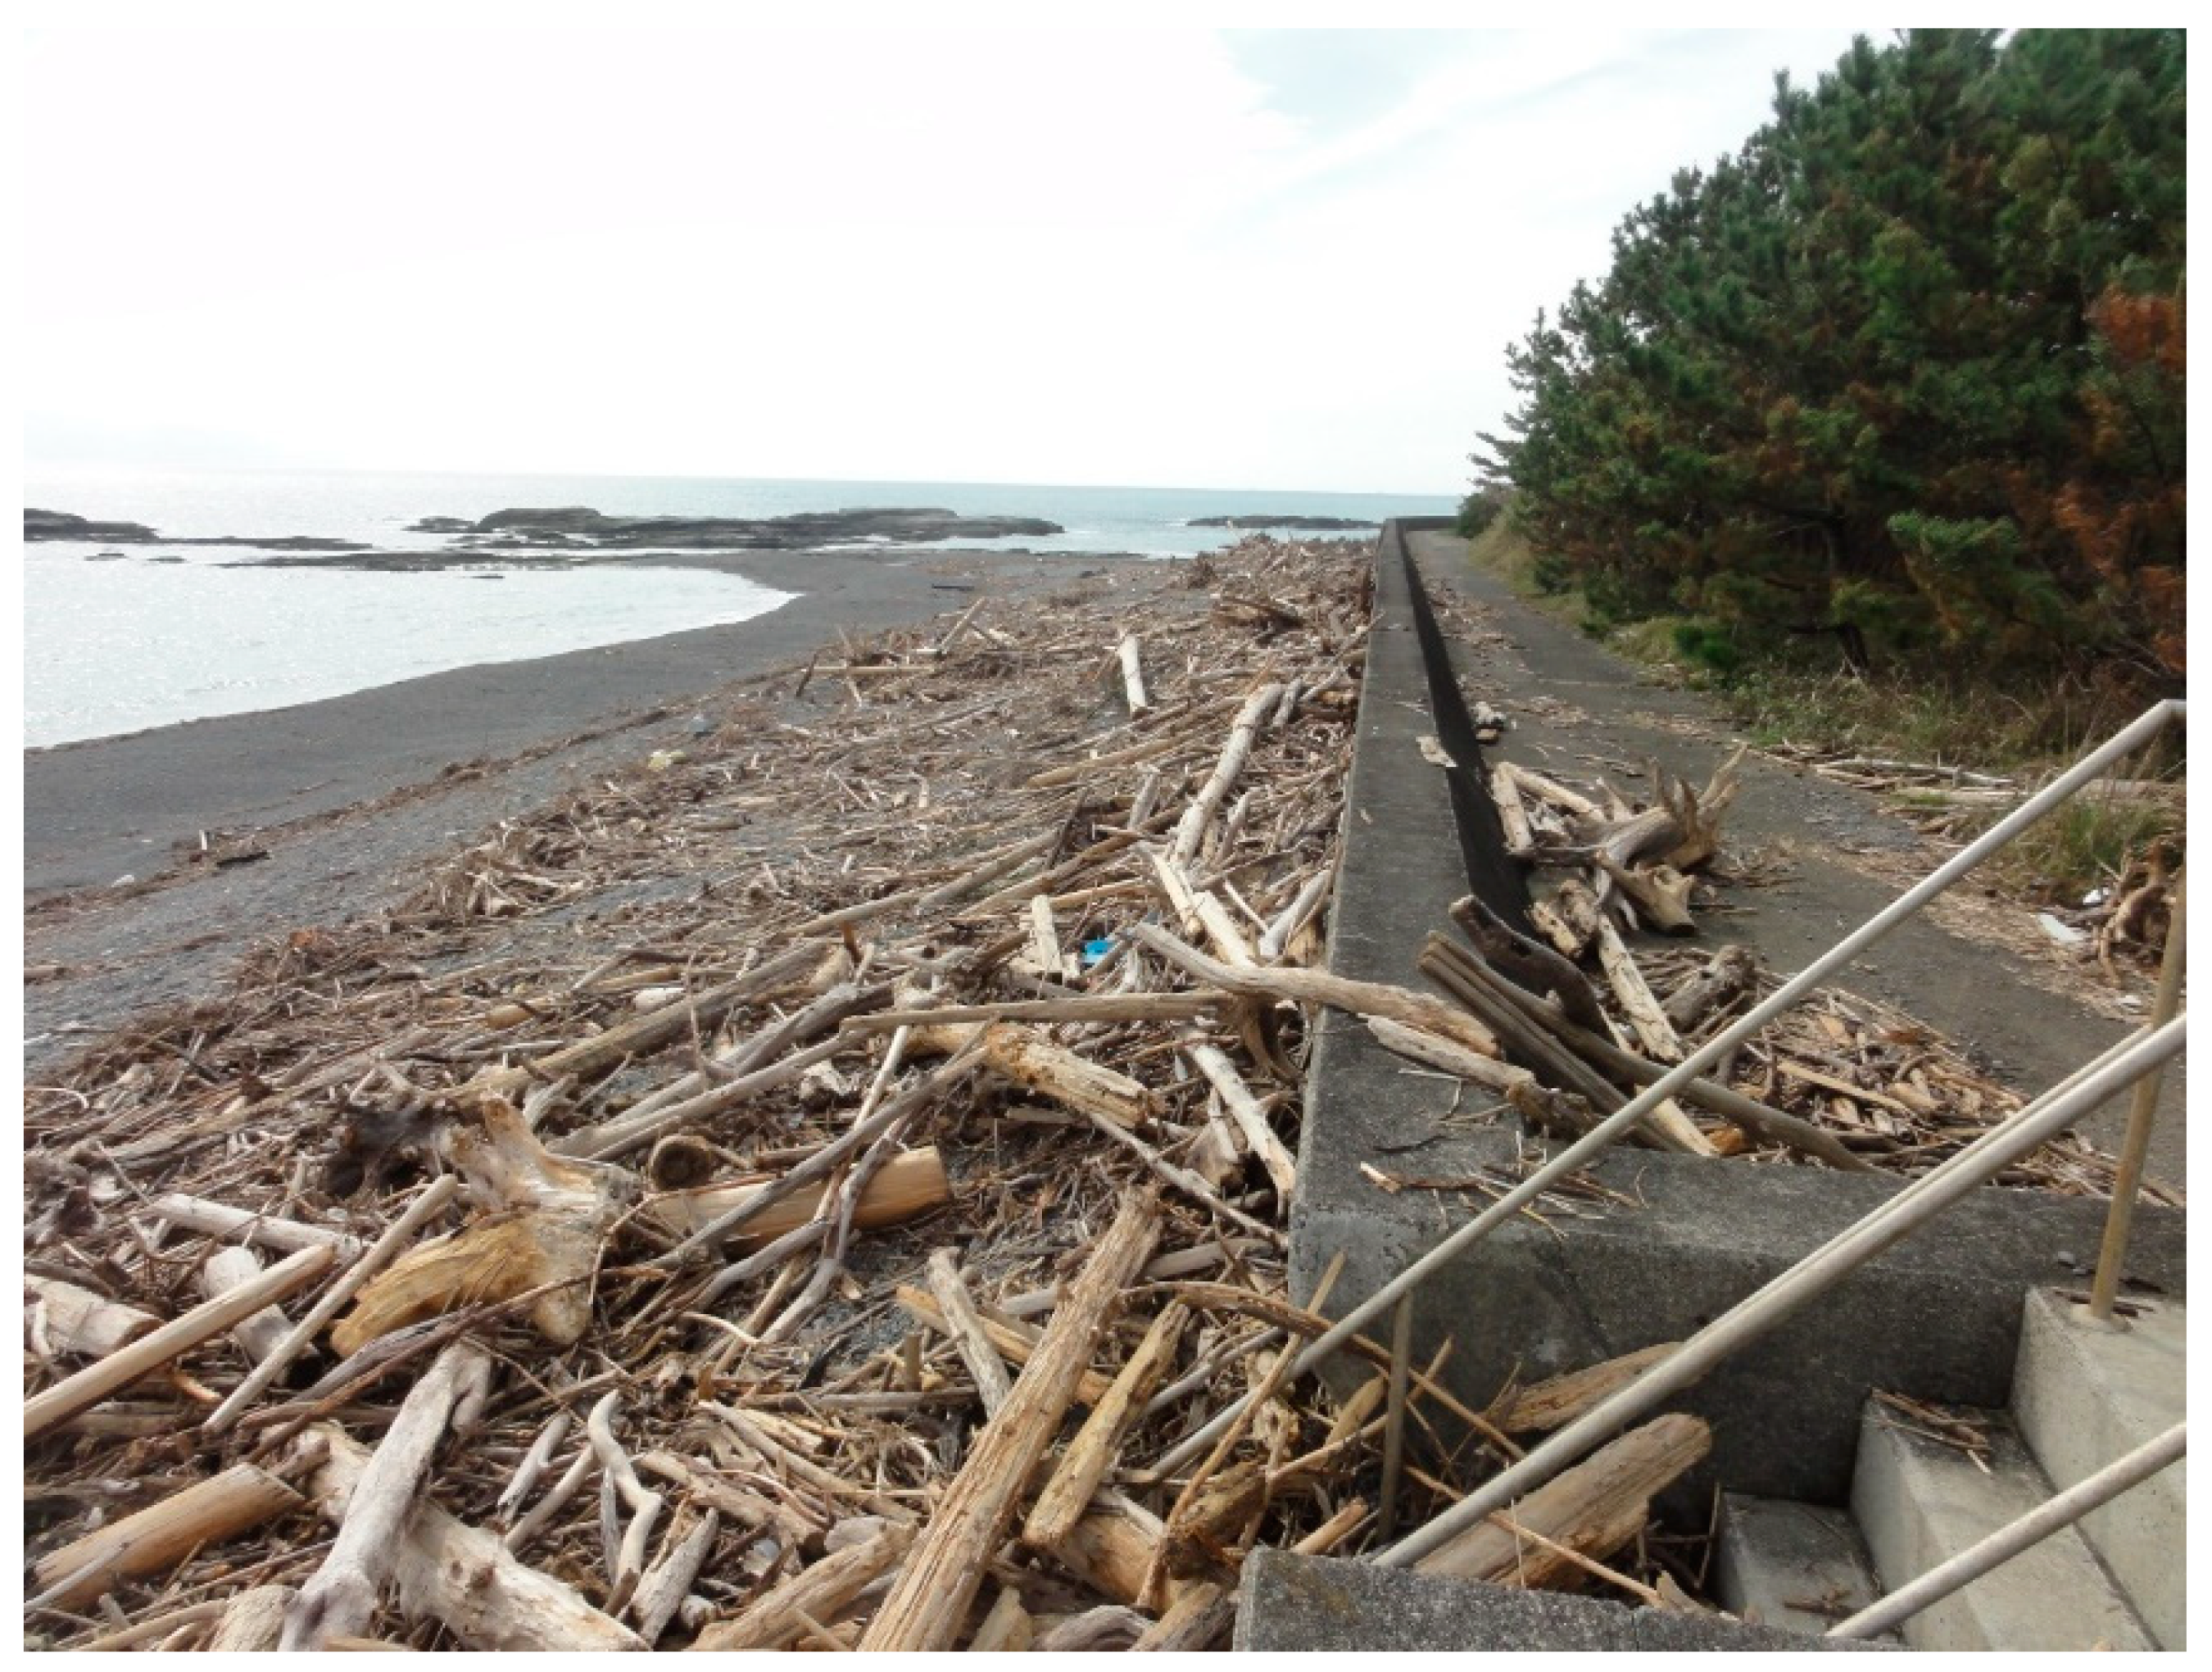
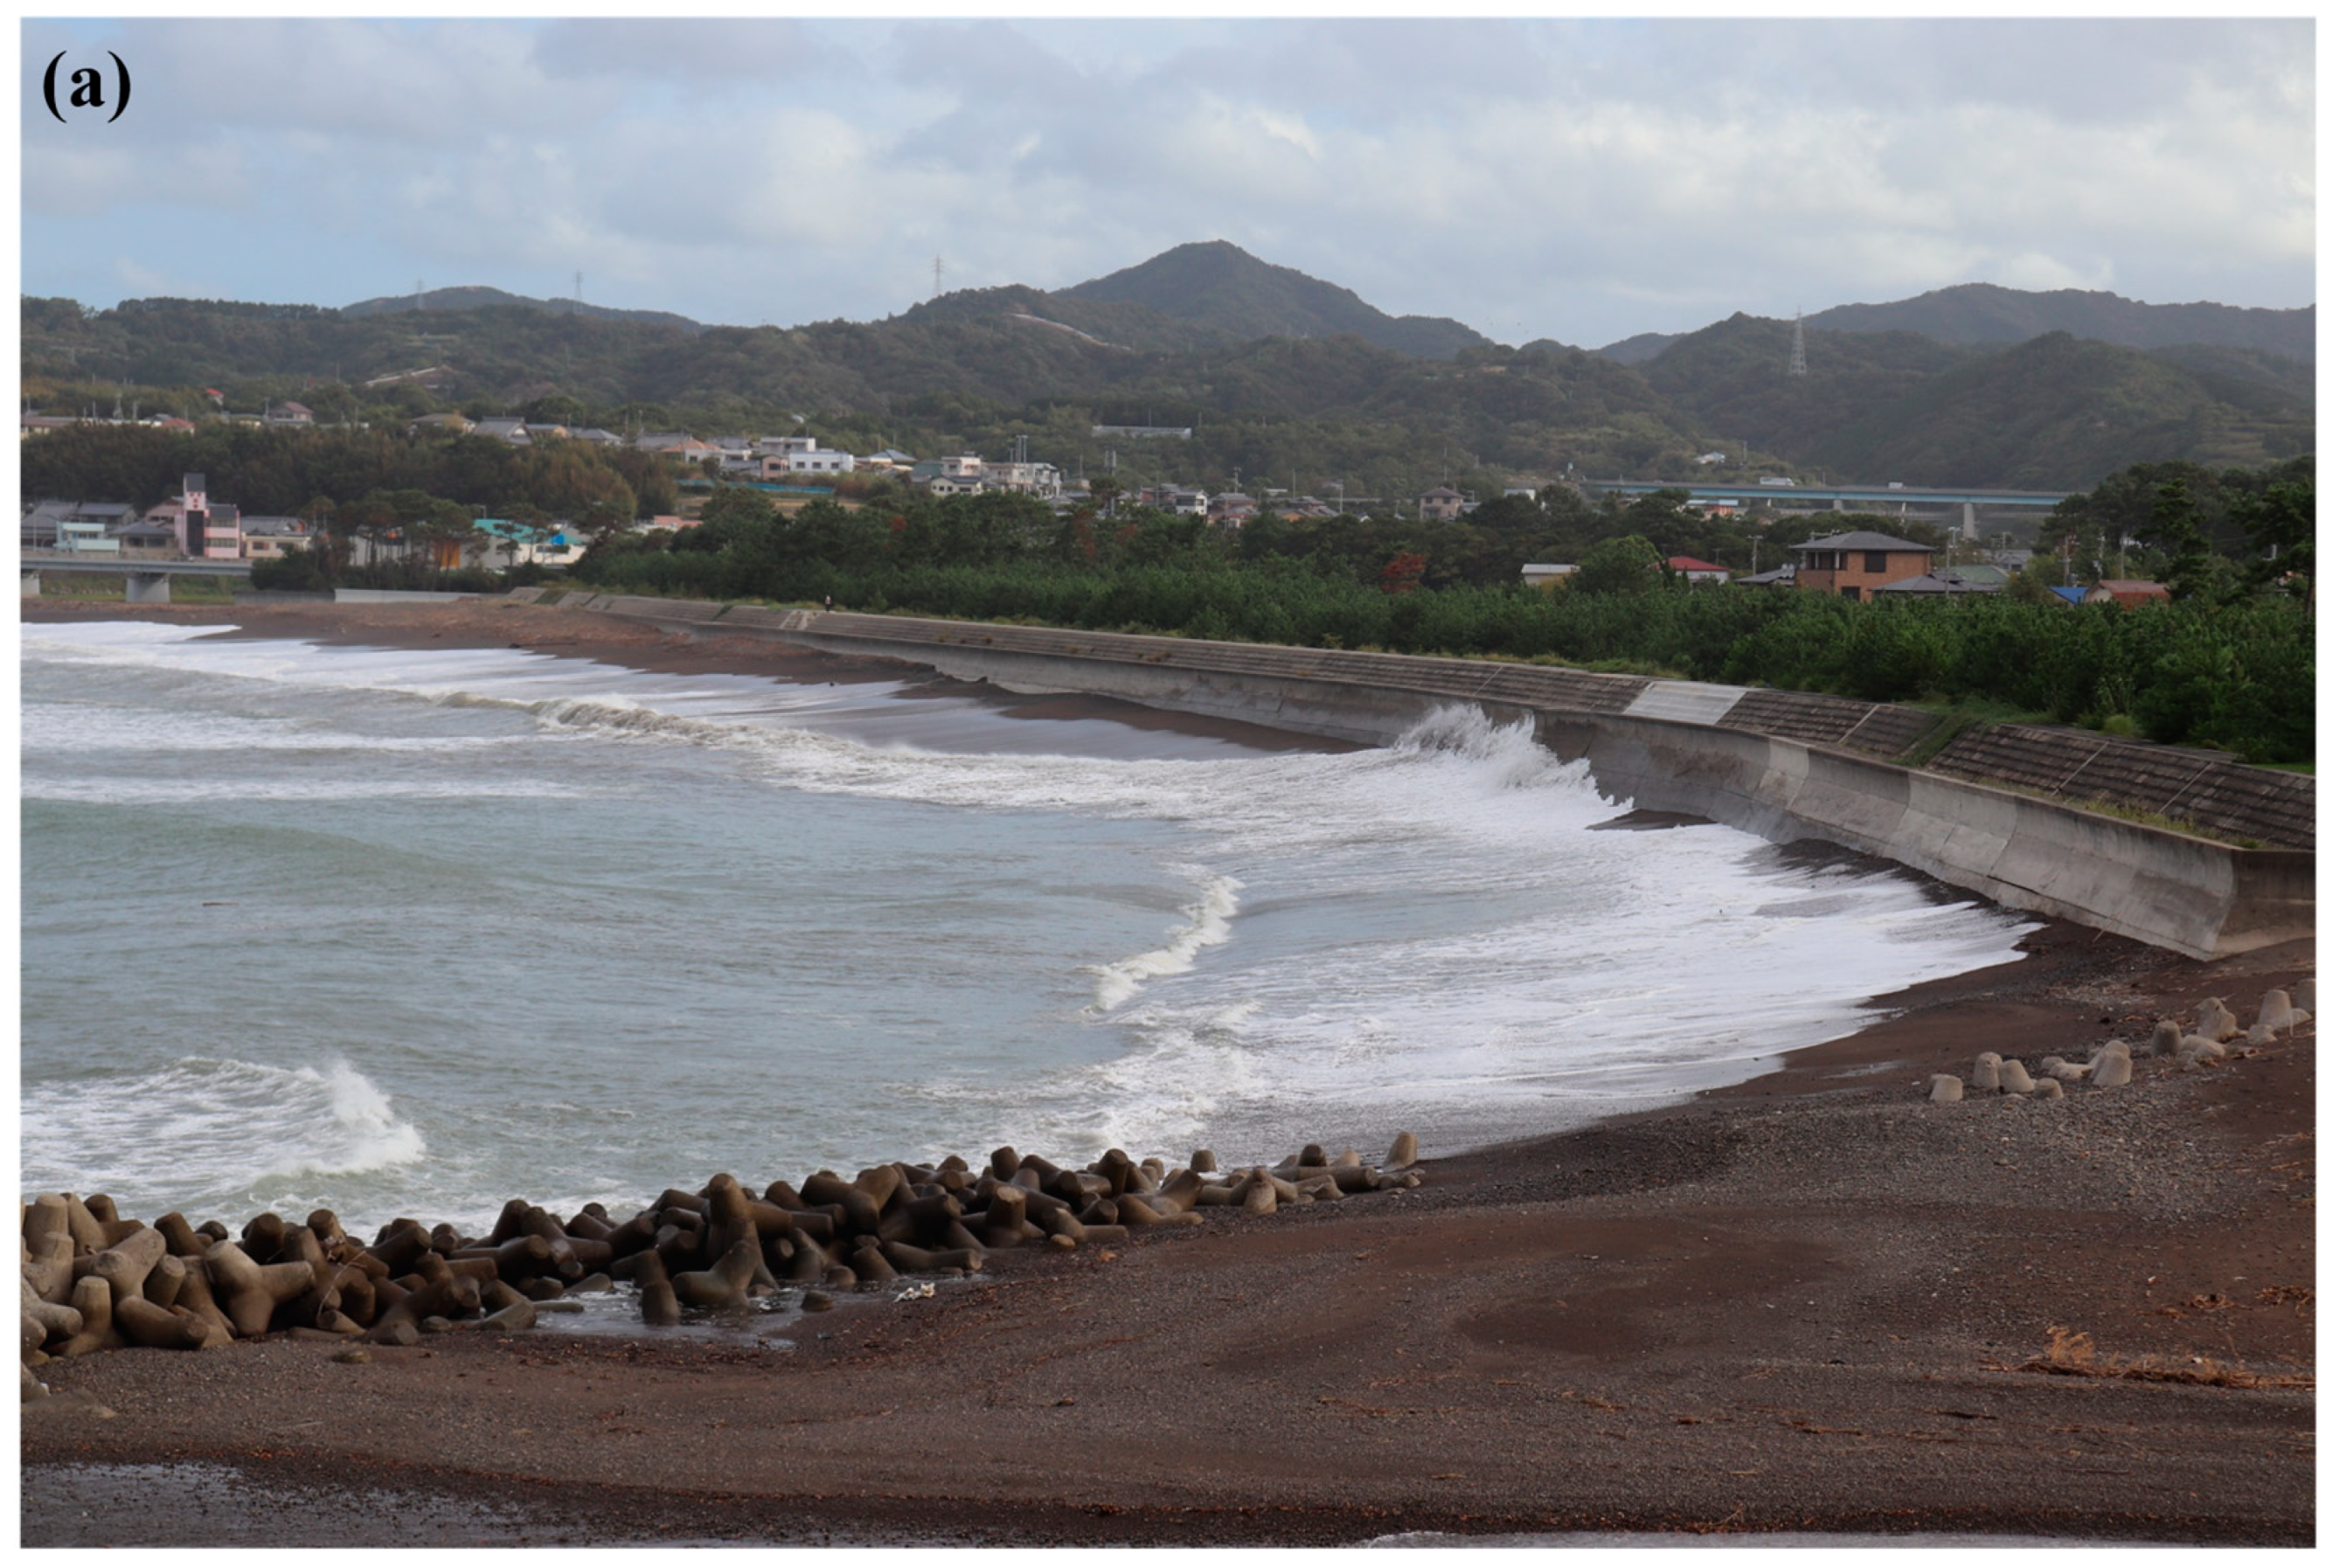
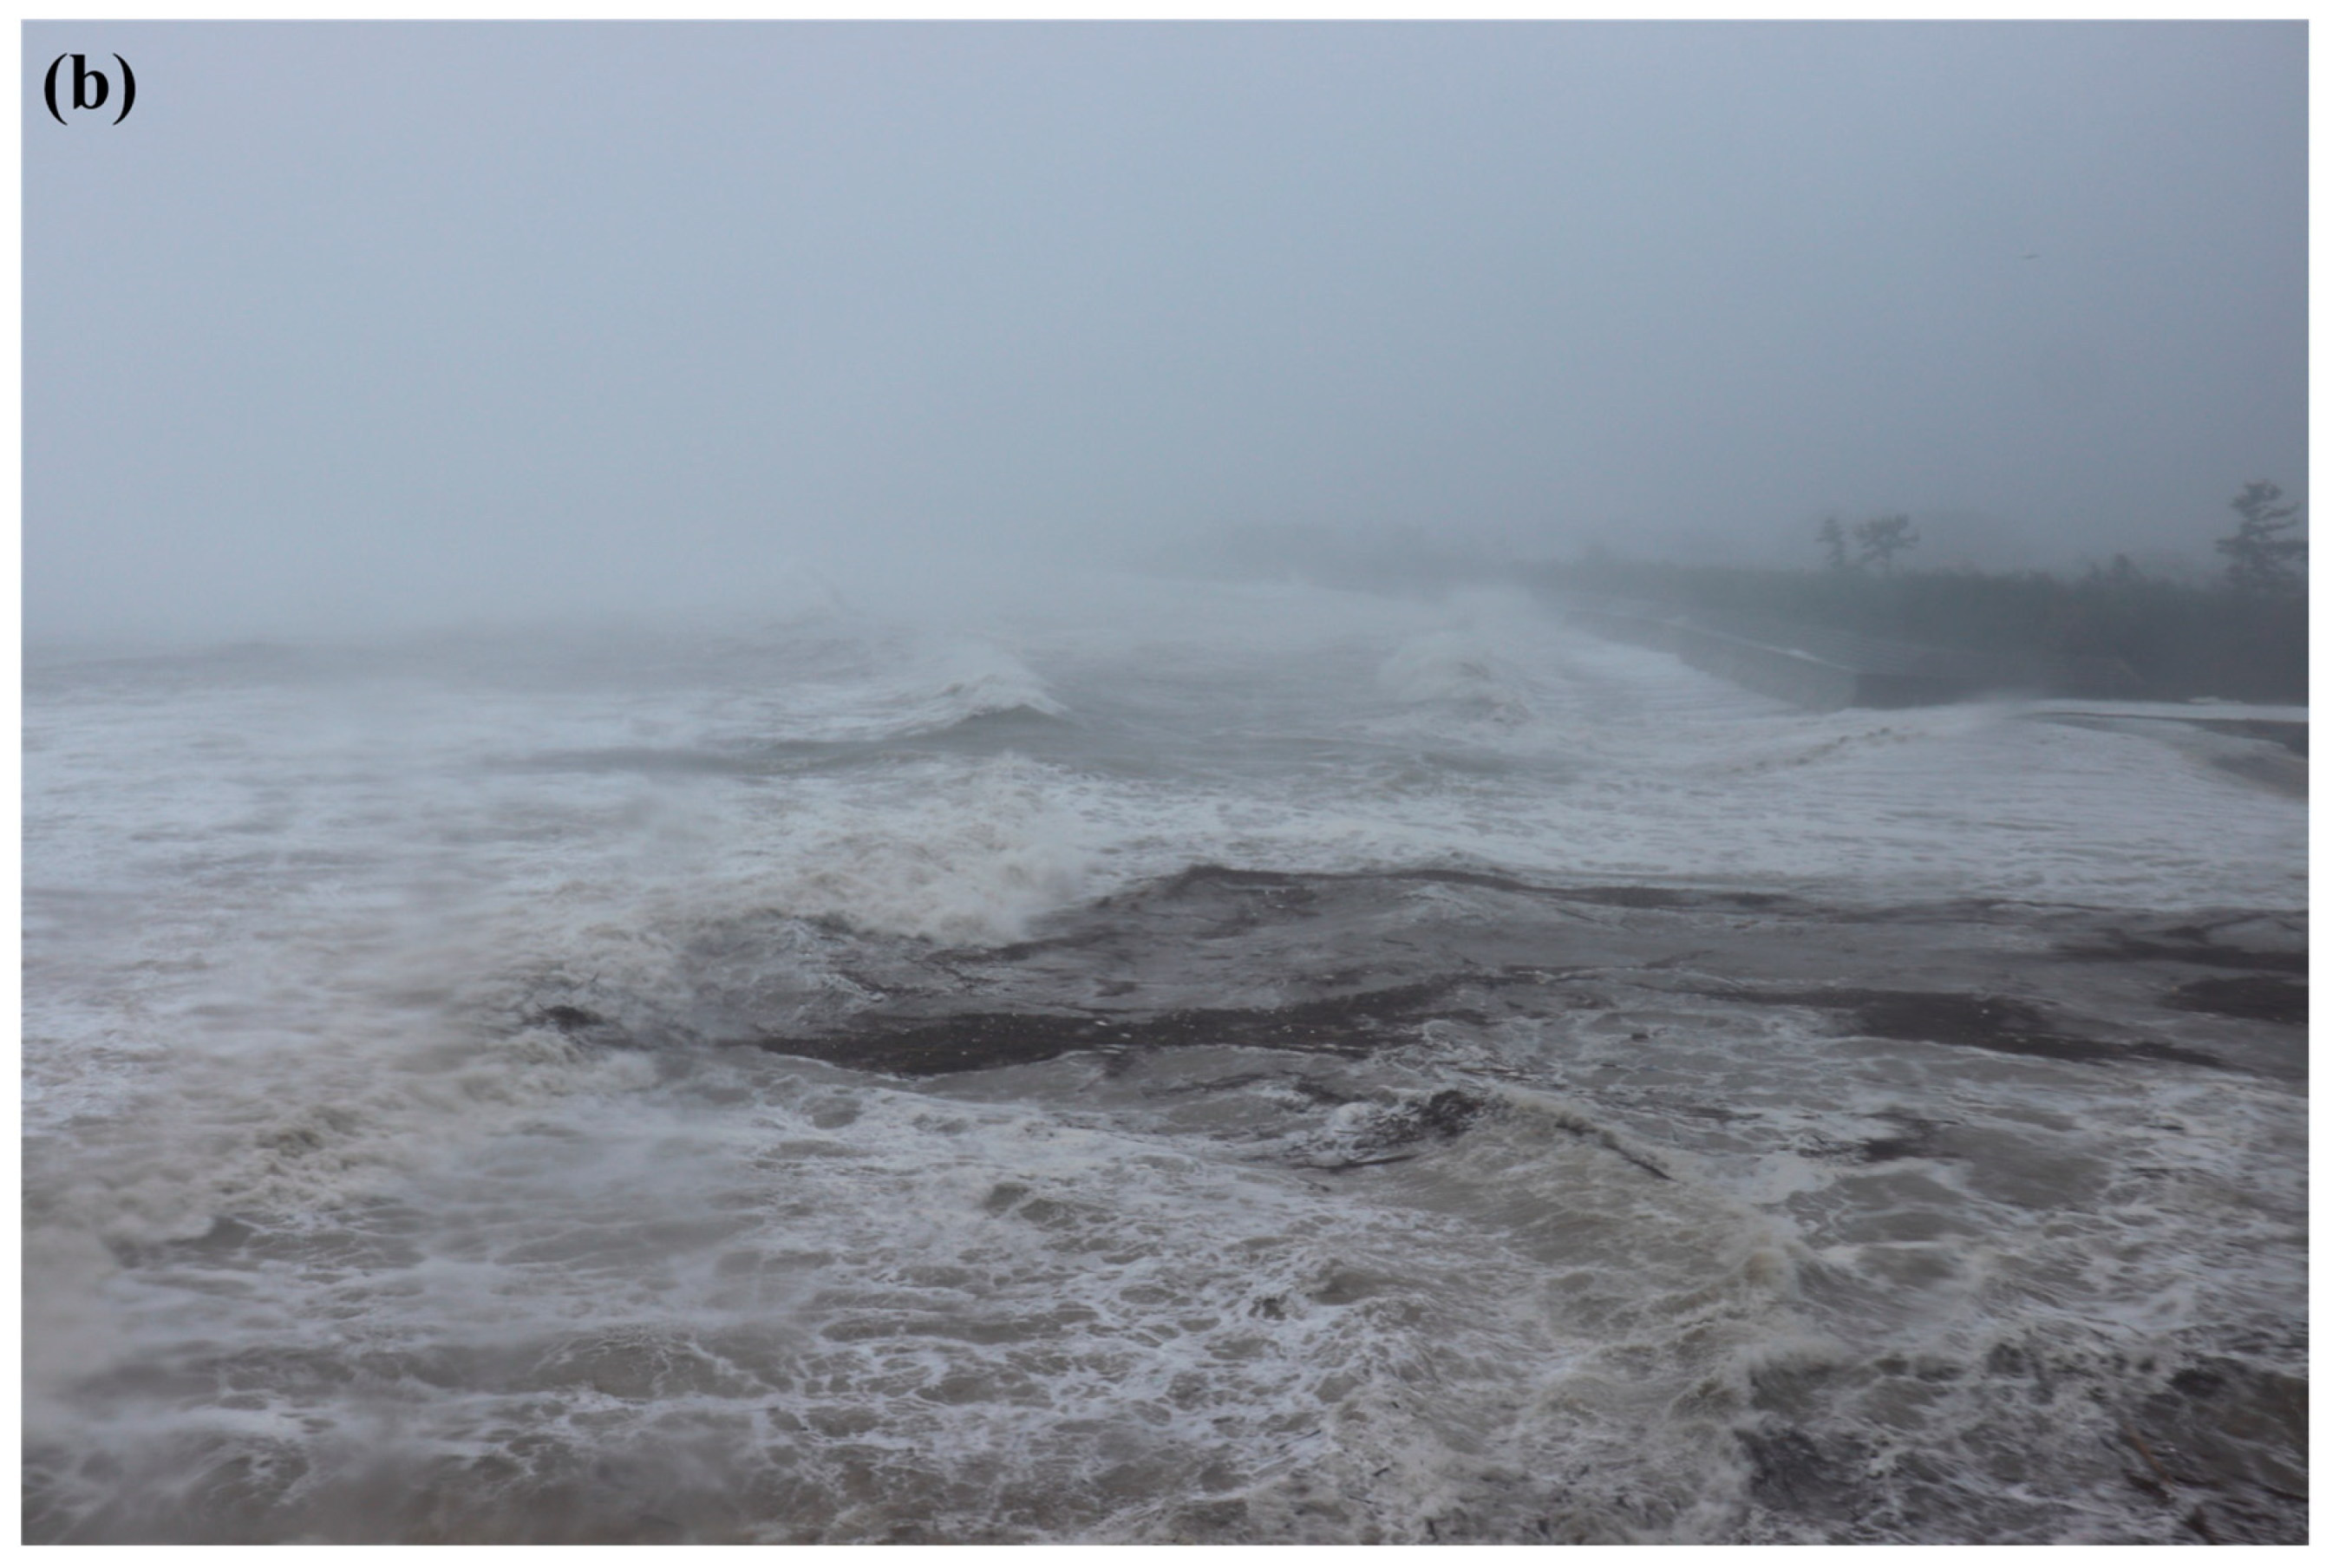
The authors visited the coasts of Kushimoto, Susami, Shirahama, Tanabe, Minabe, Inami, Gobo, Mihama, Yura, and Arida (Figure 1). Tide gauge stations, operated by Japan Meteorological Agency, JMA, at Kushimoto, Shirahama, and Gobo, observed peak surge levels of TP + 1.7 m, TP + 1.6 m, and TP + 3.2 m, respectively, at these locations during Jebi [13,14]. A substantial amount of debris was deposited onshore and covered most parts of the coast for several weeks after the typhoon. Figure 2 shows debris deposited on a coastal dike with a crown height of TP + 9.2 m, observed at Tonda Beach in Shirahama; large amounts of debris were also found behind the dike. Inami Town, located in the middle of Wakayama, (Figure 1) observed the highest witnessed watermark elevation, TP + 13.2 m, at a fishery harbor [13]. Furthermore, still images and video footages, recorded by a resident, captured large waves 1–2 km north of the port (Figure 3), and these videos clearly indicated that waves repeatedly splashed over the dike with a crown height of TP + 7.0 m. These videos captured that water splashed to such a height that it was likely to reach the tops of trees on the dike and that significant water mass with debris flowed with a long-wave component. In Yura Town, located north of Gobo, where the peak surge level was TP + 3.2 m (Figure 1), no inundation was observed in the area behind seawalls, while some residents witnessed inundation at a small harbor. According to witnesses, the inundation height and depth were approximately TP + 3.5 and 1.7 m, respectively. Debris also remained on a small coast near the harbor, and the ground level of the debris was nearly TP + 3.5 m. Minatomachi, in Arida City (Figure 1), was severely inundated with a ground level of approximately TP + 3 m, and the city was protected by a seawall with a crown height of around TP + 5–7 m [13,18]. Based on photographs taken during and after the typhoon, Yamanaka et al. [18] determined that the maximum inundation depth in the area was 0.6 m and also mentioned that wave overtopping was the primary cause of inundation.

2.2. Damage Caused by Typhoon Trami

Typhoon Trami, reaching the lowest central pressure of 915 hPa, made landfall on Tanabe in Wakayama Prefecture around 20:00 JST on 30 September 2018, with a central pressure of 950 hPa [16] (Figure 1). Typhoon-induced storm surges and waves, similar to those induced by Typhoon Jebi, significantly impacted the coasts of Wakayama, especially the coastal areas from Kushimoto to Tanabe, located on the east side of the typhoon path. Post-disaster survey following Typhoon Trami was conducted by the authors during 2 to 3 October 2018. Following the post-disaster survey after Typhoon Jebi, elevations of the remaining debris, destroyed structures, and watermarks witnessed by residents were measured by the RTK-GPS. Representative damages observed on the coast of Wakayama are presented in detail in this section.
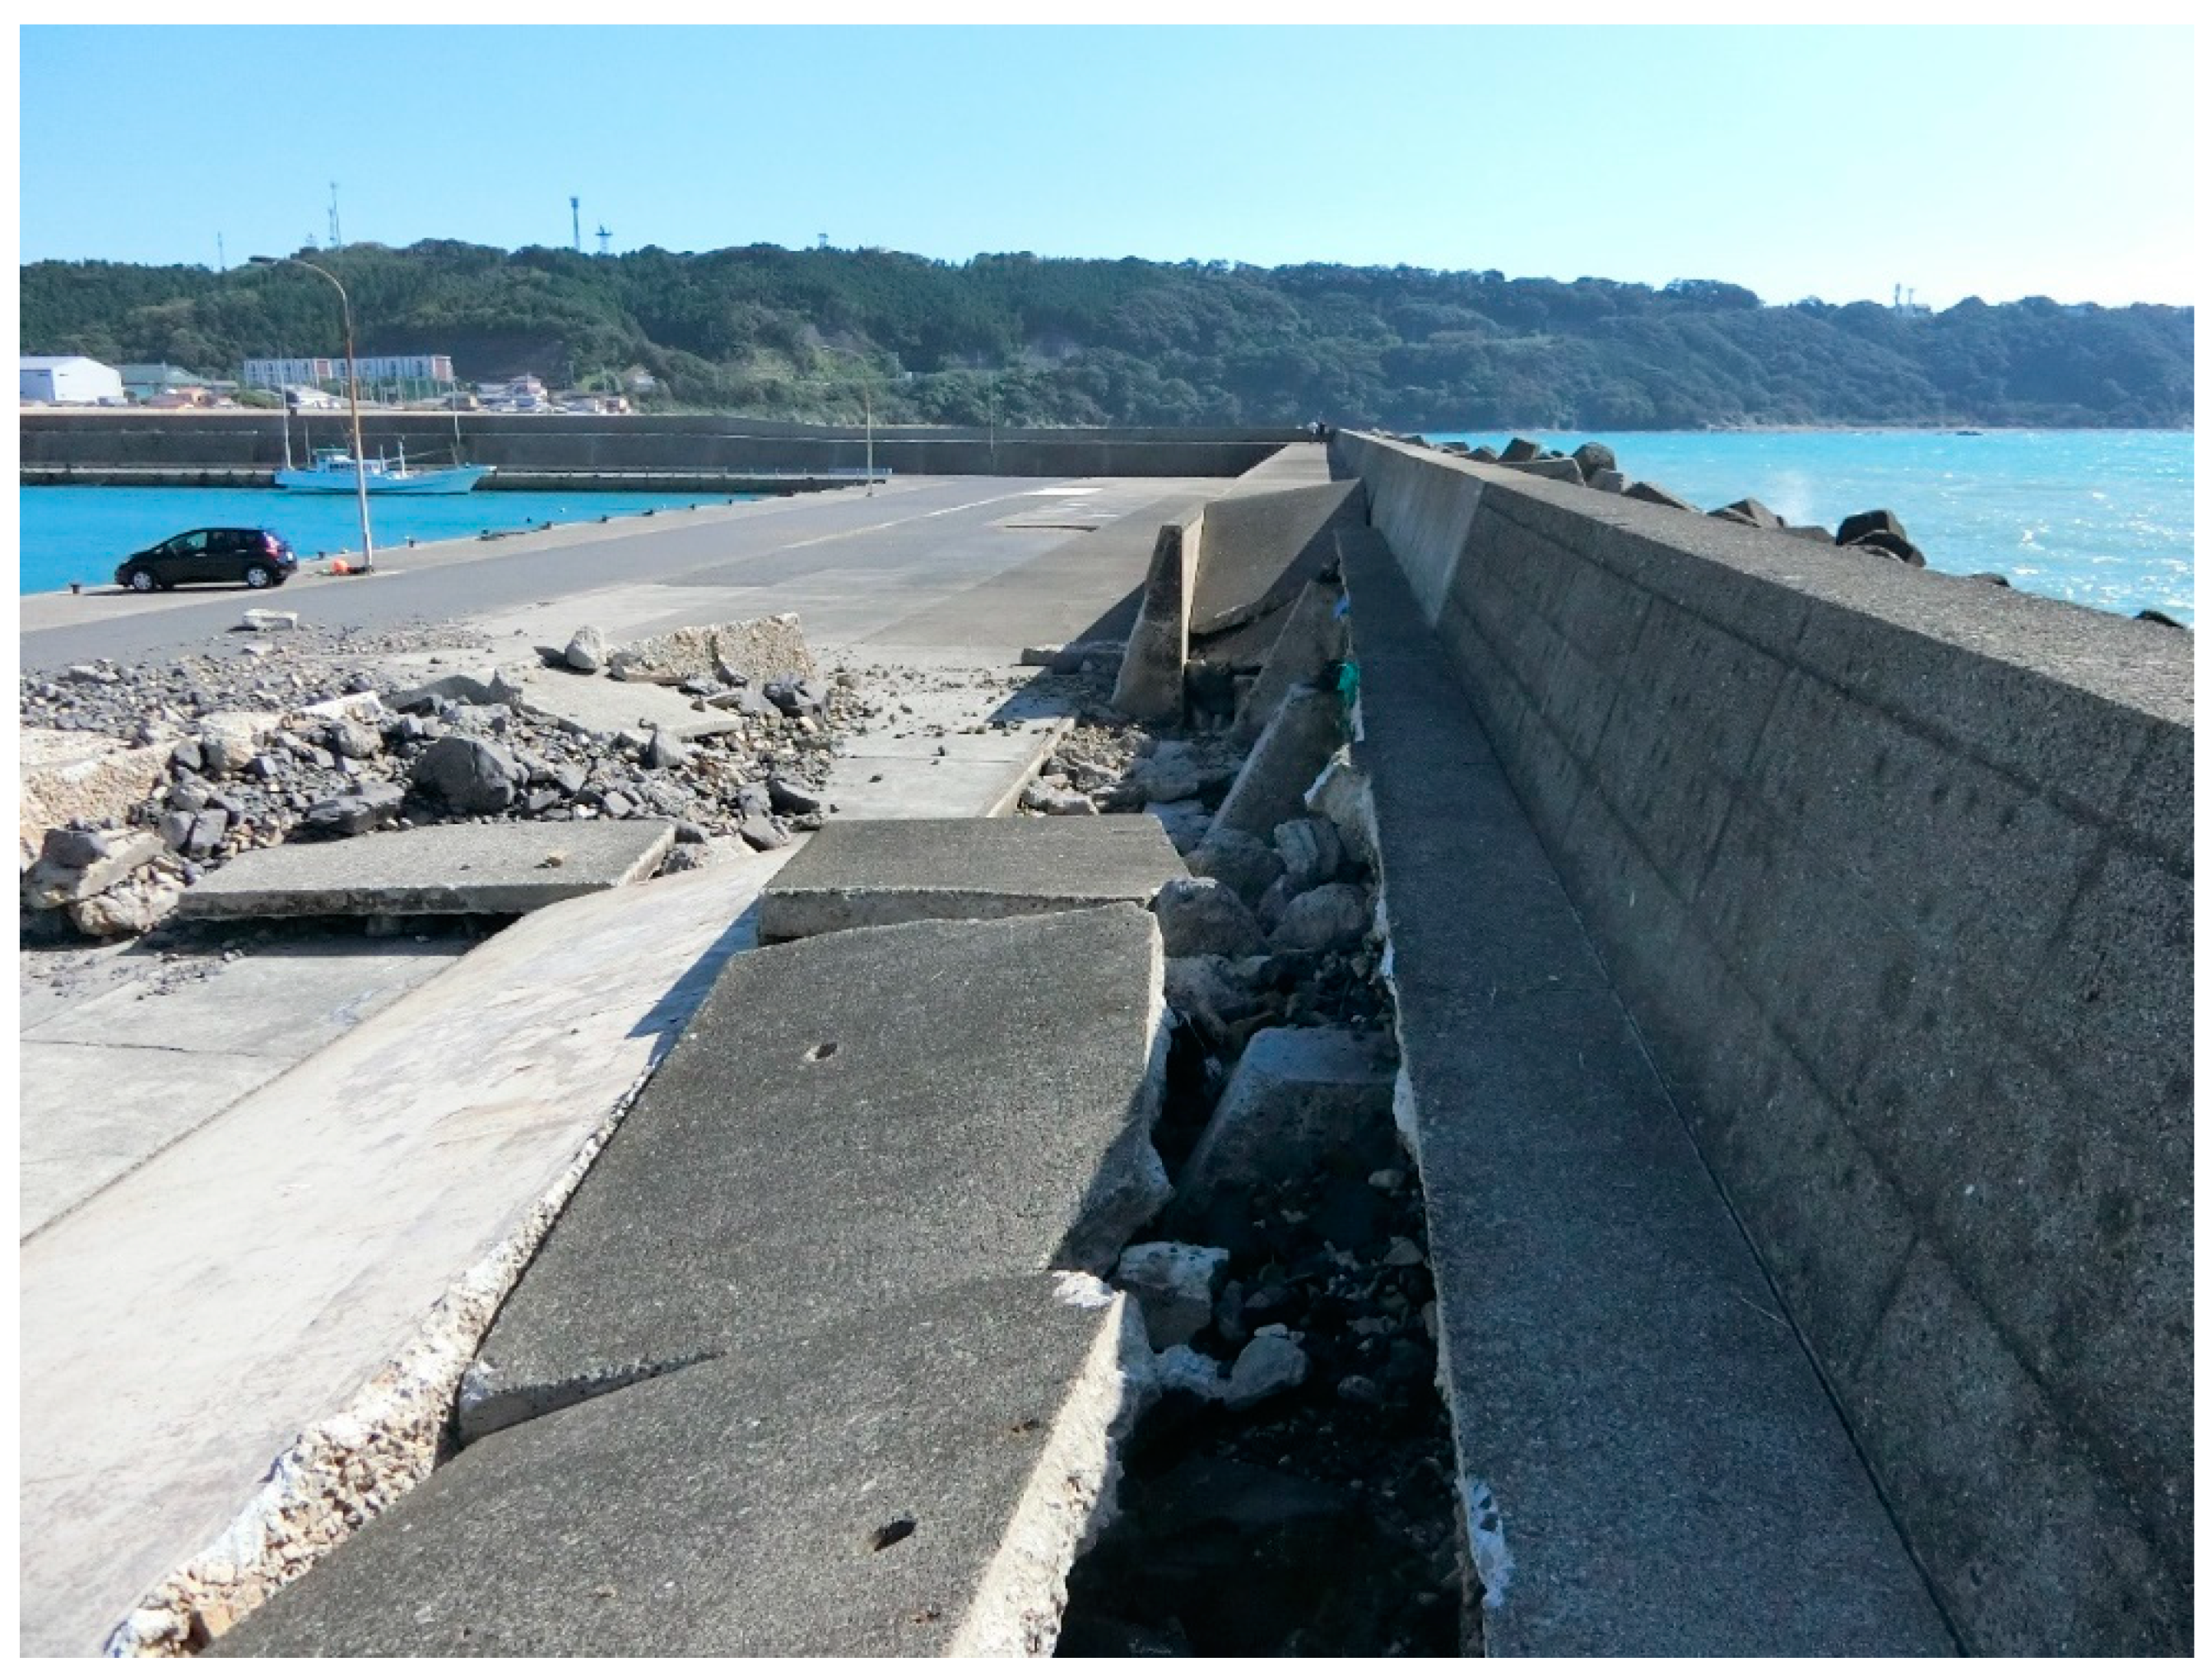
The authors visited the coasts of Kushimoto, Susami, Shirahama, Tanabe, Minabe, Inami, Gobo, and Mihama (Figure 1). Tide gauge stations at Kushimoto, Shirahama, and Gobo indicated peak surge levels of TP + 2.5 m, TP + 2.0 m, and TP + 3.0 m during Trami, respectively [15]. Similar to Typhoon Jebi, a considerable amount of debris was carried onshore and covered the coasts after Trami. Structures and houses near the coast were severely damaged by storm-induced waves during the typhoon. Figure 4 shows a damaged breakwater observed at Suganohama fishery harbor in Kushimoto. In the harbor, debris remained at a ground elevation of TP + 3.6 m, and a resident witnessed waves running up to the same elevation. However, the crown height of the breakwater was TP + 5.1 m, and it collapsed only on the inside slope, as shown in the photograph. There were few witnesses to the high surge and wave elevation during Trami because most of the damage caused by the typhoon was at night; however, important evidence was recorded by a resident at Mirozu station, where a part of a small station building had collapsed at a ground elevation of around TP + 9.3 m. The resident witnessed watermarks in/around the station buildings at 6:30 on 1 October, 10 h after the typhoon’s landfall. This station is located on a coastal cliff and thus waves might have splashed up to the elevation of the station. The Mera area, located on Shimohaya Bay in Tanabe, on which the typhoon made landfall, suffered damage from waves. Inundation was dominantly caused by overtopping waves during Jebi [13] and was more severe during Trami. A witness stated that the inundation depth during Trami in the area was approximately 1 m. Furthermore, the inundating flow razed a tree behind the seawall, and part of the tree hit and significantly damaged a nearby house. Therefore, the influence of waves was significant in this area. However, these waves were expected to dissipate because of their geometries [13].

2.3. Comparison of Inundation Characteristics of Jebi and Trami

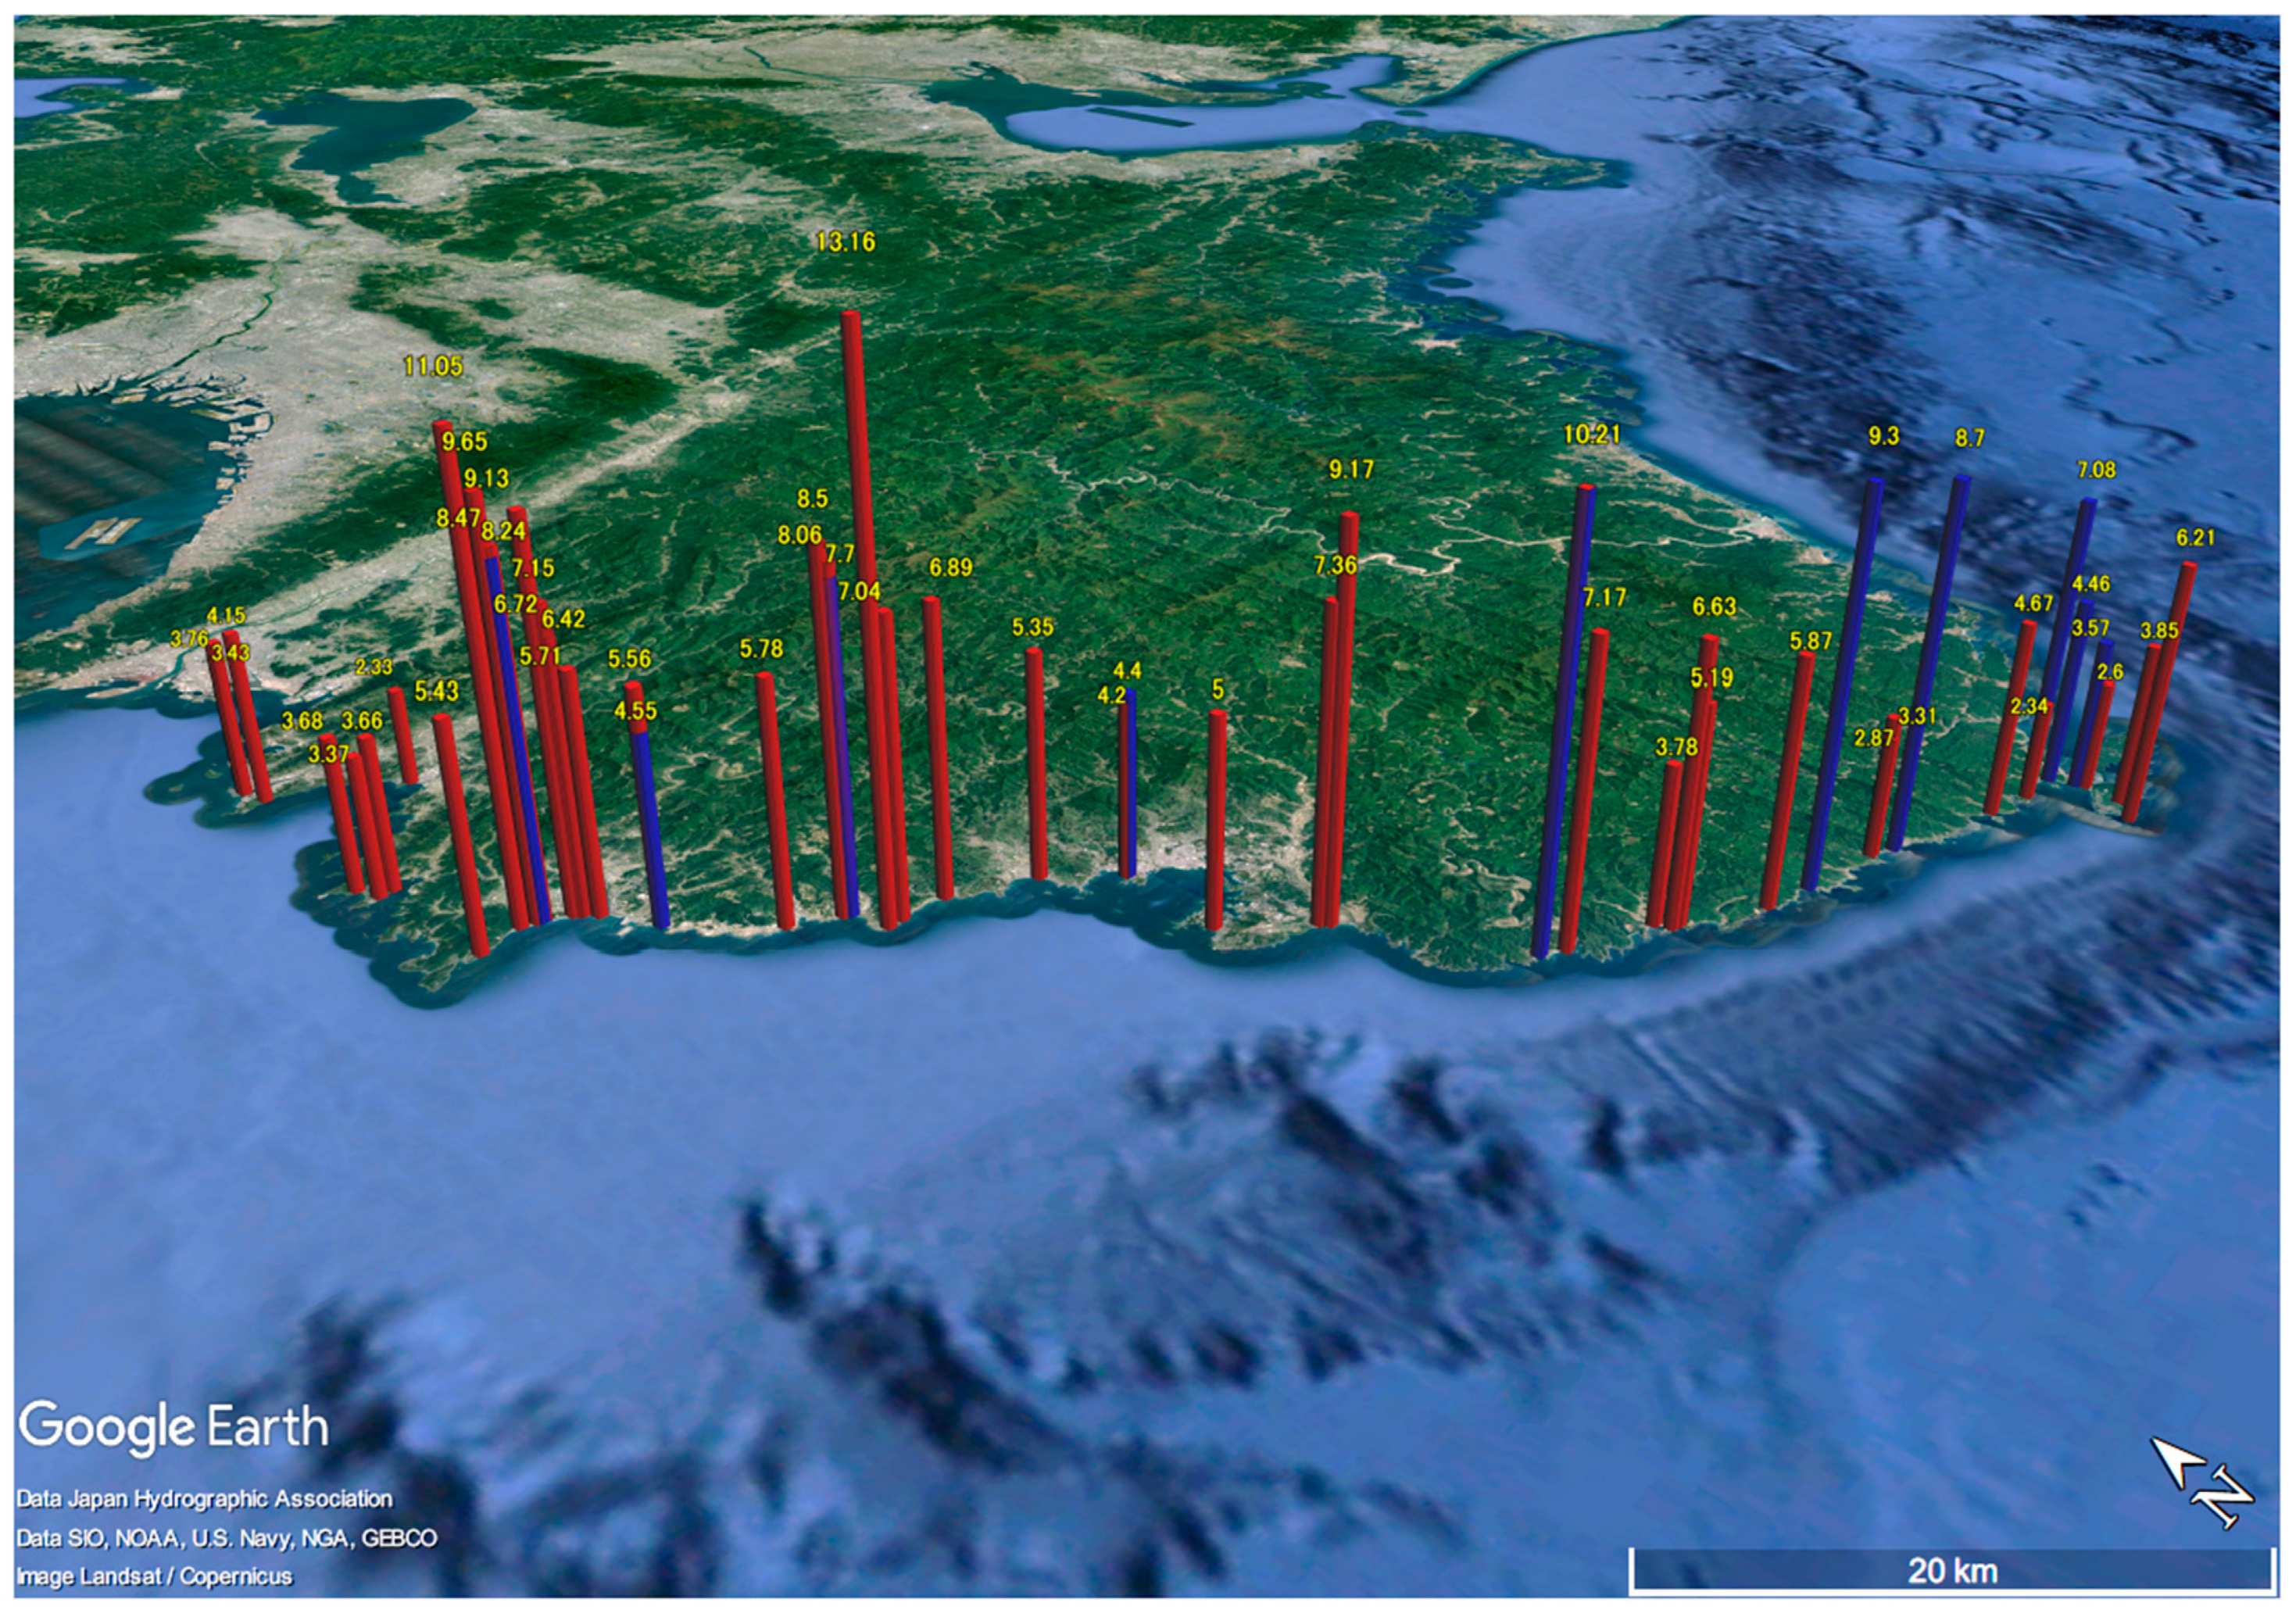
Figure 5 shows the elevations of the witnessed watermarks, debris, and destroyed structures observed along the coasts of Wakayama from both typhoons. Most of these elevations are equivalent to the run-up height of the inundating flows, primarily induced by overtopping waves. The maximum elevations of these watermarks due to Typhoons Jebi and Trami were TP + 13.2 m at Inami and TP + 10.2 m at Shirahama, respectively. As seen in Figure 5 with Figure 1, the observed elevations of the watermarks after Typhoon Jebi were relatively higher along the coasts from Shirahama to Mihama, located in the middle of the coast of Wakayama, than those along the northern and southern coasts. Furthermore, the relatively higher elevations were locally concentrated around Shirahama, Inami, and Mihama. The highest observed watermarks caused by Typhoon Trami were in a different location from those caused by Typhoon Jebi. Relatively high watermarks were found both on the east and west sides of the typhoon path. Although survey data of the run-up heights after Trami were not enough to fully capture their alongshore variation, some of the relatively higher run-up heights were observed in identical locations (e.g., Shirahama, Inami, and Mihama after both Jebi and Trami). The recorded peak tide levels during these two typhoons were much lower than the elevations of the watermarks and debris, and this feature clearly indicates the dominant influence of storm-induced waves rather than storm surges themselves along the coast of Wakayama. Additionally, the observed elevations for both typhoons were locally concentrated, and the sites showing high elevations were identical for both typhoons. Therefore, it is important to estimate nearshore wave dynamics to understand the local concentration characteristics of waves and surges.

3. Numerical Simulation

To determine the characteristics of storm-induced waves and storm surges around the coast of Wakayama during these typhoons, numerical simulations were carried out. Storm-induced wave fields were simulated based on Wave Watch III (WW3) [19], and storm surges were simulated based on the nonlinear long-wave model with forcing terms due to wind shear stress and an atmospheric pressure gradient [20]. Bathymetry data of the computation domains for these simulations were obtained from the General Bathymetric Chart of the Oceans [21]. The domain of WW3 applied a one-way, nested-grid system with resolutions of 30, 12, 3, and 1 arc-min, while the domain for storm surge applied a spherical coordinate system with a single grid size of 30 arc-sec. The wind-induced, air-sea drag coefficient model of Oey et al. [22] was applied for both computations. WW3 computations were based on a wind field obtained from Global Spectral Model - Grid Point Value, GSM-GPV data [23]. The present surge model did not account for the force due to wave radiation stress. Wind and pressure gradient fields were determined using an empirical typhoon model with the track and central pressure of the typhoon estimated by JMA [16]. Three different constant values of Manning’s roughness (i.e., 0.010, 0.025, and 0.050 m−1/3s) for representing bottom shear stress were tested. The present model did not account for time variations in the astronomical tide, and the initial still water level was set to TP + 0 m.
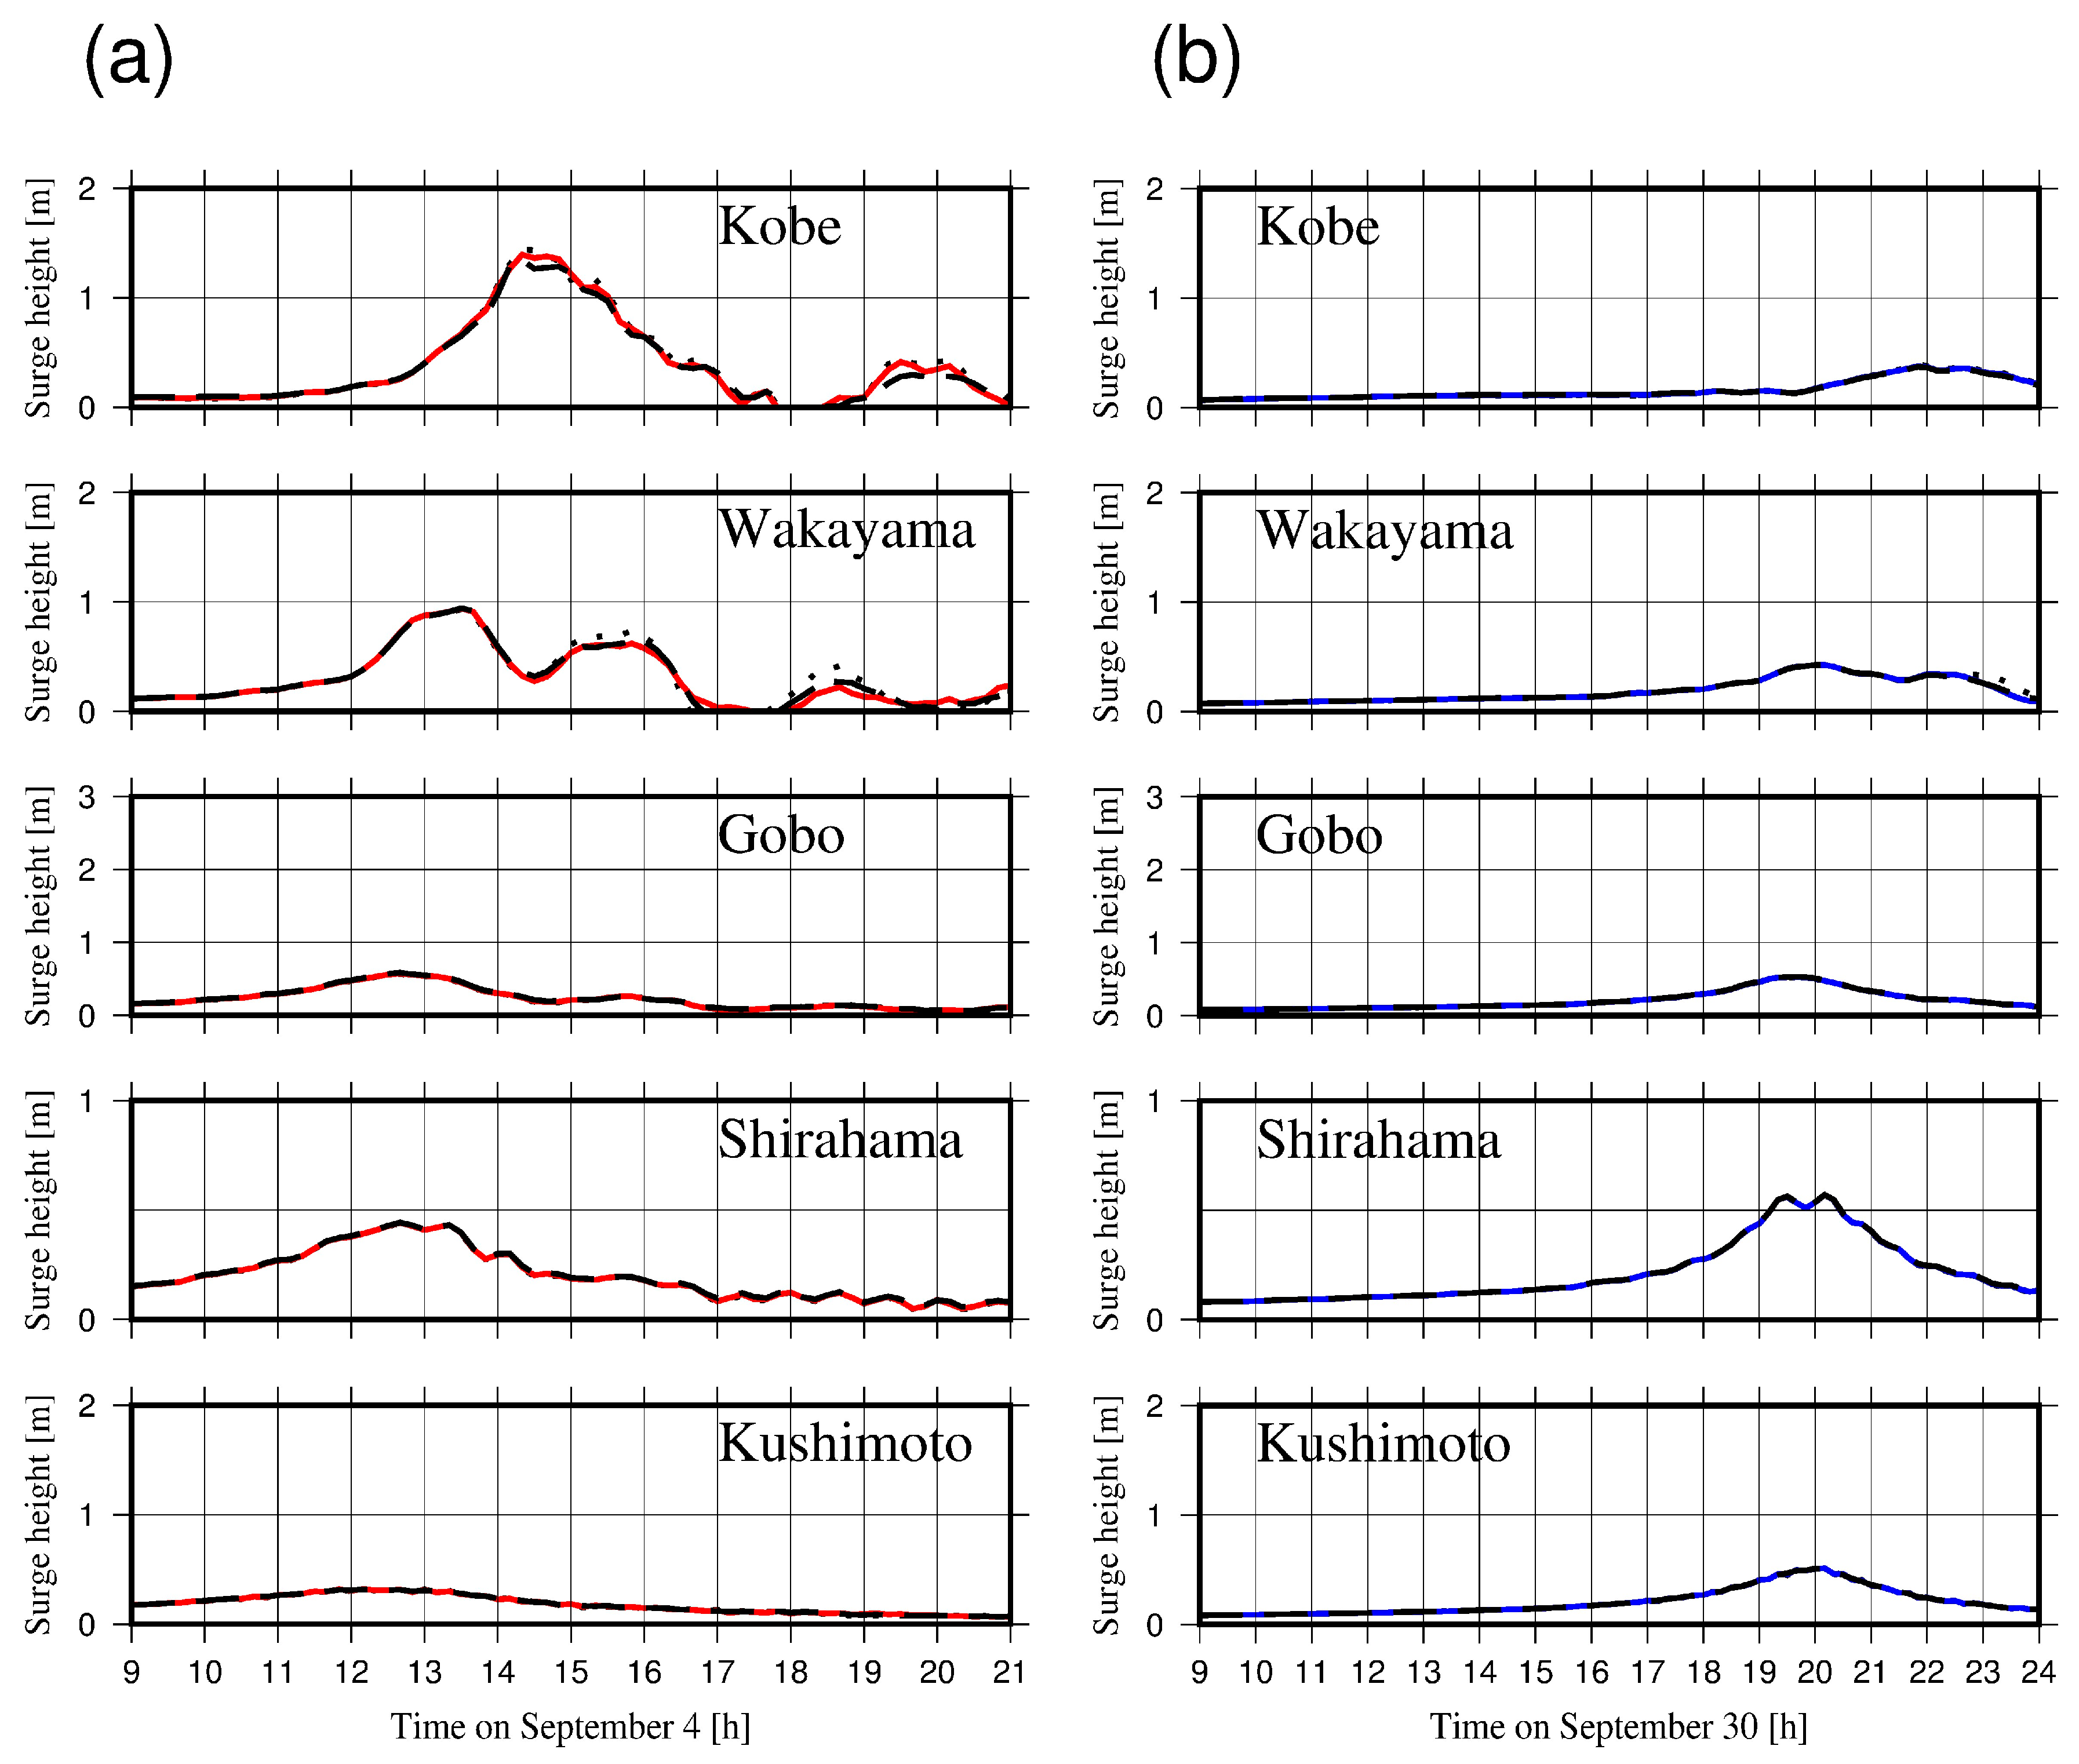
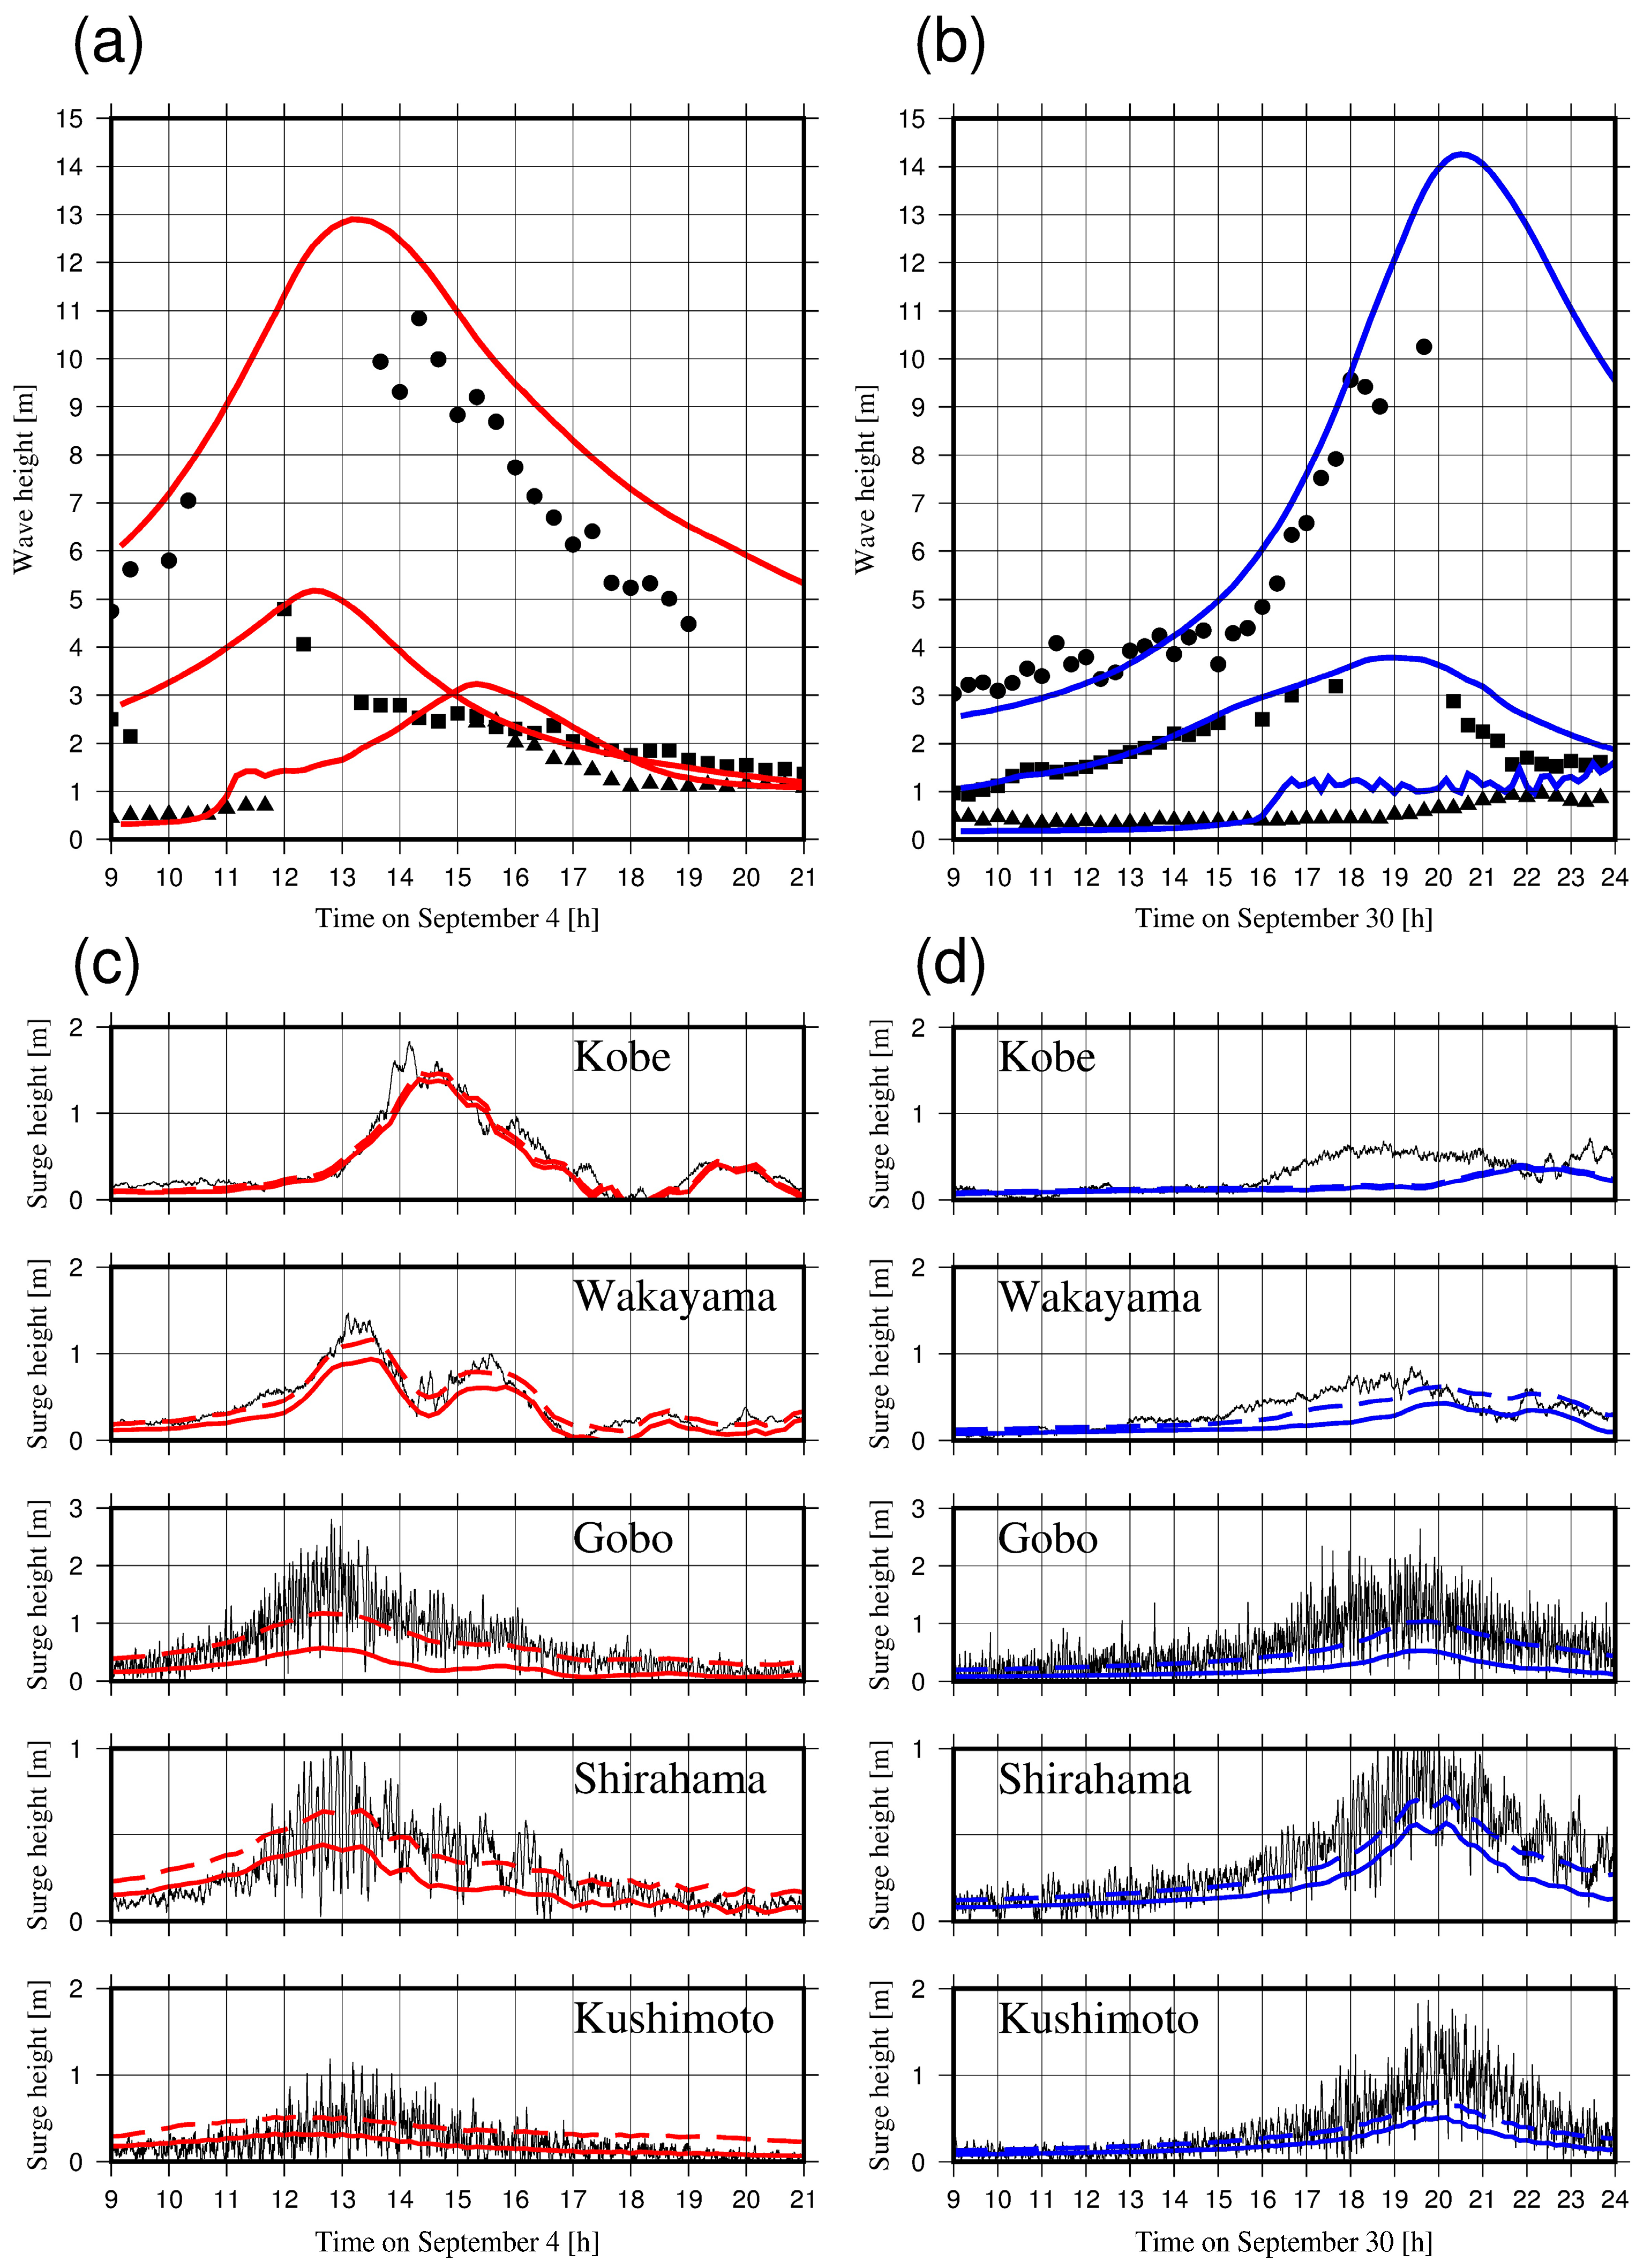
Figure 6 compares the simulation results with the observed data obtained at NOWPHAS and at tide gauges (Figure 1) for Typhoons Jebi and Trami. While some of the wave data are missing, the simulation results moderately reproduced the observed time series of significant wave heights for both Jebi and Trami. As the simulated surge heights are insensitive to the roughness values (Figure A1), Figure 6 presents the surge waveforms simulated by assuming a Manning’s roughness of 0.025 m−1/3s. In the comparison of storm surges, the observed data show the difference between the observed tide level and the corresponding astronomical tide so that it can be compared with the simulated surge heights. To roughly account for the influence of the wave setup, Figure 6c,d shows the simulated instantaneous surge heights and the ones with a height equal to 5% of the nearshore significant wave height simulated by WW3. As seen in these figures, the simulated surge heights reasonably reproduce the observed storm surge height. The simulation results showed better predictions by considering the roughly estimated wave setup (i.e., 5% of nearshore wave heights) compared to the tide gauge data, particularly at the tide gauge stations of Kushimoto, Shirahama, and Gobo. This feature indicates the significant impact of storm-induced waves on the total increase in water surface elevation along the coast of Wakayama.
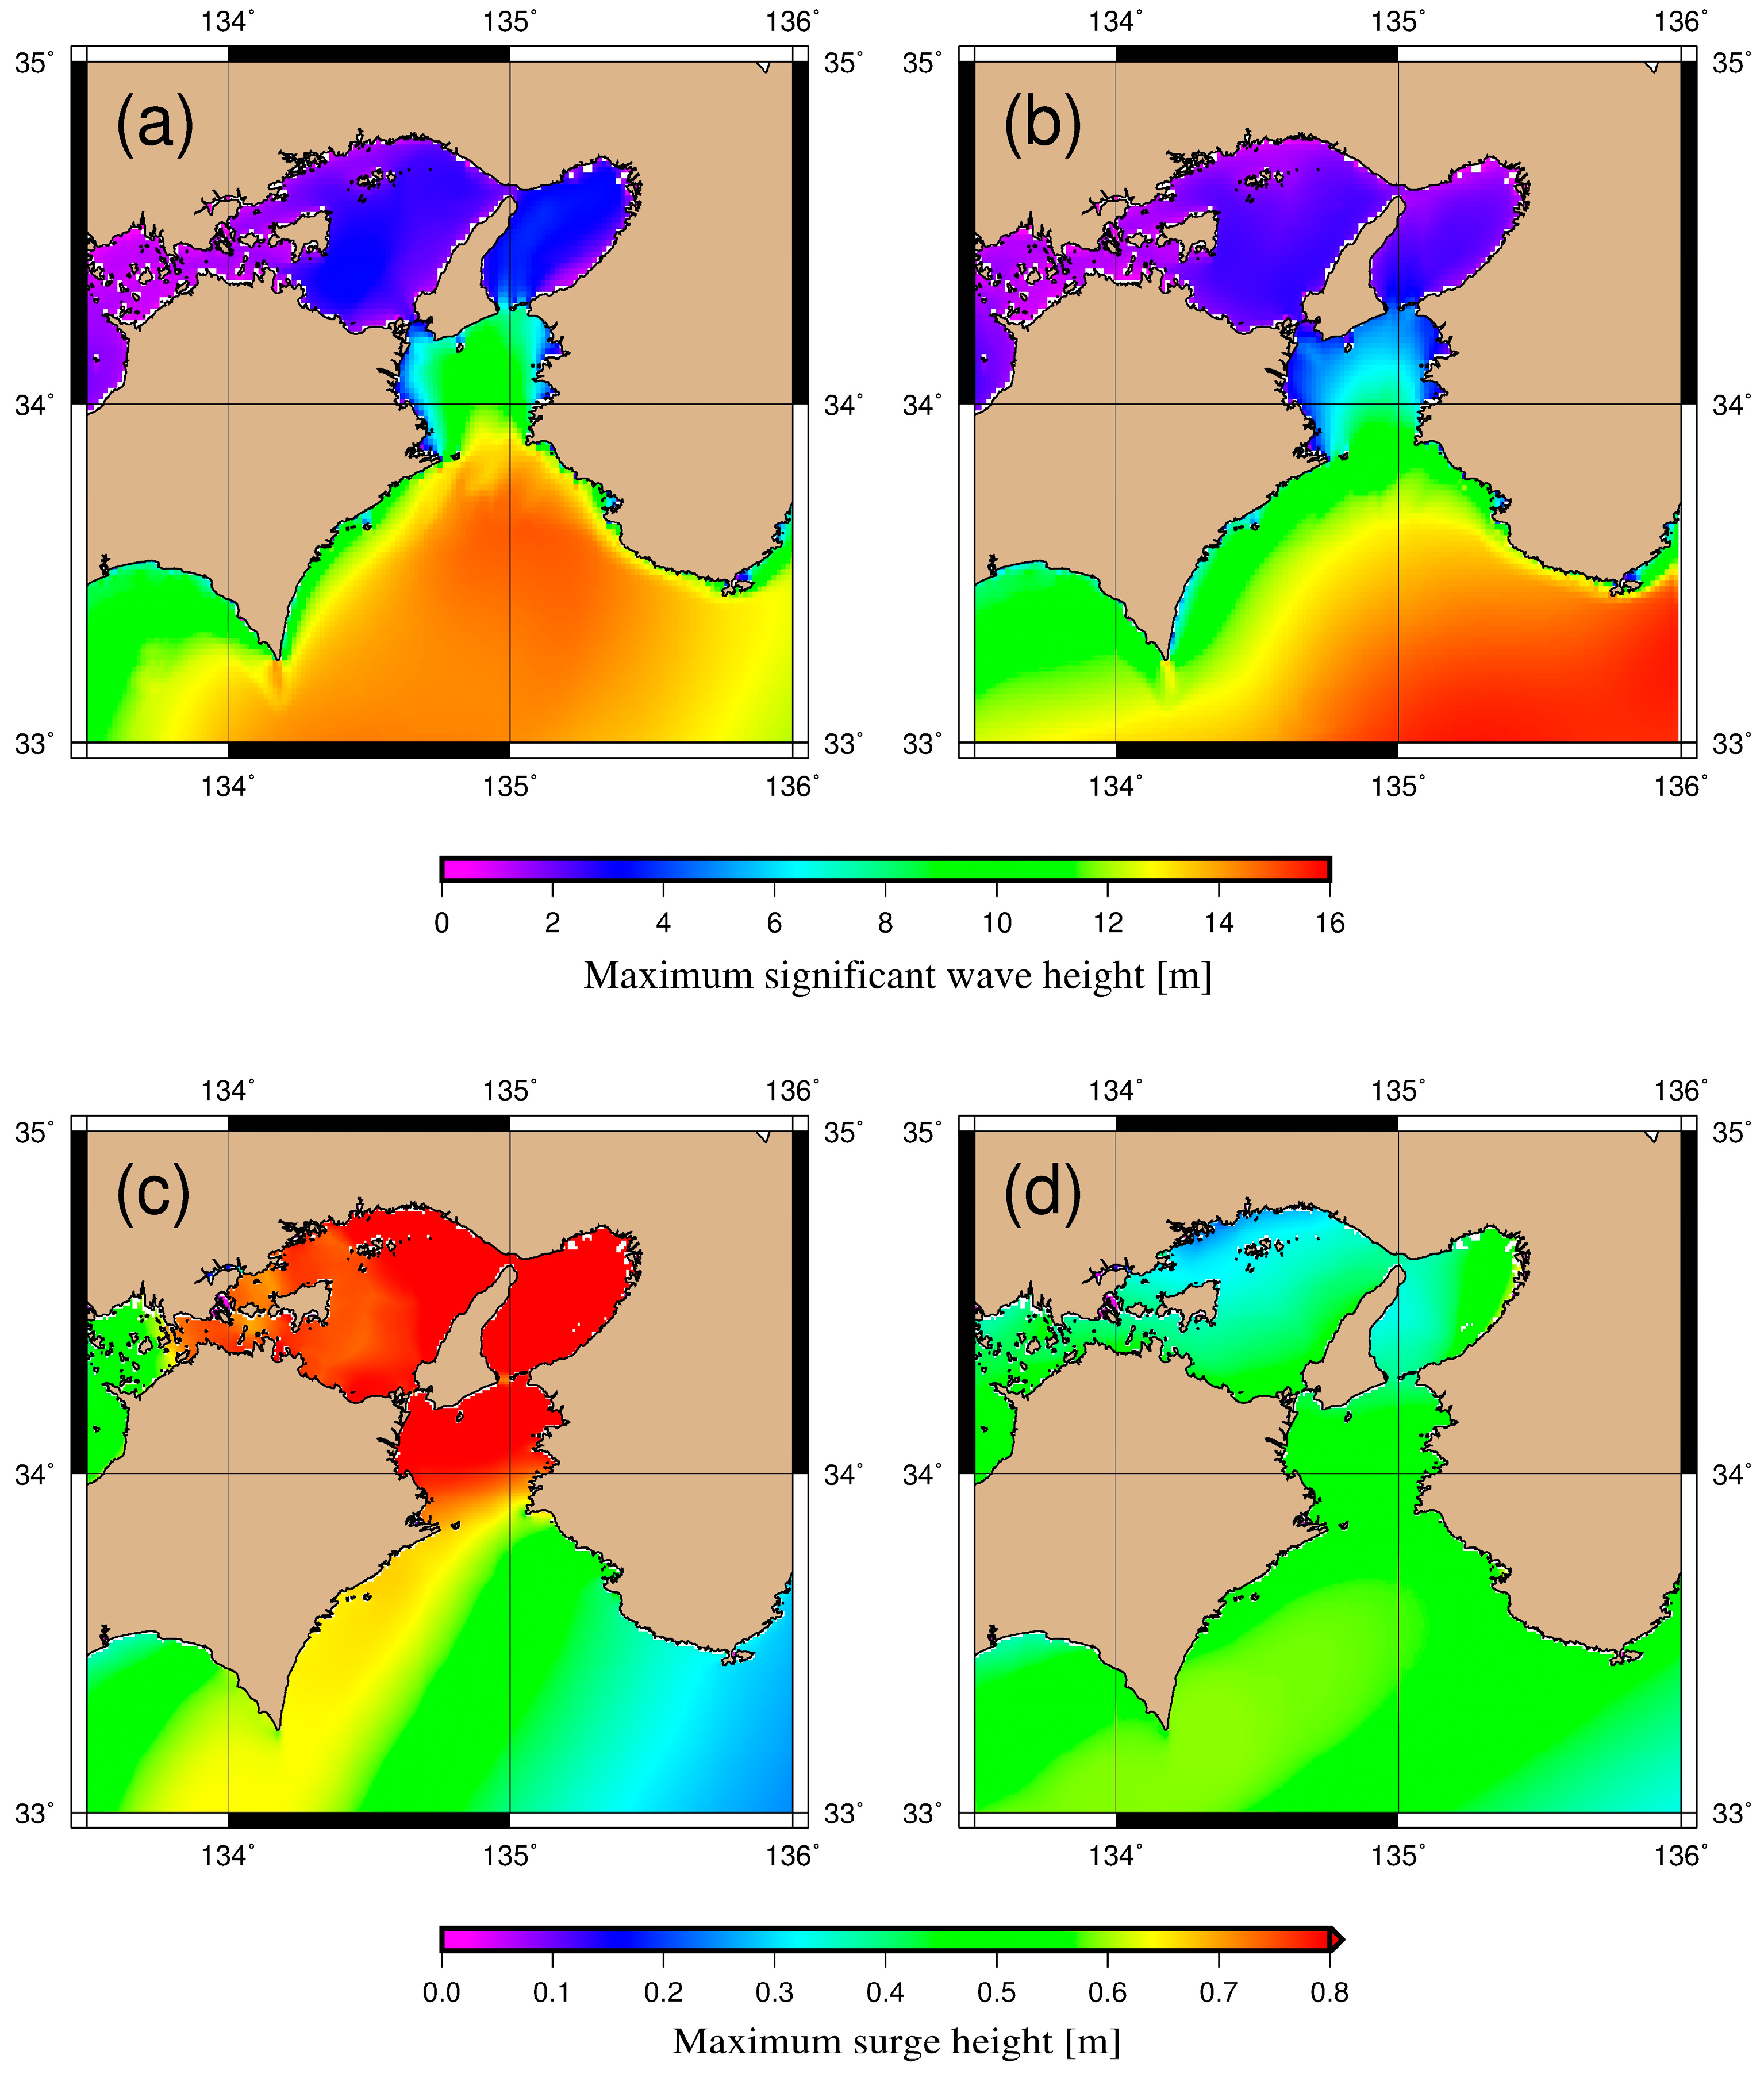
Figure 7 shows spatial distributions of the simulated maximum values of significant wave heights and storm surge heights during Jebi and Trami. As seen in Figure 7a,b, significant wave heights gradually decrease toward Kii Channel and Osaka Bay, where fetch-limited waves are dominant, and peaked around the middle coasts from Shirahama to Mihama for Jebi and at the south of Kushimoto for Trami. According to the simulation results shown in Figure 7c,d, surges in Jebi were locally concentrated around confined sea areas such as Osaka Bay because of the typhoon path and geometry; on the other hand, insignificant concentration appeared in Osaka Bay during Trami because it was located to the west of the typhoon path. These results yielded the large contrast between Figure 7c,d. The computed maximum surge heights on the coast of Wakayama have a peak in the north for Jebi and around Tanabe for Trami because of their proximities to the typhoon paths. Additionally, the model predicts smaller storm surges to the west of Typhoon Trami path than those to the east, as evidenced by the observations such as at Wakayama located to the west and Shirahama located to the east (Figure 6). However, local variations in significant wave heights and surge heights along the coast of Wakayama were not noteworthy, while elevations observed in the field surveys showed substantial variations along the coast (Figure 7). Therefore, this feature indicates the importance of local wave geometry in alongshore variations.

4. Analysis of Tide Gauge Records

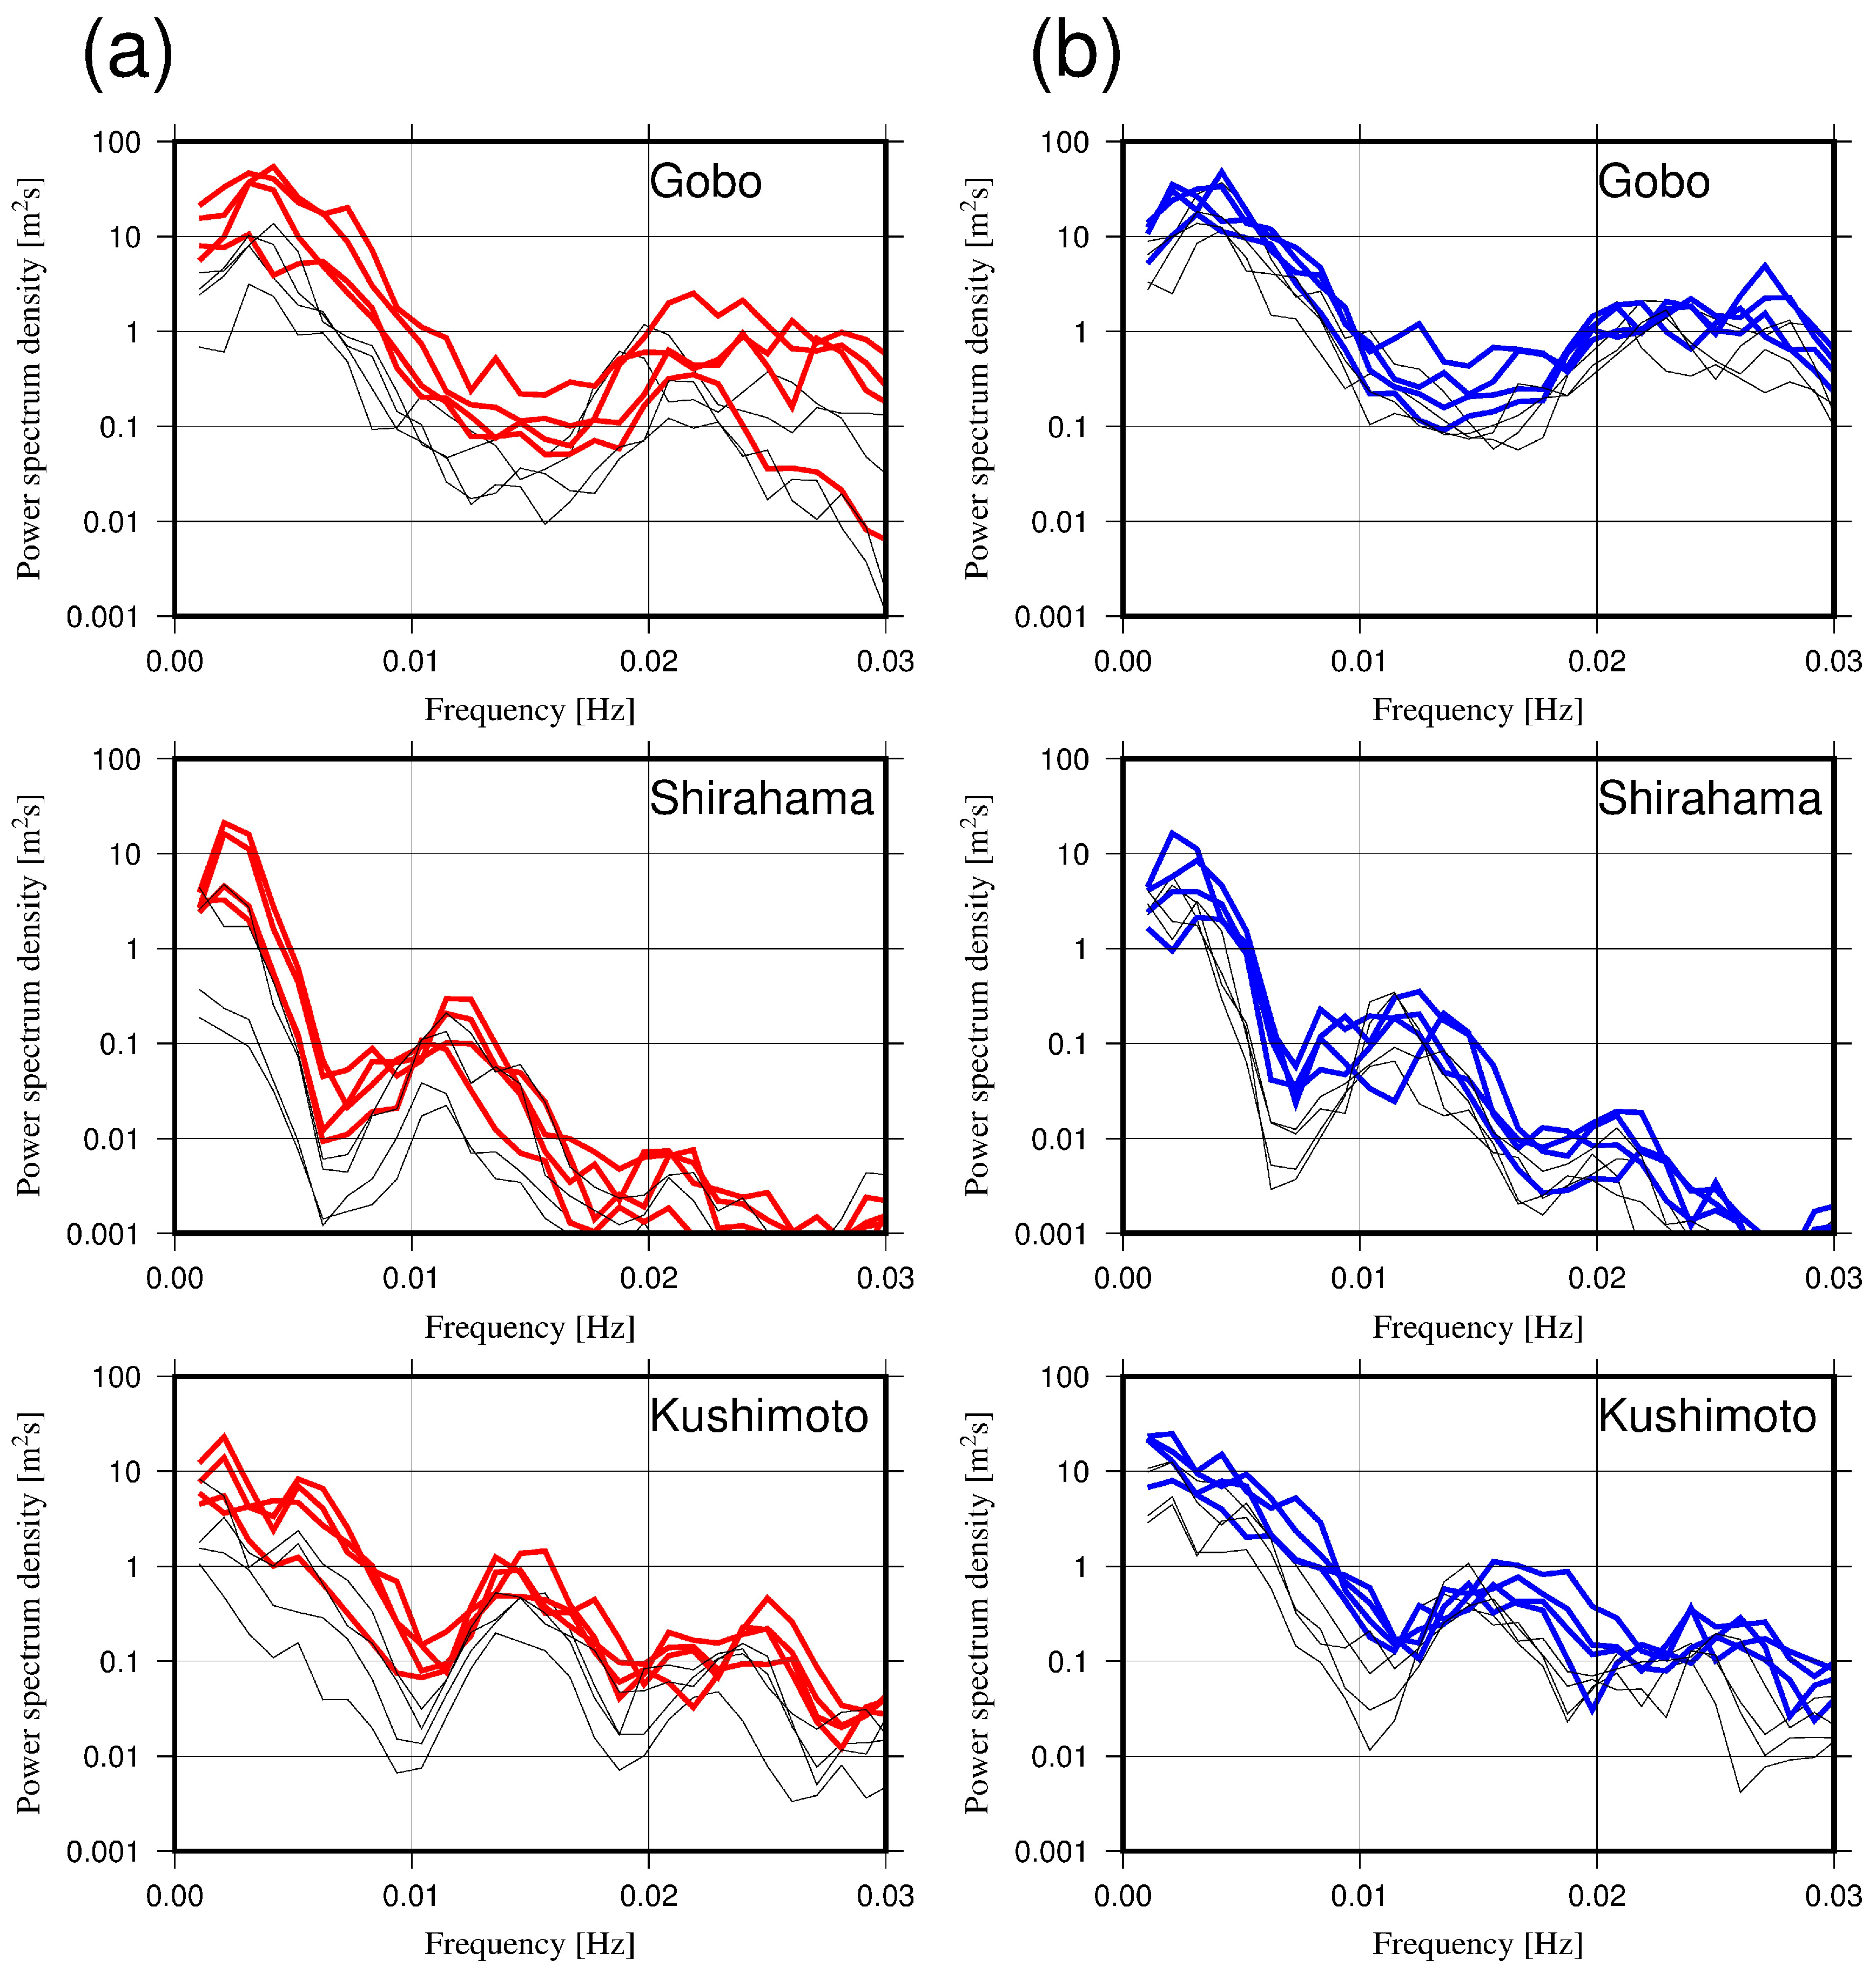
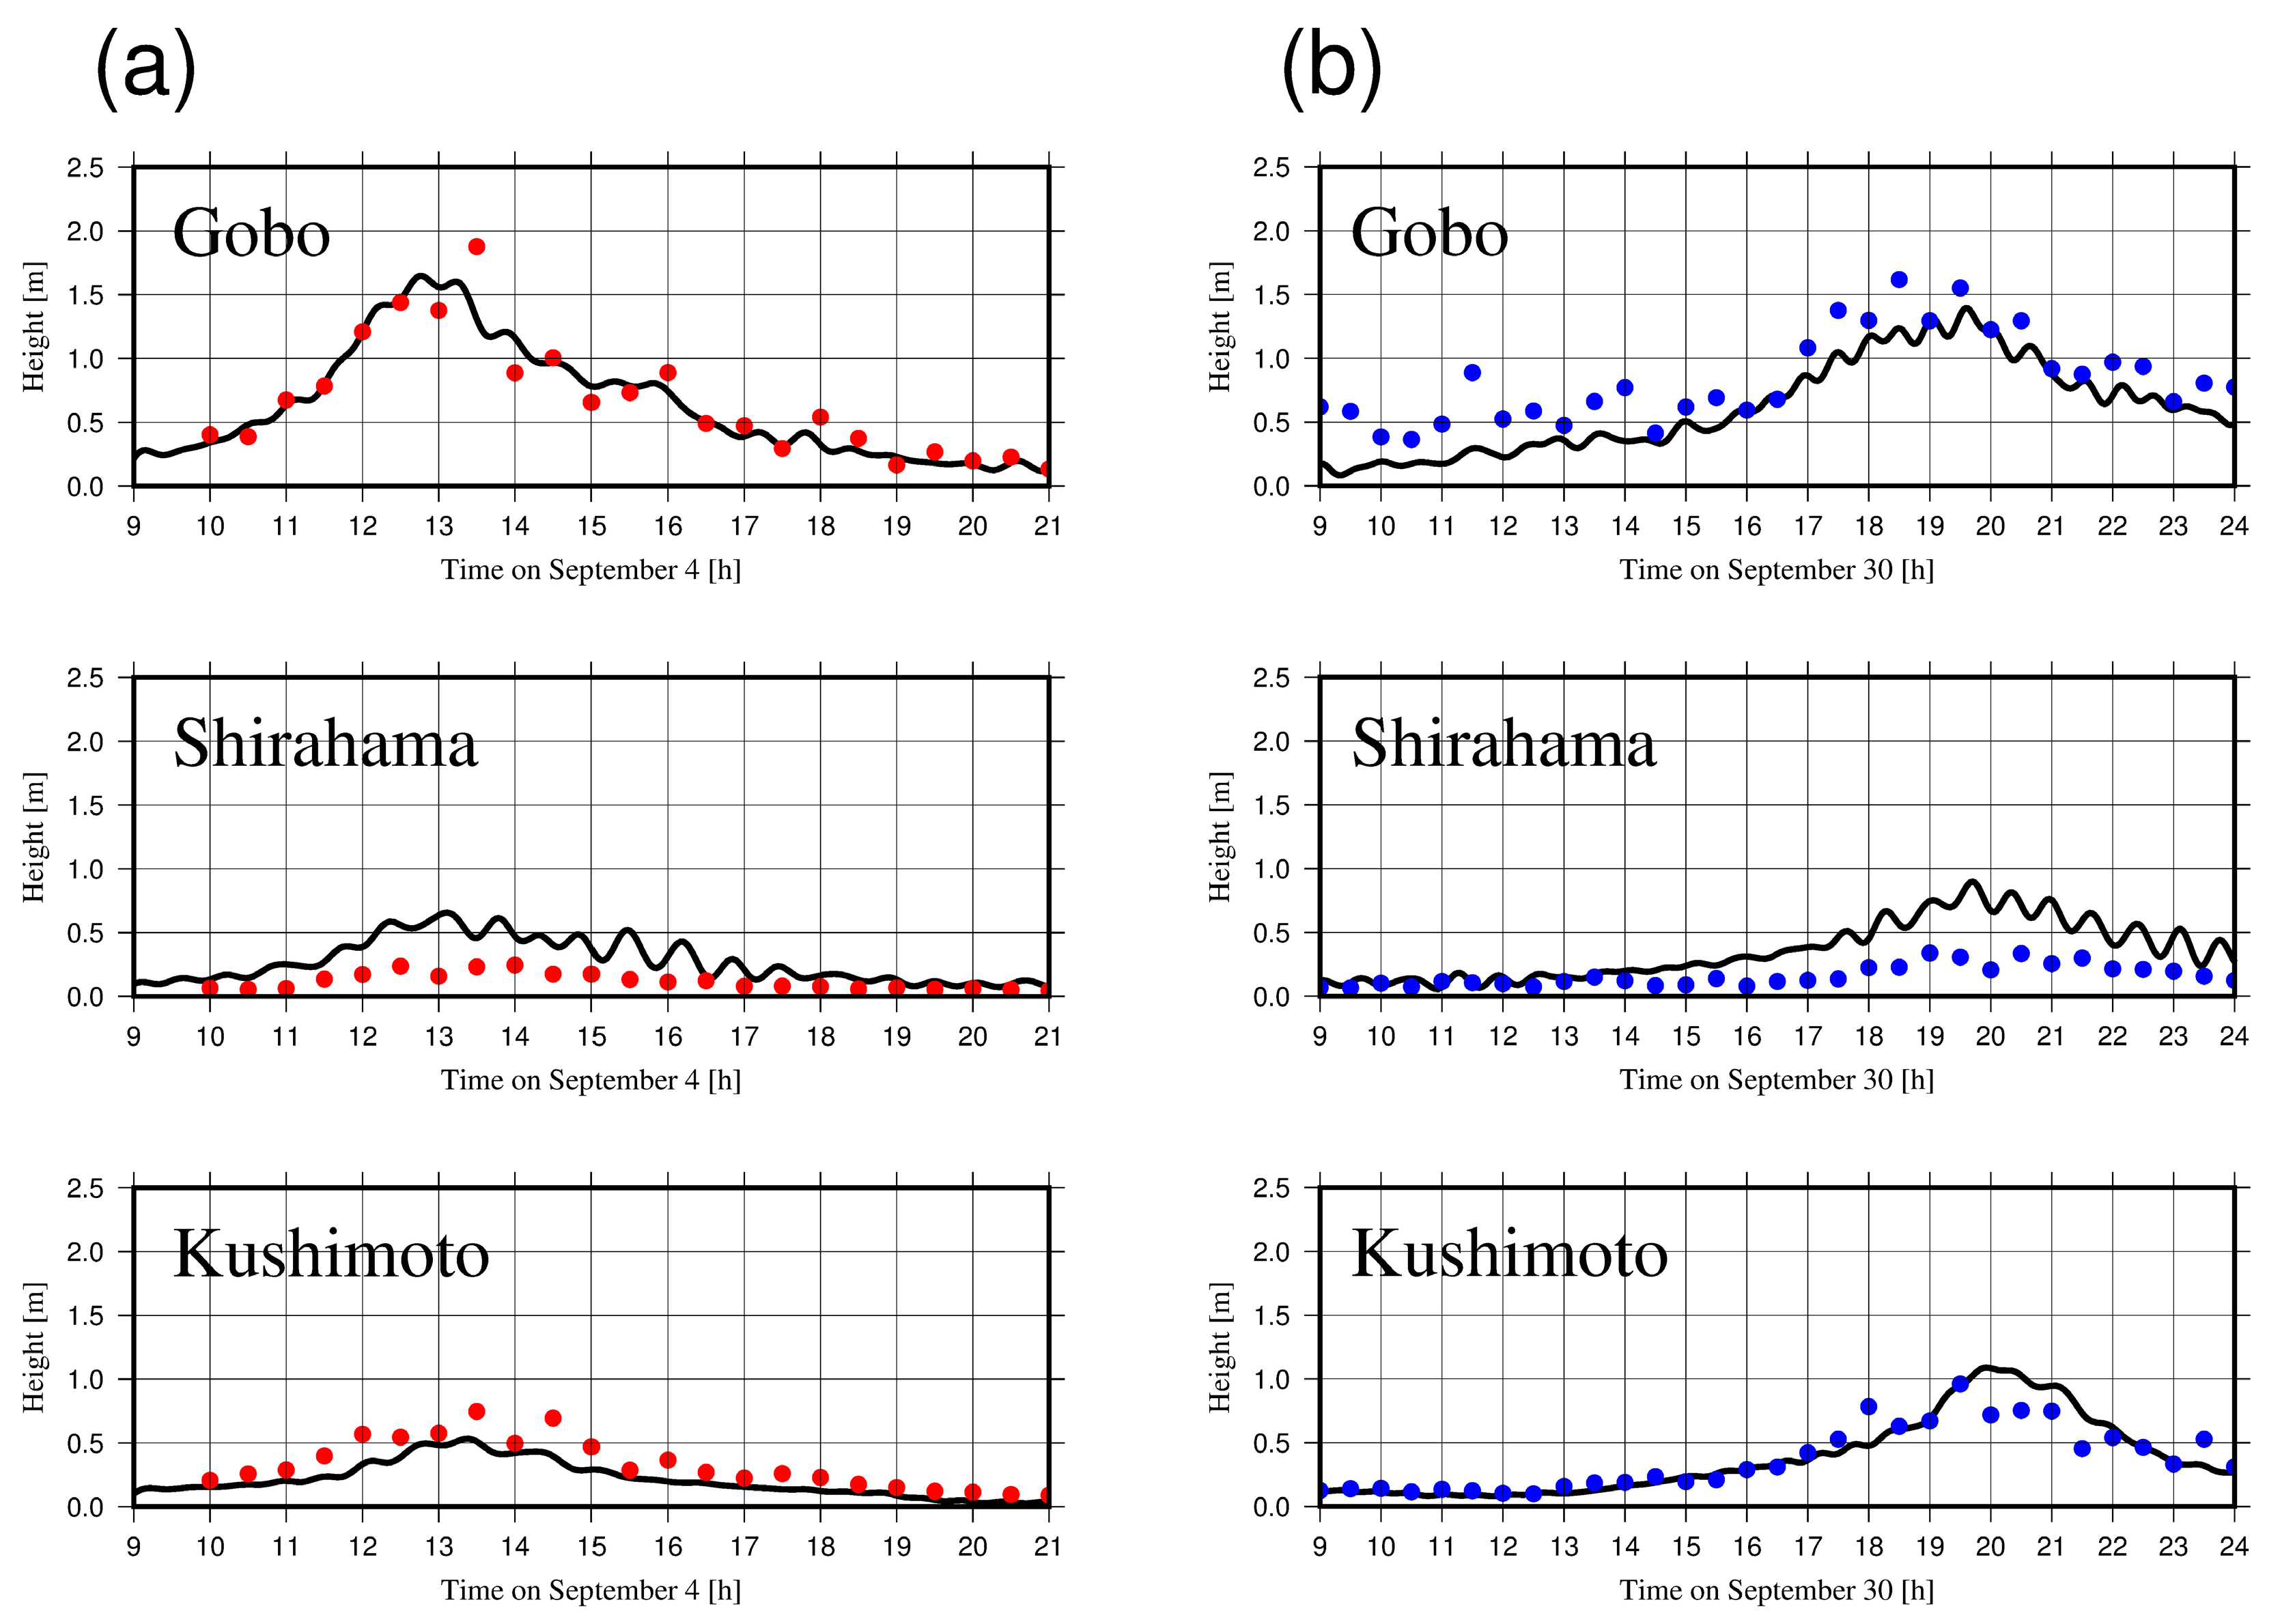
As shown in Figure 6c, d, the tide gauge records obtained at Kushimoto, Shirahama, and Gobo show relatively small surge heights during both typhoons, while significant fluctuations in the lower components, other than the wind-wave component, were influential on the coasts. The Power Spectrum Density of fluctuations in the water level recorded at each Tide Gauge (PSDTG) was then estimated based on the Fourier transform, with a sampling data length of 26 and sampling time step of 15 s (corresponding to 16 min window length), to determine if the lower components of the wave amplitude were significant (Figure 8). Figure 8 indicates that the largest PSDTG peak appears for all components lower than 5.0 × 10⁻³ Hz, independent of the locations and typhoons; its peak component for each site is similar for both typhoons. The figure also shows that all PSDTGs have peaks for components higher than 5.0 × 10⁻³ Hz. For example, the PSDTGs of Gobo, Shirahama, and Kushimoto for Jebi and Trami have peaks around 2.2 × 10⁻², 1.2 × 10⁻², and 1.6 × 10⁻² Hz, respectively. These components are within the range of infragravity wave components (5.0 × 10⁻³–4.0 × 10⁻² Hz); therefore, these could result from the amplification of waves during nearshore propagation involving reflection and wave breaking. However, the peak components are different for the three sites; this result implied that local bathymetry selectively amplified specific infragravity wave components during propagation independent of storm event. Figure 9 shows the estimated wave height corresponding to the spectral components of the infragravity wave ranging from 3.6 × 10⁻³ to 3.3 × 10⁻² Hz; it is compared with low-pass filtered waveforms obtained from observed waveforms of the surge heights, corresponding to those in Figure 6c,d, for visualizing average surge heights over time. As seen in the figure, the peak of the estimated wave height matches with that of the averaged surge height, especially at Gobo, where wave heights during both typhoons reached approximately 2 m. Therefore, these waves may have largely contributed to the transport of debris to the high elevations behind the dike. Additionally, most cases indicate that wave heights were significantly large compared to average surge heights. Consequently, infragravity wave components largely impacted the nearshore water surface fluctuations, especially along the coasts from Kushimoto to Gobo.

5. Image Analysis of Video Footage Recorded at the Coast

The field survey results, numerical analysis of offshore waves and storm surges, and evaluation of tide gauge records clearly indicated that the observed locally-concentrated inundation and wave run-up characteristics were significantly dependent on the complex nearshore hydrodynamics affected by the local nearshore geometry. Similar, locally varying coastal hazards also have been found in other events, and the behavior of infragravity waves could be an important factor in such locally concentrated coastal hazards [24,25]. However, lack of in-situ data from such severe events makes it difficult to understand the detailed features of such complex nearshore hydrodynamics. In recent disasters, several video footages were recorded by local residents, and analysis of these footages could be extremely valuable for enhanced understanding of such complex nearshore hydrodynamic characteristics [26,27]. Because Typhoon Jebi passed near Wakayama in the daytime, several pictures and video footages were recorded by local residents [13,18]. Among the collected video footages, this study focused on two videos that clearly captured the behavior of nearshore waves at different sites (Figure 10) and image analyses were conducted to extract quantitative characteristics of the captured nearshore hydrodynamics.

5.1. Video Footage Recorded at Kushimoto Town

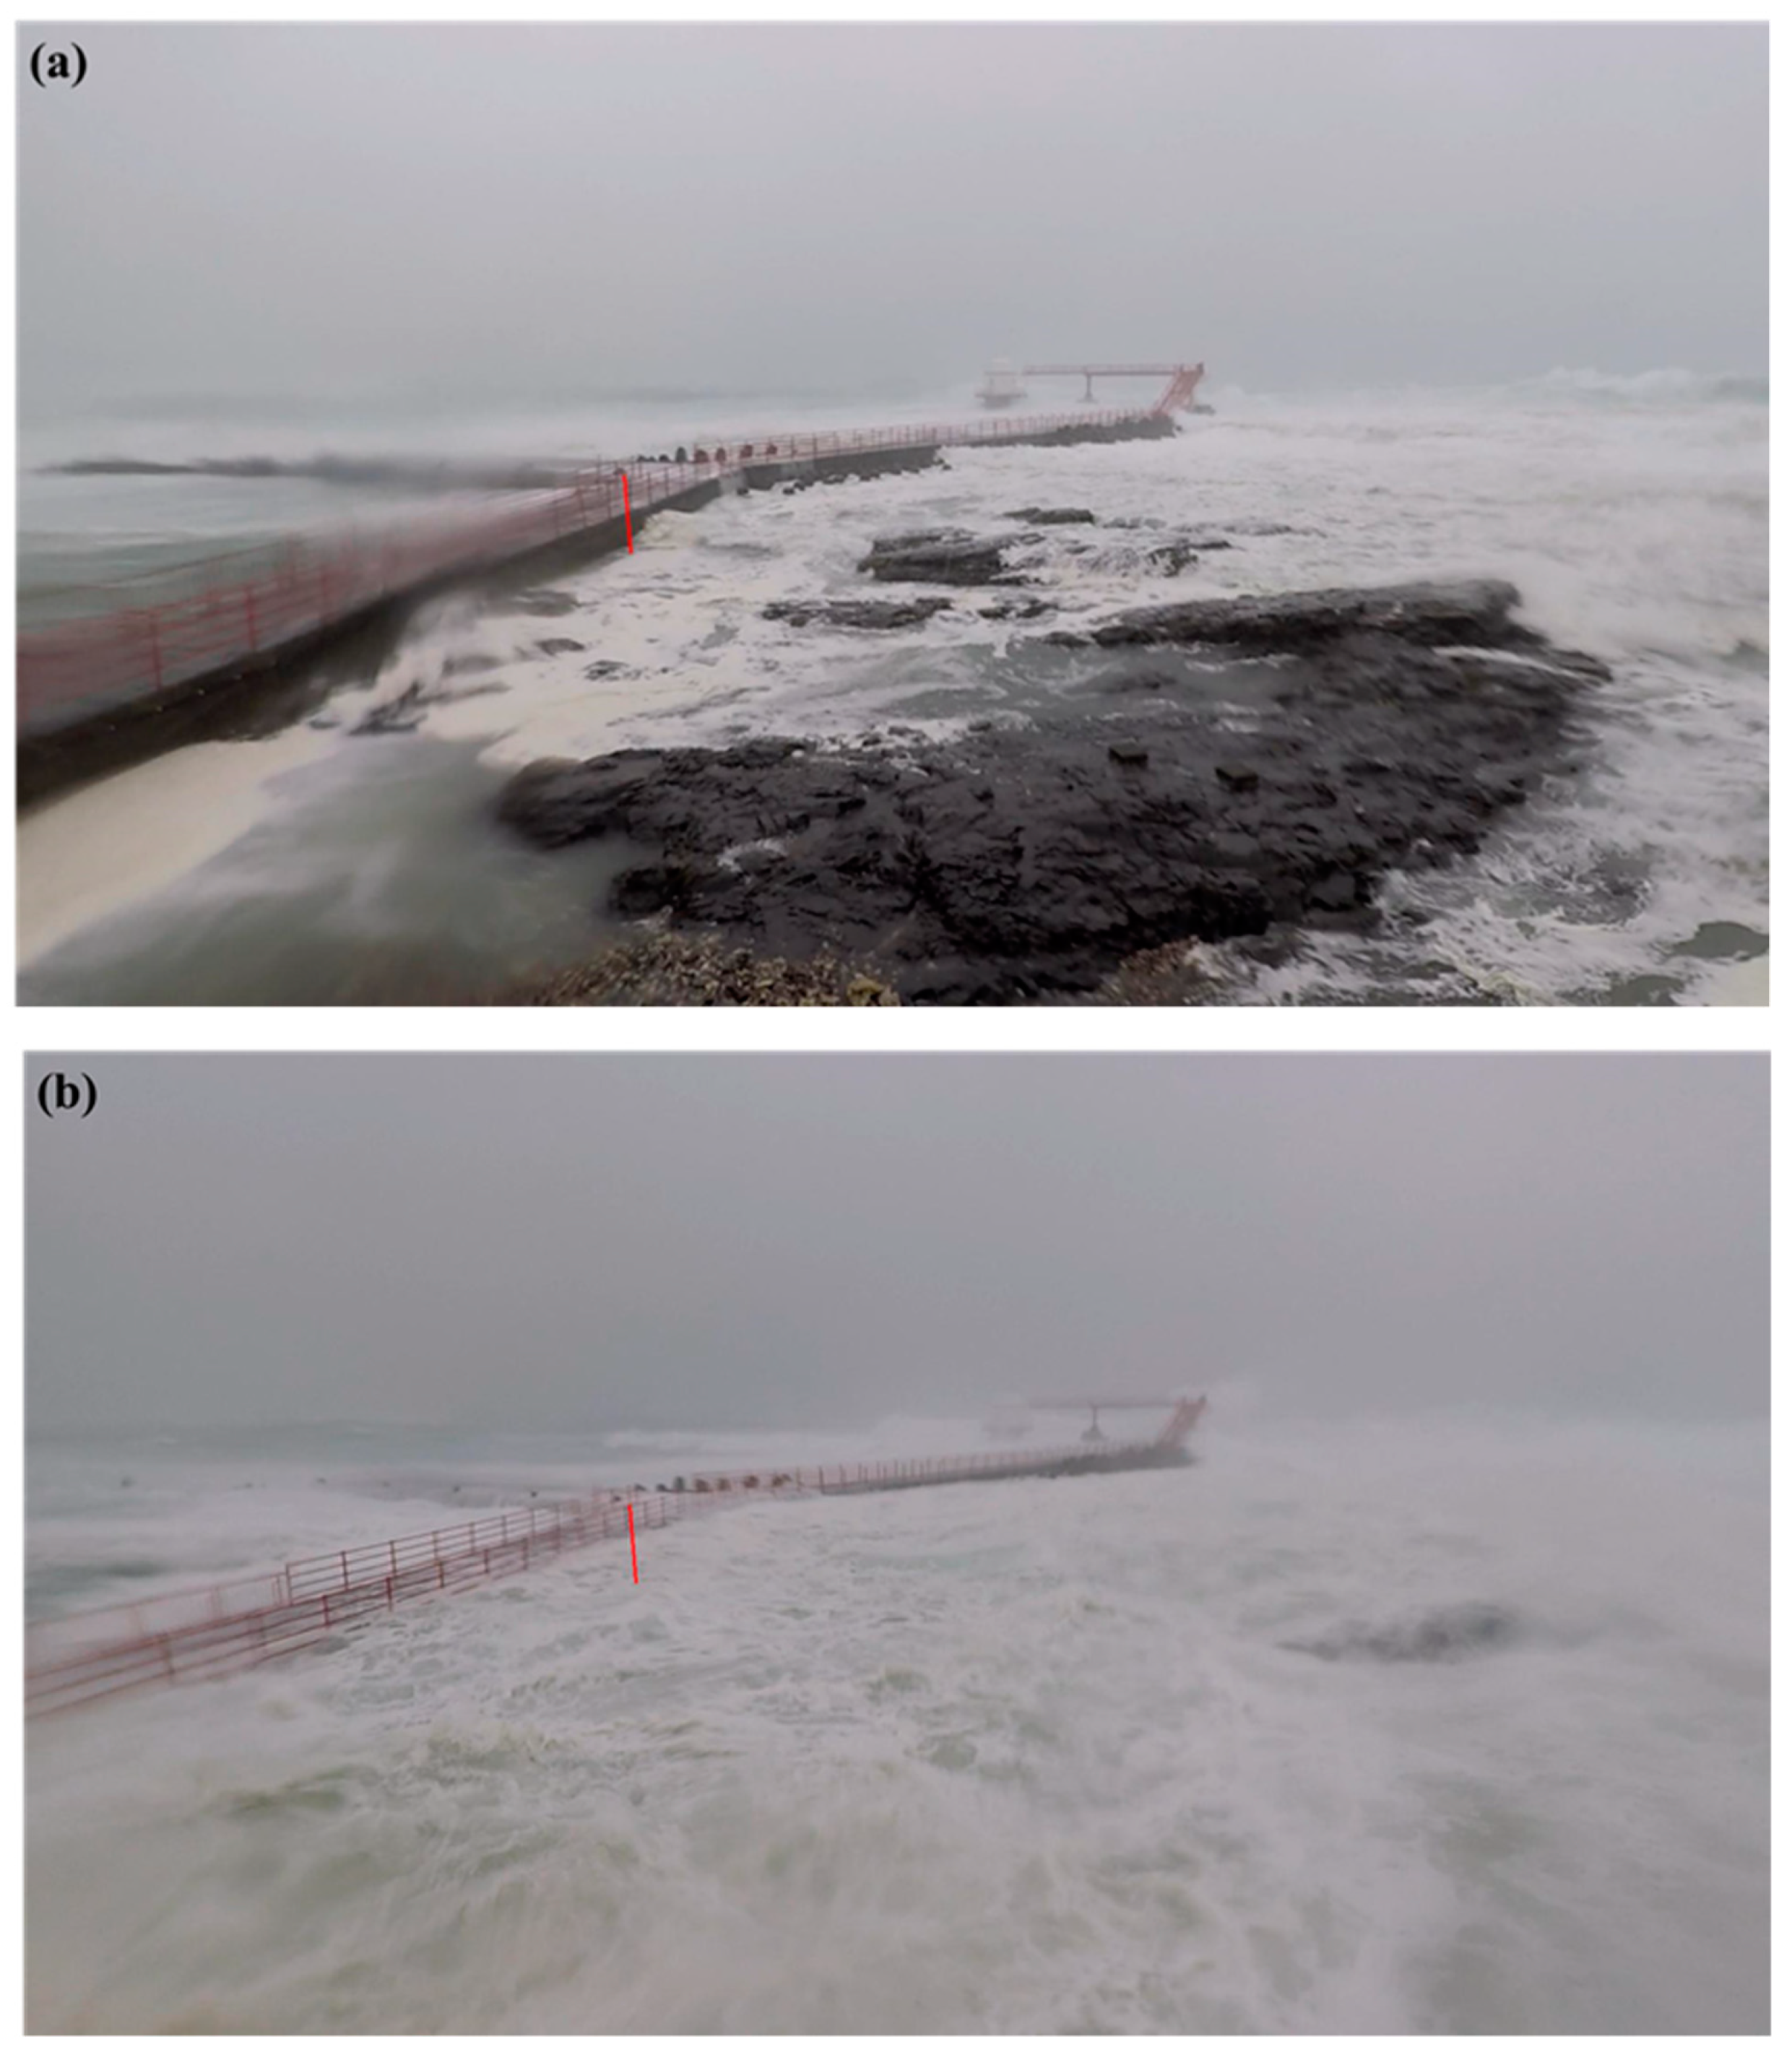
The first video was recorded on the coast in front of Kushimoto Marine Park in Kushimoto (33°28′51″N, 135°44′42″E) from approximately 11:00 to 12:00 on 4 September (Figure 10a). The video camera was fixed outside the building. Violent winds slightly vibrated the fixed camera, and drops of rain and waves on the camera affected the quality of some recordings. We carefully investigated the video quality and selected a 12-min continuous footage at approximately 11:40 when the influences were not significant. Figure 11a,b shows still images of the water surface and pier with the steel poles. Because the vertically-installed poles were nearly parallel to the column of the image pixels, line images along the column at a pole location were extracted from succeeding still images of the video, and the extracted line images were horizontally placed in the order of the recorded time to create a time stack image of the fluctuating water surface levels (Figure 12a). Figure 11a,b indicates blackish and whitish colors of the pier and water surface in the recorded images; thus, water surface elevation along the sidewall of the pier and pole can be easily detected as the boundary between the blackish and whitish pixels (Figure 12a). Time, t, refers to the elapsed time from the first image of the selected video; the height and elevation in the time stack image were based on the pole’s height and elevation.
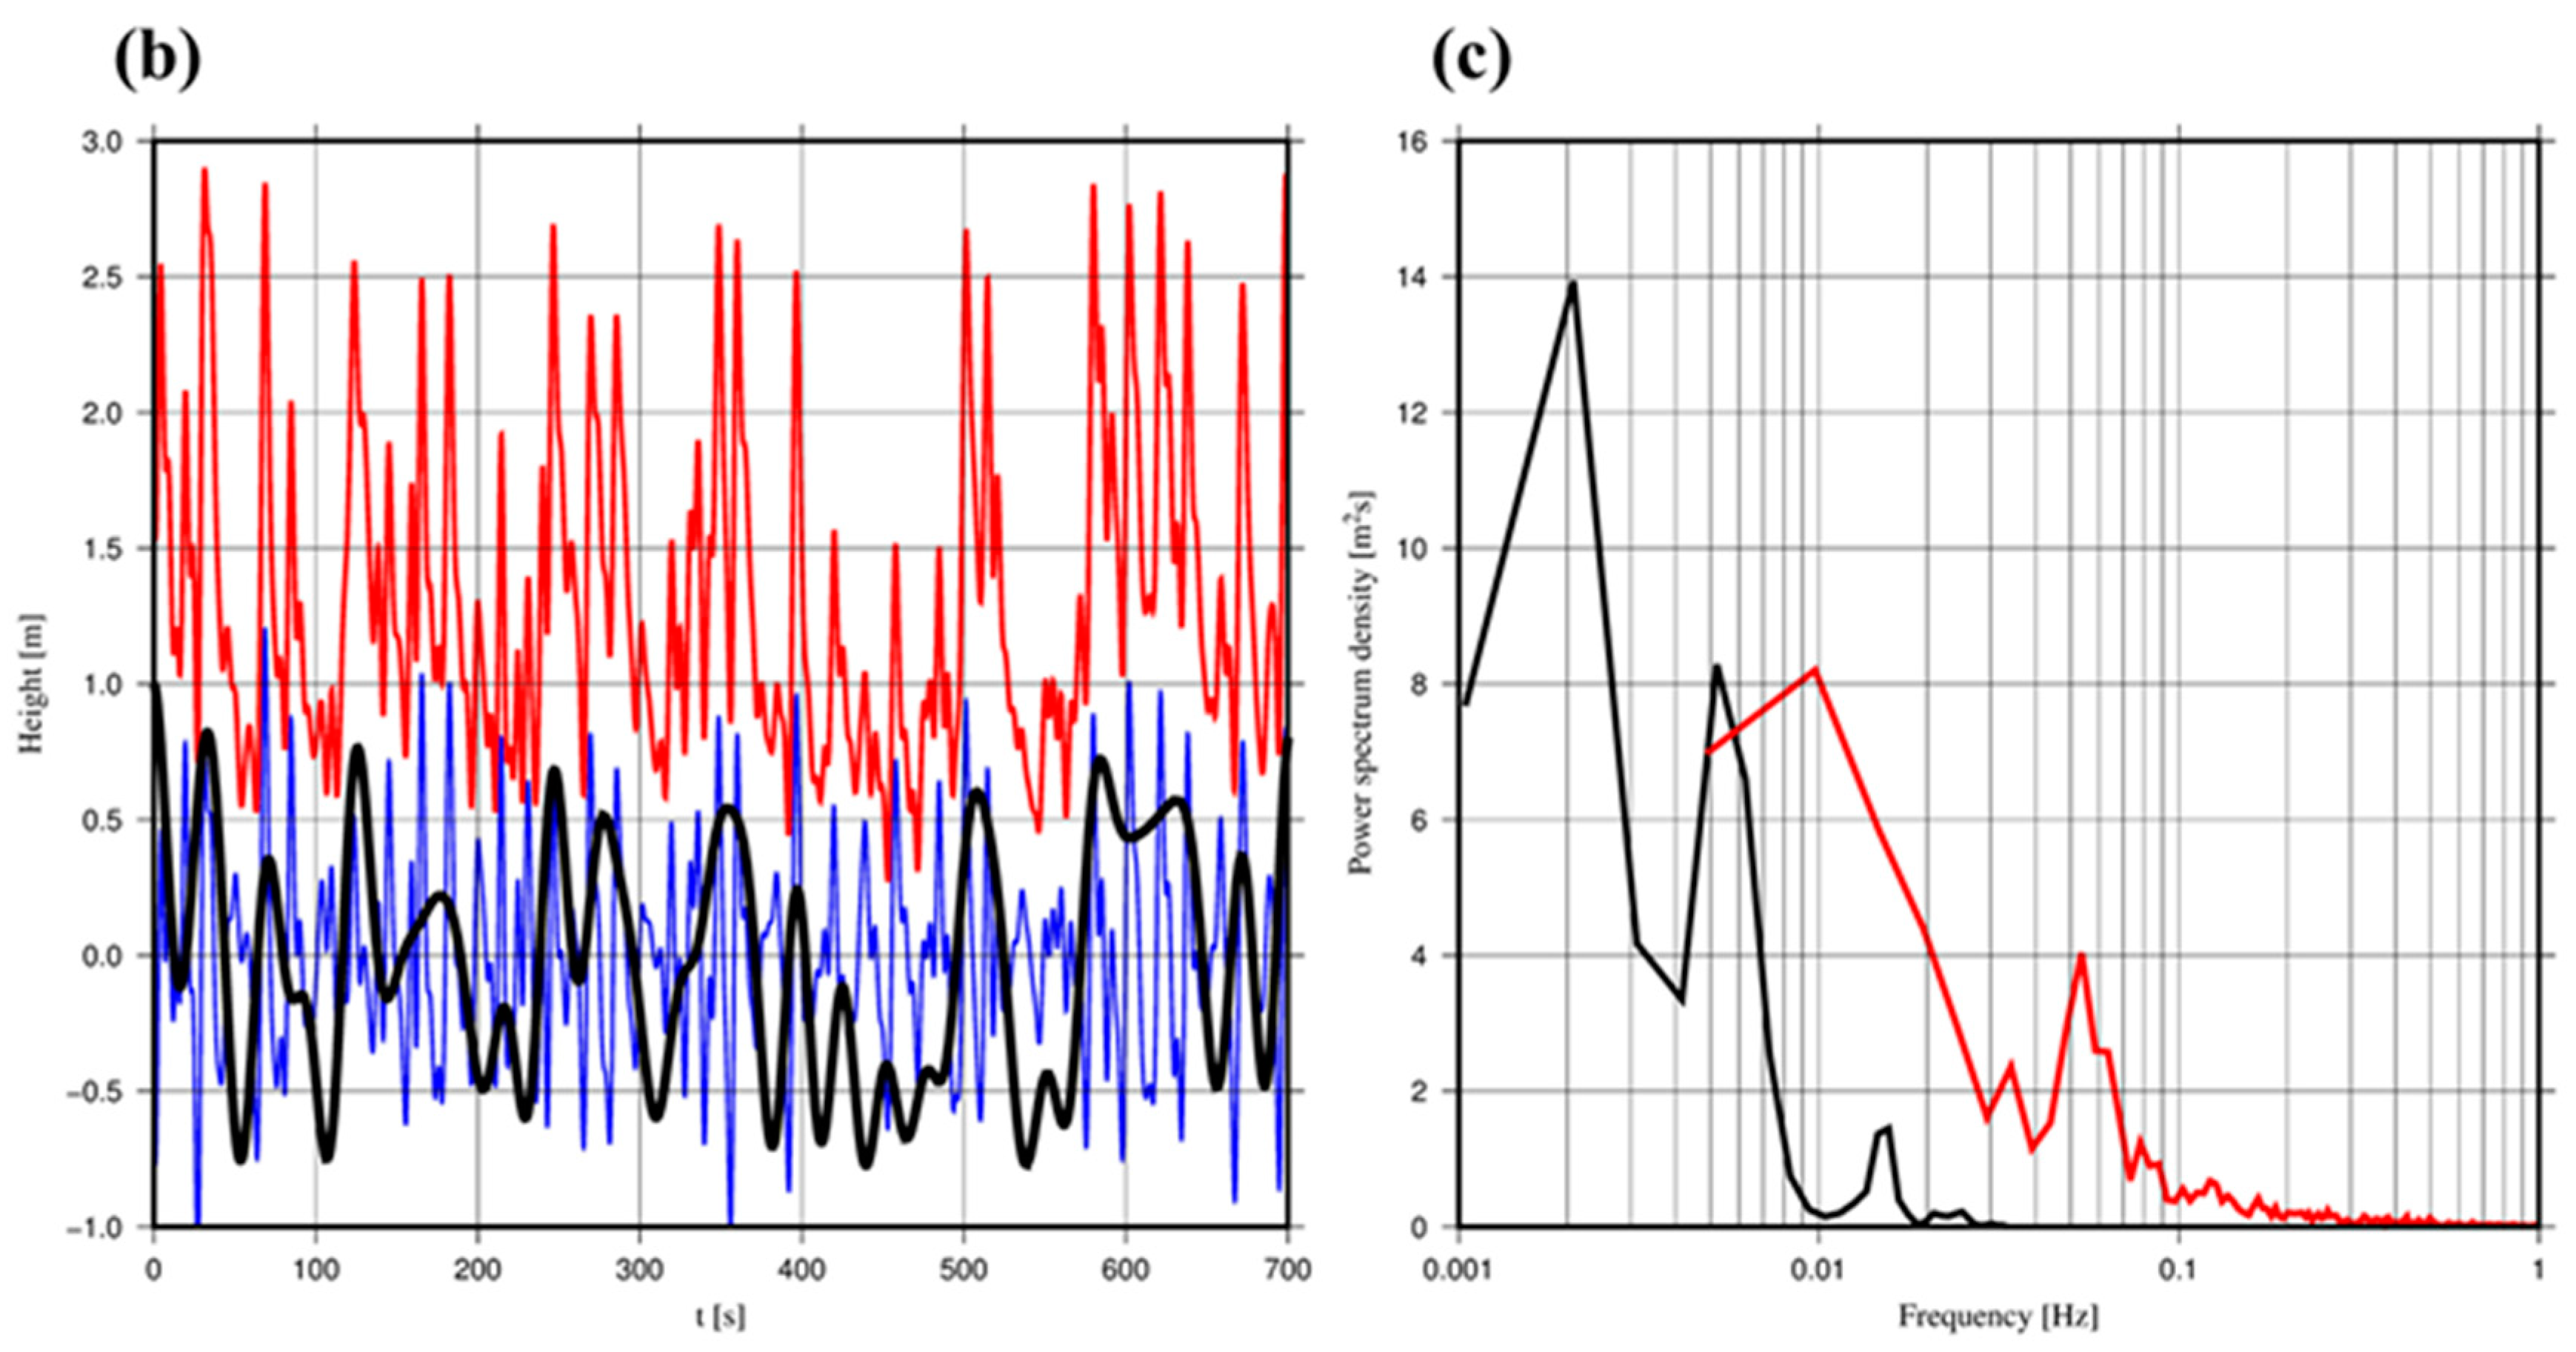
Figure 12b indicates the extracted water level fluctuations from the time stack image (Figure 12a) and its frequency components from 4.0 × 10⁻² to 5.0 × 10⁻¹ Hz and lower than 4.0 × 10⁻² Hz, respectively, based on spectral analysis. Each component respectively represents the wind wave and infragravity wave components. Figure 12c compares the Power Spectrum Density of water surface fluctuations extracted from the Video Footage (PSDVF) and PSDTG of Kushimoto, located 3 km east of the park, from 12:00 to 13:00, as displayed in Figure 8. A Fourier transform for estimating the PSDVF was conducted with a sampling data length of 211 and sampling time step of 0.1 s. First, as shown in Figure 12b, the amplitude of the low-frequency components (i.e., infragravity wave components) was approximately 1 m; this amplitude was as high as that of the wind-wave components and thus had a significant impact on inundation or wave run-up along the coast of Kushimoto. Furthermore, as shown in Figure 12c, three peaks appear at 2.1 × 10⁻³, 5.0 × 10⁻³, and 1.4 × 10⁻² Hz in PSDTG. Endoh et al. [29] investigated a resonant oscillation excited in Kushimoto Bay and determined the predominant component (i.e., the first mode bay-scale resonance period) to be 7.75 × 10⁻⁴ Hz. Endoh et al. [29] also showed that the frequency components ranging from 1.0 × 10⁻³ to 2.0 × 10⁻³ Hz, corresponding to the peak at 2.1 × 10⁻³ observed in PSDTG, were amplified. The other peak frequencies of PSDTG (5.0 × 10⁻³ and 1.4 × 10⁻² Hz) were higher than the first peak component and this may be due to the resonance of infragravity waves in local bathymetry. On the other hand, PSDVF showed two peaks at 1.0 × 10⁻² and 5.0 × 10⁻²–6.0 × 10⁻² Hz (Figure 12c). The latter frequency was equivalent to the significant wave period of 14–15 s simulated by WW3 and thus should represent wind wave components. The former frequency was similar to the frequency of one of the PSDTG peaks, at 1.4 × 10⁻² Hz. However, PSDTG at 1.4 × 10⁻² Hz was much smaller than the one for PSDVF at 1.0 × 10⁻² Hz. Tide gauge data were recorded with time intervals of 15 s, and the high-frequency components of water-level fluctuations were physically dissipated by a conduit connecting the tide gauge and open sea. Namegaya et al. [30] also indicated that tide gauge data tend to underestimate water-level fluctuations for relatively shorter frequency components, including tsunami waves. Considering the estimated results into account, the infragravity wave components, at approximately 1.4 × 10⁻² and 5.0 × 10⁻³ Hz, were enhanced by local geometry of Kushimoto and might dominate nearshore wave dynamics there.

5.2. Video Footage Recorded at Yura Town

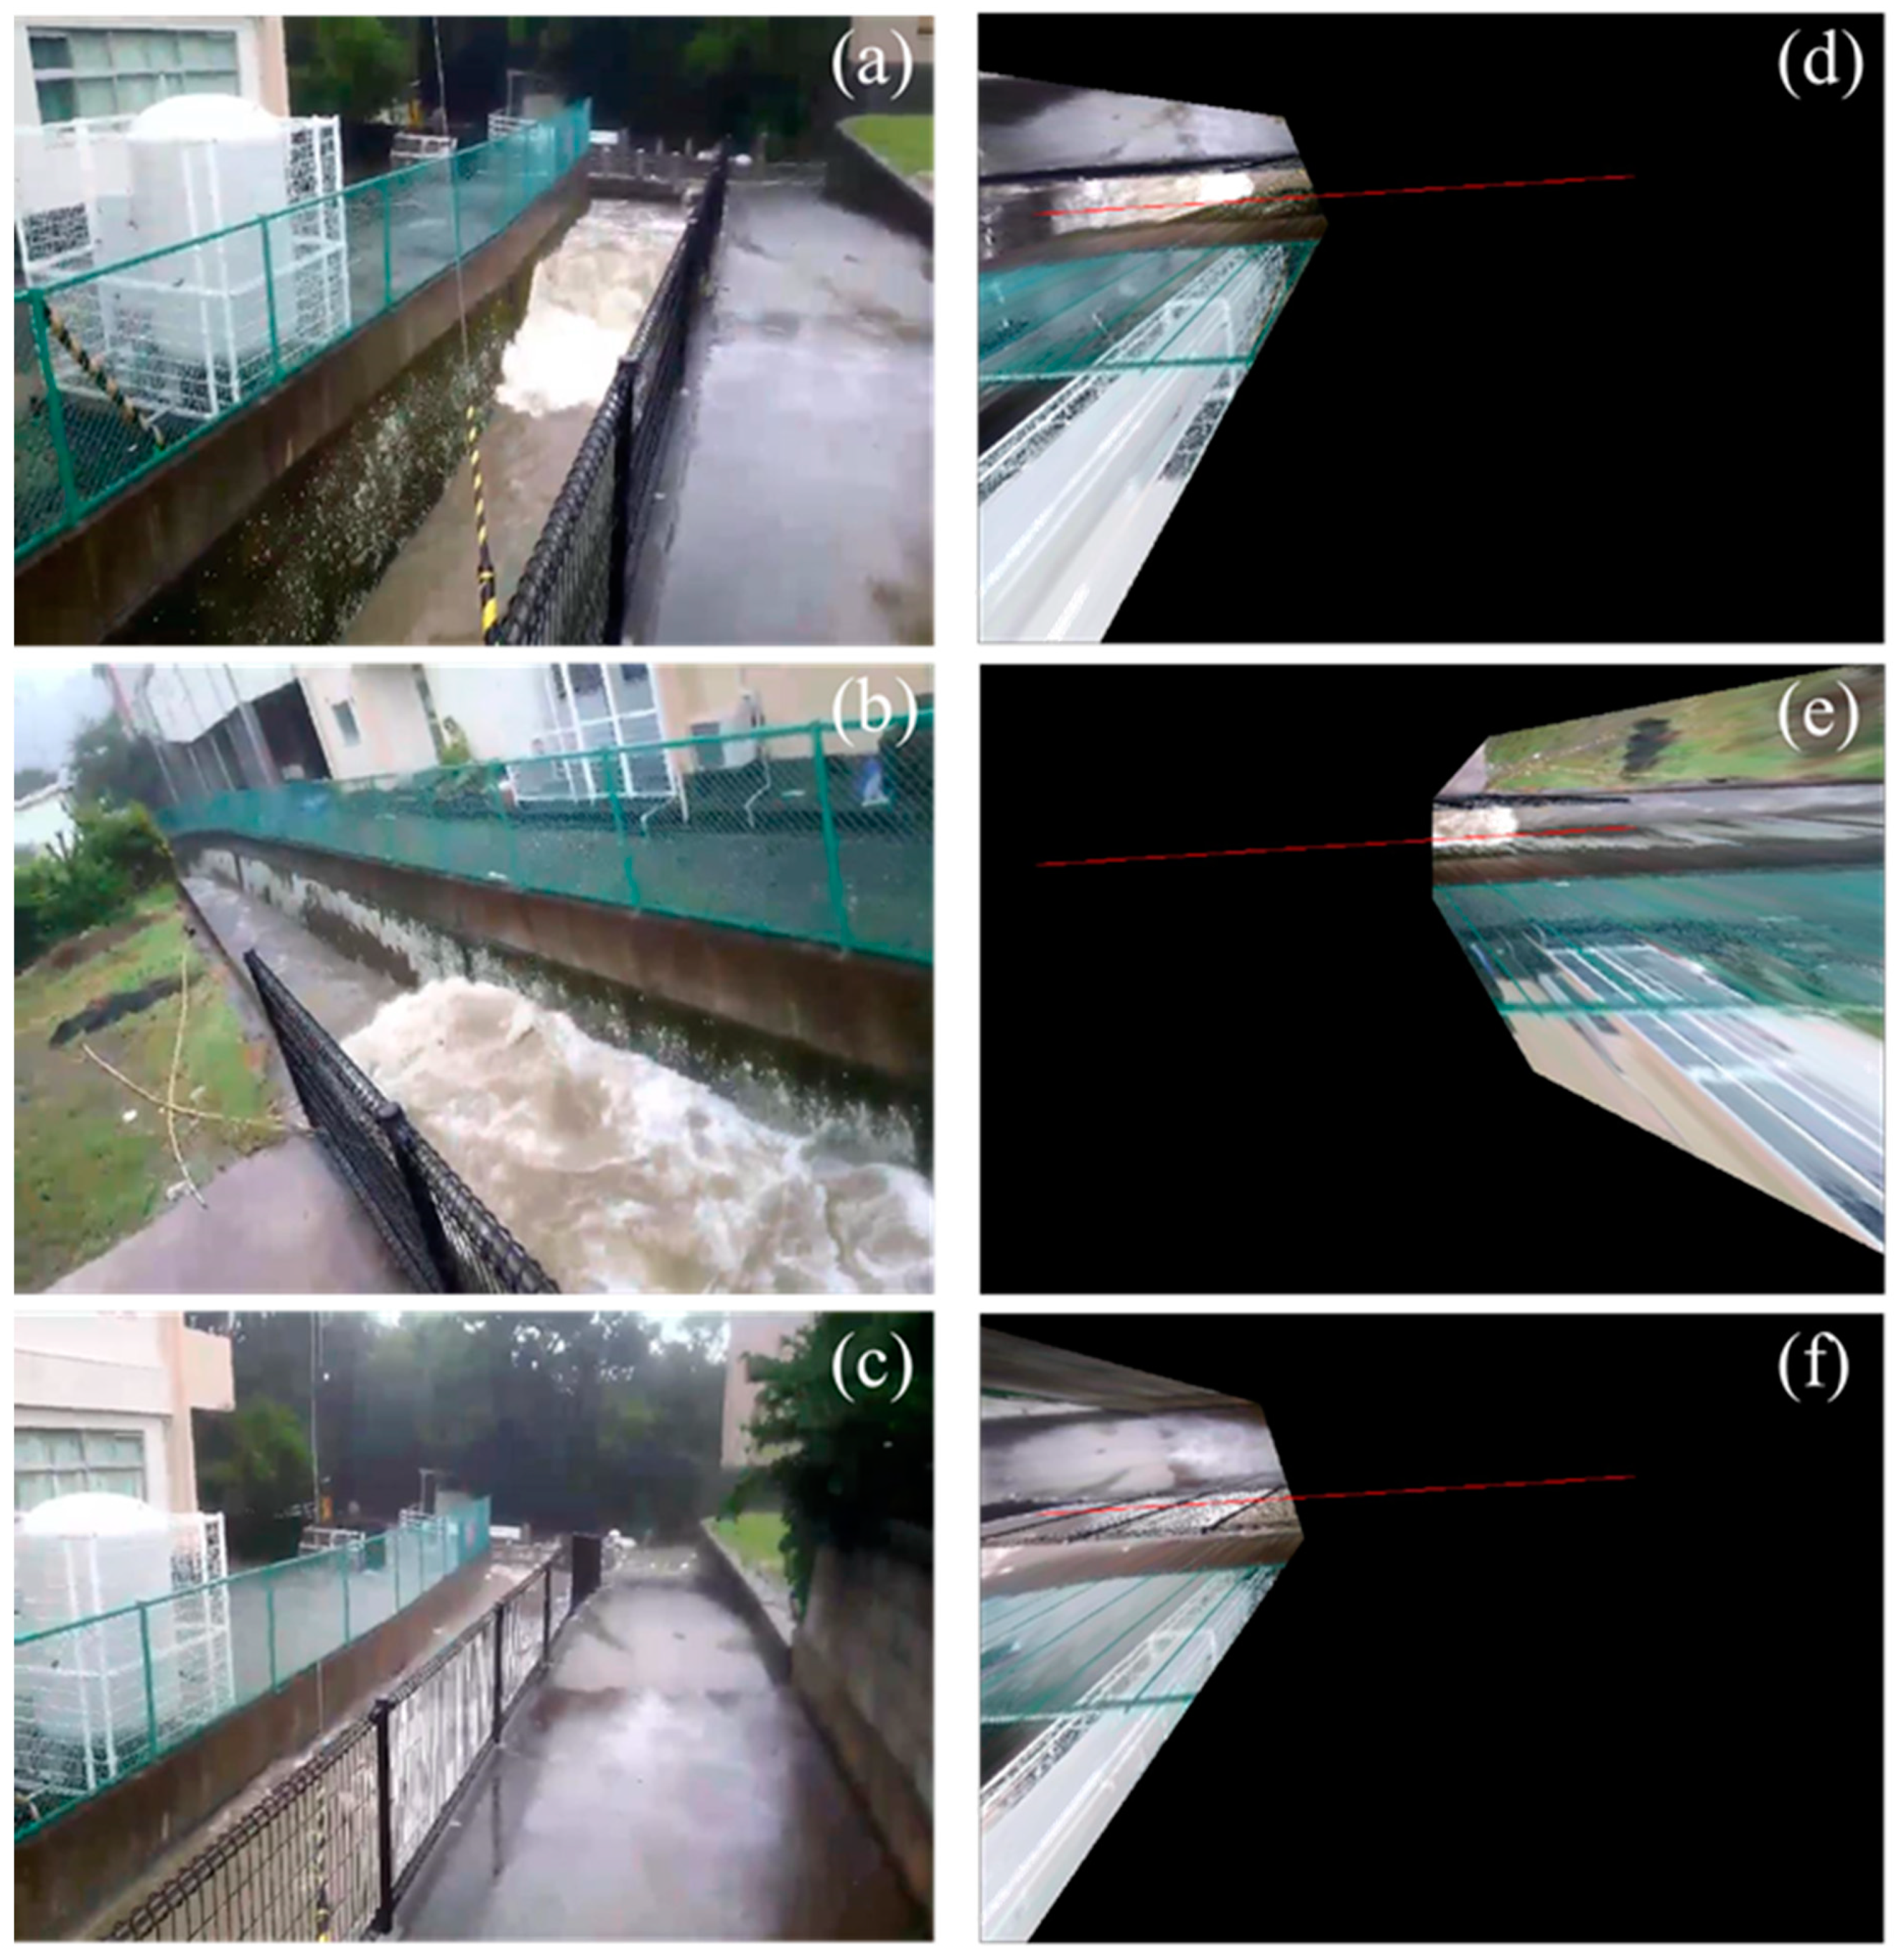
The second image-based analysis was conducted for the video footage recorded at a site behind the coast in the Obiki area, Yura (33°58′04″N, 135°05′14″E), at approximately 13:00 on 4 September (Figure 10b). The 30 s video footage captured a bore-like wave that continuously propagated in the upward direction along the 3 m wide rectangular open channel, connected to the open sea (Figure 10a and Figure 13a–c). Time, t, refers to the elapsed time from the video’s first images. Based on the video footage and survey results, the maximum height of this bore wave was estimated to be approximately 1.8 m. To quantitatively estimate the wave characteristics, the video was analyzed using the rectification technique proposed by Holland et al. [31]. However, a preprocessing step was necessary to analyze the video footage, because the method described by Holland et al. [31] requires fixed ground control points, while the video had unfixed image frames. Therefore, we applied a template-matching technique based on the zero-mean normalized cross-correlation (ZNCC) to RGB brightness in each image to track the control points in the moving frames [32,33]. A small confined area, comprising the number of vertical and horizontal pixels, M and N, respectively, was first determined in a still image (the first image) from the video footage as a template, and a ground control point was reflected in the template. An area with the same dimensions, where RGB distribution was the most similar to the template’s RGB, in the next image, i.e., an image recorded at a certain sec after the first image (the second image), was specified based on ZNCC, and then, the location of the control point in the second image was also specified. Next, the distribution of RGB brightness in the template was replaced with the distribution of that in the specified area in the second image; the template locations of a still image after the second image (the third image) were determined based on ZNCC and the replaced RGB brightness. Therefore, the control points in the moving frames could be tracked by repeating this process until the end of the video. The geometric parameters for all frames were then estimated based on the estimated control points.
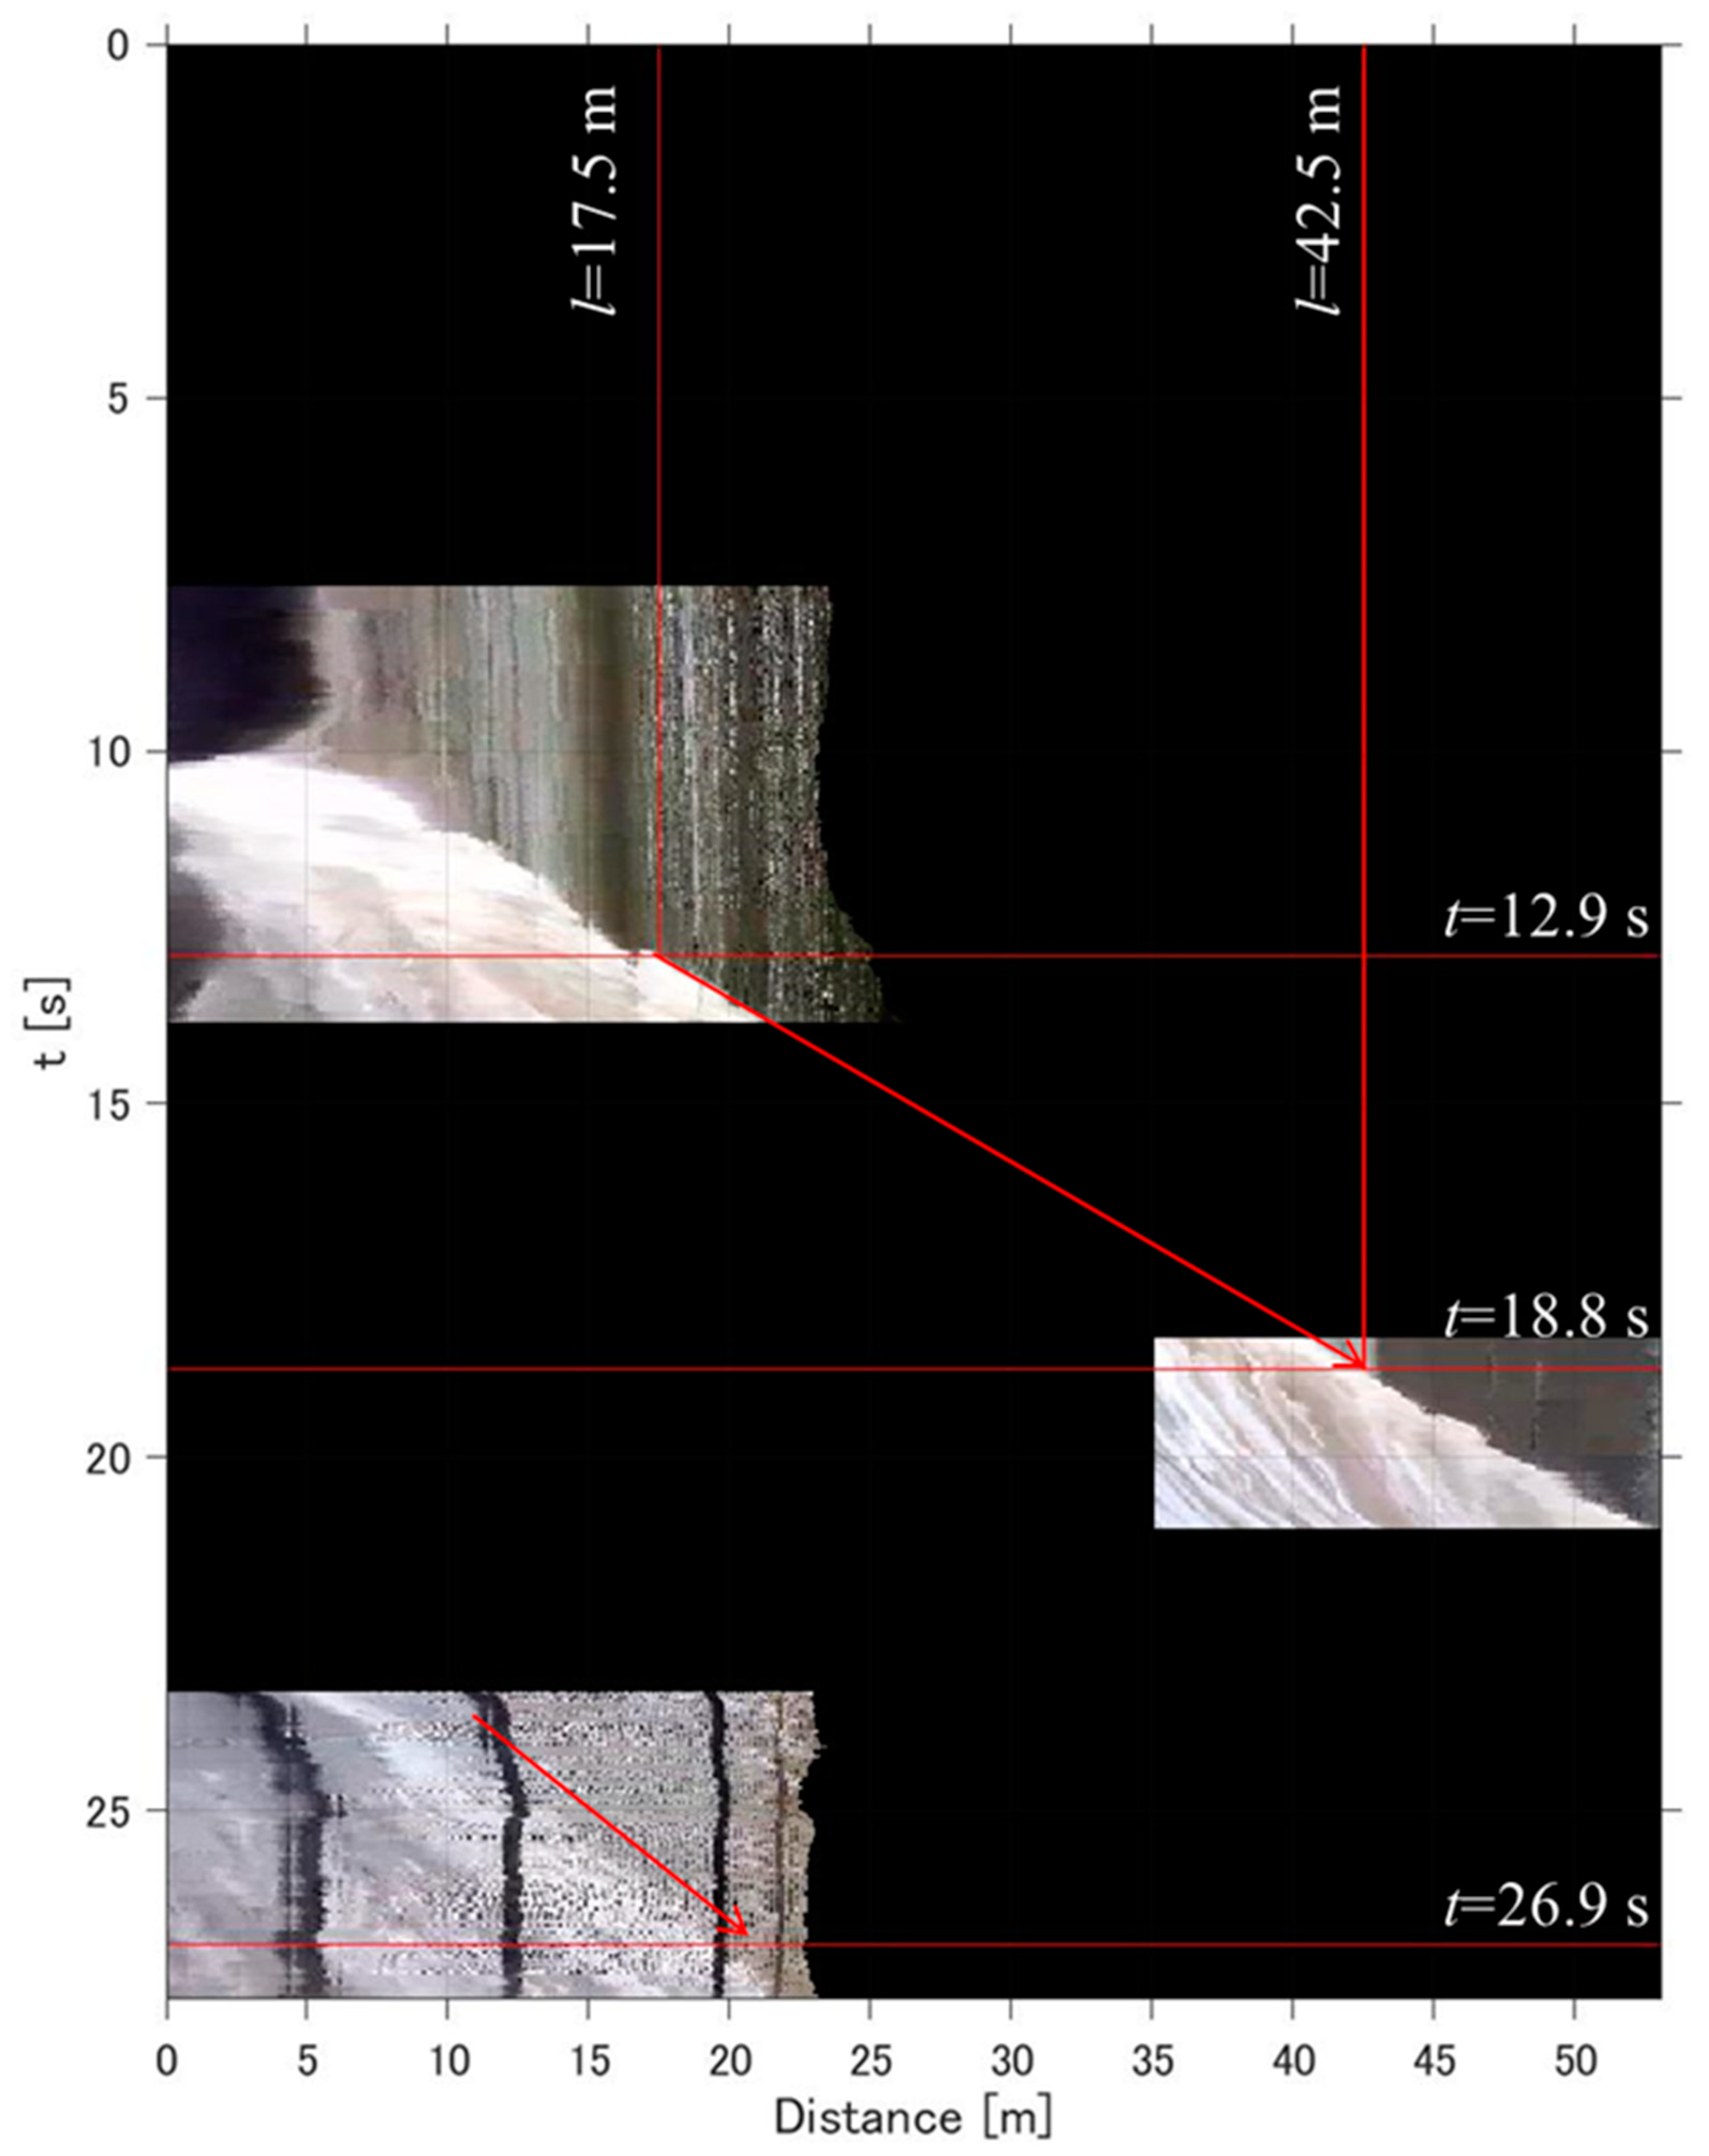
Figure 13d–f shows top-view images for Figure 13a–c, respectively, obtained by converting the pixel coordinates into Cartesian XY coordinates using the estimated geometric parameters. As seen in Figure 13, the camera changed to completely different angles very quickly to capture the wave front and wave flows; such situations make tracking same control points difficult. Therefore, the video was divided into three sections with similar camera angles, and different control points were tracked in each section (Figure 13a–c). Figure 13 shows that the front face of the bore-like wave in the channel appears white owing to turbulence. Therefore, all the image frames were, rectified into top-view images and a control line, indicated by the red lines in Figure 13d–f, was determined; RGB brightness on the line was extracted to visualize the bore-wave propagation in time and space, as a time stack image (Figure 14). In Figure 14, the horizontal axis indicates the distance along the channel, l, positive in the landward direction, and the vertical axis indicates time, positive in the downward direction. Therefore, the right-downward line of the bore front demonstrates that the bore-like wave propagated landward along the channel, and the propagating speed of this wave was approximately 4.2 m/s. Furthermore, with l = 0–20 m and t= 24–27 s, the water surface was still moving landward. Based on this figure, the bore-like wave continuously progressed landward for more than 15 s. As seen in Figure 10b, the channel curved, and the along-channel distance from the sea to the video-recording site was more than 150 m. The observed 1.8 m-high bore-like wave propagating more than 150 m along the open channel also indicates that significantly high infragravity wave components were generated around the coast of Yura.

6. Discussion and Conclusions

We investigated damages along the coast of Wakayama, induced by storm surges and storm-induced waves during Typhoons Jebi and Trami, and estimated how waves appeared near the shore and caused damage. Damage, such as inundation and destruction of structures, during these typhoons was widely observed along the coast. Relatively higher elevations for watermarks and debris were found after both Jebi and Trami, especially at Shirahama, Inami, and Mihama. As indicated by simulation results showing gradual alongshore variation in wave heights and surges during these typhoons, large waves should have affected these coasts without significant dissipation. According to Mori et al. [13], dissipating waves affected the coast of Mera, facing the northwest and protected by small islands, and the waves were; therefore, expected to cause insignificant damage, while severe inundation occurred in the area with Jebi and Trami. As mentioned in Section 4, waves with components lower than 5.0 × 10⁻³ Hz had the largest amplitude. A resonant oscillation in Shimohaya Bay, where the Mera area is located, with a period of 5 min or less (higher than 3.3 × 10⁻³ Hz) could be enhanced in a storm-induced wave condition [34]. Therefore, the bay-scale resonance, which developed under storm conditions, also may have been responsible for inundation. Furthermore, large infragravity waves, which developed through coastal resonance, were observed on the coasts of Kushimoto, Shirahama, Gobo, and Yura during Typhoons Jebi and Trami, by tide gauges and in video footages. As mentioned in Section 2, the long-wave component, which might correspond to the infragravity wave component, was also qualitatively observed in the video footage recorded in Inami during Typhoon Jebi. Infragravity waves are one of the essential factors in compounding coastal damage. These waves cause significant impacts near the shore [35] and could dominate run-up heights in a swash zone [36]. Video footage recorded during Typhoon Haiyan, for example, showed an infragravity wave that developed on a coral reef, severely damaging the coast in Philippines [26]; these infragravity waves were one of the major factors influencing the coastal hydrodynamics as well as coastal damage [37,38]. These waves may have been largely responsible for coastal damages and elevations of the watermarks observed in Wakayama during these typhoons. Therefore, considering the influence of these waves is necessary for future disaster mitigation planning.

Author Contributions

Formal analysis, Y.Y., Y.M. and N.H.; investigation, Y.Y., Y.M., Y.T., R.S., L.W. and N.O.; writing—original draft, Y.Y.; writing—review and editing, Y.T.

Funding

Part of this study was supported by the JSPS KAKENHI Grant Number JP18J21135 and was conducted as a research activity of “Enhancement of National Resilience against Natural Disasters”, a cross-ministerial Strategic Innovation Promotion Program (SIP), under the supervision of the NIED. The program was supported by the Council for Science, Technology, and Innovation (CSTI).

Acknowledgments

We thank the editor and two anonymous reviewers for providing helpful comments to improve our manuscript. We appreciate the residents, Susami Tourism Association, and Kushimoto Marine Park Ltd. who provided us with photographs and videos taken during/after the typhoons, and other important information. The GSM-GPV data were originally provided by the JMA. To access these data, the archiving system of Oki/Kanae-Lab and Kitsuregawa-Lab, IIS, Univ. of Tokyo was used. Data is accessible at http://apps.diasjp.net/gpv/. The DIAS dataset is archived and provided under the framework of the Data Integration and Analysis System (DIAS) funded by the Ministry of Education, Culture, Sports, Science, and Technology (MEXT). Several figures presented in this paper were printed using the Generic Mapping Tools (GMT) developed by Wessel et al. [39].

Conflicts of Interest

The authors declare no conflicts of interest.

Appendix A

Figure A1. Comparisons of simulation results for storm surges in (a) Jebi and (b) Trami. Solid red and blue lines indicate waveforms simulated with a Manning’s roughness of 0.025 m−1/3s, corresponding to waveforms displayed in Figure 6. Dotted black lines and dashed black lines indicate simulated waveforms with the Manning’s roughness of 0.010 and 0.050 m−1/3s, respectively.
Jmse 07 00413 g0a1

References

  1. Cox, D.; Arikawa, T.; Barbosa, A.; Guannel, G.; Inazu, D.; Kennedy, A.; Li, Y.; Mori, N.; Perry, K.; Prevatt, D.; et al. Hurricanes Irma and Maria post-event survey in US Virgin Islands. Coast. Eng. J. 2019, 61, 121–134. [Google Scholar] [CrossRef]
  2. Tajima, Y.; Yasuda, T.; Pacheco, B.M.; Cruz, E.C.; Kawasaki, K.; Nobuoka, H.; Miyamoto, M.; Asano, Y.; Arikawa, T.; Ortigas, N.M.; et al. Initial report of jsce-pice joint survey on the storm surge disaster caused by typhoon haiyan. Coast. Eng. J. 2014, 56, 1450006. [Google Scholar] [CrossRef]
  3. Mori, N.; Kato, M.; Kim, S.; Mase, H.; Shibutani, Y.; Takemi, T.; Tsuboki, K.; Yasuda, T. Local amplification of storm surge by Super Typhoon Haiyan in Leyte Gulf. Geophys. Res. Lett. 2014, 41, 5106–5113. [Google Scholar] [CrossRef] [PubMed]
  4. Sopkin, K.L.; Stockdon, H.F.; Doran, K.S.; Plant, N.G.; Morgan, K.L.M.; Guy, K.K.; Smith, K.E.L. Hurricane Sandy: Observations and Analysis of Coastal Change; US Geological Survey: Reston, VA, USA, 2014.
  5. Fritz, H.M.; Blount, C.; Sokoloski, R.; Singleton, J.; Fuggle, A.; McAdoo, B.G.; Moore, A.; Grass, C.; Tate, B. Hurricane Katrina storm surge distribution and field observations on the Mississippi Barrier Islands. Estuarine, Coast. Shelf Sci. 2007, 74, 12–20. [Google Scholar] [CrossRef]
  6. Knutson, T.R.; McBride, J.L.; Chan, J.C.L.; Emanuel, K.; Holland, G.; Landsea, C.; Held, I.; Kossin, J.P.; Srivastava, A.K.; Sugi, M. Tropical cyclones and climate change. Nat. Geosci. 2010, 3, 157–163. [Google Scholar] [CrossRef]
  7. Webster, P.J.; Holland, G.J.; Curry, J.A.; Chang, H.-R. Changes in Tropical Cyclone Number, Duration, and Intensity in a Warming Environment. Science 2005, 309, 1844–1846. [Google Scholar] [CrossRef]
  8. Bruneau, N.; Griser, J.; Loridan, T.; Bellone, E.; Khare, S. The impact of extra-tropical transitioning on storm surge and waves in catastrophe risk modeling: Application to the Japanese coastline. Nat. Hazards 2017, 85, 649–667. [Google Scholar] [CrossRef]
  9. Karaca, E.; Aslani, H. Review of two Japan Typhoon catastrophe models for commercial and industrial properties. Nat. Hazards 2016, 83, 19–40. [Google Scholar] [CrossRef]
  10. Kim, S.; Matsumi, Y.; Yasuda, T.; Mase, H. Storm surges along the Tottori coasts following a typhoon. Ocean. Eng. 2014, 91, 133–145. [Google Scholar] [CrossRef]
  11. Kawabata, T.; Kunii, M.; Bessho, K.; Kanazawa, T. Reanalysis and reforecast of Typhoon Vera (1959) using a mesoscale four-dimensional variational assimilation system. J. Meteorol. Soc. Jpn. 2012, 90, 467–491. [Google Scholar] [CrossRef]
  12. Arakawa, H. Typhoon Vera and its Induced Storm Tide. Weatherwise 1960, 13, 150–152. [Google Scholar] [CrossRef]
  13. Mori, N.; Yasuda, T.; Arikawa, T.; Kataoka, T.; Nakajo, S.; Suzuki, K.; Yamanaka, Y.; Webb, A. 2018 Typhoon Jebi post-event survey of coastal damage in the Kansai region, Japan. Coast. Eng. J. 2019, 61, 278–294. [Google Scholar] [CrossRef]
  14. Japan Meteorological Agency. Strong Wind and Storm Surge Caused by Typhoon No. 21 in 2018, (Written in Japanese); Technical Report; Japan Meteorological Agency: Tokyo, Japan, 2018; Available online: http://www.data.jma.go.jp/obd/stats/data/bosai/report/2018/20180911/20180911.html (accessed on 18 April 2019).
  15. Japan Meteorological Agency. Strong Wind and Storm Surge Caused by Typhoon No. 24 in 2018 (Written in Japanese); Technical Report; Japan Meteorological Agency: Tokyo, Japan, 2018; Available online: http://www.data.jma.go.jp/obd/stats/data/bosai/report/2018/20181011/20181011.html (accessed on 18 April 2019).
  16. Japan Meteorological Agency. Track Data of Typhoons in 2018, (in Japanese); Technical Report; Japan Meteorological Agency: Tokyo, Japan, 2018; Available online: https://www.data.jma.go.jp/fcd/yoho/typhoon/route_map/bstv2018.html (accessed on 6 December 2018).
  17. Takabatake, T.; Mäll, M.; Esteban, M.; Nakamura, R.; Kyaw, T.O.; Ishii, H.; Valdez, J.J.; Nishida, Y.; Noya, F.; Shibayama, T. Field Survey of 2018 Typhoon Jebi in Japan: Lessons for Disaster Risk Management. Geosciences 2018, 8, 412. [Google Scholar] [CrossRef]
  18. Yamanaka, Y.; Shibata, R.; Tajima, Y.; Okami, N. Inundation characteristics in Arida City due to overtopping waves induced by 2018 Typhoon Jebi. Proceedings of International Conference on Asian and Pacific Coasts 2019, Hanoi, Vietnam, 25–28 September 2019; pp. 199–206. [Google Scholar]
  19. WW3DG (The WAVEWATCH Ⅲ Development Group). User Manual and System Documentation of Wavewatch III Version 5.16; Tech. Note 329; NOAA/NWS/NCEP/MMAB: College Park, MD, USA, 2016. [Google Scholar]
  20. Tajima, Y.; Gunasekara, K.H.; Shimozono, T.; Cruz, E.C. Study on Locally Varying Inundation Characteristics Induced by Super Typhoon Haiyan. Part 1: Dynamic Behavior of Storm Surge and Waves Around San Pedro Bay. Coast. Eng. J. 2016, 58, 1640002. [Google Scholar] [CrossRef]
  21. Weatherall, P.; Marks, K.M.; Jakobsson, M.; Schmitt, T.; Tani, S.; Arndt, J.E.; Rovere, M.; Chayes, D.; Ferrini, V.; Wigley, R. A new digital bathymetric model of the world’s oceans. Earth Space Sci. 2015, 2, 331–345. [Google Scholar] [CrossRef]
  22. Ezer, T.; Oey, L.-Y.; Wang, D.-P.; Fan, S.-J.; Yin, X.-Q.; Oey, L.; Wang, D.; Fan, S.; Yin, X. Loop Current warming by Hurricane Wilma. Geophys. Res. Lett. 2006, 33, 08613. [Google Scholar] [CrossRef]
  23. Ikoma, E. GPV Data Archive [Data set]. Data Integration and Analysis System (DIAS). 2010. Available online: https://doi.org/10.20783/DIAS.161 (accessed on 24 April 2019).
  24. Tajima, Y.; Shimozono, T.; Gunasekara, K.H.; Cruz, E.C. Study on Locally Varying Inundation Characteristics Induced by Super Typhoon Haiyan. Part 2: Deformation of Storm Waves on the Beach with Fringing Reef Along the East Coast of Eastern Samar. Coast. Eng. J. 2016, 58, 1640003. [Google Scholar] [CrossRef]
  25. Tajima, Y.; Sato, S. Numerical investigations of locally concentrated damages on Seisho coast due to typhoon T0709. In Proceeding of the 5th International Conferences on Asian Pacific Coasts (APAC 2009), Singapore, 13–16 October 2009. [Google Scholar]
  26. Roeber, V.; Bricker, J.D. Destructive tsunami-like wave generated by surf beat over a coral reef during Typhoon Haiyan. Nat. Commun. 2015, 6, 7854. [Google Scholar] [CrossRef]
  27. Yamanaka, Y.; Tajima, Y.; Sato, S.; Liu, H. Dynamic behaviors of the 2011 Tohoku Tsunami in Ryori Bay. In Proceedings of the 7th International Conference on Coastal Dynamics, Arcachon, France, 23–26 June 2013; pp. 1937–1946. [Google Scholar]
  28. Geospatial Information Authority of Japan. Basic Map Information. 2019. Available online: http://www.gsi.go.jp/kiban/ (accessed on 30 June 2019).
  29. Endoh, T.; Inazu, D.; Waseda, T.; Hibiya, T. A parameter quantifying radiation damping of bay oscillations excited by incident tsunamis. Cont. Shelf Res. 2018, 157, 10–19. [Google Scholar] [CrossRef]
  30. Namegaya, Y.; Tanioka, Y.; Abe, K.; Satake, K.; Hirata, K.; Okada, M.; Gusman, A.R. In situ Measurements of Tide Gauge Response and Corrections of Tsunami Waveforms from the Niigataken Chuetsu-oki Earthquake in 2007. Pure Appl. Geophys. 2009, 166, 97–116. [Google Scholar] [CrossRef]
  31. Holland, K.; Holman, R.; Lippmann, T.; Stanley, J.; Plant, N. Practical use of video imagery in nearshore oceanographic field studies. IEEE J. Ocean. Eng. 1997, 22, 81–92. [Google Scholar] [CrossRef]
  32. Di Stefano, L.; Mattoccia, S.; Tombari, F. ZNCC-based template matching using bounded partial correlation. Pattern Recognit. Lett. 2005, 26, 2129–2134. [Google Scholar] [CrossRef]
  33. Briechle, K.; Hanebeck, U.D. Template matching using fast normalized cross correlation. In Proceedings of the Optical Pattern Recognition XII, Orlando, FL, USA, 19 April 2001. [Google Scholar]
  34. Yoshioka, H.; Takayama, T.; Serizawa, S. Observation and computation of resonant long period oscillation excited by storm wind. In Proceedings of the Coastal Engineering Conference, Lisbon, Portugal, 19–24 September 2004; pp. 1290–1298. [Google Scholar]
  35. Bertin, X.; De Bakker, A.; Van Dongeren, A.; Coco, G.; André, G.; Ardhuin, F.; Bonneton, P.; Bouchette, F.; Castelle, B.; Crawford, W.C.; et al. Infragravity waves: From driving mechanisms to impacts. Earth Sci. Rev. 2018, 177, 774–799. [Google Scholar] [CrossRef]
  36. Sénéchal, N.; Coco, G.; Bryan, K.R.; Holman, R.A. Wave runup during extreme storm conditions. J. Geophys. Res. Space Phys. 2011, 116. [Google Scholar] [CrossRef]
  37. Tajima, Y. Case study on impact of storm waves on inundation characteristics. Procedia IUTAM 2017, 25, 36–43. [Google Scholar] [CrossRef]
  38. Shimozono, T.; Tajima, Y.; Kennedy, A.B.; Nobuoka, H.; Sasaki, J.; Sato, S. Combined infragravity wave and sea-swell runup over fringing reefs by super typhoon Haiyan. J. Geophys. Res. Oceans 2015, 120, 4463–4486. [Google Scholar] [CrossRef]
  39. Wessel, P.; Smith, W.H.F.; Scharroo, R.; Luis, J.; Wobbe, F. Generic Mapping Tools: Improved Version Released. Eos Trans. AGU 2013, 94, 409–410. [Google Scholar] [CrossRef] [Green Version]
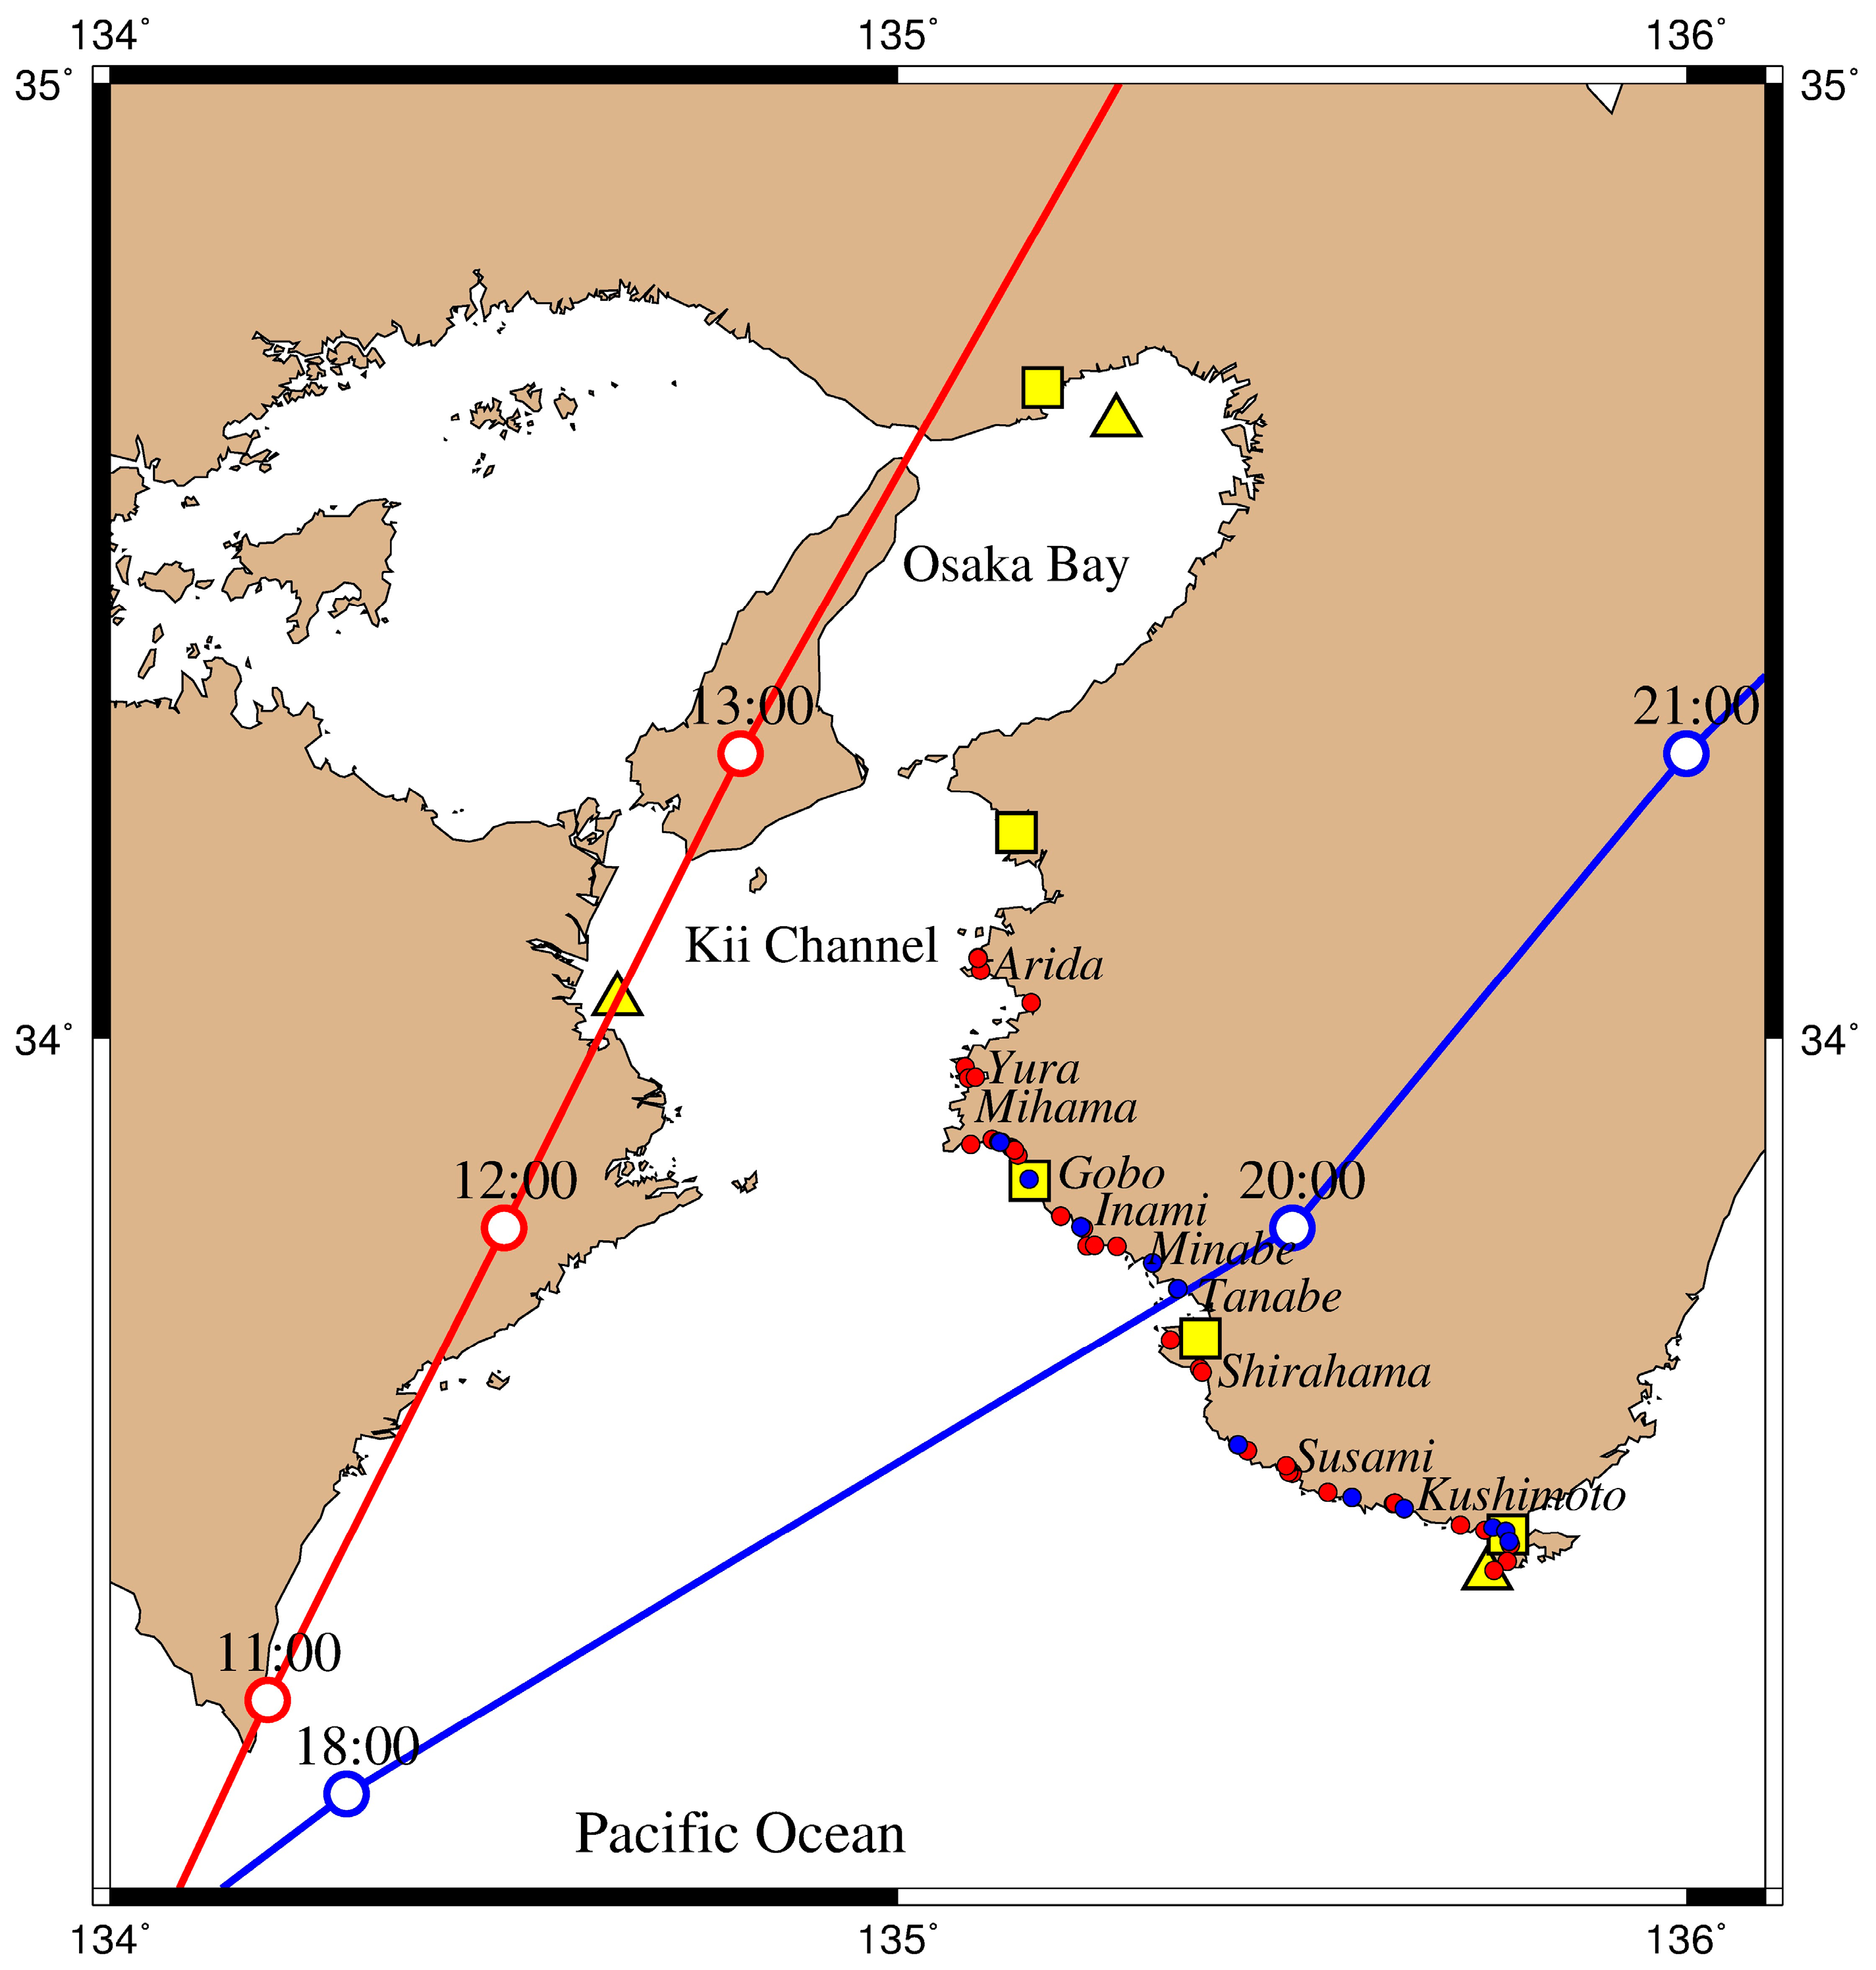
Figure 1. Typhoon paths (indicated by lines) and surveyed locations (indicated by colored circles) in Wakayama Prefecture. Red and blue indicate Typhoons Jebi and Trami, respectively. The typhoon paths were based on Japan Meteorological Agency, JMA [16]. The yellow squares indicate tide gauge stations at Kushimoto, Shirahama, Gobo, Wakayama, and Kobe from the south, and the yellow triangles indicate Nationwide Ocean Wave information for Port and HArborS (NOWPHAS) stations at Shionomisaki, Komatsushima, and Kobe from the south.
Jmse 07 00413 g001
Figure 2. Photograph of debris observed on Tonda Beach with a seawall having a crown height of + 9.2 m from the mean sea level near the head of Tokyo Bay (i.e., Tokyo Peil, TP), taken by the authors on September 21, 2018.
Jmse 07 00413 g002
Figure 3. Photographs recorded by a resident (a) at 07:13 and (b) at 12:12 (i.e., before and during Typhoon Jebi), on September 4, 2018, at a site in Inami.
Jmse 07 00413 g003aJmse 07 00413 g003b
Figure 4. Photograph showing the damaged breakwater observed at Suganohama fishery harbor in Kushimoto, taken by the authors on 2 October 2018.
Jmse 07 00413 g004
Figure 5. Elevations of remaining debris and witnessed watermarks during Typhoons Jebi and Trami [TP m], indicated by red and blue, respectively (Google Earth; Mori et al. [13]).
Jmse 07 00413 g005
Figure 6. Comparisons of observed data and simulation results for Typhoons Jebi and Trami. The observed and simulated significant wave heights are, respectively, indicated by symbols and solid lines at NOWPHAS stations for (a) Jebi and (b) Trami; the triangles, squares, and circles, respectively, indicate observations at Shionomisaki, Komatsushima, and Kobe; observed surge height, simulated surge height, and simulated surge height with 5 % of the simulated significant wave height at tide gauge stations, respectively, indicated by solid black, solid red, and dashed red lines for (c) Jebi and (d) Trami.
Jmse 07 00413 g006
Figure 7. Distribution of the maximum simulated wave heights during Typhoons Jebi and Trami. Significant wave height for (a) Jebi and (b) Trami; surge height for (c) Jebi and (d) Trami.
Jmse 07 00413 g007
Figure 8. Power spectrum density of water surface fluctuations observed by tide gauges for (a) Jebi and (b) Trami. Eight power spectrum densities are shown for Jebi based on water surface fluctuations observed within time bands of 9:00–10:00, 10:00–11:00, 11:00–12:00, 12:00–13:00, 13:00–14:00, 14:00–15:00, 15:00–16:00, and 16:00–17:00 and for Trami based on observations within time bands of 16:00–17:00, 17:00–18:00, 18:00–19:00, 19:00–20:00. 20:00–21:00, 21:00–22:00, 22:00–23:00, and 23:00–24:00. The results for time bands 11:00–15:00 and 18:00–22:00, when Typhoons Jebi and Trami significantly impacted the coasts, respectively, are highlighted in red and blue, respectively.
Jmse 07 00413 g008
Figure 9. Significant wave heights for infragravity wave components (circle) and low-pass filtered waveforms (solid line) from observed waveforms of surge heights with components lower than 5.6 × 10⁻⁴ Hz (30 min) for (a) Jebi and (b) Trami. Significant wave heights, H m 0 , were calculated as H m 0 = 4 m 0 , where m 0 is the zeroth-order moment of power spectrum densities of water level fluctuation; estimation of power spectrum density was based on Fourier transform with a sampling data length of 27 and sampling time step of 15 s (corresponding to 32 min window length).
Jmse 07 00413 g009
Figure 10. Overview of the geometry based on the Geospatial Information Authority of Japan [28] and locations video site; (a) Kushimoto (Kushimoto Marine Park) and (b) Obiki area in Yura Town. The red circles and red vectors indicate video locations and video angles, respectively.
Jmse 07 00413 g010
Figure 11. Still images from the video footage when the water level (a) decreased and (b) increased, respectively, taken at Kushimoto Marine Park Ltd. around 11:45 on 4 September 2018. The red lines in the images indicate the pixels for creating the time stack image.
Jmse 07 00413 g011
Figure 12. (a) Time stack image for estimating water-level fluctuations indicated by red lines; (b) estimated water-level fluctuations based on Figure 12a with synthesized waveforms comprising wind-wave and infragravity wave components, respectively, indicated in red, blue, and black; (c) Power Spectrum Densities based on Tide Gauge data and water-level fluctuations extracted from Video Footage, PSDTG (black) and PSDVF (red).
Jmse 07 00413 g012aJmse 07 00413 g012b
Figure 13. Still images from the recorded video at (a) t = 12.9 s, (b) 18.8 s, and (c) t = 26.9 s, and (df) top-view images obtained by rectifying the images in (ac), respectively, with the control line.
Jmse 07 00413 g013
Figure 14. Time stack image along the control line, as indicated in Figure 13d–f.
Jmse 07 00413 g014