Article

Assessment of Dredging Scenarios for a Tidal Inlet in a High-Energy Coast

by
Sandra Fernández-Fernández
1,
Caroline C. Ferreira
1,
Paulo A. Silva
1,*,
Paulo Baptista
2,
Soraia Romão
1,3,
Ángela Fontán-Bouzas
1,4,
Tiago Abreu
5 and
Xavier Bertin
6
1
CESAM & Department of Physics, University of Aveiro, 3810-193 Aveiro, Portugal
2
CESAM & Department of Geoscience, University of Aveiro, 3810-193 Aveiro, Portugal
3
IDL & Faculty of Sciences, University of Lisboa, 1749-016 Lisbon, Portugal
4
GEOMA & Department of Geosciences, University of Vigo, 36310 Vigo, Spain
5
CESAM & Department of Civil Engineering, Polytechnic of Porto, 4249-015 Porto, Portugal
6
UMR 7266 LIENS, CNRS- University of La Rochelle, 17000 La Rochelle, France
*
Author to whom correspondence should be addressed.
J. Mar. Sci. Eng. 2019, 7(11), 395; https://doi.org/10.3390/jmse7110395
Submission received: 17 October 2019 / Revised: 31 October 2019 / Accepted: 4 November 2019 / Published: 6 November 2019
(This article belongs to the Section Coastal Engineering)

Abstract

:
The high energetic wave climate of the North Atlantic Ocean causes important morphological changes at Figueira da Foz coastal system (W Portugal), which is comprised of sandy beaches and the Mondego estuary-inlet. The submerged sandbar at the inlet mouth is highly dynamic inducing short waves shoaling and breaking processes that can entail navigation problems towards the local harbor. Therefore, coastal dredging operations are performed to guarantee safe navigation. Nevertheless, these operations have a limited temporal effectiveness and require a high annual budget to be accomplished. The goal of this research is to seek long-life dredging alternatives using modeling tools (i.e., Delft3D model suite). Delft3D model is used to simulate the morphological evolution of five dredging scenarios during a three-month winter period under three wave climate scenarios. The bed level differences at the dredged area and at the inlet mouth for each scenario are analyzed in comparison with numerical solutions obtained in a reference scenario (i.e., no-dredging). Results highlight morphological changes at the dredged inlet and surrounding areas and their effectiveness in extending the operational lifetime of inlet dredged operations on dredging configuration and wave climate conditions. These findings are the basis for selecting the most suitable dredging scenario to this coastal region under current wave climate conditions.

1. Introduction

Tidal inlets establish a connection between the coastal ocean and the sheltered back-barrier environment, such as lagoons, estuaries, bays, and marshes. They allow the exchange of water, sediments, nutrients, organisms, and pollutants between these systems and provide a waterway towards the harbors located at the back-barrier environments. For these reasons, tidal inlets are regarded as environments with high ecologic and socio-economic values. Hence, stakeholders are aware of the importance of their correct management to increase their resilience. Nevertheless, this task requires a large effort because tidal inlets are highly dynamic morphological environments. Their behavior is the result of the interplay between oceanic processes, such as waves, tides and mean sea level, fluvial/estuarine processes, such as river discharges, and geological constraints on varying spatial and temporal scales [1,2].
Tidal inlets present shoaling problems due to the dynamic of submerged sandbars that constitute a risk to navigation among others [3,4,5,6]. Therefore, coastal scientists and engineers have been looking for solutions that can be gathered into two groups: structural, such as groins, jetties, and sand bypassing systems, and non-structural, such as dredging operations (e.g., in [7,8,9,10,11,12,13,14]). The construction of jetties to achieve inlet stabilization may have a significant influence on the erosional and depositional patterns on adjacent beaches [15] and in some cases new shoaling problems are observed (e.g., in [16,17]). On the other hand, regular dredging operations performed to enhance navigation entail a significant annual budget that is difficult to assure permanently and thus, dredging optimization is highly encouraged. Hence, numerical models have been developed and implemented to delve into the impact of these solutions in different coastal regions around the world (e.g., in [18,19,20]).
Understanding the morphodynamic evolution of jettied tidal inlets after dredging operations is of paramount importance regarding management for safe inlet navigation. This work tackles this issue by applying a process-based model system (Delft3D) to forecast the morphodynamic evolution of the Figueira da Foz tidal inlet (W Portugal) under different dredging scenarios at winter maritime climate timescales. The main purposes of this research are as follows:
(1)
to assess the morphodynamic response of the tidal inlet, that is subjected to dredging operations, under winter wave climate conditions;
(2)
to compare the obtained results with natural evolution (i.e., no-dredging operations);
(3)
to improve the knowledge about the parameters that contribute to sediment infill of dredging operations;
(4)
to evaluate the effectiveness of dredging configuration (i.e., area and volume), that guarantees a bed level to safe navigation, under current wave climate conditions.
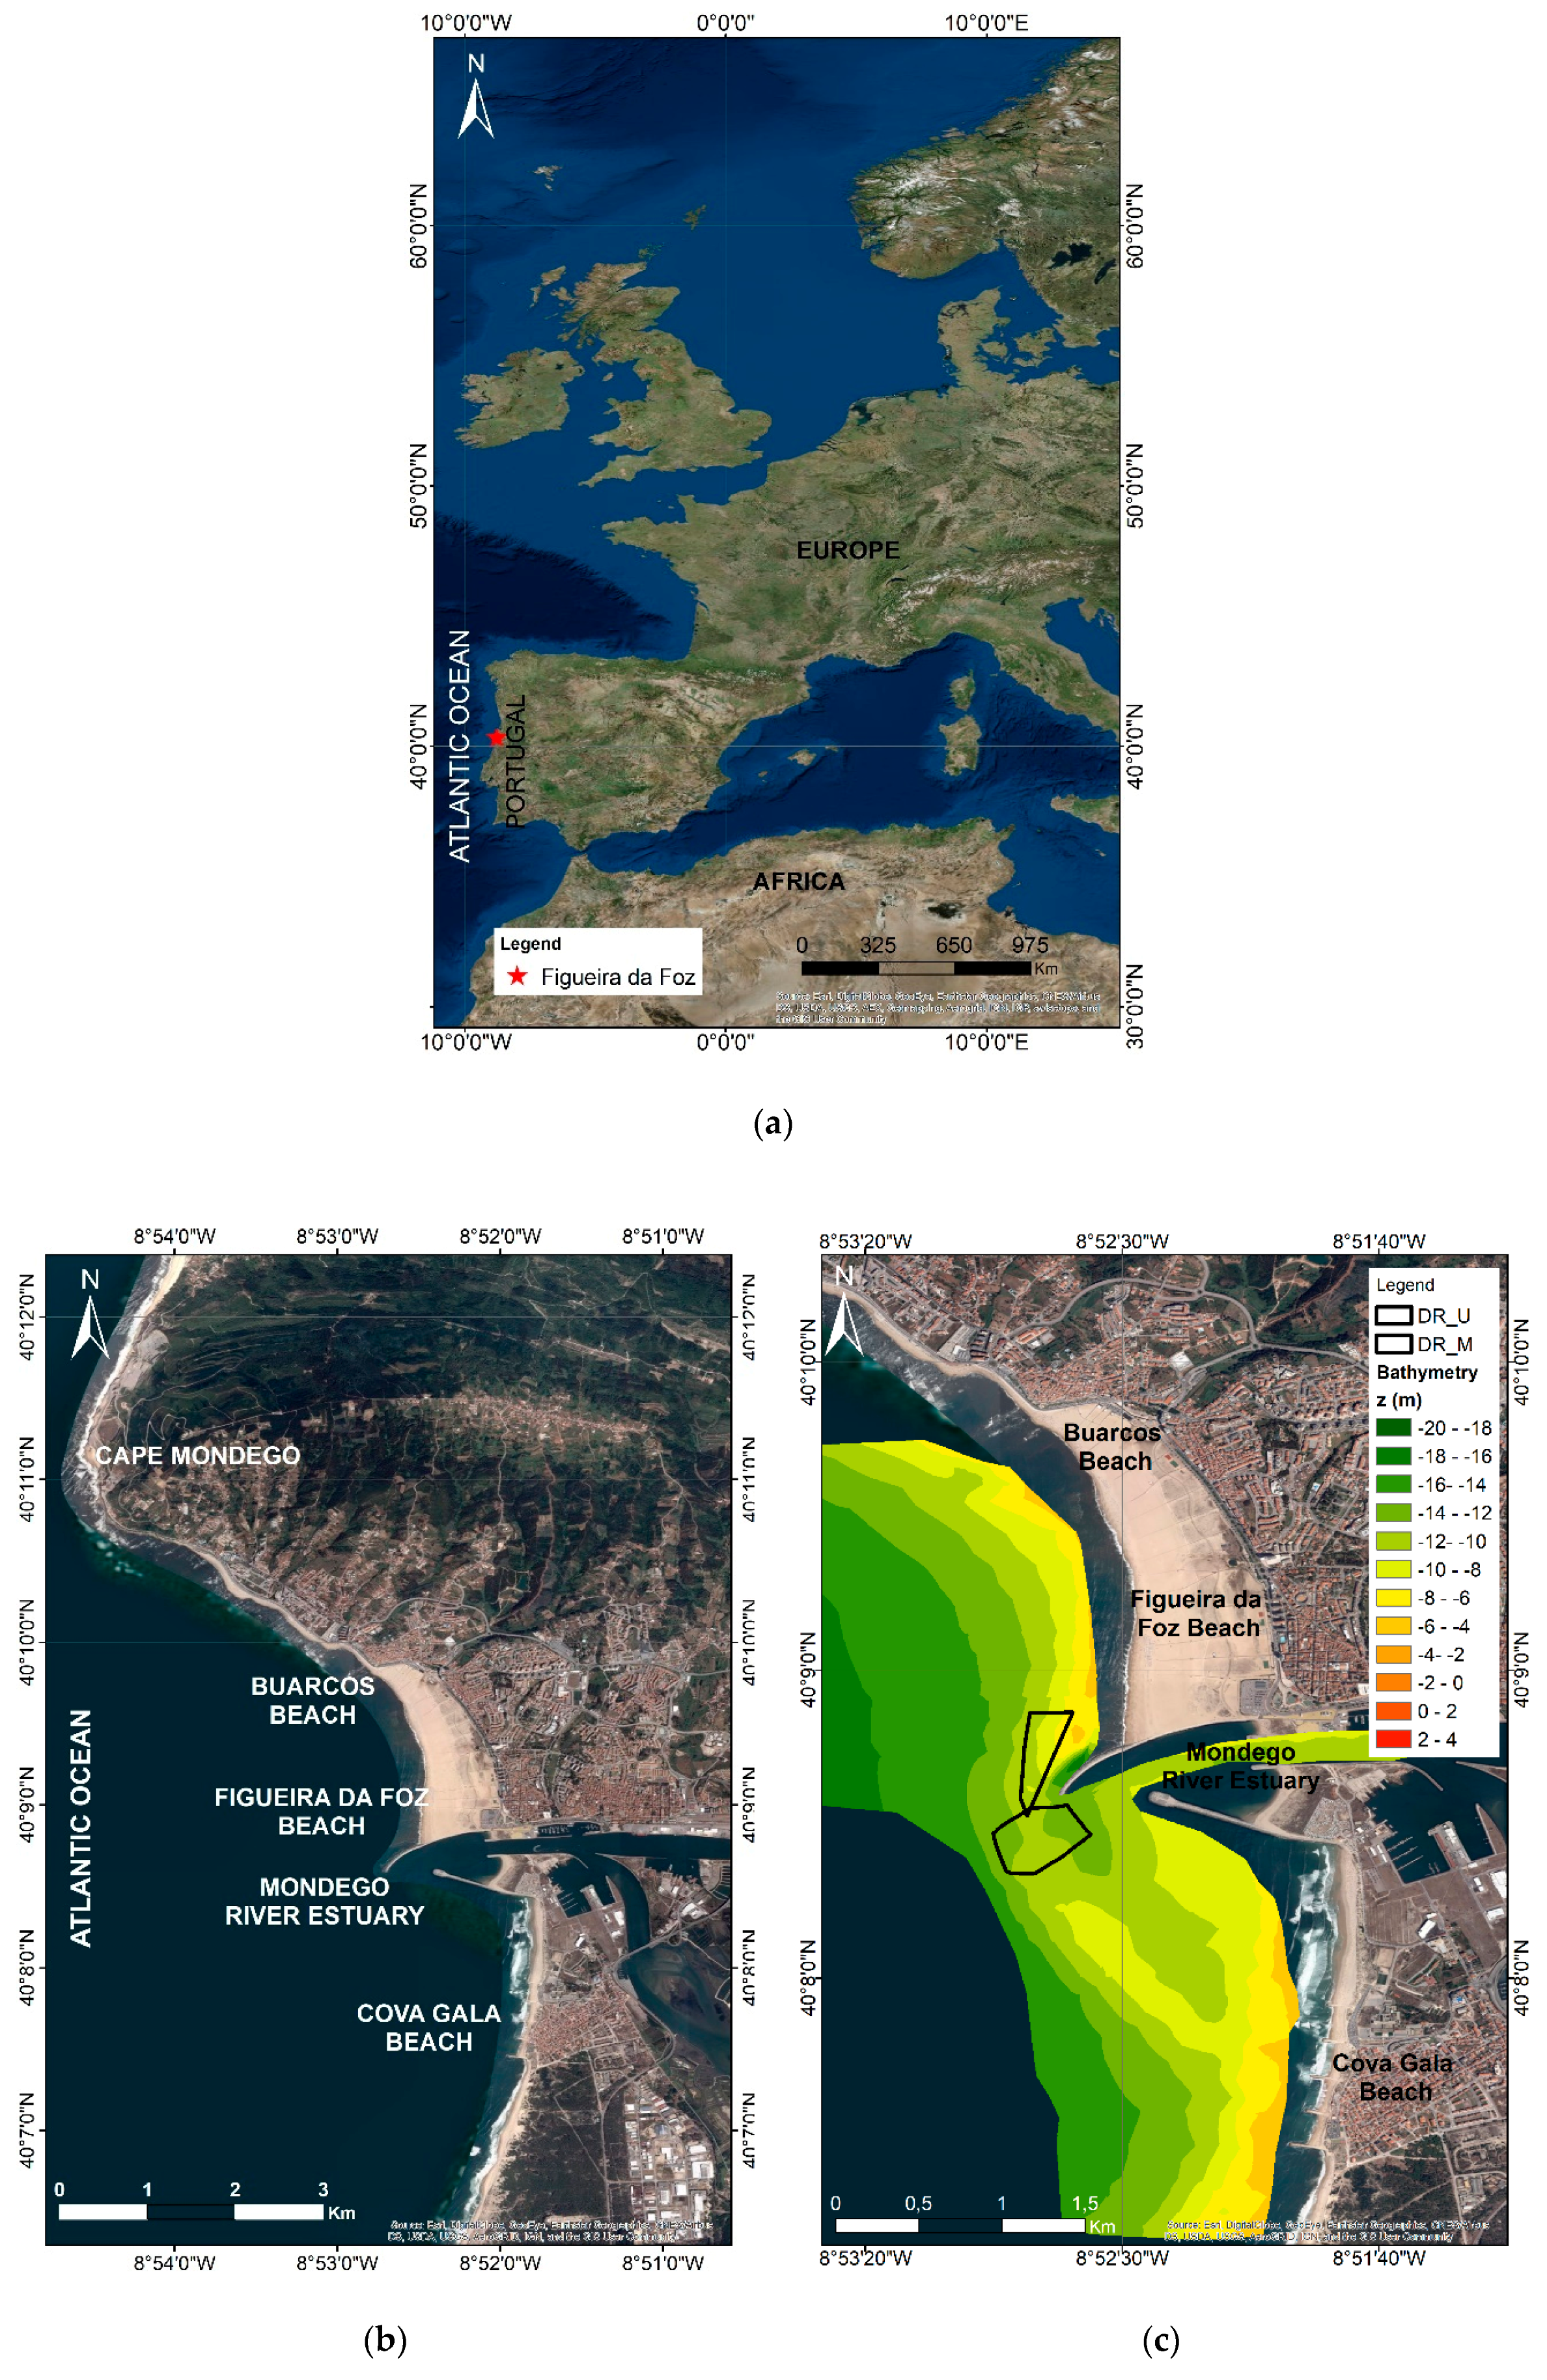
2. Study Area

The Mondego River estuary system is a jettied mouth wave-dominated ebb-tidal inlet at Figueira da Foz, on the west coast of Portugal (Figure 1a). It is located between Mondego Cape, a natural headland lying to the north, and Cova Gala Beach further south. This coastal stretch presents rocky outcrops and wide semi-exposed anthropized sandy beaches (Buarcos Beach and Figueira da Foz Beach) to the north, and several narrow groined sandy beaches to the south (Figure 1b).
The Mondego River estuary can be morphologically classified as a bar-built estuary after [21,22], having a length of 26 km, and it splits in two branches at 7 km upstream of the mouth, but these converge again downstream in an old tidal mudflat. The dams built upstream in the 1970s control its fluvial flow. The fluvial flow presents a seasonal regime with maximum values that usually do not exceed 1000 m3·s−1 during winter and 100 m3·s−1 in the summer according to the Portuguese National Water Resources Information System. This area has a mesotidal range (mean 2.2 m) with semi-diurnal tides.
The offshore wave climate in Figueira da Foz is characterized by waves coming, predominantly, from the northwest quadrant with mean significant wave heights of 2–2.5 m and mean wave periods of 5–9 s in deep waters [23]. According to [24], the annual number of storms varied over the years, but January and February are the months with the highest average number (1.52 storms per month). This wave climatology results in a strong southward potential littoral drift estimated at about 1 × 10⁶ m3·year−1 [25,26,27].
Two jetties with lengths of 500 and 950 m at the north and south of the mouth of Mondego estuary-inlet, respectively, were built in the 1960s to stabilize the inlet location and to guarantee safe navigation [28]. Nevertheless, these jetties generated a large accretion on the updrift coast and erosion on the downdrift coast denoting a preferential southward sediment transport. For instance, the shoreline progradation rate ranged from 7 m·year−1 at Buarcos Beach to 25 m·year−1 at the northern jetty for the period 1958–1977 and from 4 to 17 m·year−1 for the period 1977–1982. The shoreline retreat rate at the south coast was about 3.6 m·year−1 for the period 1958–1977 and 8 m·year−1 for the period 1977–1982 [29]. Between 2008 and 2010, the northern jetty was extended by 400 m aiming to reduce the accretion of sediments at the inlet that hinders navigation towards the local harbor [30].
Recent bathymetric surveys (Figure 1c) show that the ebb delta has the form of a small arch characterized by updrift and downdrift bypassing bars which are attached north to the Figueira da Foz Beach and at south to Cova Gala Beach, near the 4th and 5th groins. At the inlet mouth entrance, the ebb shoal has an equilibrium height, which is estimated to be –5 to –6 m from the chart datum (CD) (i.e., 2 m below mean sea level), despite dredging operations performed to guarantee a safe navigation bed level (i.e., 9 m below mean sea level). As the longshore sediment transport is higher than the tidal prism (8.9 × 10⁵ m3 in spring tides and 1.8 × 10⁵ m3 in neap tides) this is a wave dominated ebb delta which is efficient in the transport of sand from north to south through the ebb shoal at the inlet. It is a bypassing bar system [31].
In order to keep the bed level suitable for safe navigation, regular dredging operations are performed at the inlet mouth entrance or updrift of the inlet mouth entrance (see polygons in Figure 1c). For instance, two operations in the summer of 2015 (total dredged volume of 107 × 103 m3), three in the winter of 2015/16 (total dredged volume of 285 × 103 m3), two in the summer of 2016 (total dredged volume of 109 × 103 m3), and two in the winter of 2016/17 (total dredged volume of 250 × 103 m3) were performed. The monitoring program of these dredging operations revealed that their life and effect on the maintenance of the navigation channel is very dependent on wave climate. Under low-energy wave conditions, typical of summer wave climate, the dredging can last for months whereas, under high-energy wave conditions, representative of winter wave climate, it may only last a few days. As an example, the crest of the submerged sandbar was located at –7.5 m (CD) from April to October 2015 whereas it changed from −8 m (CD) in December 2015 to −5 m (CD) in January 2016 as consequence of the seven storm events recorded [32].

3. Methods

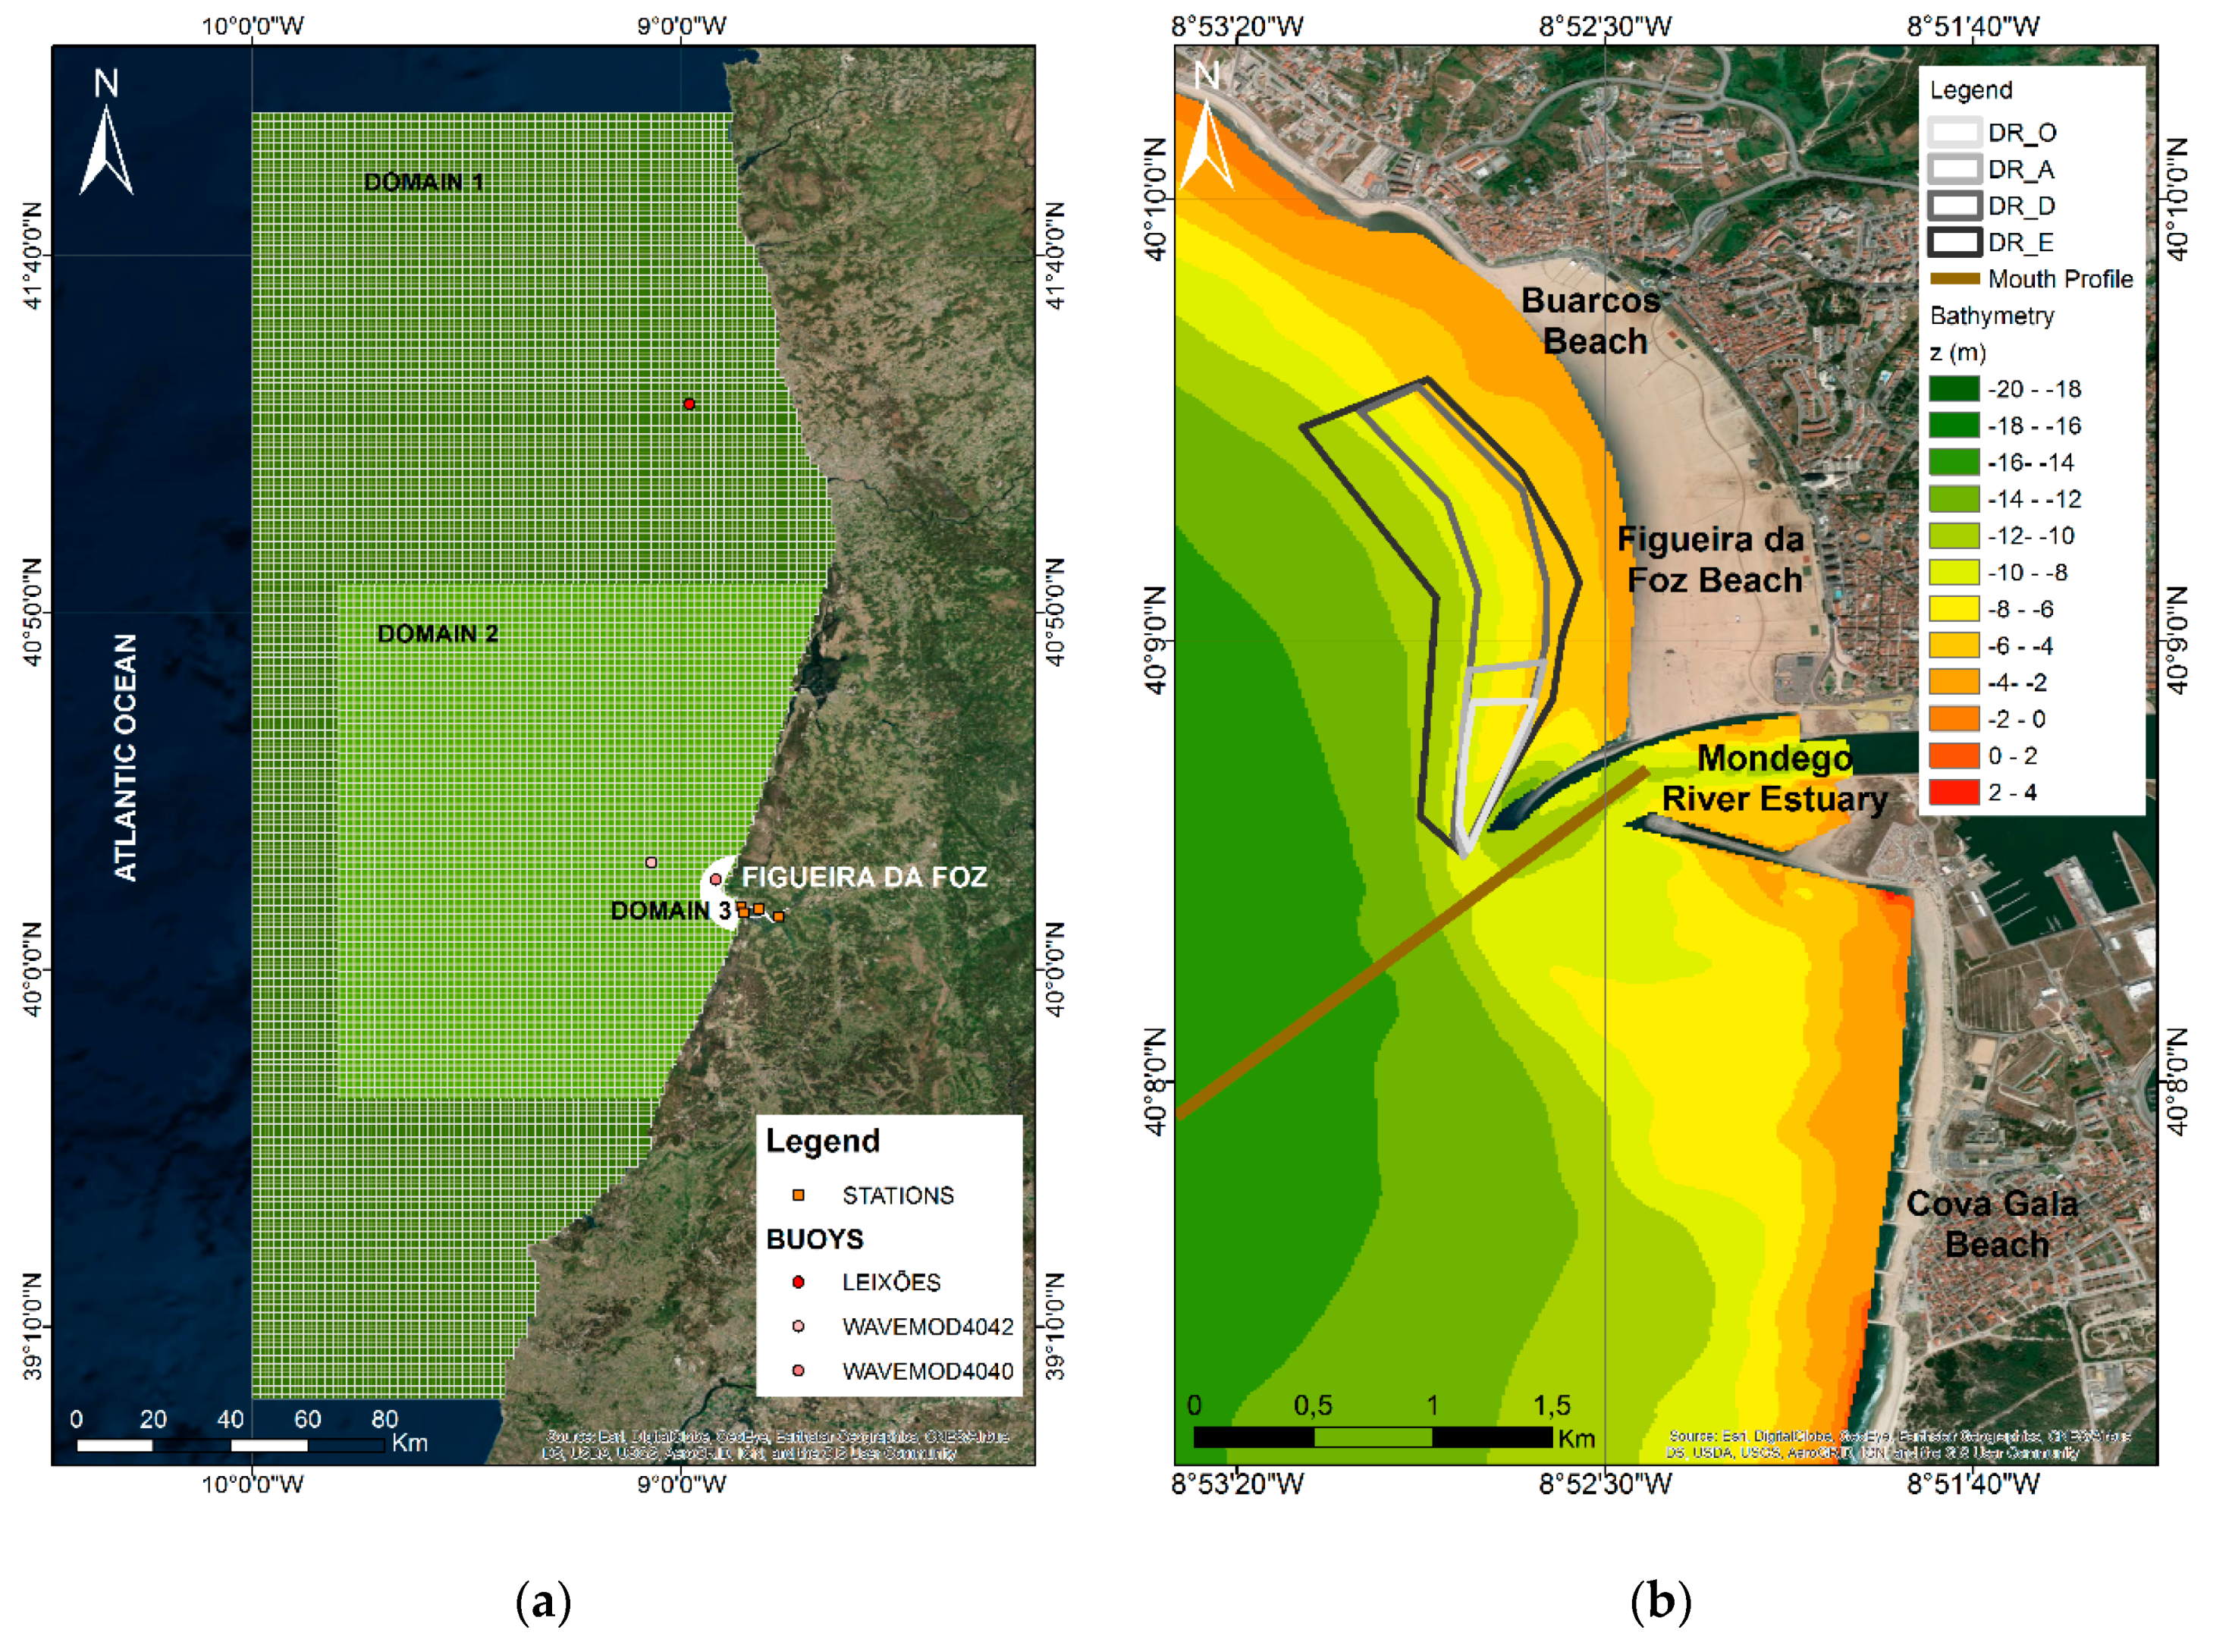
3.1. Delft3D Model Setup

This research applies the process-based numerical model suite Delft3D (v.4.01.00, Deltares, Delft, The Netherlands) [33] in 2DH mode, which means that only depth-averaged processes are simulated. This model suite contains a detailed description of relevant processes such as waves, tides, currents, and sediment transport, as well as the interaction with each other. The Delft3D model performs the hydrodynamic computations, and simultaneously calculates the transport of sediments and updates the bathymetry.
The computational domain consisted of three nested numerical grids of progressively increasing resolution designed by [34] with Delft3D-RGFGRID. These are domain 1 with dimensions 335 × 115 km2 and resolution of 1000 m; domain 2 with dimensions 133 × 85 km2 and resolution of 500 m and domain 3 with curvilinear configuration covering 102 km2 and with variable resolution (25 m close to the inlet and Mondego estuary and 35 m at the open ocean boundary) (Figure 2a). Delft3D-WAVE module was configured using these three nested numerical grids whereas Delft3D-FLOW module was configured using only the numerical grid called domain 3.
The wave boundary conditions were introduced along eight points (42, 41, 40, and 39° N/10° W; 42° N/9.5 and 8.88° W; 39° N/9.5 and 9.41° W,) in the open boundary of domain 1 (Figure 2a). The spectral wave forcing input was originated from a wave hindcast based on the WWIII model [35].
The flow boundary conditions were introduced along 44 points in the open boundary of domain 3 (Figure 2a). The tide input is based in a global ocean tide model (NA0.99b model), representing the major 16 constituents with a spatial resolution of 0.25°, and has been estimated by assimilating about 5 years of TOPEX/POSEIDON altimeter data [34].
The initial numerical bathymetry was built with Delft3D-QUICKIN using bathymetry data from the European Marine Observation and Data Network (EMODnet) and from local bathymetry surveys performed in October 2016 close to the harbor, estuary mouth, and adjacent beaches [34]. This bathymetry was considered as reference bathymetry (i.e., no-dredging operations) (Figure 2b) and it was the base for designing the dredging scenarios (Section 3.2).
The model calibration procedure is briefly described since it was discussed in detail in [34]. The Delft3D-WAVE module was validated across three domains through comparison of modeled variables (significant wave height, mean wave period, and mean wave direction) with records of three buoys (Leixões buoy, 83 m depth, to domain 1 and MAST-WAVEMOD project buoys, 72 m and 19.7 m depth, [36] to domains 2 and 3, respectively (see dots in Figure 2a)). The agreement between modeled and recorded wave parameters was estimated with different statistical indicators as in [37] (i.e., Determination correlation Coefficient (R2), Normalized Root Mean Square Error (NRMSE), Normalized Bias (NBI) and Hanna and Heinold Index [38] (HH)), obtaining values of R2 = 0.61–0.87, NRMSE = 0.05–0.25, NBI = 0.03–0.17, and HH = 0.05–0.25. The best fit of the wave parameters was obtained for domain 1.
The Delft3D-FLOW module was validated through comparison of modeled free surface water level with measures made in four stations located at the inlet mouth (see squares in Figure 2a) during a period that was comprised of spring and neap tides. The differences between modeled and measured values were 10 cm, with a phase difference of approximately 10 min for the spring tide and neap tide. The Root Mean Square (RMS) calculated with values from 0.07 to 0.24 revealed that the model reproduces the tidal propagation along the Mondego Estuary well.
The Delft3D-MOR module was validated against bathymetric changes monitored after dredging operation performed updrift of the inlet in November 2016 (Vdo = 100 × 103 m3) by Figueira da Foz Harbour Administration. Figure 3a presents the bathymetry differences observed between 19 December 2016 and 16 November 2016 (33 days). During this period, two storm events occurred promoting the infill of 60% of the dredged volume. The numerical results for the period covering both surveys were compared against observations (Figure 3b,c).
Five sediment transport equations namely, Bijker [39], Soulsby [40], Soulsby-Van Rijn [40], Van Rijn-93 [41] and Van Rijn-04 [42] were tested using default parameters to identify the one that best reproduced the morphodynamic evolution patterns at the tidal inlet as well as the infill rate of the dredging operation. Then, the effect of sediment transport parameters (αbs and αbn), which determine the influence of the bottom slope in the longitudinal (transverse) direction of the bedload component, was assessed following the procedure described in [43] to find the optimal parameters. Additionally, the variable sediment grain size distribution (d50 = 0.35–0.65 mm) based on field sediment samples and the variable bottom sediment thickness distribution (0.1–8 m) obtained from seismic data were checked. This calibration study indicated that Soulsby-Van Rijn [40] and Van Rijn-04 [42], hereinafter Van Rijn, transport equations with sediment transport parameters αbn = 25 and αbs = 0.5, a variable distribution of sediment grain size and sediment thickness, lead to good results (Brier Skill Score [44] values of 0.45 and 0.36, respectively). The model simulates littoral sediment transport from north to south which promote the infill of the dredged area similar to what was observed. Nevertheless, the obtained solutions with the Soulsby-Van Rijn sediment transport equation [10] (Figure 3b) displays a bathymetry evolution at the inlet mouth which is less realistic than the Van Rijn sediment transport equation [42] (Figure 3c). The infill sediment rate of dredging operation estimated based on the modeled result with the Soulsby-Van Rijn sediment transport equation [40] was 80% after 30 days which is higher than the infill sediment rate estimated from the bathymetry surveys (Figure 3a). The monitoring of dredging operation over time revealed that 89 days (four storm events) were necessary to achieve an infill sediment rate of 80%. Moreover, numerical simulations to assess mean sediment transport rates at this coastal stretch were performed over a representative year (i.e., 2004) with both sediment transport equations. The value obtained with the Soulsby-Van Rijn sediment transport equation [40] was 5 × 10⁶ m3·year−1 whereas the value obtained with Van Rijn sediment transport equation [42] was 1 × 10⁶ m3·year−1, which is in close accordance with [25,26,27]. Consequently, the Van Rijn sediment transport equation [42] was used in the following numerical modeling analysis.

3.2. Dredging Scenarios

The dredging scenarios were based on the concept of deposition basin or sand traps. The sediments which are moving along the coast due to waves and longshore currents are collected in the impoundment basin (sand trap), and thus decreasing the volume of sediments going inside the navigation channel [45]. In the Figueira da Foz case study, these basins will enhance the reduction of volume of sediment that contributes to the growth of the submerged sandbar after its dredging.
The design of each dredging scenario was made according to the following criteria: availability of sediment in the area and location of current effective operations such as dredging operation of November 2016 described in Section 3.1 (Figure 3a). Five dredging scenarios, whose location and shape are depicted in Figure 2b, were created taken as a basis for the 2016 bathymetry, covering a surface from 70 ×103 to 793 × 103 m2. These scenarios reached different depths (zo) and the volumes of sediment (Vdo) initially extracted in the initial numerical bathymetry were variable. They were named as DRO (zo = 10 m, Vdo = 155 × 103 m3), DRA (zo = 10 m, Vdo = 299 × 103 m3), DRD1 (zo = 10 m, Vdo = 1065 × 103 m3), DRD2 (zo = 12 m, Vdo = 1834 × 103 m3), and DRE (zo = 12 m, Vdo = 2925 × 103 m3).

3.3. Wave Climate Data

The morphodynamic simulations consider winter wave climate months (January, February, and March) corresponding to high, medium, and low wave power energy. In these months, the bed topography is highly variable whereas under summer wave climate months it remains almost constant [32].
The selection of winter wave climate input periods was based on offshore wave climate data analysis provided by the Spanish Harbour Authority to SIMAR 1042062 point (9.50° W 40.50° N) from 1958 to 2017. SIMAR datasets are composed by the concatenation of two temporal series of winds and waves originated from numerical modeling: (i) SIMAR-44 temporal series (1958–1999) created from the WAM model; and (ii) WANA temporal series (2000–present) computed with WAM and WaveWatch models forced by the wind fields of the HIRLAM model [46].
The wave power energy (P) in deep waters was estimated from:
P = 0.49Hs2Te,
where Hs is the significant wave height and Te is the wave energy period which can be estimated from zero-crossing period (T02) as in [47]:
Te = 1.32T02.
The monthly wave power energy was evaluated for the whole period. Three periods from January to March were chosen representing high (2014), medium (2007), and low (2012) wave power energy, respectively, with 100, 48, and 25 kW·m−1. The return period corresponding to these wave power energies was determined by adjusting a Gumble distribution model to the data and the obtained values were 189, 2.3, and 1 year, respectively.
The identification of storm events in the chosen periods was made following the criteria of [24], i.e., significant wave height higher than 4 m and duration higher than 12 h. For each storm event the power storm index (PSI) was estimated according to [48]:
PSI = Hsmax2d,
where Hsmax is the maximum significant wave height recorded in the storm event and d is the duration in hours of the storm event. The January–March 2014 period showed 15 storm events with durations between 12 and 253 h and PSI between 232 and 18,279 m2·h. The January–March 2007 period presented seven storm events with duration between 20 and 56 h and PSI between 480 and 2597 m2·h. The January–March 2012 period was characterized by three storm events with duration between 23 and 32 h, and PSI between 508 and 677 m2·h (Table 1).

3.4. Simulations

Numerical simulations were performed in order to assess the morphodynamic evolution of reference and dredging scenarios described in Section 3.2 under different wave climate conditions aforementioned in Section 3.3 (Table 2).
The bed level data (i.e., bathymetry) obtained were processed with ArcGIS software (v.10.4, Esri, Redlands, CA, USA). The utilization of ArcGIS tools minus, cut fill and interpolate line allowed the estimation of difference maps between days of simulation, the sediment volume accreted or eroded at the dredged area, as well bathymetric profiles at the navigation line of tidal inlet mouth entrance (brown line at Figure 2a).

4. Results

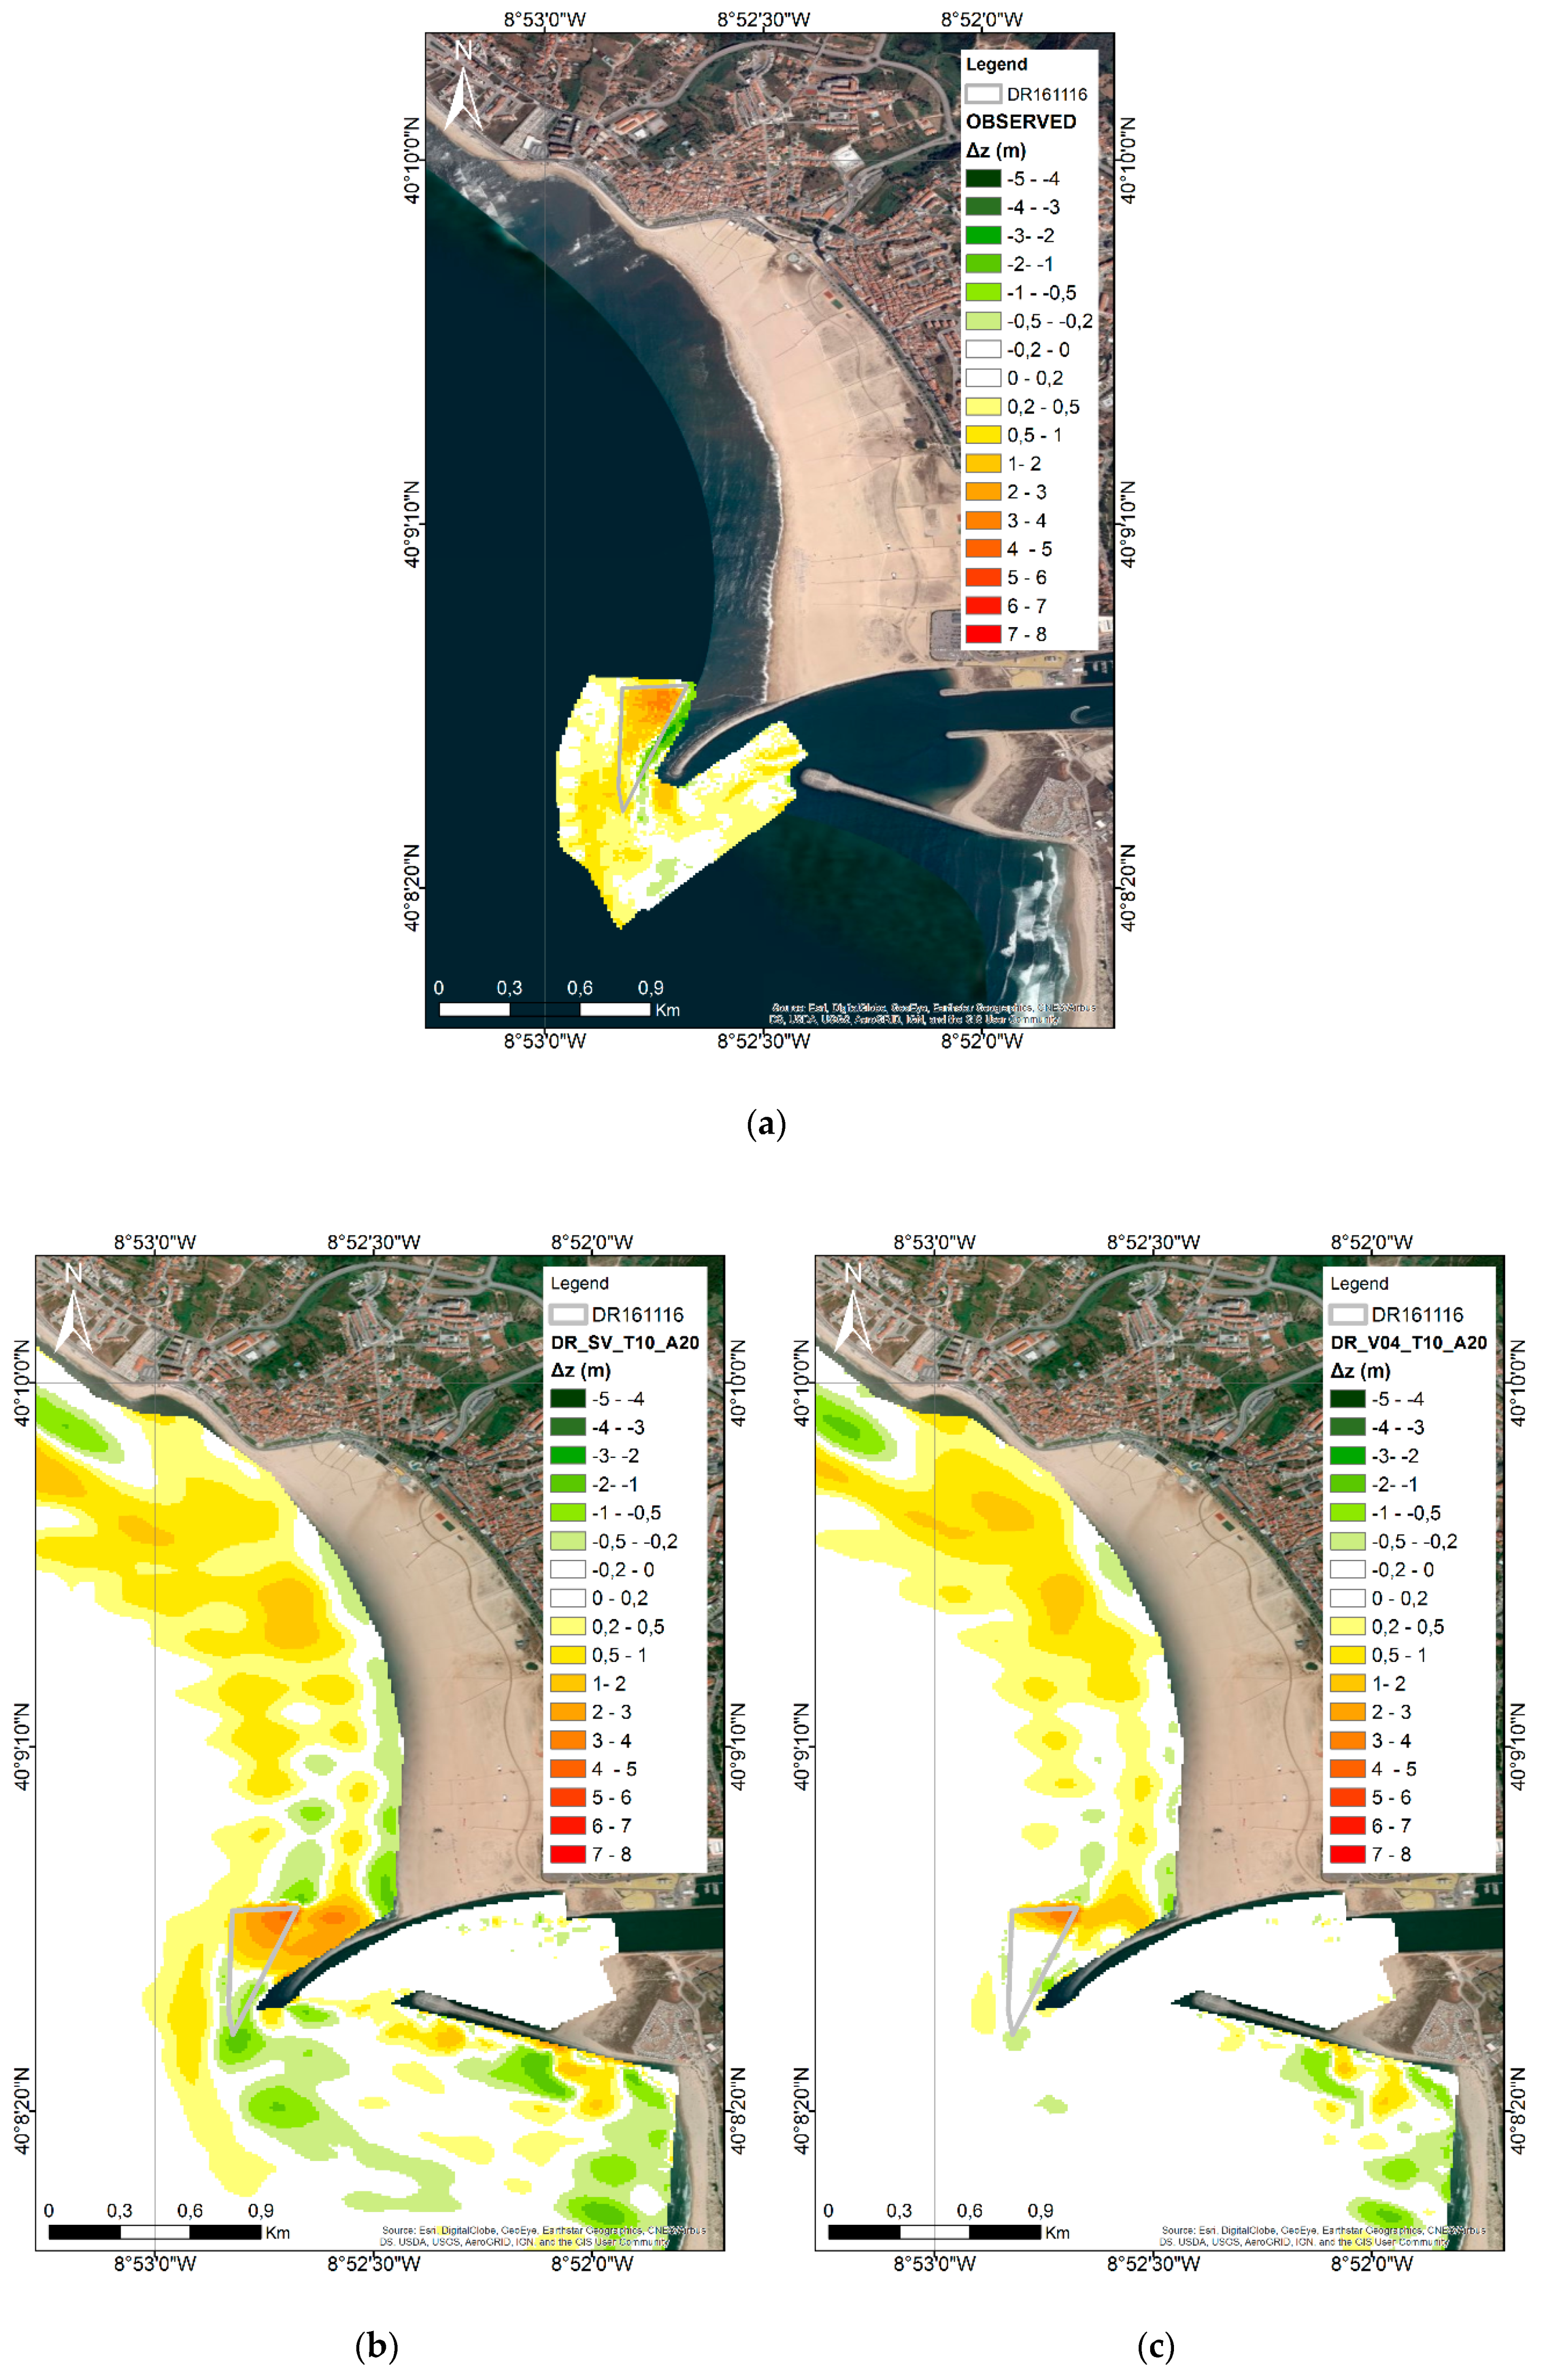
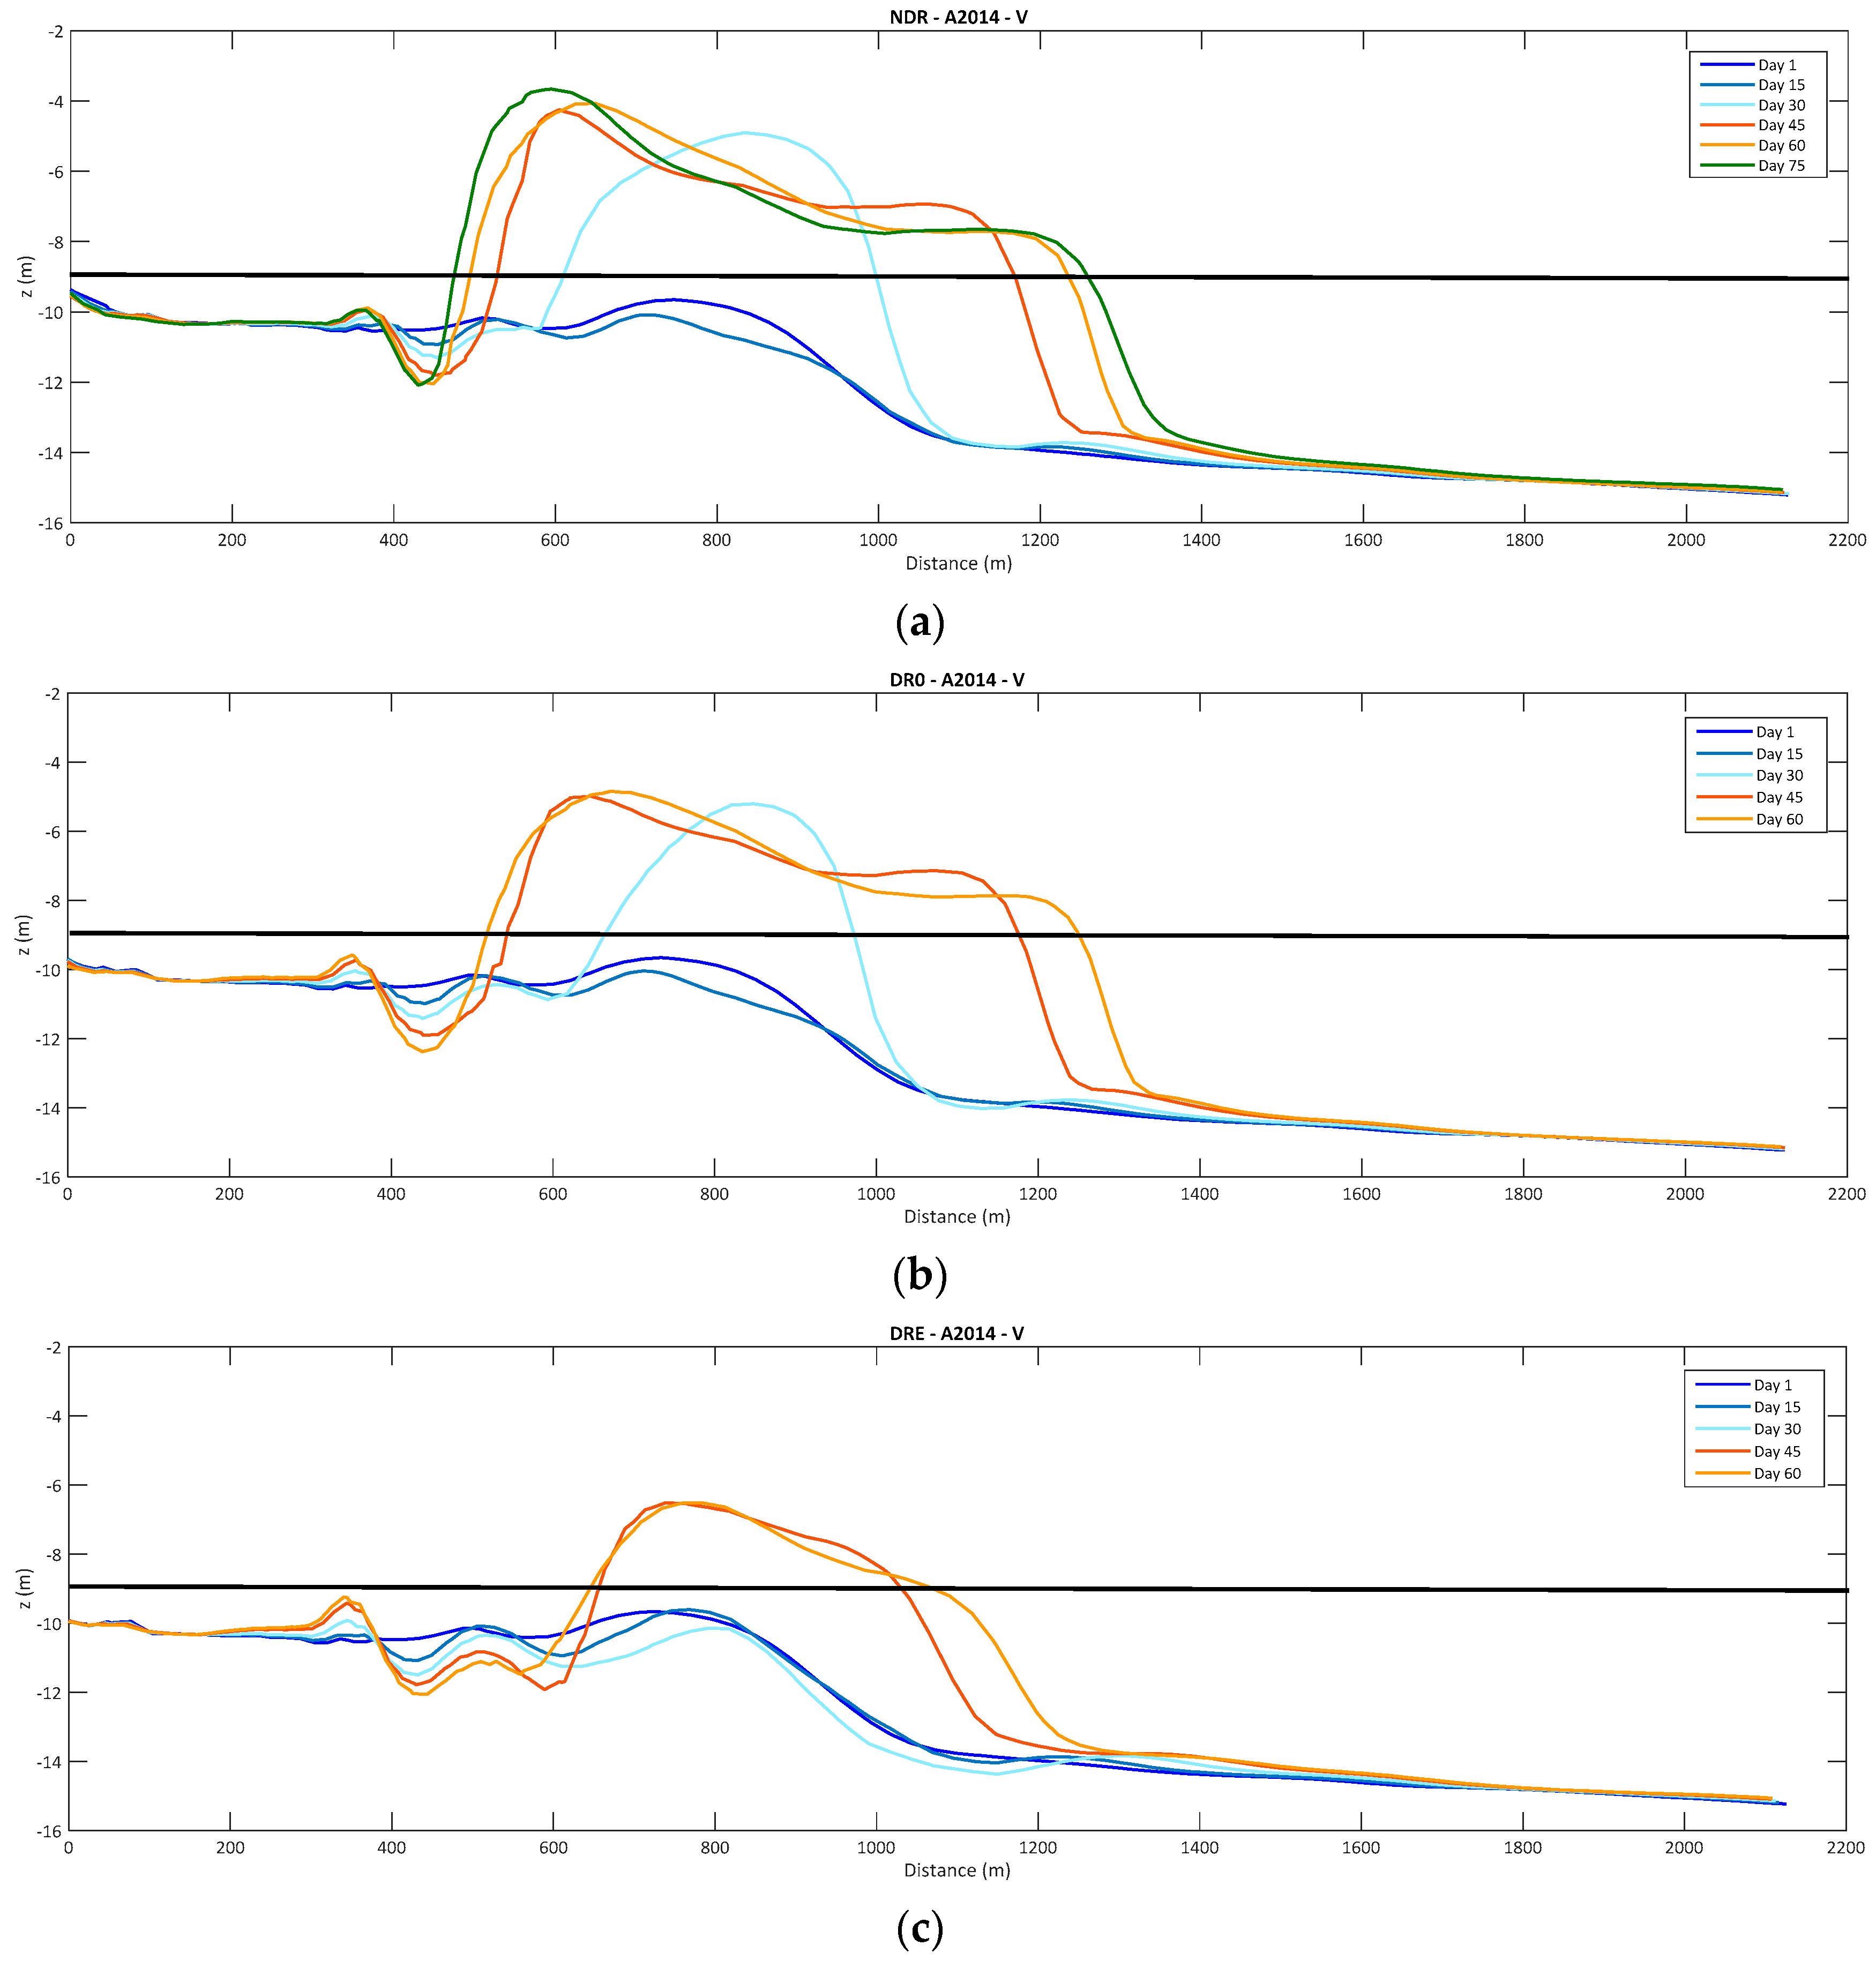
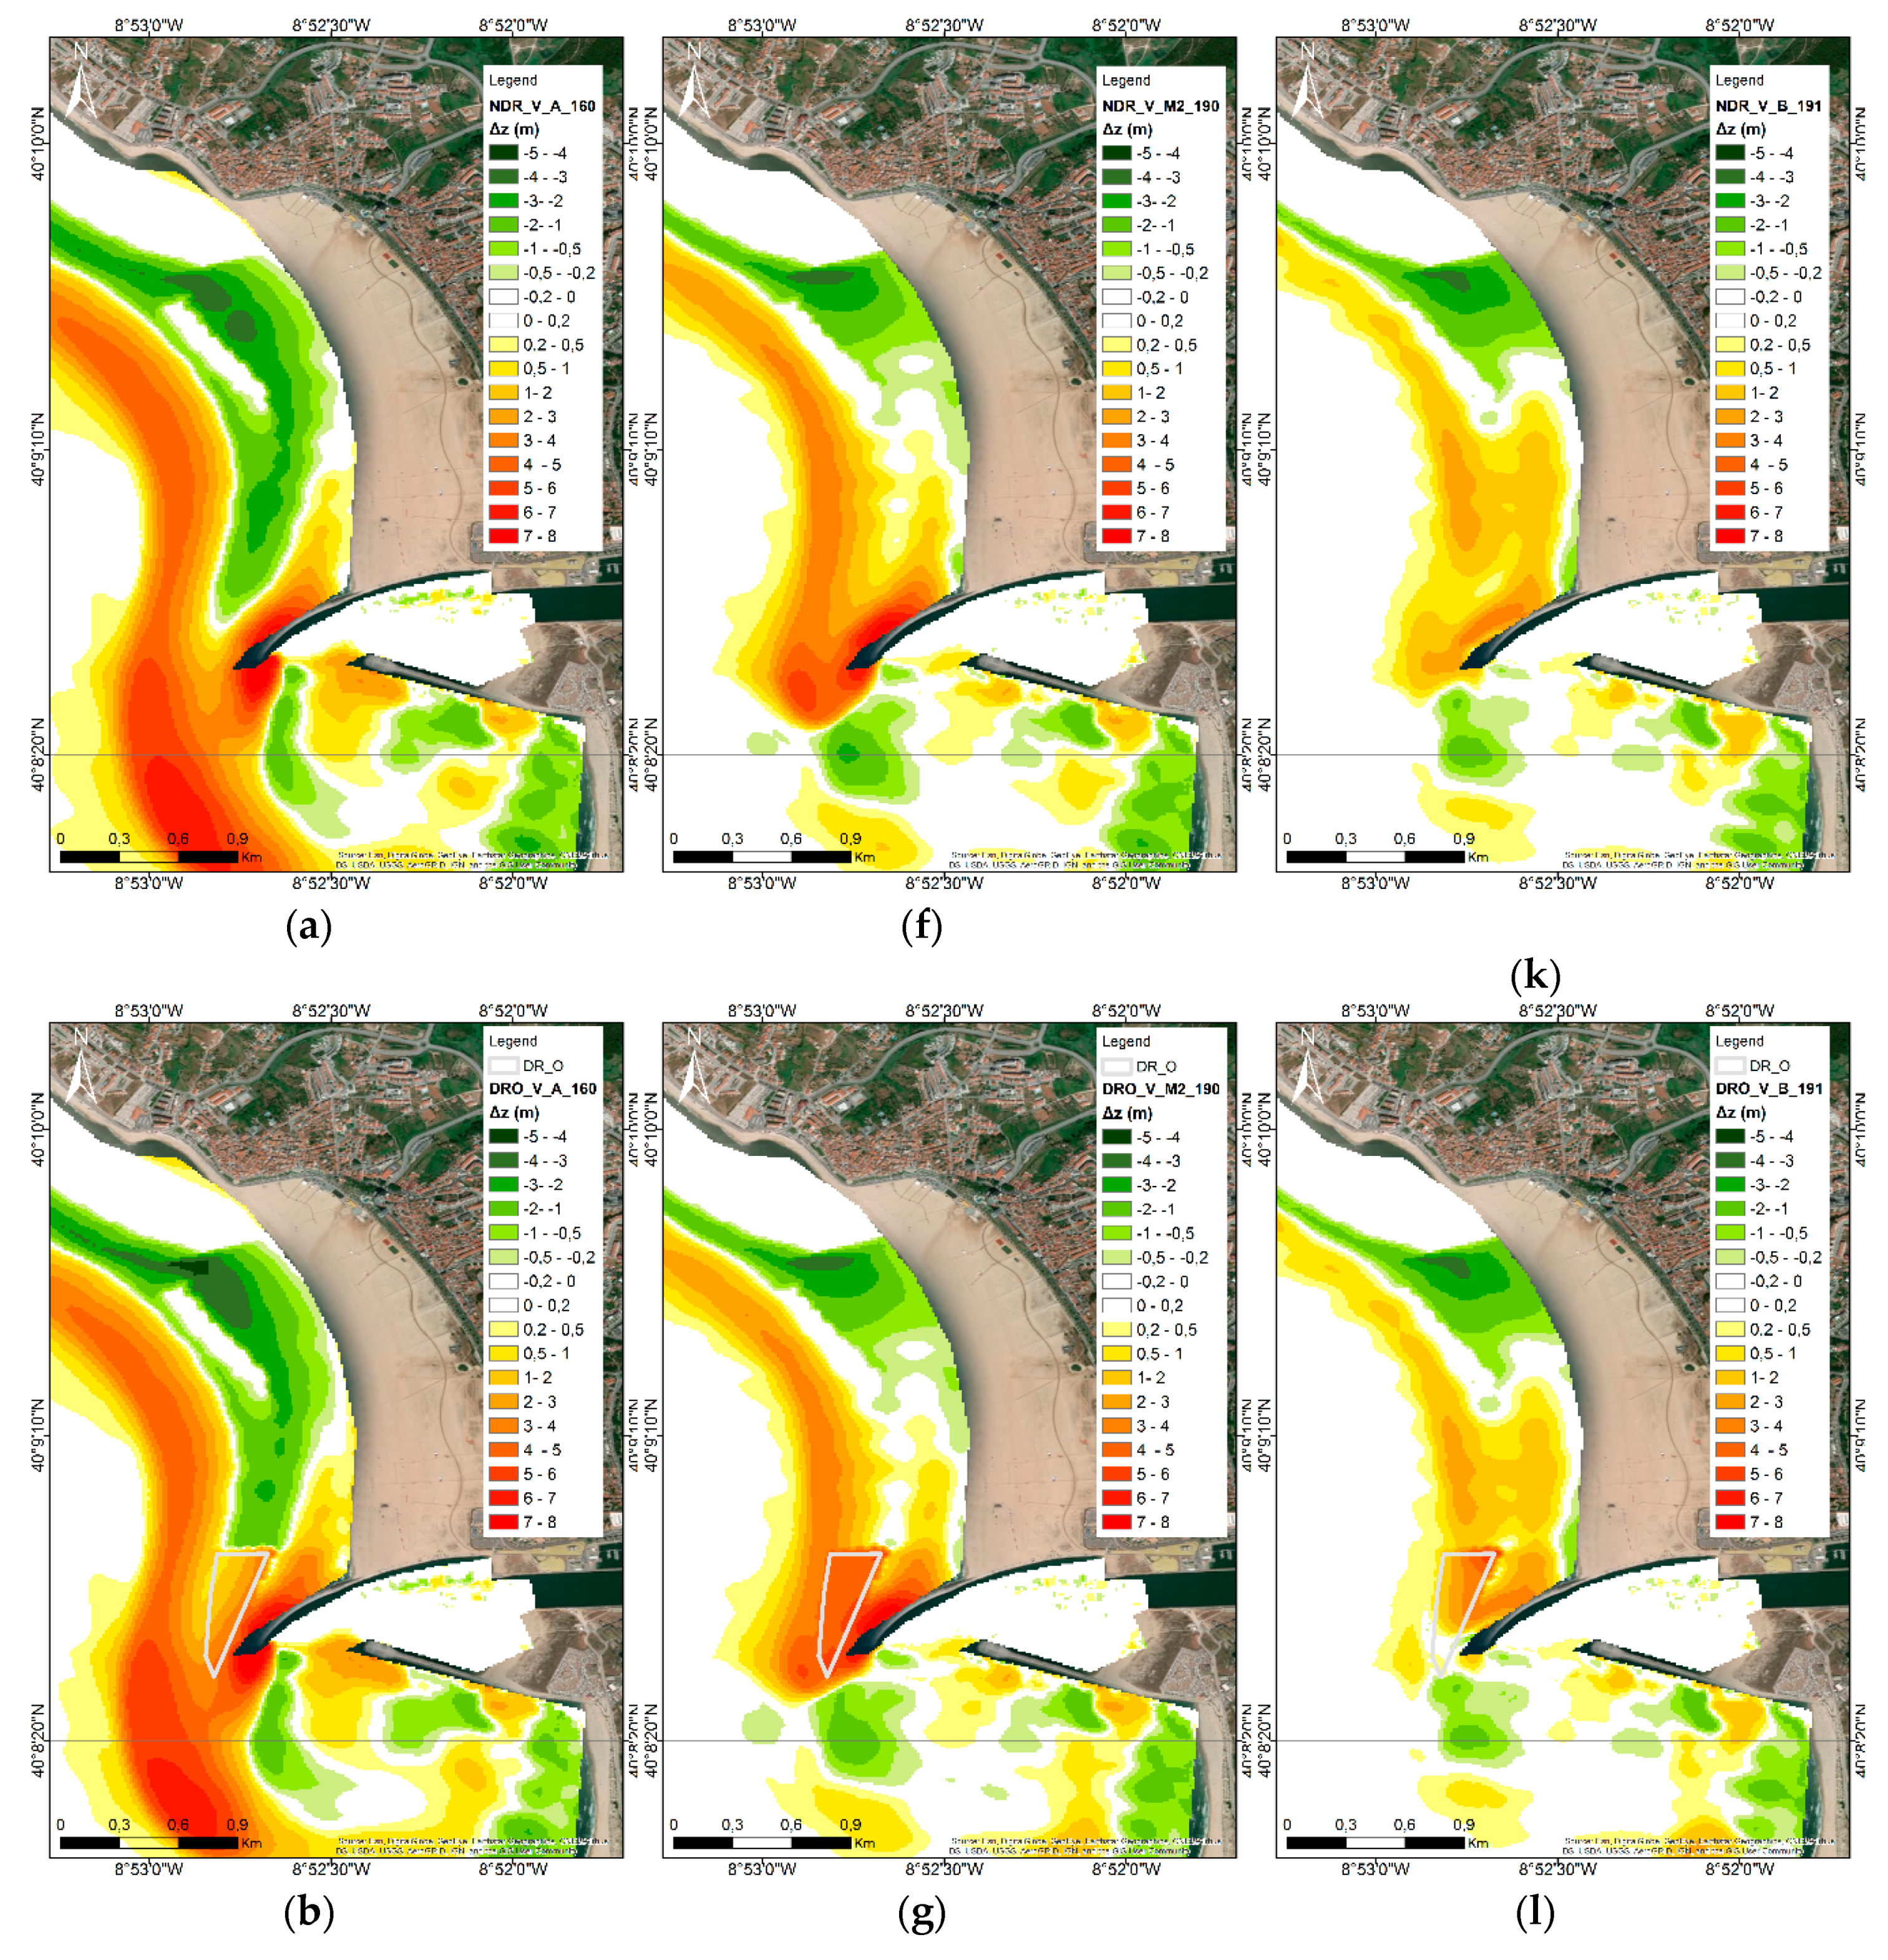
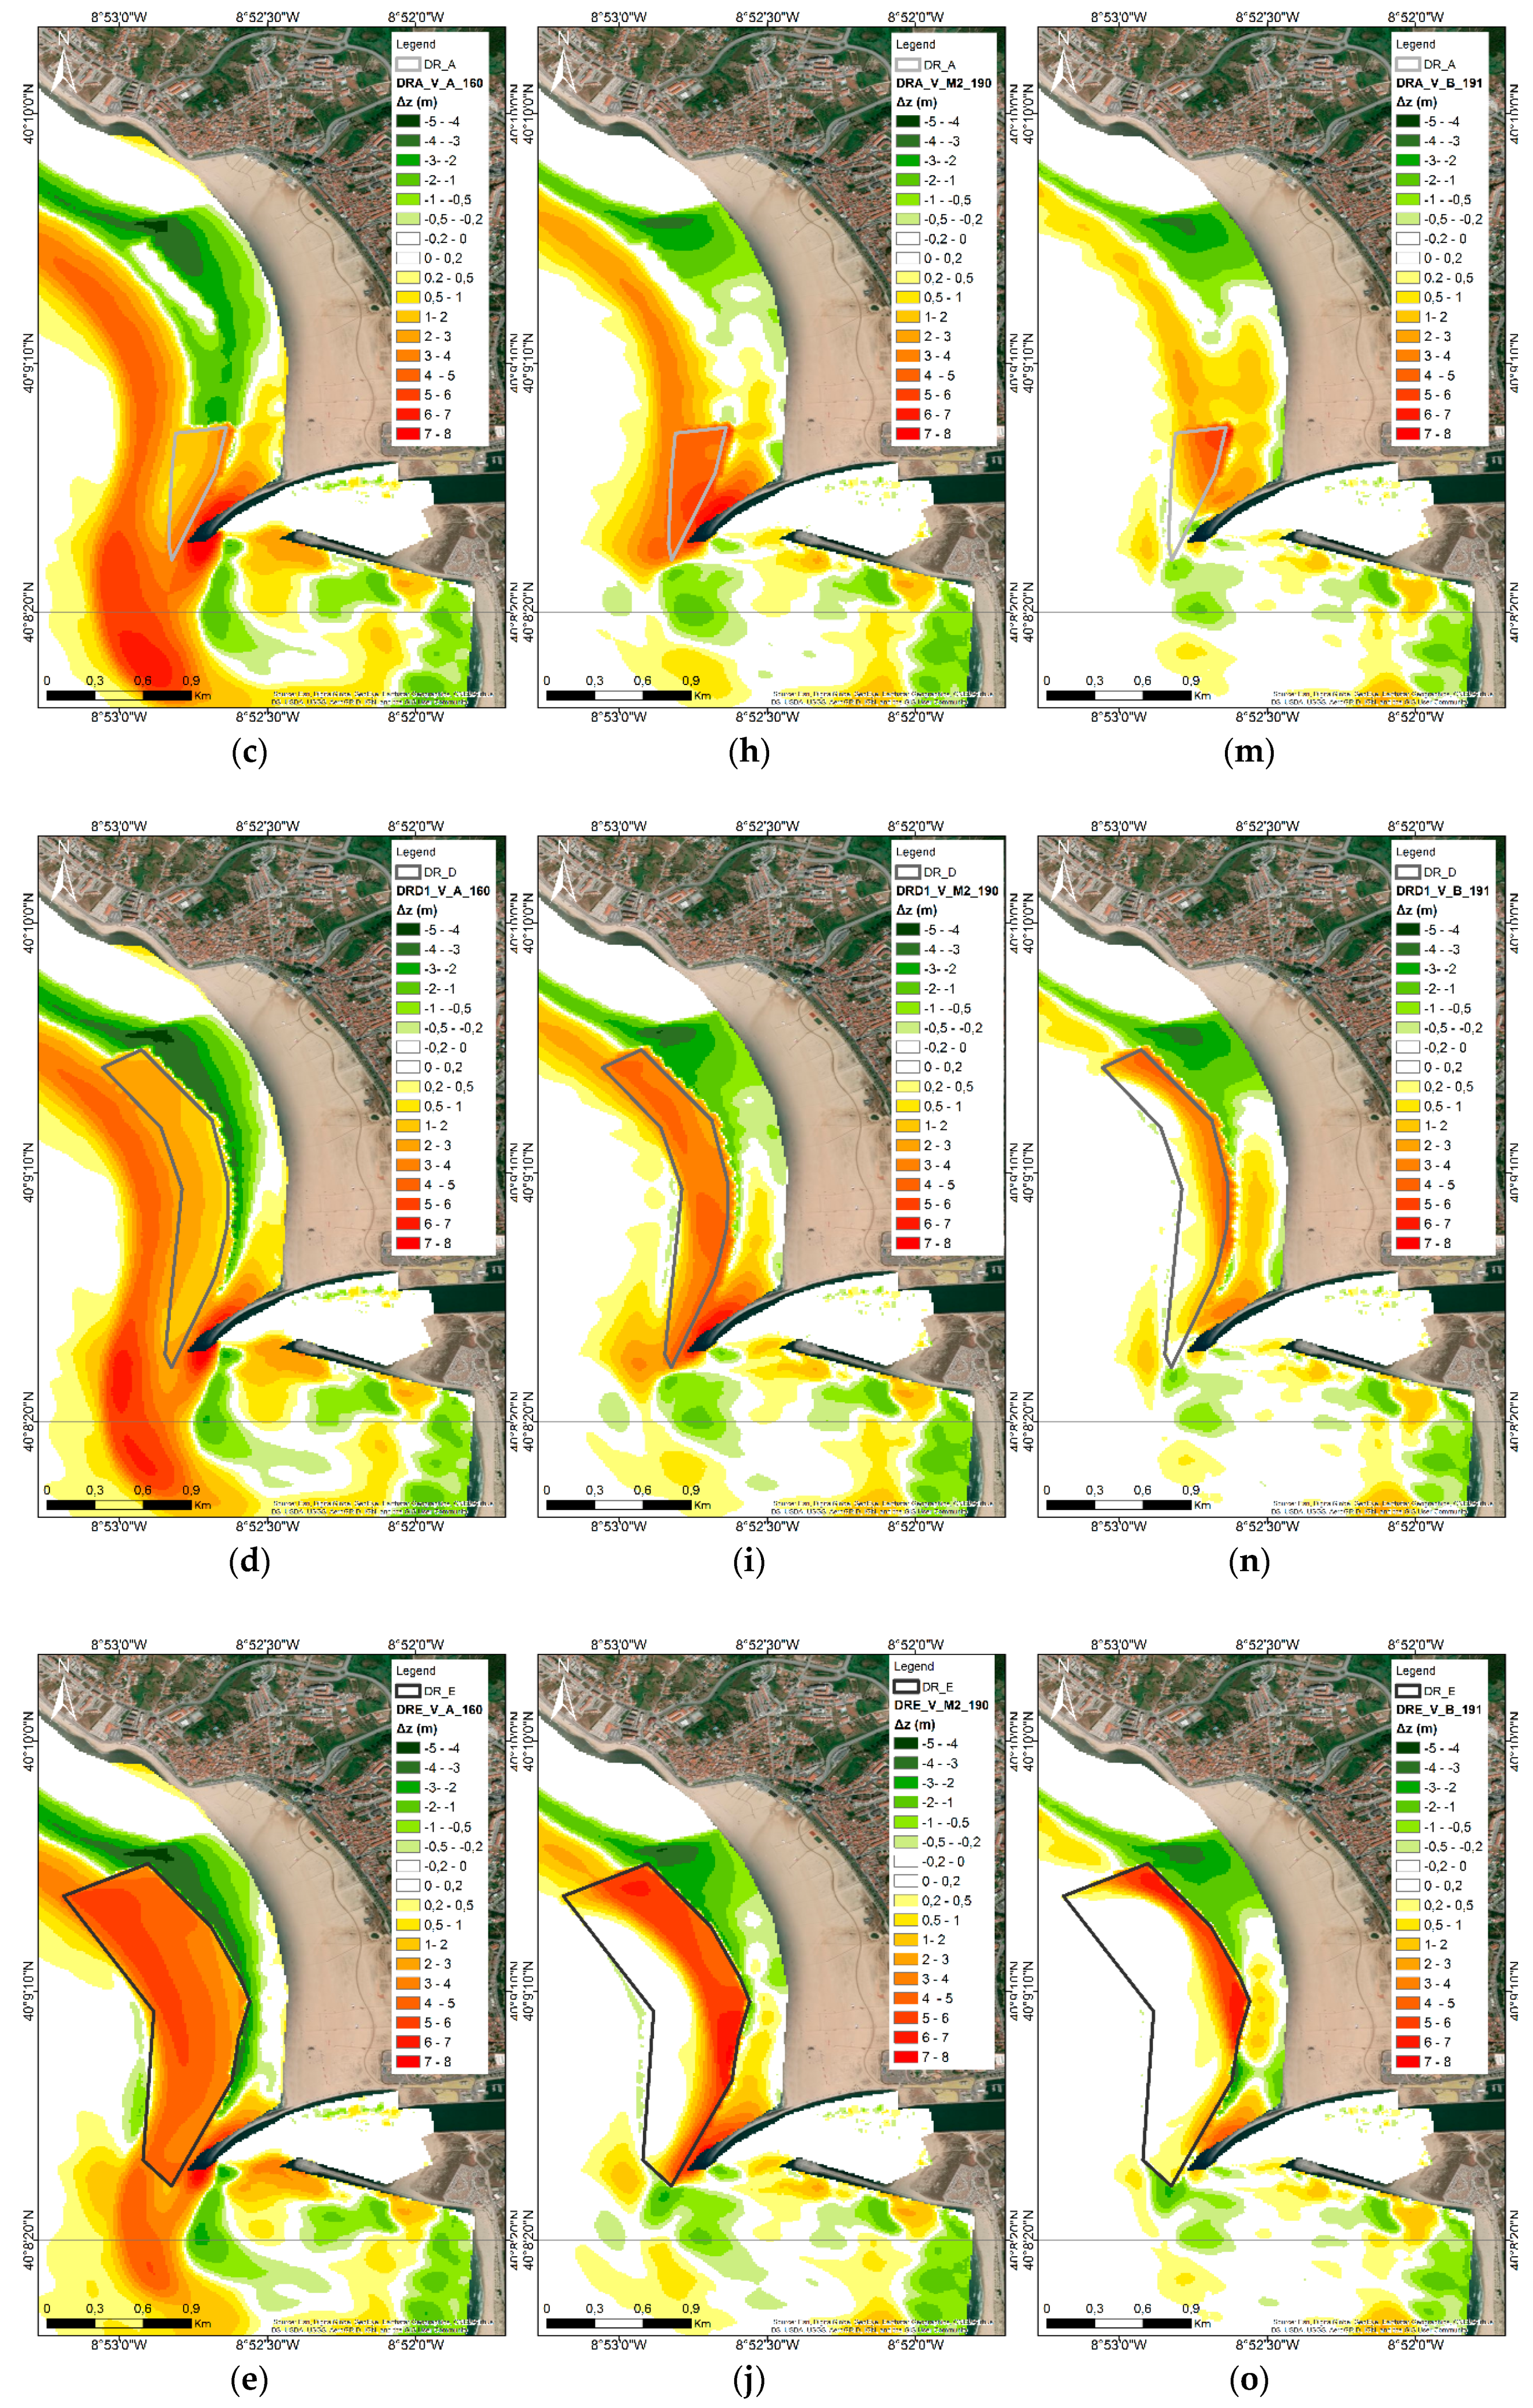
4.1. Bathymetry Evolution in Dredging Area and Tidal Inlet Mouth Entrance

The numerical solutions for the reference scenario (Figure 4) show the development of a submerged sandbar extending southwards from the head of the north jetty. The successive maps revealed bathymetry changes that are closely linked to wave climate conditions. Higher morphology changes were observed after storm events: during the second fortnight of January (Day 30 in Figure 4a) and February (Days 45 and 60 in Figure 4a) in the 2014 scenario; during February (Days 45 and 60 in Figure 4b) and the second fortnight of March (Day 90 in Figure 4b) in the 2007 scenario; and January (Days 15 and 30 in Figure 4c) and the first fortnight of March (Day 75 in Figure 4c) in the 2012 scenario.
For the dredging scenarios (e.g., DRD1 scenario in Figure S1), the sedimentation basins promote a reduction of sediment transport fluxes that enhances sediment storage coming from the northern littoral drift. These basins slowed down the development and migration of submerged sandbars and therefore could be seen as an effective mechanism to protect the tidal inlet mouth entrance. Nevertheless, the dredging effectiveness to retain sediment was determined by wave climate conditions (i.e., wave energy) and dredging operation configuration (i.e., sediment volume extraction and surface).
The evolution of the bathymetric profile at the tidal inlet corresponding to the navigation line (Figure 2b) is illustrated in Figure 5 for the reference and DRO and DRE solutions under the high wave energy scenario (i.e., 2014).
At the beginning of the simulation the reference scenario (Figure 5a) presented a submerged sandbar whose crest (z = −9.5 m above MSL) was centered at 750 m. After 30 days, the crest migrated offshore until 850 m, reaching a depth of –5 m above MSL, and thus, exceeding the safe navigation bed level (z ≤ 9 m above MSL). The submerged sandbar continued evolving and the crest migrated onshore to 600–650 m and its depth decreased from −4.5 to −3.8 m above MSL at the end of the simulation. The evolution of profile of the DRO scenario (Figure 5b) followed a similar pattern but the crest of the submerged sandbar was at −4.8 m above MSL at the end of the simulation. The evolution profile for the DRE scenario was slightly different in terms of width and depth of the submerged sandbar (Figure 5c). The safe navigation bed level was attained by day 45 when the crest reached a depth of −6.5 m above MSL and it kept this depth despite its small offshore migration. Under the 2007 and 2012 wave energy scenarios (not shown), the evolution of the submerged sandbar was less acute due to lower wave energy. The crest of the submerged sandbar maintained almost the same position in the dredging scenarios of high volume (i.e., DRD and DRE) whereas in the reference and dredging scenarios of low volume (i.e., DRO and DRA) it migrated towards an onshore position. Its depth changed by about 0.5 m after 90 days of simulation.
Figure 6 presents the bathymetry differences after the three-month simulation period. The obtained results under the high-energy wave scenario (i.e., 2014, Figure 6a–e), characterized by a set of extreme storm events (Table 1), revealed sharp changes in the bathymetry reaching values of sediment erosion of –5 m and sediment accretion of 8 m. There was an intense sediment accretion parallel to the shoreline in the northern part of the north jetty and at the mouth of the tidal inlet. Nevertheless, this pattern of sediment accretion diminished in the presence of higher sedimentation basins (Figure 6e) because they accumulated the sediment inside.
The results with medium-energy wave conditions (i.e., 2007, Figure 6f–j) indicated an intense sediment accretion in the northern part of the north jetty and at the mouth of the tidal inlet. As in the previous case, this sediment accretion reduced with sedimentation basins (Figure 6g–j). Regarding low-energy wave conditions (i.e., 2012, Figure 6k–o), bathymetry changes were lower than other years due to the reduced number of storm events (Table 1) during the simulated period. It is noteworthy the intense accretion inside sedimentation basin in the north and east edges (Figure 6l–o).
The comparison between numerical solutions concerning the reference and dredging scenarios highlighted that DRO and DRA dredging scenarios were not effective for sediment retaining because the results were similar to those obtained with the reference scenario. The DRD and DRE dredging scenarios, with dredged sediment volumes of Vdo = 1065 × 103 and 2925 × 103 m3, respectively, promoted a huge sediment retention inside the sedimentation basin and thus can avoid shoaling at the tidal inlet mouth.
Detailed analysis of these results revealed that the small sedimentation basins (DRO and DRA dredging scenarios) were only effective under low-energy wave conditions whereas, under high-energy wave conditions, few solutions corresponding to high volume of dredged sediment (DRD and DRE dredging scenarios) drive results that guarantee a safe navigation bed level at the tidal inlet mouth (z ≤ 9 m).

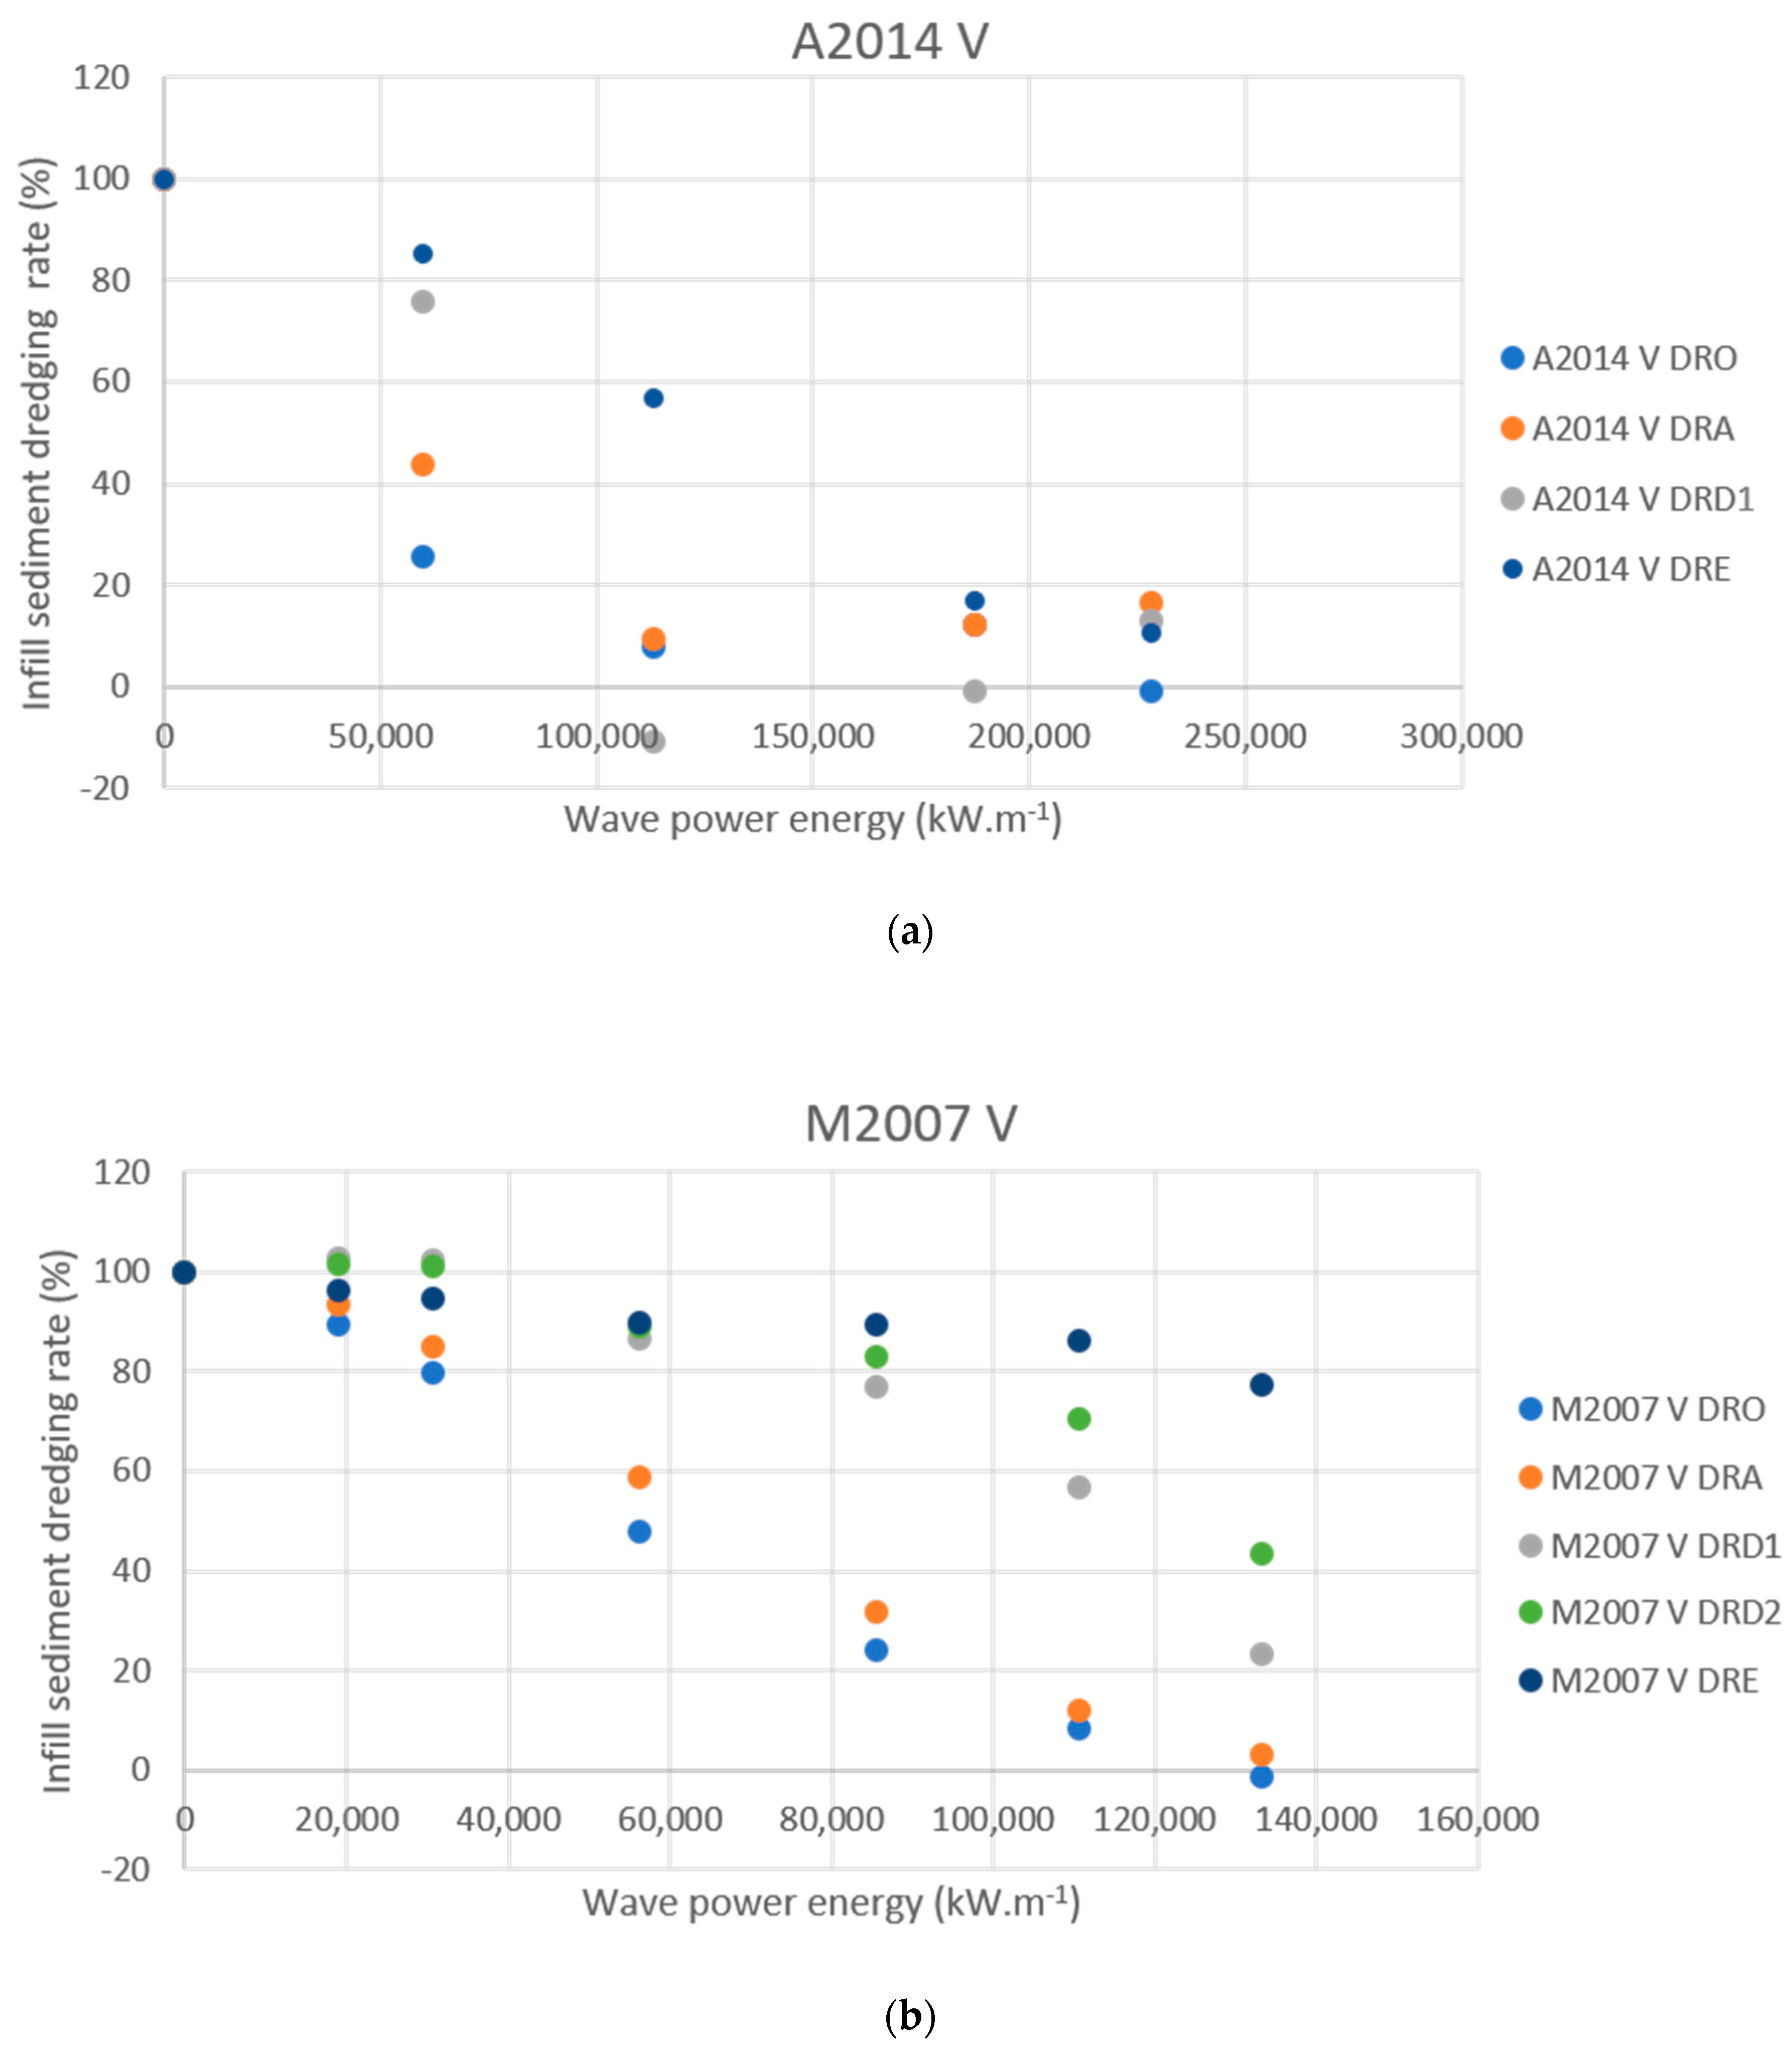
4.2. Dredging Scenarios Lifetime

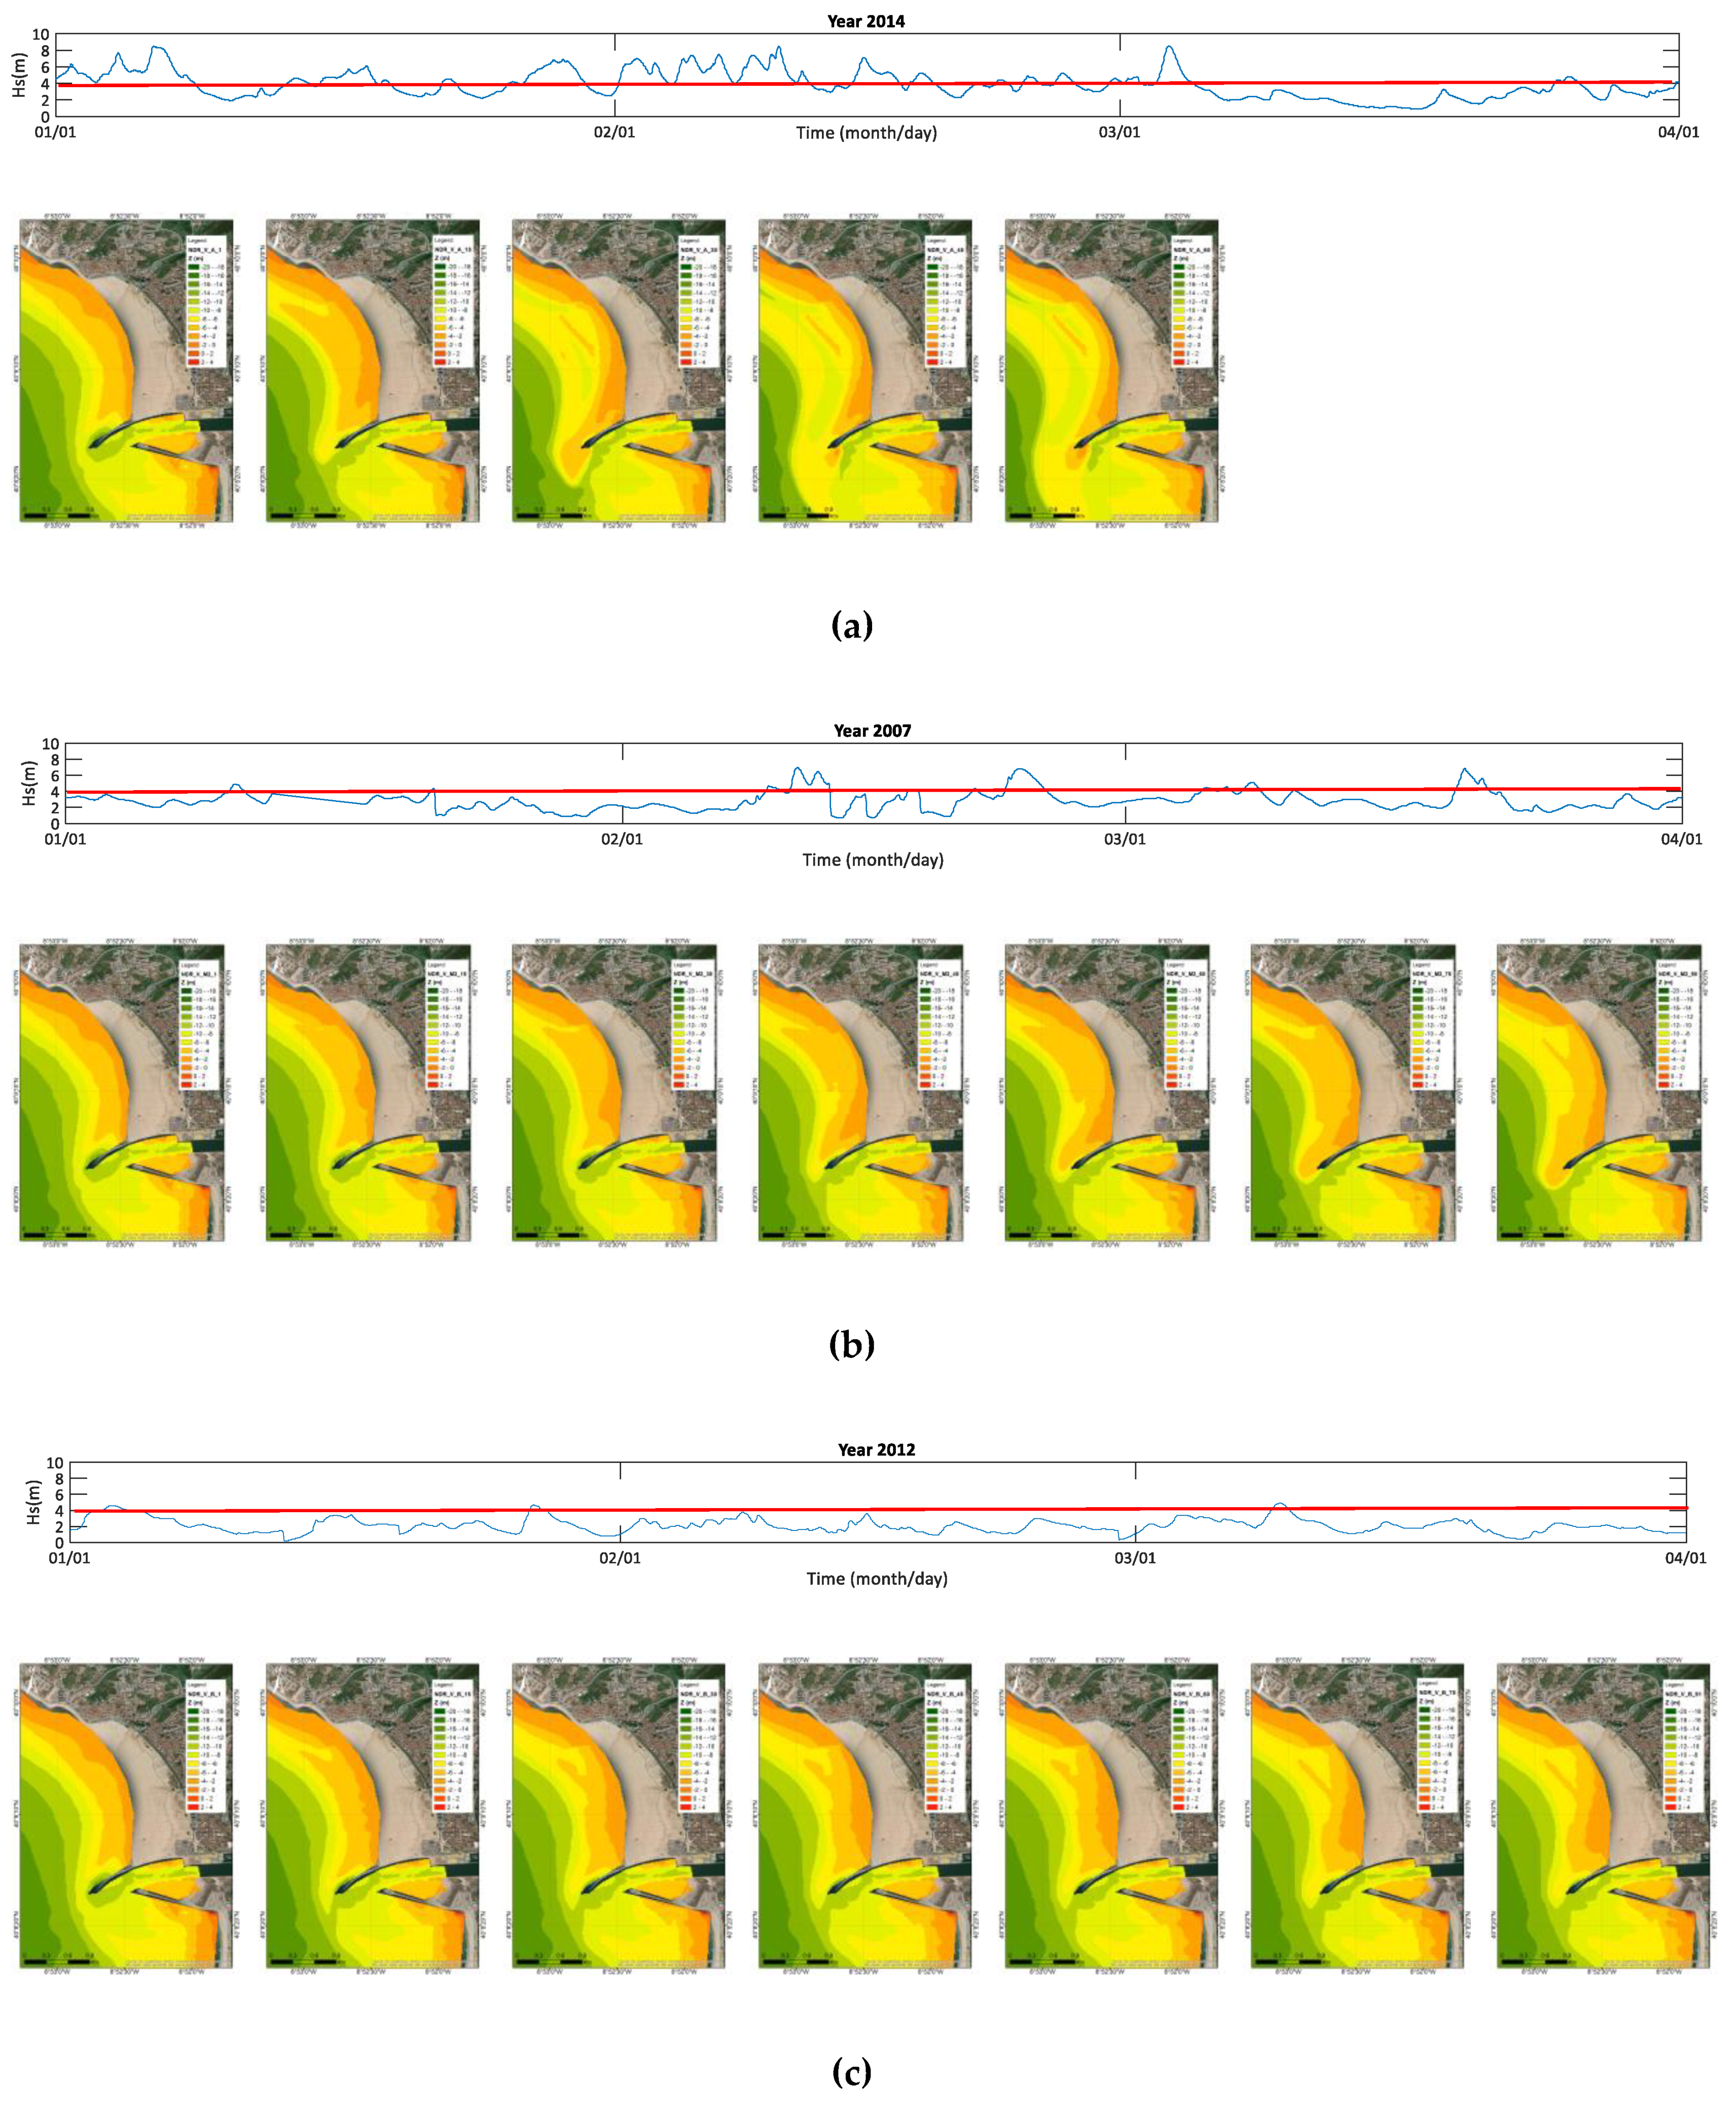
4.2.1. Dredging Scenarios Lifetime under Propagated Wave Climate

The evolution of the bathymetry in the dredged area was characterized from the accumulative sediment infill rate in the sedimentation basin. The sediment infill rate is an indicator of the dredging capacity to retain sediment and, thus, to avoid the development of a submerged sandbar at the inlet mouth. The sediment volume (Vd) in the dredged polygon was estimated for the three wave conditions and for each scenario every 15 days and these values were subtracted from the initial dredged volume (Vdo). Figure 7 represents the calculated sediment infill rate against wave energy power accumulated for each wave climate scenario. The negative values of ratio Vd/Vdo means the dredged area suffered accretion after silting dredged area. In other cases, after silting, there was erosion in response to wave climate conditions and values of ratio Vd/Vdo increased. These cases were not included in the present analysis.
The detailed analysis of the dredged area for the different scenarios studied revealed the effect of the area and the depth of the sedimentation basin in the percentage of the remaining volume at the dredging scenarios (Figure 7). It was verified for all wave conditions that small volume dredging operations such as DRO (Vdo = 155 × 103 m3) filled more quickly than high volume dredging operations such as DRE (Vdo = 2925 × 103 m3). Under the high-energy wave scenario (Figure 7a), DRO, DRA, and DRD completely filled after 30 days (wave energy power accumulated of 113,115 kW·m−1) whereas DRE filled after 60 days (wave energy power accumulated of 228,302 kW·m−1) (Figure 7a). Under the medium-energy wave scenario, DRO and DRA completely filled after 90 days (wave energy power accumulated of 133,360 kW·m−1) whereas DRD1, DRD2, and DRE had free 23%, 43%, and 77% of their capacity (Figure 7b). Under the low-energy wave scenario, no dredging scenario completely filled after 90 days (wave energy power accumulated of 74,629 kW·m−1) (Figure 7c).

4.2.2. Dredging Scenarios’ Lifetime under Wave Climate Conditions (1958–2017)

Knowledge of the lifetime of a dredging operation under current wave climate conditions is an important issue for stakeholders. Based on the wave climate data series (SIMAR 1042062 point (1958–2017)), the time, T*, needed to achieve the accumulated wave power energy that corresponds to 90% of infill, according to Figure 7, was computed for each year. The mean values and the percentiles of T* were computed and are presented in Figure 8 for each dredging scenario. Two periods to perform dredging operations were considered: one at the beginning of winter wave climate (1 October) and other at the end (1 April). The lifetime of dredging operations is more variable for big dredging scenarios (i.e., DRD2 and DRE). This lifetime depends on the period of year they are carried out and its configuration (i.e., dredged sediment volume). The mean lifetime decreased when the selected dredging period was at the beginning of the winter (Figure 8b) because high-energy wave conditions contribute more to sediment accretion inside sedimentation basin. This reduction was higher for small dredging scenarios (i.e., DRO and DRA) where the life diminished by half (100 days) whereas for the two big dredging scenarios (i.e., DRD2 and DRE), the life diminished from 325 to 225 days and from 900 to 800 days, respectively.

5. Discussion

The application of the Delft3D model on Figueira da Foz tidal inlet resulted in reasonable morphological predictions for both reference and dredging scenarios. The calibrated model [34] was able to reproduce the natural (i.e., no-dredging operations) evolution of the inlet concerning the submerged sandbar (Figure 4 and Figure 5a) and the respective infilling of the sedimentation basin after dredging operations (Figure S1). The suitability of this model for this kind of study has also been reported in other tidal inlets (e.g., in [14,19,20,49]).
Numerical modeling results disclosed differences in the bathymetry evolution of the dredged area and at the tidal mouth entrance (Figure 4, Figure 5 and Figure 6 and Figure S1) in response to the consideration of different wave climate conditions (low, medium, and high-wave energy) and distinct dredging scenarios (Vdo = 155 × 103 − 2925 × 103 m3).
The wave climate is responsible for morphological changes observed at the tidal inlet, particularly, during storm events. The biggest changes (Figure 4c) happened after extreme storm events, for instance, the unusual storm event of 1 February 2014 with PSI = 18,279 m2·h (Table 1). These results are consistent with other observational and modeling studies under storm conditions (e.g., in [3,50] and references therein). The maximum tidal current velocity values at Figueira da Foz inlet ranged from 0.8 to 1.2 m·s−1 for spring tides and from 0.4 to 0.7 m·s−1 for neap tides [51]. Previous work [51] revealed a decrease of the residual currents of about 10% between dredging and reference scenarios. The tidal current does not promote significant bathymetric changes at the inlet as it is observed during summer (i.e., under low-energy wave conditions) [32]. Therefore, the morphodynamic inlet evolution is determined essentially by waves that promote, along this coastal stretch, an estimated annual volume average of sediment transport of approximately 1 × 10⁶ m3·year−1 [25,26,27]. This value is higher than the tidal prism estimated for Mondego estuary (8.9 × 10⁵ m3). Consequently, this is a bypassing bar system according to the definition in [31].
The dredging operations modify sediment transport pathways [14,19,20,51]. Fernández-Fernández et al. [51] highlighted that total sediment transport fluxes decreased inside the dredged area, enhancing the accretion processes in this area. Therefore, the dredged area acts as a deposition basin. Furthermore, the dredging operations also have an impact on the hydrodynamic processes [51]. The dredging processes increases the depth in the dredged area due to the excavation, enhancing a decrease in wave height, orbital velocity, wave-induced currents, and tidal currents velocities [51].
The dredging scenarios investigated present a lifetime that is in accordance with prior field observations [32]. This fact is illustrated with the example of the infill sediment rate of the dredging operation performed in November 2016 (Vdo = 100 × 103 m3) (see DR_M polygon in Figure 1c) for 89 days (16 November, 2016 and 12 February, 2017) and it was estimated, based on bathymetry surveys, as 80% [32]. The mean wave energy power of this period was 45 kW·m−1, corresponding to a medium wave energy year, and the accumulated wave energy power was 128,000 kW·m−1. Furthermore, the selection of the period of the year to perform the dredging operations (i.e., period of low or high wave energies) appears to be crucial for their lifetime as highlighted by [20,32].

6. Conclusions

This research showed how a calibrated Delft3D model can reproduce sedimentation basin evolution and sediment infill in a high-energy coast. The studied place concerned the Figueira da Foz coastal system (W Portugal), where different dredging scenarios for a tidal inlet were assessed. In particular:
(1)
The response of the tidal inlet morphodynamic for three-month winter period under winter wave climate conditions after dredging operations was shown.
(2)
The results obtained under natural evolution (i.e., no-dredging operations) were compared with those of dredging operations. This disclosed that dredging operations slowed down the development of a submerged sandbar extending southwards from the head of the north jetty.
(3)
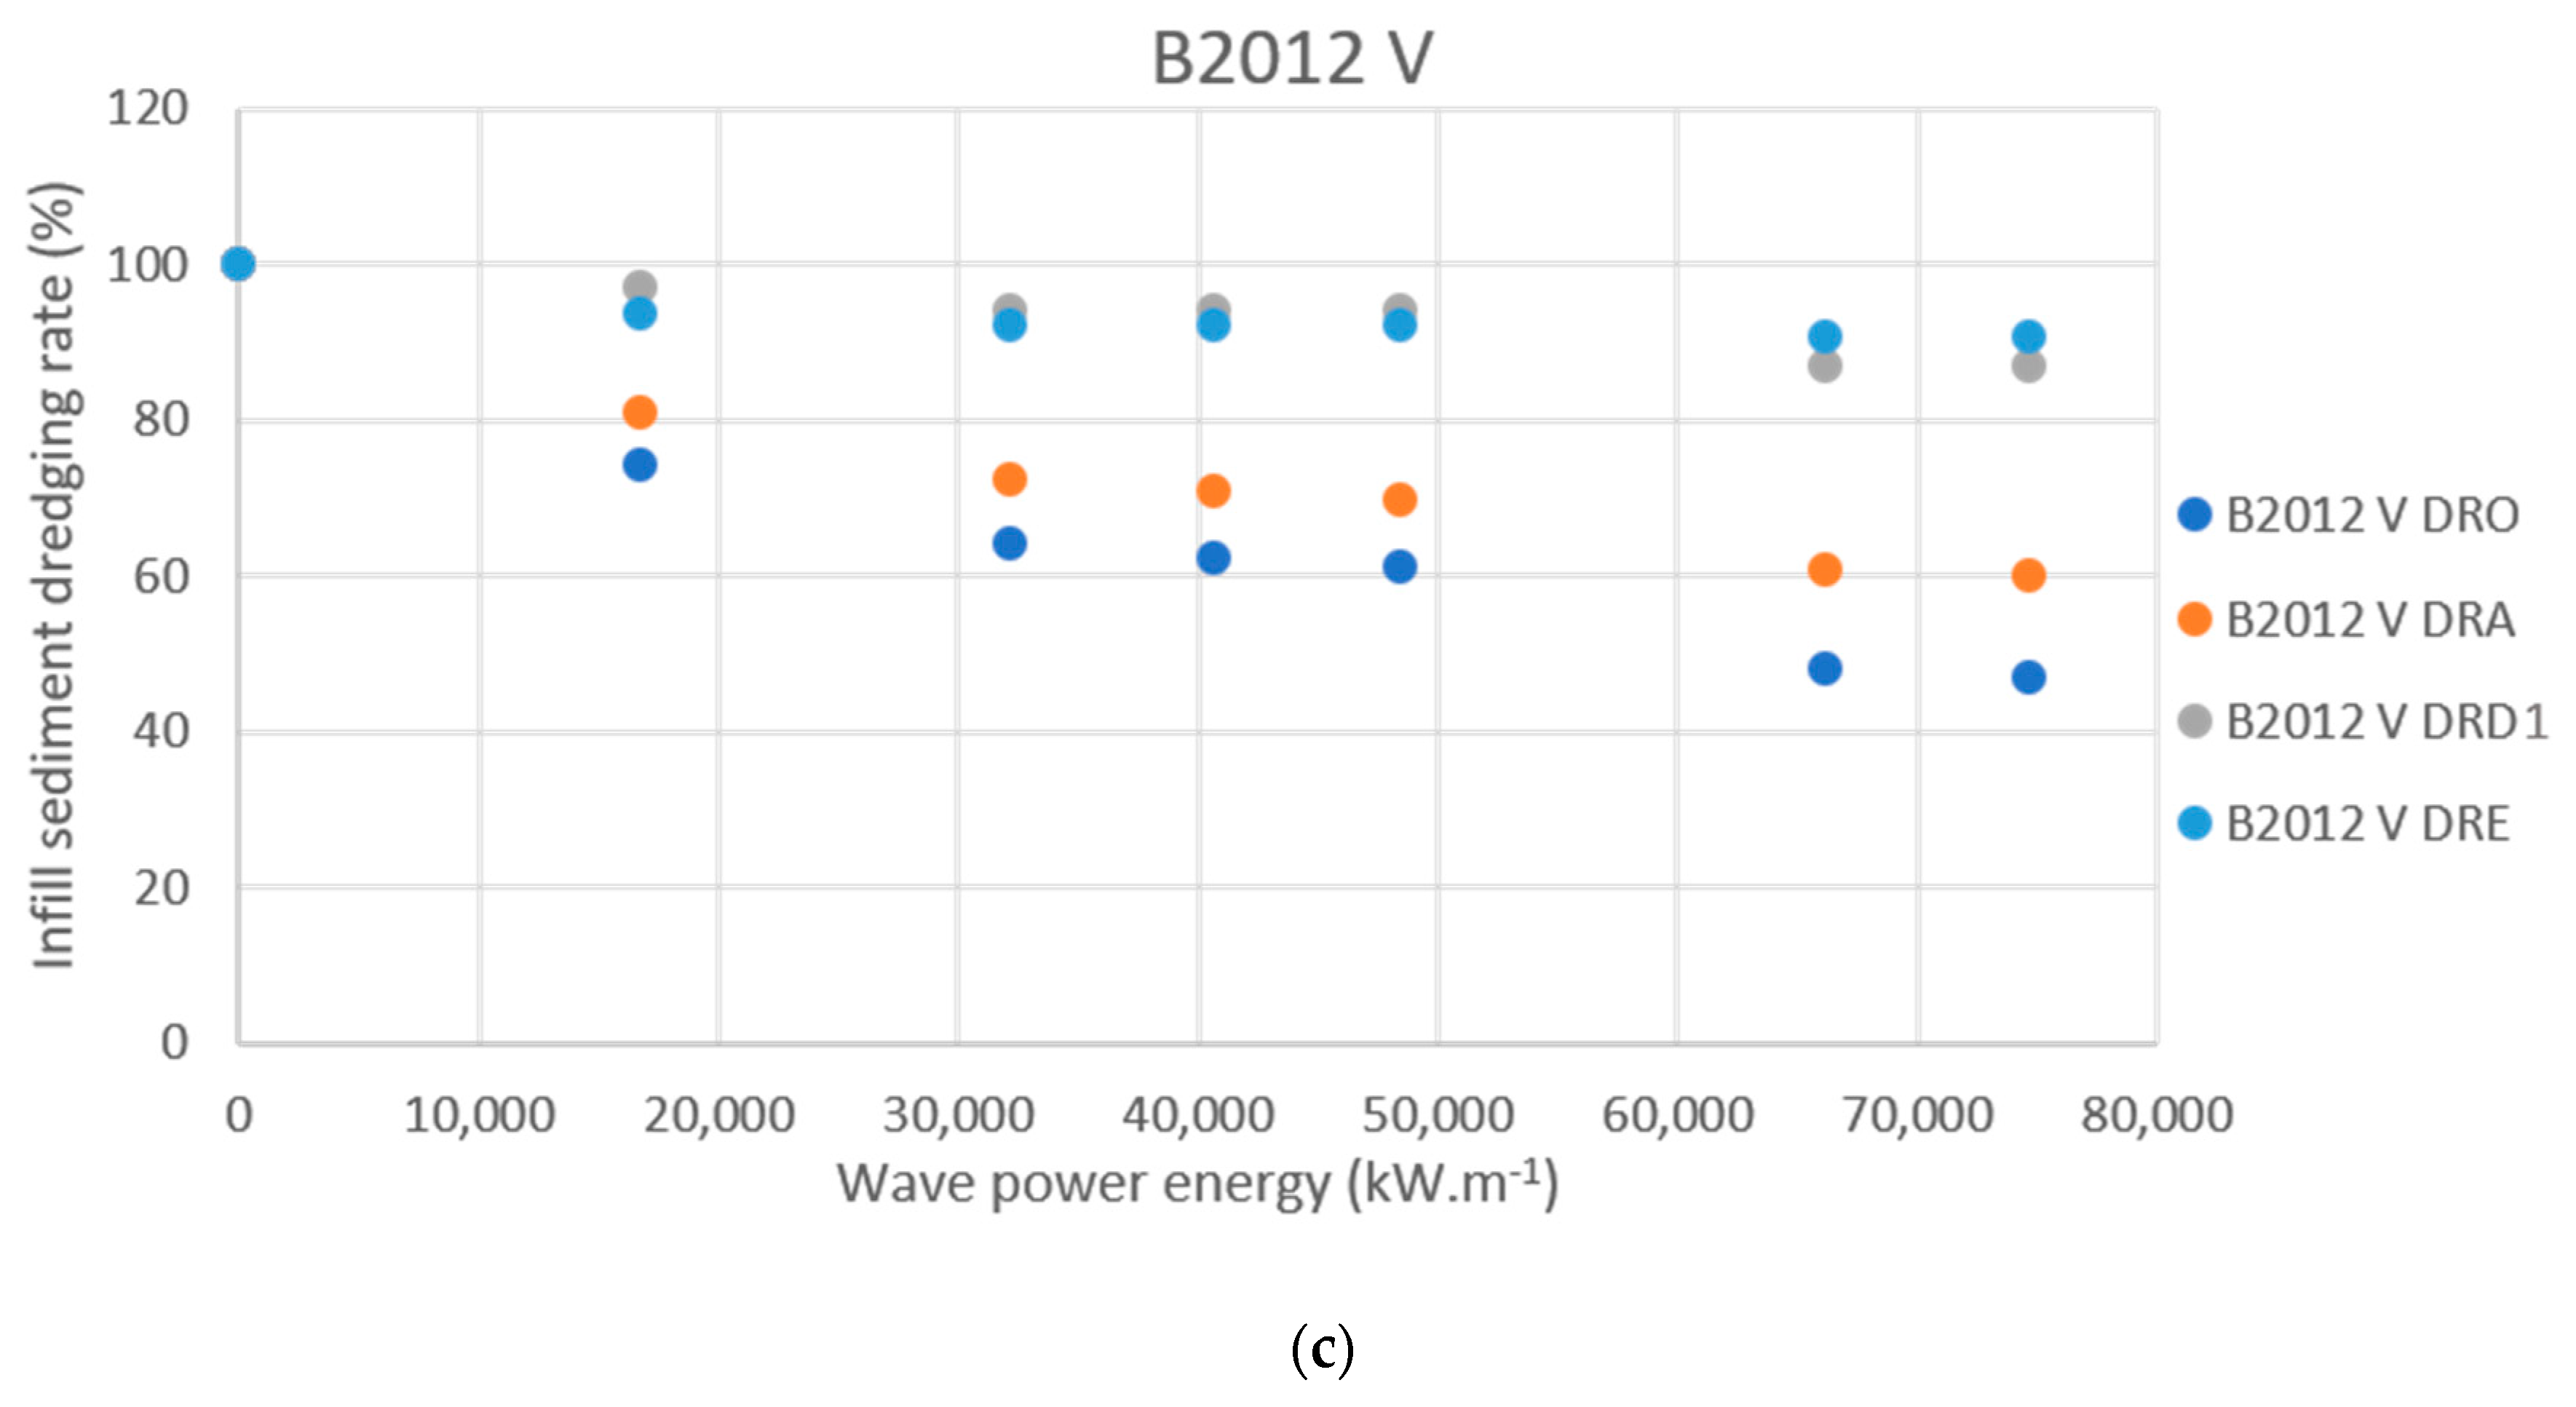
A better understanding of the underlying factors that play a role in the sediment infill of dredging operations at wave-dominated inlets was provided, revealing the link between sediment infill and wave climate conditions, as well as with sedimentation basin configuration.
(4)
The effectiveness of dredging configurations was assessed. This highlighted that dredging operations performing updrift of the tidal inlet prevent a quick shoaling at the tidal inlet mouth entrance that could promote safe navigation towards the inlet. Nevertheless, the dredging operation effectiveness depends on wave energy and sedimentation basin configuration (i.e., area and volume).
The methodological approach used for this study can be suitable for other high-energy coasts, helping stakeholders in the search of dredging scenarios, including the promotion of maritime safety.

Supplementary Materials

The following are available online at https://www.mdpi.com/2077-1312/7/11/395/s1, Figure S1: Significant wave height distribution over time with corresponding evolution of bathymetry of Dredge D_1 scenario depicted with an interval of 15 days for each wave climate scenario: (a) high-energy wave (2014), (b) medium-energy wave (2007), (c) low-energy wave (2012).

Author Contributions

Conceptualization, S.F.-F. and P.A.S.; methodology, S.F.-F., C.C.F., P.A.S. and T.A.; software, S.F.-F. and C.C.F.; validation, S.F.-F. and C.C.F.; formal analysis, S.F.-F. and P.A.S.; investigation, S.F.-F., C.C.F., P.A.S., P.B., S.R., Á.F.-B., T.A. and X.B.; resources, P.A.S.; writing—original draft preparation, S.F.-F.; writing—review and editing, S.F.-F., C.C.F., P.A.S., P.B., S.R., Á.F.-B., T.A. and X.B.; visualization, S.F.-F. and P.A.S.; supervision, P.A.S.; project administration, P.A.S.; funding acquisition, P.A.S.

Funding

This research was funded by APFF, SA—Figueira da Foz Port Administration in the framework of the project entitled: “Elaboration of the study of dredging and dumping scenarios at the mouth of the Figueira da Foz Harbour” and CESAM (UID/AMB/50017/2019) to FCT/MEC through national funds. S.F.-F. was funded by APFF, SA, grant number (BPD/DF/7559/2016), C.C.F. and S.R. were funded by Portuguese Foundation for Science and Technology, grant numbers (PD/BD/127993/2016 and SFRH/BD/129079/2017, respectively) and Á.F.-B. was funded by Galician Government (Spain), grant number (ED481B2016/141-0).

Acknowledgments

The authors gratefully acknowledge Américo S. Ribeiro and João M. Dias for their help in development of domain 3 numerical grid and calibration of Delft3D-FLOW; Ricardo Correia and Luis M. Pinheiro for the supply of bottom sediment thickness data; Pilar Gil for the provision of oceanographic data from Puertos del Estado (Spain); and Carlos Coelho for his support for funding acquisition. The authors also thank anonymous reviewers for their constructive comments.

Conflicts of Interest

The authors declare no conflict of interest. The funders had no role in the analyses, or interpretation of data; in the writing of the manuscript, or in the decision to publish the results.

References

  1. Hayes, M.O. General morphology and sediment patterns in tidal inlets. Sediment. Geol. 1980, 26, 139–156. [Google Scholar] [CrossRef]
  2. FitzGerald, D.M. Geological controls on tidal inlets. Shore Beach 2015, 83, 59–64. [Google Scholar]
  3. Bertin, X.; Fortunato, A.B.; Oliveira, A. A modeling-based analysis of processes driving wave-dominated inlets. Cont. Shelf Res. 2009, 29, 819–834. [Google Scholar] [CrossRef]
  4. Fortunato, A.B.; Nahon, A.; Dodet, G.; Pires, A.R.; Freitas, M.C.; Bruneau, N.; Azevedo, A.; Bertin, X.; Benavides, P.; Andrade, C.; et al. Morphological evolution of an ephemeral tidal inlet from opening to closure: The Albufeira inlet, Portugal. Cont. Shelf Res. 2014, 73, 49–63. [Google Scholar] [CrossRef]
  5. Karunarathna, H.; Horrillo-Caraballo, J.; Burningham, H.; Pan, S.; Reeve, D.E. Two-dimensional reduced-physics model to describe historic morphodynamic behaviour of na estuary inlet. Mar. Geol. 2016, 382, 200–209. [Google Scholar] [CrossRef]
  6. Doré, A.; Bonetton, P.; Marieu, V.; Garlain, T. Observation and numerical modeling of tidal dune dynamics. Ocean Dyn. 2018, 68, 589–602. [Google Scholar] [CrossRef]
  7. Kieslich, J.M. Tidal Inlet Response to Jetty Construction; Technical Report for US Army Engineer Waterways Experiment Station Hydraulics Laboratory; US Army Engineer Waterways Experiment Station Hydraulics Laboratory: Vicksburg, MS, USA, 1981. [Google Scholar]
  8. Angulo, R.J.; de Souza, M.C.; Lamour, M.R. Coastal erosion problems induced by dredging activities in the navigation channel of Paranaguá and São Francisco do Sul harbor, southern Brazil. J. Coast. Res. 2006, 39, 1801–1803. [Google Scholar]
  9. Pacheco, A.; Carrasco, A.R.; Vila-Concejo, A.; Ferreira, O.; Dias, J.A. Recent evolution of Faro channel and its association to dredging operations (Algarve, Portugal). J. Coast. Res. 2006, 39, 572–577. [Google Scholar]
  10. Castelle, B.; Turner, I.; Bertin, X.; Tomlinson, R. Beach nourishment at Coollangatta Bay (Australia) over the period 1987–2005: Impacts and lessons. Coast. Eng. 2009, 59, 940–950. [Google Scholar] [CrossRef]
  11. Dabees, M.; Moore, B.D. Evaluation of inlet management practices at navigation inlets in southwest Florida, USA. In Proceedings of the 32nd Conference on Coastal Engineering, Shanghai, China, 30 June–5 July 2010. [Google Scholar]
  12. Garel, E.; Sousa, C.; Ferreira, O.; Morales, J.A. Decadal morphological response of an ebb-tidal delta and down-drift beach to artificial breaching and inlet stabilisation. Geomorphology 2014, 216, 13–25. [Google Scholar] [CrossRef]
  13. Leys, V.; Lehmann, M. Multi-inlet migration modeling for navigation cannel management in Tubusintuc Bay, Eastern Canada. In Proceedings of the 35th Conference on Coastal Engineering, Antalya, Turkey, 17–20 November 2016; Lynett, P., Ed.; [Google Scholar] [CrossRef]
  14. Ramli, A.Y. The Impact of Dredging on the Stability of the Matakana Banks Ebb-Tidal Delta. Ph.D. Thesis, University of Waikato, Hamilton, New Zealand, 2016. [Google Scholar]
  15. Hayes, M.O.; FitzGerald, D.M. Origin, Evolution, and Classification of Tidal Inlets. J. Coast. Res. 2013, 69, 14–33. [Google Scholar] [CrossRef]
  16. Sennes, G.; Castelle, B.; Bertin, X.; Mirfenderesk, H.; Tomlinson, R.B. Modelling of the Gold Coast Seaway tidal inlet, Australia. J. Coast. Res. 2007, 50, 1086–1091. [Google Scholar]
  17. Logan, S.J.; Nistor, I.; Cornett, A.; Faure, T.; Drouin, A. Morphological modeling of highly dynamic tidal inlet at Shippagan Gully, Canada. In Proceedings of the 33th Conference on Coastal Engineering, Santander, Spain, 1–6 July 2012; Lynett, P., McKee Smith, J., Eds.; [Google Scholar] [CrossRef]
  18. Mendes, D.S.; Fortunato, A.B.; Pires-Silva, A.A. Assessment of three dredging plans for a wave-dominated inlet. Proc. Inst. Civil Eng. Mar. Eng. 2016, 169, 64–75. [Google Scholar] [CrossRef]
  19. Reyes-Merlo, M.A.; Ortega-Sánchez, M.; Díez-Minguito, M.; Losada, M.A. Efficient dredging strategy in a tidal inlet based on an energetic approach. Ocean Coast. Manag. 2017, 146, 157–169. [Google Scholar] [CrossRef]
  20. Shaeri, S.; Tomlinson, R.; Etemad-Shahidi, A.; Strauss, D. Numerical modelling to assess maintenance strategy management options for a small tidal inlet. Estuar. Coast. Shelf Sci. 2017, 187, 273–292. [Google Scholar] [CrossRef]
  21. Fairbridge, R.H. The estuary: Its definition and geodynamic cycle. In Chemistry and Biogeochemistry of Estuaries; Olausson, E., Cato, I., Eds.; Willey: New York, NY, USA, 1980; pp. 1–16. ISBN 978-047-12-7679-1. [Google Scholar]
  22. Cunha, P.P.; Dinis, J. Sedimentary dynamics of the Mondego estuary. In Aquatic Ecology of the Mondego River Basin: Global Importance of Local Experience; Graça, M.A., Pardal, M.A., Marques, J.C., Eds.; University of Coimbra Press: Coimbra, Portugal, 2002; pp. 43–63. ISBN 978-989-26-0336-0. [Google Scholar]
  23. Plecha, S.; Silva, P.A.; Oliveira, A.; Dias, J.M. Establishing the wave climate influence on the morphodynamics of a coastal lagoon inlet. Ocean Dyn. 2012, 62, 799–814. [Google Scholar] [CrossRef]
  24. Oliveira, T.C.A.; Neves, M.G.; Fidalgo, R.; Esteves, R. Variability of wave parameters and Hmax/Hs relationship under storm conditions offshore the Portuguese continental coast. Ocean Eng. 2018, 153, 10–22. [Google Scholar] [CrossRef]
  25. Larangeiro, S.H.C.D.; Oliveira, F.S.B.F.; Freire, P.M.S. Longshore sediment transport along a sandy coast with hard rock outcrops. Shore Beach 2003, 71, 20–24. [Google Scholar]
  26. Silva, A.N.; Taborda, R.; Bertin, X.; Dodet, G. Seasonal to Decadal Variability of Longshore Sand Transport at the Northwest Coast of Portugal. J. Waterw. Port. Coast. 2012, 138, 464–472. [Google Scholar] [CrossRef]
  27. Santos, F.D.; Lopes, A.M.; Moniz, G.; Ramos, L.; Taborda, R. Gestão da Zona Costeira: O Desafio da Mudança; Relatório do Grupo de Trabalho do Litoral: Lisbon, Portugal, 2014. [Google Scholar]
  28. Cunha, P.P.; Dinis, J. Beach erosion between cabo Mondego and Figueira da Foz (Portugal Midwest), from 1995 to 1998. Territorium 1998, 5, 31–50. [Google Scholar] [CrossRef]
  29. Cunha, P.P.; Pinto, J.; Dinis, J.L. Evolução da fisiografia e ocupação antrópica na área estuarina do Rio Mondego e região envolvente (Portugal centro-oeste), desde 1947. Territorium 1997, 4, 99–124. [Google Scholar] [CrossRef]
  30. IPTM-Instituto Portuário e dos Transportes Marítimos; I.P.; Prolongamento do Molhe Norte do Porto da Figueira da Foz: Relatório, Portugal, 2011.
  31. Kraus, N.C. Reservoir Model for Calculating Natural Sand Bypassing and Change in Volume of Ebb-Tidal Shoals. In Part I: Description (ERDC/CHL CHETN-IV-39); Report; US Army Corps of Engineers, Engineer Research and Development Center, Coastal and Hydraulics Laboratory: Vicksburg, MS, USA, 2002. [Google Scholar]
  32. Romão, S.; Silva, P.A.; Baptista, P.; Fontán-Bouzas, A.; Fernández-Fernández, S.; Ferreira, C.; Bernardes, C.; Coelho, C.; Garrido, C.; Rua, J. Efeito da agitação marítima na morfologia de uma embocadura sujeita a dragagens. In Dragagens: Questões Ambientais e Monitorização, 1st ed.; Coelho, C., Silva, P.A., Pinheiro, L.M., Gonçalves, D.S., Eds.; University of Aveiro Press: Aveiro, Portugal, 2018; pp. 111–118. ISBN 978-972-789-535-9. [Google Scholar]
  33. Lesser, G.R.; Roelvink, J.A.; van Kester, J.A.T.M.; Stelling, G.S. Development and validation of a three-dimensional morphological model. Coast. Eng. 2004, 51, 883–915. [Google Scholar] [CrossRef]
  34. Ferreira, C.; Silva, P.A.; Fernández-Fernández, S.; Ribeiro, A.S.; Abreu, T.; Bertin, X.; Dias, J.M.D. Validation of a morphodynamic model to Figueira da Foz inlet. In Proceedings of the International Short Course and Conference on Applied Coastal Research-SCACR, Santander, Spain, 3–6 October 2017; Losada, I.J., Lara, J.L., Tomasichio, G.R., D’Alessandro, F., Eds.; pp. 1–12. [Google Scholar]
  35. Bertin, X.; Prouteau, E.; Letetrel, C. A significant increase in wave height in the North Atlantic Ocean over the 20th century. Glob. Planet. Chang. 2013, 106, 77–83. [Google Scholar] [CrossRef]
  36. Barstow, S.F.; Haug, O. Wave Data Collection on the Coast of Portugal in the MAST WAVEMOD Project; Technical Report for OCEANOR; OCEANOR: Trondheim, Norway, 1994. [Google Scholar]
  37. Mentaschi, L.; Besio, G.; Cassola, F.; Mazzino, A. Problems in RMSE-based wave model validations. Ocean Model. 2013, 72, 53–58. [Google Scholar] [CrossRef]
  38. Hanna, S.; Heinold, D. Development and Application of a Simple Method for Evaluating Air Quality; No. 4409; API Pub.: Philadelphia, PA, USA, 1985. [Google Scholar]
  39. Bijker, E.W. Longshore transport computations. J. Waterw. Harb. Coast. Eng. 1971, 97, 687–701. [Google Scholar]
  40. Soulsby, R. Dynamics of Marine Sands, a Manual for Practical Applications; Thomas Telford: London, UK, 1997; ISBN 072772584X. [Google Scholar]
  41. Van Rijn, L. Principles of Sediment Transport in Rivers, Estuaries and Coastal Seas; Aqua Publications: Amsterdam, The Netherlands, 1993; ISBN 90-800356-2-9. [Google Scholar]
  42. Van Rijn, L.C.; Walstra, D.J.R.; van Ormondt, M. Description of TRANSPOR2004 and Implementation in Delft3D-ONLINE; Technical Report for Delft Hydraulics; Delft Hydraulics: Delft, The Netherlands, 2004; pp. 237–239. [Google Scholar]
  43. Walstra, D.J.R.; van Ormondt, M.; Roelvink, J.A.; van Rijn, L.C. Shoreface Nourishment Scenarios: Detailed Morphodynamic Simulations with Delft3D for Various Shoreface Nourishment Designs; Technical Report for Delft Hydraulics; Delft Hydraulics: Delft, The Netherlands, 2004. [Google Scholar]
  44. Sutherland, J.; Peet, A.H.; Soulsby, R.L. Evaluating the performance of morphological models. Coast. Eng. 2004, 51, 917–939. [Google Scholar] [CrossRef]
  45. Seabergh, W.C. Weir Jetties at Coastal Inlets: Part 1, Functional Design Considerations (ERDC/CHL CHETN-IV-53); US Army Corps of Engineers, Engineer Research and Development Center, Coastal and Hydraulics Laboratory: Vickburg, MS, USA, 2002. [Google Scholar]
  46. Spanish National Harbour Authority. Conjunto de Datos SIMAR; Technical Report for Puertos del Estado; Puertos del Estado: Madrid, Spain, 2015; Available online: http://calipso.puertos.es//BD/informes/INT_8.pdf (accessed on 11 October 2019).
  47. Cahill, B.; Lewis, T. Wave period ratios and the calculation of wave power. In Proceedings of the 2nd Marine Energy Technology Symposium-METS2014, Seattle, WA, USA, 15–17 April 2014. [Google Scholar]
  48. Dolan, R.; Davies, R.E. Coastal storm hazards. J. Coast. Res. 1994, 12, 103–114. [Google Scholar]
  49. Herrling, G.; Winter, C. Tidal inlet sediment bypassing at mixed-energy barrier islands. Coast. Eng. 2018, 140, 342–354. [Google Scholar] [CrossRef]
  50. Hopkins, J.; Elgar, S.; Raubenheimer, B. Storm impact on morphological evolution of a sandy inlet. J. Geophys. Res. Oceans 2018, 123, 5751–5762. [Google Scholar] [CrossRef]
  51. Fernández-Fernández, S.; Silva, P.A.; Ferreira, C.; Ribeiro, A.S.; Abreu, T.; Romão, S.; Baptista, P.; Fontán-Bouzas, A.; Dias, J.M.; Coelho, C.; et al. Assessment of dredging/dumping scenarios for Figueira da Foz coastal region (W Portugal). J. Coast. Res. 2018, 85, 1266–1270. [Google Scholar] [CrossRef]
Figure 1. Study area map: (a) Europe—Figueira Foz, (b) Figueira Foz coastal system, (c) bathymetry of 2015 at Figueira da Foz tidal inlet. The polygons show the areas where dredging operations are normally performed.
Jmse 07 00395 g001
Figure 2. (a) Numerical grids: domain 1, domain 2, and domain 3 including position of buoys and stations whose data were used to validate model; (b) reference numerical bathymetry (domain 3: Figueira da Foz—Cova Gala) including polygons of dredging scenarios.
Jmse 07 00395 g002
Figure 3. Bathymetry differences between November 2016 and December 2016: (a) observed, (b) modeled with the Soulsby-Van Rijn sediment transport equation, (c) modeled with Van Rijn sediment transport equation. Note: the polygon with grey border corresponds to the dredged area in November 2016.
Jmse 07 00395 g003
Figure 4. Evolution of bathymetry in the reference scenario depicted with an interval of 15 days for each wave climate scenario: (a) high-energy wave (2014), (b) medium-energy wave (2007), (c) low-energy wave (2012). Note: significant wave height distribution offshore over time is included with a red line that represents the storm threshold (i.e., Hs > 4 m).
Jmse 07 00395 g004
Figure 5. Evolution of bathymetry profile at the tidal inlet mouth depicted with an interval of 15 days under the wave climate scenario of high-energy wave (2014) for (a) reference scenario, (b) DRO dredging scenario, (c) DRE dredging scenario.
Jmse 07 00395 g005
Figure 6. Bathymetry differences after the three-month period of simulation for the reference (NDR) and all dredging scenarios (DRO, DRA, DRD_1, DRD_2 and DRE) under all wave climate scenarios: (ae) high-energy wave 2014, (fj) medium-energy wave 2007, and (ko) low-energy wave 2012.
Jmse 07 00395 g006aJmse 07 00395 g006b
Figure 7. Remaining sediment volume in the sedimentation basin based on wave energy power accumulated during the simulation period for each dredging scenario under different wave climate scenarios: (a) high-energy wave (A2014), (b) medium-energy wave (M2007), (c) low-energy wave (B2012). The results are depicted with an interval of 15 days.
Jmse 07 00395 g007aJmse 07 00395 g007b
Figure 8. Lifetime of dredging scenarios when operations are performed in (a) April and (b) October.
Jmse 07 00395 g008
Table 1. Characteristics of storm events identified in the wave climate selected: date (year, day, and month), duration, power storm index (PSI), maxima significant wave height (Hsmax) with peak wave period (Tp) and wave direction (Dir) associated (0° corresponds to North).
YearDayMonthDuration (h)PSI (m2·h)Hsmax (m)Tp (s)Dir (°)
200710January204804.916.4282
9February235084.713.1295
10February5325977.017.6295
22February5625896.817.4287
5March418684.614.0293
7March256505.113.3313
19March4722386.915.7341
20122January326774.617.1312
26January235084.714.6334
8March245764.918.8323
201413January275714.613.8298
15January7427546.114.6297
19January122324.412.1315
22January173444.514.7320
26January10248566.916.1315
1February253182798.514.3286
14February6331767.114.8285
17February318385.215.7292
22February163104.414.9307
23February225284.915.4267
25February277305.214.8301
28February429684.814.0304
3March4834688.516.2311
25March337604.813.3315
31March163694.810.9218
Table 2. Simulations performed to dredging scenarios during January, February, and March of representative winter wave climate: high-energy wave (2014), medium-energy wave (2007), and low-energy wave (2012). Note: N.P. not performed.
Winter Climate ScenariosHigh (2014)Medium (2007)Low (2012)
Coastal Dredging ScenariosReference (NDR)xxx
Dredge_O (DRO)xxx
Dredge_A (DRA)xxx
Dredge_D_1 (DRD1)xxx
Dredge_D_2 (DRD2)N.P.xN.P.
Dredge_E (DRE)xxx

