2.1. Single Monitoring Point Risk Ratio Function
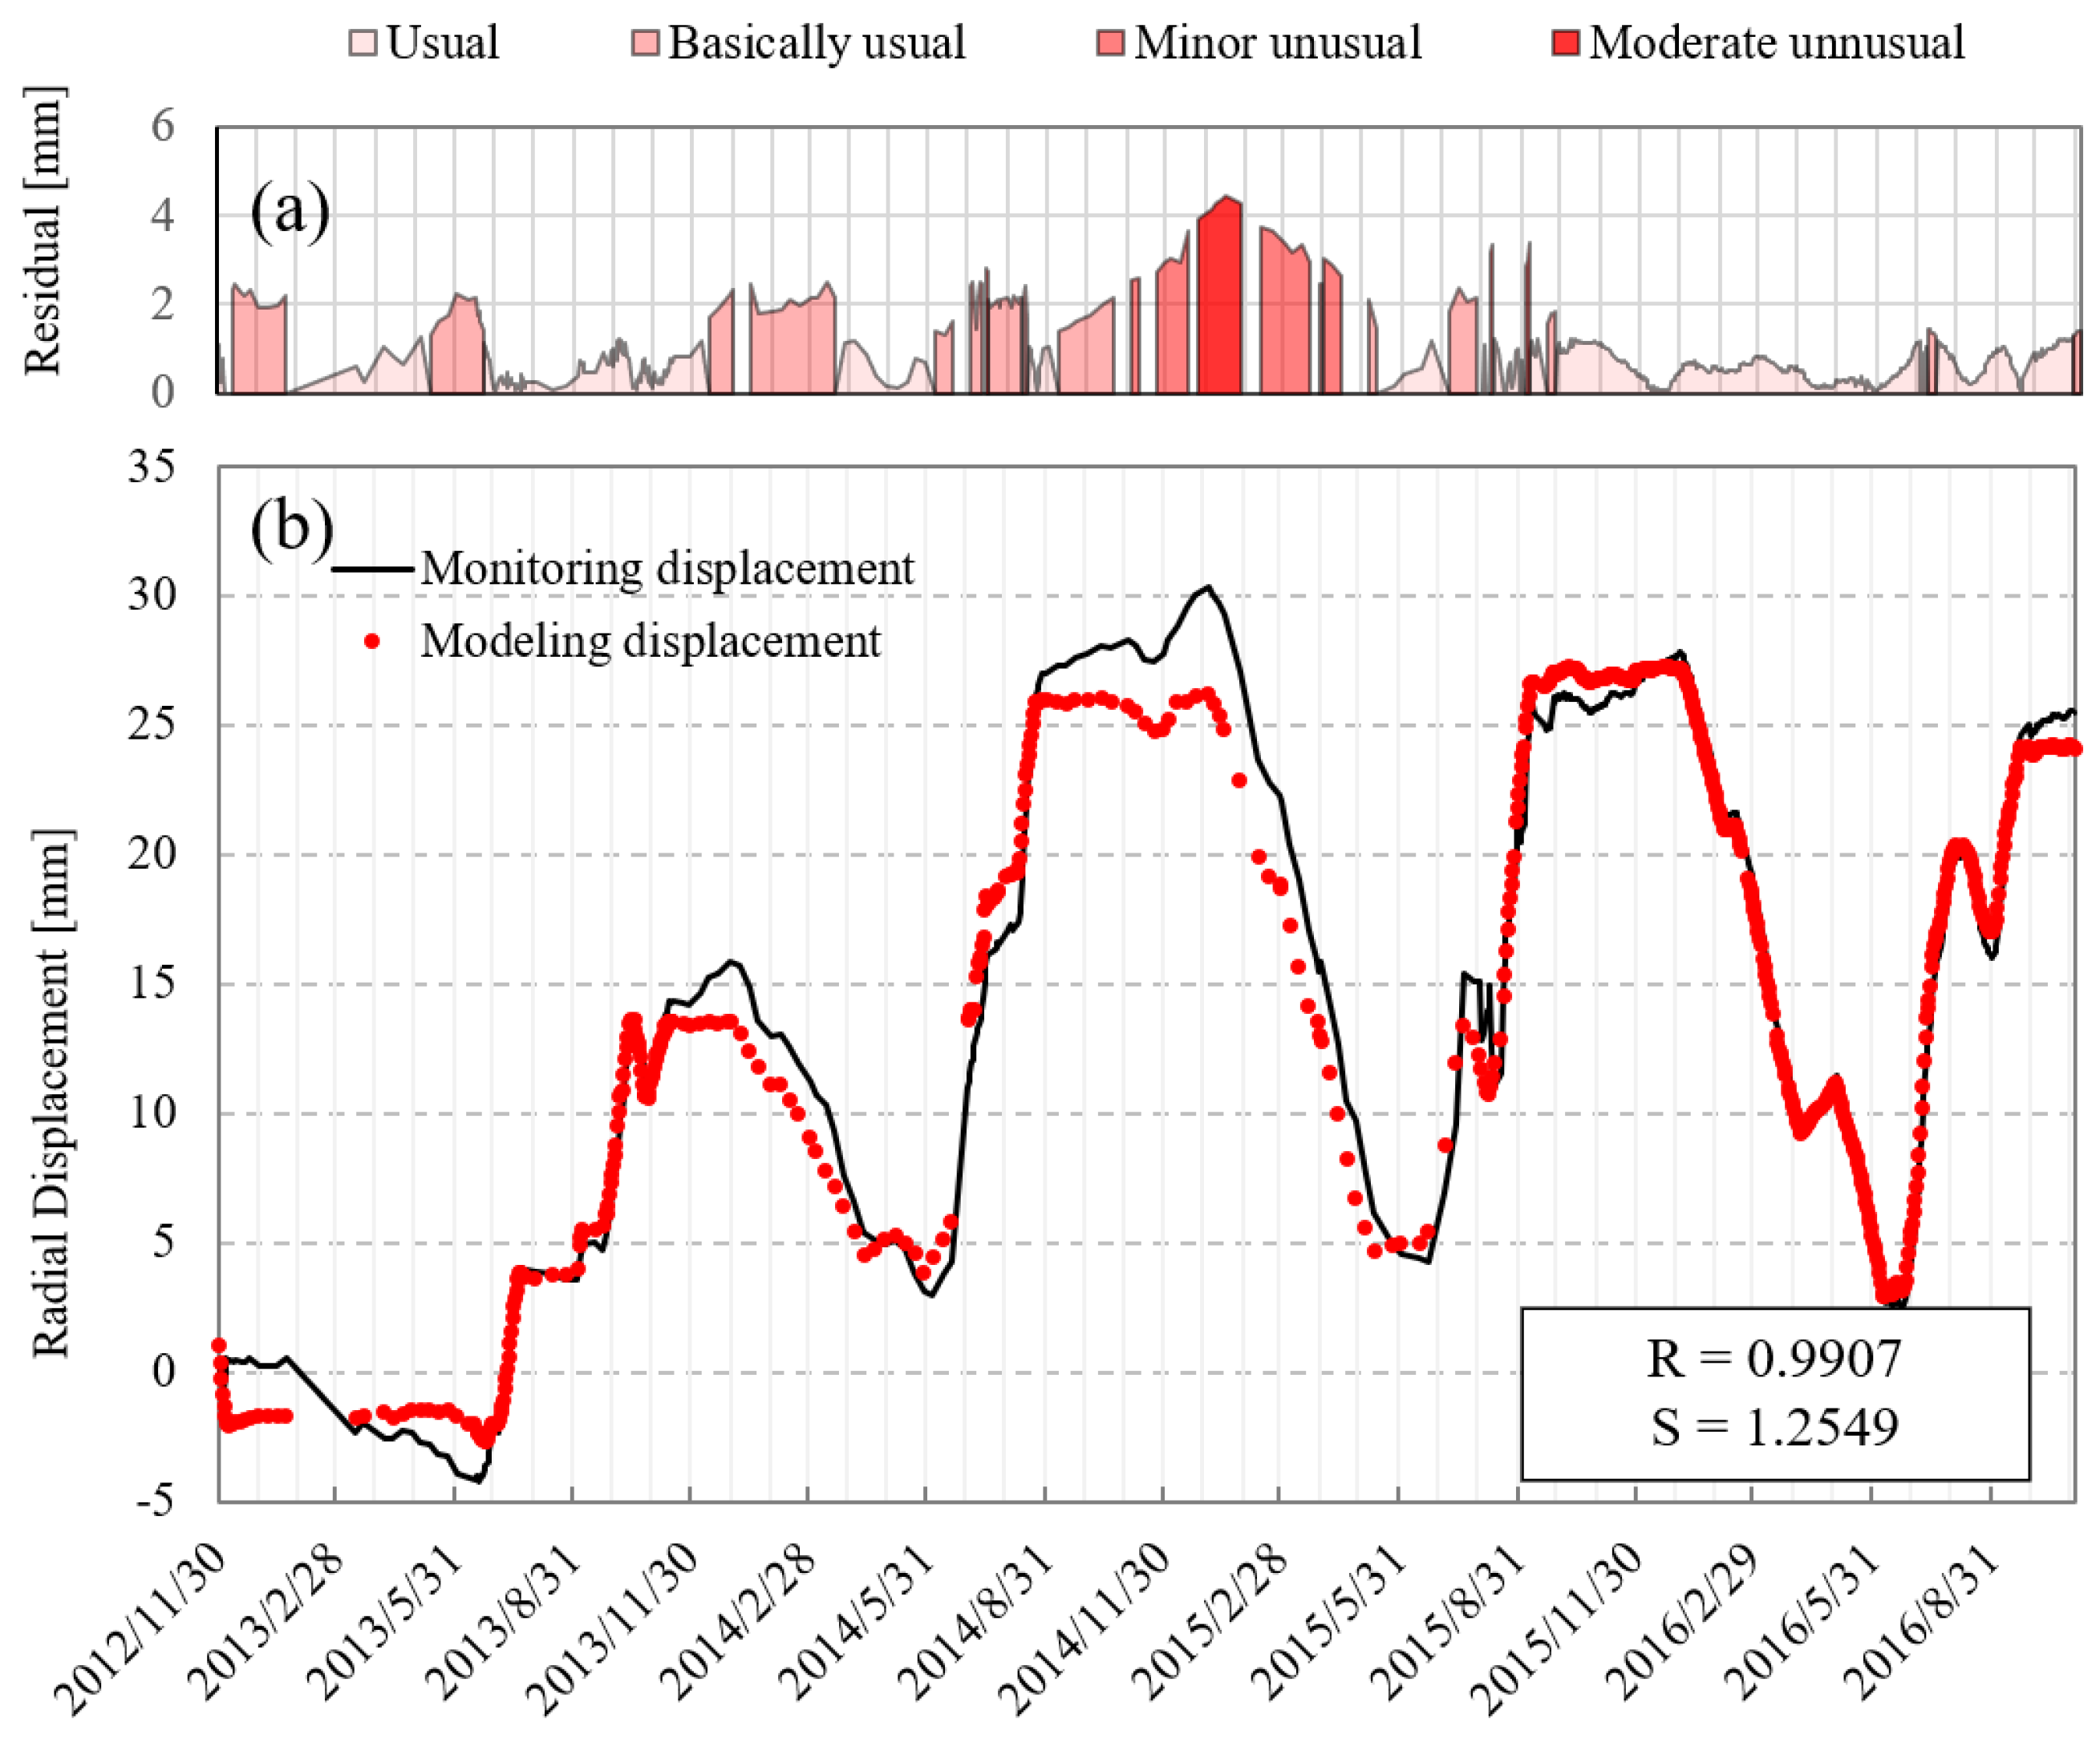
Monitored displacement data reflect a dam’s real-time structural behaviour and can be easily acquired, benefiting from the widely installed monitoring instruments inside the dam. Modelled displacement data, which are estimated from related parameters of the external environment (e.g., upstream water level, temperature), imply the theoretical dam displacement. To assess the dam risk, we established a risk ratio function based on the distribution of residual between the monitored and modelled displacement data. For an arch concrete dam (e.g., the selected dam in the present study), the radial displacement is commonly used to evaluate the risk to dam safety.
A statistical model is commonly used to obtain the radial modelled displacement data
. In the statistical model, the dam’s radial displacement consists of three components—a water pressure component
, a temperature component
and an aging component
. The modelled displacement data
can be expressed as:
The water pressure component
is the sum of the displacement of the dam body itself
, the dam foundation
and the dam bedrock’s rotational displacement
under the upstream water load.
,
and
are as functions of the upstream water level
H.
,
and
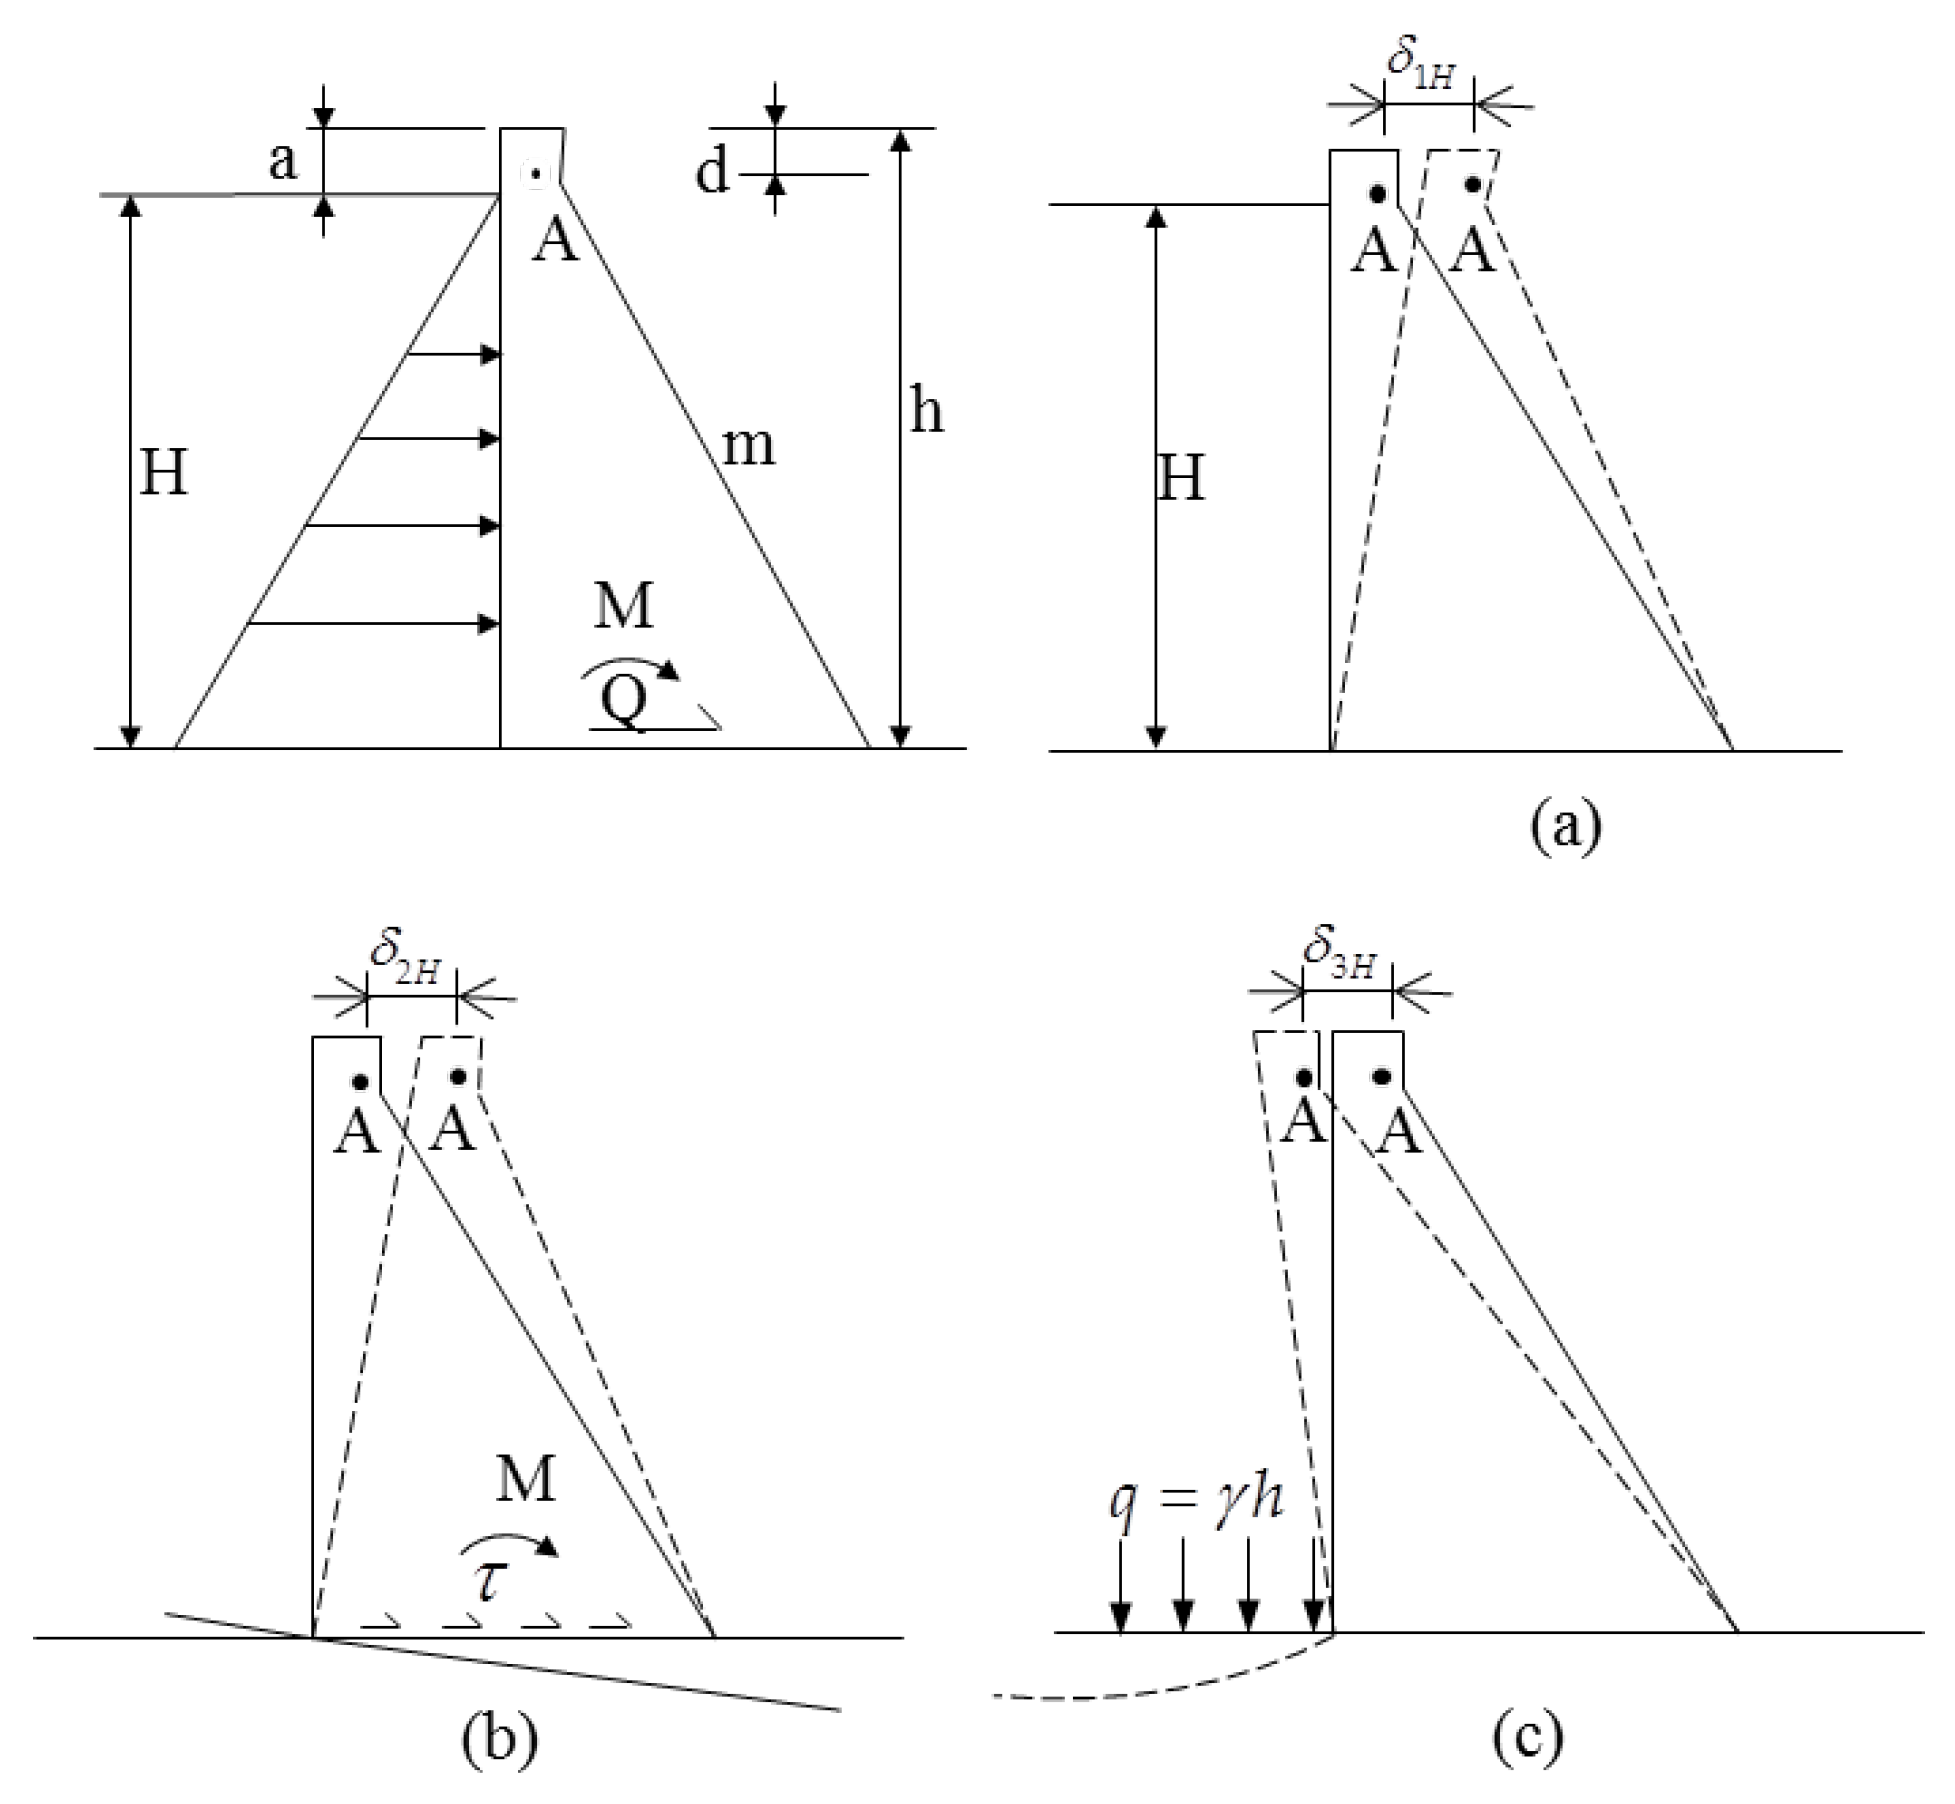
are obtained on the basis of engineering mechanics, which simplifies the gravity dam as a beam structure and the arch dam as an arch shape beam structure.
Figure 1 shows a stretch of dam displacement due to water pressure
.
Taking the gravity dam as an example,
Then, for the gravity dam,
is written as:
For the arch dam, owing to its more complicated structure,
is a polynomial function at least of third order:
The coefficients are related to the dam height h, downstream slope angle m, the distance from the monitoring point to the dam foundation d and the material parameters including the elastic modulus of the dam body , Poisson’s ratio of the dam body , elastic modulus of the foundation and Poisson’s ratio of the foundation .
The temperature component
is the displacement mainly resulting from internal temperature variation. When the internal monitored temperature data is lacking, researchers often apply a trigonometric function to describe
.
where
and
t is the number of days from the beginning of the monitoring sequence,
and
are pending coefficients. Equation (
8) is used to describe the temperature effect with one-year or six-month periodicity.
The aging component
characterizes the irreversible displacement caused by the factors such as creep and fatigue of concrete. Due to the difficulties of expressing
theoretically, we provide a formula considering time as a variable to describe its tendency.
where
is a parameter related to the time of the observation date
t and the time of the initial date
, which can be expressed as
;
and
are pending coefficients.
Then, the statistical model used to model the dam’s displacement can be written as:
where n = 3 for gravity dam and n ≥ 4 for arch dam;
are pending coefficients in the water pressure component
,
and
are pending coefficients in the temperature component
and
are pending coefficients in the aging component
, which can be estimated by Ordinary Least Squares regression with monitored displacement data
as test sets. After coefficients are determined, with input sets of upstream water level
H and number of days from the beginning of monitoring sequence
t, the modelled displacement
can be calculated.
In practical engineering, the occurrence probability of the event—that the monitored displacement data
has a large deviation from the modelled displacement data
—is fairly low. We adopted the occurrence probability of the absolute residual between
and
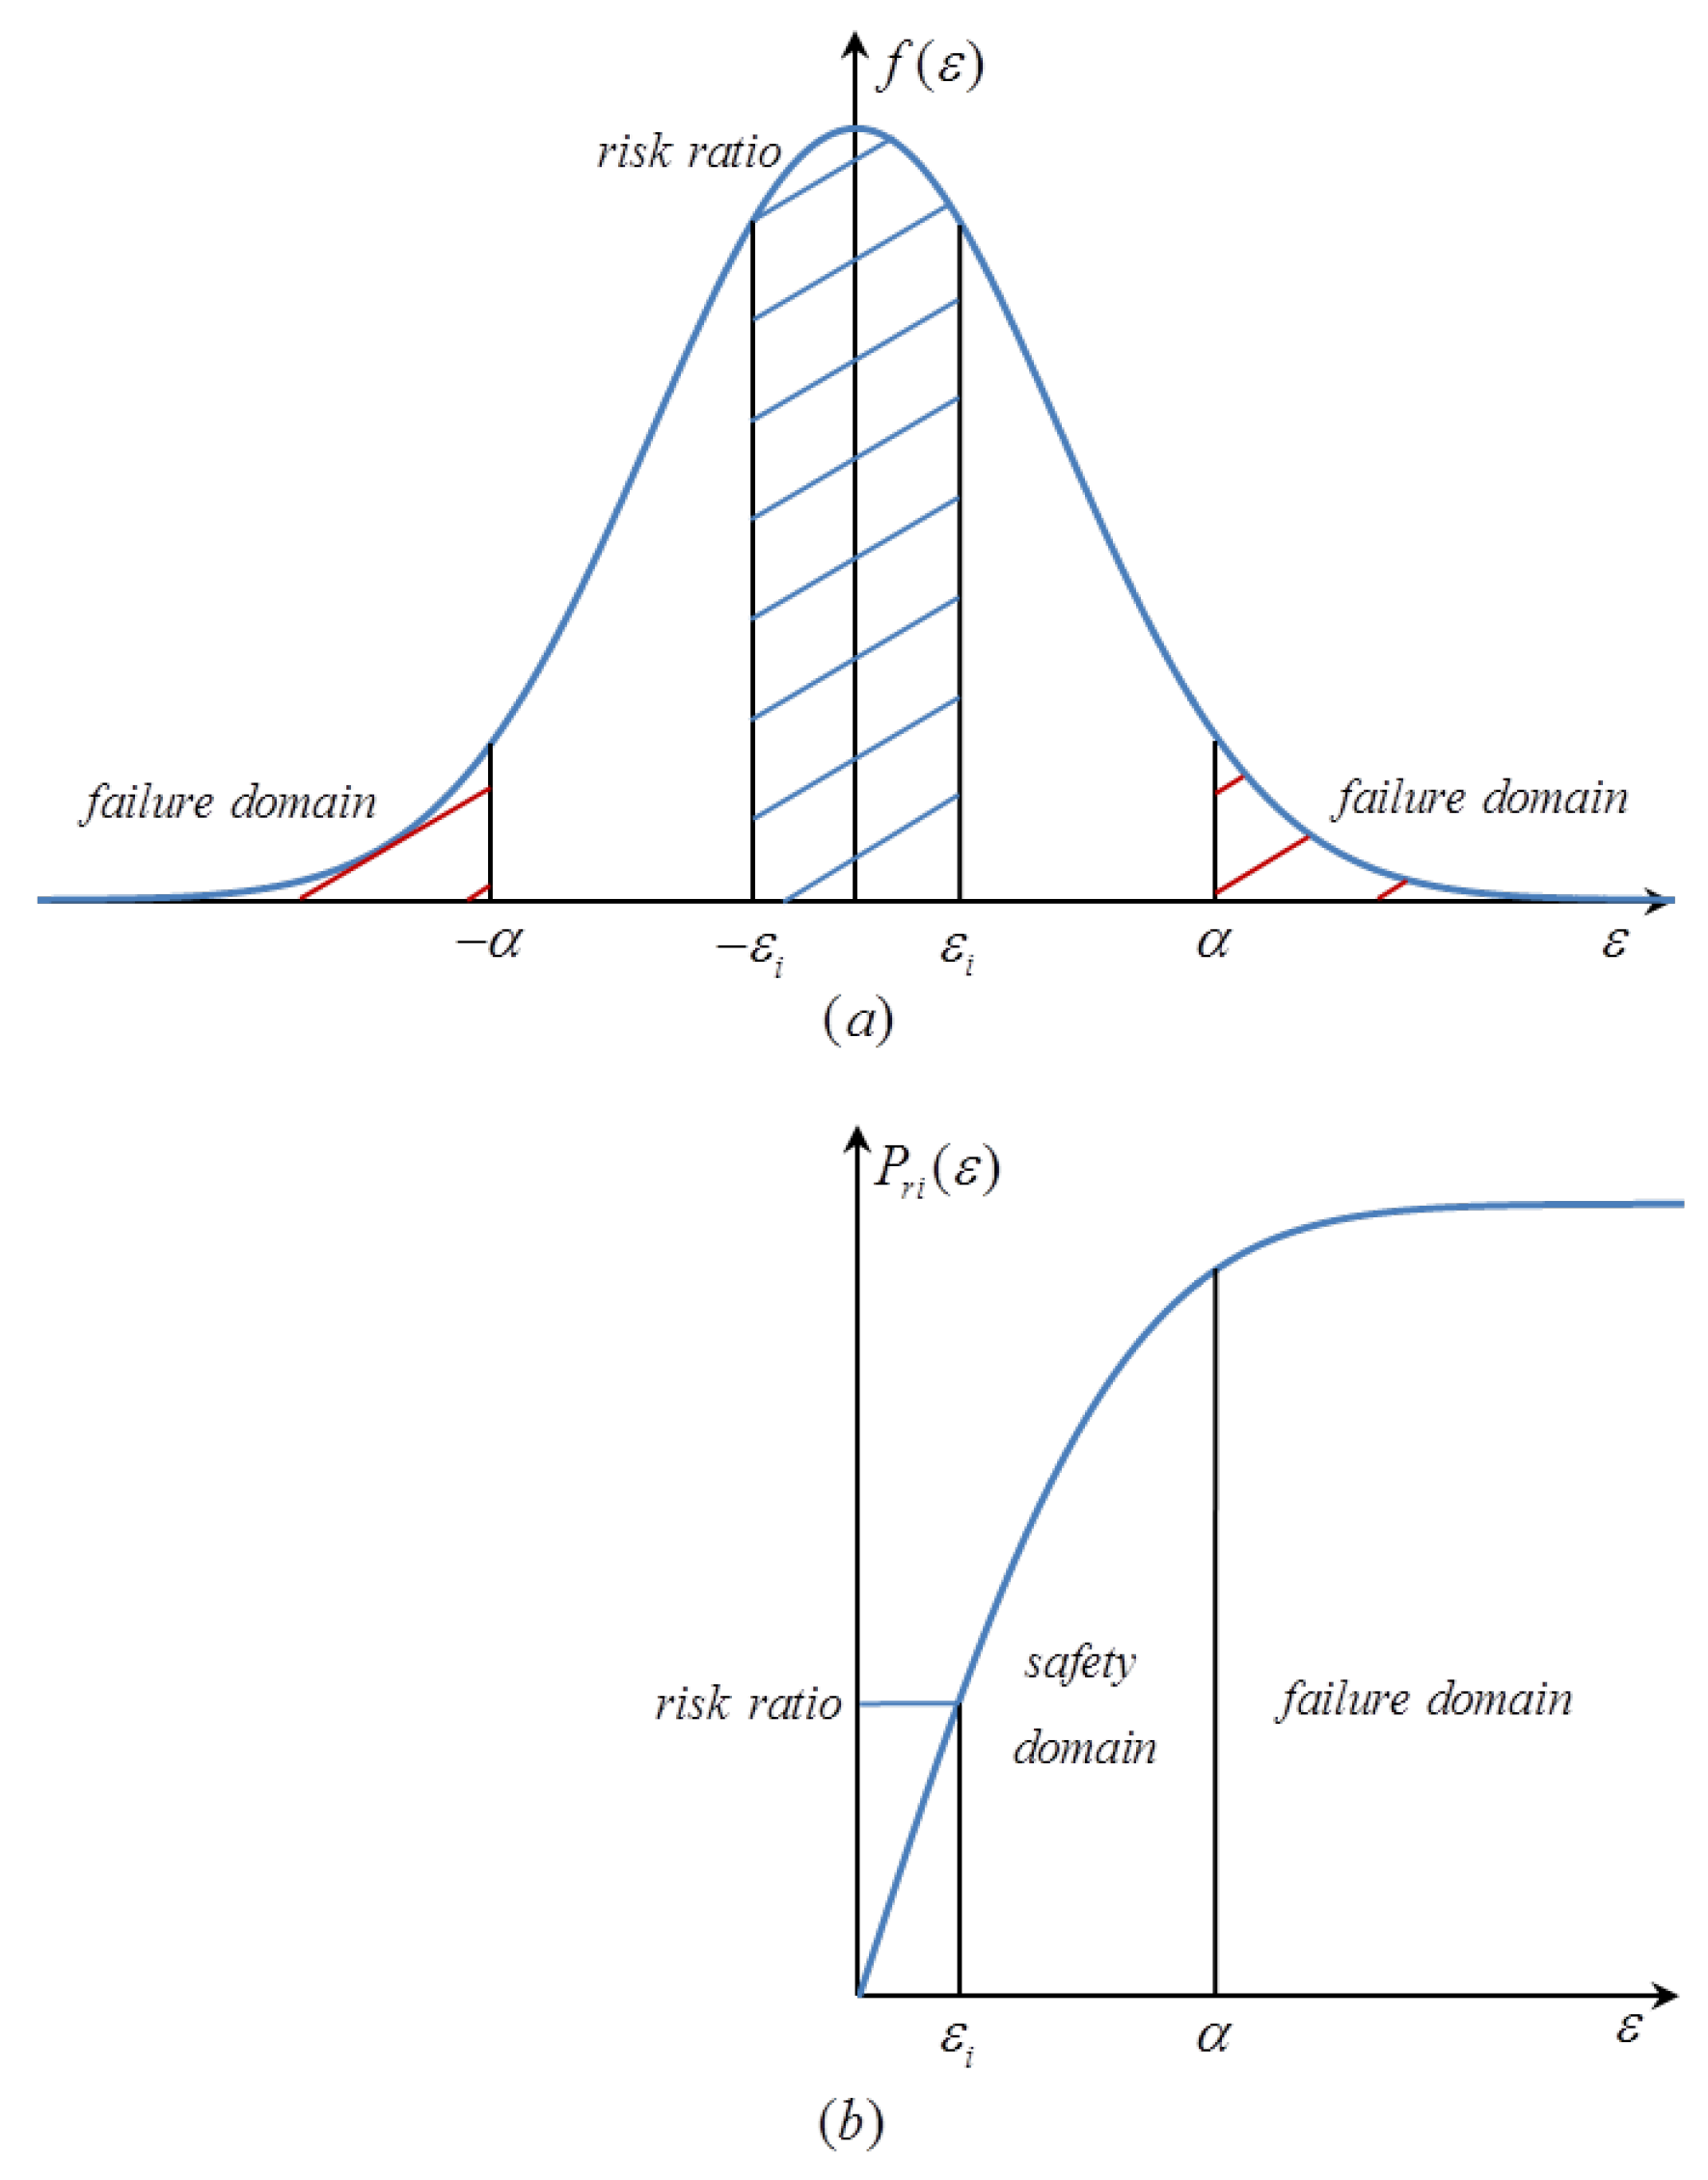
to assess dam risk. Here, we quantified the probability of dam risk by
risk ratio and proposed a cumulative distribution function (CDF) of the absolute residual to express it (see Equation (
11)).
where
is the absolute difference between monitored and modelled displacement data;
denotes the risk ratio;
t is time;
is the CDF of the absolute residual;
is a failure limit indicator.
Figure 2 exhibits the relationship between the risk ratio
P and the absolute residual
. The interval of the risk ratio is [0,1]. Based on the small probability method, once
exceeded the limit value
, the monitoring point region would be regarded as being in a failure state.


