Article

Temporal Model for Ship Twin-Propeller Jet Induced Sandbed Scour

1
State Key Laboratory of Hydraulic Engineering Simulation and Safety, Tianjin University, Tianjin 300350, China
2
First R&D Services, A-08-16 M Suites, 283 Jalan Ampang, Kuala Lumpur 50450, Malaysia
3
School of Natural and Built Environment, Architecture, Civil & Structural Engineering and Planning, Queen’s University Belfast, David Keir Building, Stranmillis Road, Belfast BT9 5AG, UK
*
Author to whom correspondence should be addressed.
J. Mar. Sci. Eng. 2019, 7(10), 339; https://doi.org/10.3390/jmse7100339
Submission received: 24 July 2019 / Revised: 23 September 2019 / Accepted: 24 September 2019 / Published: 27 September 2019
(This article belongs to the Special Issue Ship Hydrodynamics)

Abstract

:
This research paper proposes the use of empirical equations to estimate the temporal maximum scour that is induced by twin-propeller ( ε t w i n = Ω t [ l n ( t ) ] Γ t ) when acting over non-cohesive bed materials. A purpose built experimental apparatus is used to obtain the measurement data required for the calculation of the empirical constants. The output from rigorous experimental investigations demonstrates that the maximum scour depth produced from the operation of twin-propeller ( ε t w i n ), within the confines of a harbour basin, varies as a logarithmic function of time. A dimensional analysis of the standard single propeller configuration is used as the foundation upon which the scour equation is postulated. This is extended to include the influence of the operating distance between the twin-propeller configurations for the first time. The division of scours by twin-propeller and single-propeller ( ε twin / ε m ) enables the establishment of mathematical relation to calculate C1, C2, A, and B. The constants are C 1 = 366.11, C 2 = 0.3376, A = 0.859, and B = 0.1571. The proposed scour equation is more reliable within the time zone up to two hours based on the experimental data.

1. Introduction

The advent and operation of twin or multi propeller ships reduces the transportation cost associated with modern maritime trade. Twin-propeller system generates higher thrust, propelling the vessels ships with better efficiency while also increasing the manoeuvrability and stability that they possess, Kim et al. [1]. The flow characteristics from twin-propeller present more complex fluid interactions when compared to the wash that is produced by single propeller vessels. Consequently, the twin-propeller jet induces enhanced scour patterns, with direct impingement that can lead to increased undermining of nearby harbour infrastructure and result in subsequent damage to facilities.
Albertson et al. [2] initiated the theoretical research of plain water jet while using axial momentum theory and a Gaussian normal distribution to predict the velocity field. Further work built on the knowledge that was developed from momentum jet studies, and the three dimensional nature of a propeller jet was investigated by Blaauw and van de Kaa [3] and Verhey et al. [4]. Hamill [5] measured the flow field within the jet form a single-propeller while using Pitot tubes, while Lam [6] proposed a semi-empirical model that would predict the velocity field within the jet using axial momentum theory with Laser Doppler Anemometry (LDA) and Computational Fluid Dynamics (CFD) corrections. Jiang et al. [7] improved the single-propeller jet model to be a semi-empirical model for twin-propeller and demonstrated that the mixing of the twin-propeller jets could lead to more complicated scour structure at seabed when compared to the single source system.
Research on ship propeller jet scour was conducted by Hamill [5], Lam et al. [8], and Hong et al. [9] in laboratories with single rotating propeller jet. Hamill et al. [10] focused on a prediction of scour that included the influence of the structures surrounding berth, with most researchers concentrating their efforts on the estimation of the maximum scour depth induced. In all studies the densimetric Froude number, F 0 , was the most significant factor that influenced the magnitude of the maximum scour depth. Hong et al. [9] extended the research by relating the single-propeller jet scour to the time dependent scour profile. The progression from a single propeller to a twin-propeller system will allow for full inclusion of the effects these larger vessels at an early design stage by clarifying the prediction of any potential damage that may occur. In addition, Wang et al. [11], Sun et al. [12], and Ma et al. [13] studied the wake of tidal turbine pushing forward the investigation on propeller induced scour.
Mujal-Colilles et al. [14], Yew [15], and Cui et al. [16] indicated the importance of the twin-propeller induced scour, while Bergh and Magnusson [17] and Chait [18] concurred with the scour damage in harbour that resulted. The high velocity jet that is produced by the rotating propeller can wash away the seabed sediment forming scour hole downstream as illustrated in [16]. The potential damage caused by a ship propeller jet was highlighted by Stewart et al. [19], Sumer and Fredsøe [20], and Gaythwaite [21]. Hamill et al. [22] stated the propeller wash caused the seabed scour with non-cohesive soil in ports and waterway. Hamill et al. [10] found that the propeller jet can expand to several propeller diameters downstream to directly impinge the seabed. Low clearance between the ship and seabed maximised the scour depth. The sediment transports of cohesive soil are discussed in Zhang et al. [23] and Xu et al. [24]. Li et al. [25] proposed the integrated suction foundation for tension leg platform, which might consider the impingement of propeller wash. Li et al. [26] studied the cutter suction dredger as potential remedial action for the scour damage.
The current research experimentally investigated the development of twin-propeller scour while using non-cohesive sediments. The measured data is analysed to determine the temporal variation of the developed scour profile and an empirical model is proposed to predict the maximum scour depth induced.

2. Previous Scour Model by Single Propeller

Hamill et al. [10] proposed an empirical model to predict the induced scour in sand bed with fine and coarse sediments acted on by a single propeller. The maximum scour depth in that case ( ε m ) was described by the functions in Equations (1) and (2). The specific dimensionless analysis process is omitted, which is explained in Section 4 for twin-propeller.
ε m = f ( V 0 , D p , d 50 , C , ρ , g , Δ ρ , ν )
ε m D p = f 1 [ V 0 g d 50 Δ ρ ρ , V 0 D p ν , D p d 50 , C d 50 ]
where V 0 is the efflux velocity (the maximum velocity in the outflow plane) (m/s); D p is the propeller diameter (m); d 50 is the median sediment grain size (m); C is the clearance between propeller tip and seabed (m); ρ is the density of fluid (kg/m3); Δ ρ is the difference between mass density of sediment and fluid (kg/m3); g is the acceleration due to gravity (m/s2); ν is the kinematic viscosity of fluid (m2/s); V 0 g d 50 Δ ρ ρ is the densimetric Froude number; and, V 0 D p ν is the Reynolds number of jet. According to Hamill [8], when the Reynolds number of the propeller jet is large the effects of viscosity in the flow can be neglected. In that case, the efflux velocity can be calculated while using Equation (3).
V 0 = 1.59 n D P C t
where n is the rotational speed (rps) suggested by the axial momentum theory and C t is the propeller thrust coefficient, which is defined as T ρ n 2 D p 4 by Stewart et al. [19].
Hamill et al. [10] proposed an empirical scour model for single-propeller that would predict the maximum scour depth development with time and that the maximum scour depth ( ε m a x ) could be calculated while using Equations (4)–(6).
ε m = Ω [ l n ( t ) ] Γ
where
Ω = 6.9 × 10 4 × ( C d 50 ) 4.63 ( D p d 50 ) 3.58 F 0 4.535
Γ = 4.113 × ( C d 50 ) 0.742 ( D p d 50 ) 0.522 F 0 0.682
The maximum scour depth ( ε m ) is exponentially related to l n ( t ) . Ω and Γ are two coefficients that are related to the clearance between propeller and the bed (C), the propeller diameter (Dp), the median sediment size ( d 50 ), and densimetric Froude number ( F 0 ) . Note that SI units applied to all dimensions in these equations.

3. Experimental Setup

Previous research on twin-propeller induced scour is insufficient to estimate the scour depth for twin-propeller ship. Cui et al. [16] stated that most ships used the external rotating system (turning outward over the top), and therefore the experimental data of external rotating system is used to establish the empirical model for twin-propeller. The twin-propeller scour has two connected scour holes, which can be described as the combination of two single-propeller scour holes in the preliminary stage. The mixing of the two propeller jets [7] results in a larger scour due to jet diffusion. Inclusion of the distance between two propellers (dp) leads to two additional terms in the equations for twin-propeller scour. Experiments were conducted with four different twin-propeller distances to determine the empirical coefficients.

3.1. Experiment Setup

According to the guidance that was issued by both World Association for Waterborne Transport Infrastructure (PIANC) and Bundesanstalt für Wasserbau (BAW), the flow characteristics and maximum scour depth are two most significant factors in designing for ship propeller induced scour. With the bollard pull condition commonly assumed as the most serious scouring condition.
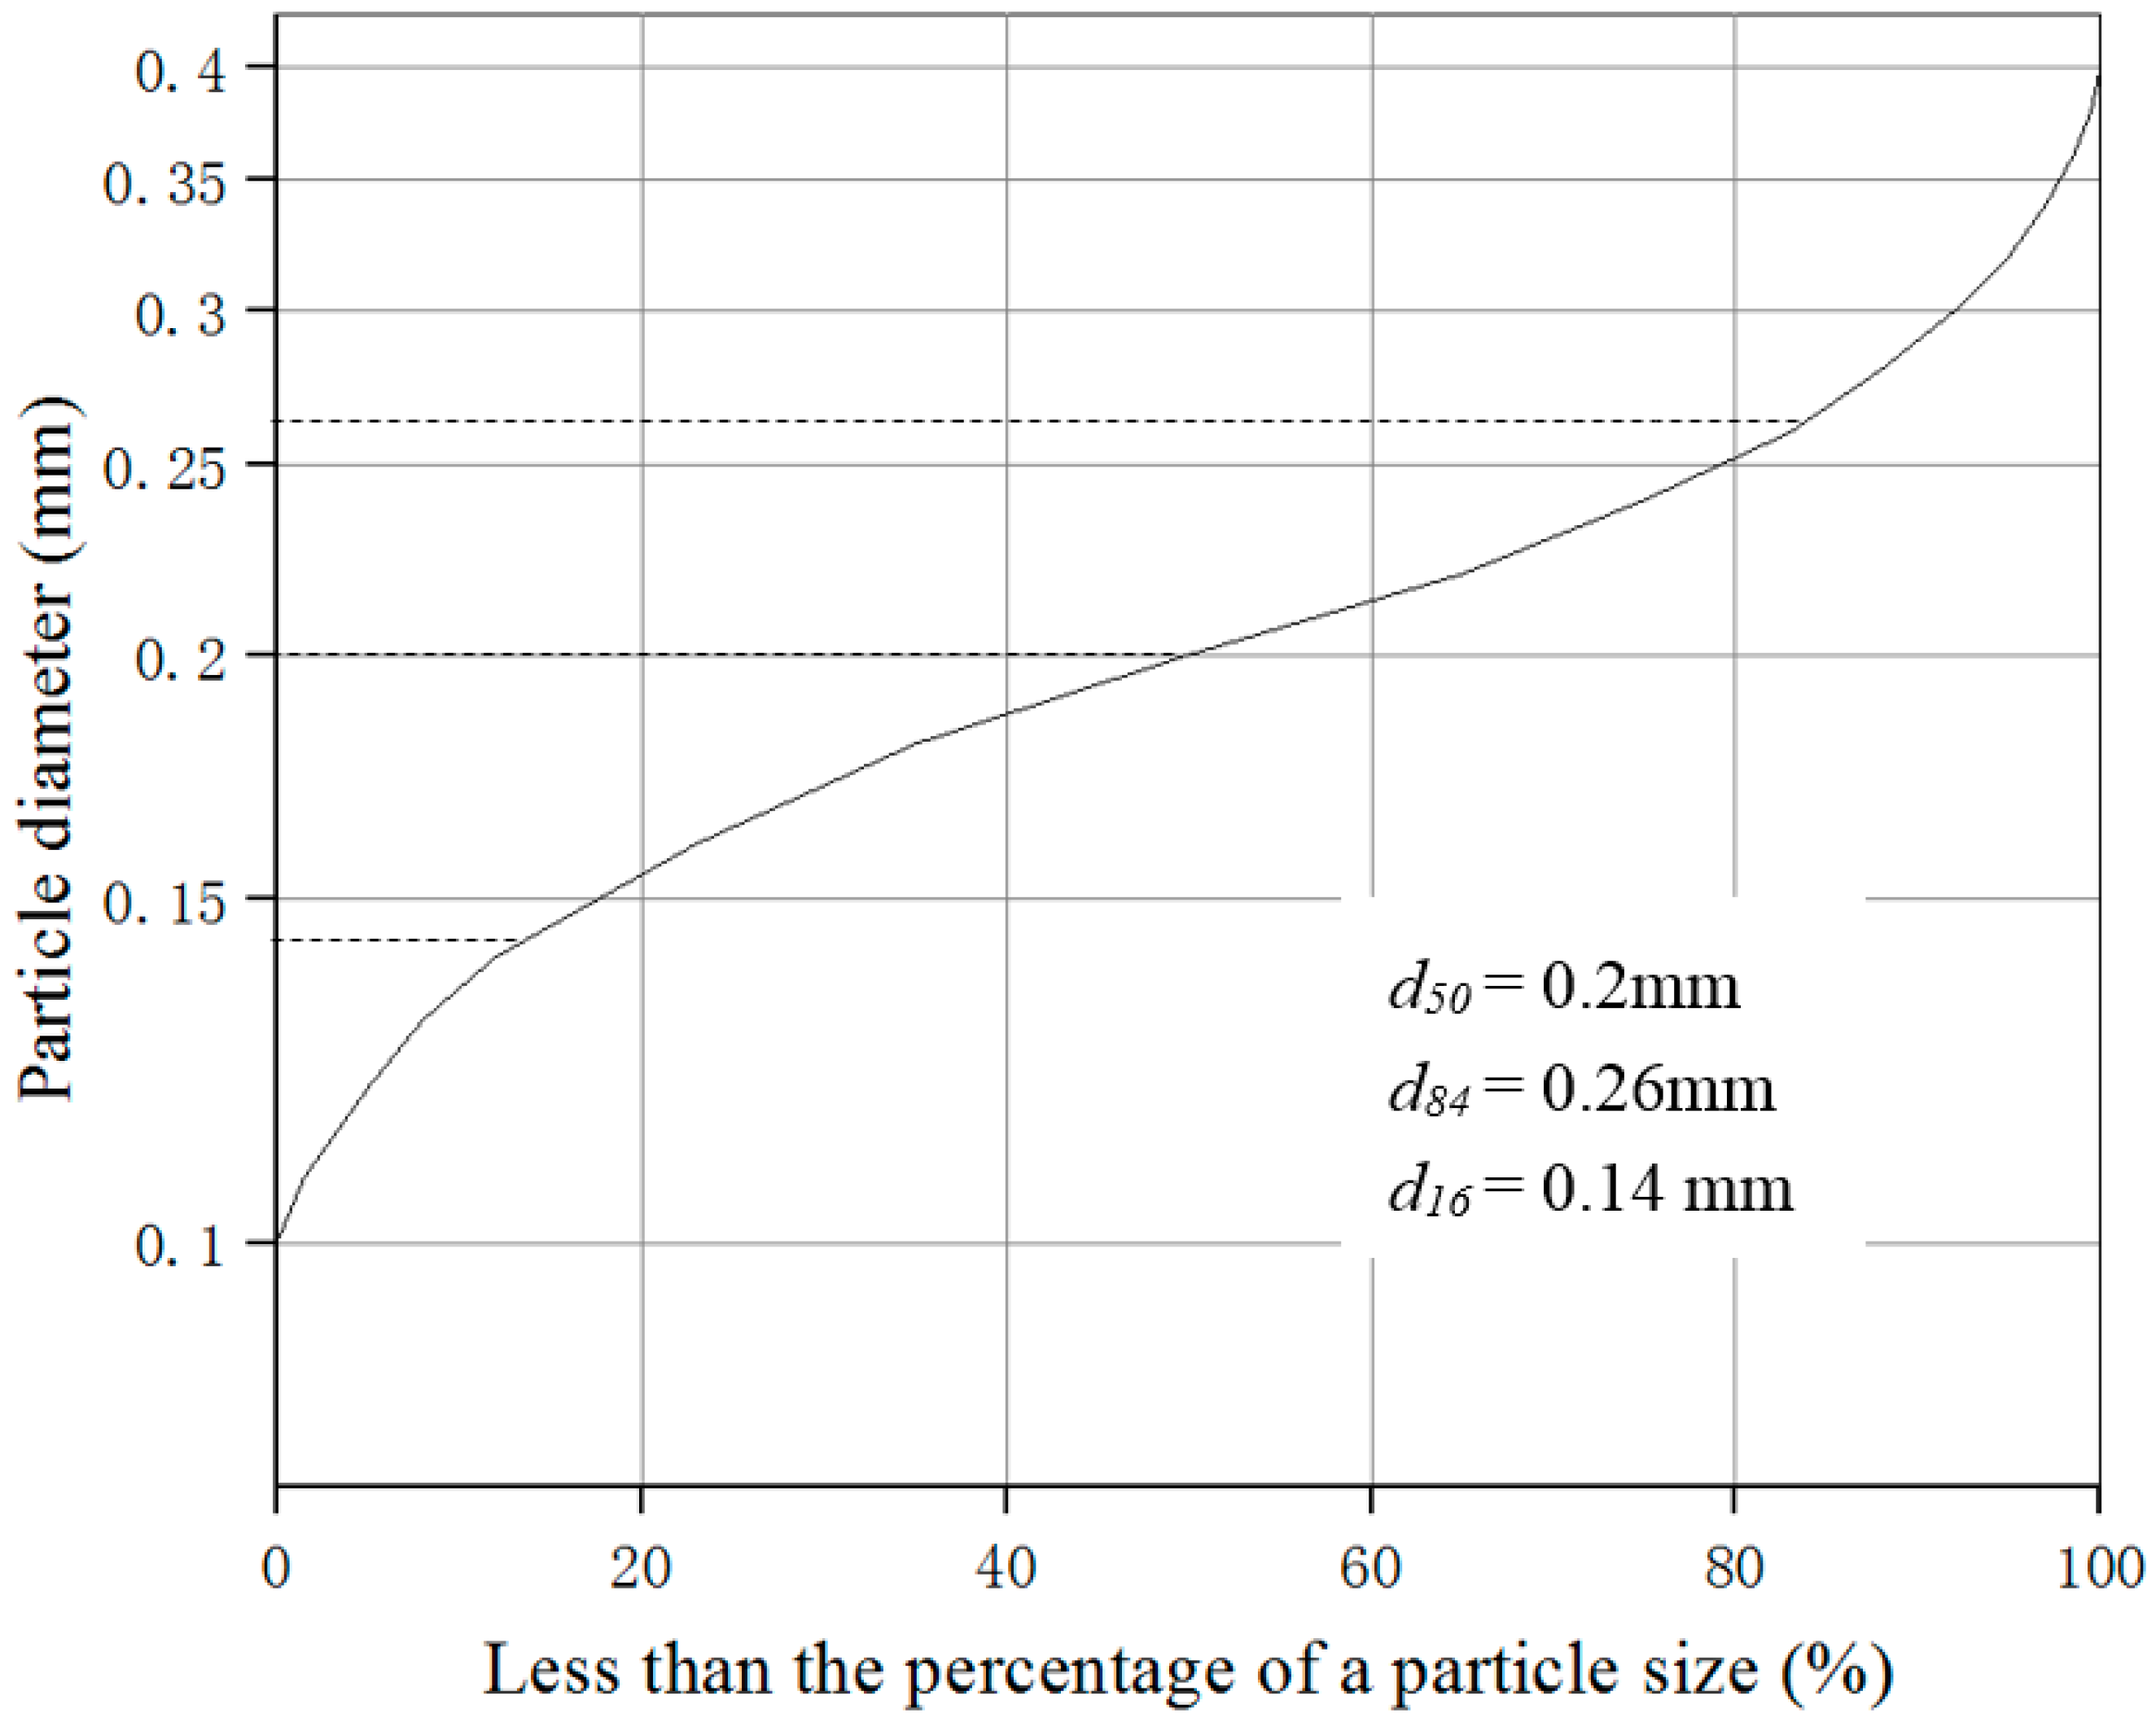
The experiments for research projects described in this paper were conducted in a water tank with a length of 1.2 meters, a width of 0.8 meters, and a height of 0.45 meters, as shown in Figure 1. Fine sand was laid to a depth of 0.1 m to replicate the seabed condition and a clear water depth of 0.32 m from the sand layer was maintained. The sand layer was sufficiently deep to allow the scour process to develop unhindered, with the maximum scour depth obtained always smaller than the sand thickness. The sand was screened through 0.1-mm-diameter, 0.15-mm-diameter, 0.2-mm-diameter, 0.25-mm-diameter, 0.3-mm-diameter, and 0.4-mm-diameter sand screens. The calculated mean sand diameter (d50) was 0.2 mm according to the cumulative frequency curve of sand particle size distribution, as shown in Figure 2. The density of sand ( ρ ) was 2650 kg/m3. The investigation of the various sand sizes and the use of clay is suggested as future work.
A range of clearance values between the propeller tip and the seabed were investigated. Depths of 5 mm (0.09 Dp), 27.5 mm (0.5 Dp), and 55 mm (1 Dp), as shown in Table 1. In all seven cases were investigated, with six cases for twin-propeller (twin-propeller TE-1 to twin-propeller TE-6) and one case for single-propeller (single-propeller S-1) at various tip-bed clearance and distance between propellers. The twin-propeller jet produces the main flow in line with axis of rotation of the propeller, axial direction, while a secondary rotational flow is associated as vortices along the jet. However, the secondary flow effect is insignificant to the efflux velocity due to the size of the propeller model, which was 55 mm, when compared with the 1.2 m-length and 0.45 m-height of the tank. The water depth in between the free surface and top blade tip was controlled in between 0.2 m–0.25 m to allow the submerged propeller jet feely expanding without free surface influences. The scour experiment was run for four hours to ensure that the asymptotic scour conditions were developed and little change in scour depth occurred after 0.5 hours (1800 s).
The distances between the test propeller were adjusted to 1.5   D p , 2   D p , 2.5   D p , and 3   D p . Two extensible bars are set to control the tip-bed clearance in between 0–60 mm vertically. The designed twin-propeller system consists of the transformer and speed switch, geared motors, powertrains for torque transfer, and propeller shaft. The 220 V transformer was connected to the wall power supply to provide household electricity to the system. The transformer converted the power output at a constant 24V to geared motor. A speed switch was used to adjust the propeller rotating at a desired speed. The geared motor produced torque in the vertical rotational axis rather than the horizontal rotational axis used by the propellers. The powertrain used two 45-degree telescopic shaft (Cardan shaft) to produce 90-degree torque transfer from the vertical rotational axis to horizontal. One set of transformer and speed switch was used to control the two sets of geared motors and the powertrains for each propeller. A telescopic shaft connected to the geared motor and propeller shaft at each end while two telescopic shafts connected two geared motors at a maximum rotational speed of 1000 rpm. A three-dimensional (3 D) printer was used to create the propeller model geometry.

3.2. Measurement System

The scour depth was measured while using a laser rangefinder that was made by Sndway Co. Ltd. The laser rangefinder was attached to a traverse system by a guide rail above the water surface. The measurement range covered the entire tank area, with the laser rangefinder being adjustable to any desired location. The laser rangefinder had a maximum range of 40 m with an error of less than 0.2 mm. The laser beam was vertically aligned above the water and it was reflected from the sand bed back to the aspheric-optical-focus mirror of the receiver. The measured scour depth was corrected to account for the different speeds of travel in water and in air. The experimental data was collected at time intervals that effectively doubled, i.e., 60 s, 120 s, 300 s, 600 s, 1200 s, etc.
The laser rangefinder was unable to obtain a clear observation under the operating propellers. Therefore, the operating propellers were stopped for every measurement of scour depth. The sand bed height L1, in the area without scour, was recorded and then the guide rail was moved to measure the scour profile in the direction of propeller rotational axis. The maximum depth L2 of the scour profile was recorded, as shown in Figure 3. The actual scour depth ε m = (L2-L1) * N, where N is the refractive index of water.

3.3. 3D Printing for Twin-Propeller

The current test propellers were created to replicate the original model from the hydraulics laboratory in Queen’s University Belfast. Researchers, such as Stewart et al. [19] and Hamill et al. [10], used these propellers to investigate the propeller jets. The propeller parameters are given in Table 2. Propeller types are generally defined by propeller diameter ( D p ), thrust coefficient (Ct), hub diameter (Dh), pitch ratio (ratio of pitch and diameter) (P′), projected blade area ratio (β), and other factors. 3D printing technology was innovatively used to create the desired propeller for the experiments. The 3D printer is made by JG Aurora in China. The biodegradable polylactic acid filament (PLA) material was melted at 200 degrees to print the propeller layer by layer. Before the model printing, modelling software was needed to draw physical model of propeller. Solidworks was used in the current research to create the geometric shape of propeller. The physical model of propeller was processed by Cura, the professional slicing software. Cura converted the Solidworks model to be the printable data to print the propeller by 3D printer. The actual print height of each layer is 0.1 mm. Two hours were taken to complete the entire printing process. Figure 4a shows the propeller printed in progress and Figure 4b shows the completed propeller with the temporary supporting structure, which needs to be eliminated in post-processing.
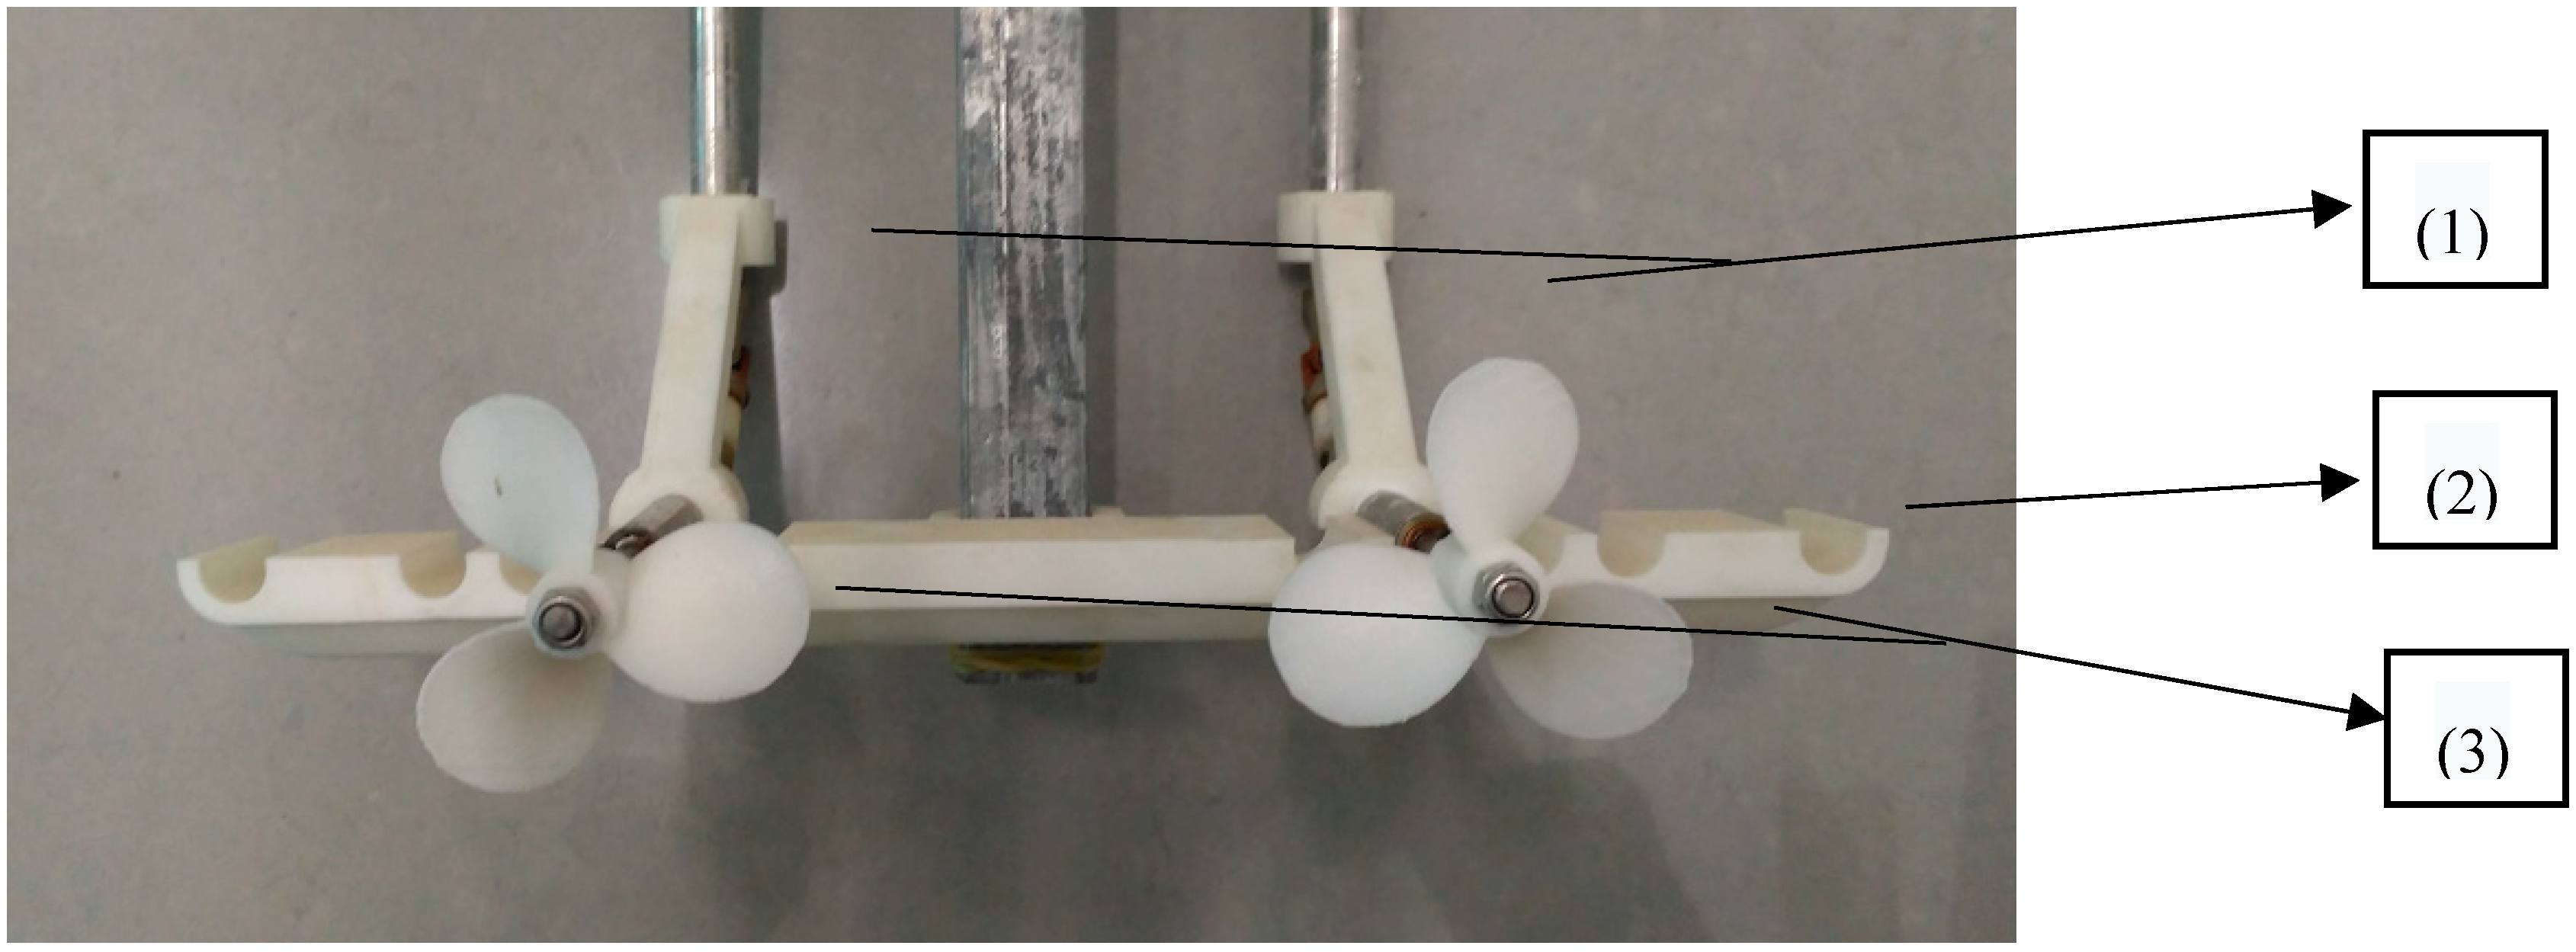
The horizontal support was printed with four different grooves to allow for the adjustment of twin-propeller distances at 1.5 D p , 2 D p , 2.5 D p , and 3 D p , as shown in Figure 5. The horizontal support was created through 3D printing. The grooved support has a width of 15 mm (0.273Dp) and a streamlined surface at the bottom to reduce its hydrodynamical impact. A 20 mm (0.364Dp) gap exists between the grooved holder and the propeller face. At bollard pull conditions the horizontal support is assumed to have a negligible effect on the propeller jets produced. This is in line with now accepted international test protocol. The current experimental settings did not consider the effects of rudder and hull.

3.4. Scaling of Experiment

In all hydraulics experiments, the effects of viscosity should normally be included unless it can be demonstrated that fully developed turbulent flow exists. In propeller flow, two Reynolds numbers are used to determine the onset of fully developed turbulence. These can be calculated using the Equations (7) and (8) according to Verhey et al. [4].
R f l o w = V 0 D P ν
R p r o p = n L m D p ν
where,
L m = β D p π ( 2 N ( 1 D h D p ) ) 1
where V 0 is the efflux velocity (m/s); D p is the diameter of the propeller (m); D h is the diameter of the hub (m); ν is the kinematic viscosity of the fluid (8.54 × 10⁻⁷ m2 /s); n is the number of revolutions per second; and, N is the number of blades.
Generally, a marine propeller has a diameter in between 1.5 m and 3 m, with rotation speeds of 200–400 rpm. A typical ship propeller proposed by Hamill [5] is taken as the prototype for twin propellers with diameter of 1.65 m, rotation speed of 200 rpm and thrust coefficient (Ct) of 0.35. The rotational speed used in this study was set at 500 rpm to investigate the resulting scour profile. No corresponding model test data is available to validate bigger ships and bigger propellers, but it will be included in future work.
The Reynolds numbers for the proposed speed ranges were 2.9 × 10⁴ for R f l o w and 1.3 × 10⁴ for R p r o p . In current study, the motor speed is limited. R p r o p is slightly smaller than the specified value. However, Blaauw & van de Kaa [3] and Verhey et al. [4] proposed that these scale effects might be insignificant. The Reynolds number for the jets are all greater than 3 × 10³, satisfying the criteria for the use of Froudian scaling only.

4. Estimation of Twin-Propeller Induced Scour

4.1. Dimensional Analysis of Scour by Twin Propeller

The single propeller scour model was used as the foundation to establish the empirical scour model for the twin-propeller system. The distance between propellers, d p , is a unique parameter in the twin-propeller and it is included in the dimensional analysis, as Equation (10). The time-dependent scour depth of twin-propeller ( ε t w i n ) can then be expressed as:
f ( ε t w i n ,   V 0 , D p , d 50 , C , ρ , g , Δ ρ , ν , d p ) = 0
According to Buckingham π theorem that was given by Tan [27], there are 10 dimensional quantities, including three basic variables. Equation (11) can be converted to a functional relationship with seven dimensionless parameters. The three basic variables are selected as V 0 ,   d 50 ,   ρ . The specific dimensionless calculation process is shown in Appendix A.
F ( ε t w i n D p , D p d 50 , C d 50 , d p d 50 , V 0 g d 50 , Δ ρ ρ , V 0 D p ν ) = 0
Equation (10) can also be written as Equation (12).
ε t w i n D p = F [ V 0 g d 50 , Δ ρ ρ , V 0 D p ν , D p d 50 , C d 50 , d p d 50 ]
The relationship between the density of water and sand density ( Δ ρ ρ ) is combined with jet Froude number ( V 0 g d 50 ) to produce the Densimetric Froude number which can be expressed as Equation (13). The Reynolds number ( R J ) can be expressed as Equation (14). The scale effects were insignificant according to Blaauw & van de Kaa [3] and Verhey et al. [4] and the viscosity of jet is negligible according to Hamill et al. [10].
F 0 = V 0 g d 50 Δ ρ ρ
R J = V 0 D p ν
Therefore, the scour depth produced by the operation of a twin-propeller set can be expressed as Equation (15).
ε t w i n D p = F [ F 0 , D p d 50 , C d 50 , d p d 50 ]
From the dimensionless analysis, two terms C 1 ( d p d 50 ) A and C 2 ( d p d 50 ) B were added to include the consideration of distance between propellers for twin-propeller system based on Equations (4)–(6). The time-dependent scour depth of twin-propeller ( ε t w i n ) can be determined by the functions that are given in Equations (16)–(18).
ε t w i n = Ω t [ l n ( t ) ] Γ t
where,
Ω t = 6.9 × 10 4 × C 1 ( d p d 50 ) A ( C d 50 ) 4.63 ( D p d 50 ) 3.58 F 0 4.535
Γ t = 4.113 × C 2 ( d p d 50 ) B ( C d 50 ) 0.742 ( D p d 50 ) 0.522 F 0 0.682
where C 1 and C 2 are two constants and A and B are the coefficients of dimensionless distance between the propellers.

4.2. Empirical Constants C1, C2, A and B

The empirical model for twin-propeller induced scour required empirical corrections. The current study proposed the calculation of corrections factors C1, C2, A, and B by dividing the scour depths of single and twin propellers. The relation between twin-propeller scour depth ( ε twin ) and single-propeller scour depth ( ε m ) is expressed in Equation (19).
ε twin ε m = C 1 ( d p d 50 ) A [ ln ( t ) ] Γ ( C 2 ( d p d 50 ) B 1 )
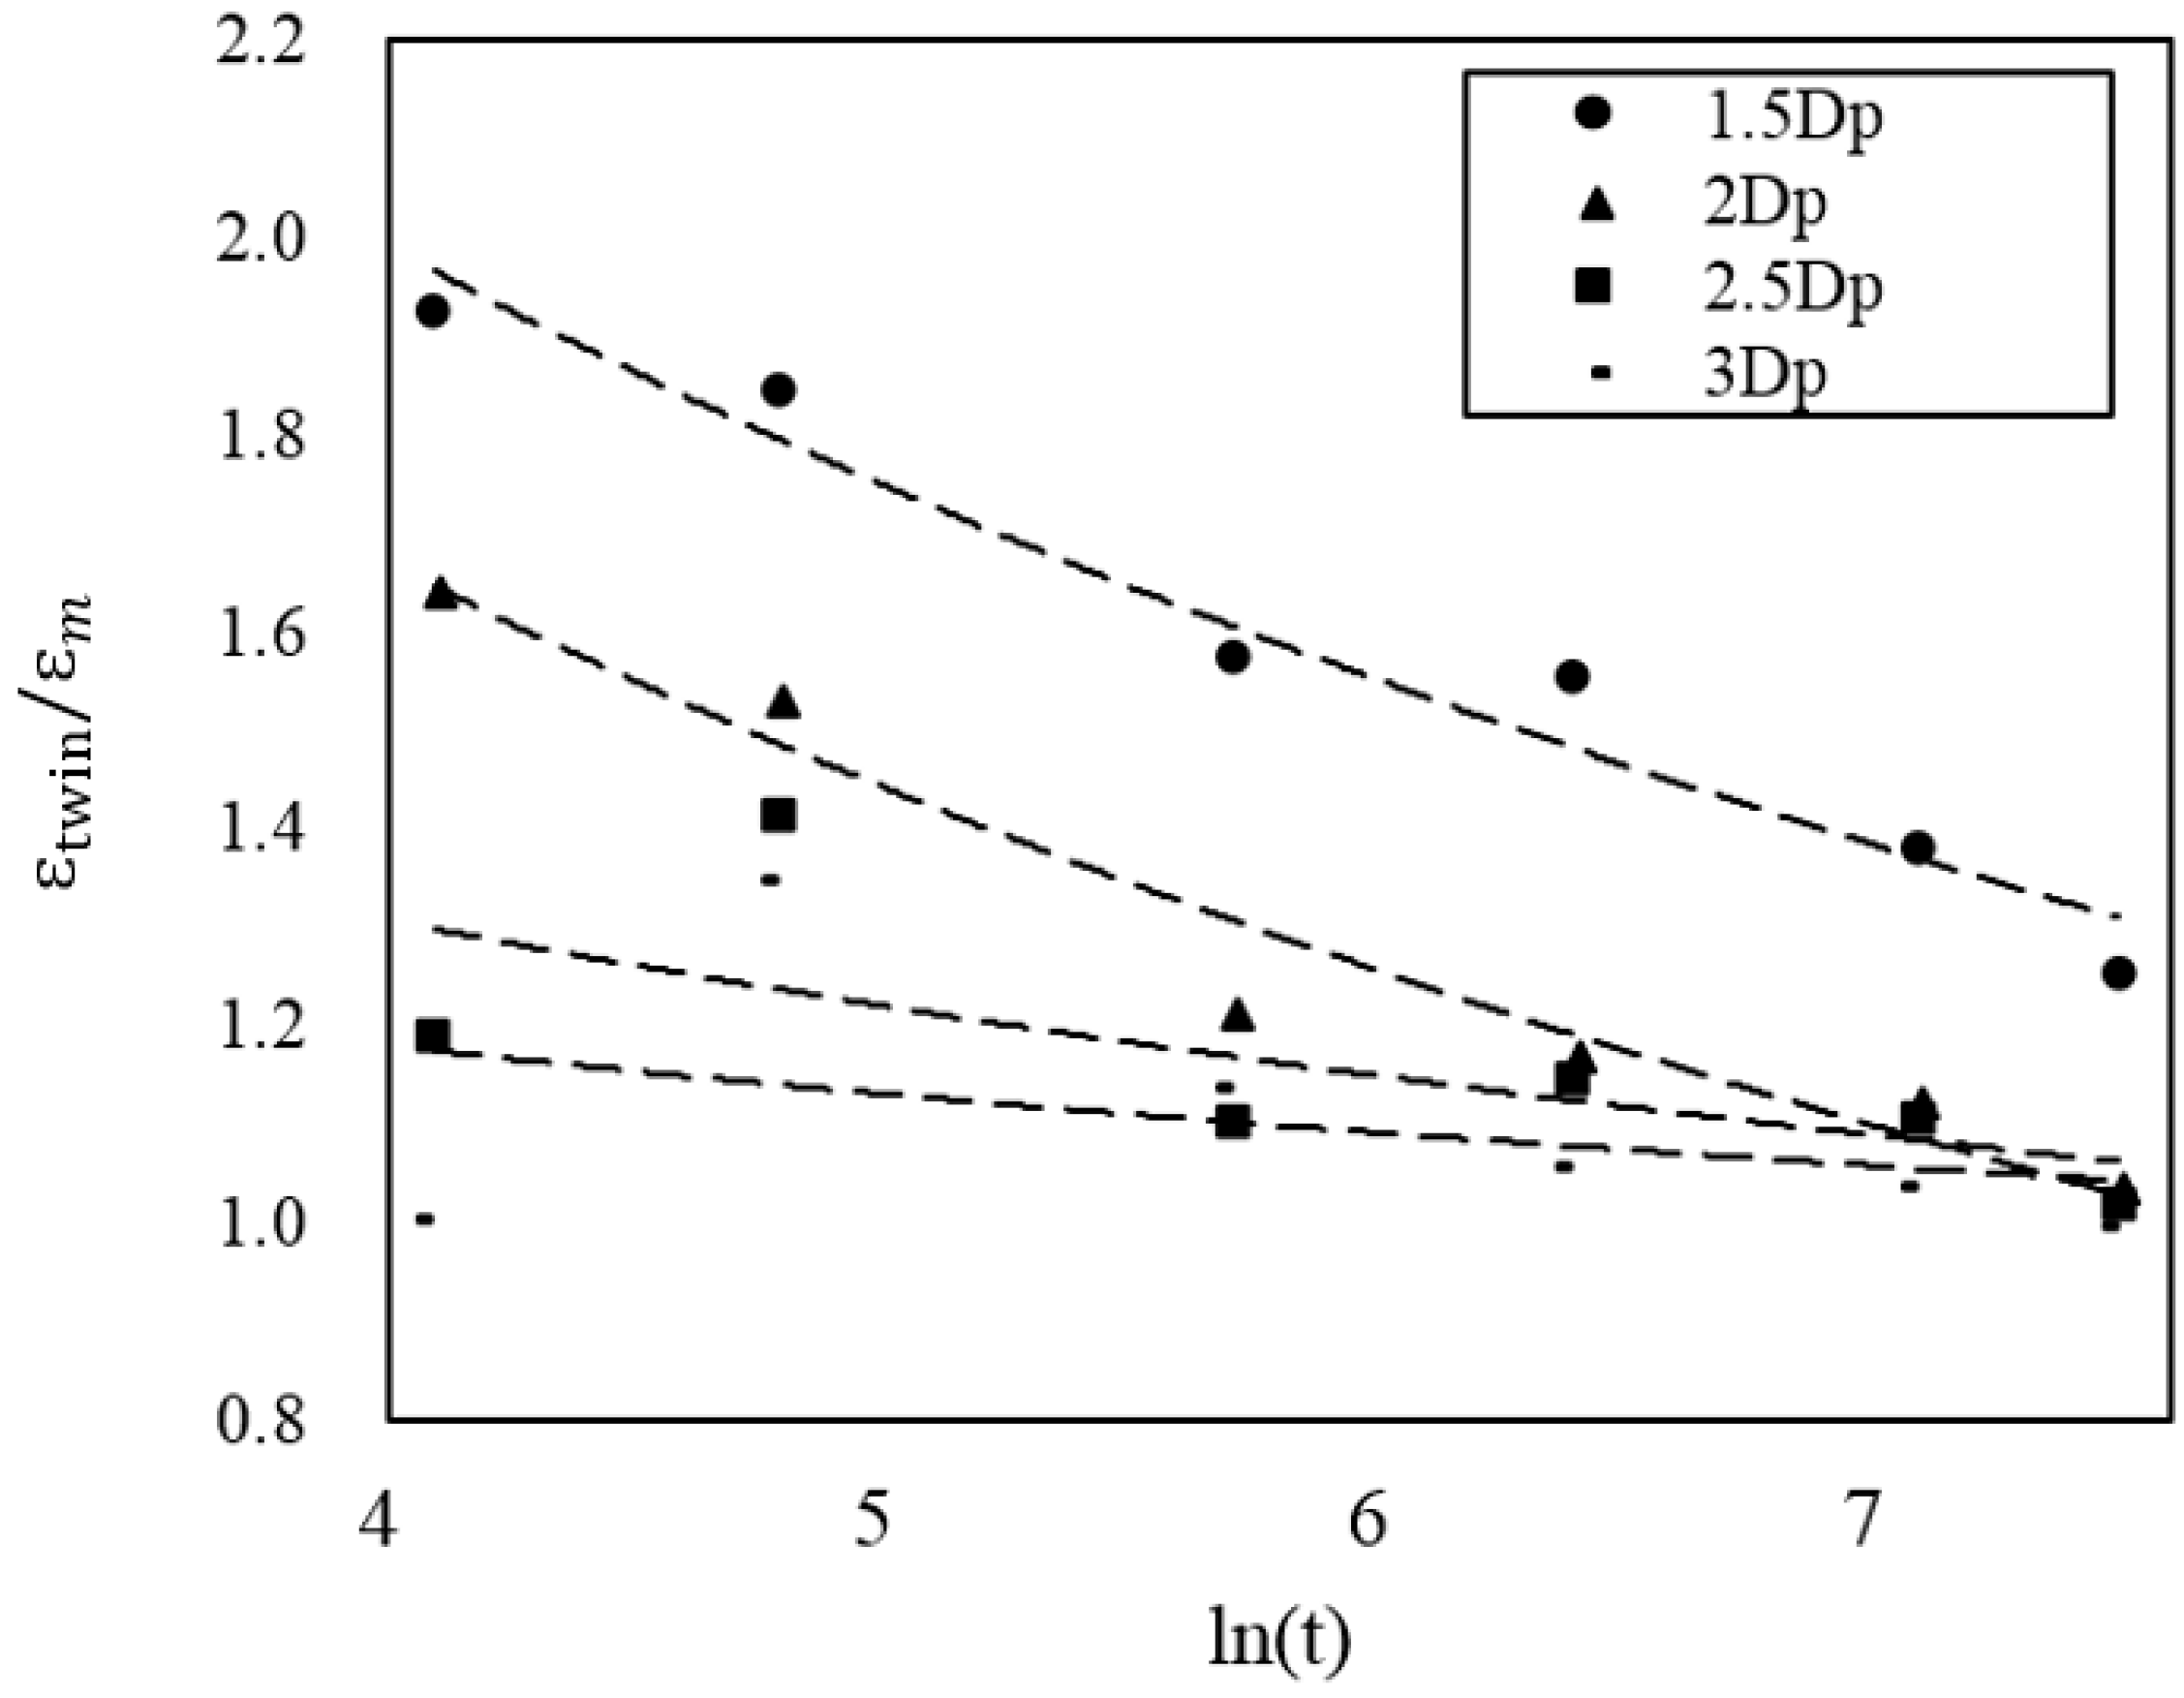
Using the experimental data that were obtained in this study can represent a relation between the single and twin propellers scour. The relationship between ε twin / ε m and ln (t) in Equation (19) are presented in Figure 6 and this was subsequently used to obtain the two terms. The intervals of data acquisition are 60 s, 120 s, 300 s, 600 s, 1200 s, and 1800 s. For different propeller spacing, the calculated ε twin / ε m is quite different at 60 s (ln (t) = 4.09). The maximum ε twin / ε m is close to 2 at propeller spacing of 1.5Dp, while the closer the distance between propellers then the greater change of initial scour that takes place while the ε twin / ε m of four groups of twin-propeller, with different spacings, tends to be the same as time increases.
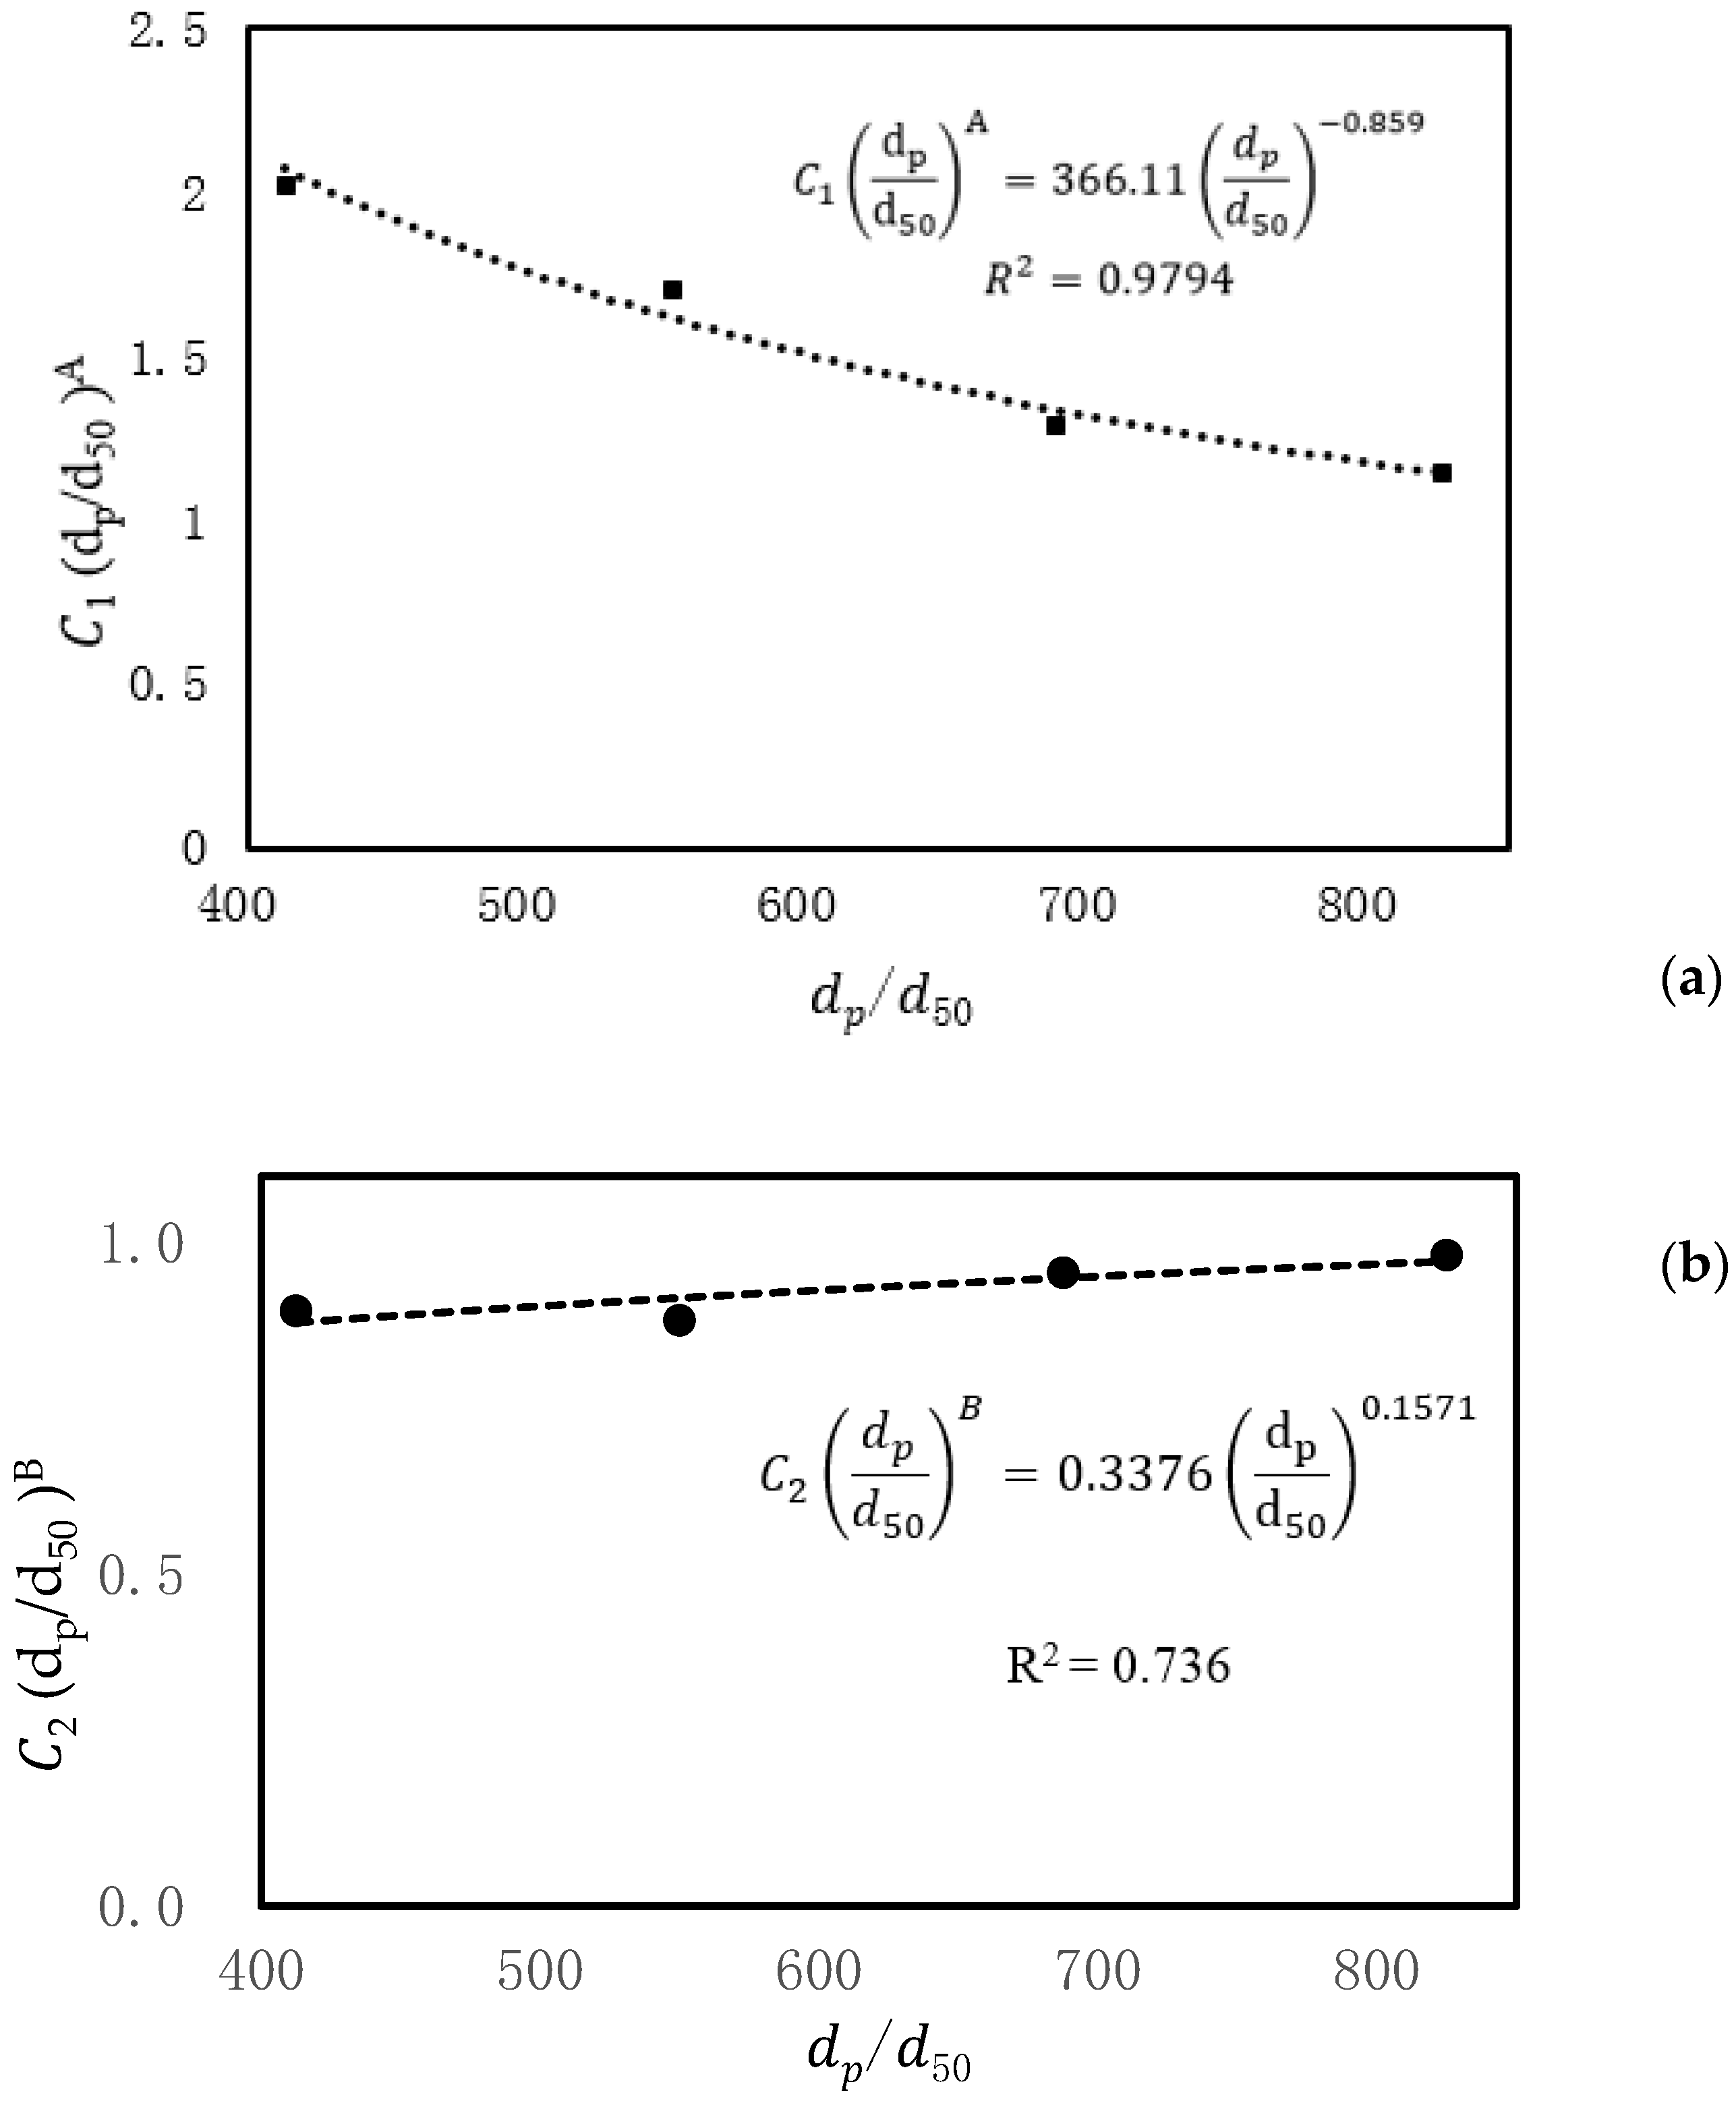
The calculated variation of ε twin / ε m and ln (t) is related to the distance between propellers. Different distance between propellers curves are obtained. Table 3 shows the terms of C 1 ( d p d 50 ) A and C 2 ( d p d 50 ) B , according to the experimental data and fitting curve. The constants C1 and A in C 1 ( d p d 50 ) A term can be obtained by transforming the data by substituting the dp and d50 in the current experiments. The calculated C1 and A are shown in Table 4 and Figure 7a. The constants C2 and B in C 2 ( d p d 50 ) B term can be obtained in the same transformation, as shown in Table 5 and Figure 7b. Mathematical fitting was carried out while using the experimental data. The unknowns of C1, C2, A, and B are then calculated.
From the calculation using the experimental data in Figure 7, the obtained coefficients for first term are A = ‒0.859 and C 1 = 366.11 with R2 = 0.9794. The coefficients for second term are calculated to obtain B = 0.1571 and C 2 = 0.3376 with R2 = 0.736. The empirical corrections can be inserted into Equations (16)–(18) and then proposed the empirical model of twin-propeller used to estimate the time-dependent scour depth by using Equations (20)–(22).
ε twin = Ω t [ l n ( t ) ] Γ t
Ω t = 0.2526 × ( d p d 50 ) 0.859 ( C d 50 ) 4.63 ( D p d 50 ) 3.58 F 0 4.535
Γ t = 1.389 × ( d p d 50 ) 0.1571 ( C d 50 ) 0.742 ( D p d 50 ) 0.522 F 0 0.682
The application of Equations (20)–(22) is suggested for cases with 1.5 d p   t o   3 d p distance between the two propellers. The comparison was made between the experimental scour depth and the predicted scour depth, as shown in Figure 8. The six groups of twin-propellers are compared between the experimental data and formula predictions. The proposed equations have a high correlation with the experiment data, with the R2 = 0.917.

4.3. Implementation of Equations on Full-Scale Vessel

The geometric similarity, kinematic similarity, and dynamic similarity between the actual twin-propeller ship and the experiment are considered in the current research according to the similarity principle of fluid mechanics that were proposed by Kong [28]. The length scale ( λ l ) in geometric similarity can be calculated by Equation (23), which is 30 for actual propeller of 1.65 m and propeller model of 0.055 m in the current study.
λ l = l p l m
where, l m is the diameter of propeller model; l p is the diameter of actual propeller.
Stewart [19] proposed that the velocity scale ( λ ν ) in kinematic similarity should satisfy Equation (24), which is 30 or 5.48 for the current case.
λ ν = ν p ν m = l p l m
where, ν m is the velocity of propeller model jet; and, ν p is the velocity of actual propeller jet.
However, it is necessary to satisfy the time scale ( λ t ) between the model experiment and the actual situation to ensure the motion similarity. The time similarity represents the ratio of the scour time of actual ship twin-propeller to the experiment, which is calculated by Equation (25), as 30/ 30 or 5.48 for the current case, according to Kong [28].
λ t = t p t m = λ l λ ν
where, t m is the scour time of propeller model; and, t p is the scour time of actual propeller.
In the analysis process shown in Section 4.1, the factors such as propeller diameter and sand particle diameter are all treated as dimensionless quantities. For model test and actual ship propeller scour, the dimensionless coefficients ( d p d 50 , C d 50 , D p d 50 , F 0 ) in Equation (15) obtain the same calculated results due to geometric similarity. The impact of scour time is increased in Equation (16), which is not a dimensionless parameter. Therefore, Equations (20)–(22) are only applicable to the change of scour depth with time in the current model test. When Equations (20)–(22) is applied to the full-scale vessel, the time scale must be satisfied. It is necessary to multiply the scour time by the time scale to predict the scouring depth of a full-scale vessel. Specific consideration should be given to the geometric similarity ratio and velocity similarity ratio between full-scale ships and the current model tests.
To the best of our knowledge, the previous work has limited reports on the full-scale propeller scour and the twin-propeller scour. Yew [15] proposed an equation to predict the scour depth of twin-propeller based on co-rotating propellers, but did not consider the application on the full-scale ships. Hamill [5] and Hong et al. [9] proposed the equations to predict the scour depth by single-propeller based on dimensionless analysis. Stewart [19] proposed the conversion of the small-scale laboratory works to predict the efflux velocity of full-scale single-propeller. Mujal-Colilles et al. [29] and Tan & Yuksel [30] emphasised the importance of maximum scour depth without consideration of the time factors.

5. Comparison

The prediction from the proposed equations is compared with the previous works from Hamill [5], Hong et al. [9], Yew [15], Mujal-Colilles et al. [29], and Tan & Yuksel [30]. The case of twin-propeller TE-1 was used in the comparison and Table 6 shows the predicted scour depth and variations. The twin-propeller scour depth is larger than the single-propeller scour with 6% variation as compared to Hamill [5]. The predicted maximum scour depth has higher variations when compared to the single-propeller scour equation by Hong et al. [9] and Mujal-Colilles et al. [29], which is 31%. The calculated scour depth using Yew [15] is higher than the current prediction with a 40% variation. The current works used an external counter-rotating propeller system. Yew [15] used a co-rotating system to rotate the twin-propeller in the same direction, which is inconsistent with normal actual twin propeller ship systems. The predicted value is close to Tan & Yuksel [30], with 0.5% variation. The current experiments found that the maximum scour depth did not significantly change after two hours (7200 s). More future works are suggested for the maximum scour depth and scour time, which are always the interesting arguments for researchers. The current works mainly focuses on the civil engineering more than naval architecture and mechanical engineering, which may have different focuses.

6. Conclusions

The current work investigated the scour depth that is caused by the ship twin-propeller systems acting over a sandbed. The propeller scour data was obtained using a purpose-designed twin-propeller system, powertrain system and 3D-printed propeller. The measurements were made by using a laser rangefinder to allow the point measurement of the scour depth. An empirical model is proposed to allow for scientists and engineers to estimate the maximum scour depth caused by twin-propeller ships. Empirical equations are proposed to predict the twin-propeller maximum scour depth.
ε twin = Ω t [ l n ( t ) ] Γ t
Ω t = 0.2526 × ( d p d 50 ) 0.859 ( C d 50 ) 4.63 ( D p d 50 ) 3.58 F 0 4.535
Γ t = 1.389 × ( d p d 50 ) 0.1571 ( C d 50 ) 0.742 ( D p d 50 ) 0.522 F 0 0.682
The current twin-propeller investigation provides novel insights for the propeller scour community to assist in capturing the needs of being able to account for the increase on the use of twin-propeller ships systems. The sand characteristics, propeller diameter, rotational speed, rudder, hull, and other factors need to be considered in future work.

Author Contributions

W.H.L.’s long term research series in ship propeller jet induced scour; Y.C. and W.H.L. contributed to propose the dimensional analysis of twin-propeller scour; Y.C. wrote the manuscript with revisions, recommendations and validations from W.H.L., T.Z., C.S., D.R., and G.H.

Funding

This research was funded by the Natural Science Foundation of Tianjin City: 18JCYBJC21900 and Science Fund for Creative Research Groups of the National Natural Science Foundation of China (Grant no. 51621092). The APC was funded by the Natural Science Foundation of Tianjin City: 18JCYBJC21900.

Acknowledgments

The authors wish to extend their gratitude to the School of Civil Engineering at Tianjin University for laboratory space; Queen’s University Belfast, University of Plymouth, University of Oxford, Dalian University of Technology, University of Malaya (HIR ENG47), Universiti Teknologi Malaysia, and Southern University College for their past support; and professional bodies EI, IEI, IET, BCS, IEM, IEAust, ASCE, ECUK, SCUK, BEM, FEANI, AFEO, MINDS and academy AAET for membership support and available resources.

Conflicts of Interest

The authors declare no conflict of interest.

Notation

A = corrections factors;
B = corrections factors;
C = clearance distance from propeller tip to bed;
C1 = corrections factors;
C2 = corrections factors;
Ct = thrust coefficient;
Dh = propeller hub diameter;
D p = propeller diameter;
dp = distance between twin-propeller;
d50 = average sediment grain size;
F0 = densimetric Froude number;
L m = characteristic length;
n = number of revolutions per second;
N = blade number;
P’ = pitch ratio (pitch/diameter);
R f l o w = Reynolds numbers for propeller jet;
R p r o p = Reynolds numbers for propeller model;
T = propeller thrust;
t = time;
V0 = efflux velocity;
Z D , t w i n = maximum deposition height of twin-propeller at time t;
Ω = experimental coefficient for single-propeller;
Ω t = experimental coefficient for twin-propeller;
Γ = experimental coefficient for single-propeller;
Γ t = experimental coefficient for twin-propeller;
β = projected area ratio;
ε m = depth of maximum scour of single-propeller at time t;
ε t w i n = depth of maximum scour of twin-propeller at time t;

Appendix A

  • f ( ε t w i n ,   V 0 , D p , d 50 , C , ρ , g , Δ ρ , ν , d p ) = 0
  • The dimensions of each physical quantity:
  • dim ( ε t w i n ) = L; dim ( V 0 ) = LT−1; dim ( D p ) = L; dim ( d 50 ) = L; dim ( C ) = L; dim ( ρ ) = L−3M; dim ( g ) = LT−2; dim ( Δ ρ ) = L−3M; dim ( ν ) = L2T−1; dim ( d p ) = L.
  • There are 10 physical quantities, involving 3 basic dimensions: L, T, M. End up with 7 dimensionless coefficients.
  • F [ π 1 ,   π 2 ,   π 3 ,   π 4 ,   π 5 ,   π 6 ,   π 7   ] = 0
  • Select the basic physical quantity from 10 physical quantities as V 0 ,   d 50 ,   ρ .The rest of the physical quantities are expressed in the form of the power product of the basic physical quantities.
  • [ π 1 ] = [ ε t w i n d 50 ] = L L = 1 ,
  • [ π 2 ] = [ D p d 50 ] = L L = 1 ,
  • [ π 3 ] = [ C d 50 ] = L L = 1 ,
  • [ π 4 ] = [ g d 50   V 0 2 ] = LT 2 L ( LT 1 ) 2 = 1 ,
  • [ π 5 ] = [ Δ ρ ρ ] = L 3 M L 3 M = 1 ,
  • [ π 6 ] = [ ν   V 0 D p ] = L 2 T 1 ( LT 1 ) L = 1 ,
  • [ π 7 ] = [ d p d 50 ] = L L = 1 ,
  • The dimensionless functional relation is expressed as:
  • F ( ε t w i n D p , D p d 50 , C d 50 , d p d 50 , V 0 g d 50 , Δ ρ ρ , V 0 D p ν ) = 0

References

  1. Kim, Y.G.; Kim, S.Y.; Kim, H.T.; Lee, S.K.; Yu, B.S. Prediction of the manoeuvrability of a large container ship with twin-propeller and twin rudders. Mar. Sci. Technol. 2007, 12, 130–138. [Google Scholar] [CrossRef]
  2. Albertson, M.L.; Dai, Y.B.; Jensen, R.A.; Rouse, H. Diffusion of submerged jets. Trans. Am. Soc. Civ. Eng. 1950, 115, 639–697. [Google Scholar]
  3. Blaauw, H.G.; van de Kaa, E.J. Erosion of Bottom and Sloping Banks Caused by the Screw Race of the Manoeuvring Ships; Rep. No. 202; Delft Hydraulics Laboratory: Delft, The Netherlands, 1978. [Google Scholar]
  4. Verhey, H.J.; Blockland, T.; Bogaerts, M.P.; Volger, D.; Weyde, R.W. Experiences in Netherlands with quay structures subjected to velocities created by bow thrusters and main propellers of mooring and unmooring ships. Perm. Int. Assoc. Navig. Congr. 1987, 58, 69–88. [Google Scholar]
  5. Hamill, G.A. The scouring action of the propeller jet produced by a slowly manoeuvring ship. Perm. Int. Assoc. Navig. Congr. 1988, 61, 85–110. [Google Scholar]
  6. Lam, W.H. Simulation of Ship Propeller Jet. Ph.D. Thesis, Queen’s University of Belfast, Belfast, UK, 3 July 2008. [Google Scholar]
  7. Jiang, J.; Lam, W.H.; Cui, Y.; Zhang, T.; Sun, C.; Guo, J.; Ma, Y.; Wang, S.; Hamill, G. Ship Twin-propeller Jet Model used to Predict the Initial Velocity and Velocity Distribution within Diffusing Jet. KSCE J. Civ. Eng. 2019, 23, 1118. [Google Scholar] [CrossRef]
  8. Lam, W.H.; Hamill, G.A.; Robinson, D.; Raghunathan, S. Observations of the initial 3D flow from a ship’s propeller. Ocean Eng. 2010, 37, 1380–1388. [Google Scholar] [CrossRef]
  9. Hong, J.H.; Chiew, Y.M.; Cheng, N.S. Scour Caused by a Propeller Jet. J. Hydraul. Eng. 2013, 139, 1003–1012. [Google Scholar] [CrossRef]
  10. Hamill, G.A.; Johnston, H.T.; Stewart, D.P. Propeller wash scour near quay walls. Waterw. Port Coast. Ocean 1999, 125, 170–175. [Google Scholar] [CrossRef]
  11. Wang, S.; Lam, W.; Cui, Y.; Zhang, T.; Jiang, J.; Sun, C.; Guo, J.; Ma, Y.; Hamill, G. Novel energy coefficient used to predict efflux velocity of tidal current turbine. Energy 2017. [Google Scholar] [CrossRef]
  12. Sun, C.; Lam, W.; Cui, Y.; Zhang, T.; Jiang, J.; Guo, J.; Ma, Y.; Wang, S.; Hamill, G.; Lam, S. Empirical model for Darrieus-type tidal current turbine induced seabed scour. Energy Convers. Manag. 2018, 171, 478–490. [Google Scholar] [CrossRef] [Green Version]
  13. Ma, Y.B.; Lam, W.; Cui, Y.; Zhang, T.; Jiang, J.; Sun, C.; Guo, J.; Wang, S.; Hamill, G.; Lam, S. Theoretical vertical-axis tidal-current-turbine wake model using axial momentum theory with CFD corrections. Appl. Ocean Res. 2018, 79, 113–122. [Google Scholar] [CrossRef] [Green Version]
  14. Mujal-Colilles, A.; Gironella, X.; Crespo, A.J.C.; Sanchez-Arcilla, A. Study of the Bed Velocity Induced by Twin Propellers. J. Waterw. Port Coast. Ocean Eng. 2017, 145, 04017013. [Google Scholar] [CrossRef]
  15. Yew, W.T. Seabed Scour Induced by Twin-Propeller Ships. Ph.D. Thesis, University of Malaya, Kuala Lumpur, Malaysia, 11 October 2017. [Google Scholar]
  16. Cui, Y.; Lam, W.; Zhang, T.; Sun, C.; Hamill, G. Scour Induced by Single and Twin Propeller Jets. Water 2019, 11, 1097. [Google Scholar] [CrossRef]
  17. Bergh, H.; Magnusson, N. Propeller erosion and protection methods used in ferry terminals in the port of Stockholm. Perm. Int. Assoc. Navig. Congr. 1987, 58, 112–120. [Google Scholar]
  18. Chait, S. Undermining of quay walls at South African ports due to the use of bow thrusters and other propeller units. Perm. Int. Assoc. Navig. Congr. 1987, 58, 107–110. [Google Scholar]
  19. Stewart, D.P.; Hamill, G.A.; Johnston, H.T. Bed scour considerations in ship berth design. In Proceedings of the International Conference on Coastal and Port Engineering in Developing Countries, Mombasa, Kenya, 16–20 September 1991; pp. 1110–1125. [Google Scholar]
  20. Sumer, B.M.; Fredsøe, J. The Mechanics of Scour in the Marine Environment; World Scientific: Singapore, 2002. [Google Scholar]
  21. Gaythwaite, J. Design of Marine Facilities for the Berthing, Mooring, and Repair of Vessels; ASCE: Reston, VA, USA, 2004. [Google Scholar]
  22. Hamill, G.A.; Kee, C. Predicting axial velocity profiles within a diffusing marine propeller jet. Ocean Eng. 2016, 124, 104–112. [Google Scholar] [CrossRef] [Green Version]
  23. Zhang, J.F.; Zhang, Q.H.; Maa, P.Y.; Qiao, G.Q. Lattice boltzmann simulation of turbulence-induced flocculation of cohesive sediment. Ocean Dyn. 2013, 63, 1123–1135. [Google Scholar] [CrossRef]
  24. Xu, D.; Bai, Y.; Ji, C.; Williams, J. Experimental study of the density influence on the incipient motion and erosion modes of muds in unidirectional flows: The case of huangmaohai estuary. Ocean Dyn. 2015, 65, 187–201. [Google Scholar] [CrossRef]
  25. Li, Y.; Yang, S.G.; Yu, S. Numerical simulation of installation process and uplift resistance for an integrated suction foundation in deep ocean. China Ocean Eng. 2016, 30, 33–46. [Google Scholar] [CrossRef]
  26. Li, M.; Kong, R.; Han, S.; Tian, G.; Qin, L. Novel method of construction-efficiency evaluation of cutter suction dredger based on real-time monitoring data. J. Waterw. Port Coast. Ocean Eng. 2018, 144, 05018007. [Google Scholar] [CrossRef]
  27. Tan, Q.M. Dimensional Analysis; China University of Science and Technology Press: Anhui, China, 2005. [Google Scholar]
  28. Kong, L. Fluid Mechanics I; Higher Education Press: Beijing, China, 2011. [Google Scholar]
  29. Mujal-Colilles, A.; Gironella, X.; Sanchez-Arcilla, A.; Puig Polo, C.; Garcia-Leon, M. Erosion caused by propeller jets in a low energy harbour basin. J. Hydraul. Res. 2017, 55, 121–128. [Google Scholar] [CrossRef]
  30. Tan, R.I.; Yuksel, Y. Seabed scour induced by a propeller jet. Ocean Eng. 2018, 160, 132–142. [Google Scholar] [CrossRef]
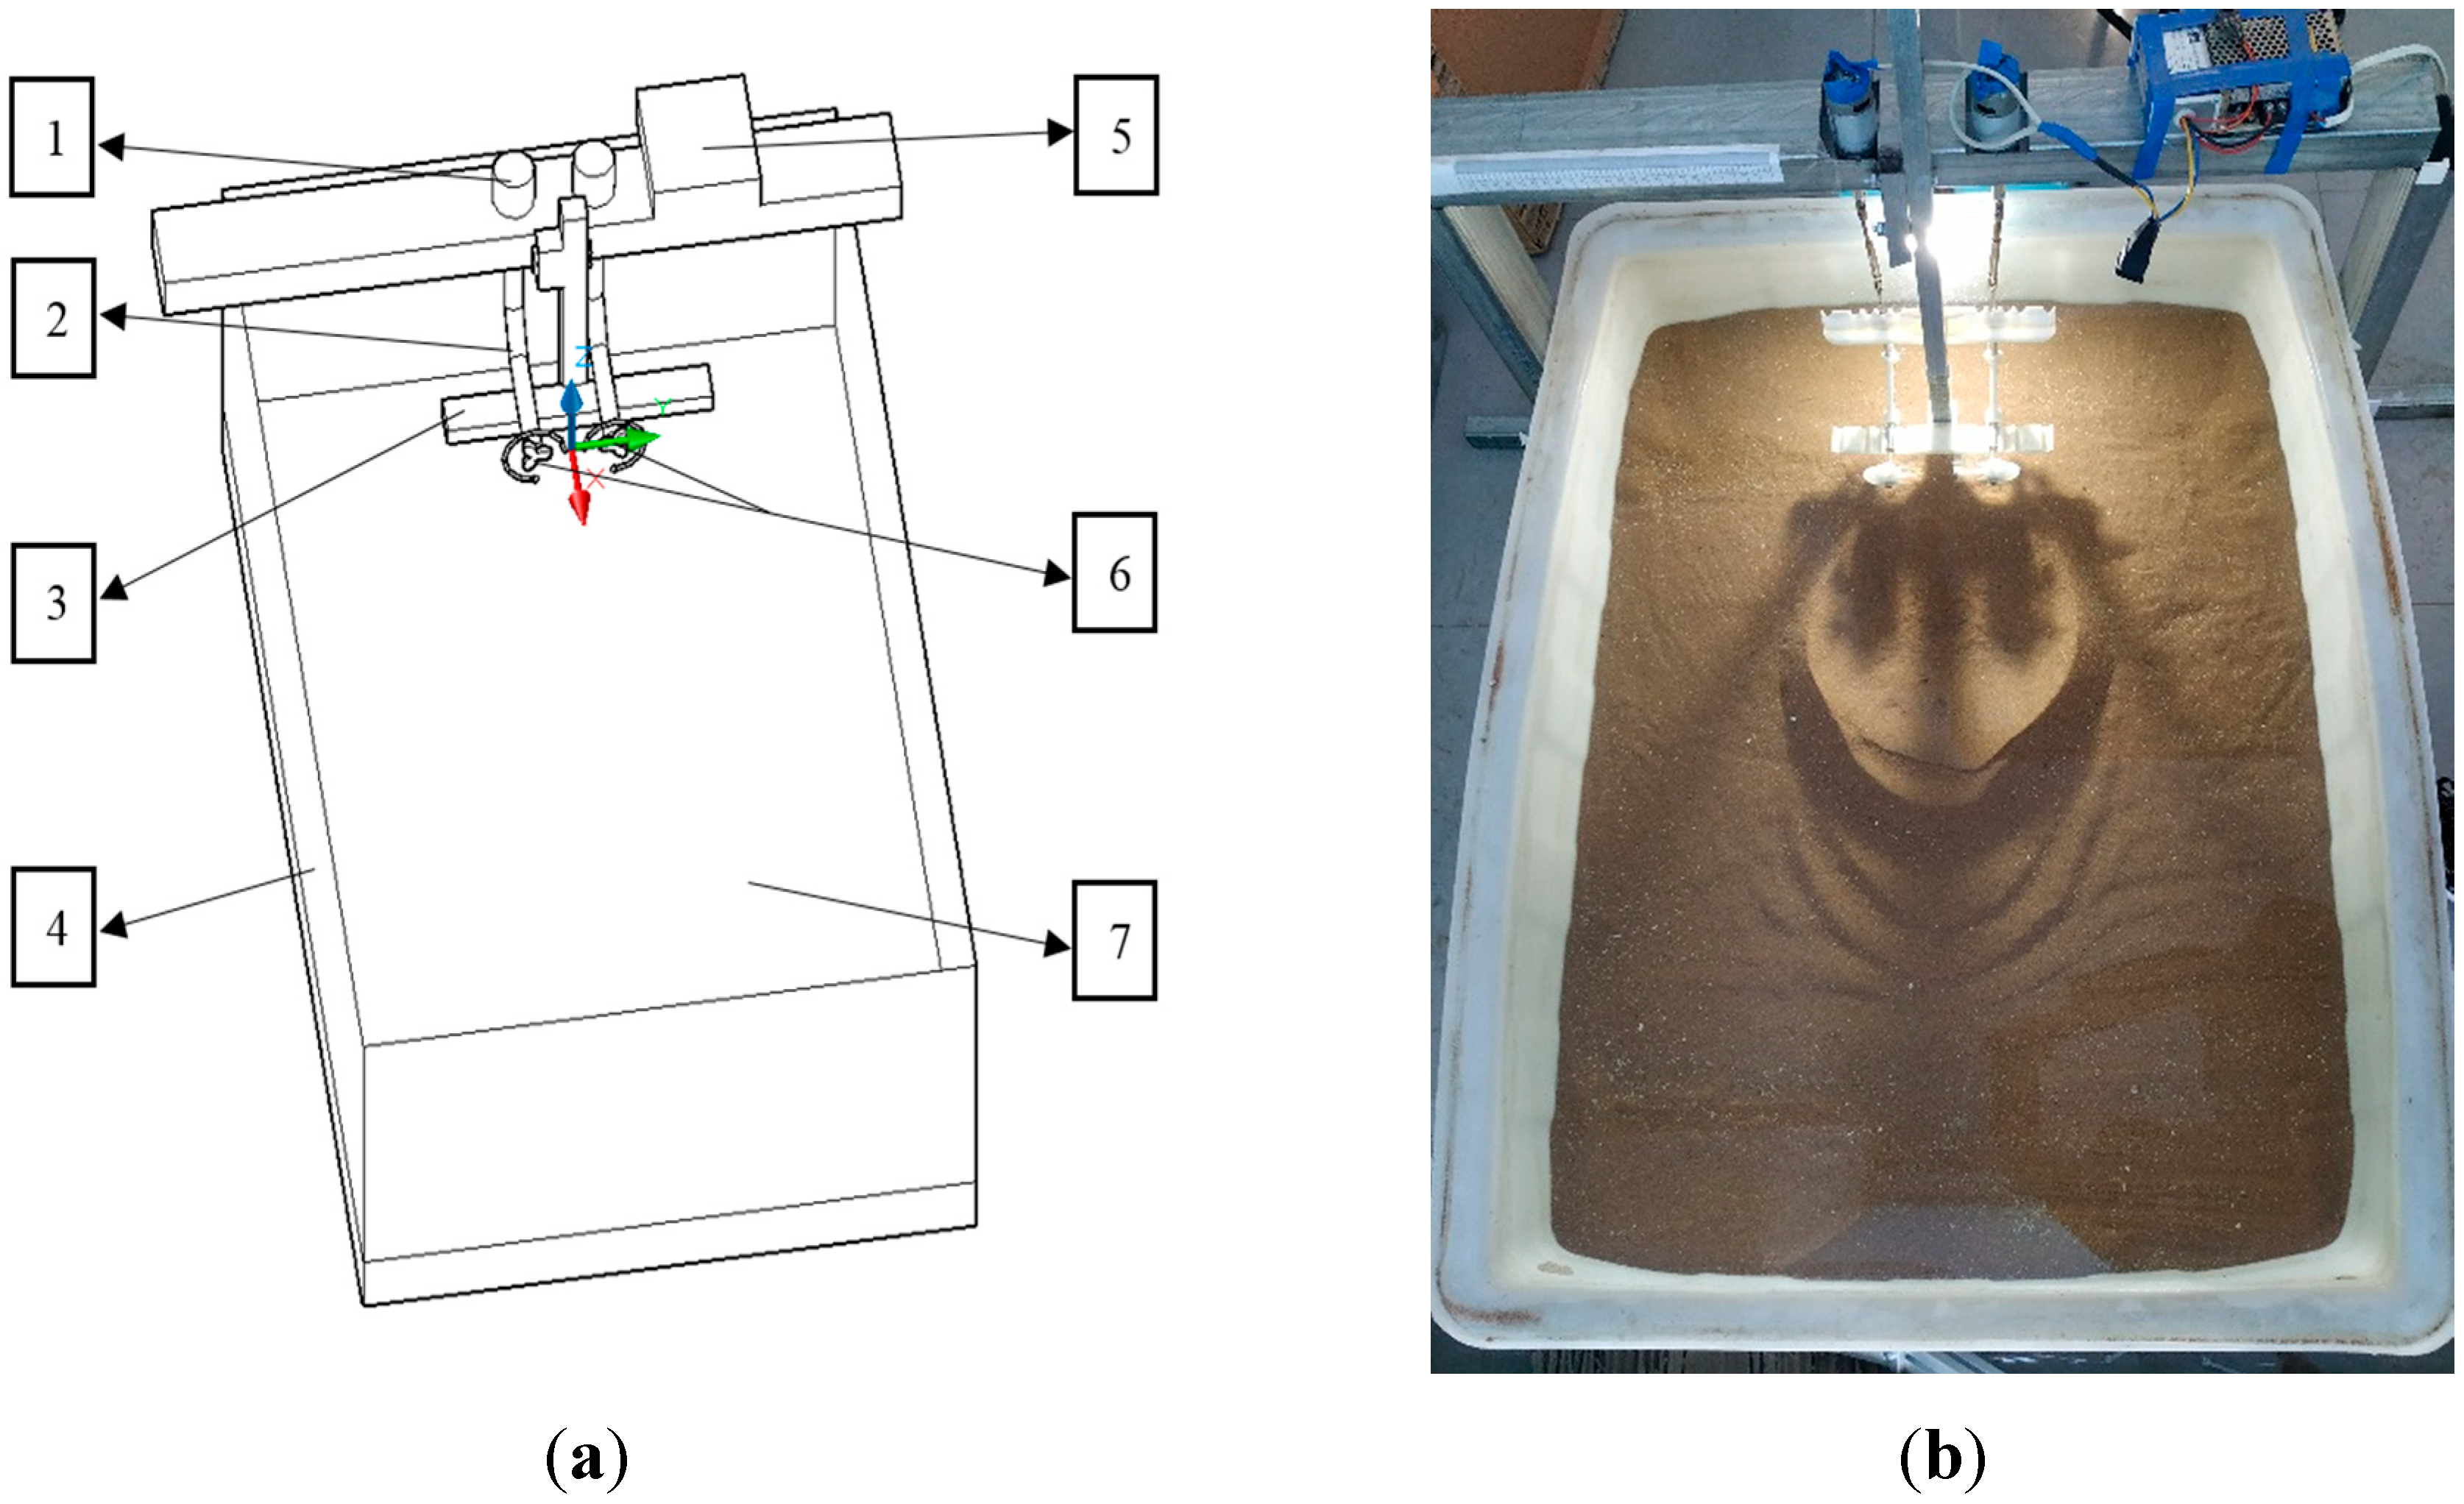
Figure 1. Experimental tank with twin propeller system. (a) schematic diagram; (b) experimental device (1) Geared motor; (2) Powertrain to transfer toque force in 90 degree; (3) Adjustable propeller distance holder; (4) Water tank (1.2 m × 0.8 m × 0.45 m); (5) Transformer and speed switch; (6) Twin-propeller; and, (7) Sandbed.
Jmse 07 00339 g001
Figure 2. Cumulative frequency curve of sand particle size distribution.
Jmse 07 00339 g002
Figure 3. Measurement system. (1) Laser rangefinder; (2) Optical axis and sliding block; (3) Support (1 m × 1 m × 0.5 m); and, (4) Experimental tank.
Jmse 07 00339 g003
Figure 4. Three-dimensional (3D) printing for propeller model. (a) Printing in progress; and, (b) Printing completion.
Jmse 07 00339 g004
Figure 5. 3D printed twin-propeller and the horizontal support with grooves. (1) Torque conversion system; (2) Grooved support; and, (3) Twin-propeller.
Jmse 07 00339 g005
Figure 6. Relationship between ε twin / ε m and ln (t).
Jmse 07 00339 g006
Figure 7. Determination (a) C 1   and   A   in   C 1 ( d p d 50 ) A ; (b) C 2   and   B   in C 2 ( d p d 50 ) B .
Jmse 07 00339 g007
Figure 8. Comparison between the experimental scour depth and predicted scour depth.
Jmse 07 00339 g008
Table 1. Experiment Test Set.
Experiment NumberC (mm) d p   ( mm ) n (rpm)V0 (m/s)F0T (s)
Twin-propeller TE-127.51105000.4638.1357200
Twin-propeller TE-227.582.55000.4638.1351800
Twin-propeller TE-327.5137.55000.4638.1351800
Twin-propeller TE-427.51655000.4638.1351800
Twin-propeller TE-551105000.4638.1351800
Twin-propeller TE-6551105000.4638.1351800
Single-propeller S-127.5/5000.4638.1351800
Table 2. Propeller characteristics.
Propeller D p (mm)CtP′βDh (mm)
Propeller-55 (Present research)550.401.000.4711.5
Table 3. Calculated C 1 ( d p d 50 ) A and C 2 ( d p d 50 ) B at various distance of twin-propeller.
dp 1.5 D p 2 D p 2.5 D p 3 D p
C 1 ( d p d 50 ) A 2.0291.7061.2951.146
C 2 ( d p d 50 ) B 0.8970.8830.9550.981
Table 4. Calculated C1, and A in   C 1 ( d p d 50 ) A .
Distance   Between   Propellers   ( d p ) d p d 50 C 1 ( d p d 50 ) A
1.5 Dp412.52.029
2.0 Dp550.01.706
2.5 Dp687.51.295
3 Dp825.01.146
Table 5. Calculated C2, and B in   C 2 ( d p d 50 ) B .
Distance   Between   Propellers   ( d p ) d p d 50 C 2 ( d p d 50 ) B
1.5 Dp412.50.897
2.0 Dp550.00.883
2.5 Dp687.50.955
3 Dp825.00.981
Table 6. Comparison of the proposed twin-propeller scour equation and previous researchers
ResearchersType of PropellerEquationsTime-Dependent Scour Depth of 7200 s (mm)Variation (%)
ProposedequationTwin-propeller ε twin = Ω t [ l n ( t ) ] Γ t
Ω t = 0.2526 × ( d p d 50 ) 0.859 ( C d 50 ) 4.63 ( D p d 50 ) 3.58 F 0 4.535
Γ t = 1.389 × ( d p d 50 ) 0.1571 ( C d 50 ) 0.742 ( D p d 50 ) 0.522 F 0 0.682
56.9-
Hamill [5]Single-propeller ε m a x = Ω [ l n ( t ) ] Γ
Ω = 6.9 × 10 4 × ( C d 50 ) 4.63 ( D p d 50 ) 3.58 F 0 4.535
Γ = 4.113 × ( C d 50 ) 0.742 ( D p d 50 ) 0.522 F 0 0.682
53.36
Hong et al. [9]Single-propeller ε m a x D p = k 1 [ l o g 10 ( U 0 t D P ) k 2 ] k 3
k 1 = 0.014 F 0 1.12 ( G D p ) 1.74 ( G d 50 ) 0.17
k 2 = 1.882 F 0 0.009 ( G D p ) 2.302 ( G d 50 ) 0.441
k 3 = 2.477 F 0 0.073 ( G D p ) 0.53 ( G d 50 ) 0.045
38.731
Yew [15]Twin-propeller ε t w i n = k ( logt ) 0.0231
k = ( C D p ) 0.488 ( U 0 t C ) 0.241
80.040
Mujal-Colilles et al. [29]Single-propellerAgree with Hong (2013)38.731
Tan & Yuksel [30]Single-propeller ε m a x D p = 0.57 ( F r d F r d c ) 0.33 ( G D p ) 1.1
F r d c = 2.1 G D p
56.60.5