Article

Comparison of Physical to Numerical Mixing with Different Tracer Advection Schemes in Estuarine Environments

1
Integrated Statistics, Contracted to the U.S. Geological Survey, Woods Hole, MA 02543, USA
2
State Key Laboratory of Estuarine and Coastal Research, East China Normal University, Shanghai 200062, China
3
Woods Hole Oceanographic Institution, Applied Ocean Physics and Engineering, Woods Hole, MA 02543, USA
4
U.S. Geological Survey, Coastal and Marine Geology Program, Woods Hole, MA 02543, USA
*
Author to whom correspondence should be addressed.
J. Mar. Sci. Eng. 2019, 7(10), 338; https://doi.org/10.3390/jmse7100338
Submission received: 7 August 2019 / Revised: 16 September 2019 / Accepted: 19 September 2019 / Published: 26 September 2019

Abstract

:
The numerical simulation of estuarine dynamics requires accurate prediction for the transport of tracers, such as temperature and salinity. During the simulation of these processes, all the numerical models introduce two kinds of tracer mixing: (1) by parameterizing the tracer eddy diffusivity through turbulence models leading to a source of physical mixing and (2) discretization of the tracer advection term that leads to numerical mixing. Physical and numerical mixing both vary with the choice of horizontal advection schemes, grid resolution, and time step. By simulating four idealized cases, this study compares the physical and numerical mixing for three different tracer advection schemes. Idealized domains only involving physical and numerical mixing are used to verify the implementation of mixing terms by equating them to total tracer variance. Among the three horizontal advection schemes, the scheme that causes the least numerical mixing while maintaining a sharp front also results in larger physical mixing. Instantaneous spatial comparison of mixing components shows that physical mixing is dominant in regions of large vertical gradients, while numerical mixing dominates at sharp fronts that contain large horizontal tracer gradients. In the case of estuaries, numerical mixing might locally dominate over physical mixing; however, the amount of volume integrated numerical mixing through the domain compared to integrated physical mixing remains relatively small for this particular modeling system.

1. Introduction

Estuaries provide critical habitat to sustain marine life. The transport of tracer quantities, such as salinity, sediment, plankton, nutrients, and pollutants, are crucial factors that determine the quality and sustainability of estuaries. The salinity is also an important dynamical variable in estuaries, such that the mixing of saline water with fresh water has important consequences for estuarine circulation and stratification [1]. These interactions of mixing and stratification can depend on several factors such as the size, depth, forcing characteristics, river inflow [2], ocean salinity, tidal forcing and wind forcing [3,4]. This implies that an understanding the processes that cause mixing is a fundamental requirement in the prediction of estuarine dynamics.
To gain an understanding of processes causing mixing in estuaries, several observational studies [5,6,7,8,9,10] have included direct measurements to obtain the turbulent fluxes of momentum, dissipation of turbulent kinetic energy, or turbulent buoyancy flux. The observational work provides data showing the importance of the broad range of conditions that are involved in estuary scale mixing processes. However, the observations can be challenging in regions of high spatial variability with complex bathymetry or in shallow depths. Numerical models can be employed to provide an increased understanding of the observational data. Several one-dimensional models [11,12,13,14,15] quantify mixing through the on-dimensional (1-D) vertical representation of velocity and salinity fields. The 1-D approaches ignore the lateral processes and under-predict mixing in strongly stratified areas near the pycnoclines. Other lower order models parameterize the role of mixing with eddy coefficients which depend on the strength of the tidal velocity [3,16,17]. They solve for tidally averaged momentum and salinity equations in a rectangular estuary with two vertically averaged levels. These works highlight the importance of further exploring the dynamical balances in estuarine dynamics to get a better estimate of mixing of tracers such as salinity.
With advances in computational power, numerical simulations of complex estuarine processes are more prevalent through three-dimensional (3-D) Reynolds Averaged Navier-Stokes (RANS) based numerical models. All numerical models inherently include two sources of mixing: physical (resolved) mixing and numerical mixing due to the discretization scheme and are described, as follows.

1.1. Physical Mixing

Physical mixing is introduced through the parameterization of eddy viscosity, typically through turbulence closure models. In RANS based models, the ensemble averaged momentum equation (1) results in a Reynolds stress term that accounts for the fluctuating flow.
U i t + U j U i x j + 2 ε i j l Ω j U i =   1 ρ 0   P x i g i ρ ρ 0 x j ( u j   u i   ¯ v U i x j )
where subscript “i” and “j” represent the individual directions, U i and u i   are the mean and turbulent component of velocities respectively, ε i j l Ω j is the rotation tensor, P is the pressure, g i is acceleration due to gravity, ρ and ρ 0 are total and reference density respectively, u j   u i   ¯ is the Reynolds stress tensor, and v is the molecular kinematic viscosity. Along with the Reynolds stress term that is introduced through the ensemble averaged momentum equations, the tracer transport equation introduces a turbulent tracer flux term that accounts for fluctuation of tracer quantities in the flow. The transport equation for the tracer quantities is written as:
C t + U j C x j =   x j ( u j   c ¯ v θ C x j )
where C and c represent the mean and fluctuating components of any tracer quantity (such as salinity, temperature or suspended sediment), u j   c ¯ is the turbulent tracer flux, and v θ is the molecular diffusivity.
The goal of all the turbulence models is to parameterize the fluctuating terms i.e., the Reynolds stress u j u i ¯ and the turbulent tracer fluxes u j   c ¯ in terms of the mean flow. Establishing such a relationship is referred to as the “closure model”. The Reynolds stress term is related to mean flow through eddy viscosity for momentum ( K V ) and the turbulent tracer fluxes are related to mean tracer gradients through eddy diffusivity for tracers ( K T ) . There are different closure models that might depend on the application and computational costs. The most commonly used turbulence closure models involving ocean modeling applications originate from the family of two-equation generic length scale (GLS) models [18]. Different variations in the turbulence closure models use different parameterizations to represent the production and dissipation of turbulence, along with a variety of parameterizations to represent the stability and wall functions. A detailed analysis of the equations involving different turbulence closure models and their performance was conducted by [19,20,21].

1.2. Numerical Mixing

The discretization of the tracer transport advection term (second term in Equation (2)) introduces numerical mixing in models. The accuracy of the advection term depends on grid size, choice of advection schemes, and time step size. An increase in grid resolution resolves finer scales; however, the available computational resources often limit the selection of grid size. This issue is further complicated, because an increase in spatial resolution accompanies an increase in temporal resolution to maintain stability [22] in ocean models.
Based on the differences in the formulation of advection schemes, the resulting numerical errors (diffusive and dispersive errors) can vary for a given grid size. Physically, the diffusion errors manifest as smearing of fronts and dispersive errors cause the formation of unrealistic ripples near the fronts. Additional steps, such as the use of limiters, are taken to avoid the formation of spurious wiggles (creation of artificial maximum or minima of tracer) and to maintain nonnegative tracer quantities. At a discrete level, the advection schemes are required to conserve mass. Overall, a high-order accurate, non-oscillatory, and mass conserving advection scheme is desirable for practical applications. More details on the numerical properties that affect advection schemes are available in [23]. The amount of numerical mixing on tracer mixing that is caused by various advection schemes can be estimated through the Taylor series or Von Neumann approach. These analysis methods are difficult to apply when the advection schemes are formulated by using adaptive spatial stencils, limiters, or possess multi-dimensionality properties. Therefore, it is important to find the amount of numerical mixing that is caused by the choice of advection schemes. Other methods, such as the reference potential energy to quantify the spurious mixing in non-isopycnal models, have been utilized [24,25], and found that the increase in horizontal resolution led to a higher fraction of spurious mixing through the contribution of vertical processes. Recently, a discrete variance decay method for quantifying physical and numerical mixing by calculating the loss of kinetic energy could quantify the mixing due to advective and diffusive fluxes [26].
Similar to these aforementioned studies, the goal of this work is to quantify physical and numerical mixing, in a 3-D RANS based ocean model that is applied to an estuarine environment. The estimation of the physical and numerical mixing is based on the work of Burchard and Rennau, 2008. The quantification of mixing allows for understanding the impact of different advection schemes on the tracer distribution in estuarine environments. This article is organized, as follows: the methods describing the numerical model, the choice of different advection schemes and the method to estimate physical and numerical mixing are discussed in Section 2. In Section 3, we use four test cases to quantify physical mixing. In Section 4, we discuss the effects of different advection schemes on mixing from the model and apply the methods to estimate mixing on a realistic application of the Hudson River. Section 5 consists of the summary and conclusions from the current work.

2. Methodology

2.1. Numerical Model Description

The open-source Coupled Ocean-Atmosphere-Wave-Sediment Transport (COAWST) numerical modeling system [27] is utilized for the current work. The hydrodynamic component of this coupled system is ROMS (Regional Ocean Modeling System), which is a three-dimensional, free surface, terrain-following numerical model that solves finite-difference approximations of the RANS equations while using the hydrostatic and Boussinesq assumptions [28,29] with a split-explicit time stepping algorithm [30,31]. The barotropic and baroclinic momentum equations are solved using different time steps (i.e., a shorter time step for the barotropic component) while assuming the hydrostatic approximation. ROMS employs a two-way, time-averaging procedure for the barotropic mode that satisfies the 3-D continuity equation. It uses a horizontal curvilinear Arakawa C grid and vertical stretched terrain-following coordinates. Momentum, scalar advection, and diffusive processes are represented while using transport equations. The density field is determined from an equation of state that accounts for temperature, salinity, and suspended-sediment concentrations. Further details regarding the numerical algorithms and techniques present in COAWST model are mentioned in [27].

2.2. Different Tracer Advection Scheme Choices in COAWST Model

The modeling system allows for choices of many of the model components, including several options for advection schemes of momentum and tracers. We have chosen and used in this work three different tracer advection schemes for comparison that are fundamentally different in their formulation.

2.2.1. Multidimensional Positive Definite Advection Transport Algorithm (MPDATA)

MPDATA has been derived from Lax Wendroff (LW) family of schemes and it was developed [32,33] by subtracting spatial approximations of higher order error terms from the first order solution, thus obtaining a second order of accuracy. MPDATA is formulated to conserve the sign of the tracers (positive definite) in multi-dimensions introducing cross derivate terms rather than preserving monotone solutions in one spatial dimension.

2.2.2. Third-order Upstream-biased Horizontal Scheme (U3H)

U3H was formulated [34] while using an upstream biased stencil through parabolic interpolation to obtain a third order accurate advection scheme. Unlike MPDATA, the U3H is a directionally split scheme (no cross derivative) terms. A fourth-order centered scheme has been used for vertical advection while the U3H only solves horizontal terms.

2.2.3. High-order Spatial Interpolation at the Middle Temporal Level (HSIMT)

HSIMT was formulated [35] while using a local quadratic distribution of tracer computed at the current time level resulting in a third order accurate advection scheme. The tracer values are constrained to avoid oscillations and preserve monotonicity while using the Sweby’s Total Variation Diminishing (TVD) limiter [36]. It is a directionally split scheme (no cross derivative terms) and it maintains the positive definite characteristics of the initial tracer quantity.

2.3. Estimating Physical and Numerical Mixing

2.3.1. Physical Mixing

One of the ways to quantify the mixing in ocean models is to evaluate the tracer eddy diffusivity ( K T ) (as described in Section 1) introduced in the tracer transport equation (Equation (2)). However, diffusivity alone may not be a strong indicator of mixing, because a higher value of eddy diffusivity in a homogeneously distributed tracer quantity is not producing increased mixing. Burchard and Rennau 2008 [37] suggest that the decay of mean tracer variance is a far better measure of mixing. When considering a three-dimensional domain of volume V, e.g., the entire estuary, we can decompose the tracer as C = C + C , where angle brackets denote the volume average and prime denotes the deviation from the average, with the volume average of prime vanishing, i.e., C = 0. The equation describing the decay of tracer variance is written as:
( C ) 2 t +   . [ u   ( C ) 2 K ( C ) 2 ] 2 C u . C =   2 ( K C ) . ( C )
where the tracer vector and velocity vector can be decomposed as C = C + C , u   = u + u , respectively, and angle brackets denote the volume average while prime denotes the deviation from the average. Additionally, is the gradient operator, and K is a three-dimensional matrix with K x x , K y y , and K Z Z being eddy diffusivity coefficients in three dimensions and other non-diagonal elements (e.g., K x y ) in K being 0.
The volume integral is evaluated to remove some of the terms and further simplify (Equation (3)). The vertical integral of the third term on the left hand side divergence of vertical diffusive flux z K Z Z [ ( C ) 2 z ] is zero, recognizing that the vertical turbulent flux K Z Z [ ( C ) 2 z ] vanishes at the surface and bottom. Additionally, when Equation (3) is integrated over the volume V, the integral of fourth term on the left side 2 C u . C amounts to zero. The divergence of horizontal diffusive fluxes contained in the third term on the left side are relatively much smaller than vertical due to the large horizontal scales in estuaries. Similarly, the horizontal components of the right side of Equation (3) are relatively small when compared to vertical mixing based on the aspect ratio in estuaries. With these reductions, Equation (3) simplifies to the form of:
( C ) 2 t d V +   .   u   ( C ) 2 d V = 2 K Z Z ( C z ) 2 d V
By using the divergence theorem, the second term from the LHS in Equation (4) can be converted to represent the advection of tracer variance across the domain (Equation (5)), where n ^ is the unit normal vector and d S is the area of the domain boundaries.
( C ) 2 t d V +   u   ( C ) 2 n ^ d S   = 2 K Z Z ( C z ) 2 d V
shows that the change of tracer variance inside a domain is controlled by the net flux of tracer variance across the domain boundaries and the dissipation of variance due to mixing inside the domain. According to [37], the right hand side term provides the mixing in the model, as it represents the action of homogenizing tracer variance through mixing. Thus, the physical mixing from the model is equal to:
D p h y s i c a l = 2 K z z ( C z ) 2   or   2 K T ( C z ) 2
where D p h y s i c a l is the physical mixing, KT is the vertical eddy diffusivity for the tracer, and C z is the vertical tracer gradient. Note that the physical mixing in Equation (6) only accounts for vertical mixing and it has been approximated after neglecting the horizontal contributions.

2.3.2. Numerical Mixing

Equation (4) provides a relationship between decay of tracer variance and mixing. It should be noted that, theoretically, the mixing term (RHS of Equation (4)) only accounts for prescribed vertical mixing (Equation (5)). However, in numerical models, the discretization process of tracer quantities to solve for the advective terms introduces the other form of mixing i.e., numerical mixing. Therefore, physical and numerical mixing both contribute towards total mixing in numerical models. The amount of numerical mixing can be computed whole using the expression provided by [37] and calculated at each time step by taking the difference between advected square of the tracer and the square of advected tracer. It is equal to:
D n u m e r i c a l = A { C 2 } ( A { C } ) 2 Δ t
where, D n u m e r i c a l is the numerical mixing, C is any tracer quantity, A{} is the advection operator (depending on the advection scheme), and Δ t is the model time step. One can independently calculate the mixing in each direction and the resulting values can be positive or negative, depending on the advection scheme for a particular grid size. All advection schemes that intend to reduce diffusion by including correction/anti-diffusive terms (Flux Corrector Schemes-FCS schemes add controlled diffusion/anti-diffusion to reduce overshoots) or preserve monotonicity by including limiters (Flux Limited Schemes) cause negative numerical mixing.
The volume integral of numerical mixing that was obtained from Equation (7) can be added to the RHS of Equation (4) to obtain the total mixing from the model. For a closed domain, the second term (advection term) of tracer variance on the LHS of Equation (4) goes to zero. Therefore, the volume integral of mean tracer variance decay should amount to the volume integral of physical and numerical mixing.

3. Model Simulations

The model simulations include four idealized test cases that vary with increasing complexity to compare physical and numerical mixing with different advection schemes. These idealized test cases include: (1) Wind-induced mixed-layer deepening that involves only physical mixing, (2) Horizontal tracer patch propagation that involves only numerical mixing, (3) Lock-exchange representing an estuary without any tidal or river forcing and involves both physical and numerical mixing, and (4) Estuary with tidal and river forcing resulting in both physical and numerical mixing from the model. The last model simulation presented in the section includes the application of a realistic Hudson River estuary.

3.1. Test Case 1: Wind-induced Mixed-layer Deepening

This test case is based on wind-induced deepening of a mixed-layer that was described in observations of [38] and analytically by [39], and computationally described by [40,41]. This mixed-layer deepening case provides a simplified analysis of mixing processes in the vertical direction. Because of the mixing in vertical direction and no advection, this test case is used to verify the implementation of physical mixing terms in the model. The tracer in consideration is temperature that is initialized by prescribing a vertical linear variation at the surface to the bottom and starts to mix under the application of surface stress. The tracer only mixes due to the vertical diffusion. The model domain is 500 m long with a width of 100 m and a depth of 50 m. The number of grid spacing in the x, y, and z directions are 10, 5, and 200 respectively, which lead to a vertical resolution of 0.25 m. The north and south boundaries are prescribed with free-slip walls while east and west boundaries are periodic (the longest axis is in the east-west direction). Initially, the temperature varies linearly from 13 °C at the surface to 10 °C at the bottom (Figure 1a). A surface stress of 0.1 N/m2 in the x-direction provides the surface friction velocity that creates a periodic east-west flow, leading to mixing in the vertical direction. The simulation is performed at a barotropic time step of 10 s for a period of 30 h. The baseline numerical simulation is performed while using the MPDATA advection scheme using the k ε turbulence model.
Figure 1a observed the vertical profile of initial and final temperatures. The initial linearly stratified tracer mixes under the action of surface stress. The mixed layer depth from the test case is identified as the location where the turbulent kinetic energy < 10−5 m2s−2 and compared with the analytical solution of Price et al., 1979 [42] (Figure 1b). The mixed layer depth is found to be 33 m at the end of 30 h (end of simulation). The efficiency of stratified mixing in estuaries determines the rate at which tracers can be vertically transported. One measure of mixing efficiency is the Flux Richardson ( R f ) number [10], which is the ratio of buoyant and turbulence production and it is described as:
R f = B P
where, the buoyancy production is defined as B = g ρ z K T ; where g is the gravity constant, ρ z is the vertical gradient of density, and KT is the vertical eddy diffusivity. The production term is defined as P = ( u z ) 2 K v , where ( u z ) 2 is the vertical gradient of velocity and K v is the vertical eddy viscosity. Figure 1c shows the Flux Richardson number R f for this test case. It can be noticed that R f is close to zero in the near-surface, weakly stratified layer, and it approaches a constant value slightly less than 0.25 through most of the mixing layer.
The total mixing is computed by the volume and time integral of physical and numerical mixing and comparing with the volume and time integral of mean tracer variance decay (Equation (3), described in Section 2.3). For this test case, physical mixing accounts for all of the mixing and it is equal to the total variance decay (Table 1). The numerical mixing is zero in this test case because the velocity is spatially uniform, which leads to a spatial gradient equal to zero, and thus there is no contribution of advection terms in this case. Therefore, all of the mixing in the model can be attributed to physical mixing. Identical results are obtained with other two tracer advection schemes (U3H and HSIMT).

3.2. Test Case 2: Horizontal Tracer Patch Propagation

The second test case is the horizontal propagation of a tracer patch in one-dimension. Because of no horizontal diffusivity and in the absence of any vertical gradients, the mixing in this test case is entirely numerical. The test case helps in verifying the implementation of numerical mixing terms in the model and in comparing the effect of using different tracer advection schemes in the presence of a sharp front. The test case consists of a 3-D model domain that is 100 km long with a width of 100 m and 0.5 m depth. The resolution in the x-, y-, and z, directions is 500 m, 20 m, and 0.05 m, respectively, with the number of grid spacing in x-, y-, and z- directions as 200, 5, and 10, respectively. This leads to a horizontal along-channel grid resolution of 500 m. The model domain comprises of periodic boundary conditions in north, south, east and west directions and the barotropic time step is 40 s. The simulations are first performed without the presence of the tracer to achieve a steady state horizontal velocity of 0.98 m/s. All the vertical layers advect at the same velocity by the application of a body force term through the water column. After a constant streamwise velocity is obtained, the simulations are restarted with the introduction of a passive tracer patch that varies horizontally between 35 km and 65 km initially.
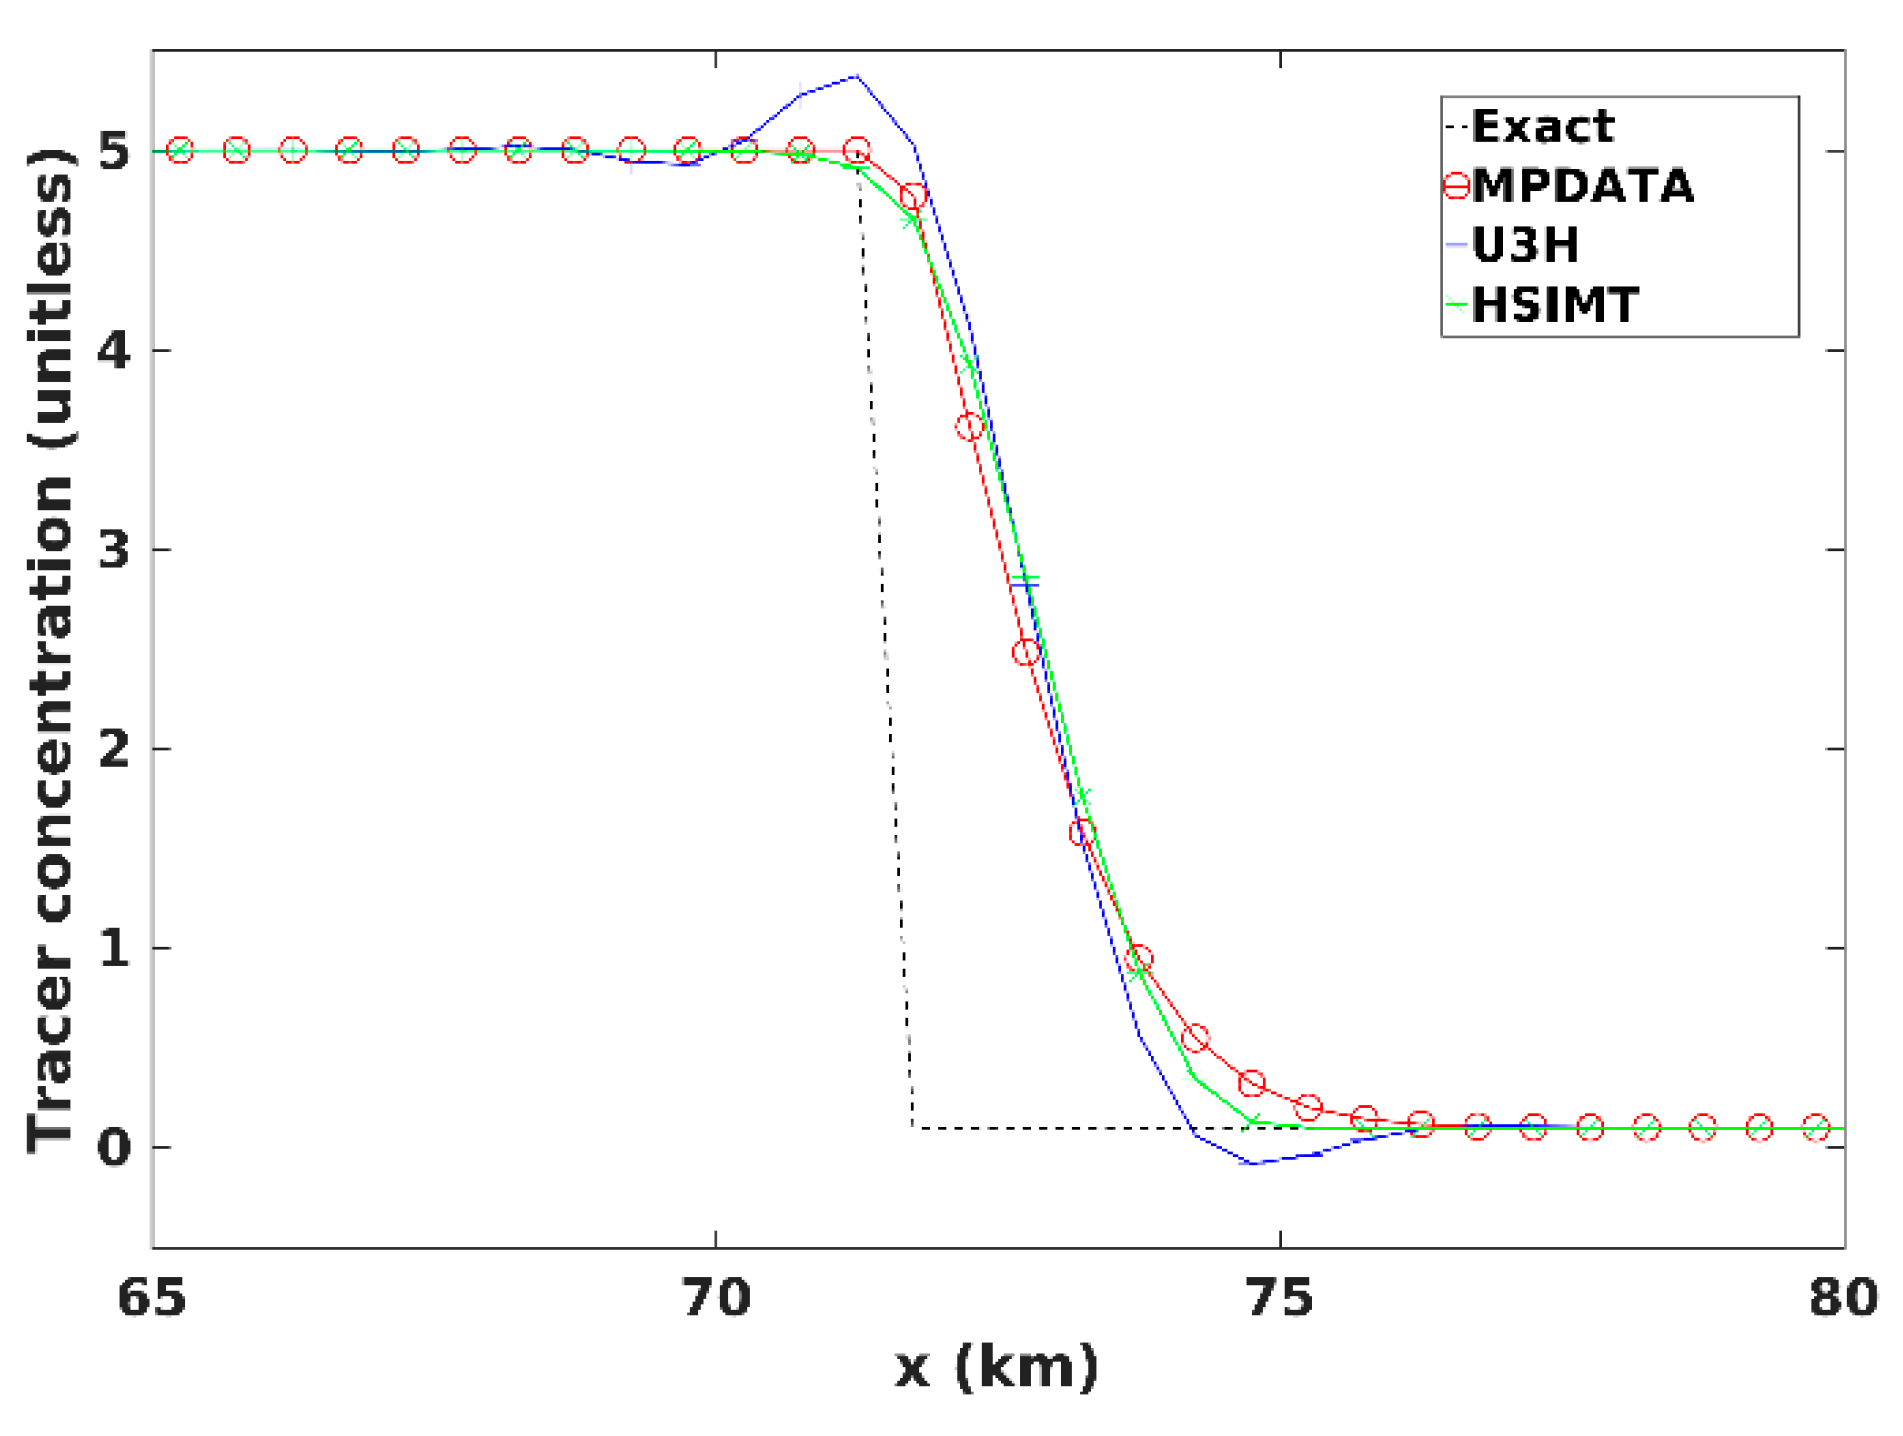
Figure 2 shows the tracer concentration with the three different tracer advection schemes (MPDATA, U3H, and HSIMT) and the exact solution propagation after 9600 s. Out of the three schemes, the U3H shows the closest agreement with the exact solution by maintaining a sharper discontinuity when compared to the other schemes. However, the U3H scheme also shows oscillations around the sharp discontinuities of over- and under- shoots causing negative tracer values. The HSIMT scheme shows a sharper front when compared to the MPDATA. The HSIMT and MPDATA both lack the oscillatory behavior of the U3H, which thereby indicates their monotonicity preserving property. The time and volume integrated values of mixing are compared with the mean tracer variance decay (Table 1). The results show that the total tracer variance decay is equal to the total mixing (in this case only numerical mixing). The least amount of numerical mixing is obtained from the U3H advection scheme (albeit with non-monotonic behavior at the front), while the MPDATA and HSIMT schemes result in similar numerical mixing.
Similar to the definition of vertical eddy diffusivity that is related to the physical mixing in Equation (4), one can compute an effective numerical diffusivity that is based on total numerical mixing and relate it to the horizontal salinity gradient. This helps in quantifying the effect of numerical mixing from different advection schemes where horizontal advection dominates.
D n u m e r i c a l = 2 K a d v e c t i o n s c h e m e ( C z ) 2 d V
where D n u m e r i c a l is the numerical mixing, Kadvection-scheme is the effective numerical diffusivity coefficient, and C x is the horizontal tracer gradient which in this case is salinity. At the end of the simulation, the numerical mixing that is obtained from Equation (7) and horizontal salinity gradient integrated over the entire domain are used to get the volume averaged effective numerical diffusivity from Equation (9). It is further divided by a factor of 0.5 u Δ x , which results in a non-dimensionalized value (Table 2), where Δ x is the spatial resolution. All the schemes have considerably less diffusion than upwind-differencing. The U3H advection scheme shows the least numerical diffusivity, while the MPDATA and HSIMT schemes show comparable effective numerical diffusivity.

3.3. Test Case 3: Lock Exchange Problem

Test case 3 is studied to analyze the mixing properties of numerical schemes with strong horizontal and vertical salinity gradients and shear, but without tidal or river forcing. It is setup by introducing less dense water in the western half of the domain (0 psu) and heavier water (30 psu) on the eastern end reproducing the classic “lock exchange problem”. The sharp difference in fluid density leads to a shear flow driven by the internal pressure gradient. This results in the formation of fronts near the surface and at the bottom along with a stratified shear layer. Friction and rotation are set to zero. The model domain is 12.8 km long, 2 km wide, and with a constant depth of 10 m. The number of interior grid cells are 256 in along channel, four in the cross channel, and 40 in the vertical direction. This leads to a horizontal grid resolution of 50 m and a vertical resolution of 0.25 m. The model domain consists of periodic boundaries in north and south and closed boundaries on the eastern and western end. The baseline simulation is performed with the MPDATA advection scheme with k ε turbulence closure model with a time step of 4 s. A high horizontal viscosity coefficient of 10.0 m2/s is chosen to limit the development of shear waves at the mixing interface. The horizontal diffusivity is set to 0.0 m2/s. This eliminates any horizontal diffusivity in the setup.
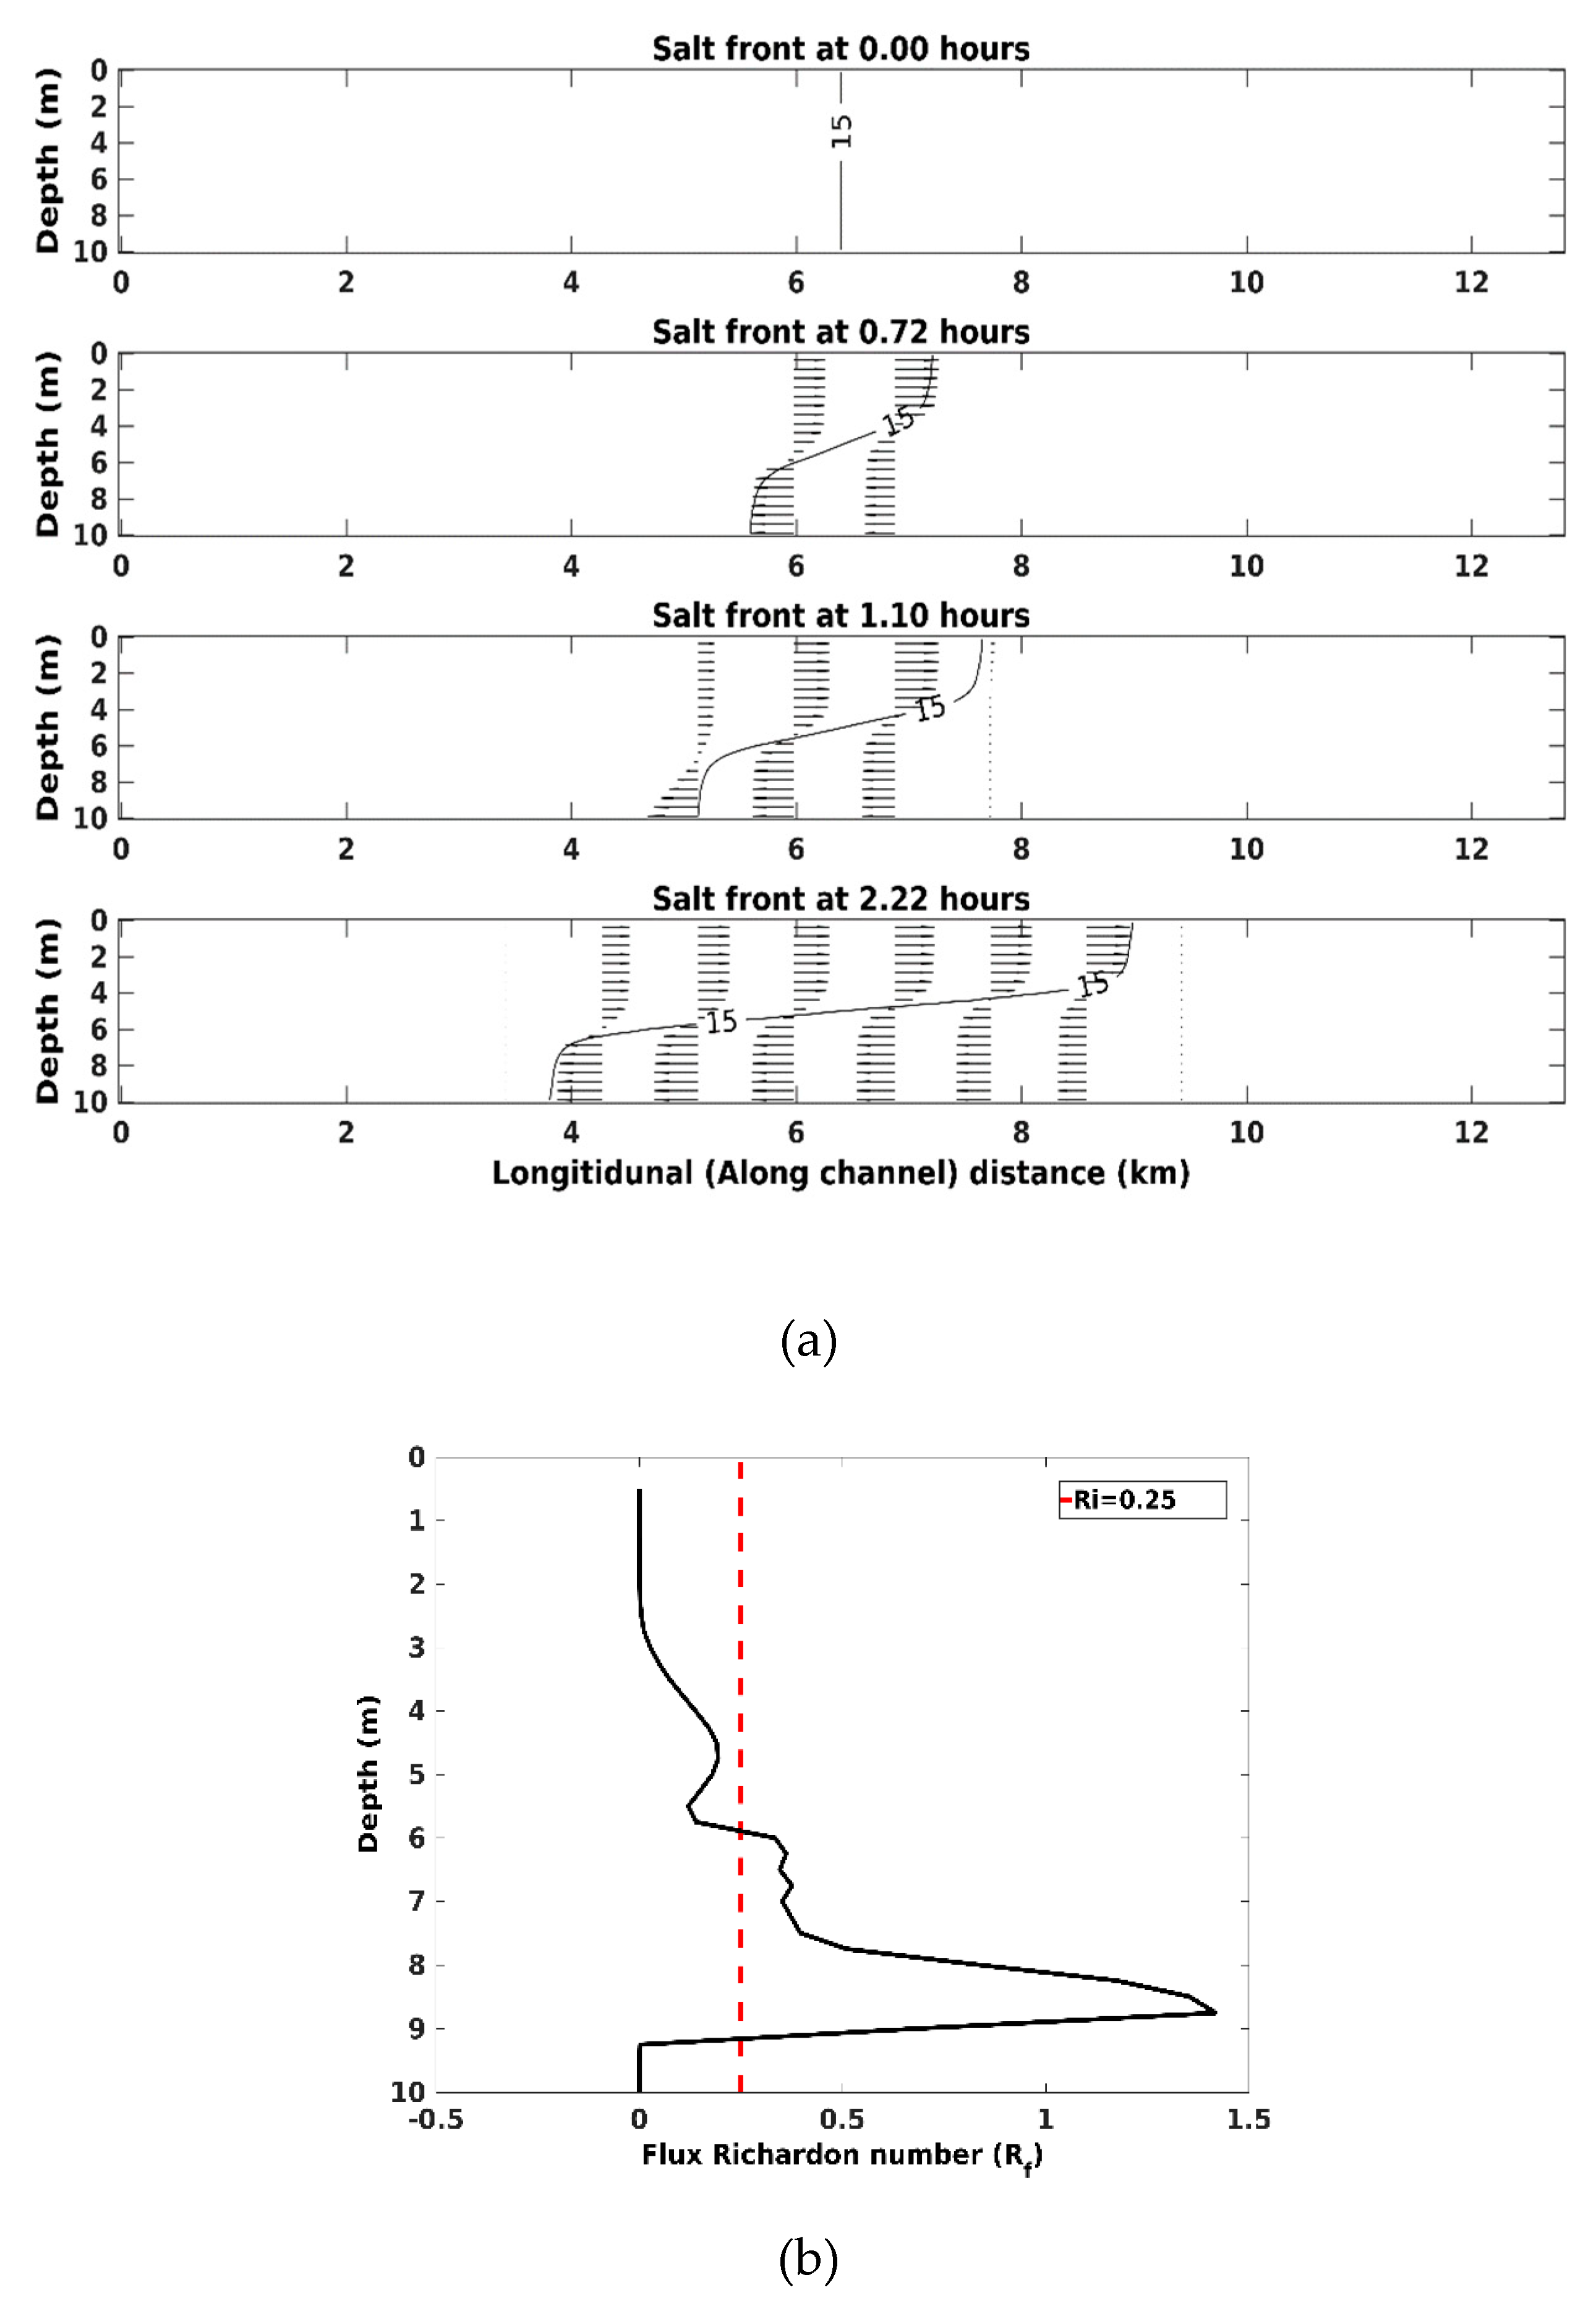
The baseline simulation with the MPDATA advection scheme is setup for a total of 2.2 h. Figure 3a shows the progress of the simulation at 0, 0.72, 1.1, and 2.2 h. The front travels at a speed of 0.45 m/s towards the western boundary and it is positioned at 3.85 km at the end of the simulation (2.2 h). The flux Richardson number at the x = 3.85 km front shows that shear-induced mixing dominates over buoyant forces until a depth of 8.5 m (Figure 3b). This identifies the location of the front. To further establish that test case 3 is representative of an estuarine system, the interfacial drag coefficient is computed in the middle of the domain at x = 6.4 km. The interfacial drag coefficient ( C D i ) is equal to:
C D i = K v d u d z ( Δ u ) 2
where Δ u = ( u 1 u 2 ) 2 and u 1 , u 2 are the velocity in the upper and lower layers of the stratified fluid. The interfacial drag coefficient in the domain at various depths at the end of the simulation reveals a maximum value of C D i = 1.5 × 10⁻⁴, which is of similar order to a highly stratified estuarine front [1].
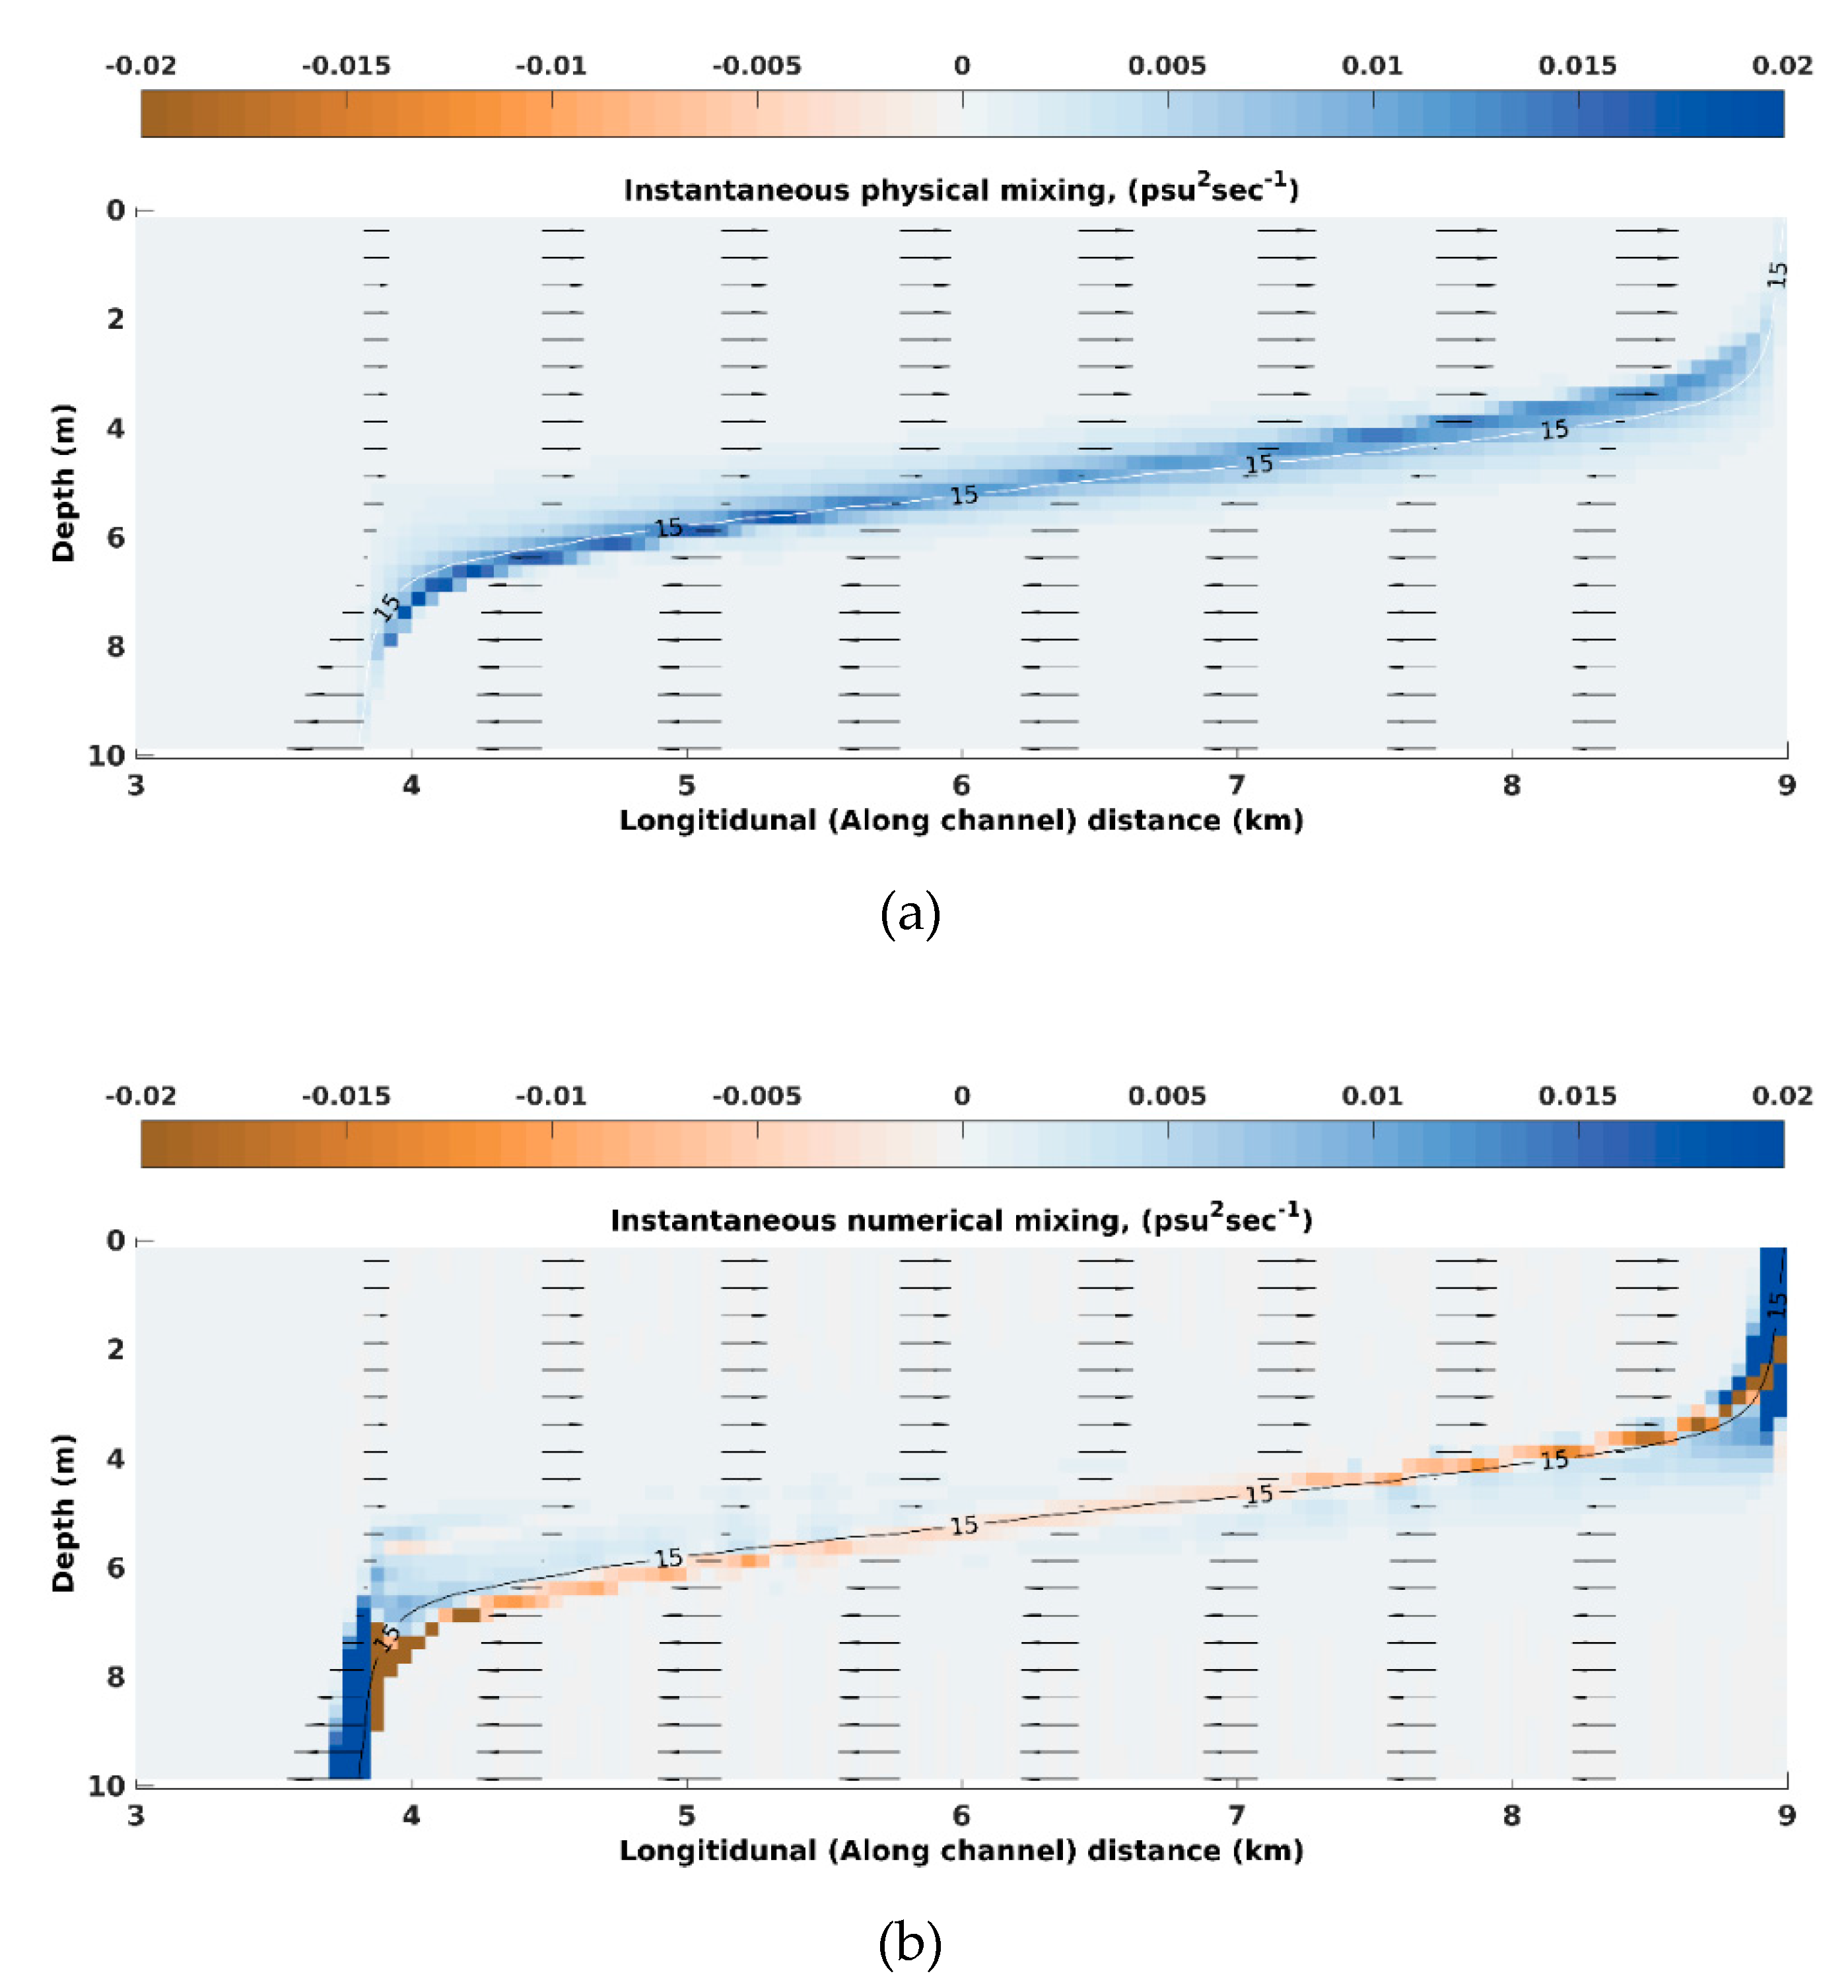
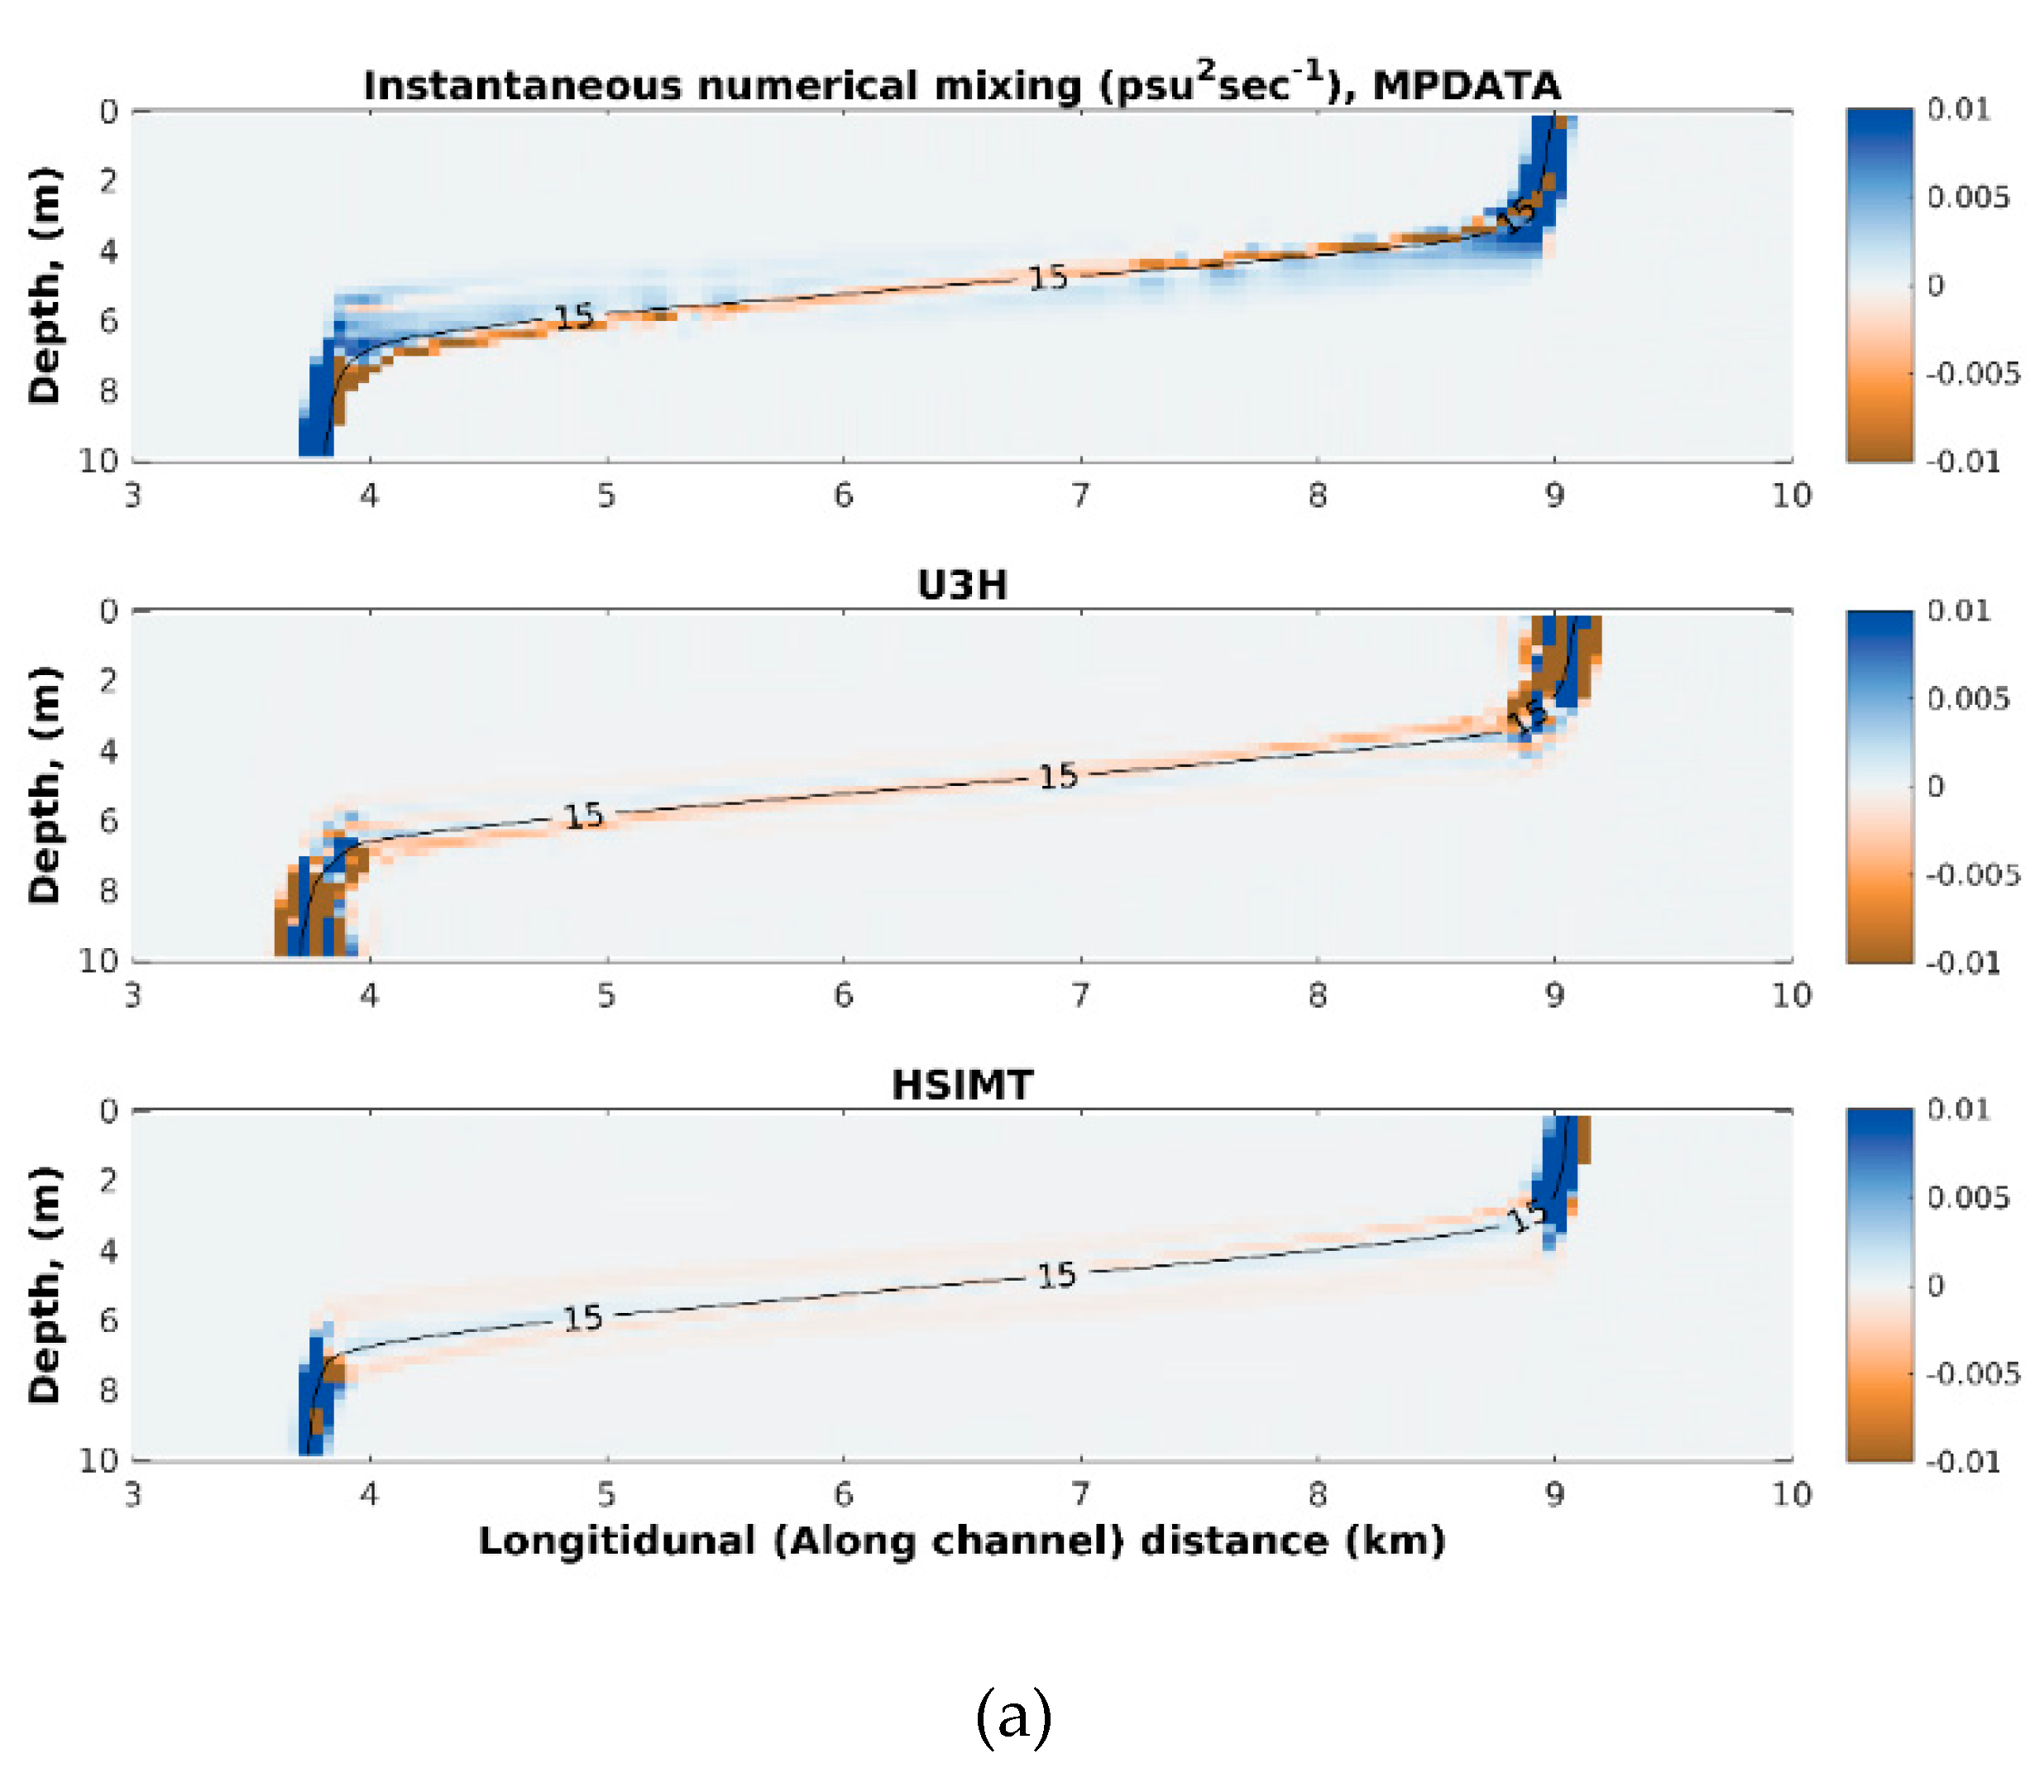
For the baseline case with the MPDATA, the spatial distribution of physical and numerical mixing can be compared in Figure 4a,b. It can be noticed that the physical mixing is higher in the pycnocline (high ds/dz, Figure 4a), while numerical mixing dominates at the fronts (high ds/dx, Figure 4b). The spatial distribution of physical and numerical mixing remains similar with the use of different advection schemes (not shown in the figure). To compare the effects of different advection schemes, numerical mixing varying with depth is observed at the end of the simulation (Figure 5a).
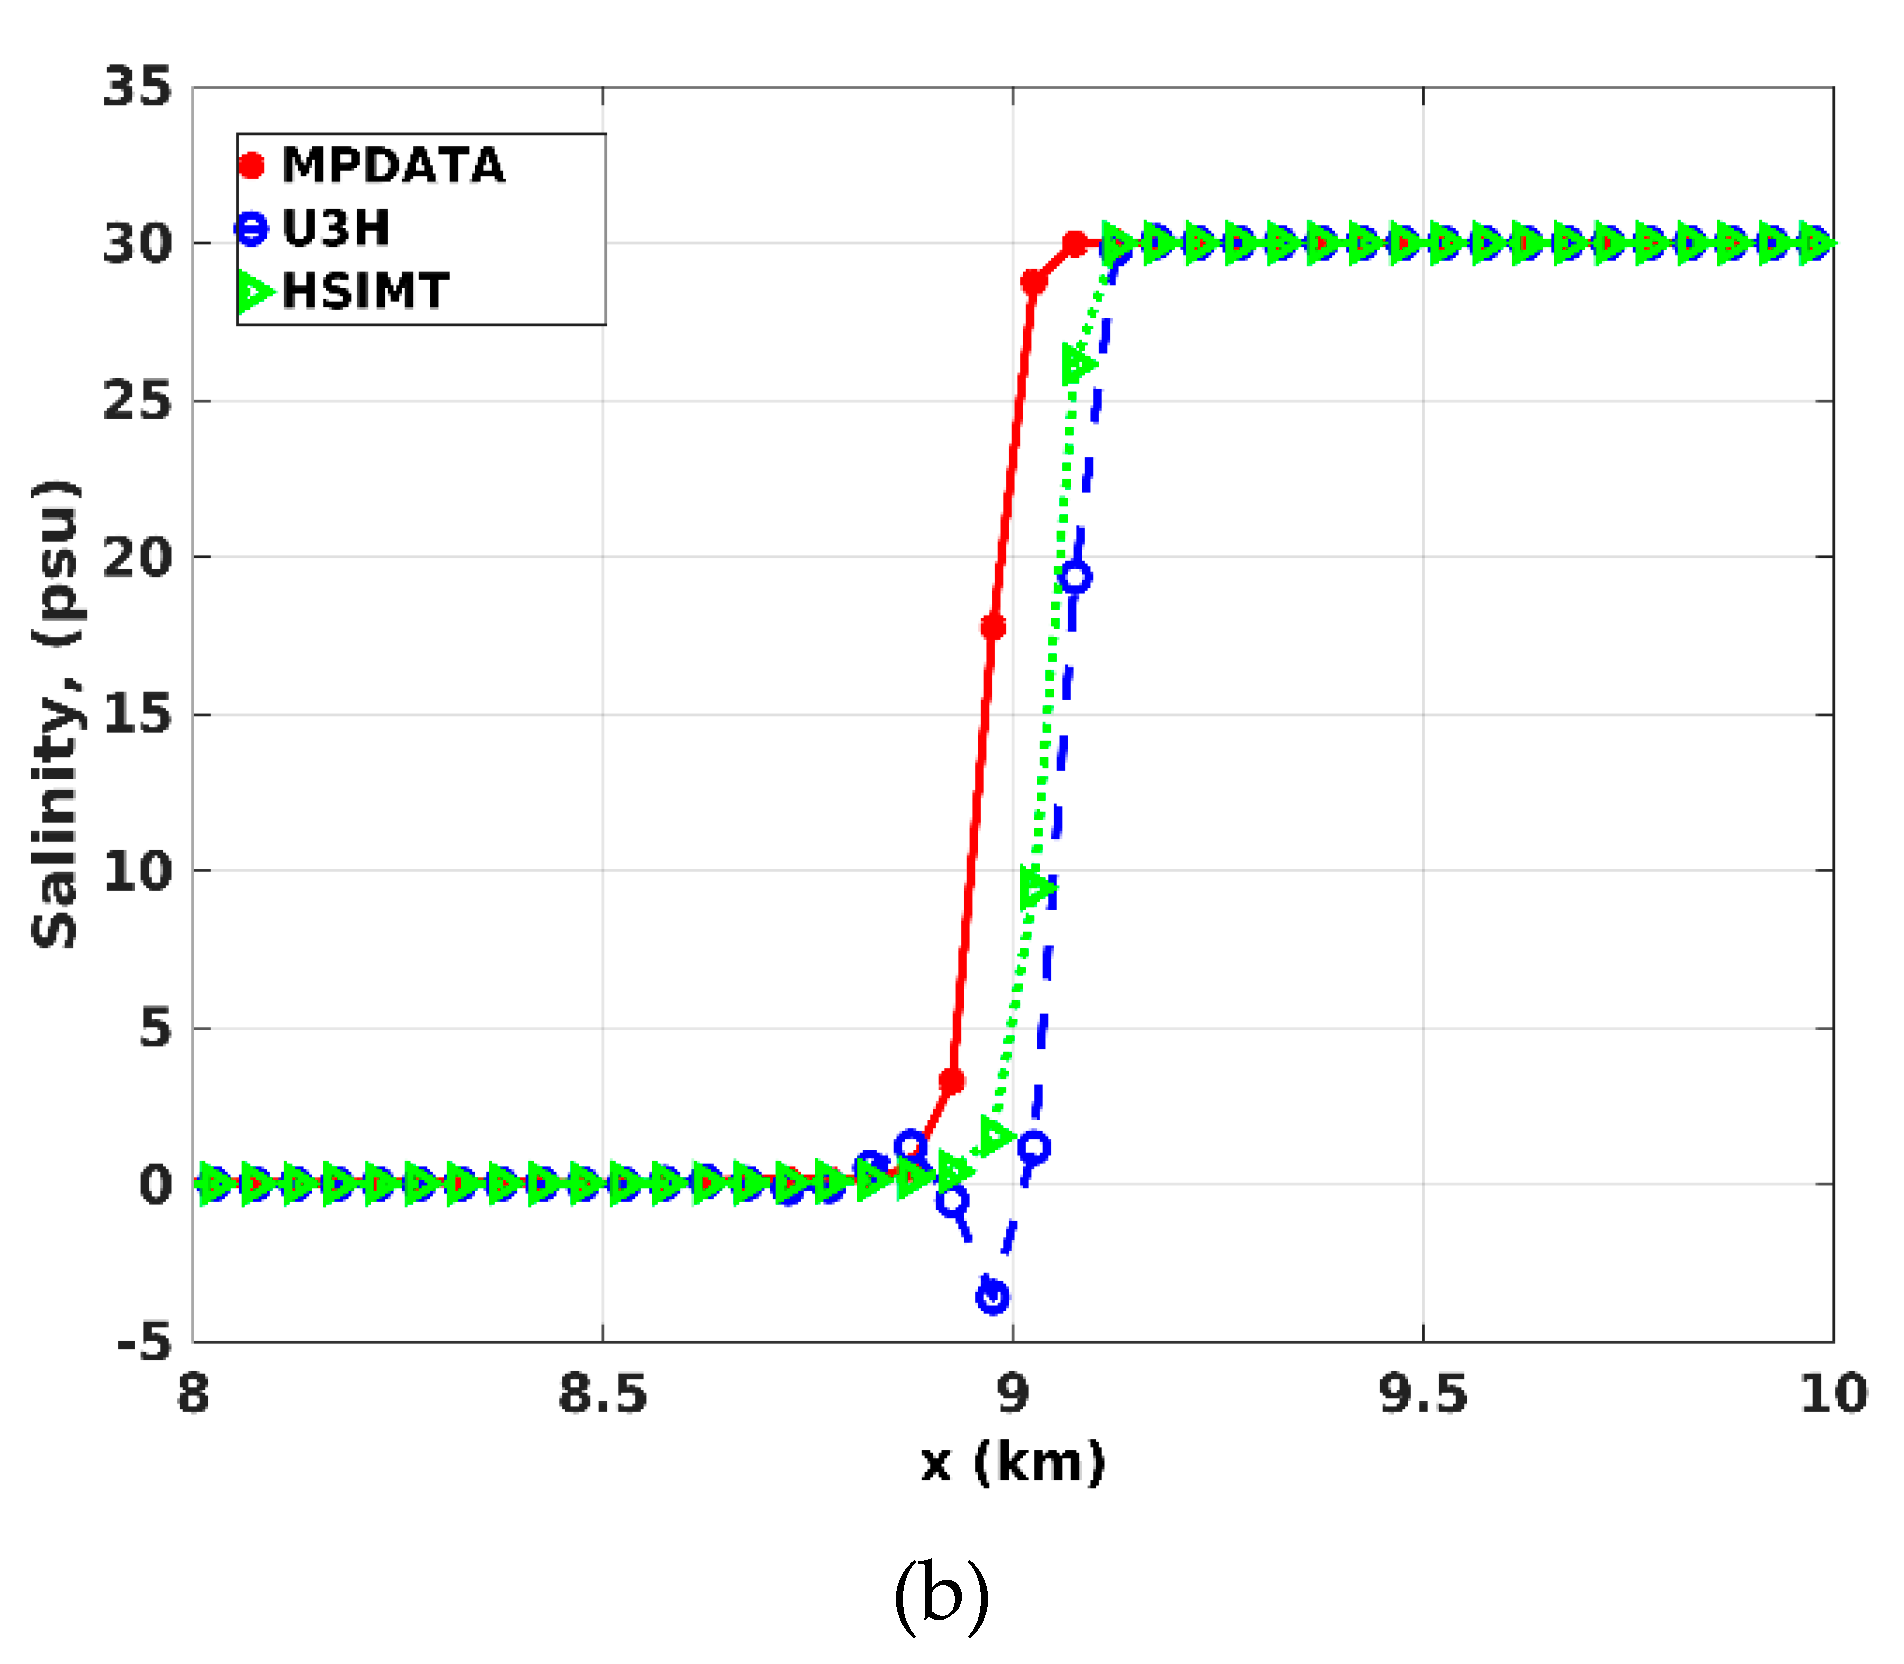
It can be noticed that the U3H shows more negative regions of numerical mixing at the fronts when compared to the other two schemes. This is expected from a higher order scheme, such as the U3H, which is formulated to possess more anti-diffusive properties as compared to the MPDATA and HSIMT schemes. To further understand the numerical properties of the three advection schemes, salinity profiles are obtained from model runs at 1.25 m depth (Figure 5b). The gradient of the front is computed with all three advection schemes. The U3H scheme results in a sharper front when compared to the other two schemes, but it also results in an oscillatory behavior with negative salinity. It can be noticed that the HSIMT shows a sharper front than the MPDATA. In addition, the MPDATA shows a phase lag in capturing the sharp discontinuity as compared to the other two schemes.
Table 3 provides a comparison of physical and numerical mixing with different advection schemes. Numerical mixing accounts for majority of total mixing with all the advection schemes. The simulation with the U3H scheme shows the lowest numerical mixing while showing the highest physical mixing when compared to the MPDATA and HSIMT schemes. Based on Equation (9), in test case 3, the U3H advection scheme shows the lowest effective numerical diffusivity, while the MPDATA and HSIMT schemes show comparable effective numerical diffusivity (Table 2).

3.4. Test Case 4: Estuary Test Case with a Rectangular Geometry

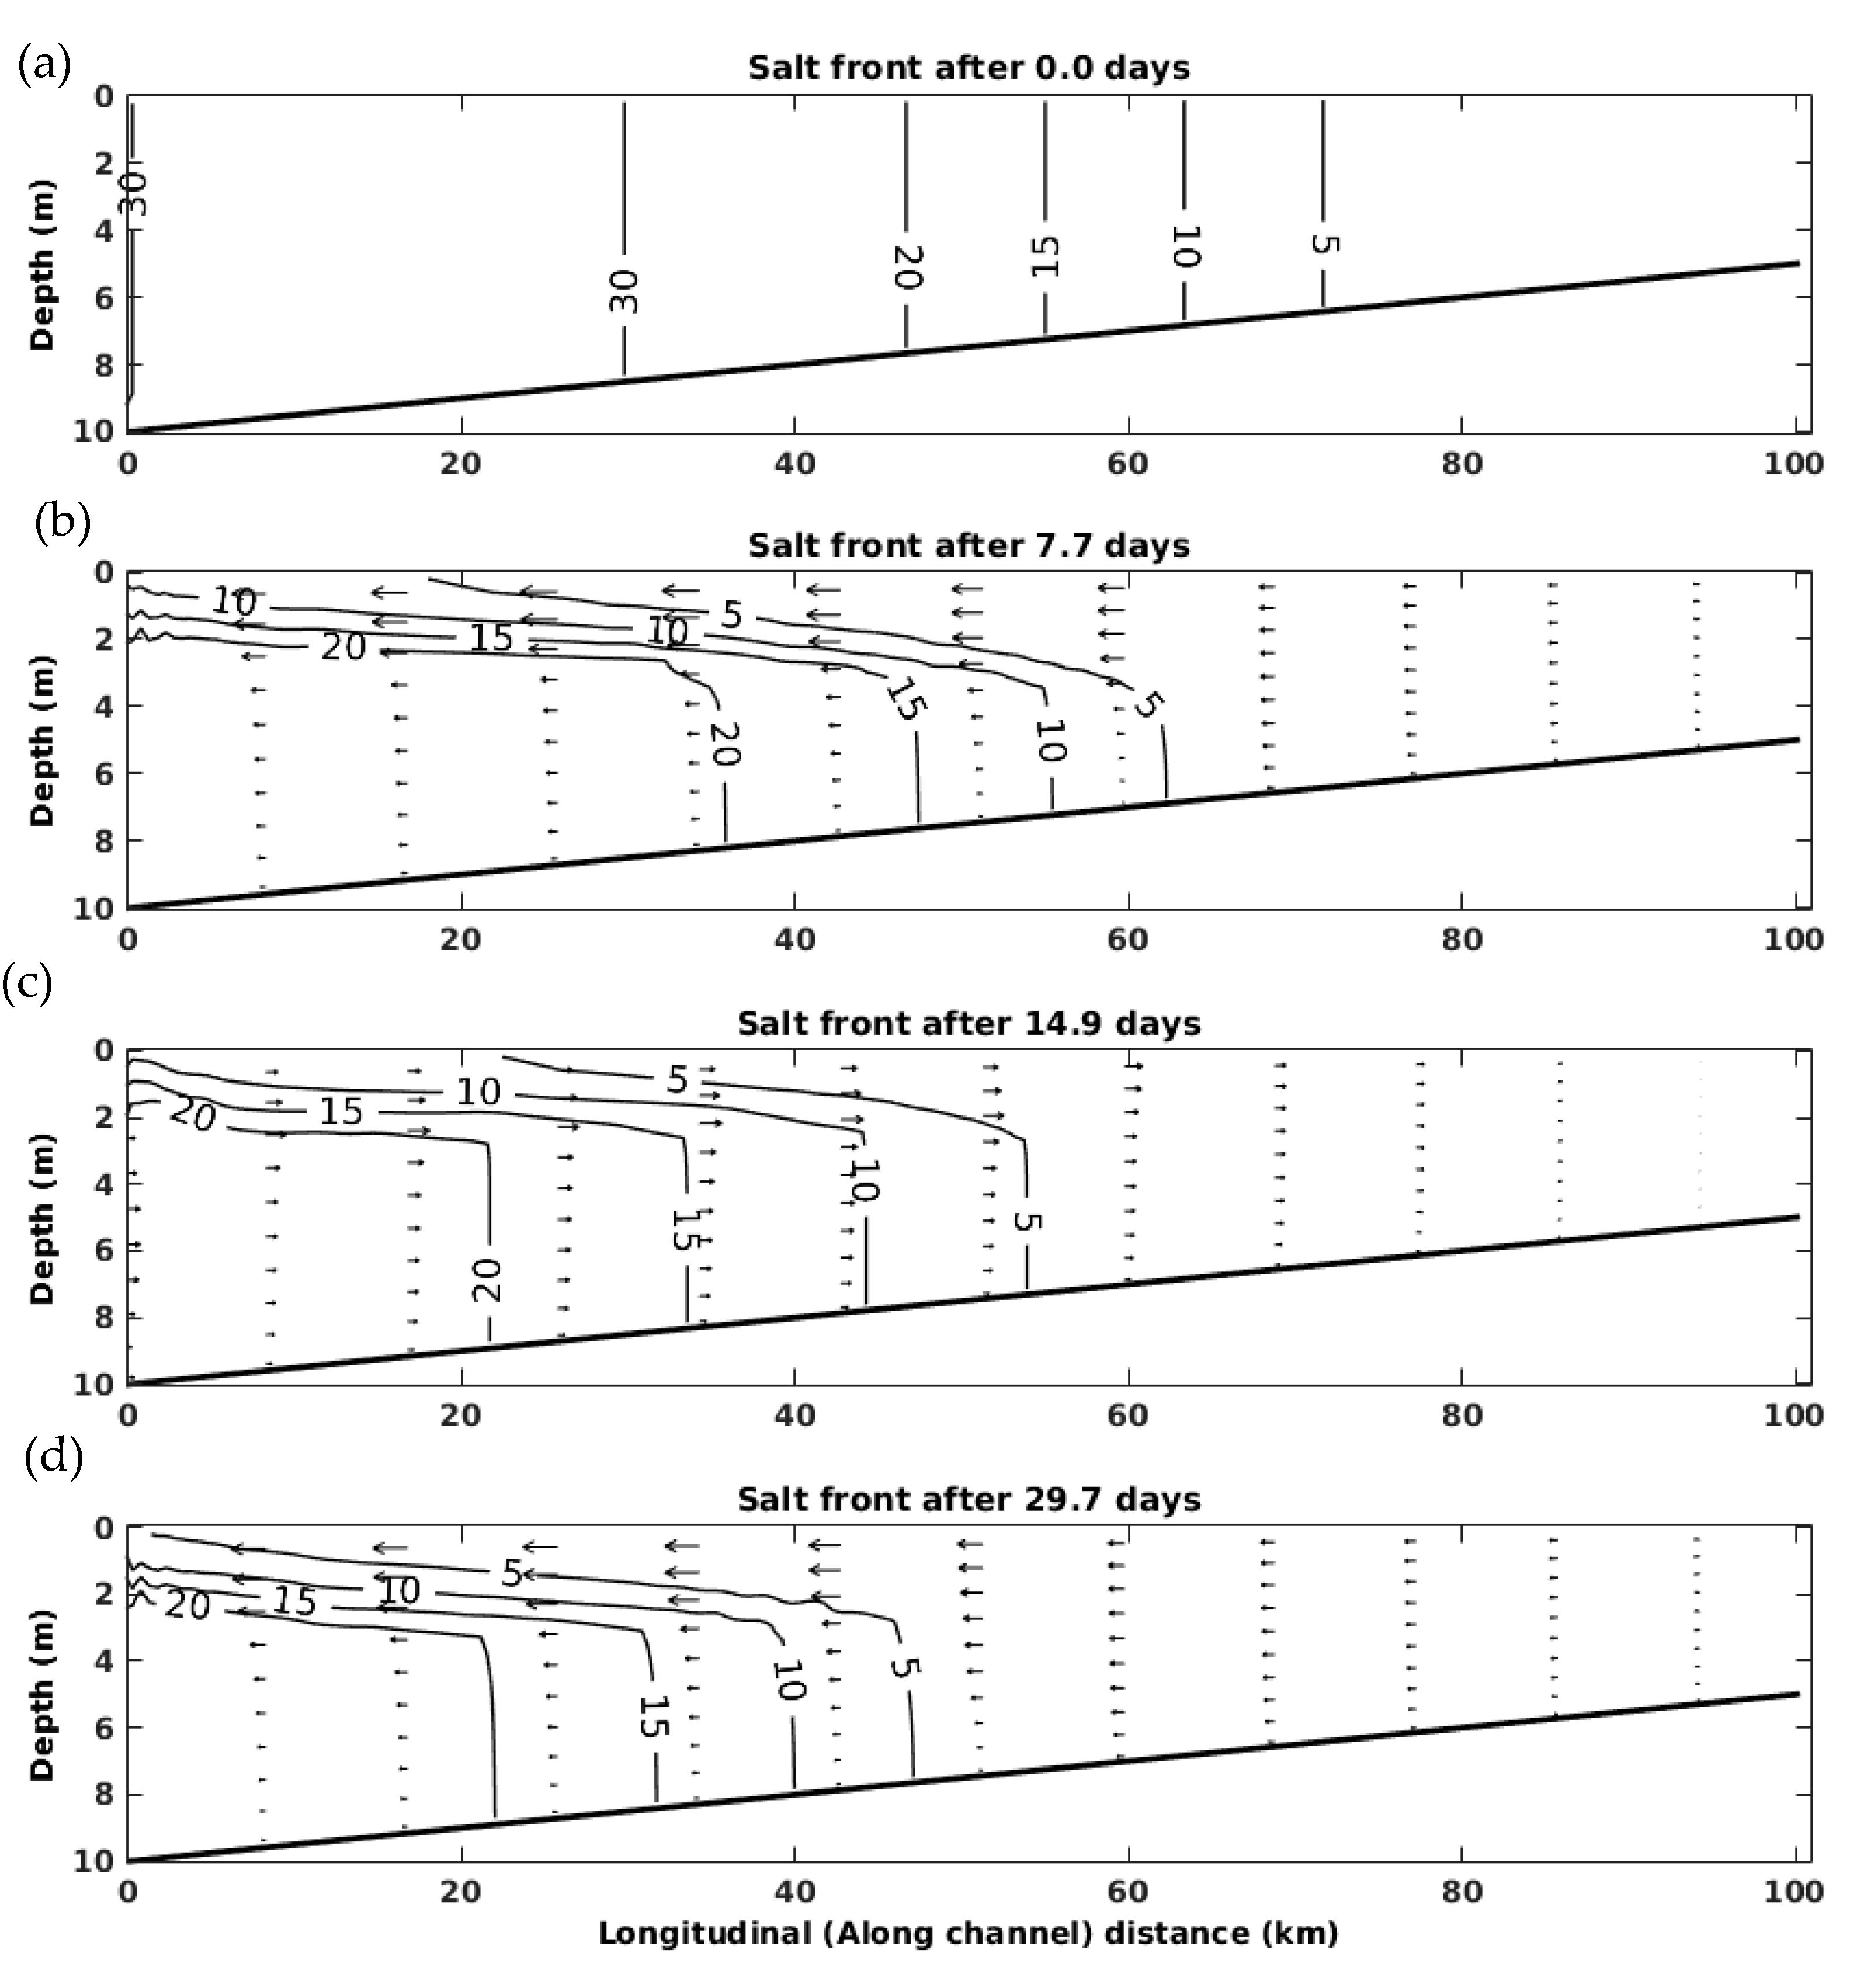
Test case 4 is studied to highlight the impact of salt intrusion with varying tracer advection schemes in an idealized estuary. A similar setup was utilized by [41] to study the effects of using different turbulence closure schemes. The test case involves the simulation of an idealized stratified estuary with a rectangular geometry, along with tidal forcing and river input to provide a time-dependent solution of mixing. The purpose of this test case is to evaluate the effect of mixing from the three advection schemes on salt intrusion length. The effect of earth rotation is not included. The model domain is 100 km long, 0.3 km wide with depths linearly decreasing from 10 m at the ocean (western end) to 5 m at the river end (eastern end). The interior of the domain consists of 200 points in the along-channel direction, seven points in the across channel and 20 points in the vertical. This results in a horizontal resolution of 500 m and a vertical resolution of ~0.5 m maximum (varying slightly tidally and decreasing landward).
The tidal velocity on the ocean end is set to sinusoidally vary with an amplitude of 0.4 m/s, while the river inflow velocity at the east boundary is a constant 0.08 m/s. Salinity is forced with a radiation boundary condition and nudged with a three-hour time scale to a value of 30 psu at the ocean end and clamped at 0 psu at the riverine end. Temperature is uniform and constant at 10 °C. The free surface on the ocean end is enforced with Chapman boundary condition and radiation conditions are placed on the baroclinic velocities. The surface elevation at the ocean end is subjected to a tidal forcing of 0.5 m with a 12-hour period. The baseline simulation is performed with the MPDATA advection scheme while using the k ε turbulence model. A bottom roughness zo = 0.005 m is used. The simulations are performed for 30 days at a barotropic time step of 30 s. The horizontal diffusivity is set to 0.0 m2/s. Figure 6a–d shows the progress of the simulation at the end of 0, 8, 15, and 30 days for the baseline simulation with the MPDATA advection scheme. Figure 6a shows the initial salinity distribution with the ocean end on the western boundary with 30 psu and river end on the eastern boundary with 0 psu. A stationary simulation is achieved at the end of 10 days.
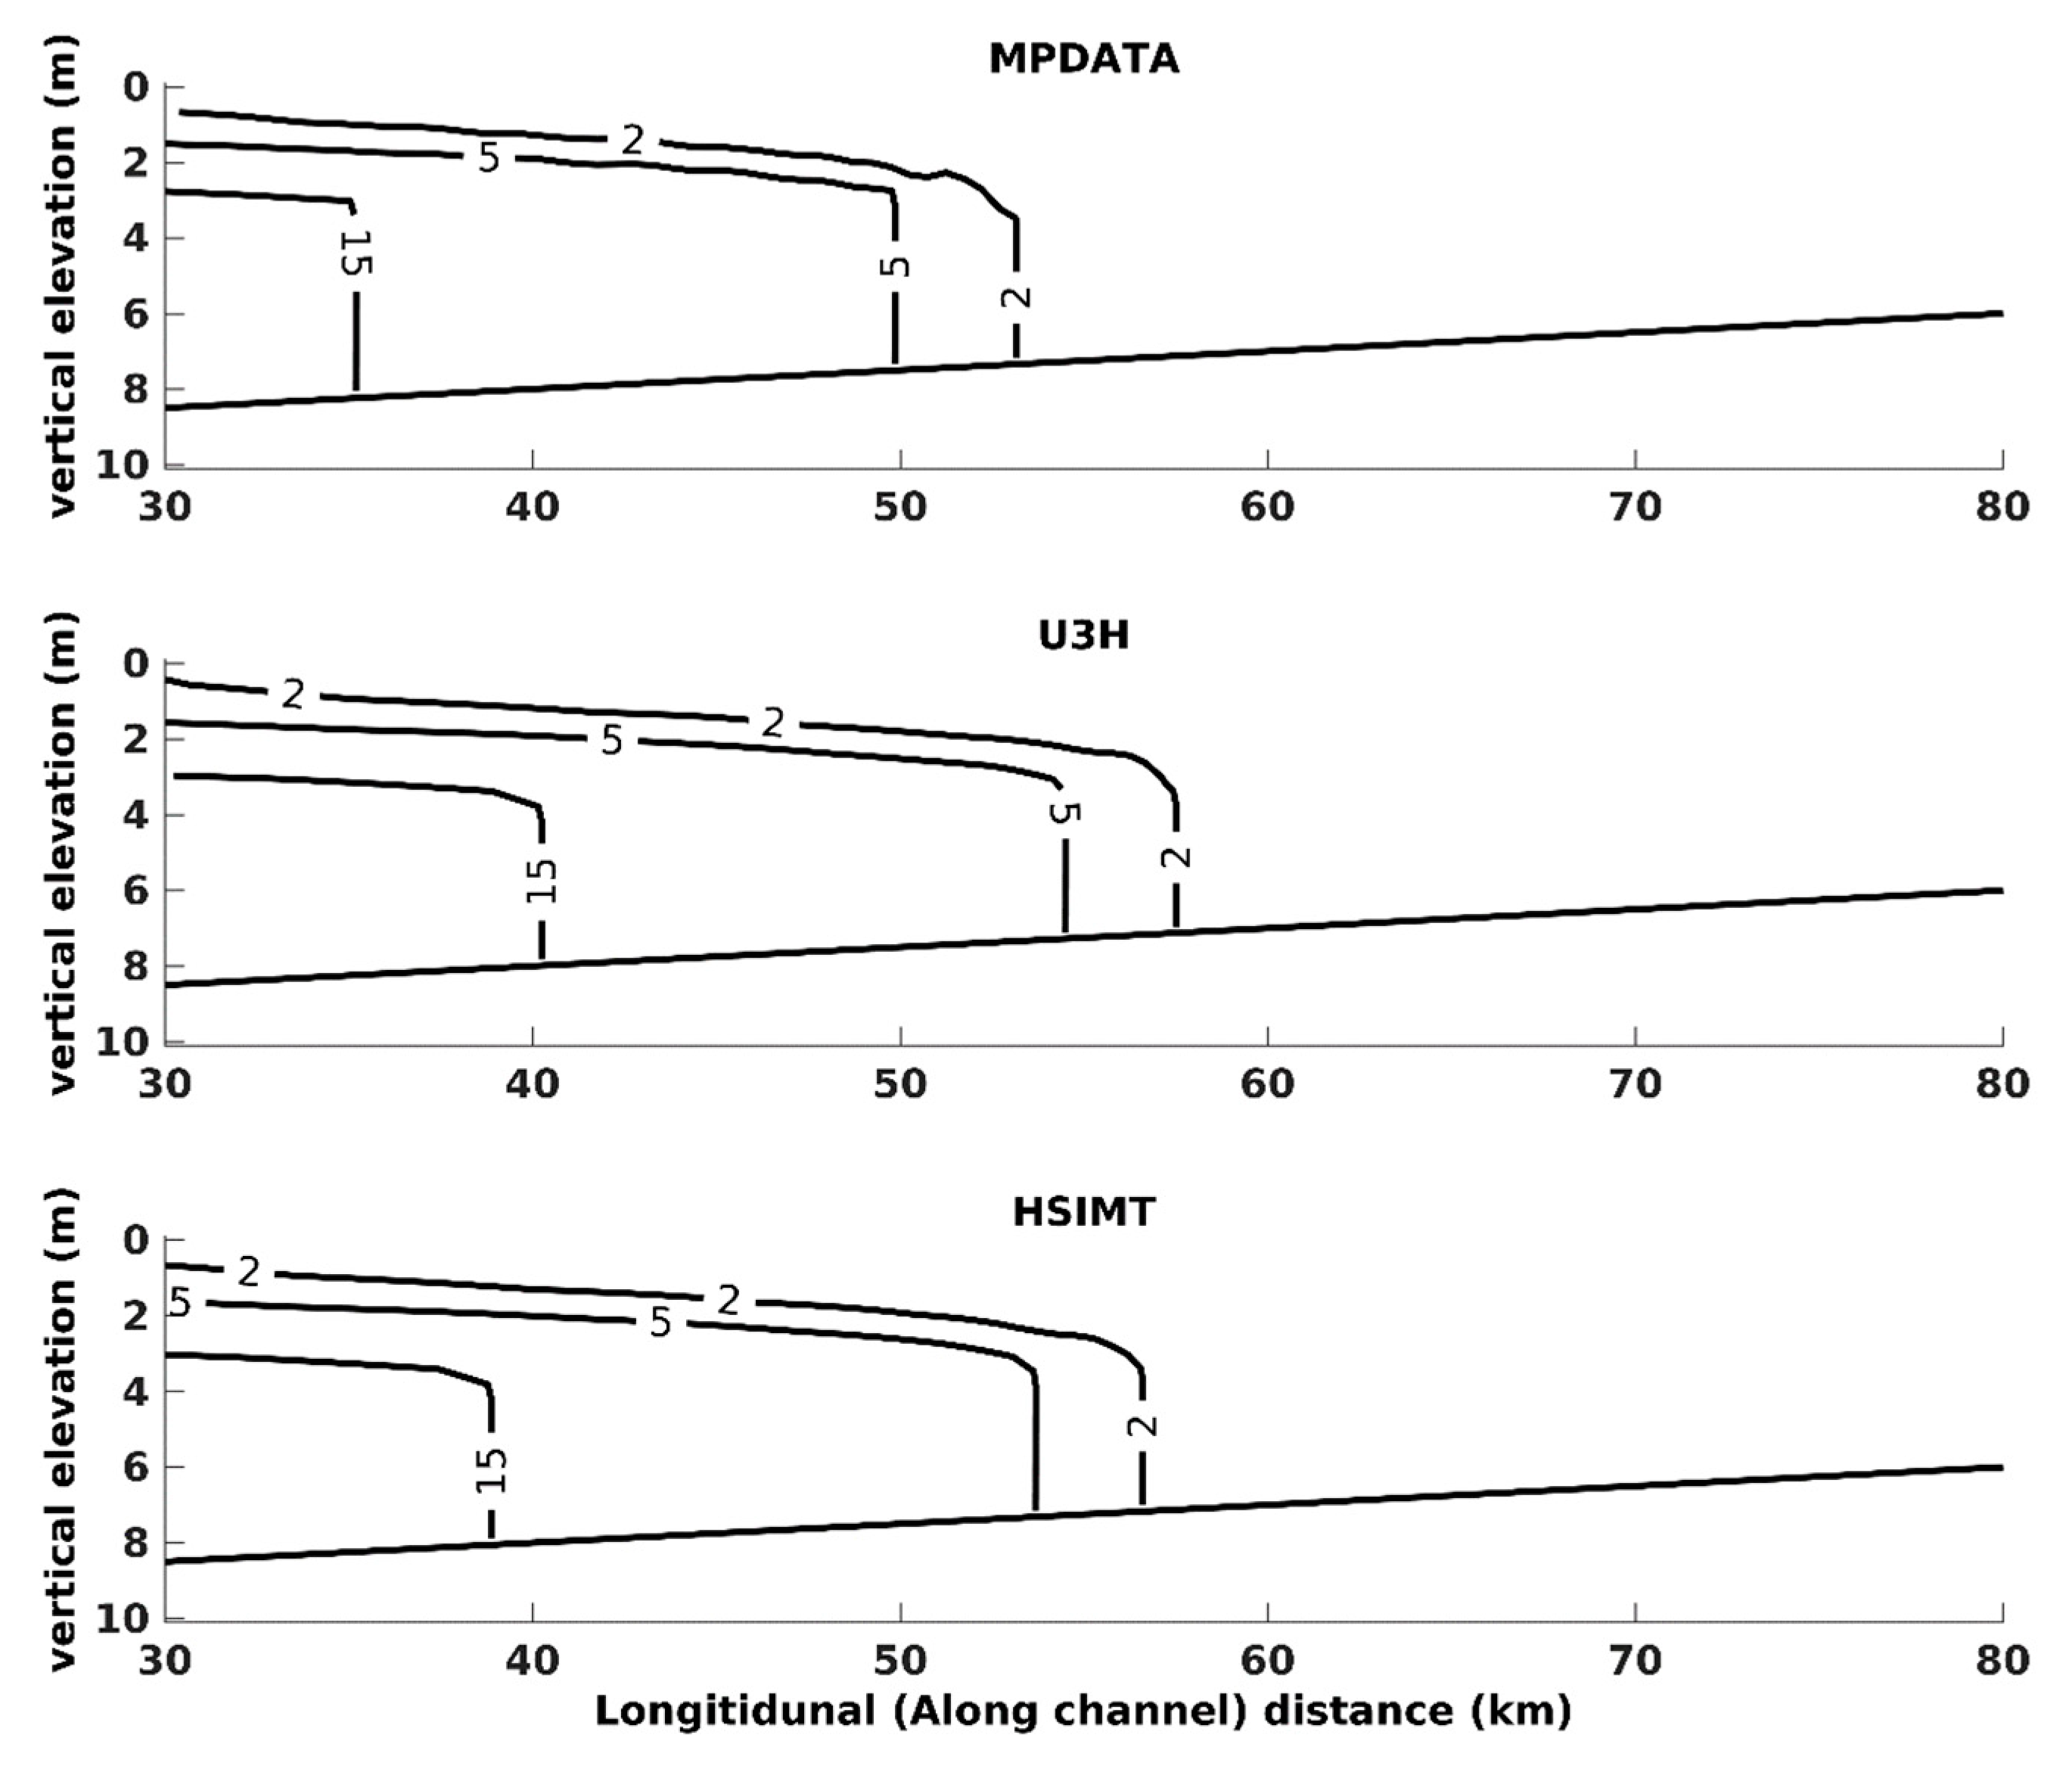
The mixing estimates are made by utilizing a control volume that extends from x = 15 km to x = 100 km. This avoids the open boundary part of the domain that is most affected during the nudging of salinity at the ocean end. The numerical mixing only constitutes 2% of the total mixing for the MPDATA and HSIMT (refer to Table 1). It is the lowest for the U3H advection (i.e., under 1%). The physical mixing is the highest for the U3H simulation, followed by the HSIMT and the lowest physical mixing is obtained in the simulation with the MPDATA advection scheme. The total mixing from the model (sum of physical and numerical mixing) is the highest for the U3H simulation and lowest for the MPDATA simulation. The impact of mixing on the salt intrusion length during peak flood from different advection schemes can also be noticed (Figure 7). The baseline simulation with the MPDATA shows the least salt intrusion with the isohaline of 2 psu at x = 53 km. The salt intrusion with the HSIMT advection scheme is up until x = 56.5 km, while the use of the U3H advection scheme shows salt intrusion up until x = 58 km. This shows that during peak flood, the MPDATA scheme causes the least amount of total mixing, and it also results in the lowest salt intrusion length. On the other hand, the U3H that is associated with the highest total mixing among the three advection schemes also results in the longest salt intrusion length.

3.5. Realistic Application of Hudson River Estuary

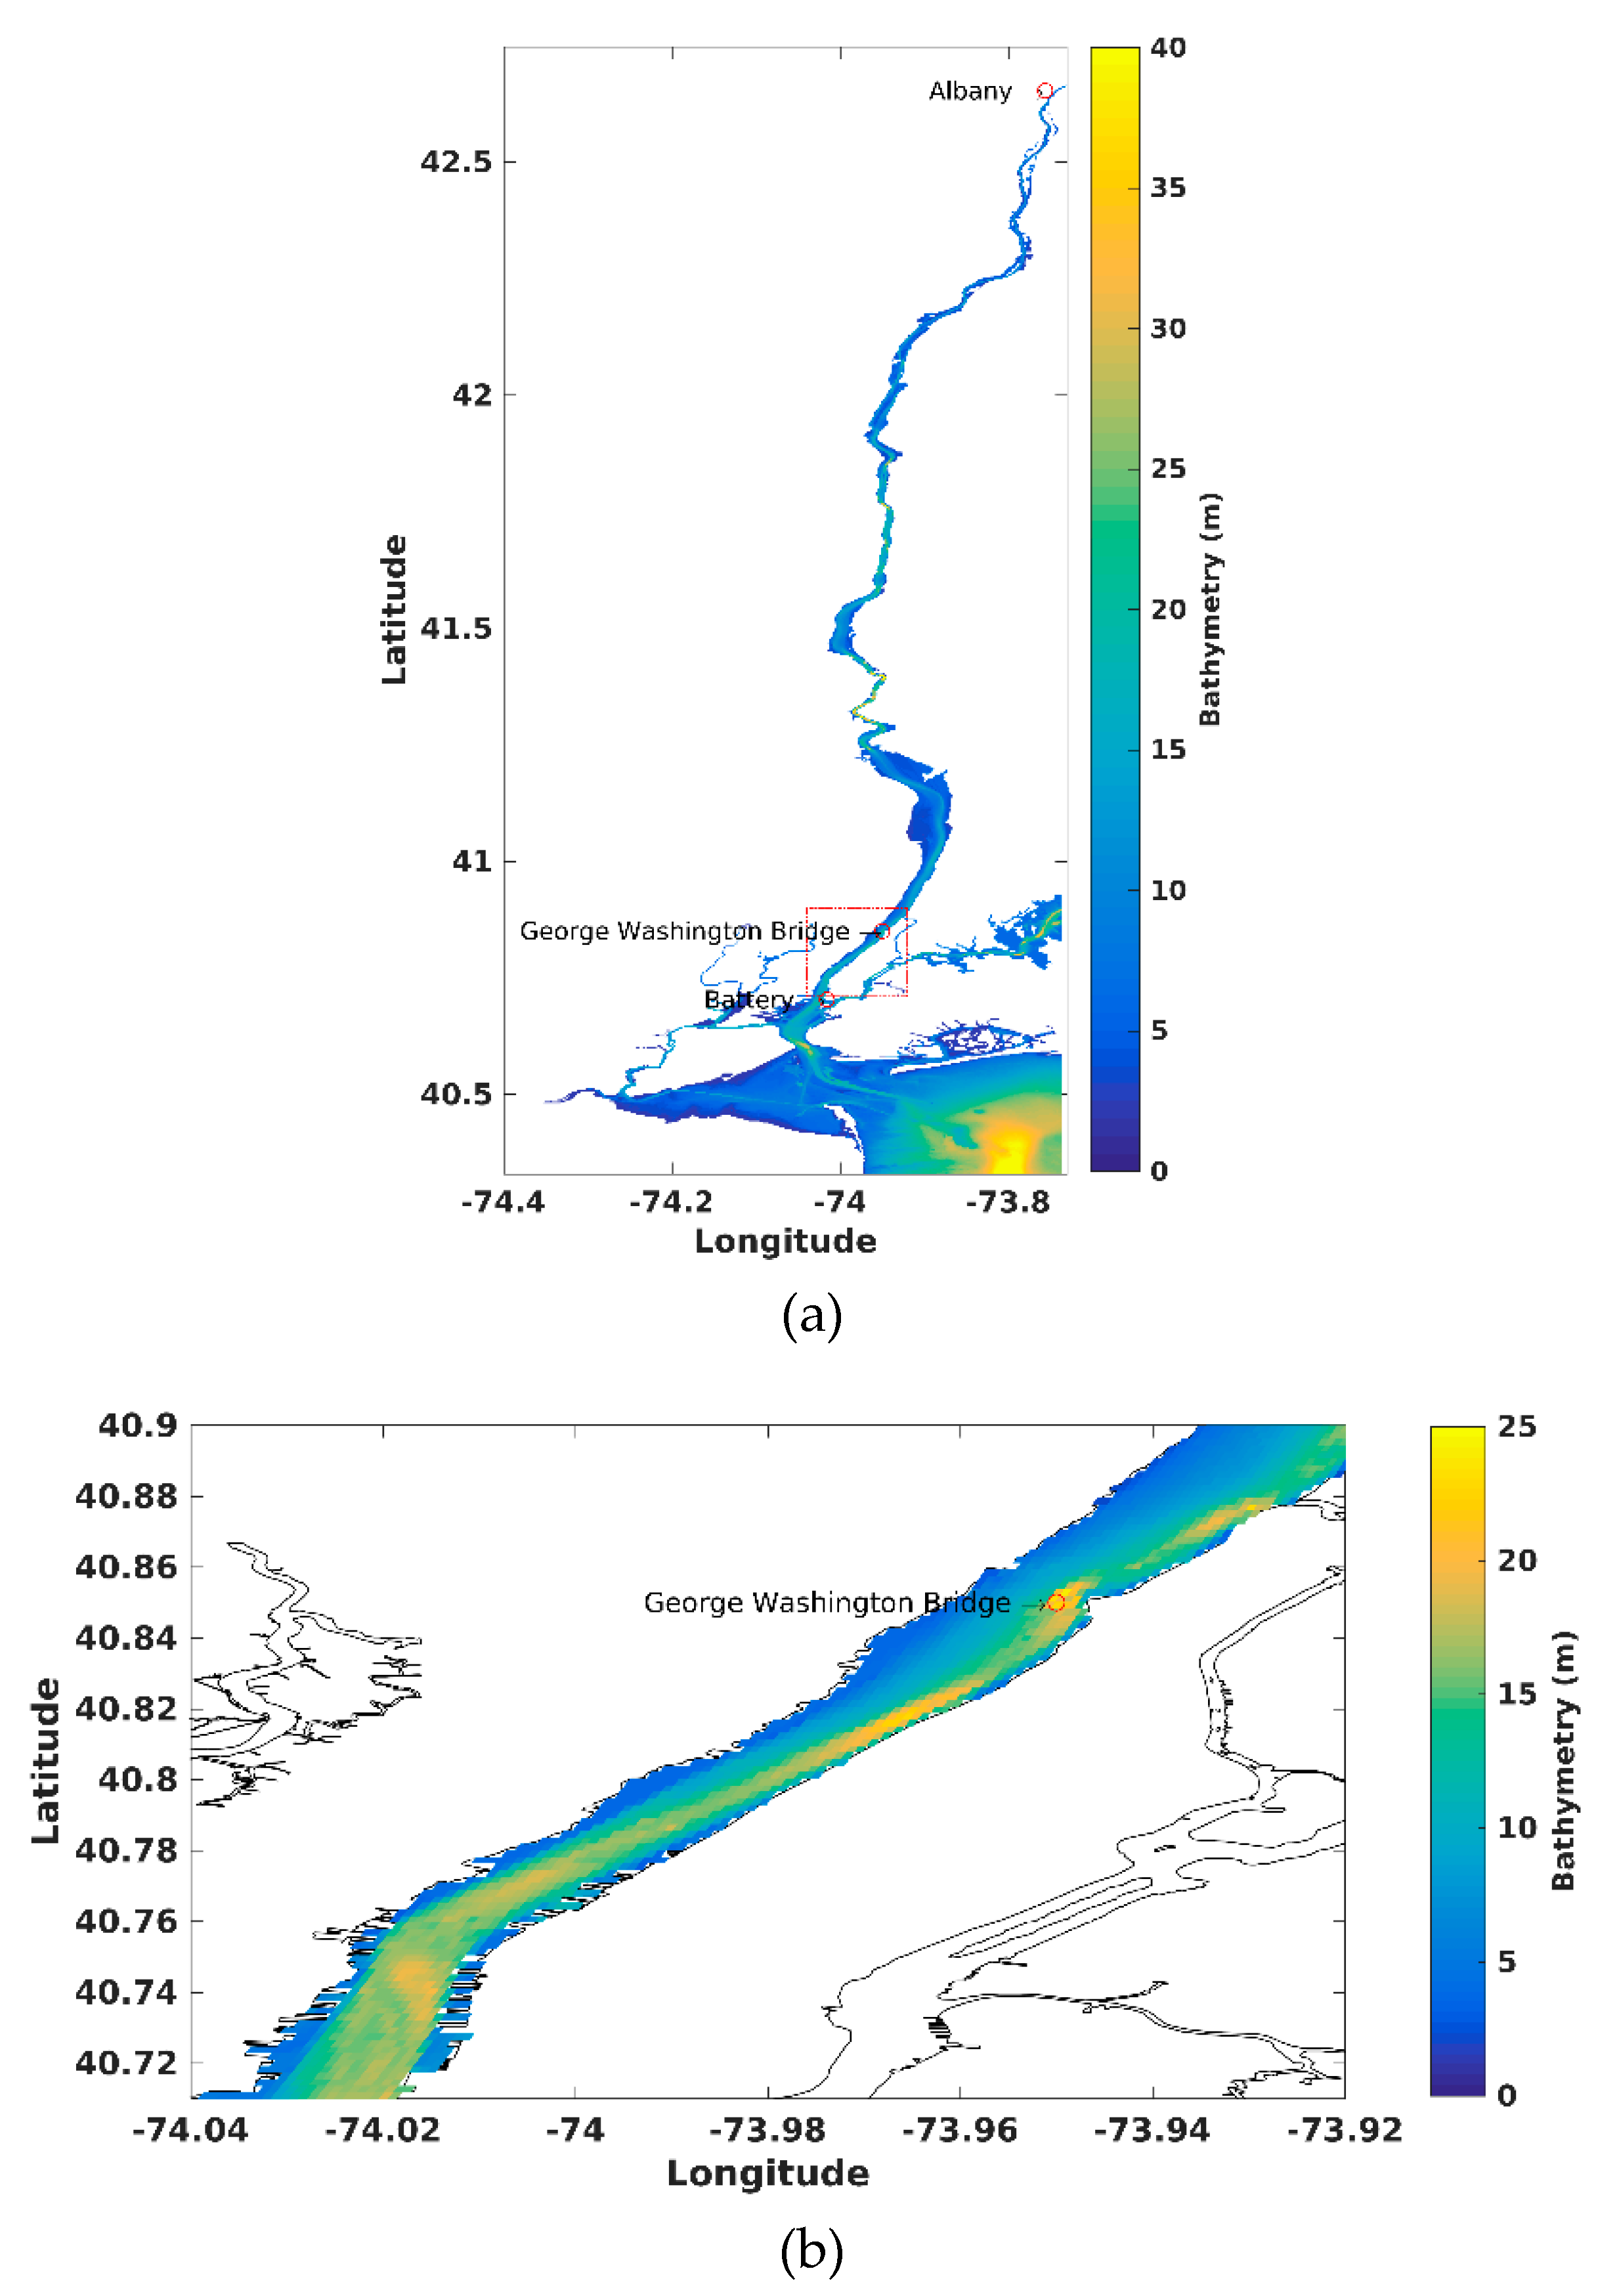
The Hudson River is located along the northeast coast of the U.S. The skill assessment of the COAWST model for the 3-D salinity structure of the estuary has been successfully studied in the past [41]. The model grid extends from the south at the Battery to the north in Troy, NY (Figure 8a). The model domain consists of 530 × 1133 × 16 interior points in the x-, y-, and z-directions, respectively. The bathymetry varies from 2 to 25 m with a mean depth of 8 m. The region of interest in the current work (Figure 8b) is the lower part of the estuary that has a mean grid resolution of 201 m along channel and 67 m across channel.
For the tracer quantities, the lateral boundary conditions consist of closed boundaries on the western edge. The eastern and southern boundaries are radiation nudging, while the northern boundaries are clamped. The input of lateral rivers occurs at several points in the domain. More details on the input from lateral rivers is explained in [43]. The tides are input from the ADCIRC model while using a low pass filter at Kings Point and Sandy Hook. This leads to a tidal range on the order of 2 m and depth-averaged tidal velocities reach 1 ms-1 during spring cycle. We simulated the period from March 25 to July 11, 2005 (111 days). This is done while using the MPDATA advection scheme at a barotropic time step of 6 s using the k ω turbulence model. A bottom roughness of 0.0025 m is used in the setup and the output is obtained every hour.
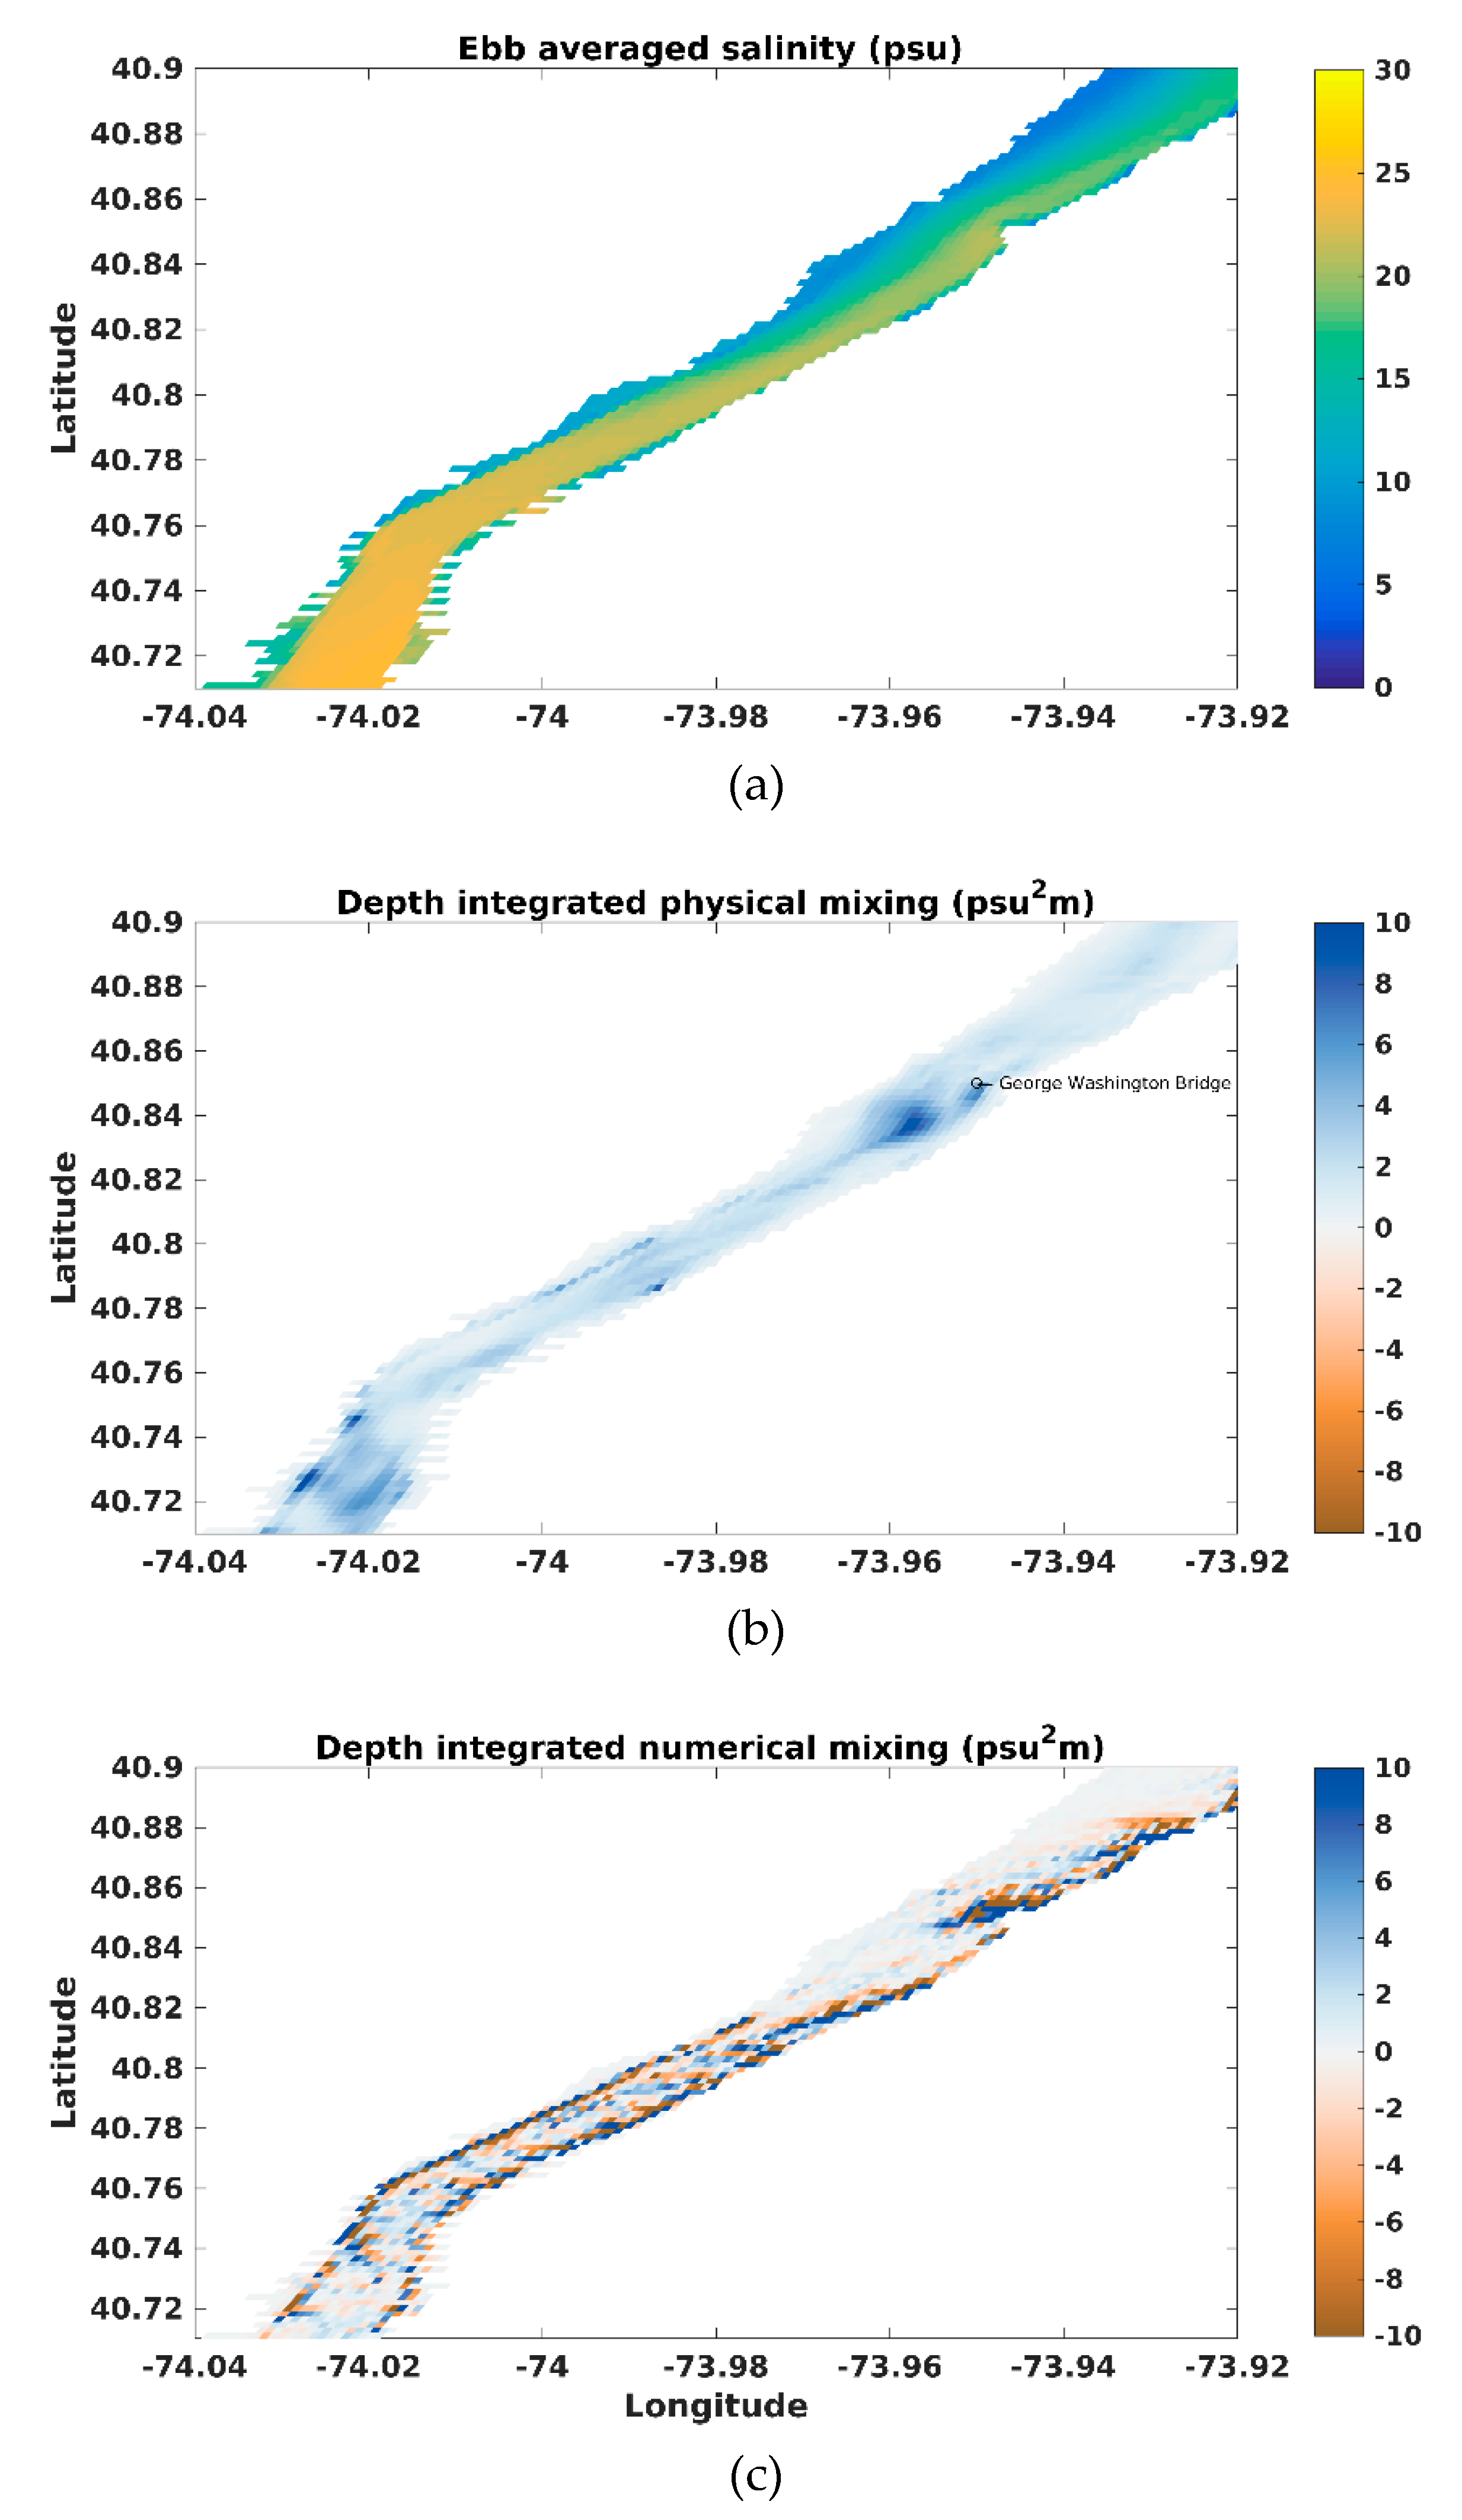
The spatial distribution of mixing is assessed by integrating the flood and ebb component over 111 days in the region of interest of the domain (Figure 8b). The ebb constitutes 60% of the total mixing, while the flood consists of 40%. We only focus on the ebb cycle (Figure 9) in the current work, because the ebb cycle consists of a higher amount of mixing; however, both flood and ebb demonstrate similar concepts but different spatial patterns.
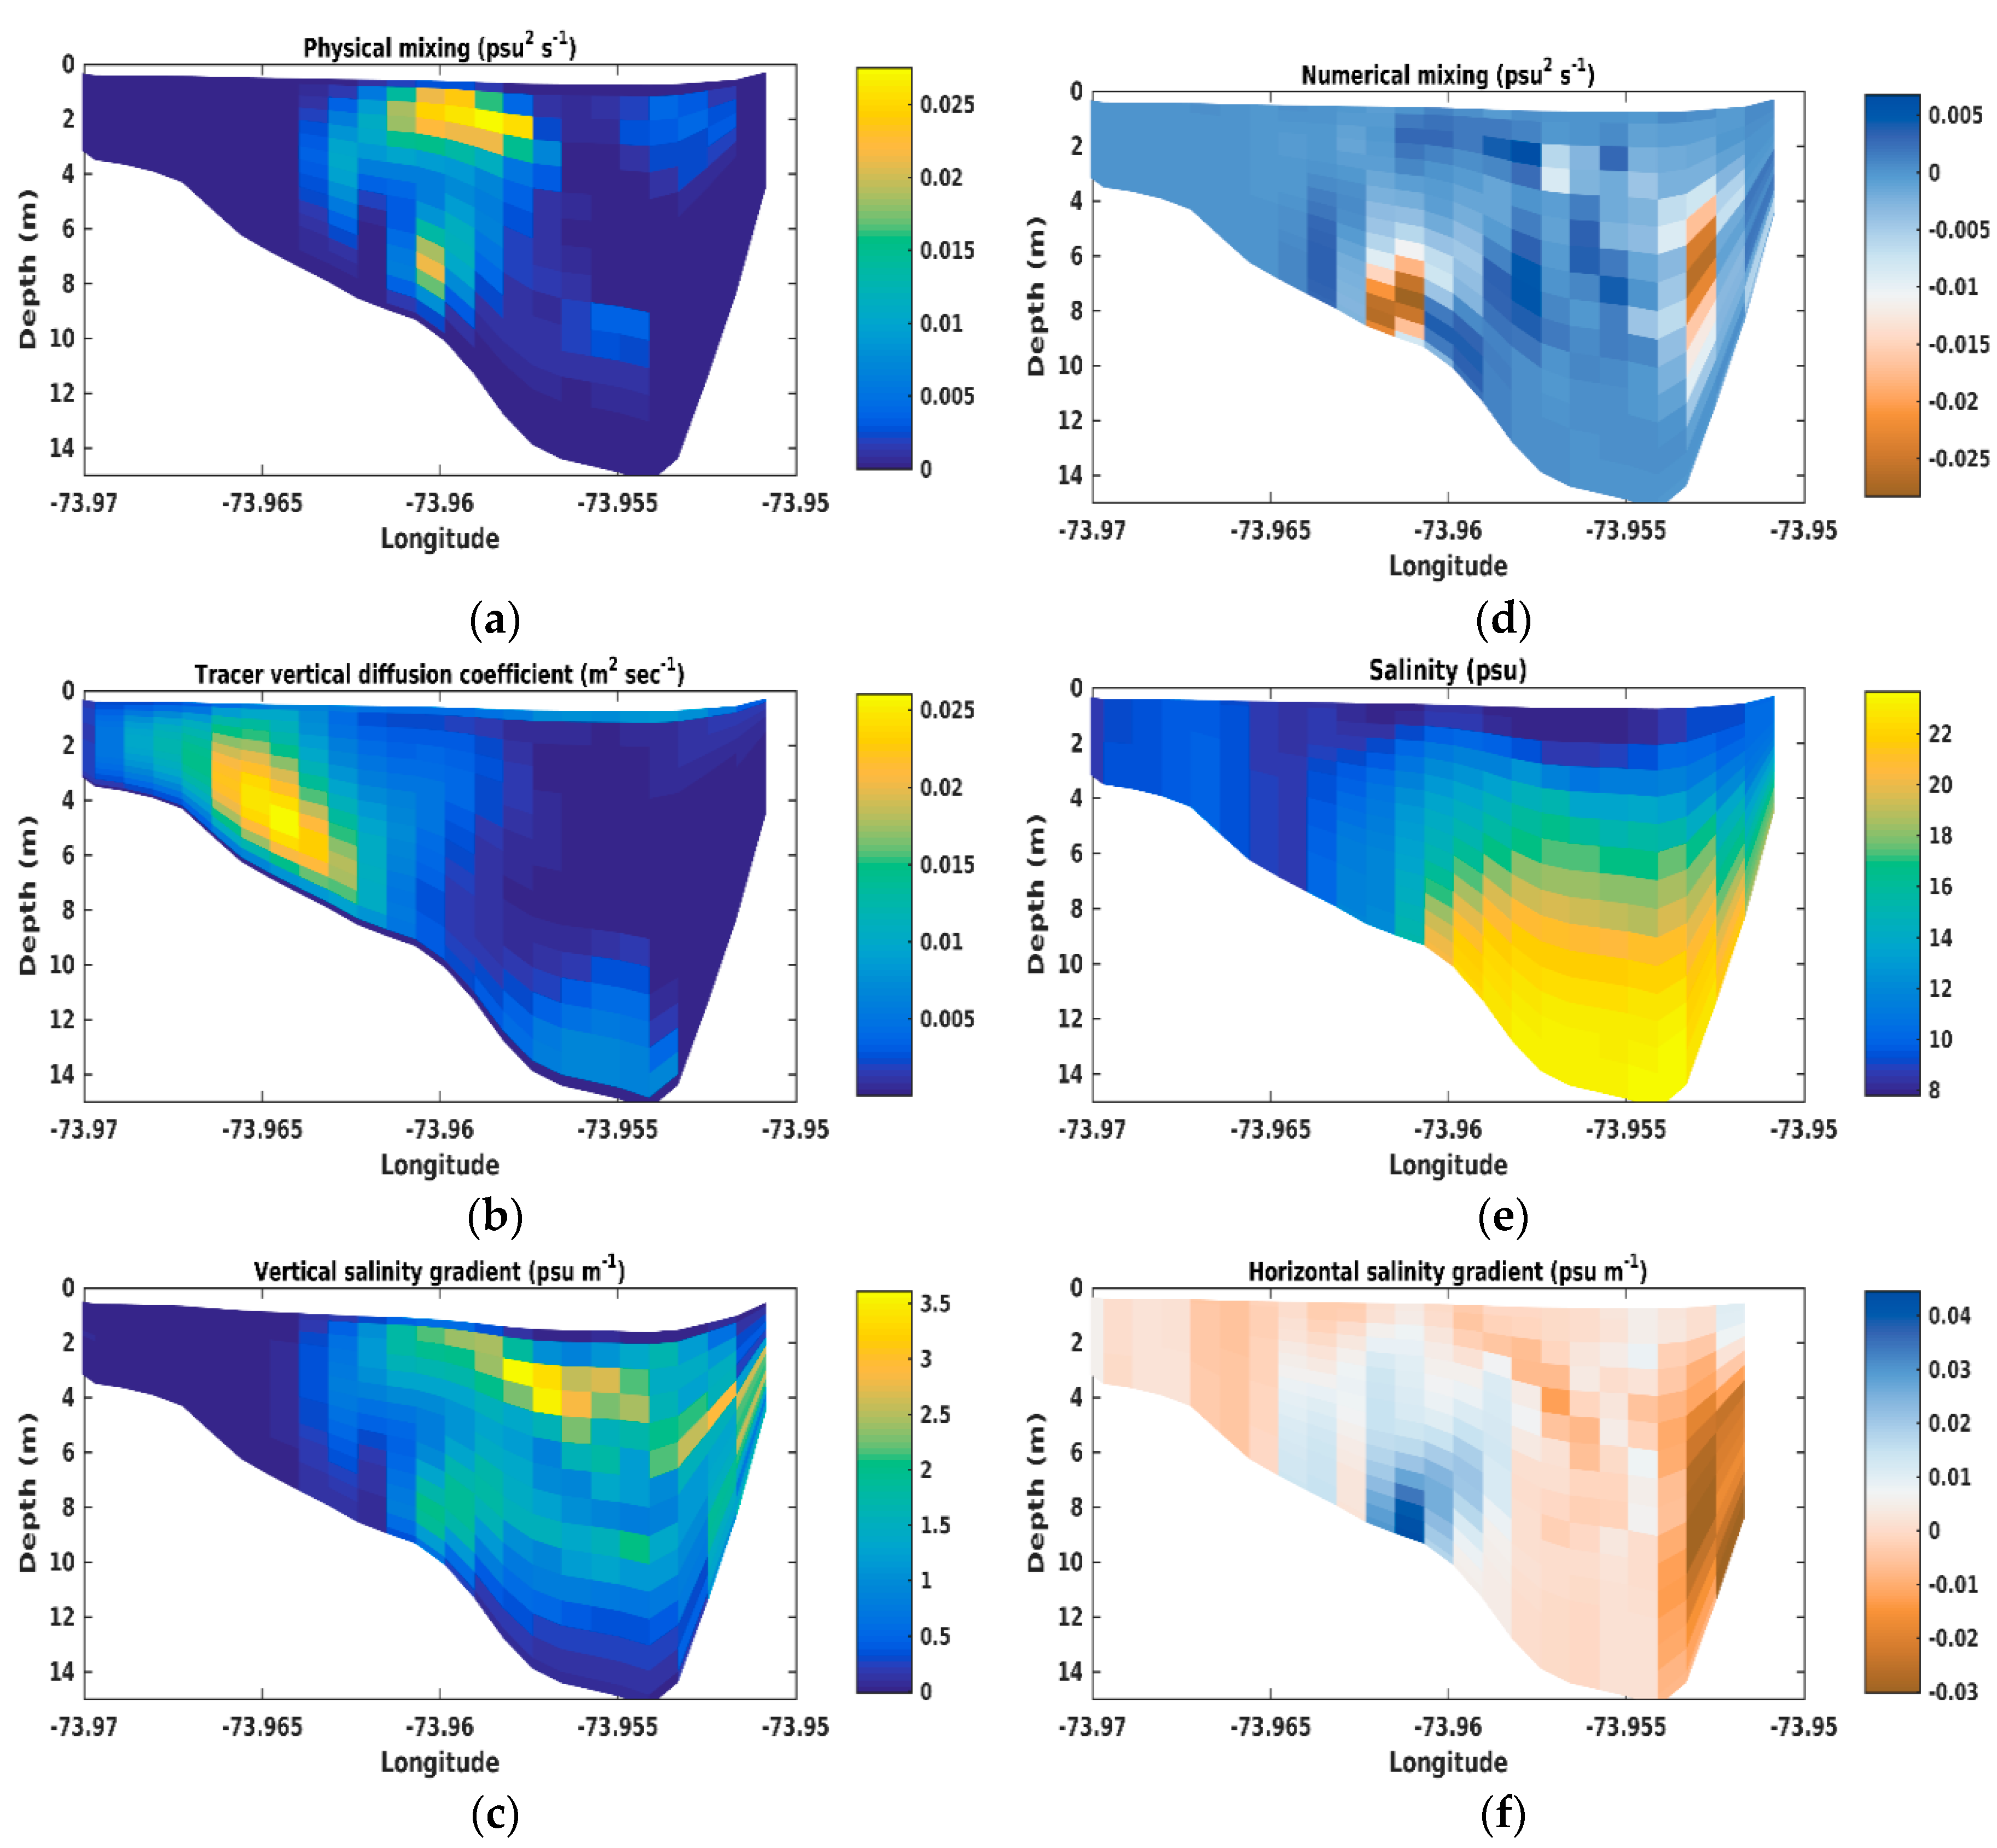
Figure 9a shows the averaged salinity distribution during the ebb cycle. The physical mixing integrated over the ebb cycle is the highest in the center of the channel south of the constriction from the George Washington (GW) Bridge, north of the Battery, and a few locations along the edges (Figure 9b). At the constriction from the George Washington (GW) Bridge, the salinity gradient is intensified and fronts are formed as the channel width increases. The increasing of width leads to a steepening of the pycnocline [44], which results in a higher physical mixing in that region. Numerical mixing is highest along the lateral river edges (Figure 9c). The volume integrated ratio of numerical to total mixing is 3.6%. The spatial distribution of mixing can be observed (Figure 10) in more detail by looking at a lateral cross-section at a location South of the GW bridge near a latitude of 40.85° for a particular time (02-April at 1700 h) from the ebb cycle. The lateral salinity front corresponds to the region where physical mixing is seen to be the highest in Figure 9b.
The lateral front shows that high physical mixing (Figure 10a) occurs in the upper portion of the water column. The physical mixing has contributions from both the vertical diffusion and the vertical salinity gradient. The vertical tracer diffusion shows a maximum on the lateral shoal where the stratification is minimal, and the vertical salinity gradient is maximum near the top of the water column. However, the maximum physical mixing is in the region where the combination of terms K T (Figure 10b) and ds/dz maximizes (Figure 10c). The numerical mixing (Figure 10d) maximizes at locations where the horizontal salinity gradient ds/dx maximizes (Figure 10e) i.e., at the lateral fronts. The application of the realistic case of the Hudson River Estuary provides further evidence that is consistent with the simulation of the idealized test cases, which showed that the maximum physical mixing occurred along the density interface, while the maximum numerical mixing was at the lateral edges that are associated with large horizontal tracer gradients. A detailed investigation of the dissipation of salinity variance and its spatial and temporal variation through spring-neap cycles in Hudson River estuary is presented by [45]. Based on the method of total exchange flow method of salt, this study [45] showed that maximum mixing occurs in the presence of intensified turbulence and high salinity gradients, while numerical mixing is small for the Hudson River estuary model.

4. Discussion

4.1. Effect of Grid Resolution on Mixing

In most ocean modeling applications, the users are limited by the choice of grid resolution from the practical constraints of computational costs. While the scope of this study is limited to varying different tracer advection schemes to understand their impact on mixing; in this section, we vary the grid resolution in the horizontal direction for test case 3 to discuss the sensitivity of physical and numerical mixing for three different grid resolutions. The baseline case consists of a horizontal resolution of 50 m, and two more simulations are performed with 25 m and 12.5 m, respectively. Table 3 shows that an increase in grid resolution results in an increase of physical mixing and a decrease of numerical mixing. This is consistent with the idea that a higher grid resolution captures finer scales of turbulence to increase physical mixing, while the increased resolution of salinity fronts in the test case results in lower numerical mixing. The trend of increased physical and decreased numerical mixing with an increased grid resolution holds true for all the advection schemes. A similar sensitivity of mixing components to grid resolution is also seen in the work of Burchard and Rennau, 2008 [37] and Ralston et al. 2017 [46], where a higher resolution grid accompanies higher physical mixing and lower numerical mixing.

4.2. Effect of Advection Schemes on Mixing

From the results, it is understood that the spatial distribution of physical and numerical mixing is independent of the choice of advection scheme. The negative numerical mixing acts locally in the simulations and none of the simulations cause a net global negative numerical mixing. The amount of numerical mixing is consistently lowest in all the tests cases while using the U3H advection scheme. Consequently, the U3H captures sharp fronts, which thus results in a better resolution of finer structures that leads to a larger physical mixing. The U3H also generates spurious tracer concentrations with undershooting and overshooting of tracer concentration. These oscillations are a feature (also referred to as Gibbs phenomena, [47]) of non-monotonic schemes such as the U3H. The U3H scheme also has significant occurrence of negative mixing in regions of sharp gradients, as indicated in the lock-exchange example. This indicates that there is a penalty that accompanies the smaller amount of numerical mixing with the U3H. On the other hand, the HSIMT and the MPDATA schemes show a similar amount of numerical mixing in all the test cases. Both these schemes preserve the positive definite characteristics of the tracer. In addition, the use of the MPDATA scheme also causes lower total mixing (physical + numerical) for the idealized two-dimensional (2-D) estuary (Test case 4) and it affects the amount of salt intrusion. With a lower total mixing, the amount of salt intrusion is the least during peak flood when compared with the other two advection schemes. Based on these results, we utilized only the MPDATA scheme to compare the amount and spatial distribution of physical and numerical mixing for a realistic 3-D Hudson River estuary case.
These results indicate that the relative contribution of numerical mixing tends to be small in stratified regimes with active vertical mixing. Using the same analysis method to quantify physical and numerical mixing, the unstructured grid used by [46] predicted that numerical mixing contributed more than half of the total mixing in the highly stratified Connecticut River estuary. The current work analyzes a different physical system of Hudson River estuary and it shows that the numerical mixing for a structured model (i.e., ROMS) with the MPDATA advection scheme is not a significant contributor towards total mixing. This is the case in the mixed layer deepening experiment, the idealized estuary, and the Hudson River simulation, all of which have active vertical mixing that is driven either by wind stress or tidal motion. In contrast, in regimes where vertical mixing is absent or weak and horizontal tracer gradients are strong, numerical mixing tends to dominate. This is illustrated by the tracer patch propagation experiment and the lock exchange case. The dominance of numerical mixing in the lock exchange case is surprising in light of the strong density gradient in the pycnocline, which may be expected to produce significant physical mixing. However, in the absence of external forcing (such as tides or winds), the lock exchange produces a relatively small amount of vertical mixing, and the numerical mixing that is associated with the fronts dominates. Well mixed estuaries would also be expected to have a relatively high contribution of numerical mixing, because of the absence of vertical mixing in the well-mixed regime.
It remains to be determined to what extent numerical mixing might represent unresolved processes in regions of strong gradients. For example, laboratory experiments reveal strong mixing at gravity current fronts [48], which is consistent with the strong numerical mixing in the lock-exchange experiment. The numerical mixing that occurs along the flanks of the estuary in the realistic Hudson simulation might bear some relation to secondary flow-induced mixing that may occur in the actual estuary at scales that are unresolved by the numerical scheme, although this conjecture needs to be tested with higher resolution models.

5. Conclusions

The current paper estimates the two sources of tracer mixing: physical mixing originating from the turbulence closure model and numerical mixing originating from discretization methods, with a focus on an estuarine environment using the COAWST modeling system. The implementation of the mixing terms is based on the prior work of Burchard and Rennau, 2008 [37]. The formulation of physical and numerical mixing terms in the model is verified in test cases 1 and 2, respectively, by comparing the time and volume integrated total mixing that amounts to total tracer variance decay. Test cases 2, 3, and 4 are used to find the effect of utilizing three different tracer advection schemes on mixing terms. The three advection schemes used in this work include the MPDATA, U3H, and HSIMT. All these schemes have been differently formulated from each other while providing a higher order of accuracy than the first order upwind scheme. The test cases highlight the mixing properties of the advection schemes. The advection scheme causing the lowest numerical mixing (U3H) results in capturing finer spatial structures that lead to a higher physical mixing. Owing to lower numerical mixing, it preserves the sharp fronts with better accuracy than the other two advection schemes. At the same time, the U3H scheme causes undershoots and overshoots of tracer quantities which may cause negative tracer concentrations. This suggests that there is a penalty associated with the U3H, although the net numerical mixing is lowest. The MPDATA and HSIMT schemes both cause a similar amount of numerical mixing while preventing the occurrence of negative tracer values. The spatial distribution of physical and numerical mixing is independent of the advection schemes and it does not coincide. It is shown that the total amount of mixing that can vary with the choice of advection scheme and can consequently impact the length of salt intrusion during peak flood. Physical mixing dominates in the pycnocline while numerical mixing dominates at the horizontal tracer fronts. It is seen through the application of the 2-D idealized estuary and the 3-D Hudson river estuary that numerical mixing might locally dominate over physical mixing. However, for both these cases with open boundaries, the amount of integrated numerical mixing through the domain as compared to integrated physical mixing remains relatively small.
The model source is available for download at https://code.usgs.gov/coawstmodel/COAWST and data sets discussed herein, and their associated metadata, are hosted and publicly available on and accessible via DOI:10.5066/P90KDWTX (Idealized domains [49] and DOI:10.5066/P95E8LAS (Hudson river estuary [50]).

Author Contributions

The project was carried under the guidance of J.C.W. and W.R.G.; J.C.W. and T.S.K. developed the model simulations and implemented the method to obtain the mixing in the model. X.L. and W.R.G. helped in the mathematical interpretation of the mixing equations when applied in the model. X.L. and T.S.K. performed the model data analysis. H.W. provided help in the implementation and analysis of the HSIMT advection scheme that was added during the course of this project. T.S.K., X.L., J.C.W. and W.R.G. contributed towards the preparation of the manuscript.

Funding

This study was funded through the Coastal Model Applications and Field Measurements Project and the Cross-shore and Inlets Project, US Geological Survey Coastal Marine Hazards and Resources Program.

Acknowledgments

We thank Alfredo Aretxabaleta on providing feedback during the project. We would like to extend our gratitude to Daniel Nowacki at the US Geological Survey in Santa Cruz, California for insightful comments to improve the quality of the paper. We thank the anonymous reviewers for their careful reading of our manuscript and their insightful comments and suggestions.

Conflicts of Interest

This draft manuscript is distributed solely for purposes of scientific peer review. Its content is deliberative and pre-decisional, so it must not be disclosed or released by reviewers. Because the manuscript has not yet been approved for publication by the U.S. Geological Survey (USGS), it does not represent any official USGS finding or policy. Any use of trade, firm, or product names is for descriptive purposes only and does not imply endorsement by the U.S. Government.

References

  1. MacDonald, D.G.; Geyer, W.R. Turbulent energy production and entrainment at a highly stratified estuarine front. J. Geophys. Res. 2004, 109, C05004. [Google Scholar] [CrossRef]
  2. Cifuentes, L.A.; Schemel, L.E.; Sharp, J.H. Qualitative and Numerical Analyses of the Effects of River Inflow Variations on Mixing Diagrams in Estuaries. Coast. Shelf Sci. 1990, 30, 411–427. [Google Scholar] [CrossRef]
  3. Hansen, D.V.; Rattray, M. Gravitational circulation in straits and estuaries. J. Mar. Res. 1965, 23, 104–122. [Google Scholar]
  4. Geyer, W.R. Influence of Wind on Dynamics and Flushing of Shallow Estuaries. Estuar. Coast. Shelf Sci. 1997, 44, 713–722. [Google Scholar] [CrossRef]
  5. Gordon, C.M.; Dohne, C.F. Some observations of Turbulent Flow in a Tidal Estuary. J. Geophys. Res. 1973, 78, 1971–1978. [Google Scholar] [CrossRef]
  6. Stacey, M.T. Turbulent Mixing and Residual Circulation in a Partially Stratified Estuary. Ph.D. Thesis, Department of Civil Engineering, Stanford University, Stanford, CA, USA, 1996. [Google Scholar]
  7. Trowbridge, J.H.; Geyer, W.R.; Bowen, M.M.; Williams, A.J., III. Near-bottom turbulence measurements in a partially mixed estuary: Turbulent energy balance, velocity structure, and along-channel momentum balance. J. Phys. Oceanogr. 1999, 29, 3056–3072. [Google Scholar] [CrossRef]
  8. Geyer, W.R.; Malcolm, E.; Scully, M.E.; David, K.; Ralston, D.K. Quantifying vertical mixing in estuaries. Environ. Fluid Mech. 2008, 8, 495–509. [Google Scholar] [CrossRef]
  9. Scully, M.E.; Geyer, W.R.; Trowbridge, J.H. The influence of stratification and nonlocal turbulent production on estuarine turbulence: An assessment of turbulence closure with field observations. J. Phys. Oceanogr. 2011, 41, 166–185. [Google Scholar] [CrossRef]
  10. Holleman, R.C.; Geyer, W.R.; Ralston, D.K. Stratified Turbulence and Mixing Efficiency in a Salt Wedge Estuary. J. Phys. Oceanogr. 2016, 46, 1769–1783. [Google Scholar] [CrossRef]
  11. Nunes Vaz, R.A.; Simpson, J.H. Turbulence closure modeling of estuarine stratification. J. Geophys. Res. 1994, 99, 143–160. [Google Scholar] [CrossRef]
  12. Simpson, J.H.; Brown, J.; Matthews, J.; Allen, G. Tidal straining, density currents, and stirring in the control of estuarine stratification. Estuaries 1990, 13, 125–132. [Google Scholar] [CrossRef]
  13. Simpson, J.H.; Sharples, J. Dynamically-active models in the prediction of estuarine stratification. In Dynamics and Exchanges in Estuaries and the Coastal Zone; Prandle, D., Ed.; Springer: New York, NY, USA, 1991; pp. 101–103. [Google Scholar]
  14. Nunes Vaz, R.A.; Lenon, G.W.; de Silva Samarasinghe, J.R. The negative role of turbulence in estuarine mass transport. Estuar. Coast. Shelf Sci. 1989, 28, 361–377. [Google Scholar] [CrossRef]
  15. Zhou, M. Influence of bottom stress on the two-layer flow induced by gravity currents in estuaries. Estuar. Coast. Shelf Sci. 1998, 46, 811–825. [Google Scholar] [CrossRef]
  16. Chatwin, P.C. Some remarks on the maintenance of the salinity distribution in estuaries. Estuar. Coast. Mar. Sci. 1976, 4, 555–566. [Google Scholar] [CrossRef]
  17. MacCready, P. Toward a Unified Theory of Tidally-Averaged Estuarine Salinity Structure. Estuaries 2004, 27, 561–570. [Google Scholar] [CrossRef]
  18. Umlauf, L.; Burchard, H. A generic length-scale equation for geophysical turbulence models. J. Mar. Res. 2003, 61, 235–265. [Google Scholar] [CrossRef]
  19. Burchard, H.; Petersen, O. Models of turbulence in the marine environment. A comparative study of two-equation turbulence models. J. Mar. Syst. 1999, 21, 29–53. [Google Scholar] [CrossRef]
  20. Burchard, H.; Petersen, O.; Rippeth, T. Comparing the performance of the Mellor–Yamada and the k–ε two-equation turbulence models. J. Geophys. Res. 1998, 103, 10543–10554. [Google Scholar] [CrossRef]
  21. Warner, J.C.; Sherwood, C.R.; Arango, H.G.; Signell, R.P. Performance of four turbulence closure models implemented using a generic length scale method. Ocean Model. 2005, 8, 81–113. [Google Scholar] [CrossRef]
  22. Soufflet, Y.; Marchesiello, P.; Lemarié, F.; Jouanno, J.; Capet, X.; Debreu, L.; Benshila, R. On effective resolution in ocean models. Ocean Model. 2006, 98, 36–50. [Google Scholar] [CrossRef]
  23. Leveque, R.J. Numerical Methods for Conservation Laws; Birkhauser Verlag: Boston, MA, USA, 1992. [Google Scholar]
  24. Ilicak, M. Quantifying spatial distribution of spurious mixing in ocean models. Ocean Model. 2016, 108, 30–38. [Google Scholar] [CrossRef] [PubMed] [Green Version]
  25. Gibson, A.H.; Hogg, A.M.; Kiss, A.E.; Shakespeare, C.J.; Adcroft, A.J. Attribution of horizontal and vertical contributions to spurious mixing in an Arbitrary Lagrangian-Eulerian ocean model. Ocean Model. 2017, 119, 45–56. [Google Scholar] [CrossRef]
  26. Klingbeil, K.; Mohammadi-Aragh, M.; Gräwe, U.; Burchard, H. Quantification of spurious dissipation and mixing Discrete Variance Decay in a Finite-Volume framework. Ocean Model. 2014, 81, 49–64. [Google Scholar] [CrossRef]
  27. Warner, J.C.; Sherwood, C.R.; Signell, R.P.; Harris, C.K.; Arango, H.G. Development of a three-dimensional, regional, coupled wave, current, and sediment-transport model. Comput. Geosci. 2008, 34, 1284–1306. [Google Scholar] [CrossRef]
  28. Chassignet, E.P.; Arango, H.G.; Dietrich, D.; Ezer, T.; Ghil, M.; Haidvogel, D.B.; Ma, C.-C.; Mehra, A.; Paiva, A.M.; Sirkes, Z. DAMEE-NAB: The base experiments. Dyn. Atmos. Ocean. 2000, 32, 155–183. [Google Scholar] [CrossRef]
  29. Haidvogel, D.B.; Arango, H.G.; Hedstrom, K.; Beckmann, A.; Malanotte-Rizzoli, P.; Shchepetkin, A.F. Model evaluation experiments in the North Atlantic Basin: Simulations in nonlinear terrain-following coordinates. Dyn. Atmos. Ocean. 2000, 32, 239–281. [Google Scholar] [CrossRef]
  30. Shchepetkin, A.F.; McWilliams, J.C. The Regional Ocean Modeling System: A split-explicit, free-surface, topography-following coordinates ocean model. J. Ocean Model. 2005, 9, 347–404. [Google Scholar] [CrossRef]
  31. Haidvogel, D.B.; Arango, H.G.; Budgell, W.P.; Cornuelle, B.D.; Churchitser, E.; Di Lorenzo, E.; Fennel, K.; Geyer, W.R.; Hermann, A.J.; Lanerolle, L.; et al. Ocean forecasting in terrain following coordinates: Formulation and skill assessment of the Regional Ocean Modeling System. J. Comput. Phys. 2008, 227, 3595–3624. [Google Scholar] [CrossRef]
  32. Smolarkiewicz, P.K. A simple positive definite advection scheme with small implicit diffusion. Mon. Weather Rev. 1983, 111, 479–486. [Google Scholar] [CrossRef]
  33. Smolarkiewicz, P.K. A fully multidimensional positive definite advection transport algorithm with small implicit diffusion. J. Comput. Phys. 1984, 54, 325–362. [Google Scholar] [CrossRef]
  34. Shchepetkin, A.F.; McWilliams, J.C. Quasi-monotone advection schemes based on explicit locally adaptive dissipation. Mon. Weather Rev. 1998, 126, 1541–1580. [Google Scholar] [CrossRef]
  35. Wu, H.; Zhu, J. Advection scheme with 3rd high-order spatial interpolation at the middle temporal level and its application to saltwater intrusion in the Changjiang Estuary. Ocean Model. 2010, 33, 33–514. [Google Scholar] [CrossRef]
  36. Sweby, P.K. High resolution schemes using flux limiters for hyperbolic conservation laws. Society of Industrial and Applied Mathematics. J. Numer. Anal. 1984, 21, 995–1011. [Google Scholar] [CrossRef]
  37. Burchard, H.; Rennau, H. Comparative quantification of physically and numerically induced mixing in ocean models. Ocean Model. 2008, 20, 293–311. [Google Scholar] [CrossRef]
  38. Kato, H.; Phillips, O.M. On the penetration of a turbulent layer into a stratified fluid. J. Fluid Mech. 1969, 37, 643–655. [Google Scholar] [CrossRef]
  39. Trowbridge, J.H. A simple description of the deepening and structure of a stably stratified flow driven by a surface stress. J. Geophys. Res. 1992, 97, 15529–15543. [Google Scholar] [CrossRef]
  40. Burchard, H.; Bolding, K. Comparative analysis of four second-moment turbulence closure models for the oceanic mixed layer. J. Phys. Oceanogr. 2001, 31, 1943–1968. [Google Scholar] [CrossRef]
  41. Warner, J.C.; Geyer, W.R.; Lerczak, J.A. Numerical modeling of an estuary: A comprehensive skill assessment. Geophys. Res. Lett. 2005, 40, 5451–5455. [Google Scholar] [CrossRef]
  42. Price, J.F. On the scale of stress-driven entrainment experiments. J. Fluid Mech. 1979, 90, 509–529. [Google Scholar] [CrossRef]
  43. Ralston, D.K.; Warner, J.C.; Geyer, W.R.; Wall, G.R. Sediment transport due to extreme events: The Hudson River estuary after tropical storms Irene and Lee. Geophys. Res. Lett. 2013, 40, 5451–5455. [Google Scholar] [CrossRef] [Green Version]
  44. Geyer, R.W.; Ralston, D.K. Estuarine Frontogenesis. J. Phys. Oceanogr. 2014, 45, 546–561. [Google Scholar] [CrossRef]
  45. Wang, T.; Geyer, R.W.; MacCready, P. Total Exchange Flow, Entrainment, and Diffusive Salt Flux in Estuaries. J. Phys. Oceanogr. 2017, 47, 1205–1220. [Google Scholar] [CrossRef]
  46. Ralston, D.K.; Cowles, G.W.; Geyer, W.R.; Holleman, R.C. Turbulent and numerical mixing in a salt wedge estuary: Dependence on grid resolution, bottom roughness, and turbulence closure. J. Geophys. Res. Ocean. 2017, 122, 692–712. [Google Scholar] [CrossRef]
  47. Harten, A. On High-Order Accurate Interpolation for Non-Oscillatory Shock Capturing Schemes. In Oscillation Theory, Computation, and Methods of Compensated Compactness; The IMA Volumes in Mathematics and Its Applications; Dafermos, C., Ericksen, J.L., Kinderlehrer, D., Slemrod, M., Eds.; Springer: New York, NY, USA, 1986; Volume 2. [Google Scholar]
  48. Simpson, J.E.; Britter, R.E. The dynamics of the head of a gravity current advancing over a horizontal surface. J. Fluid Mech. 1979, 94, 477–495. [Google Scholar] [CrossRef]
  49. Kalra, T.S.; Warner, J.C. Idealized COAWST Model Cases for Studying the Comparison of Physical to Numerical Mixing with Different Tracer Advection Schemes in Estuarine Environments; U.S. Geological Survey Data Release; USGS: Reston, VA, USA, 2019.
  50. Warner, J.C.; Kalra, T.S. Numerical Model of Salinity Transport and Mixing in the Hudson River Estuary; U.S. Geological Survey Data Release; USGS: Reston, VA, USA, 2019.
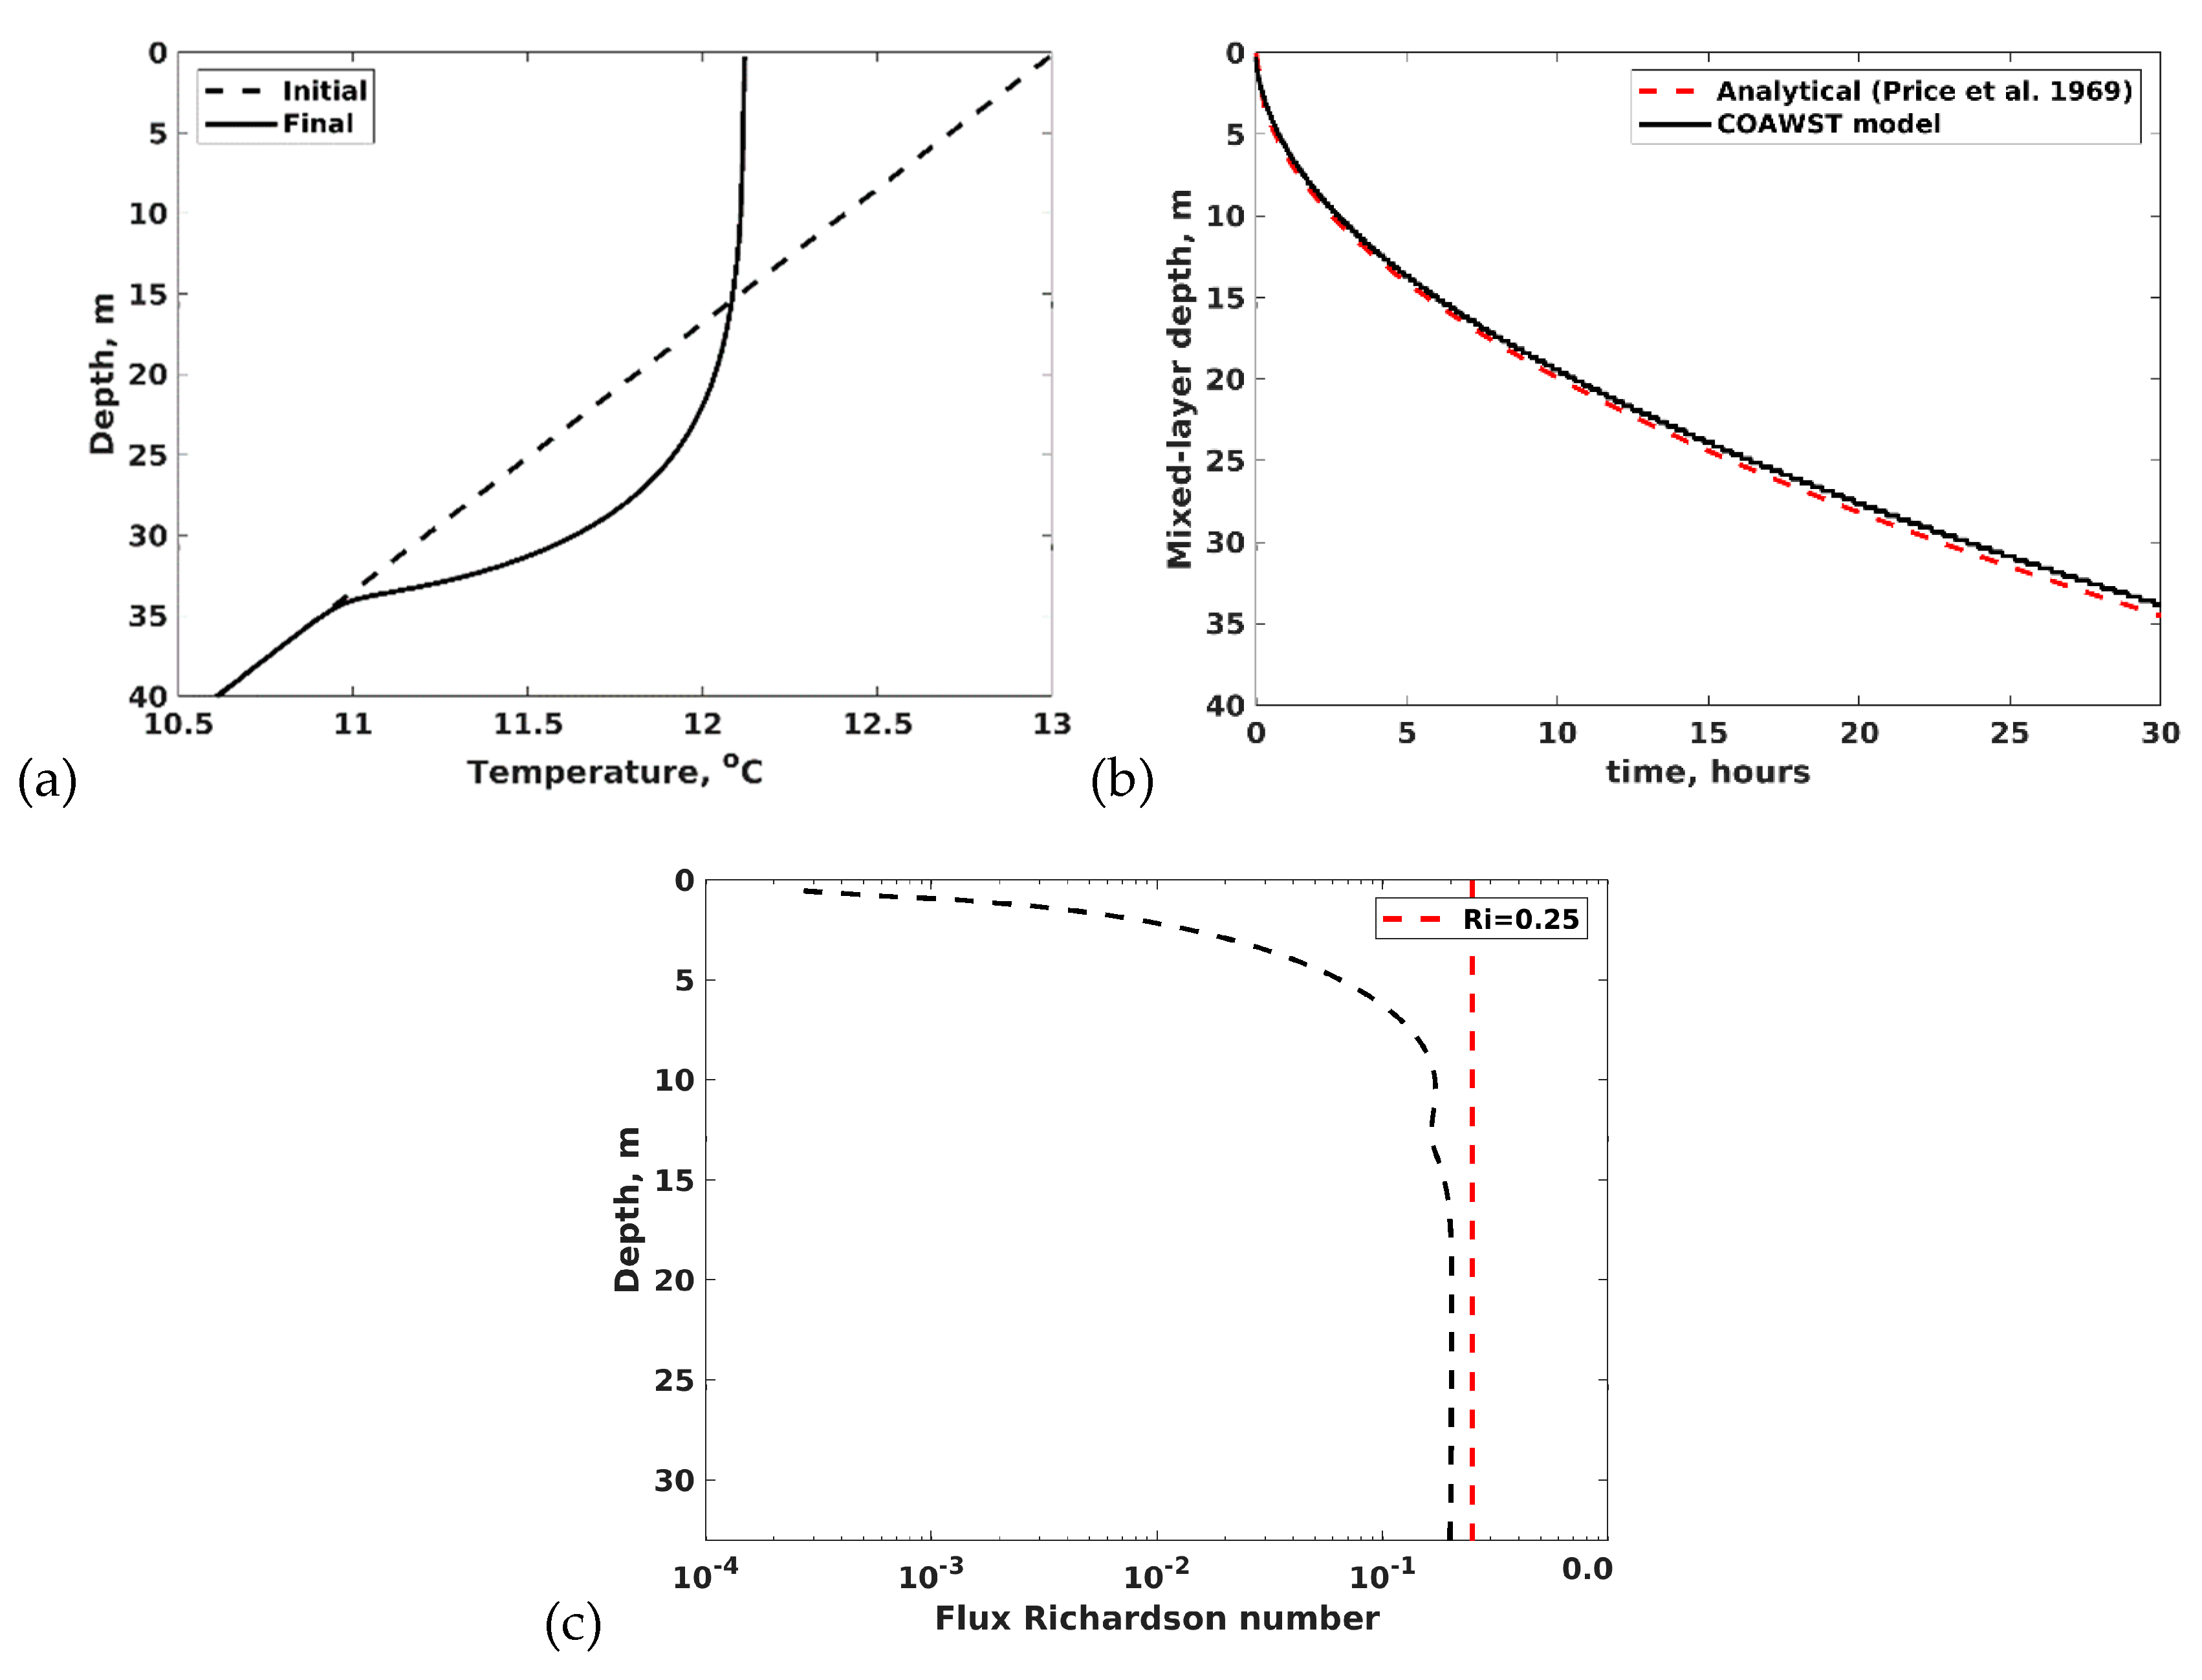
Figure 1. Test case 1: Wind induced mixed-layer deepening; Vertical profiles (a) initial and final temperature, (b) Comparison of model output with analytical solution of Price et al. (1979), and (c) Flux Richardson number ( R f ) at the end of simulation.
Jmse 07 00338 g001
Figure 2. Test Case 2: Horizontal tracer patch propagation; Comparison of tracer advection schemes after 9600 s with exact profile.
Jmse 07 00338 g002
Figure 3. Case 3: Lock exchange problem using the Multidimensional Positive Definite Advection Transport Algorithm (MPDATA) scheme with a Δ x of 50 m, (a) Along channel salinity profile (15 psu isohaline) and velocity vectors (drawn to scale) varying with depth at (t = 0 h, t = 0.5 h, t = 1.1 h, t = 2.2 h), (b) Flux Richardson number ( R f ) at x = 3.85 km at the end of simulation.
Jmse 07 00338 g003
Figure 4. Test Case 3: Lock exchange using the MPDATA scheme with a Δ x of 50 m; Spatial distribution of (a) Physical mixing, (b) Numerical mixing at the end of simulation (2.2 h) drawn along with 15 psu isohaline.
Jmse 07 00338 g004
Figure 5. Test Case 3: Lock exchange using the MPDATA scheme with a Δ x of 50 m; (a) Comparing numerical mixing distribution with contour levels of salinity (15 psu isohaline) using different tracer advection schemes (b) Salinity profile at 1.25 m depth at the end of simulation (2.2 h).
Jmse 07 00338 g005aJmse 07 00338 g005b
Figure 6. Case 4: Estuary test case with a rectangular geometry; Along channel estuarine flow with tidal input from west and river input from east at different time intervals (Simulation setup for 30 days using MPDATA). Arrows represent scaled velocity vector with a scaling factor of 2.5.
Jmse 07 00338 g006
Figure 7. Case 4: Estuary test case with a rectangular geometry; Comparing salt intrusion (2, 5, and 15 psu isohalines) with the three different advection schemes at the end of 30 days with 2, 5, and 15 psu isohaline.
Jmse 07 00338 g007
Figure 8. (a) Hudson River estuary grid (rectangular box on the figure shows area of interest), (b) Close up on the area of interest at the lower part of Hudson River estuary.
Jmse 07 00338 g008
Figure 9. Hudson River estuary: (a) Salinity distribution, and depth integrated (b) physical and (c) numerical mixing during time averaged ebb cycle.
Jmse 07 00338 g009
Figure 10. Hudson River estuary; Comparing instantaneous (a) Physical mixing, (b) Tracer vertical diffusion coefficient, (c) Vertical salinity gradient, (d) Numerical mixing, (e) Salinity, and (f) Horizontal salinity gradient at 1700 h on April 2, 2015 at a cross-section corresponding to a lateral front of 40.85°.
Jmse 07 00338 g010
Table 1. Comparing physical, numerical mixing with total mixing and variance decay. Column 1: Mphys/Mtotal = Ratio of physical to total mixing; Column 2: Mnum/Mtotal = Ratio of numerical to total mixing; Column 3: Mtotal = Total mixing (non-dimensionalized by total volume) in (°C)2 for test case 1 and in (psu)2 for test cases 2, 3, 4. Column 4: Vtotal = Total variance decay (non-dimensionalized by total volume) in (°C)2 for test case 1 and in (psu)2 for test cases 2, 3, 4.
Advection SchemeMphys/MtotalMnum/MtotalMtotalVtotal
Test Case 1: MPDATA1.00.00.25−0.25
Test Case 1: U3H1.00.00.25−0.25
Test Case 1: HSIMT1.00.00.25−0.25
Test Case 2: MPDATA0.01.00.002−0.002
Test Case 2: U3H0.01.00.0003−0.0003
Test Case 2: HSIMT0.01.00.002−0.002
Test Case 3: MPDATA0.0860.91417.994−18.968
Test Case 3: U3H0.1120.88815.168−16.211
Test Case 3: HSIMT0.0760.92318.721−19.597
Test Case 4: MPDATA0.9910.009211.619−171.377
Test Case 4: U3H0.9980.002235.329−188.808
Test Case 4: HSIMT0.9960.014225.643−182.531
Table 2. Effective numerical diffusivity based on the ratio of numerical mixing to horizontal tracer gradient (Equation (9)) for Test case 2: one-dimensional (1-D) horizontal tracer patch propagation, and Test case 3: two-dimensional (2-D) lock exchange.
Advection Scheme Effective   Numerical   Diffusivity   (   K a d v e c t i o n s c h e m e 0.5 u Δ x ;   Non - dimensional )
Test case 2: K M P D A T A 0.164
Test case 2: K U 3 H 0.009
Test case 2: K H S I M T 0.161
Test case 3: K M P D A T A 0.40
Test case 3: K U 3 H 0.22
Test case 3: K H S I M T 0.35
Table 3. Effect of grid resolution on physical and numerical mixing using test case 3, the lock exchange. Comparing physical, numerical mixing with total mixing. Column 1: Mphys/Mtotal = Ratio of numerical to total mixing; Column 2: Mnum/Mtotal = Ratio of physical to total mixing; Column 3: Mtotal = Total mixing (non-dimensionalized by total volume) in in (psu)2.
Grid   Resolution   ( Δ x ) ,   Advection   Scheme Mphys/MtotalMnum/MtotalMtotal
50 m, MPDATA0.0860.91417.994
50 m, U3H0.1120.88815.168
50 m, HSIMT0.0760.92318.721
25 m, MPDATA0.1110.88915.936
25 m, U3H0.1380.86214.066
25 m, HSIMT0.1130.88615.742
12.5 m, MPDATA0.1340.86614.565
12.5 m, U3H0.1820.81812.733
12.5 m, HSIMT0.1450.85414.018