1. Introduction
This study addresses the required research on the assessment and characterization of damage to coastal structures with rock armored slopes produced by the impact of environmental loads. The development of consistent and accurate damage characterization methods aims to fully describe the response, as well as the remaining strength of the coastal structures after facing a given loading condition. This paper will elaborate on how, with high resolution measurements from digital stereo photography (DSP), more advanced damage parameters can be used. Combined with clear damage definitions (such as characterization width and damage limits), this can offer a precise damage characterization of conventional (e.g., straight slope) and non-conventional (e.g., slopes with a berm and roundheads) structures.
Climate change should also be considered, as this phenomenon increases the environmental loads acting on coastal structures. In such scenarios, the damage characterization methods presented in this paper aim to improve the assessment of conventional and non-conventional structures used as upgrading and adaptation alternatives.
1.1. Background
In the assessment of coastal structures, damage can be defined as “the movement of armor units as consequence of the impact of environmental loads” [
1]. Hudson [
2] used the percentage of displaced units to characterize damage. Later on, Thompson and Shuttler [
3] and Broderick [
4] introduced parameters to describe damage as the number of removed units from the slope. The parameter S [
4] is widely used and is based on the eroded area (difference between the initial and final width-averaged profiles) divided by the nominal diameter of the armor units.
More recently, Melby and Kobayashi [
5] introduced three additional damage parameters including the normalized erosion depth (E), the normalized erosion length (L), and the normalized cover depth (C) obtained for averaged profiles over the width. Hofland et al. [
6,
7] recently incorporated innovative and more accurate measuring techniques, such as DSP, for the survey of damage in physical modelling tests, and presented a three-dimensional erosion depth parameter (E
3D,m) to be used in the damage characterization of conventional and non-conventional coastal structures.
1.2. Current Limitations
Firstly, the concepts of “damage initiation”, “intermediate damage”, and “failure” are not accurately and uniformly described. Different authors established the current limits based on unconsolidated arguments, also influenced by less detailed measurement techniques (such as being obtained from a limited number of profiles). Broderick [
4] defined the condition of no-damage as S = 2, “which is the lowest level of damage that can be consistently detected in the survey data”, while failure is described as “when enough rip-rap is shifted to expose the filter material”, again without a filter exposure extension. Van der Meer [
1] defines these limits in a similar manner—start of damage is described as S = 2 for a 1:2 slope and failure is reached when the filter layer becomes visible, without describing an extension threshold.
Secondly, the suitability of innovative damage parameters to accurately characterize the response and remaining strength of rubble mound structures is further investigated. The damage parameter S used by Van der Meer [
1] provides limited information about the structure conditions and is only considered for trunk sections. The damage parameters presented by Melby and Kobayashi [
5] and by Hofland et al. [
6,
7] could present a more accurate description of damage for conventional and non-conventional slopes, providing a significant improvement in the characterization of the structure conditions.
Thirdly, damage characterization methods for rubble mound structures can increase their accuracy and reliability as a result of the continuous development of testing and measuring techniques. New measuring techniques such as DSP [
6,
7] are able to provide model surveys with millimeter resolution and describe the damage in detail.
Following the three previously described limitations of current methods, this study focuses on the following aspects of damage characterization: concepts (demand for unified damage characterization concepts) in
Section 3.1, parameters (demand for universal and more accurate damage characterization parameters) in
Section 3.2, and measuring techniques (demand for validating the suitability of innovative survey methods) in
Section 3.3. The physical model tests are presented in
Section 2 and the main conclusions are discussed in
Section 4.
2. Physical Model Tests
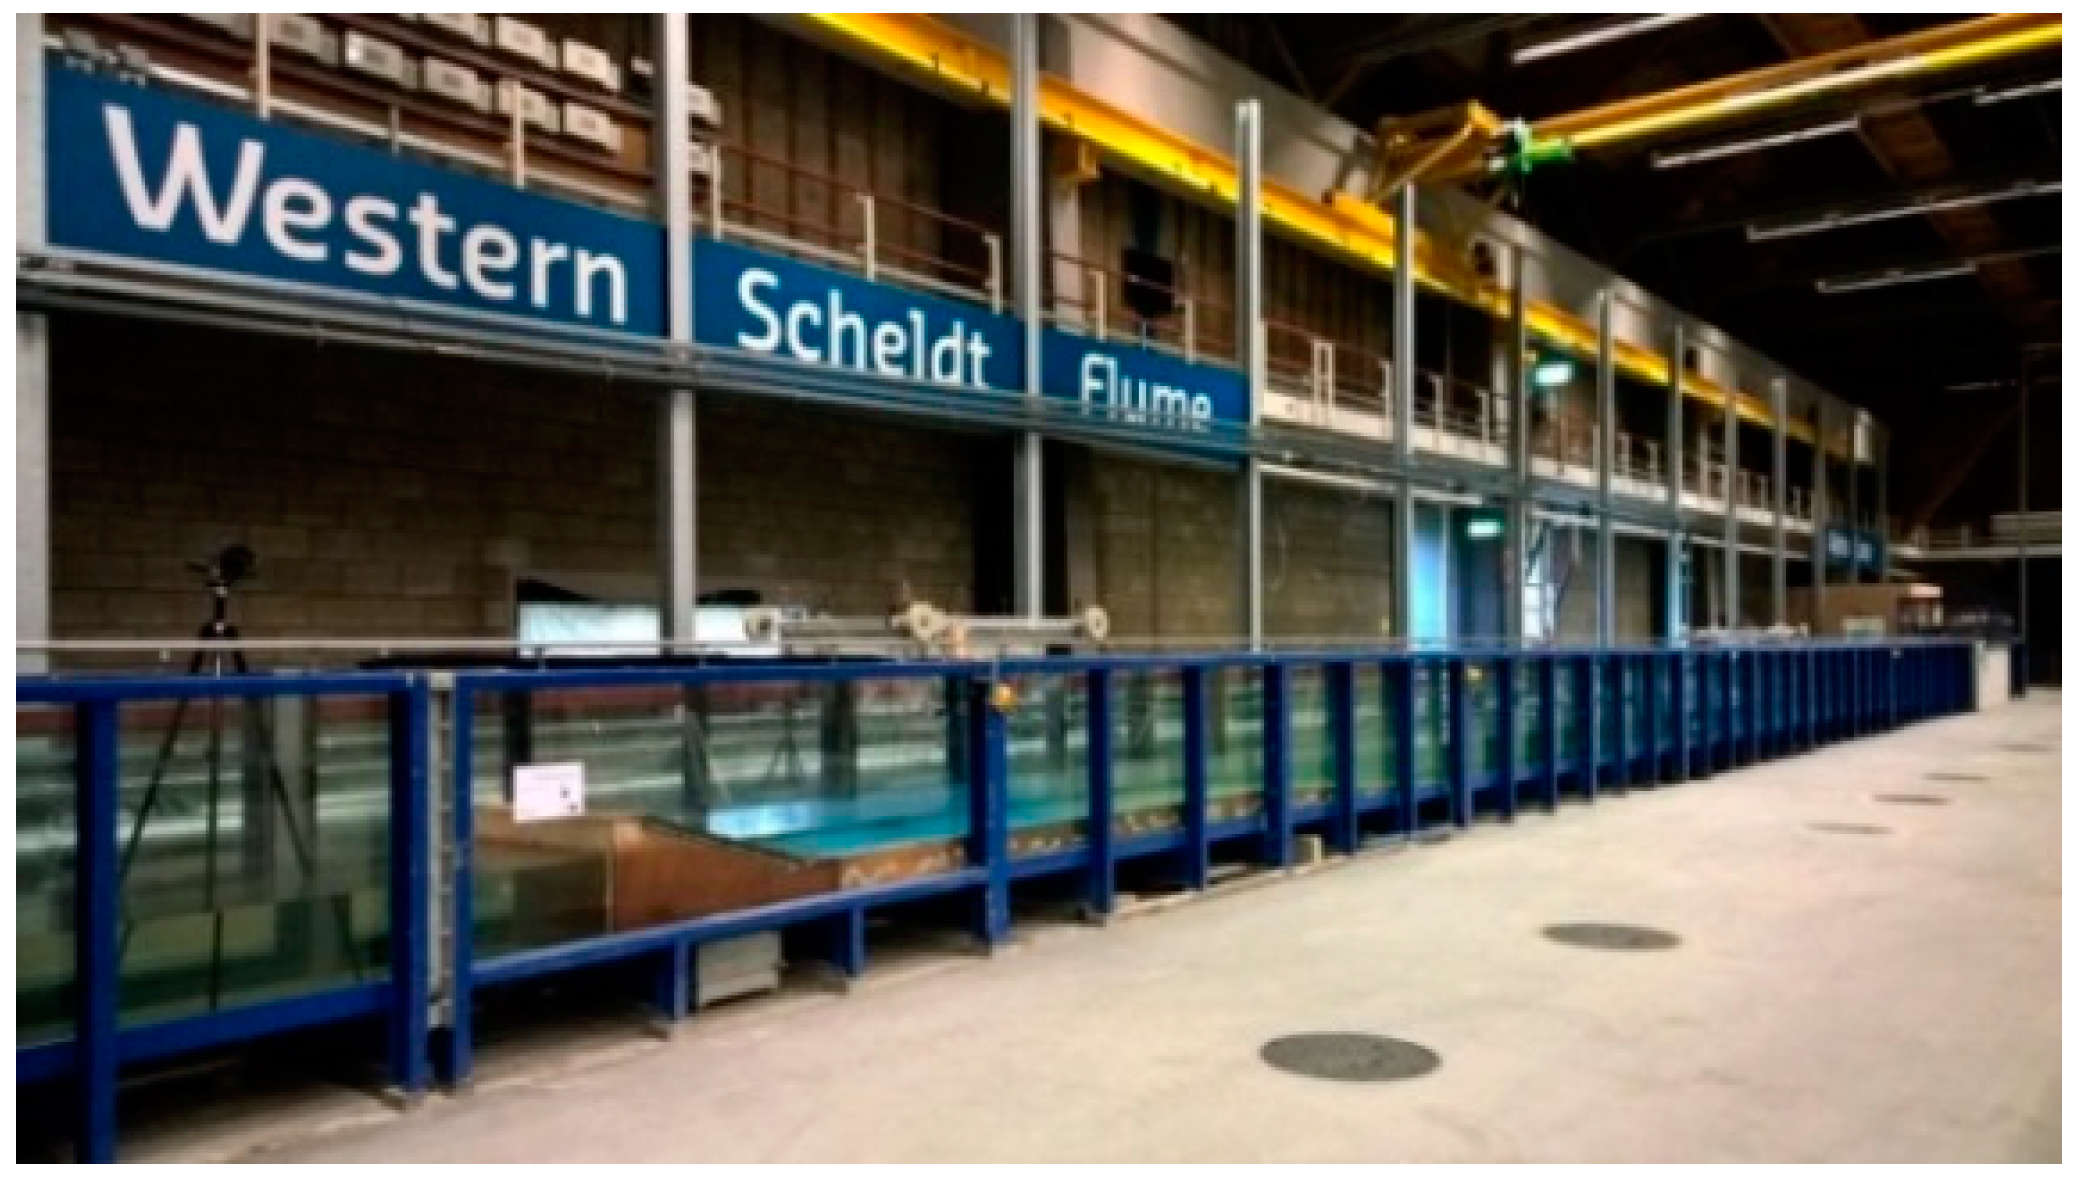
A physical modelling campaign was carried out at Deltares within the European Hydralab+ framework. These tests were planned with the aim of obtaining better validation data for addressing the research aims. They were carried out in the Scheldt Flume at Deltares, Delft, The Netherlands (see
Figure 1). The set-up was based on shallow coastal areas with wave conditions that were depth-limited. Thus, conditions under which the increase in the water level due to climate change would be directly linked to a change in the incident wave height at the toe of the structure were studied.
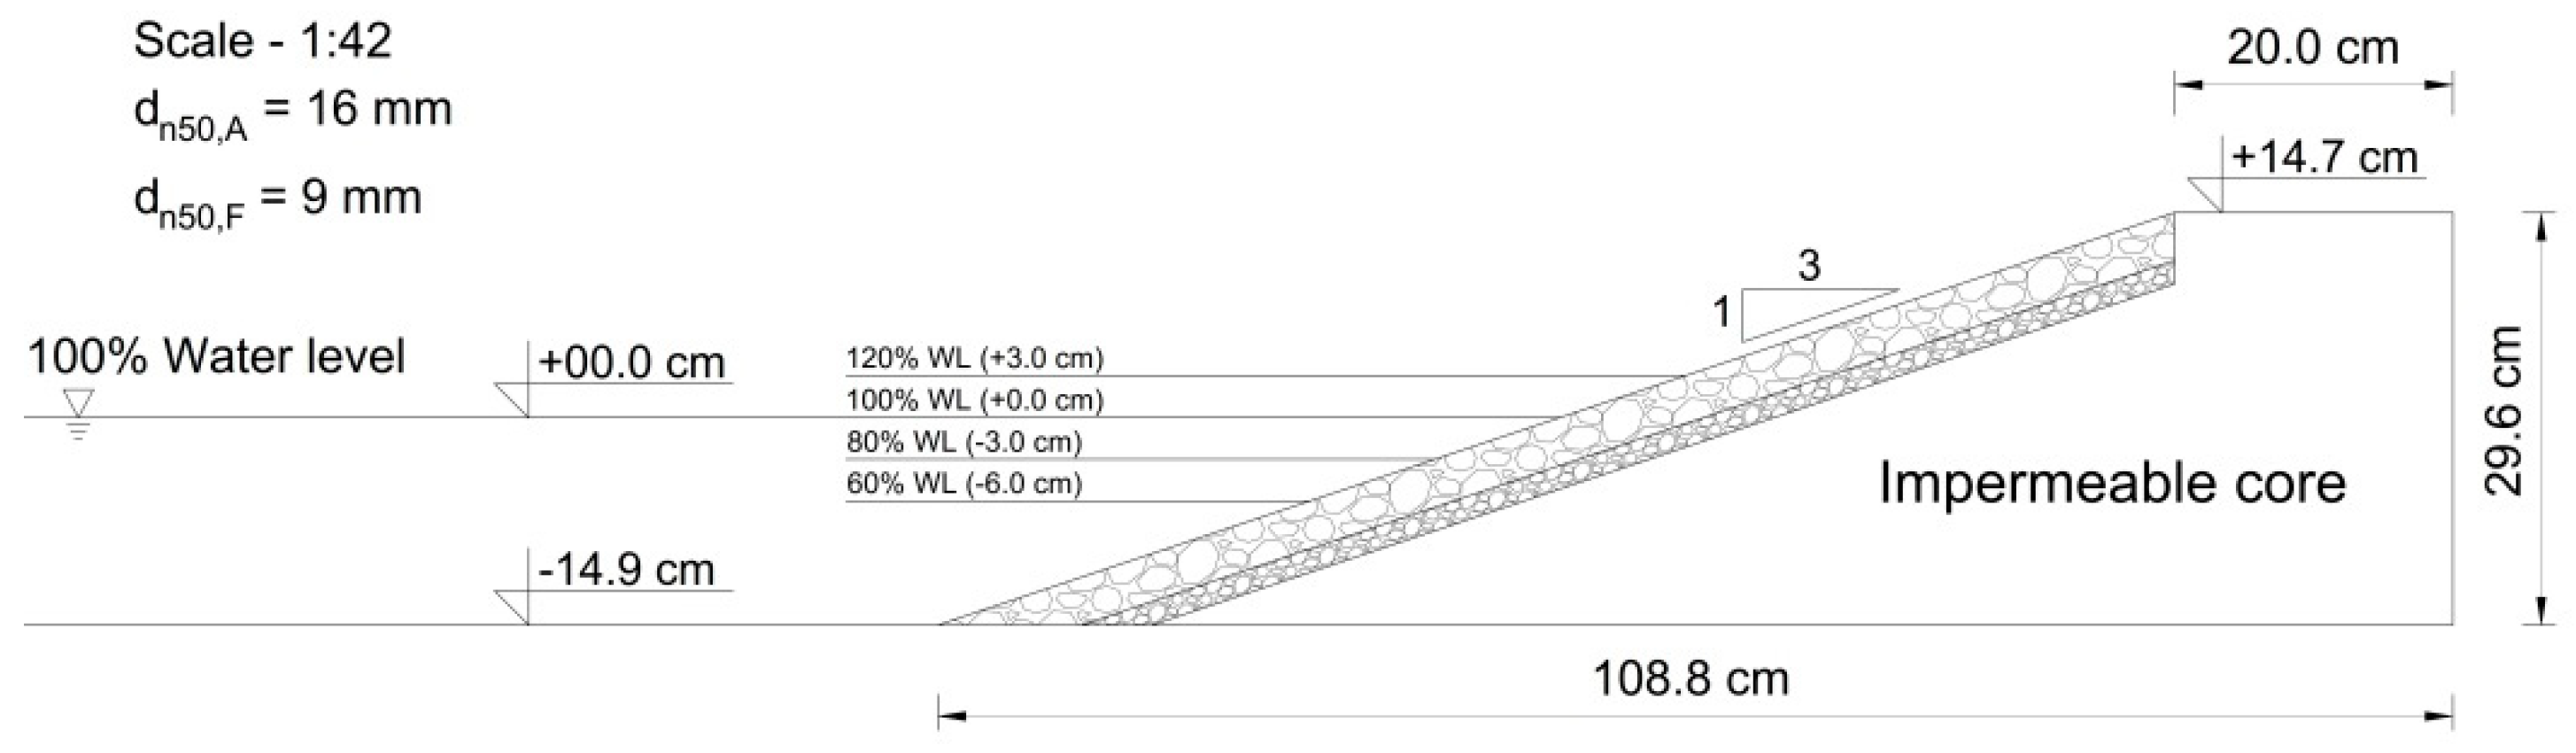
This set-up consisted of a non-overtopped rubble mound structure with an impermeable core, a filter (D
n50 = 9.4 mm), a 1:3 two-layer rock armored slope (D
n50 = 16.3 mm and D
n85/D
n15 = 1.19), and a foreshore (see
Figure 2). In addition, the main particularity of these tests for shallow coastal areas is that the generated wave was equal for all test runs, and only the change in the water depth at the toe of the structure defined the incident wave height. This way, the effect of the sea level rise in the damage to the structure was clearly represented. Thus, this set-up provided a large amount of data given the number of tests carried out, which allowed the testing of different slope configurations and a number of repetition tests. The testing conditions included the following:
Current sea level and sea level rise scenarios (in depth-limited conditions).
Cumulative and non-cumulative damage.
Damage variability: repetition tests.
The cross-section of the model set-up used in the Deltares tests is shown in
Figure 3. During these tests, only the damage to the front slope was evaluated. In this study, only the straight slope configuration is considered. The test program, including slope configurations with a berm, is described in the works of [
8,
9]. Incident wave heights were depth-limited given that an 8 m long foreshore was present in this model. The model (considering reference wave climate in the Dutch coast) followed the Froude criterion. Moderate Reynolds (Re > 1 × 10
4) ensured turbulent conditions in the filter and armor (no permeable core) and negligible scale effects. In addition, the wave generation equipment included active compensation for the reflected wave at the wave board.
The (straight slope) tests included 25 runs in two series (repeated five times each), described in
Table 1, which shows the type of damage (cumulative or non-cumulative), the water depth at the toe of the structure (h
T), the test condition (Cond.), the targeted generated wave height (H
s,g), the targeted wave height at the toe of the structure (H
s,T), the targeted peak wave period (T
p), and the number of waves of each test run (N
w).
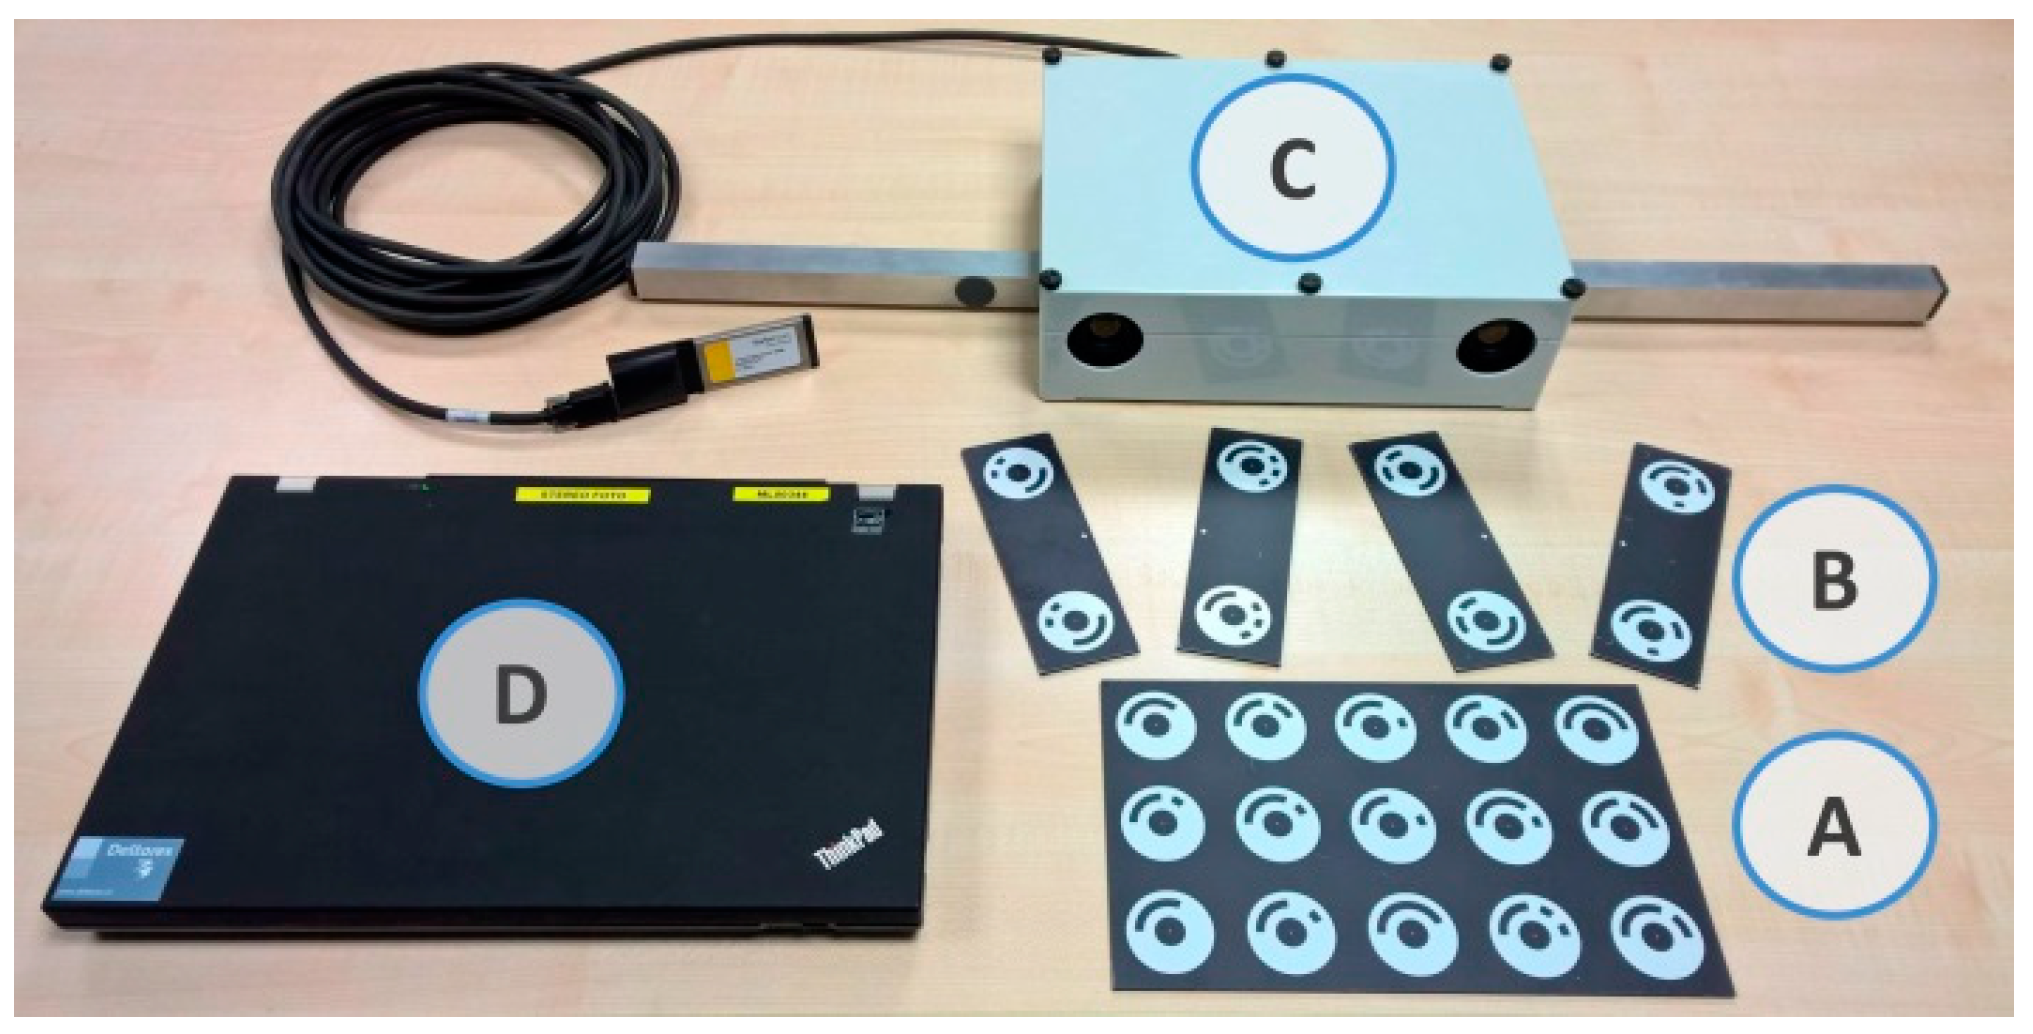
During those tests, the measurement of damage to the armor layer was done using the digital stereo photography (DSP) technique. This method used the following equipment described in
Figure 4 and in the list hereafter.
A—Markers base plate: fixed origin of coordinates for the 3D reconstruction and comparison between test runs, to be kept fixed during the complete testing period.
B—Additional markers: pairs of reference points used in the 3D reconstruction, to be randomly placed before a measurement and removed after it (if necessary, they can also be fixed).
C—Cameras: two digital cameras with a fixed distance between each other.
D—Laptop: used for obtaining the pairs of images and carrying out the post-processing.
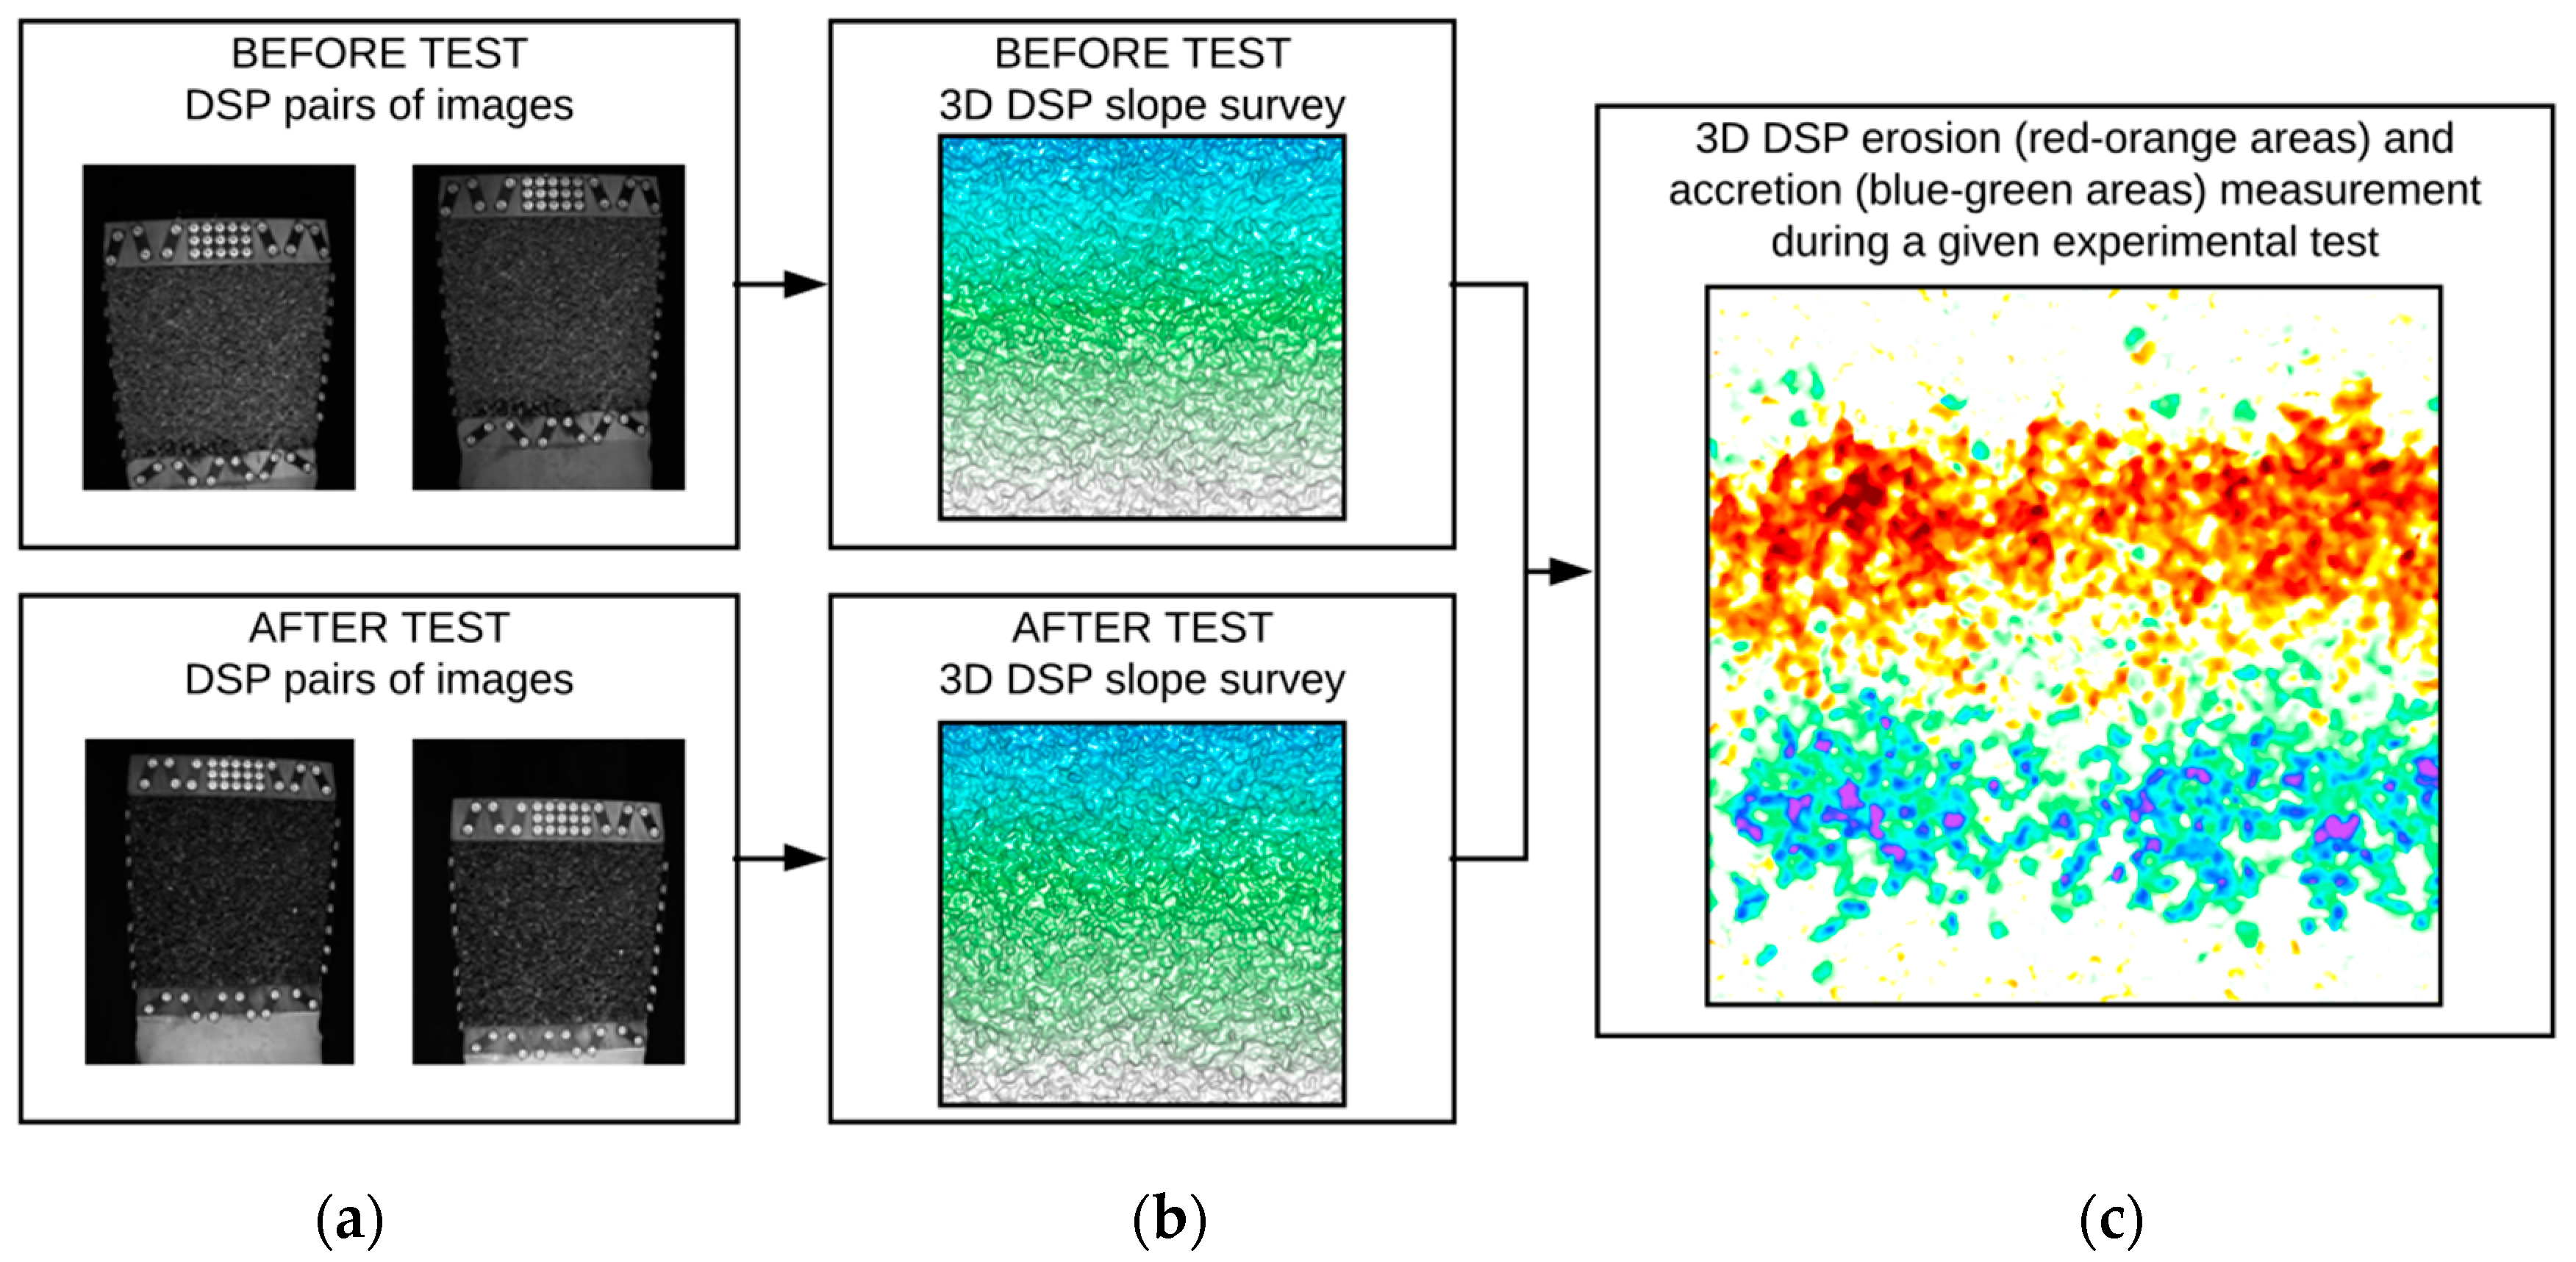
Figure 5 shows the workflow for the characterization of damage to rock slopes using digital stereo photography. The images and measurements shown in
Figure 5 are obtained from the measurement campaign carried out during this research (see tested rock slope in
Figure 2). From about 10 pairs of images (
Figure 5a) before and after a given test run, the 3D reconstructions of the structure are obtained (
Figure 5b). Comparing those 3D models from before and after the given tests, the 3D damage reconstruction is obtained (
Figure 5c). This method for measuring damage is used during this research. From those measurements, the erosion areas (in yellow-orange-red in
Figure 5c) are assessed and characterized (for more details on the DSP technique, see [
6,
7,
10])
3. Damage Characterization Method
This section has the aim of validating the damage characterization methods, which include the damage concepts (
Section 3.1), damage parameters (
Section 3.2), and measuring techniques (
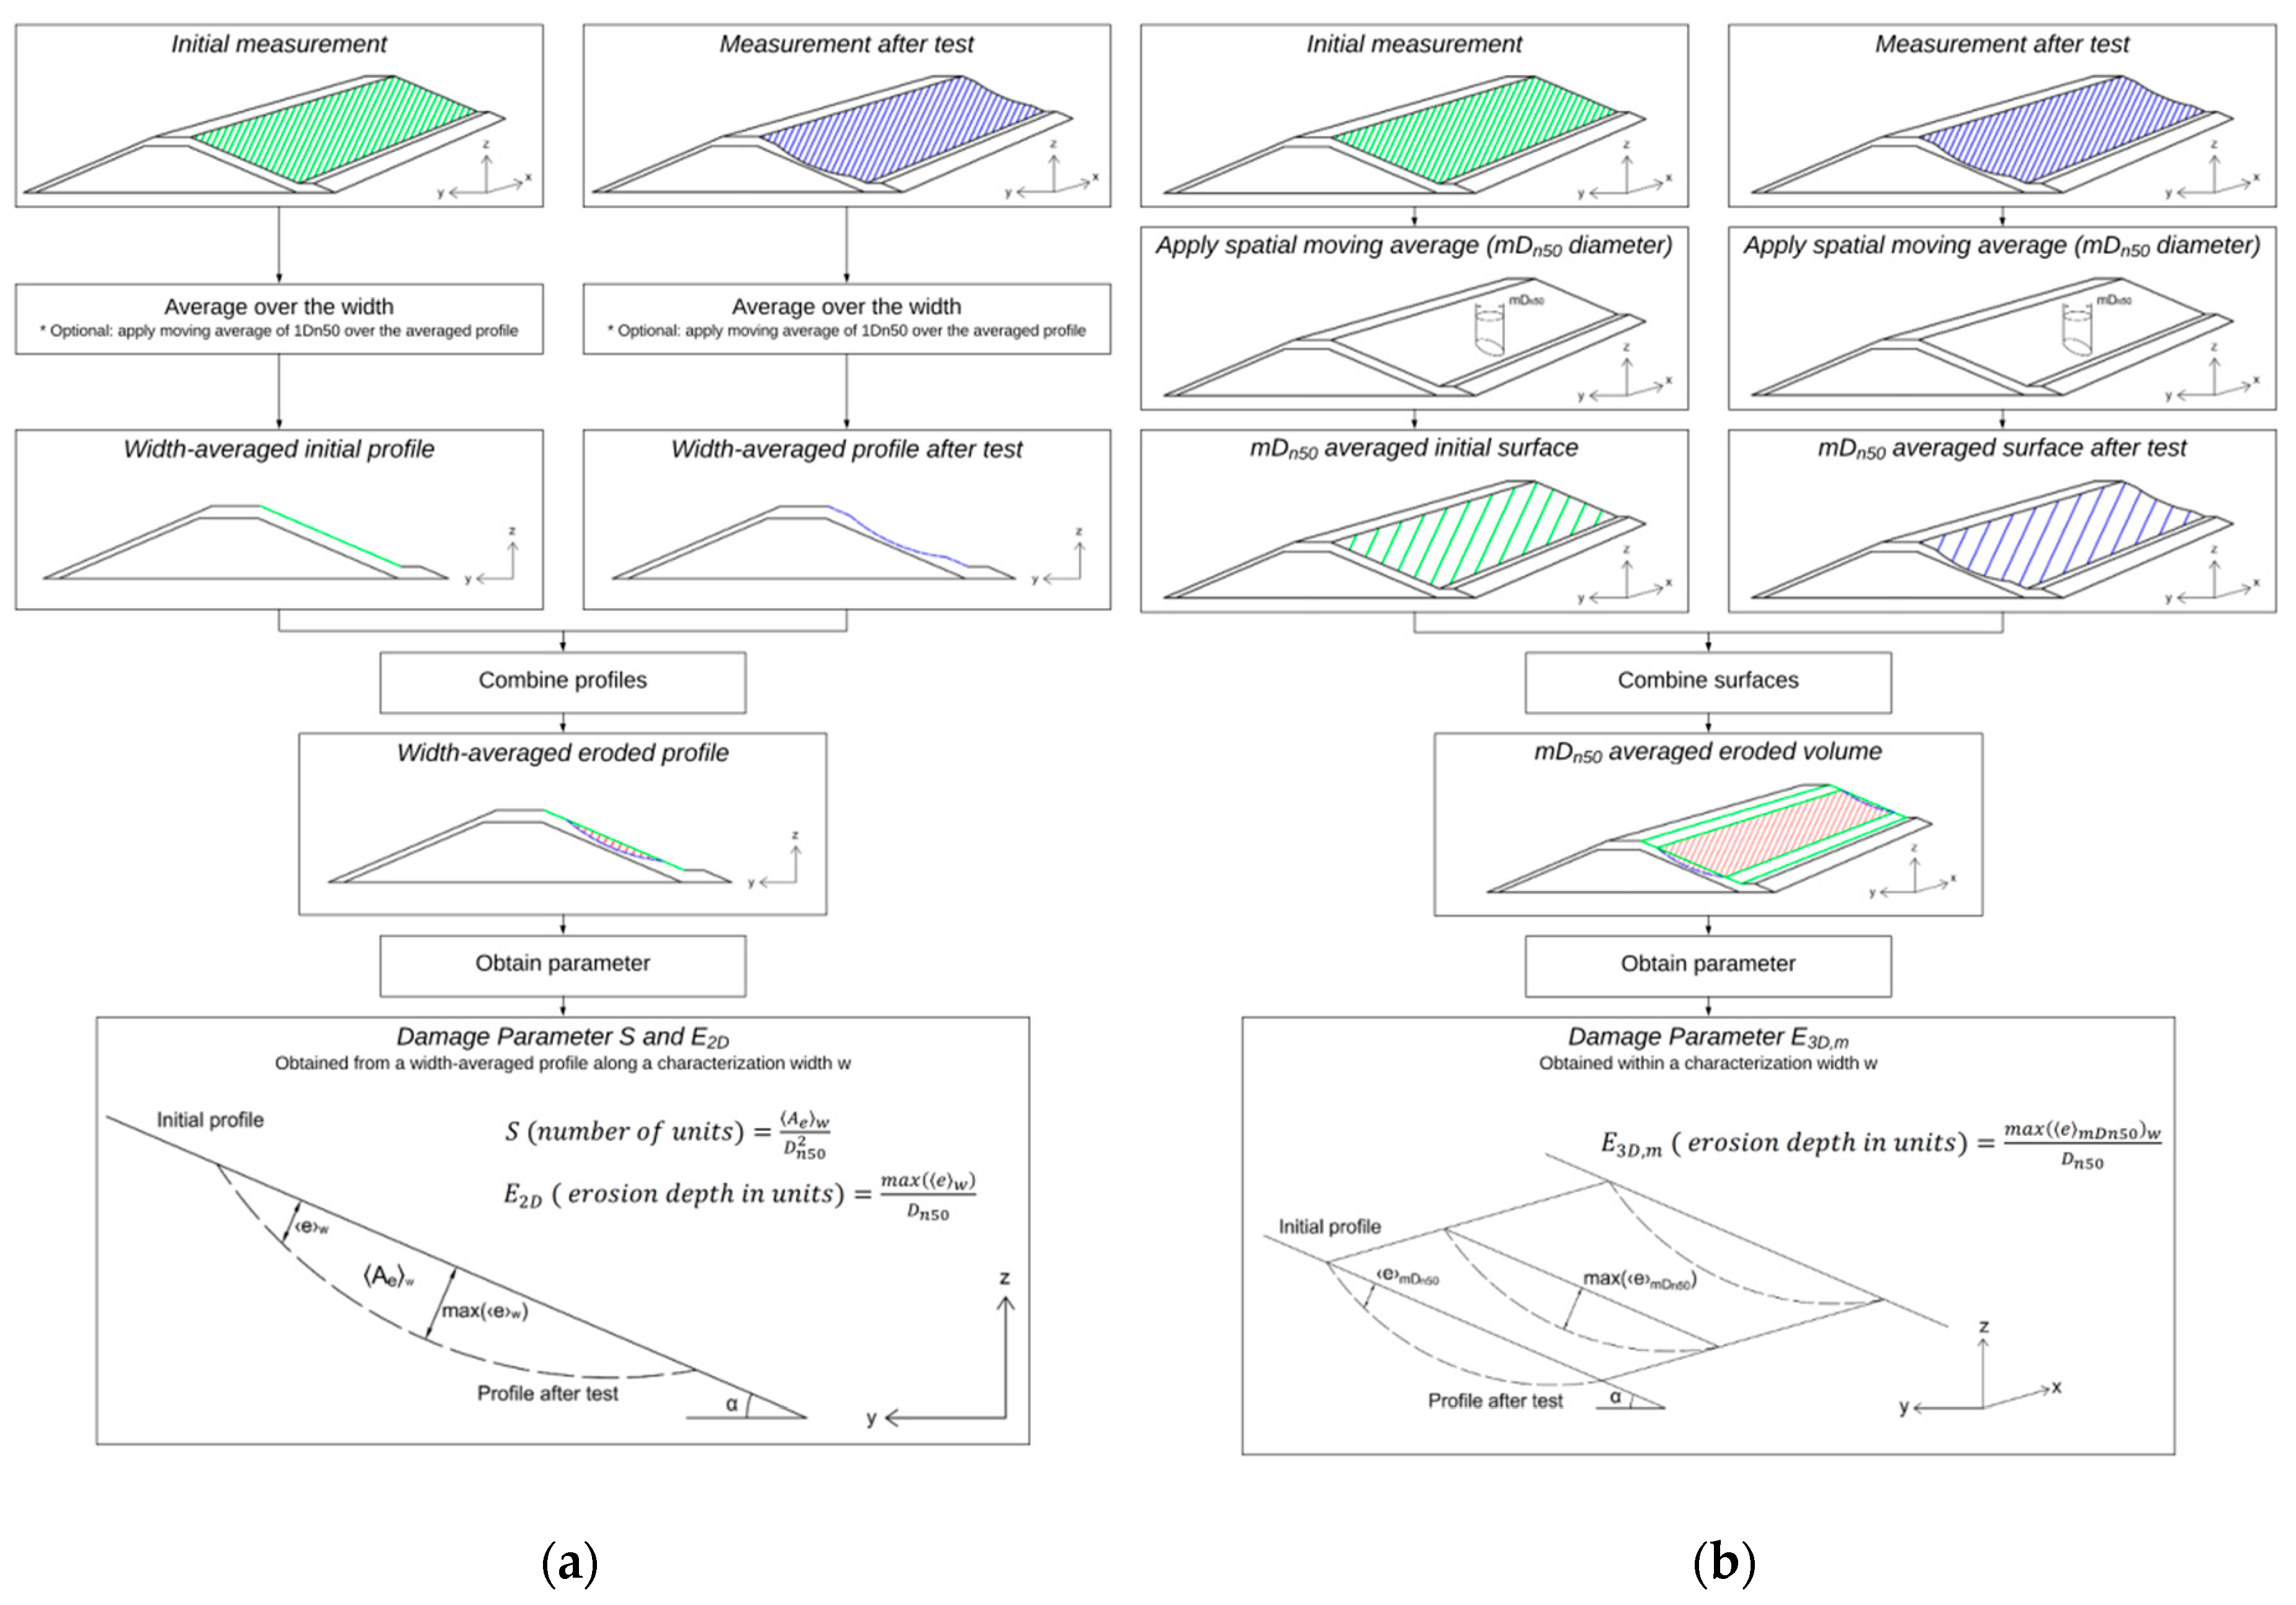
Section 3.3). For that, the physical modelling tests presented in the previous section are used. As a first step, the damage parameters considered in this study are described in more detail, including the procedure for their calculation in
Figure 6, for the S and E
2D parameters (6a) and for the E
3D,m parameters (6b).
The first parameter considered is S, as defined by Broderick [
4] (see Equation (1)). This damage parameter is widely used and describes the damage to the structure as the number of units eroded in the width-averaged profile.
where
(m
2) is the eroded area from the averaged profile obtained over a given characterization width w and
(m) is the nominal median diameter.
The parameters E
2D [
5] and E
3D,m [
6,
7] are shown in Equations (2) and (3), respectively. These two parameters estimate the damage to the structure considering the maximum erosion depth perpendicular to the slope. The distinction between them is that for E
2D, this erosion depth is measured in the width-averaged profile, while for E
3D,m, this erosion depth is obtained as the maximum erosion depth recorded at any point of the structure or defined characterization width. In addition, for E
3D,m, the initial profile and the profile after the test are averaged with a circular spatial moving average with mD
n50 diameter.
where
(m) is the maximum erosion depth from the averaged profile obtained over a given characterization width w,
(m) is the maximum erosion depth averaged over an area of mD
n50 diameter obtained over a given characterization width w, and
(m) is the nominal median diameter.
3.1. Damage Concepts
Two main damage concepts will be discussed here; namely characterization width (i.e., the width over which the damage is evaluated in a physical model) and the damage limits (i.e., damage initiation, intermediate damage, and failure).
3.1.1. Characterization Width
This is addressed given that using different characterizations widths in the assessment of coastal structures would lead to different damage results for all damage parameters and would influence the definitions of damage limits. Among others, the authors of [
11] recommend the use of characterization widths larger than 15–20 rock diameters in order to achieve representative results, but do not discuss the influence it has on the measured damage.
Mean Damage Evolution
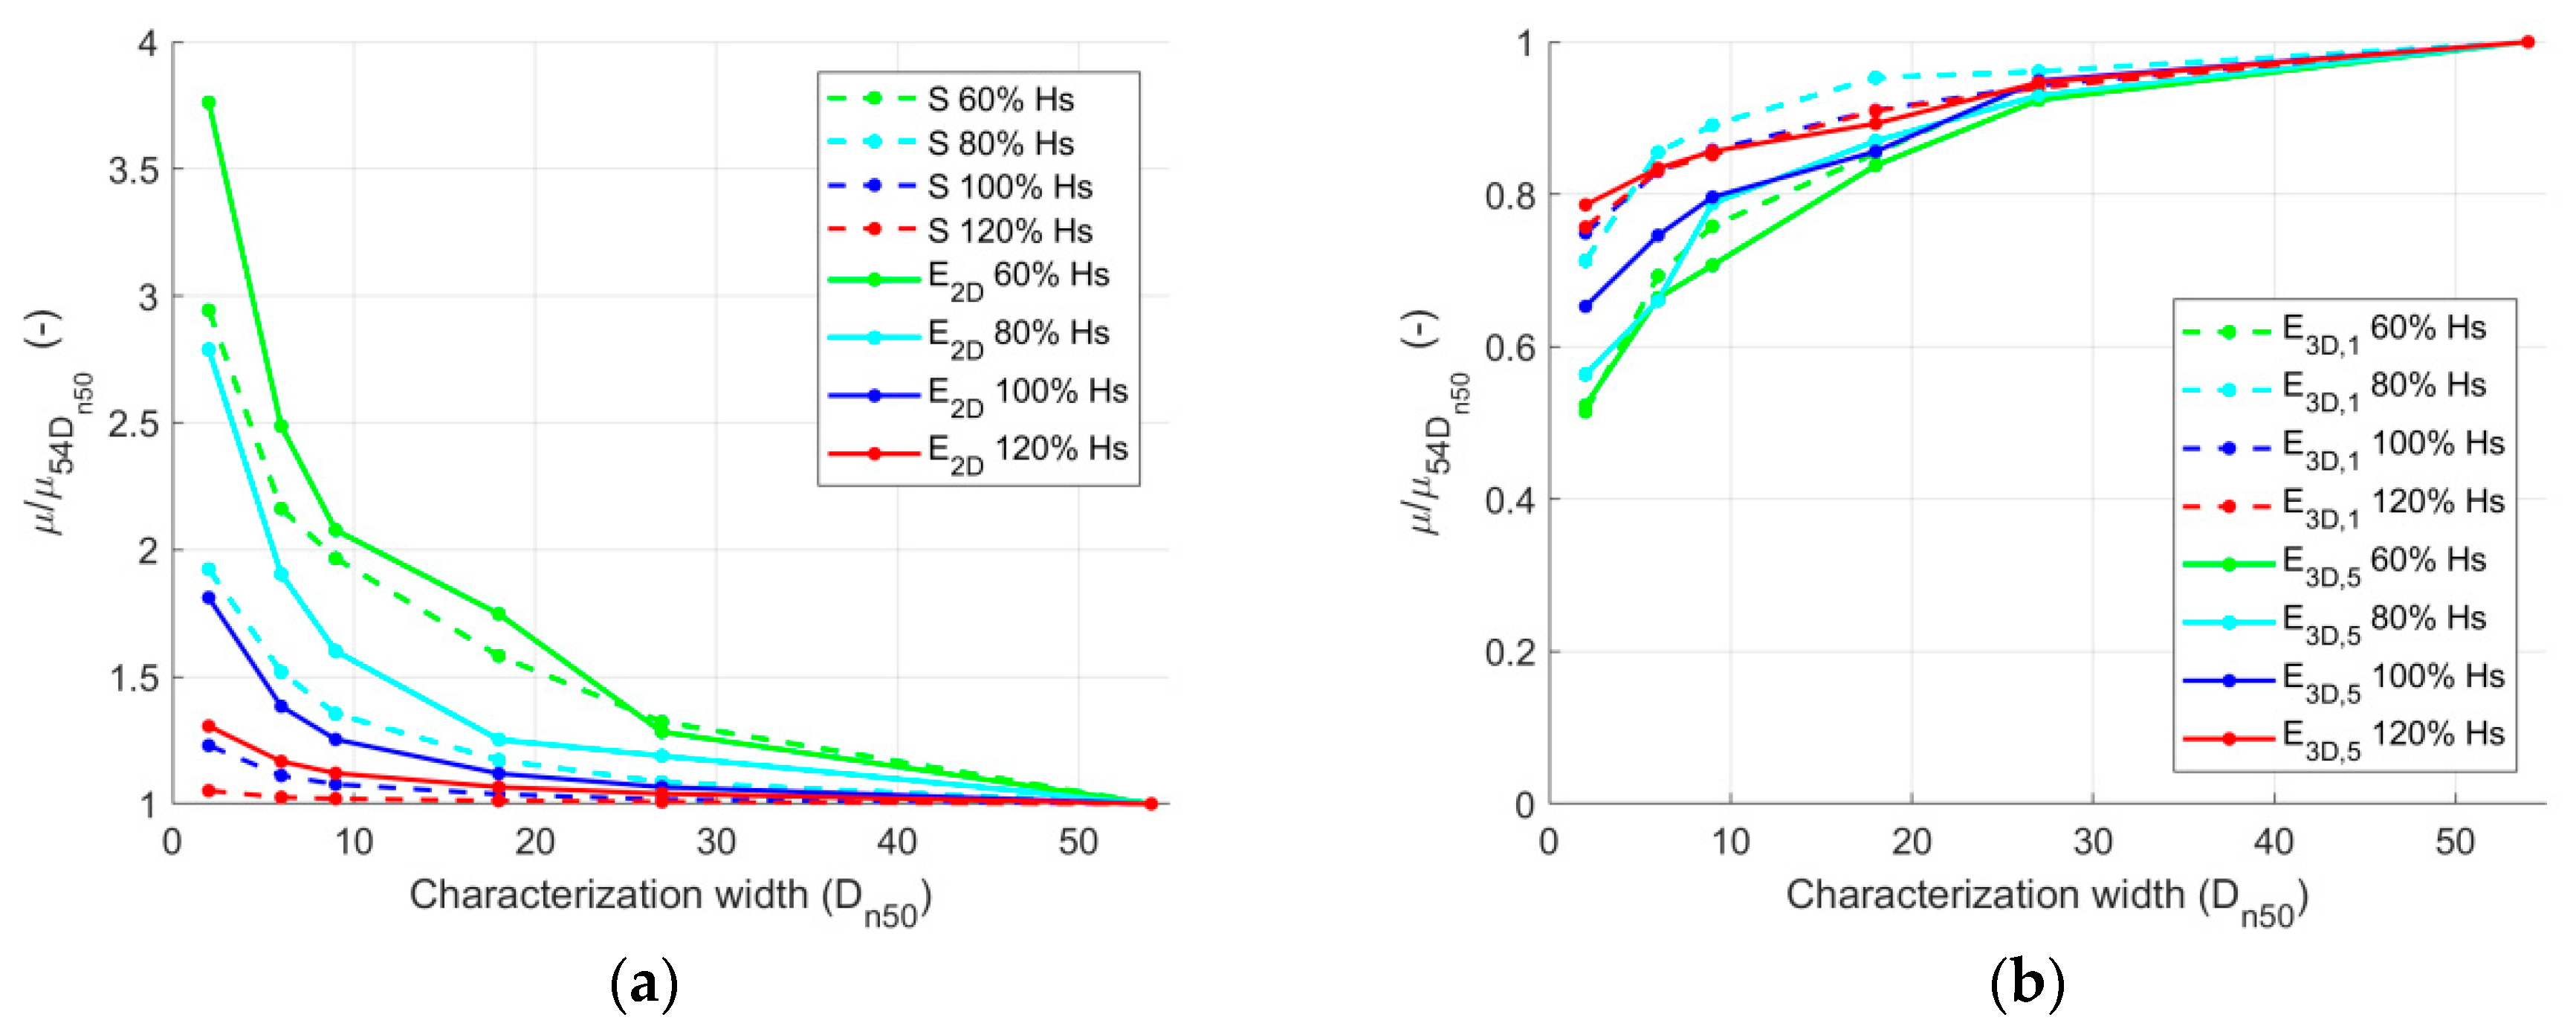
The influence of the characterization width on the mean measured damage can be observed in
Figure 7, obtained from the survey of a 54D
n50 wide slope in the Deltares tests Series 1 (see
Table 1), carried out five times in five identical repetitions. The values for each characterization width are obtained as the average of all the values for that given width, being between 135 values for the 2 D
n50 width and 5 values for the 54 D
n50 width. This average damage is then normalized by the damage obtained for the 54 D
n50 characterization width.
Regarding the parameters obtained from width-averaged profiles (S and E
2D in
Figure 7a), it can be observed that the measured mean damage reduces with increased characterization width because the damage to certain areas is hidden by the accretion in other areas. Regarding the parameters obtained as the maximum erosion depth observed within a given characterization width (E
3D,1 and E
3D,5 in
Figure 7b), it can be observed that the measured damage increases with increased characterization width.
The main observation for the damage parameters E
3D,1 and E
3D,5 (also referred in general form as E
3D,m) is that the measured damage continues to increase with increasing characterization widths. This suggests that there is no upper limit for the damage to the structure and that when considering wider structures, the probability of observing a larger extreme damage will continue to increase. Thus, besides considering the characterization width, this length effect for the design and characterization of coastal structures should then be taken into account (see
Section 3.2.2 and [
9]).
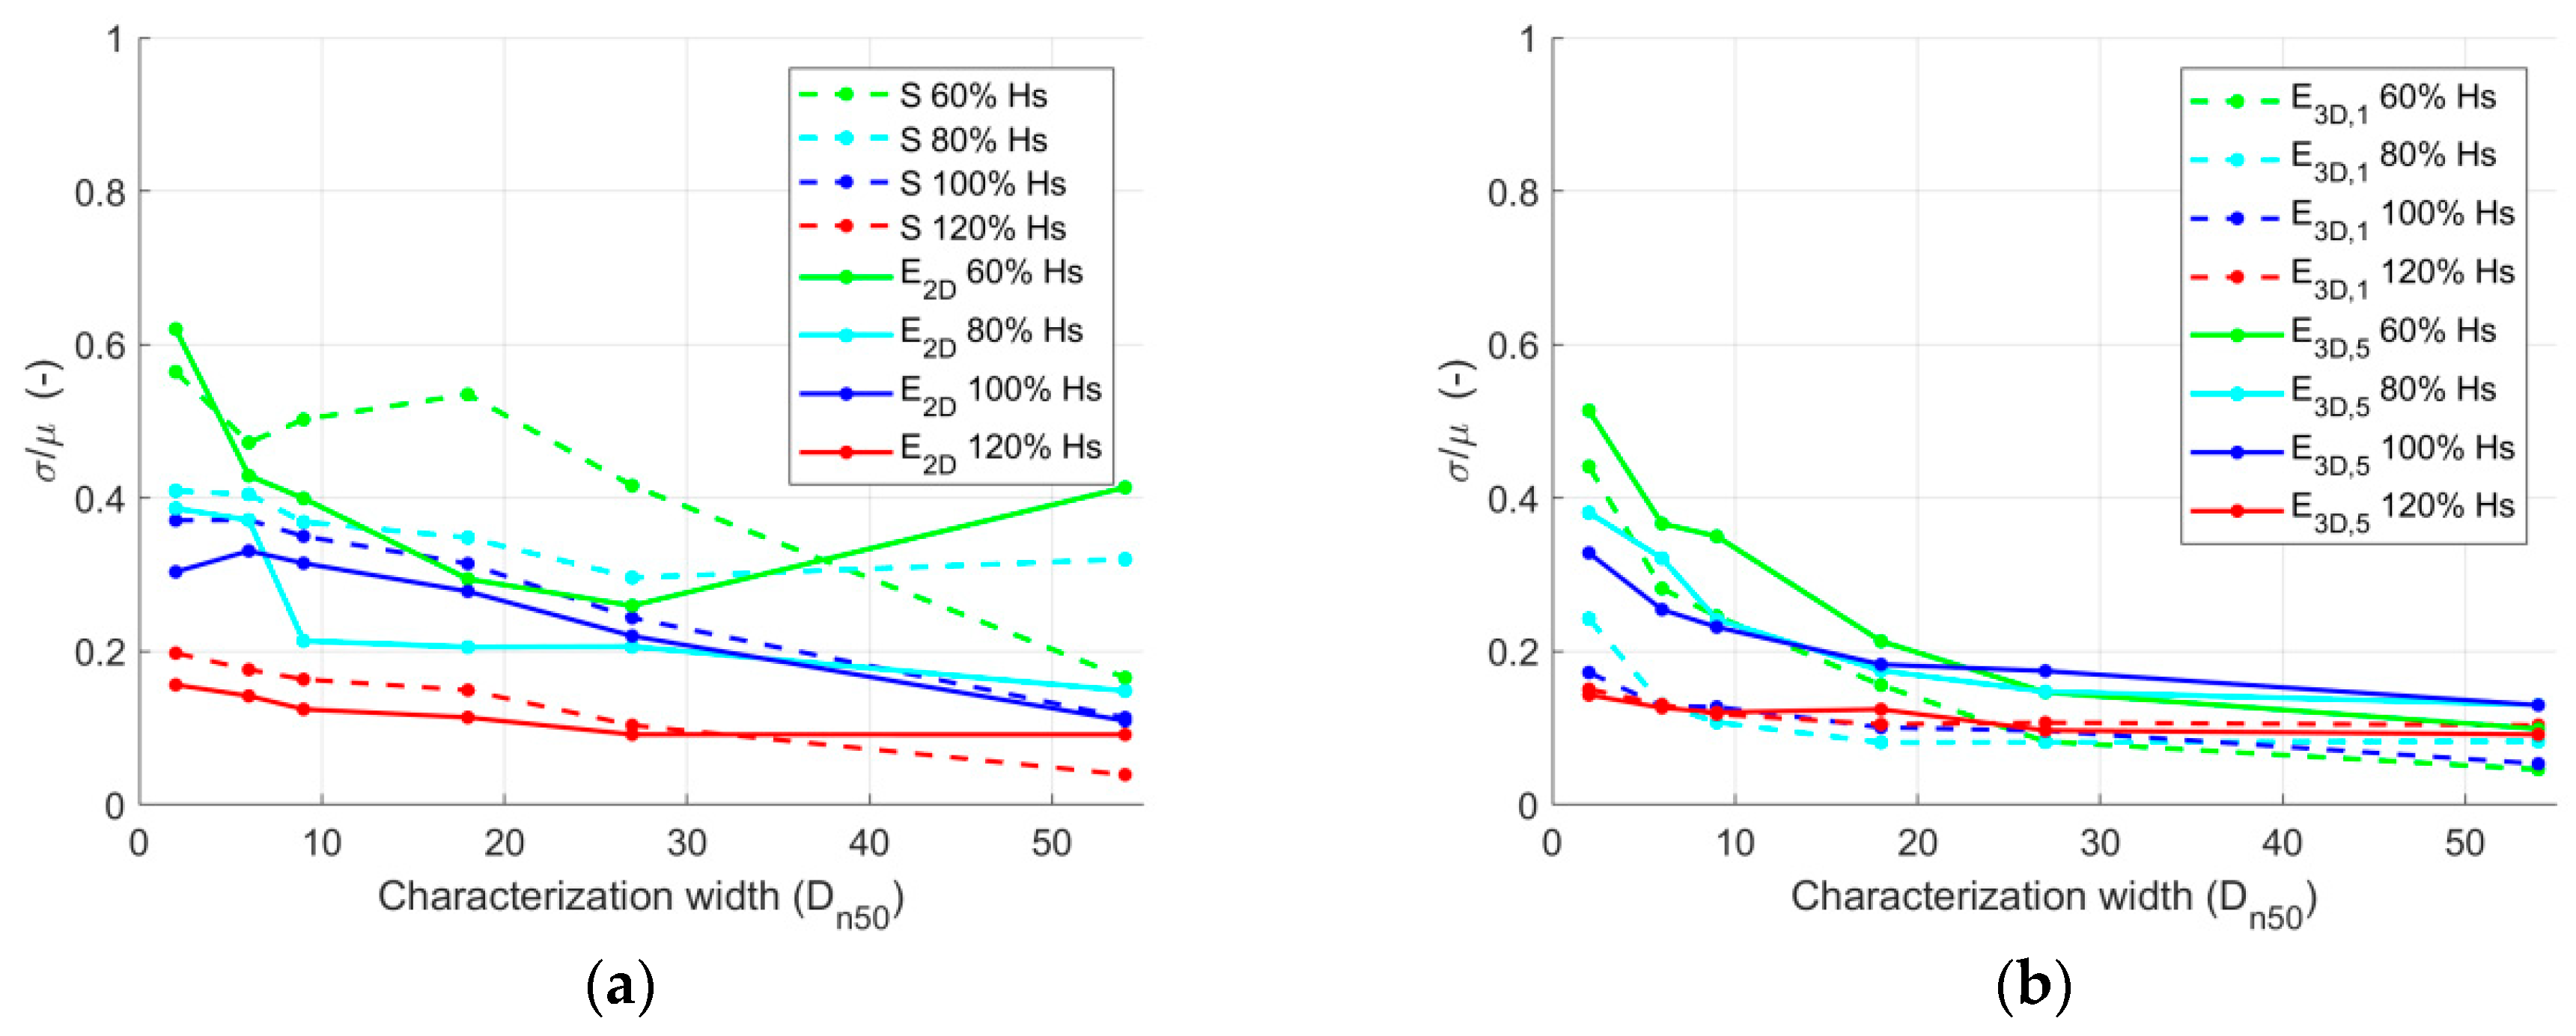
Damage Variability Evolution
The variability of measured damage is evaluated for different characterization widths. The five identical realizations of Deltares tests Series 1 are considered again, which consists of four test runs each (see
Table 1). In
Figure 8, the standard deviation normalized by the mean for the four parameters can be observed.
Regarding the parameters obtained from width-averaged profiles (S and E
2D in
Figure 8a), it can be observed that the increase in the characterization width leads to a general reduction of the variability in the measurements. Regarding the parameters obtained as the maximum erosion depth observed within a given characterization width (E
3D,1 and E
3D,5 in
Figure 8b), they also show a reduction in the variability (mainly because of an increase in the mean values) with increasing characterization width, with significantly less variability than for parameters S and E
2D. For additional details on damage variability, consider the work of [
9].
Conclusions Regarding Characterization Width
Following the previous results, it can be stated that the characterization width is an important factor in the definitions of damage to coastal structures. According to the present results, a characterization width of approximately 25Dn50 is recommended, but the following aspects should be taken into account:
Mean evolution: as shown in
Figure 7, different characterization widths will affect the measured damage (bias). Thus, ideally, a suitable characterization width will be the one that shows a smaller difference in mean measured damage compared with what is obtained when considering different characterization widths.
Variability evolution: as shown in
Figure 8, it should be considered that different characterization widths will present different variability in the results when the same condition is tested several times (random error). Thus, ideally, a suitable characterization width will be the one that shows a smaller variability in the results.
Laboratory conditions: the definition of the most suitable characterization widths should take into account the limited space available for physical modelling tests and the associated costs that limit the experiment dimensions. In addition, the implication of the scaling constraints that limit the possibility of reducing the units’ size in the armor of the structure should be taken into account. Thus, a suitable characterization width will be the one that could fit into general testing facilities without introducing scale effects.
3.1.2. Damage Limits
This study aims to establish unified damage limits for the characterization of coastal structures such as damage initiation, intermediate damage, and failure. On the basis of the contributions and limitations found in literature (see
Section 1.2) and the need for establishing unified concepts for damage characterization, the following damage limits are proposed for a nD
n50 thick rock armored slope:
Damage initiation: defined as the condition in which a circular hole of 1Dn50 diameter and a depth of 1Dn50 is observed in the armor layer.
Intermediate damage: defined as the condition in which a circular hole of 1Dn50 diameter and a depth of 1.5 Dn50 is observed in the armor layer.
Failure limit: defined as the condition in which a circular hole of 1Dn50 diameter and a depth of nDn50 is observed in the armor layer.
In order to characterize a given rock armored slope according to these damage limits, the parameter E3D,1 is used as the calibration method. This E3D,1 parameter can be described as “the erosion depth measured in Dn50 perpendicular to the slope averaged over a circular area of 1Dn50”, which allows capturing the damage limits described above.
Traditional damage assessment methods were based on slope surveys with profilers with a limited number of profiles and the exposure of the filter layer for the failure limit; D
50/2 for Thompson and Shuttler (1975), 1D
n50 for Melby and Kobayashi (1998), and to a less clear extent for other authors (see
Section 1.2). According to such methods, damage initiation and intermediate damage are based on defined parametric limits, while failure is determined by the visual observation of images or using a cylindrical gauge with a hemispherical foot. In contrast, the use of high resolution surveys such as the ones provided by DSP (see
Figure 2) allows a more precise visualization of the state of the structure for all damage levels. In this case, all the damage limits can be quantified according to the depth and extension of the damage area.
Thus, considering all the measurements carried out with a high resolution technique (DSP) and the damage parameter E
3D,1, the damage limits can be calibrated based on the Deltares tests (characterization width of 27D
n50), see
Figure 9 and
Table 2.
An important remark from the previously defined calibrated damage limits is the fact that, according to the available data, they are constant for the slopes applied (1:3 in Deltares tests). Nevertheless, this should be further investigated considering a larger number of tests and different slope configurations in order to validate these conclusions.
3.2. Damage Parameters
This section addresses the need for establishing and validating a robust damage parameter able to accurately characterize the damage and remaining strength of rubble mound structures. This will be done by analyzing the Deltares shallow water test results in more detail and using a characterization width of 27 Dn50 and the previously established damage limits. Only parameters S, E2D, and E3D,5 will be evaluated (E3D,1 calibration parameter will not be considered).
The preference for E3D,5 (E3D,m with m = 5, which describes the erosion depth in Dn50 over an averaged circular area of 5Dn50 diameter) over other values of m is justified given the fact that in the erosion profile from the test results, the damage cavity repeatedly showed a cross-profile extension of approximately 5Dn50.
3.2.1. Damage Parameters Analysis
The analysis of damage parameters is done considering the following four criteria: bias, random error, distinction of damage range, and its values for different structures.
Bias
The first element to be considered, the bias in damage characterization of coastal structures, is related to the ability of the damage parameters to provide the most precise description of the state of the structure. This can be achieved with damage parameters that do not lead to hidden erosion, defined as the conditions in which the damage in one location of the structure is hidden by the accretion in other location when considering width-averaged profiles.
Damage parameters based on width-averaged profiles (S and E2D) are associated with a larger bias because a larger characterization width will lead to an averaged profile, which reduces (averages out) the magnitude of the maximum erosion areas, especially for smaller damage levels (damage initiation). On the contrary, damage parameters that capture the maximum erosion depth observed within a given characterization width (E3D,5) have limited bias because they provide an assessment of the complete structure surface and identify all damaged areas.
Random Error
This second aspect, the random error in the measured damage to coastal structures, is related to the ability of damage parameters to describe the state of the structure with the smallest variability and larger confidence in the measured result. This will be analyzed further in order to estimate the random error associated with each of the damage parameters.
The damage data for Series 1 (composed of four test runs of 60%, 80%, 100%, and 120%) and Series 2 (composed of one test run of 100%) is described in the table below. For each test run, 10 observations are considered, obtained from five realizations in a model with a width of 54D
n50 (twice the considered characterization width of 27 D
n50). For these 10 observations and the 3 damage parameters,
Table 3 and
Figure 10 show the 80% confidence prediction interval, applying a Student’s
t-distribution with a critical t-value of 1.383 (
) expressed as a percentage of the mean.
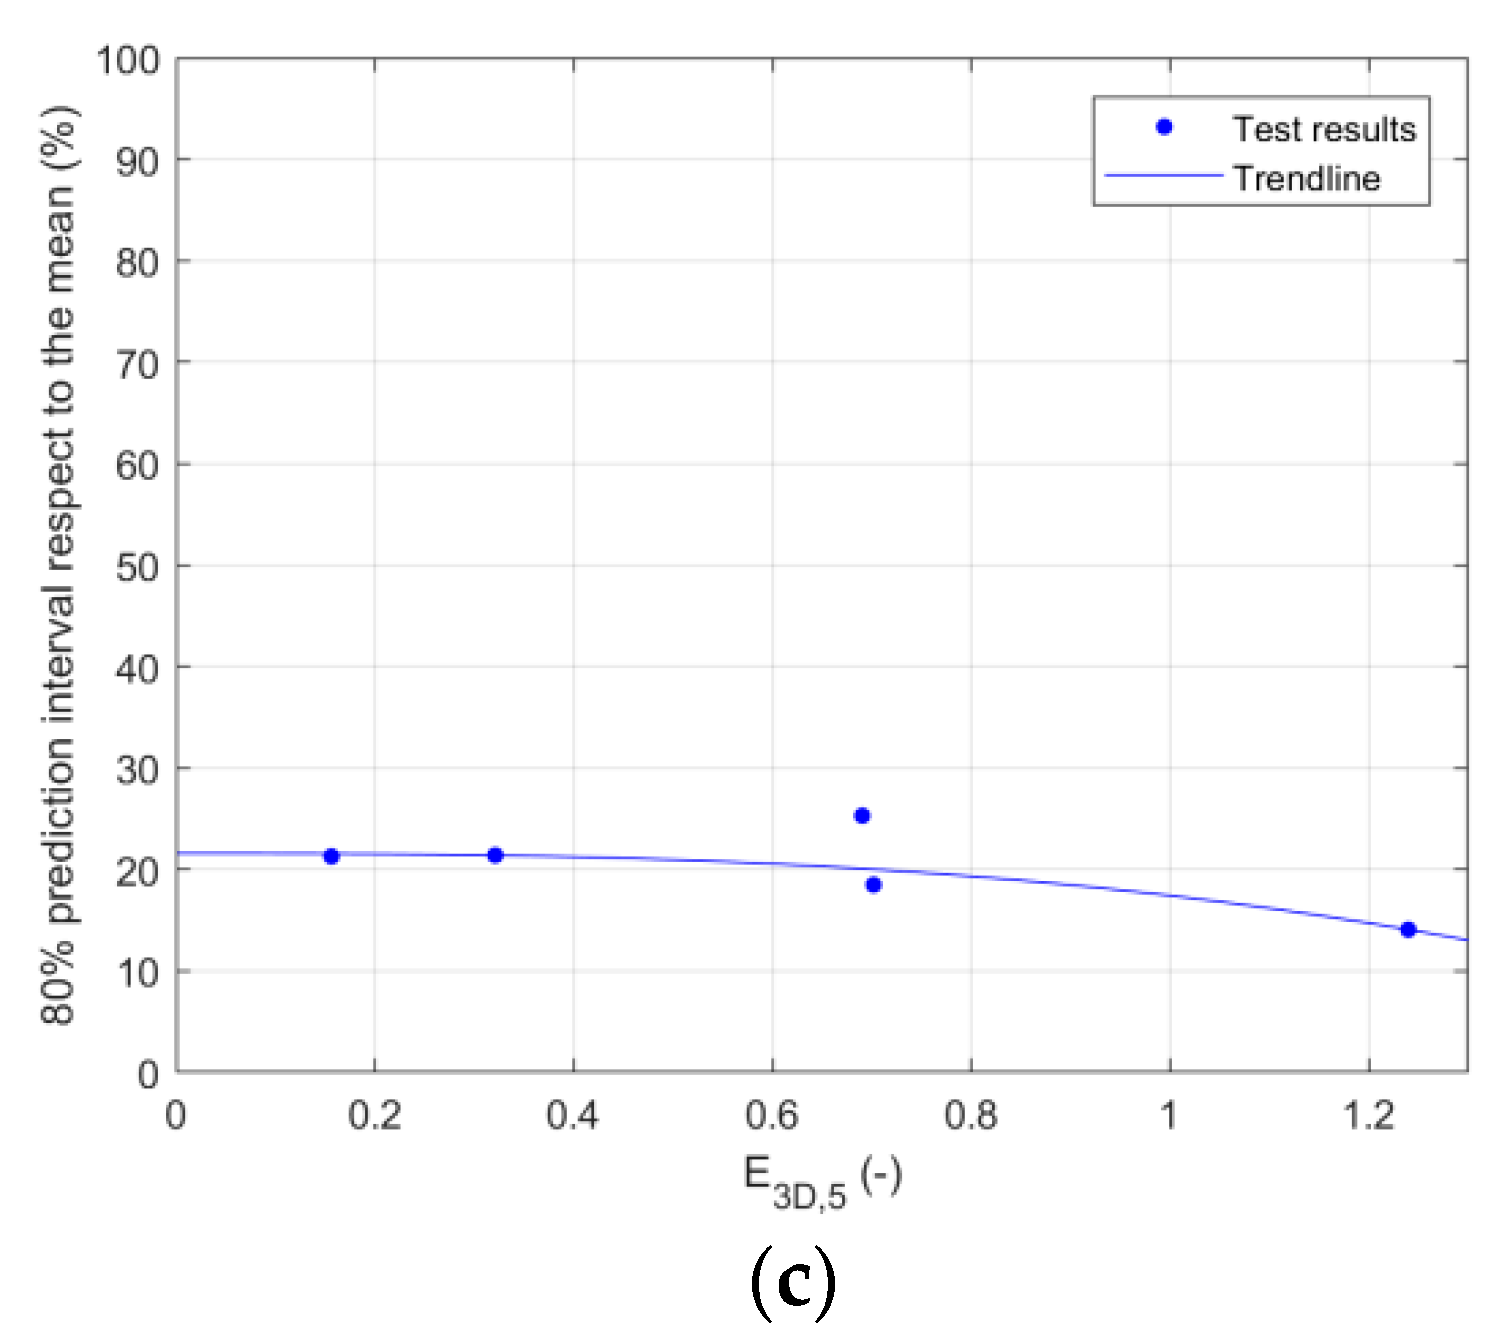
According to these results, it can be observed that damage parameters E3D,5 present a lower variability (random error), especially for the lower conditions associated with a lower amount of damage (60% and 80%). Damage parameters S and E2D present low variability in higher damage levels (120% in Series 1 run 4), but much higher variability (random error) in the other damage levels.
Distinction of Damage Range
The third element to be considered is the ability of damage parameters to distinguish the range of damage levels between initial damage, intermediate damage, and failure. According to the experimental data from the tests, the S, E
2D, and E
3D,5 parameters were able to distinguish the different damage levels with a similar degree of scatter (for parameter E
3D,1, a larger scatter was observed). For additional details, consider the work of [
12].
Values for Different Structures
The fourth aspect to be considered in this analysis is the suitability of damage parameters to be used in different structures. In this case, different structures do not only include variations in the characteristics of the rock slope, but also 3D features such as roundheads or slopes with a berm. Of the three parameters considered here, only the parameter that captures the maximum erosion depth observed within a given characterization width (E3D,5) is suitable for describing damage to coastal structures with any geometry or 3D feature.
Conclusions on Damage Parameters Analysis
According to the four criteria previously discussed, the damage parameter E3D,5 is considered as the most suitable damage parameter for the characterization of damage to coastal structures based on the following four reasons:
Low bias: the damage to the structure is clearly captured, without including hidden erosion present in the parameters that consider width-averaged profiles.
Low random error: this parameter describes the damage to the structure with low variability also for a relatively low amount of damage, which increases the confidence in the measured and expected damage.
Distinguish damage range: the different states of damage to the structure can be recognized according to the limits established.
Constant value for different structures: for all structure configurations, this parameter can be used without the need for any modification.
3.2.2. Extreme Damage Distribution for E3D,5
According to the results from this study, the measured damage with parameter E
3D,5 can be adjusted to an extreme value distribution. This illustrates that for increasingly long structures, a larger damage is expected, in the same way that for an increasingly long time period, a larger wave height is expected, or that for increasingly long dikes, a larger probability exists that one section can fail [
13].
In order to define an extreme value distribution for the measured damage with E
3D,5, the results shown in
Table 4 are considered. Each test condition (four for Series 1 and one for Series 2) had five realizations each with a width of 54D
n50, which leads to 10 damage results for a characterization width 27D
n50. For each test condition, the measured damage was normalized by the mean value, so all 50 measurements are combined in one single distribution. These values are adjusted to a Gumbel distribution, with the distribution parameters determined by the least square method.
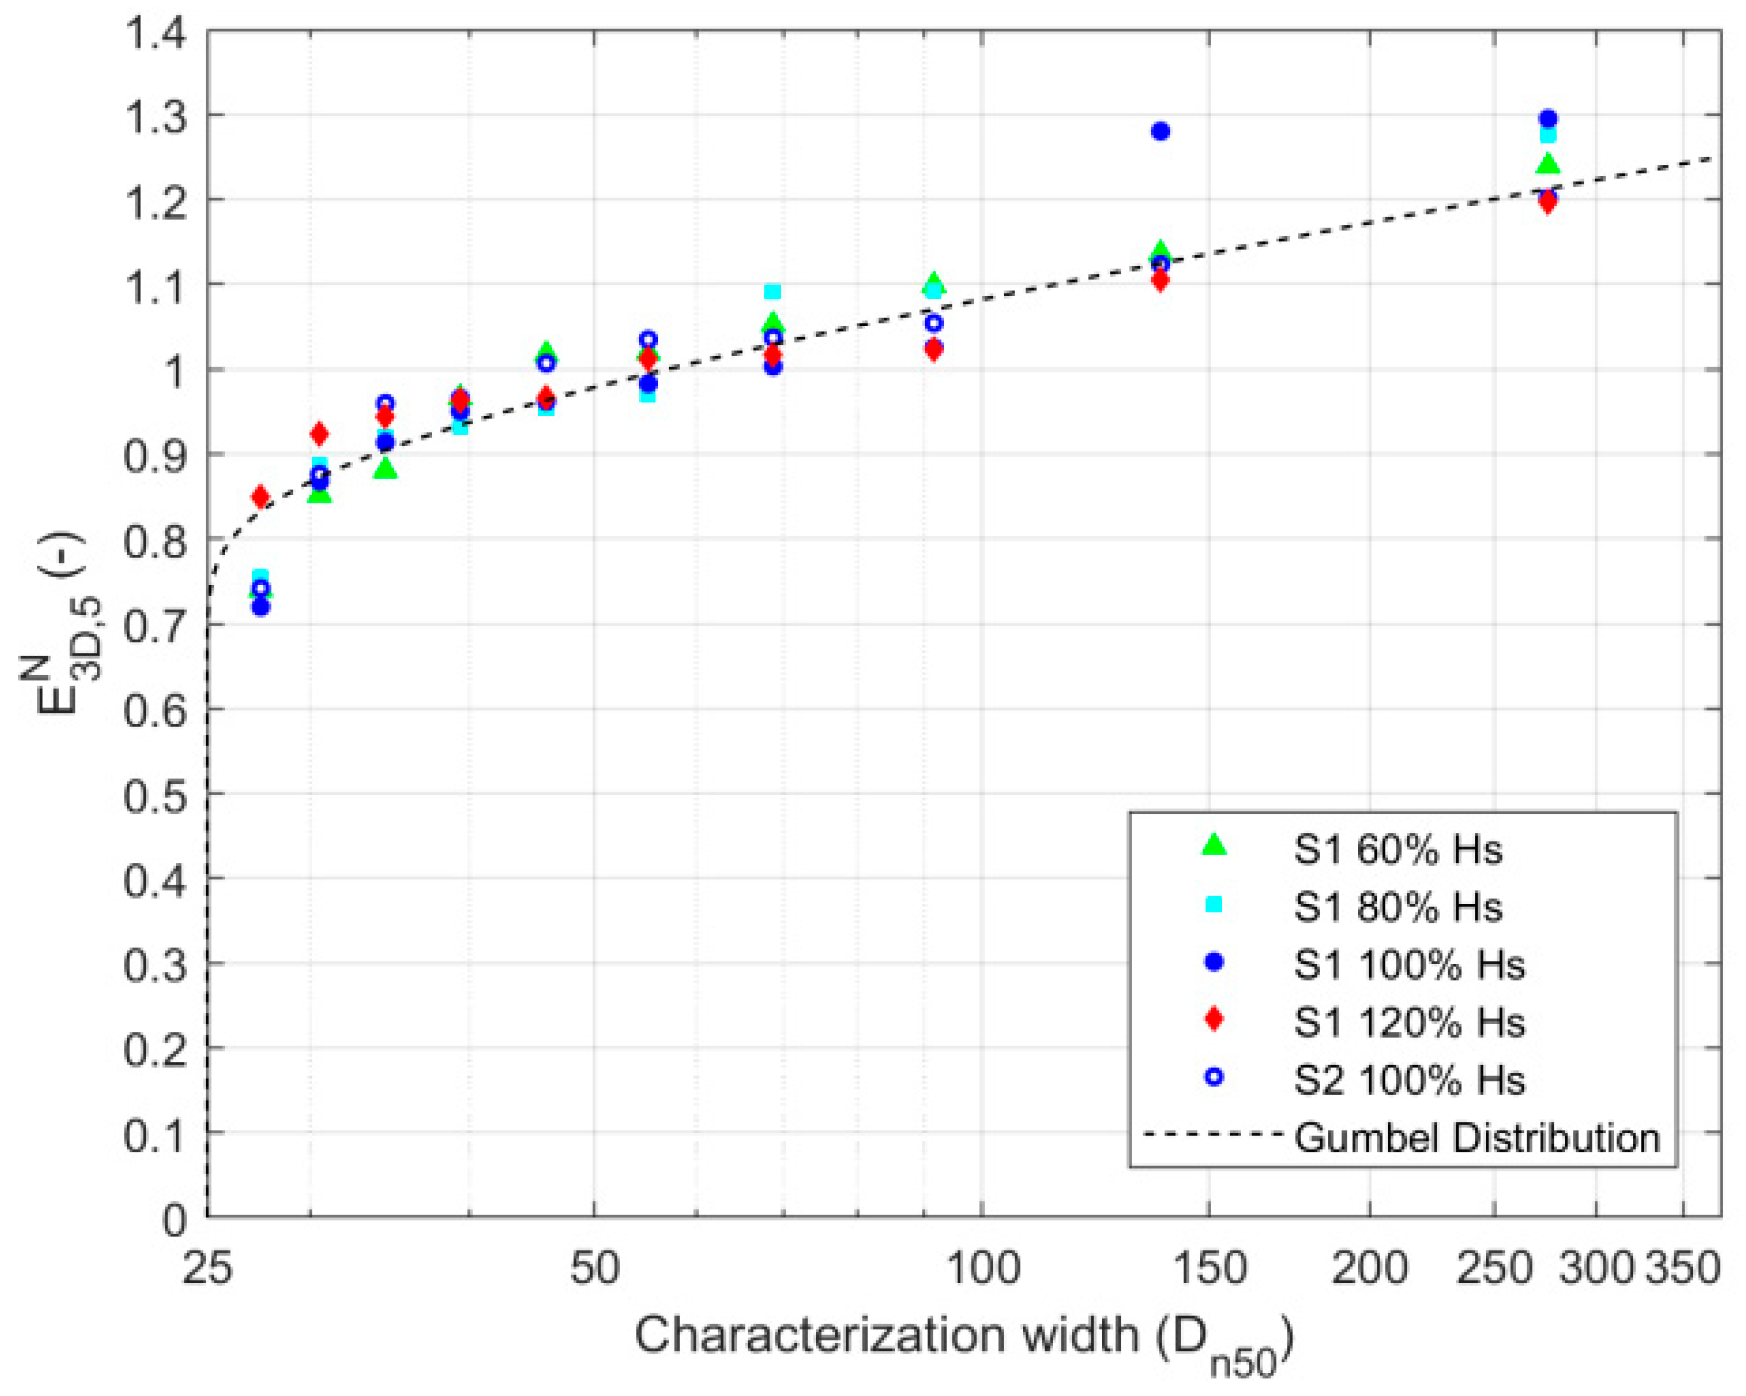
The exceedance probability for the damage is translated to a return width in a similar form to that used for the study of extreme wave climate (see Equation (4)). The combined extreme distribution for the normalized damage parameter E
N3D,5 is shown in
Figure 11.
where
(m) is the return width,
(m) is the characterization width (27D
n50 in this study), and
(-) is the exceedance probability.
Figure 11 shows that a single realization of a test run for a characterization width of 27D
n50 is expected to present damage of approximately 0.8 as the mean damage (calculated from 10 realizations), while for a structure 10 times wider (approximately 270D
n50 wide), damage of 1.2 as the mean damage is expected. Thus, according to this study, the damage to a structure 270D
n50 wide is expected to present damage up to 50% (1.2/0.8 = 1.5) larger than that obtained in a single realization in a 27D
n50 characterization width. Detailed guides on how to account for the length effect on rock armored structures are presented in the work of [
9].
3.3. Measuring Technique
Significant differences can be observed in the damage characterization outcome when using high resolution and high accuracy measurements techniques compared with low resolution measurements used in traditional surveys. In contrast to low resolution techniques, high resolution techniques (e.g., DSP) are able to measure the state of the whole structure surface and capture all the erosion areas.
These high resolution measuring techniques, such as DSP, present a number of advantages for the damage characterization of coastal structures. First, they allow the introduction of more precise damage parameters, such as E3D,5, and allow the improvement in the damage limits and definitions. Thus, these high definition measuring techniques, together with suitable parameters and definitions, can describe the state of the full structure surface in order to identify the presence of weak areas, which threatens the stability of the structure. Second, for parameters obtained from width-averaged profiles such as S and E2D, high resolution surveys that capture the state of the whole structure surface are able to reduce the variability and uncertainty in the damage characterization results, especially for situations with a relatively low amount of damage.
In summary, high resolution measurement techniques, in combination with the use of other damage parameters, are able to reduce the bias related to hidden erosion and random errors related to the position of the measured profiles, which are present in the damage characterization methods carried out with low resolution techniques. Thus, it can be concluded that innovative measuring techniques such as DSP are able to significantly improve the damage characterization of coastal structures.
4. Conclusions
Damage characterization for rock armored slopes was addressed in this paper, with a focus on three key elements: damage concepts, damage parameters, and measuring techniques. It is highlighted that these three elements should be taken into account for a reliable damage assessment. For this research, a physical modelling campaign was carried out within the EU Hydralab+ framework. The Deltares shallow water tests were performed in a wave flume with a foreshore (depth-limited waves), a 1:3 slope, and an impermeable core.
On damage concepts, the characterization width was discussed, because this influences the measured damage and the associated assessment description. The main effect is that for parameters obtained from width-averaged profiles (S and E2D), the measured damage reduces with increased characterization width, because the damage to certain areas will be hidden by the accretion in other areas, while for parameters obtained as the maximum erosion depth observed within a given characterization width (E3D,1 and E3D,5), the measured damage increases with increased characterization width. Considering this and also the damage variability, it is recommended to carry out laboratory experiments with a characterization width of around 25Dn50.
The calibrated damage limits and damage parameters for rock armored slopes with a characterization width of about 25Dn50 and an armor thickness of 2Dn50 are as follows:
Damage initiation: defined as the condition in which a circular hole of 1Dn50 diameter and a depth of 1Dn50 is observed in the armor layer: E3D,1 = 1; E3D,5 = 0.3; E2D = 0.2; S = 1.
Intermediate damage: defined as the condition in which a circular hole of 1Dn50 diameter and a depth of 1.5Dn50 is observed in the armor layer: E3D,1 = 1.5; E3D,5 = 0.7; E2D = 0.5; S = 4.
Failure limit: defined as the condition in which a circular hole of 1Dn50 diameter and a depth of nDn50 is observed in the armor layer: E3D,1 = 2.0; E3D,5 = 1.1; E2D = 0.9; S = 11.
Regarding damage characterization parameters, different parameters were considered. It was found that E3D,5 is the parameter that can better describe the damage and remaining strength of conventional and non-conventional structures. The key reasons for defining this parameter as the most suitable damage characterization parameter are the following:
Low bias: the damage to the structure is clearly captured, without including hidden erosion present in the parameters that consider width-averaged profiles.
Low random error: this parameter describes the damage to the structure with low variability also for a relatively low amount of damage, which increases the confidence in the measured and expected damage.
Distinguish damage range: the different states of damage to the structure can be recognized according to the limits established.
Constant value for different structures: for all structure configurations, this parameter can be used without the need for any modification.
In addition, the results from this study show that the damage measured with the damage parameter E3D,5 presents an extreme value distribution. This illustrates that for increasingly long structures, a larger damage is expected.
Regarding damage characterization measuring techniques, the importance of high resolution measuring techniques for delivering accurate damage characterization of coastal structures was demonstrated. These techniques (such as DSP) allow the use of the most precise damage parameter, that is, E3D,5.
Author Contributions
Conceptualization, Methodology, Validation and Investigation: E.d.A., M.R.A.v.G. and B.H.; Formal Analysis, Data Curation, Writing-Original Draft Preparation and Visualization: E.d.A.; Resources, Supervision and Funding Acquisition: M.R.A.v.G. and B.H.; Writing-Review & Editing: E.d.A., M.R.A.v.G. and B.H.
Funding
This project received co-funding from the European Union’s Horizon 2020 research and innovation programme under grant agreement No 654110, HYDRALAB+.
Acknowledgments
We would like to thank our colleagues from Deltares and Hydralab+ for their contribution to the present work. Most of the research described here has first been presented and published [
14] at the Coastlab 2018 conference (22–26 May 2018, Santander, Spain); the conference is acknowledged for providing the platform to present the described research.
Conflicts of Interest
The authors declare no conflict of interest.
References
- Van der Meer, J.W. Rock Slopes and Gravel Beaches under Wave Attack. Ph.D. Thesis, Delft University of Technology, Delft, The Netherlands, 1988. [Google Scholar]
- Hudson, R.Y. Laboratory investigation of rubble-mound breakwaters. J. Waterw. Harb. Div. 1959, 85, 93–121. [Google Scholar]
- Thompson, D.M.; Shuttler, R.M. Riprap Design for Wind-Wave Attack, a Laboratory Study in Random Waves; Report EX707; Hydraulic Research Station: Wallingford, Oxford, UK, 1975. [Google Scholar]
- Broderick, L.L. Riprap Stability versus Monochromatic and Irregular Waves. Ph.D. Thesis, Oregon State University, Corvallis, OR, USA, 1984. [Google Scholar]
- Melby, J.A.; Kobayashi, N. Progression and variability of damage on rubble mound breakwaters. J. Waterw. Port Coast. Ocean Eng. 1998, 124, 286–294. [Google Scholar] [CrossRef]
- Hofland, B.; Van Gent, M.R.A.; Raaijmakers, T.; Liefhebber, T. Damage evolution using the damage depth. In Proceedings of the Coastal Structures 2011, Yokohama, Japan, 5–9 September 2011. [Google Scholar]
- Hofland, B.; Disco, M.; Van Gent, M.R.A. Damage characterization of rubble mound roundheads. In Proceedings of the Coastlab 2014, Varna, Bulgaria, 29 September–2 October 2014. [Google Scholar]
- Van Gent, M.R.A.; De Almeida, E.; Hofland, B. Statistical analysis of the stability of rock armoured slopes. In Proceedings of the Coastlab 2018, Santander, Spain, 22–26 May 2018. [Google Scholar]
- Van Gent, M.R.A.; De Almeida, E.; Hofland, B. Statistical analysis of the stability of rock armoured slopes. J. Mar. Sci. Eng. 2019. submitted. [Google Scholar]
- Raaijmakers, T.; Liefhebber, T.; Hofland, B.; Meys, P. Mapping of 3D-bathymetries and structures using stereo photography through air-water interface. In Proceedings of the Coastlab 2012, Ghent, Belgium, 17–20 September 2012. [Google Scholar]
- Frostick, L.E.; McLelland, S.J.; Mercer, T.G. User Guide to Physical Modelling and Experimentation: Experience of the Hydralab Network; CRC Press/Balkena: Leiden, The Netherlands, 2011. [Google Scholar]
- De Almeida, E. Damage Assessment of Coastal Structures in Climate Change Adaptation. Master’s Thesis, Delft University of Technology, Delft, The Netherlands, 2017. [Google Scholar]
- VNK. The National Flood Risk Analysis for The Netherlands, Final Report; Rijkswaterstaat VNK Project Office: Utrecht, The Netherlands, 2014. [Google Scholar]
- De Almeida, E.; Van Gent, M.R.A.; Hofland, B. Damage characterisation of rock armoured slopes. In Proceedings of the Coastlab 2018, Santander, Spain, 22–26 May 2018. [Google Scholar]
Figure 1.
Scheldt Flume, Deltares.
Figure 1.
Scheldt Flume, Deltares.
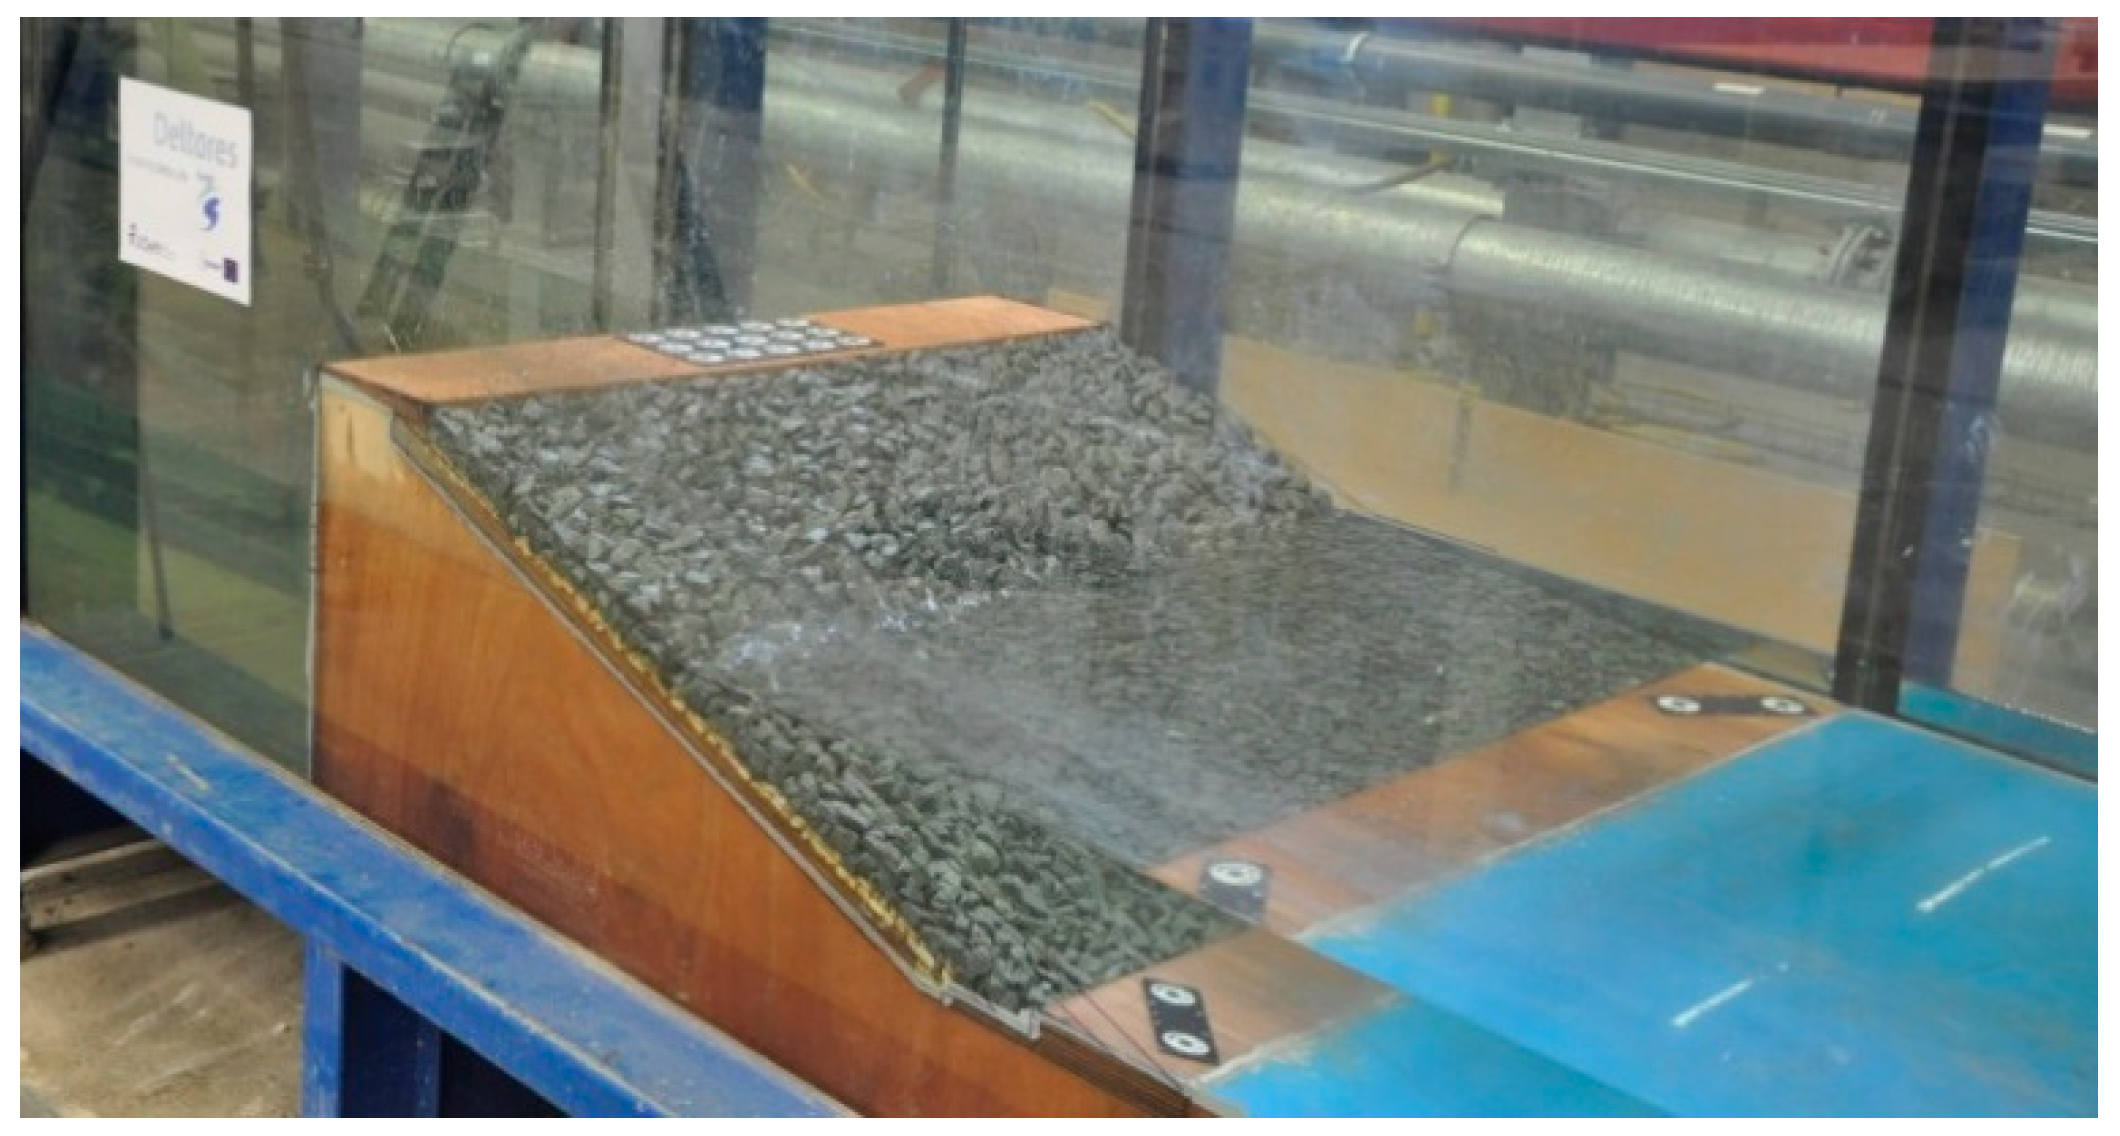
Figure 2.
Deltares shallow water tests set-up.
Figure 2.
Deltares shallow water tests set-up.
Figure 3.
Deltares tests cross-section.
Figure 3.
Deltares tests cross-section.
Figure 4.
Digital stereo photography (DSP) equipment.
Figure 4.
Digital stereo photography (DSP) equipment.
Figure 5.
Digital stereo photography (DSP) workflow. (a) Pairs or images from the surveyed slope, before and after a test, (b) 3D slope survey before and after a test (white color being the lower part of the slope, and blue color being the higher part of the slope), (c) erosion and accretion measurement following a given test (red-orange areas being erosion areas, and blue-green areas being accretion areas).
Figure 6.
Damage parameters methodology. (a) S and E2D parameters obtained from a width-averaged profile, (b) E3D,m parameters obtained from the maximum erosion depth observed within a given characterization width.
Figure 6.
Damage parameters methodology. (a) S and E2D parameters obtained from a width-averaged profile, (b) E3D,m parameters obtained from the maximum erosion depth observed within a given characterization width.
Figure 7.
Characterization width. Mean damage variation (bias), calculated as the mean damage from each characterization width (μ) divided by the mean damage from the 54Dn50 characterization width (μ54Dn50). (a) S and E2D parameters, (b) E3D,1 and E3D,5 parameters.
Figure 7.
Characterization width. Mean damage variation (bias), calculated as the mean damage from each characterization width (μ) divided by the mean damage from the 54Dn50 characterization width (μ54Dn50). (a) S and E2D parameters, (b) E3D,1 and E3D,5 parameters.
Figure 8.
Characterization width. Standard deviation of the damage (σ) divided by the mean of the damage (μ), for each characterization width (random error). (a) S and E2D parameters, (b) E3D,1 and E3D,5 parameters.
Figure 8.
Characterization width. Standard deviation of the damage (σ) divided by the mean of the damage (μ), for each characterization width (random error). (a) S and E2D parameters, (b) E3D,1 and E3D,5 parameters.
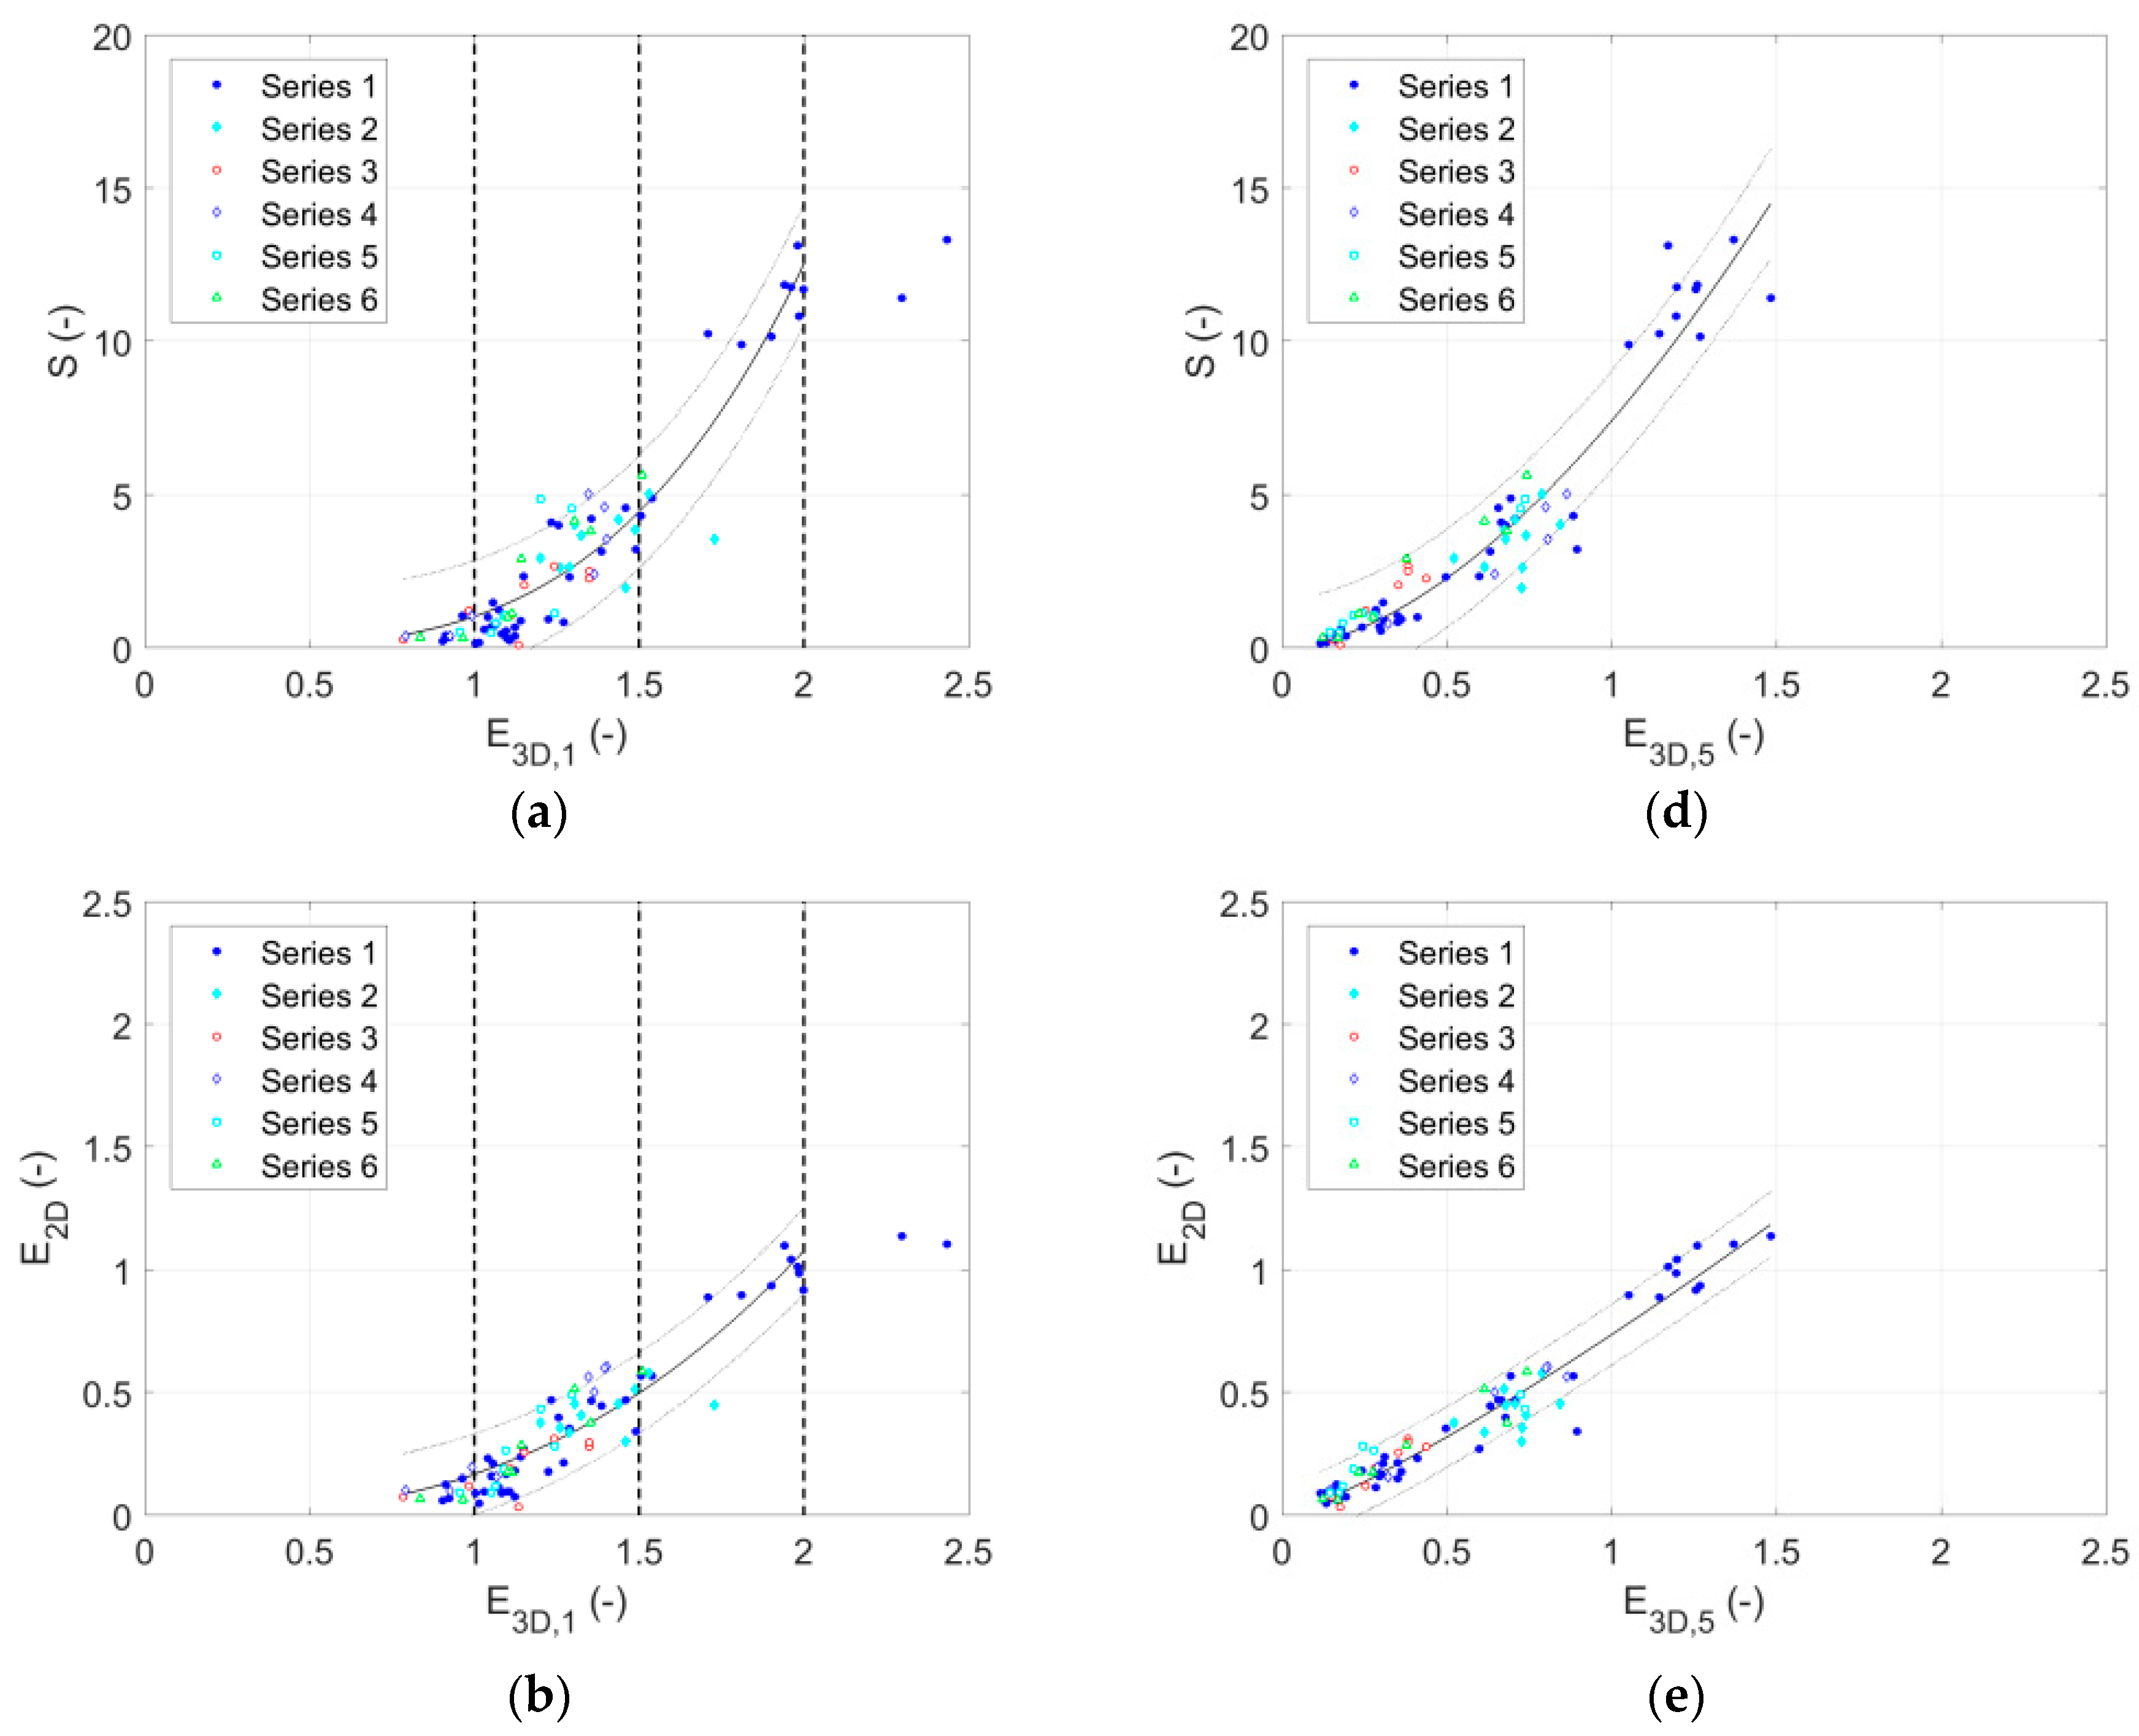
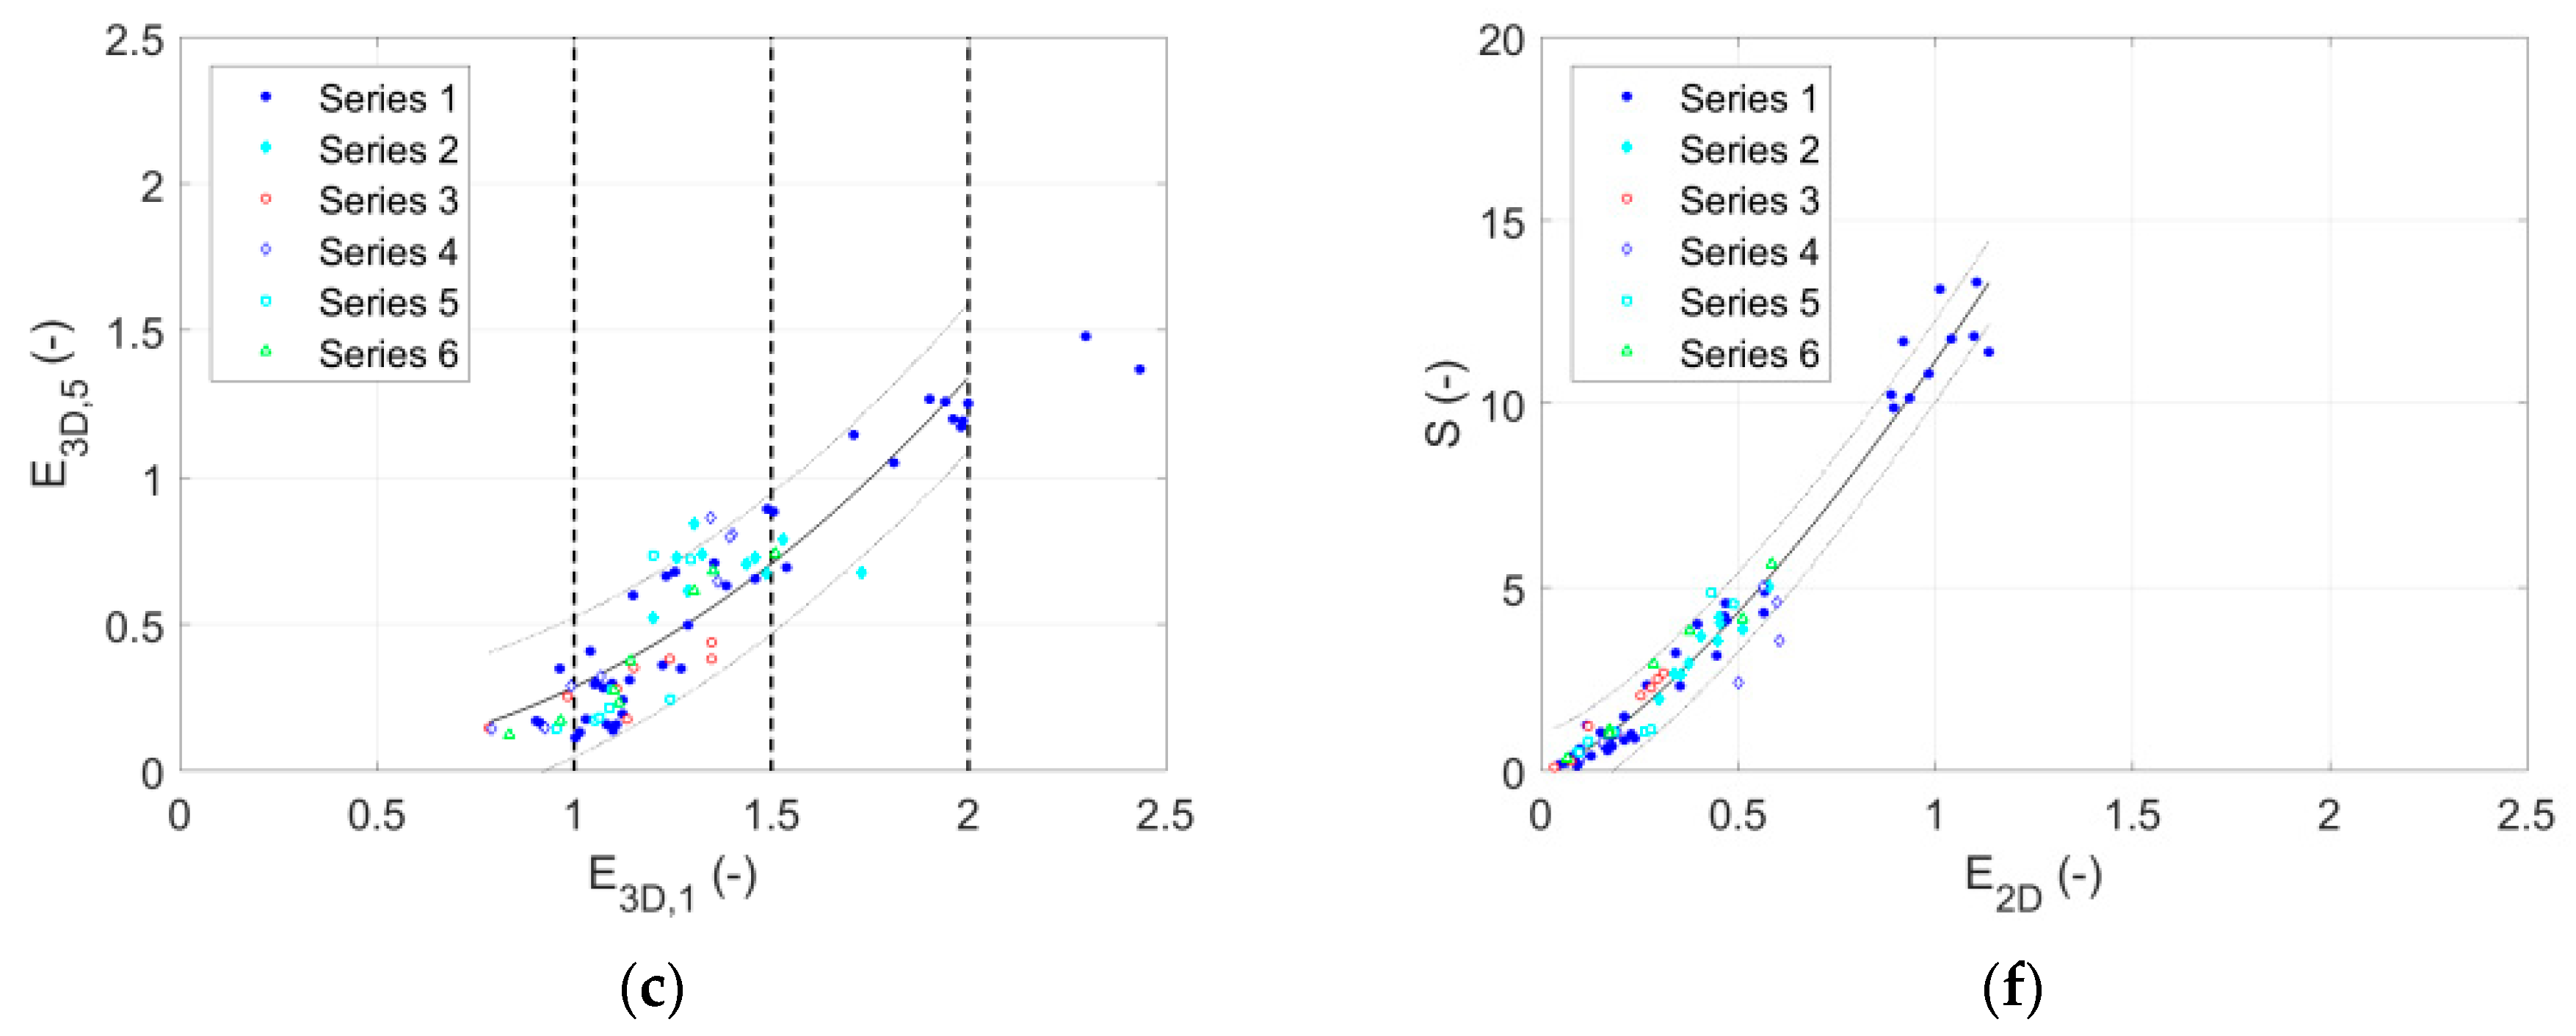
Figure 9.
Comparison of all damage parameters (for 27Dn50 characterization width). (a) E3D,1 vs. S parameters, (b) E3D,1 vs. E2D parameters, (c) E3D,1 vs. E3D,5 parameters, (d) E3D,5 vs. S parameters, (e) E3D,5 vs. E2D parameters, (f) E2D vs. S parameters.
Figure 9.
Comparison of all damage parameters (for 27Dn50 characterization width). (a) E3D,1 vs. S parameters, (b) E3D,1 vs. E2D parameters, (c) E3D,1 vs. E3D,5 parameters, (d) E3D,5 vs. S parameters, (e) E3D,5 vs. E2D parameters, (f) E2D vs. S parameters.
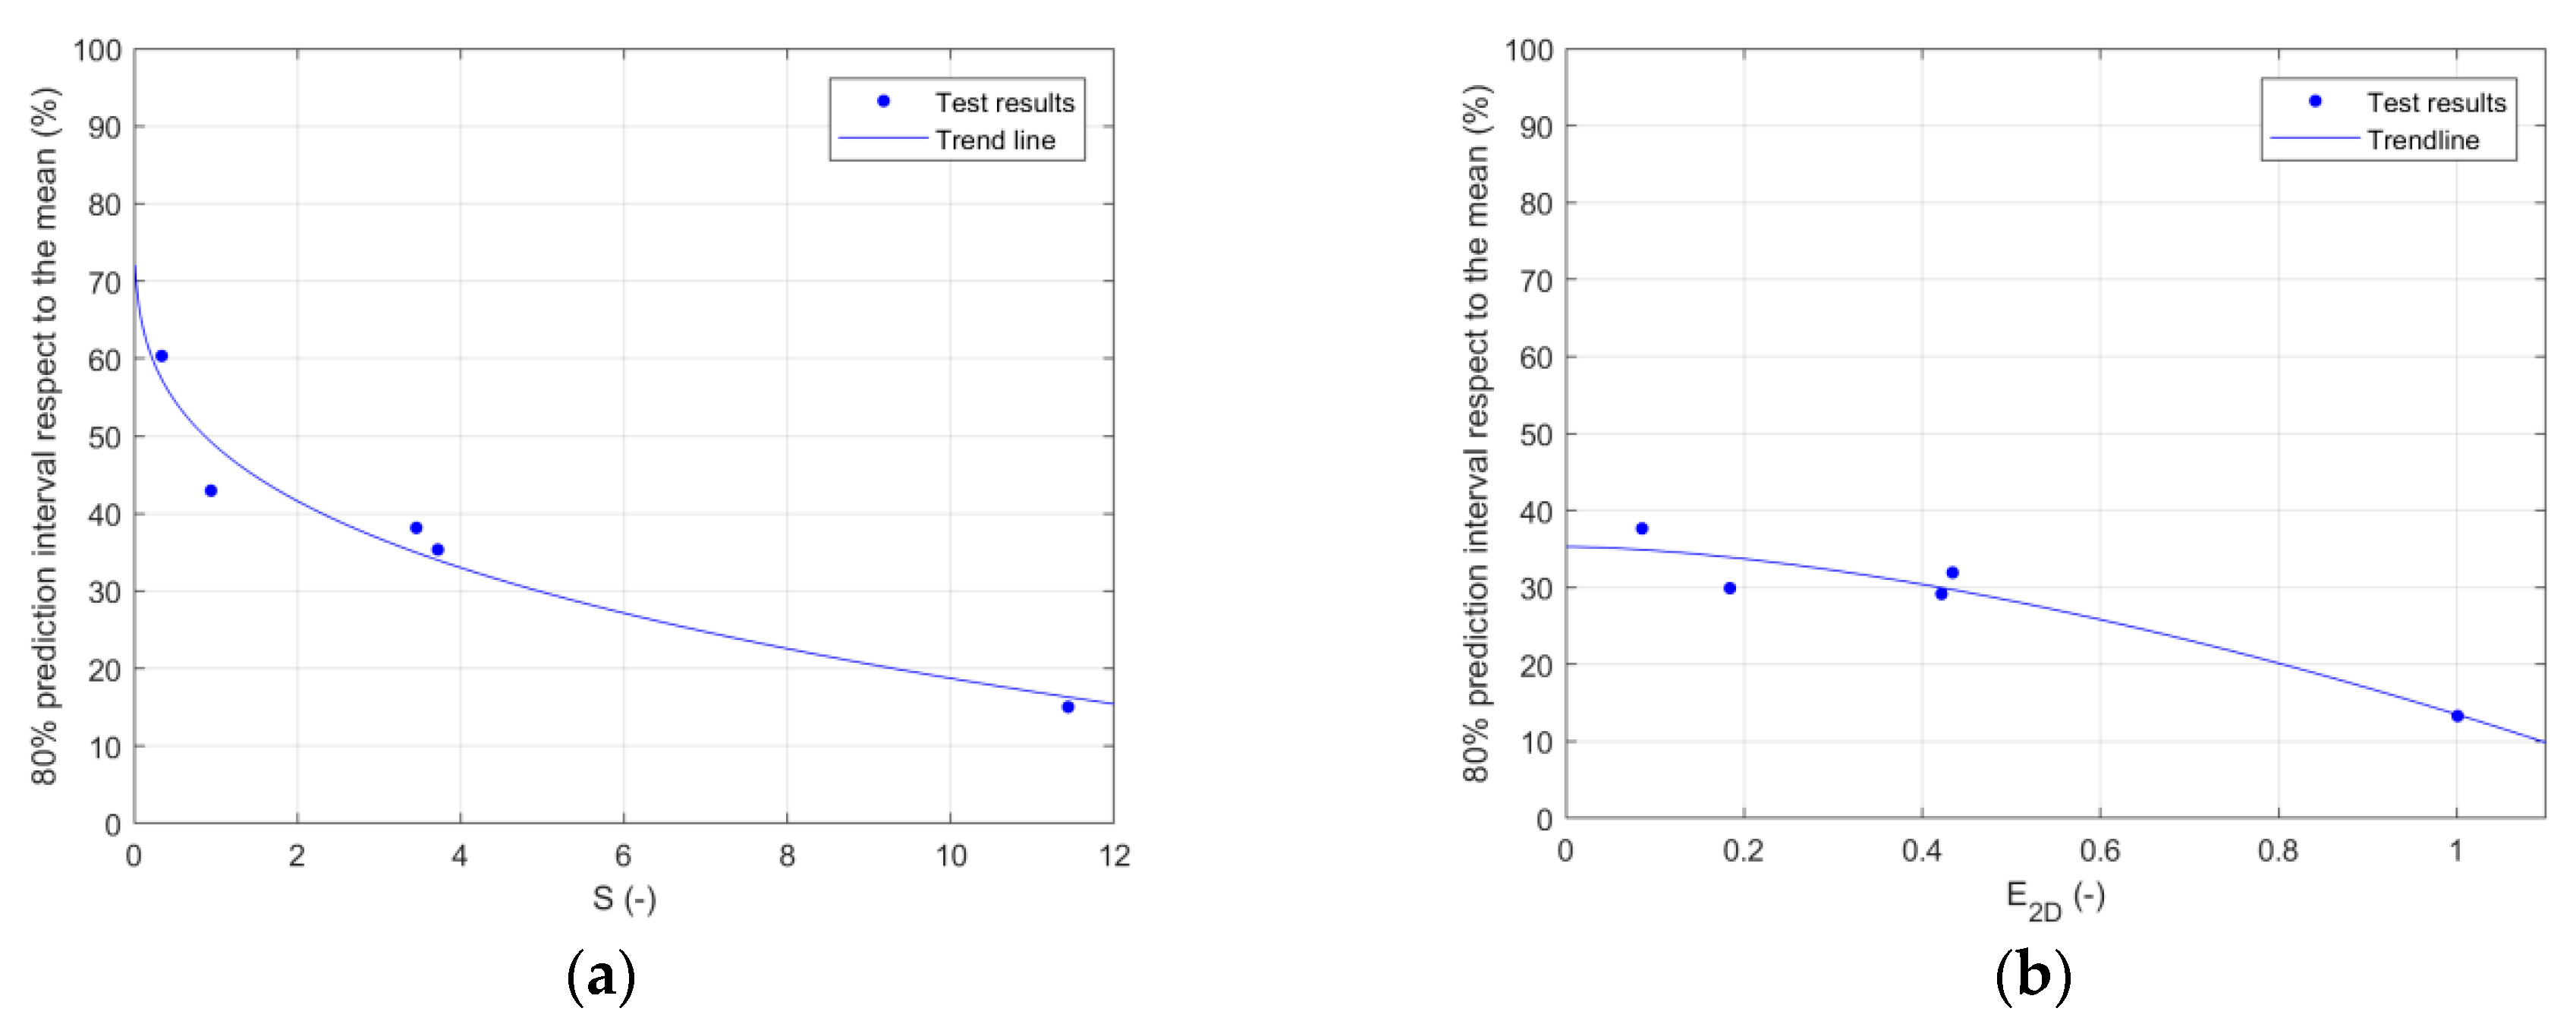
Figure 10.
Eighty percent prediction interval with respect to the mean (for 27Dn50 characterization width). (a) S parameter, (b) E2D parameter, E3D,5 parameter.
Figure 10.
Eighty percent prediction interval with respect to the mean (for 27Dn50 characterization width). (a) S parameter, (b) E2D parameter, E3D,5 parameter.
Figure 11.
Gumbel extreme distribution for EN3D,5 parameter (for 27Dn50 characterization width).
Figure 11.
Gumbel extreme distribution for EN3D,5 parameter (for 27Dn50 characterization width).
Table 1.
Test conditions.
Table 1.
Test conditions.
| Series | Run | Damage | hT (m) | Cond. | Hs,g (m) | Hs,T (m) | Tp (s) | Nw |
|---|
Series 1
(5 repetitions) | Run 1 | Cum. | 0.089 | 60% | 0.087 | 0.037 | 1.27 | 1000 |
| Run 2 | Cum. | 0.119 | 80% | 0.087 | 0.050 | 1.27 | 1000 |
| Run 3 | Cum. | 0.149 | 100% | 0.087 | 0.062 | 1.27 | 1000 |
| Run 4 | Cum. | 0.179 | 120% | 0.087 | 0.074 | 1.27 | 1000 |
Series 2
(5 repetitions) | Run 1 | Non-cum. | 0.149 | 100% | 0.087 | 0.062 | 1.27 | 1000 |
Table 2.
Damage limits (for 27Dn50 characterization width).
Table 2.
Damage limits (for 27Dn50 characterization width).
| Series | E3D,1 | E3D,5 | E2D | S |
|---|
| Damage initiation | 1.0 | 0.3 | 0.2 | 1 |
| Intermediate damage | 1.5 | 0.7 | 0.5 | 4 |
| Failure | 2.0 | 1.1 (90% conf.) | 0.9 (90% conf.) | 11 (90% conf.) |
Table 3.
Eighty percent prediction interval with respect to the mean (for 27Dn50 characterization width).
Table 3.
Eighty percent prediction interval with respect to the mean (for 27Dn50 characterization width).
| Parameter | S1 Run 1
60% | S1 Run 2
80% | S1 Run 3
100% | S1 Run 4
120% | S1 Run 2
100% |
|---|
| E3D,5 | 21% | 21% | 25% | 14% | 18% |
| E2D | 38% | 30% | 32% | 13% | 29% |
| S | 60% | 43% | 35% | 15% | 38% |
Table 4.
Parameters for Gumbel distribution for EN3D,5 parameter (for 27Dn50 characterization width).
Table 4.
Parameters for Gumbel distribution for EN3D,5 parameter (for 27Dn50 characterization width).
| Parameter | S1 Run 1
60% | S1 Run 2
80% | S1 Run 3
100% | S1 Run 4
120% | S1 Run 2
100% |
|---|
| 0.74 | 0.75 | 0.72 | 0.85 | 0.74 |
| 0.85 | 0.89 | 0.87 | 0.92 | 0.88 |
| 0.88 | 0.92 | 0.91 | 0.94 | 0.96 |
| 0.97 | 0.93 | 0.95 | 0.96 | 0.97 |
| 1.02 | 0.95 | 0.96 | 0.97 | 1.01 |
| 1.02 | 0.97 | 0.98 | 1.01 | 1.03 |
| 1.05 | 1.09 | 1.00 | 1.02 | 1.04 |
| 1.10 | 1.09 | 1.03 | 1.02 | 1.05 |
| 1.14 | 1.13 | 1.28 | 1.10 | 1.12 |
| 1.21 | 1.28 | 1.29 | 1.20 | 1.20 |
| 0.94 |
| 0.12 |
© 2019 by the authors. Licensee MDPI, Basel, Switzerland. This article is an open access article distributed under the terms and conditions of the Creative Commons Attribution (CC BY) license (http://creativecommons.org/licenses/by/4.0/).


