1. Introduction
The prediction of the amount of wave overtopping during storms is important for the design and evaluation of flood protection structures, for instance to determine the crest height, the protection of the crest and inner slope of dikes, and the volumes of water that need to be drained from the landward side of the structure.
Guidelines on wave overtopping over coastal structures are based on conditions with waves from one direction only, either waves approaching structures perpendicular or structures with an oblique wave attack. No guidelines exist for coastal structures where waves from one direction are combined with waves from another direction. A simultaneous wave attack by wave fields with different wave directions is of special importance for locations where wind waves approach a coastal structure under a specific direction while swell waves approach the coastal structure under another direction. Such bimodal seas with sea states from different directions (crossing seas) have, for instance, been discussed in [
1,
2,
3]. Although in practice directional spreading (short-crested waves) of each of the sea states may also play a role, the present study focuses on bimodal seas with long-crested waves from two directions.
Most methods to characterize wave overtopping focus primarily on mean overtopping discharges (e.g., the empirical expressions by [
4,
5] and the artificial neural network by [
6]. Individual overtopping events can be characterized by using estimates of water layer thicknesses and velocities during overtopping events as described by [
7,
8,
9,
10]. The present work focusses on the mean overtopping discharge as parameter to characterize wave overtopping. Two existing empirical expressions to estimate the mean overtopping discharge for waves from one direction are mentioned here. A widely used method to estimate the mean wave overtopping discharge for structures in relatively deep water is based on [
4]:
with a maximum of
where
q is the mean wave overtopping discharge,
g is the acceleration due to gravity,
ξm−1,0 is the breaker parameter based on the spectral significant wave height at the toe of the structure
Hm0 and the spectral wave period
Tm−1,0 (see [
11,
12]),
Rc is the crest height relative to the water level,
α is the slope angle, and
γb,
γf,
γβ and
γν are influence factors for berms, roughness of the slope, the angle of wave attack, and crest elements respectively. Since the combination of these influence factors has not been validated systematically, the combination of influence factors has been set at
γb γf γβ γν ≥ 0.4, see [
4], to avoid too large reductions that have not been based on data. The reliability of Equations (1) and (2) can be expressed by assuming the coefficients 4.75 and 2.6 as normally distributed stochastic parameters with standard deviations
σ4.75 = 0.5,
σ2.6 = 0.35.
Another method to estimate the mean wave overtopping discharge for structures in relatively deep water is described in [
5] and mentioned in [
13]:
with a maximum of
The reliability of Equations (3) and (4) can be expressed by assuming the coefficients 0.023, 2.7, 0.09 and 1.5 as normally distributed stochastic parameters with standard deviations
σ0.023 = 0.5,
σ2.7 = 0.2,
σ0.09 = 0.0135 and
σ1.5 = 0.15. Note that the influence factors
γb,
γf,
γβ and
γν are based on expressions like Equations (1) and (2) with these reduction factors to the power −1 while in Equations (3) and (4) the same reduction factors are applied to a different power (−1.3) resulting in a much larger impact of the reduction factors than can be justified based on the data on which these factors have been based. In order to apply the same influence factors as derived based on Equations (1) and (2), Equations (5) and (6) need to be used instead of Equations (3) and (4):
with a maximum of
Note that overtopping data do hardly justify the change from the power 1 to 1.3; based on overtopping data [
14] concluded that the power 1.0 is better than the power 1.3. It is proposed to apply a maximum reduction due to combinations of various influence factors, similar to [
4]:
γb γf γβ γν ≥ 0.4 since the combination of reduction factors has not been validated systematically. Note that effects of wind on wave overtopping have not been incorporated in these empirical expressions. Some guidance on effects of wind on wave overtopping over sloping structures is provided in [
15].
Most of the data on mean overtopping discharges and individual overtopping events are based on physical model tests with a perpendicular wave attack. Oblique waves lead to lower overtopping discharges and less severe overtopping events than perpendicular wave attack. In [
16] prediction formulae for the influence of oblique wave attack (influence factor
γβ) on the mean overtopping discharge over impermeable structures (e.g., dikes) were derived. In [
16] a reduction factor is included for wave obliquity
γb, where
β represents the angle of wave incidence (with
β = 0° for perpendicular wave attack and
β = 90° for waves propagating in the longitudinal direction of the structure). In the prediction formulae distinction is made between long-crested waves (unidirectional waves) and short-crested waves (multi-directional waves). For long-crested waves approaching impermeable structures, [
16] proposed:
For short-crested waves approaching impermeable structures, [
16] proposed:
These reduction factors for oblique wave attack on impermeable structures can be applied in combination with various formulae for predicting the mean wave overtopping discharge over impermeable structures. To account for the effects of oblique wave attack over permeable structures expressions were derived by [
17,
18,
19]. In [
17], tests with long-crested waves on various types of armour slopes were described. For long-crested waves approaching permeable structures with rock armour layers, [
17] proposed:
In [
19] different expressions were proposed based on tests within the range of 0° ≤
β ≤ 60°. For long-crested waves approaching permeable structures, [
19] proposed:
For short-crested waves approaching permeable structures, [
19] proposed:
The effect of oblique wave attack on the overtopping discharge can also be predicted by using a data-driven neural network technique [
6] for various types of structures (e.g., dikes and breakwaters).
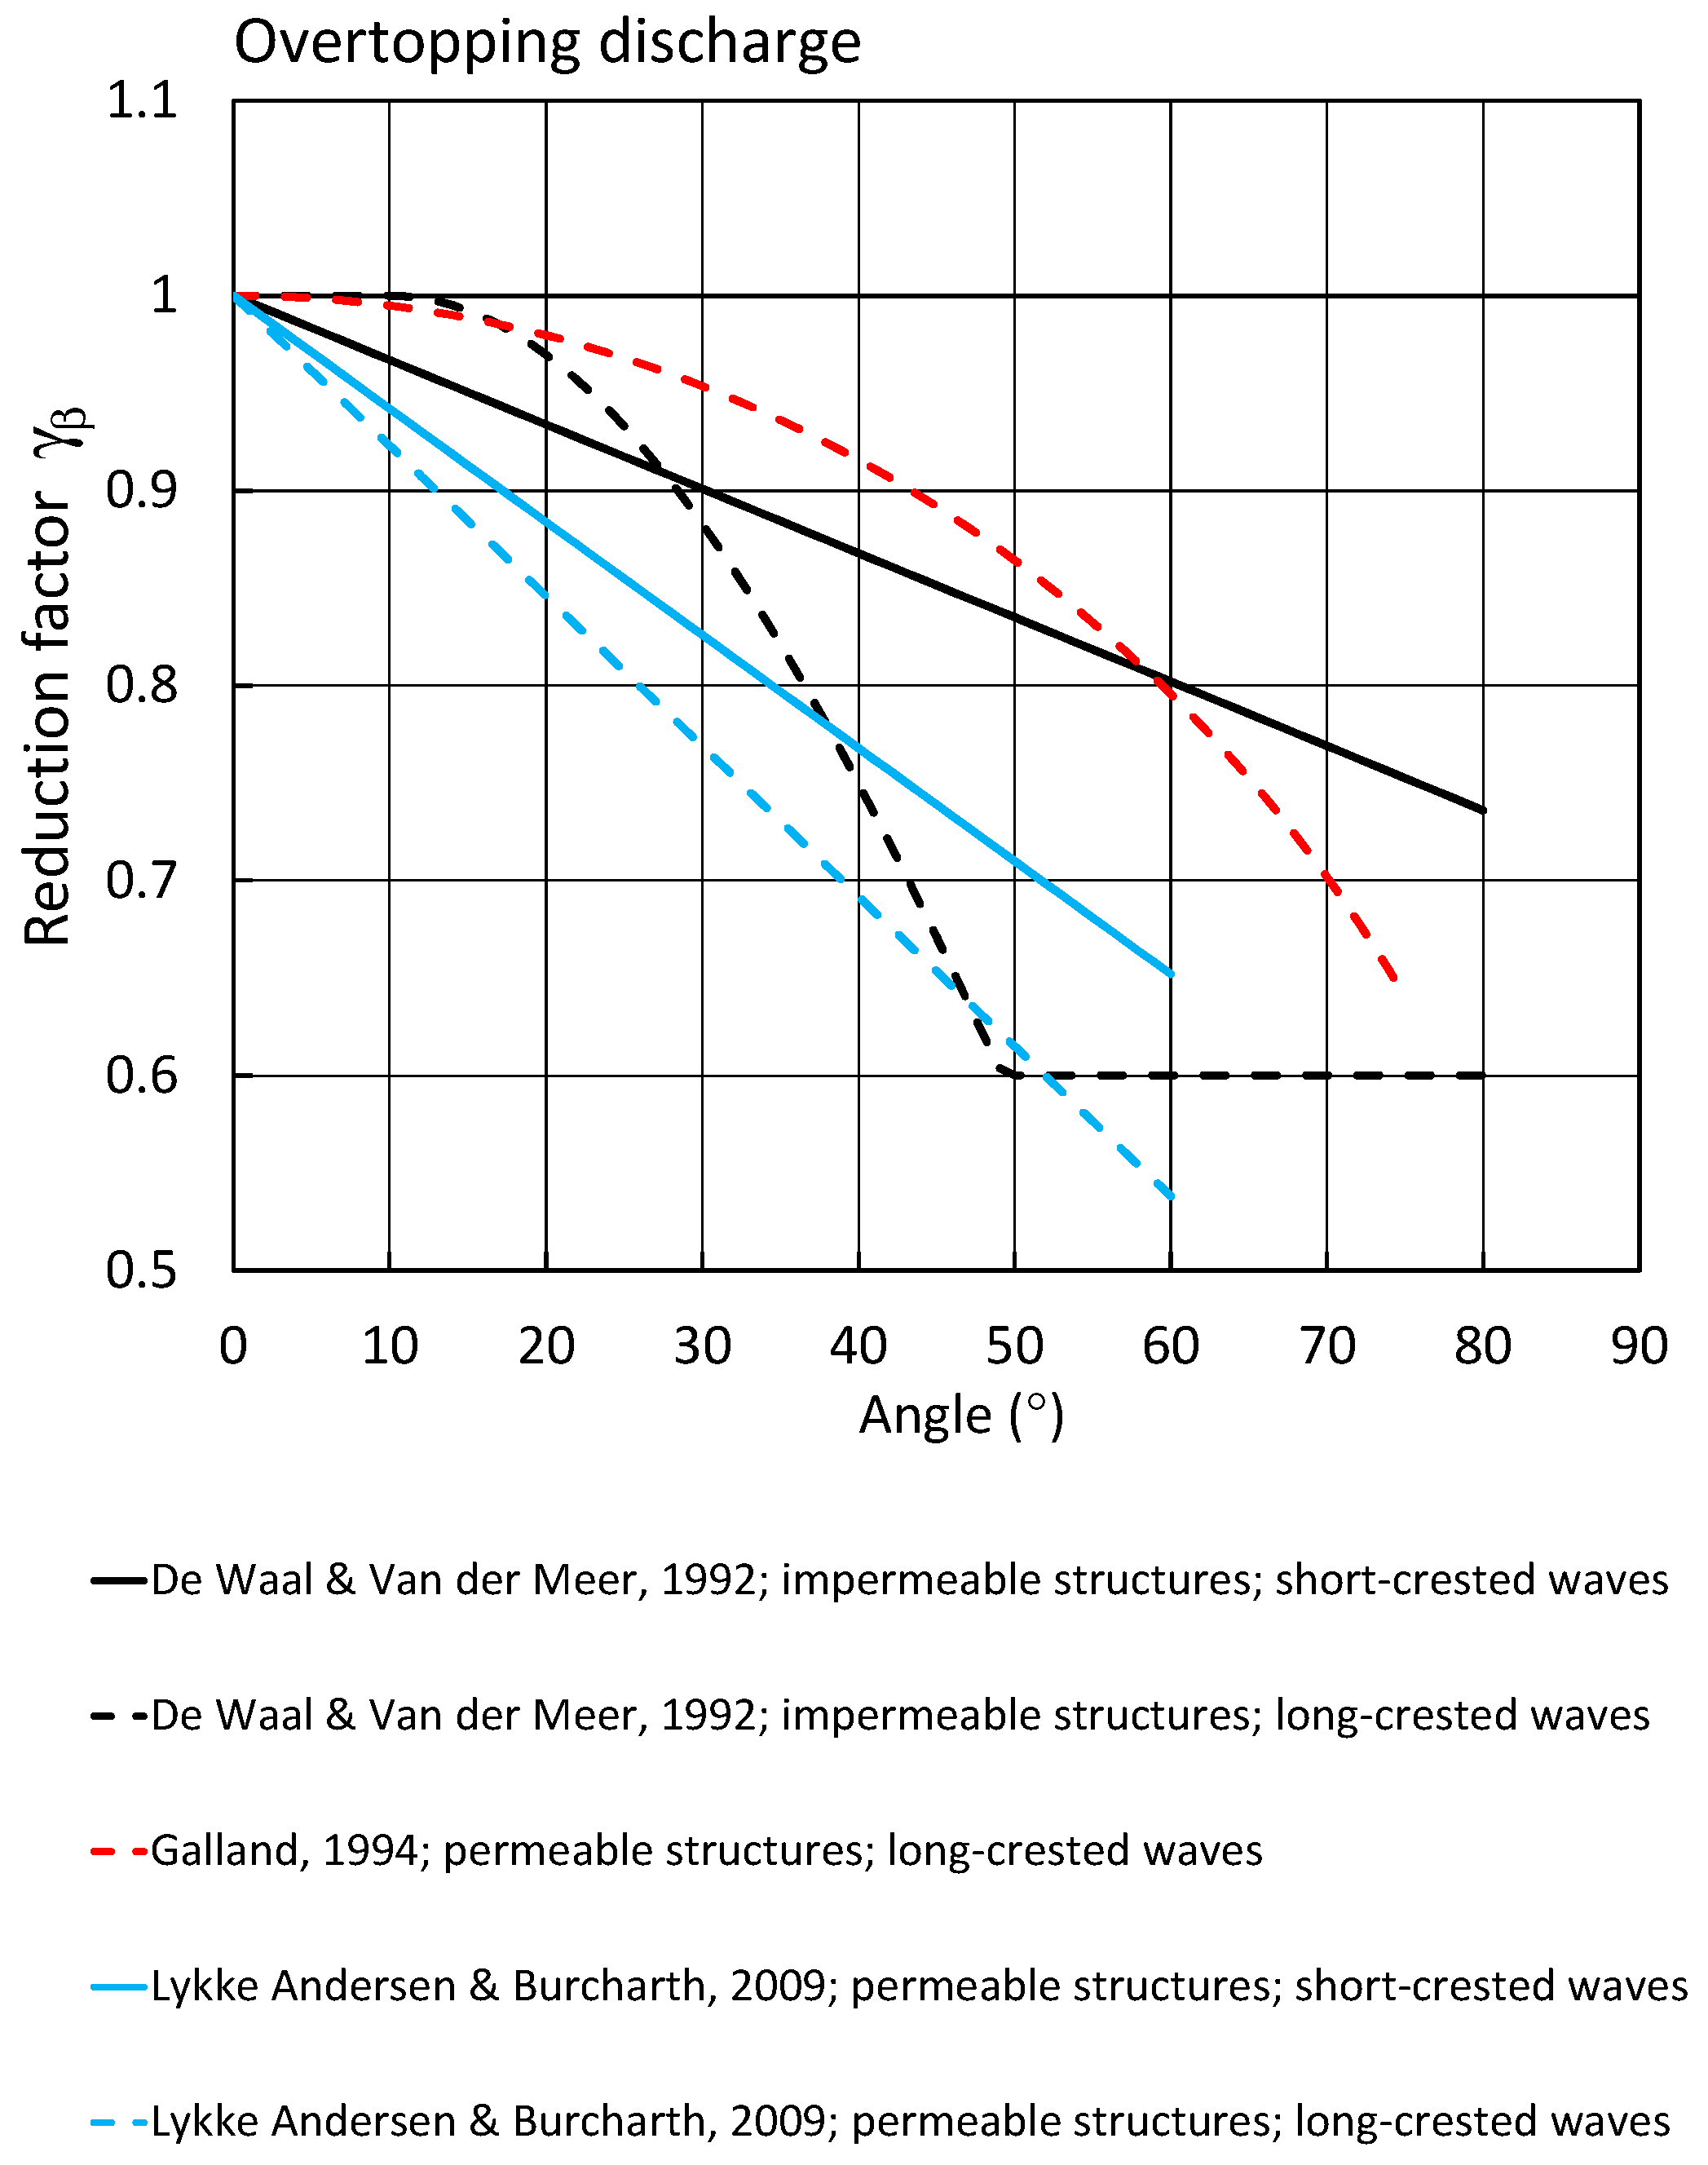
Figure 1 shows a comparison of methods that predict the reduction in wave overtopping due to oblique wave attack. Note that these methods were developed for different wave loading (short-crested or long-crested) or different types of structures (impermeable or permeable), only [
17,
19] proposed expressions for mean overtopping discharges over permeable structures with long-crested waves. In the expression by [
17] the influence of wave obliquity is much smaller than in the expression by [
19]. The comparison shows that in all expressions the influence of wave obliquity on mean wave overtopping discharges is rather large; note that the reduction factor is present in the exponential part of the equations (Equations (1)–(6)). The comparison also shows that the mutual differences between expressions for the same situation (i.e., the blue and red dashed lines for permeable structures and long-crested waves) are even more significant, indicating that there can be a rather large uncertainty around proposed expressions, and/or that the influence factor for oblique waves depends on other aspects than those present in the expressions.
As mentioned before, existing guidelines on wave overtopping over coastal structures are based on conditions with waves from one direction only, either waves approaching structures perpendicular or structures with oblique wave attack. For coastal structures where waves from one direction are combined with waves from another direction no guidelines exist. The present research aims at providing a guideline to predict the mean overtopping discharge over dikes for one wave field and also for two wave fields at the same time. The combination of a sea state with swell is one of those combinations of two wave fields.
2. Physical Model Tests
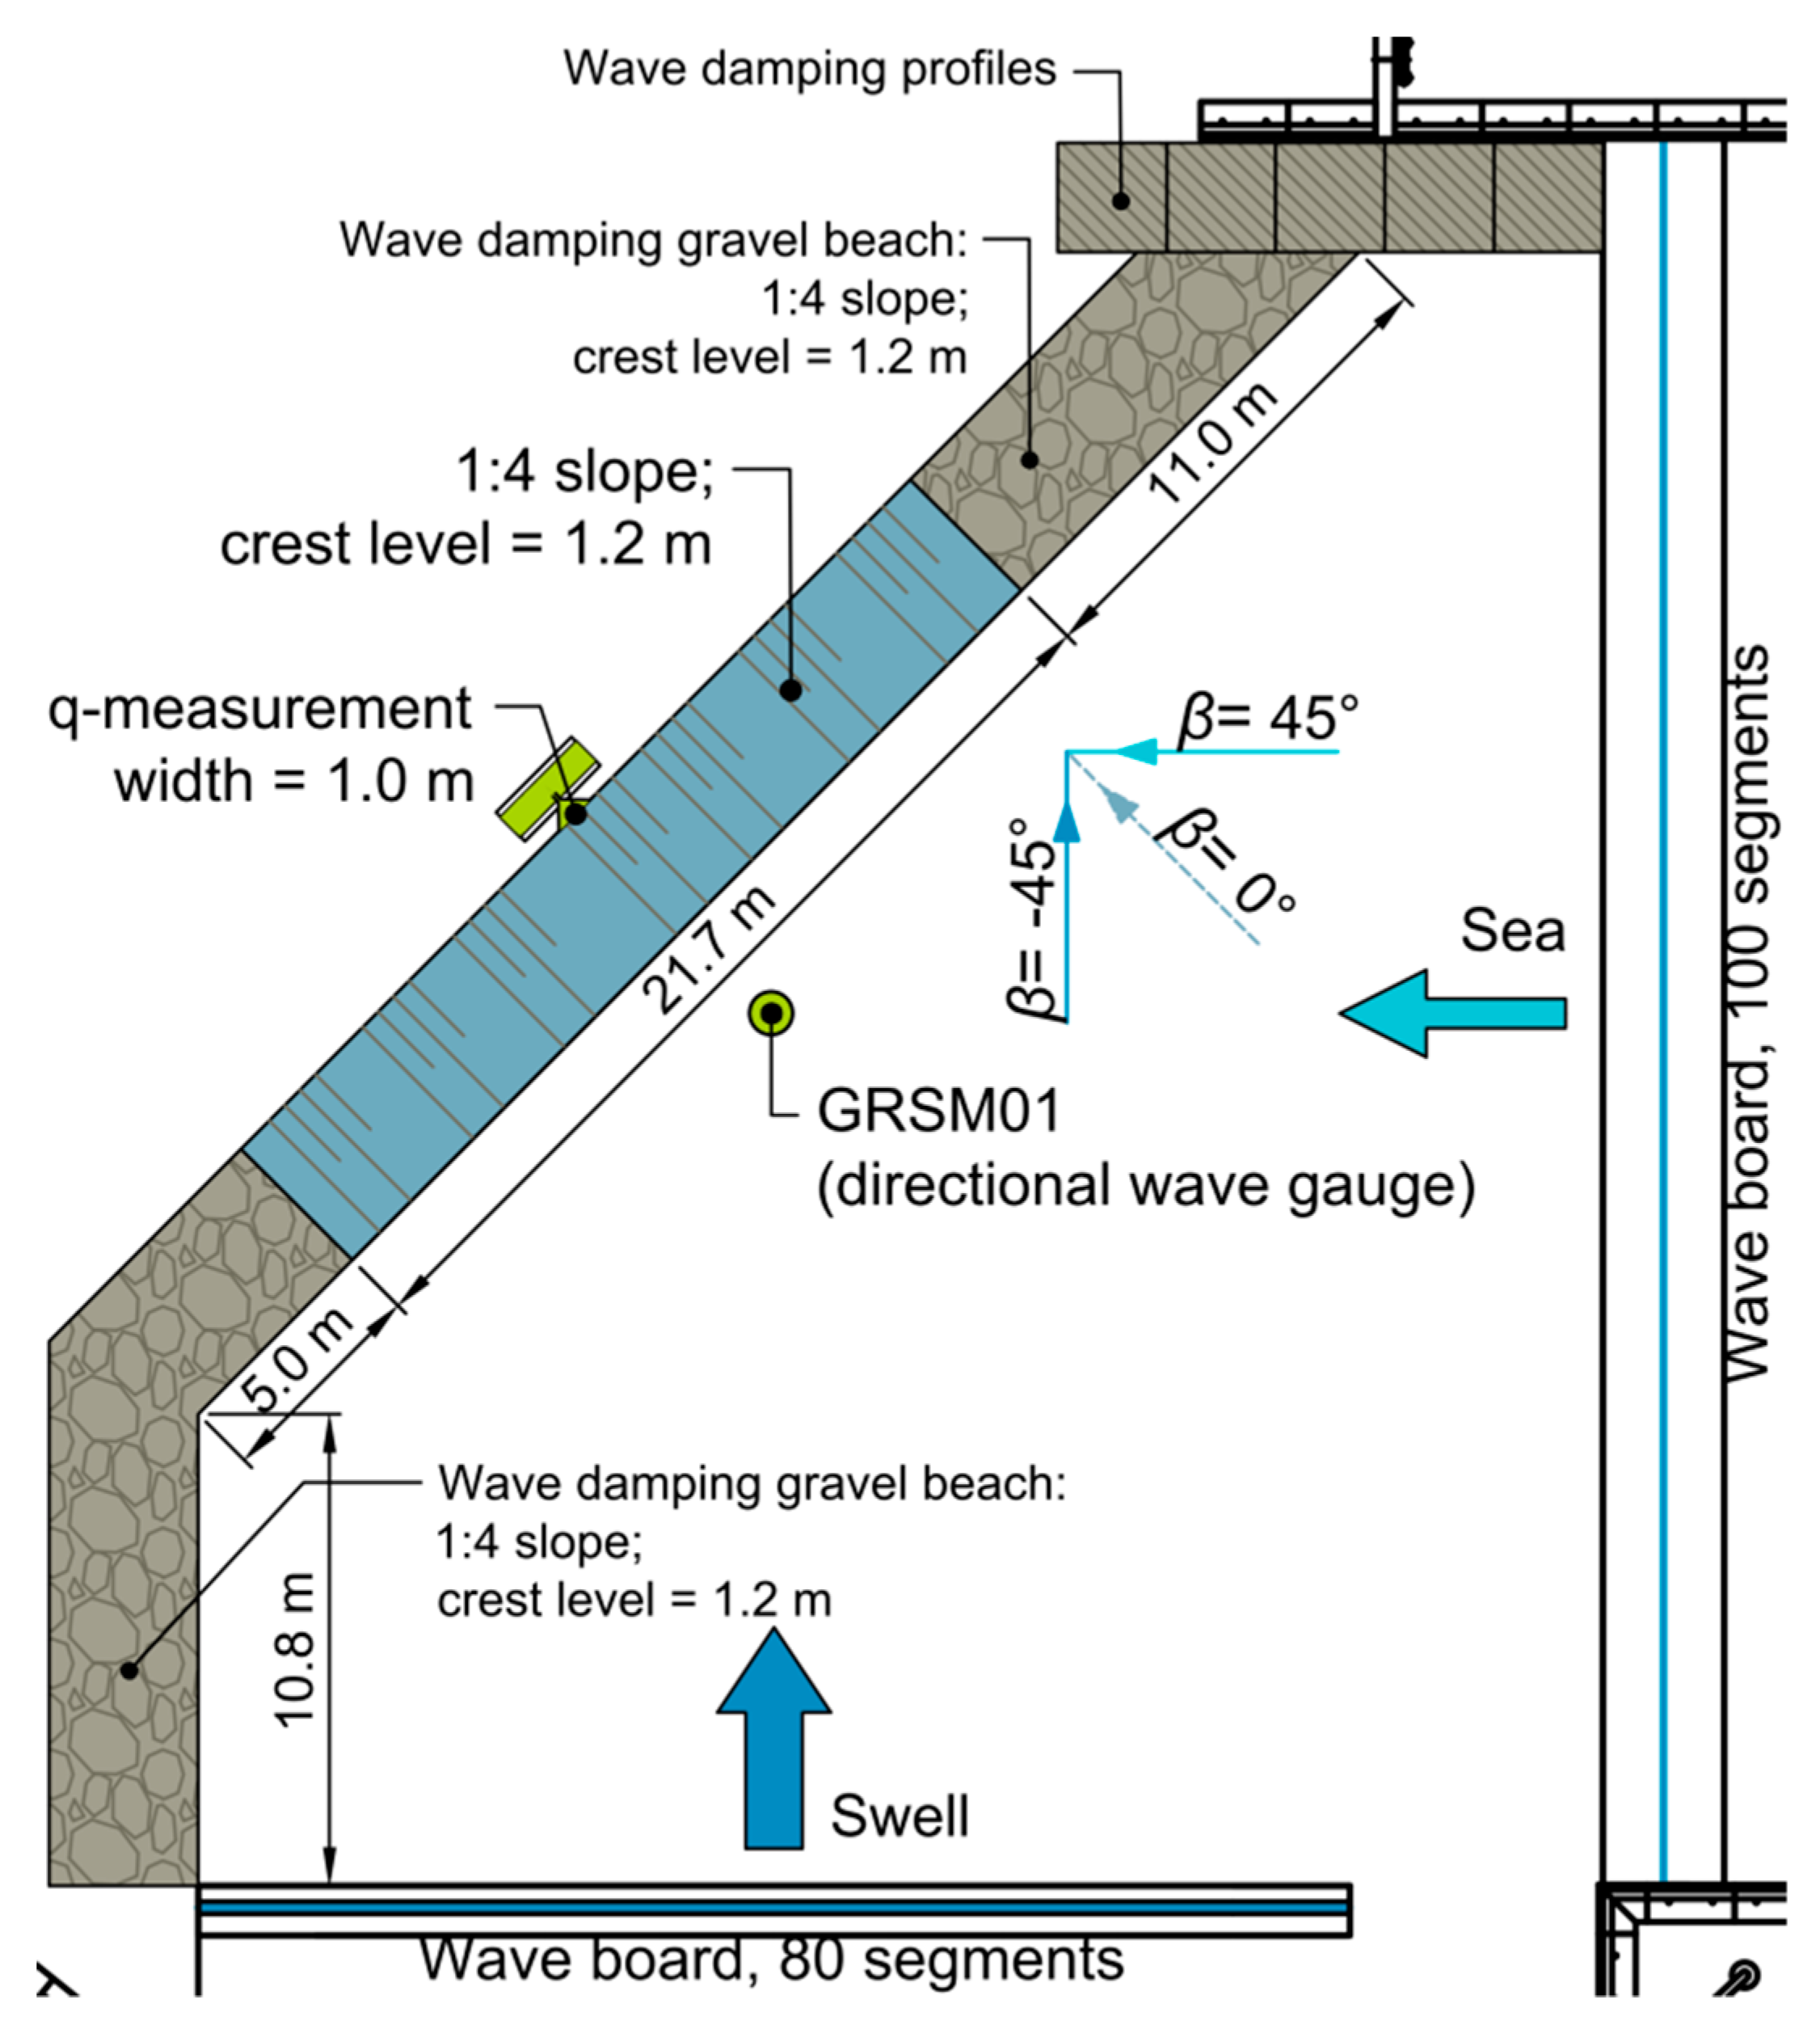
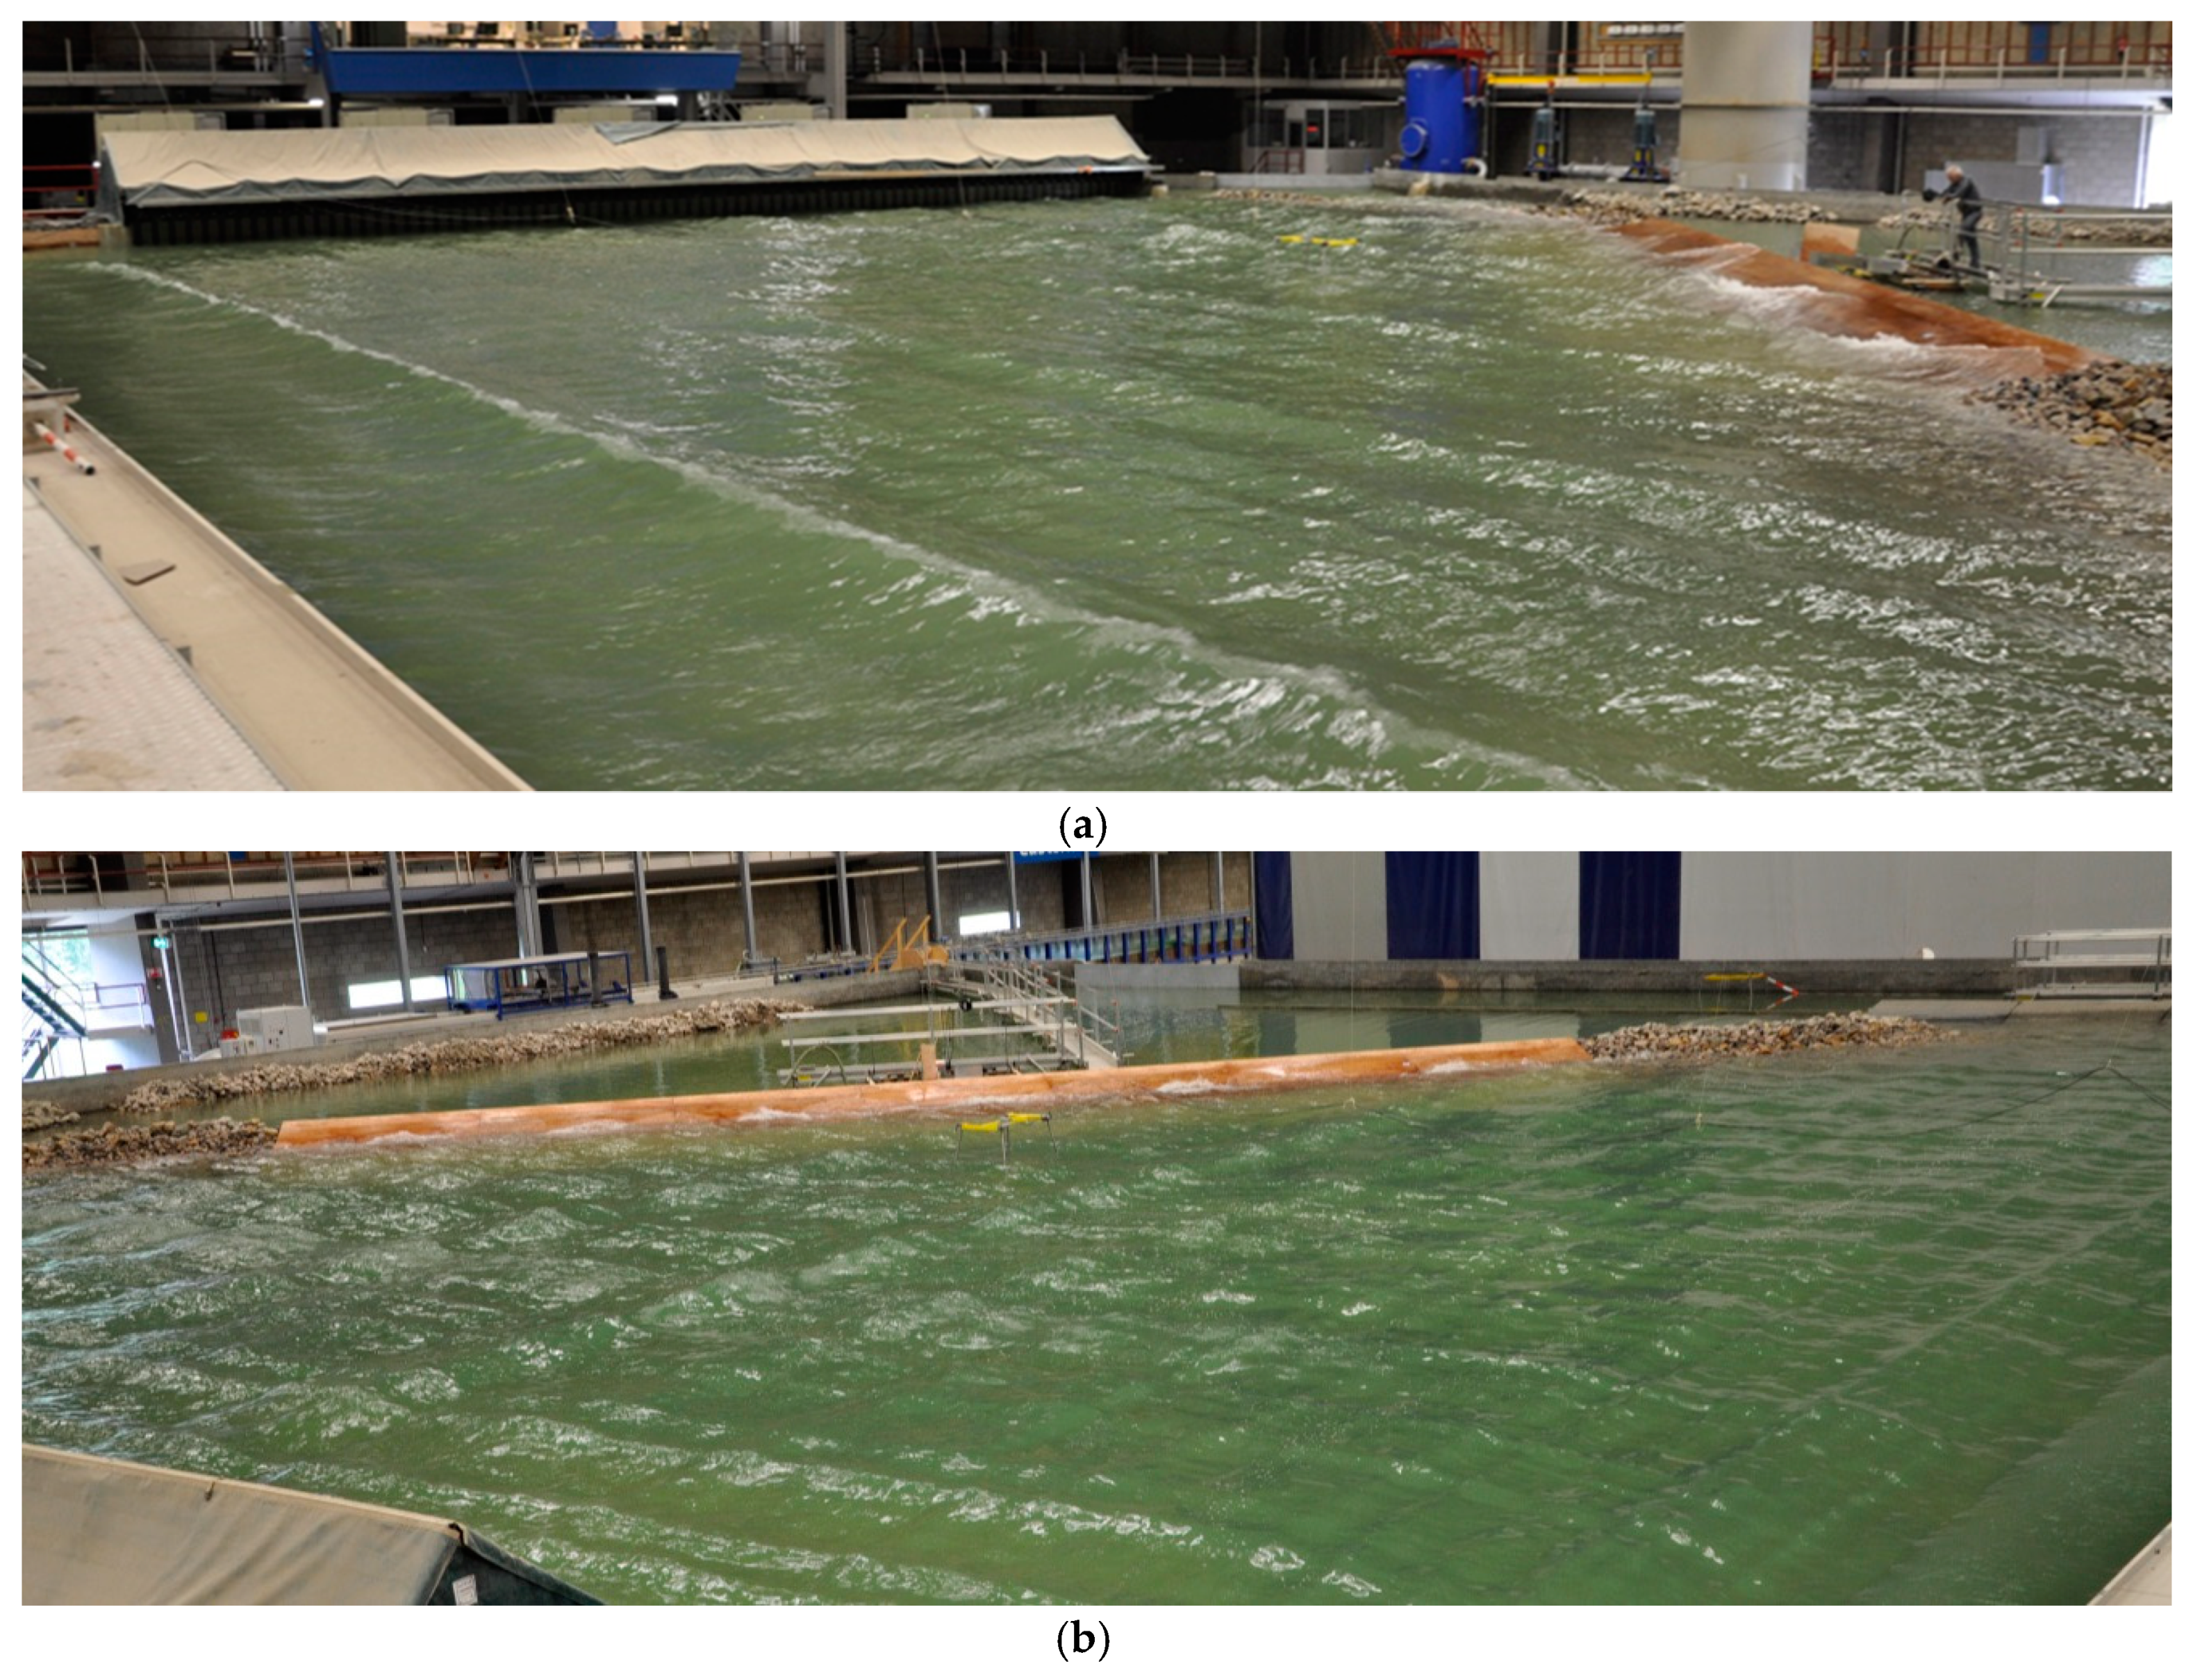
Physical model tests have been performed in the Delta Basin of Deltares, Delft. This size of the basin is 50 m × 50 m. Two multi-directional wave generators have been used, one with length of 26 m and another of 40 m. Both wave generators are equipped with an active reflection compensation system (see for details of the system [
21]). The tested structure had a very smooth impermeable 1:4 slope made of wood with a crest level of 1.2 m above the horizontal foreshore. The water depth was 0.9 m in all tests (
Rc = 0.3 m). Long-crested waves were used in all tests. Although the wave generators can generate waves under an angle, in the present tests all waves were generated perpendicular to the wave board leading to all waves approaching the structure under an angle of 45°. All wave energy spectra were JONSWAP spectra (
γ = 3.3), for the wind waves and for the swell waves. Although for swell waves a Pierson-Moskowitz spectrum (thus a peak enhancement factor of (
γ = 1.0 instead of 3.3) is more appropriate for swell conditions since the spectrum of swell generally is a fully developed and a Pierson–Moskowitz spectrum is assumed to represent fully developed conditions in deep water [
22]. However, for consistency reasons the same shape was used for all wave energy spectra. Besides that, in [
11,
12] it was shown that the spectral shape does not affect wave run-up and wave overtopping as long as the spectral wave period of the spectrum
Tm−1,0 is the same. Waves were measured in front of the toe of the structure with a directional wave gauge (GRSM). The directional wave gauge consisted of a standard wave gauge combined with a two-component velocity sensor. The signals of these instruments were jointly analysed to produce an incident and reflected wave spectrum using the maximum entropy method based on [
23]. The wave steepness of the wind waves measured at the toe was in the range of
sp = 0.018 to 0.052. The wave steepness of the swell waves was in the range of
sp = 0.0005 to 0.040. Note that the lower range of the wave steepness of the swell component is very low. The selected wave conditions cover a fairly wide range of relevant values of the wave steepness. Mean wave overtopping discharges were measured over a width of 1 m at the middle of the structure (with a width of 21.7 m), see
Figure 2. Visually it was observed that variations of wave overtopping occurred along the crest of the structure but no reasons for this variation along the structure could be determined.
The test programme consisted of four types of wave loading:
Wind waves only: “sea” (45°).
Wind waves and swell waves from the same direction: “Sea + swell” (45°).
Wind waves and swell waves, simultaneously from two different directions: “Sea + swell perpendicular” (45° and −45°; crossing seas).
Wind waves, simultaneously from two different directions: “Sea + sea perpendicular” (45° and −45°; crossing seas).
The two types of wave loading with crossing sea states (see for instance
Figure 3) can be seen as a combination of wind waves and swell waves, but in the third type of wave loading, the wave steepness of the swell waves is considerably lower than in the fourth type of wave loading. Since in the fourth type of wave loading the generated wave heights and wave steepness of both sea states are similar, in the following we refer to them as two sea states of wind waves (“sea + sea”), to distinguish those from the third type of wave loading (referred to as “sea + swell”). Although the conditions of the two sea states (“sea + sea”) could have been varied mutually, such a variation is assumed not to be essential.
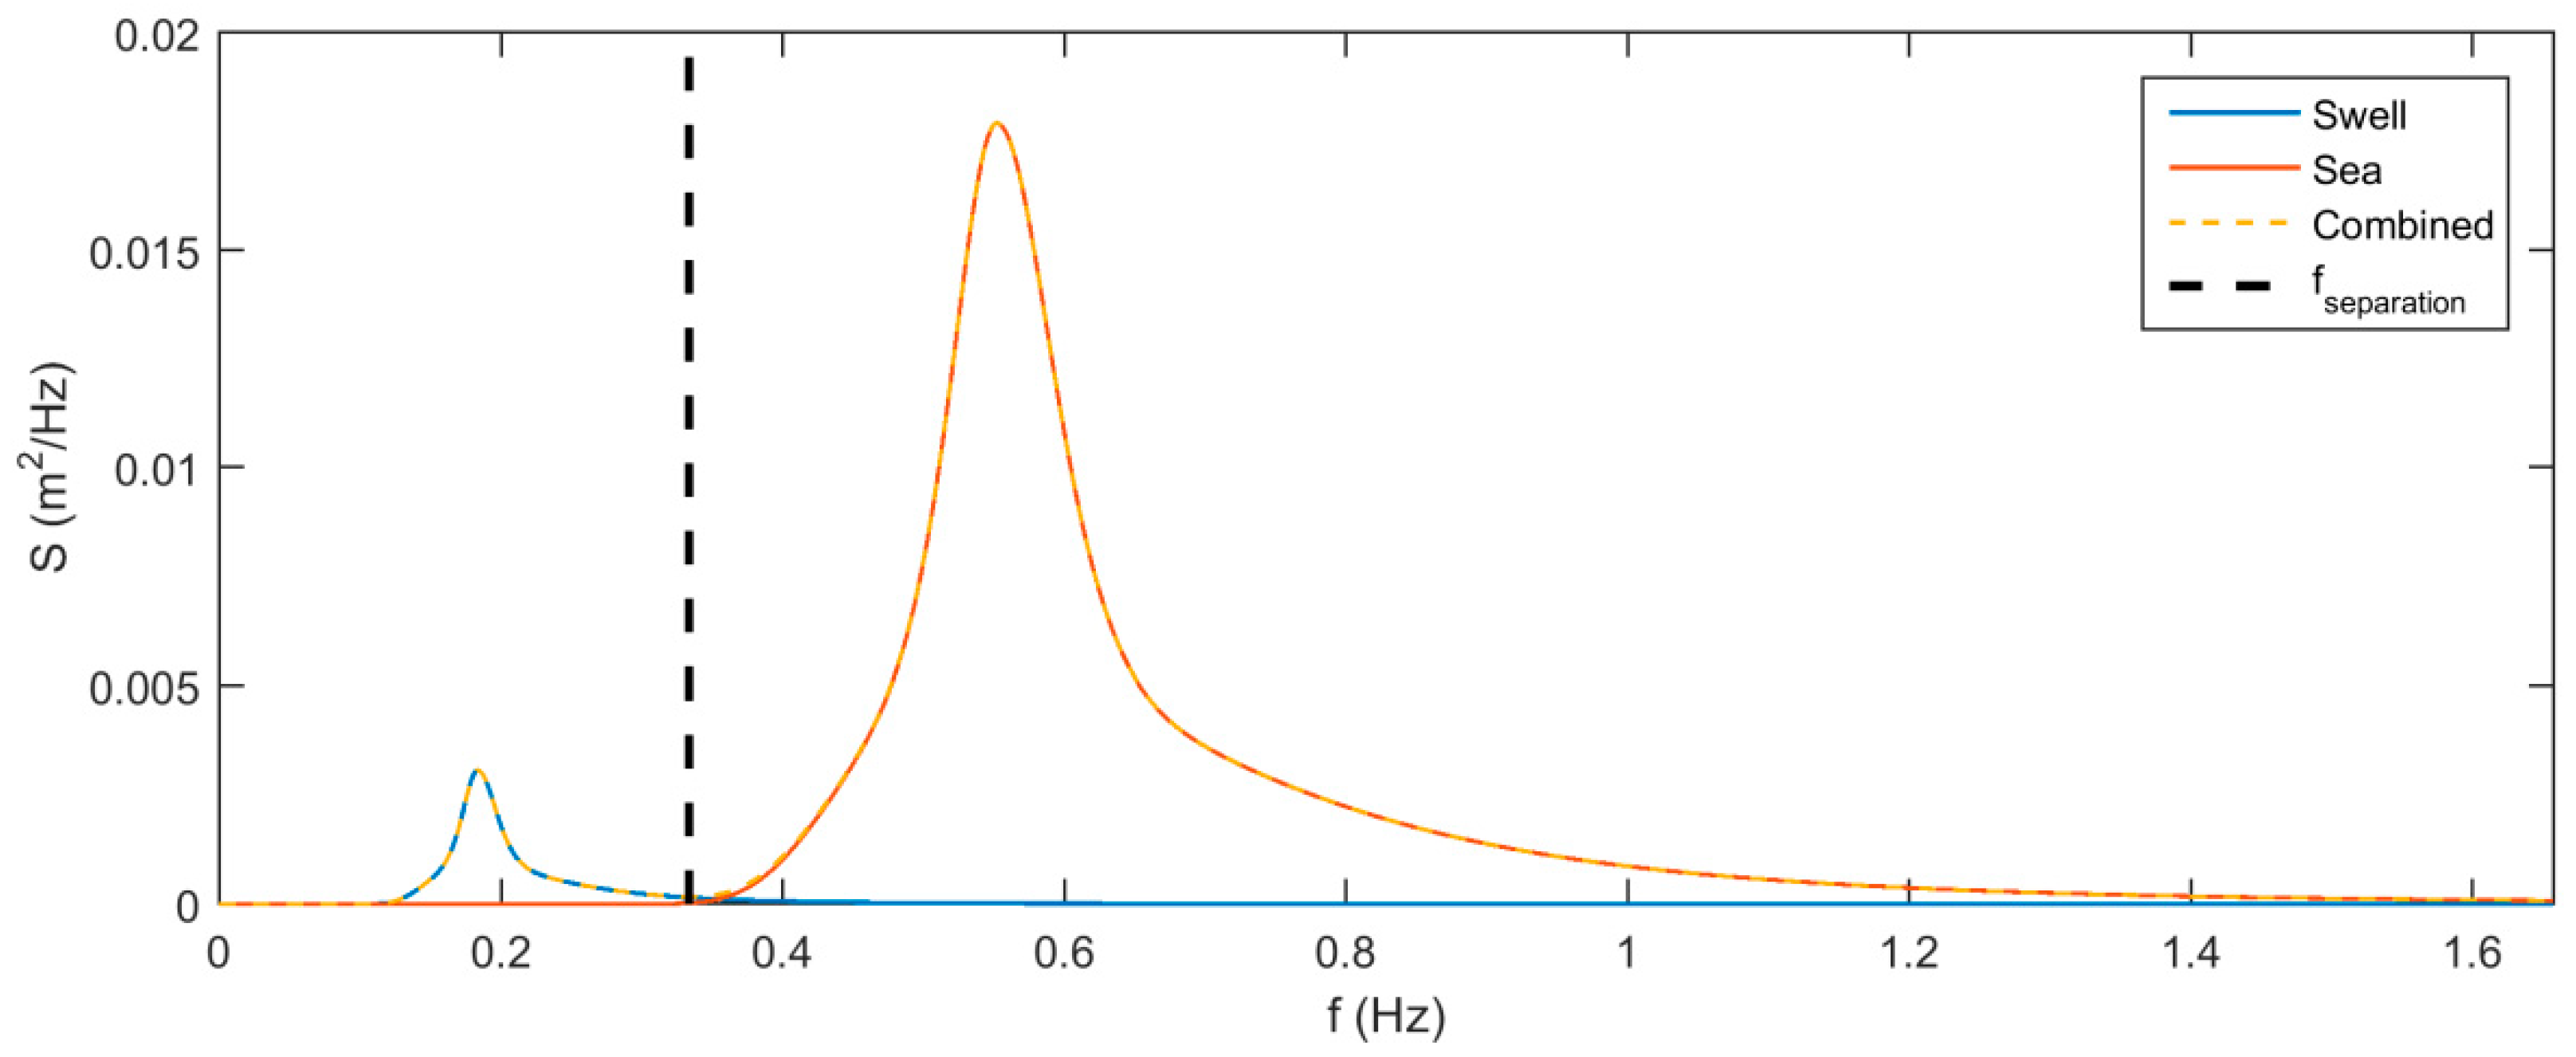
Table 1 shows the measured wave conditions and measured wave overtopping discharges. Each condition was tested once. For the second and third series with swell waves (with peak wave periods of the swell waves that are a factor 3—or more—larger than the peak wave periods of the sea waves), the measured wave conditions at the toe of the structure have been decomposed into a sea component and a swell component where the swell component is based on the energy in the low-frequencies and the sea component on the energy in the higher frequencies. The frequency separating the two components is the position with minimum energy between the energy peaks of the individual sea states, which corresponds closely with the frequency in the middle of the two peaks (see
Figure 4 for an illustration of the double peaked spectrum and the separation frequency).
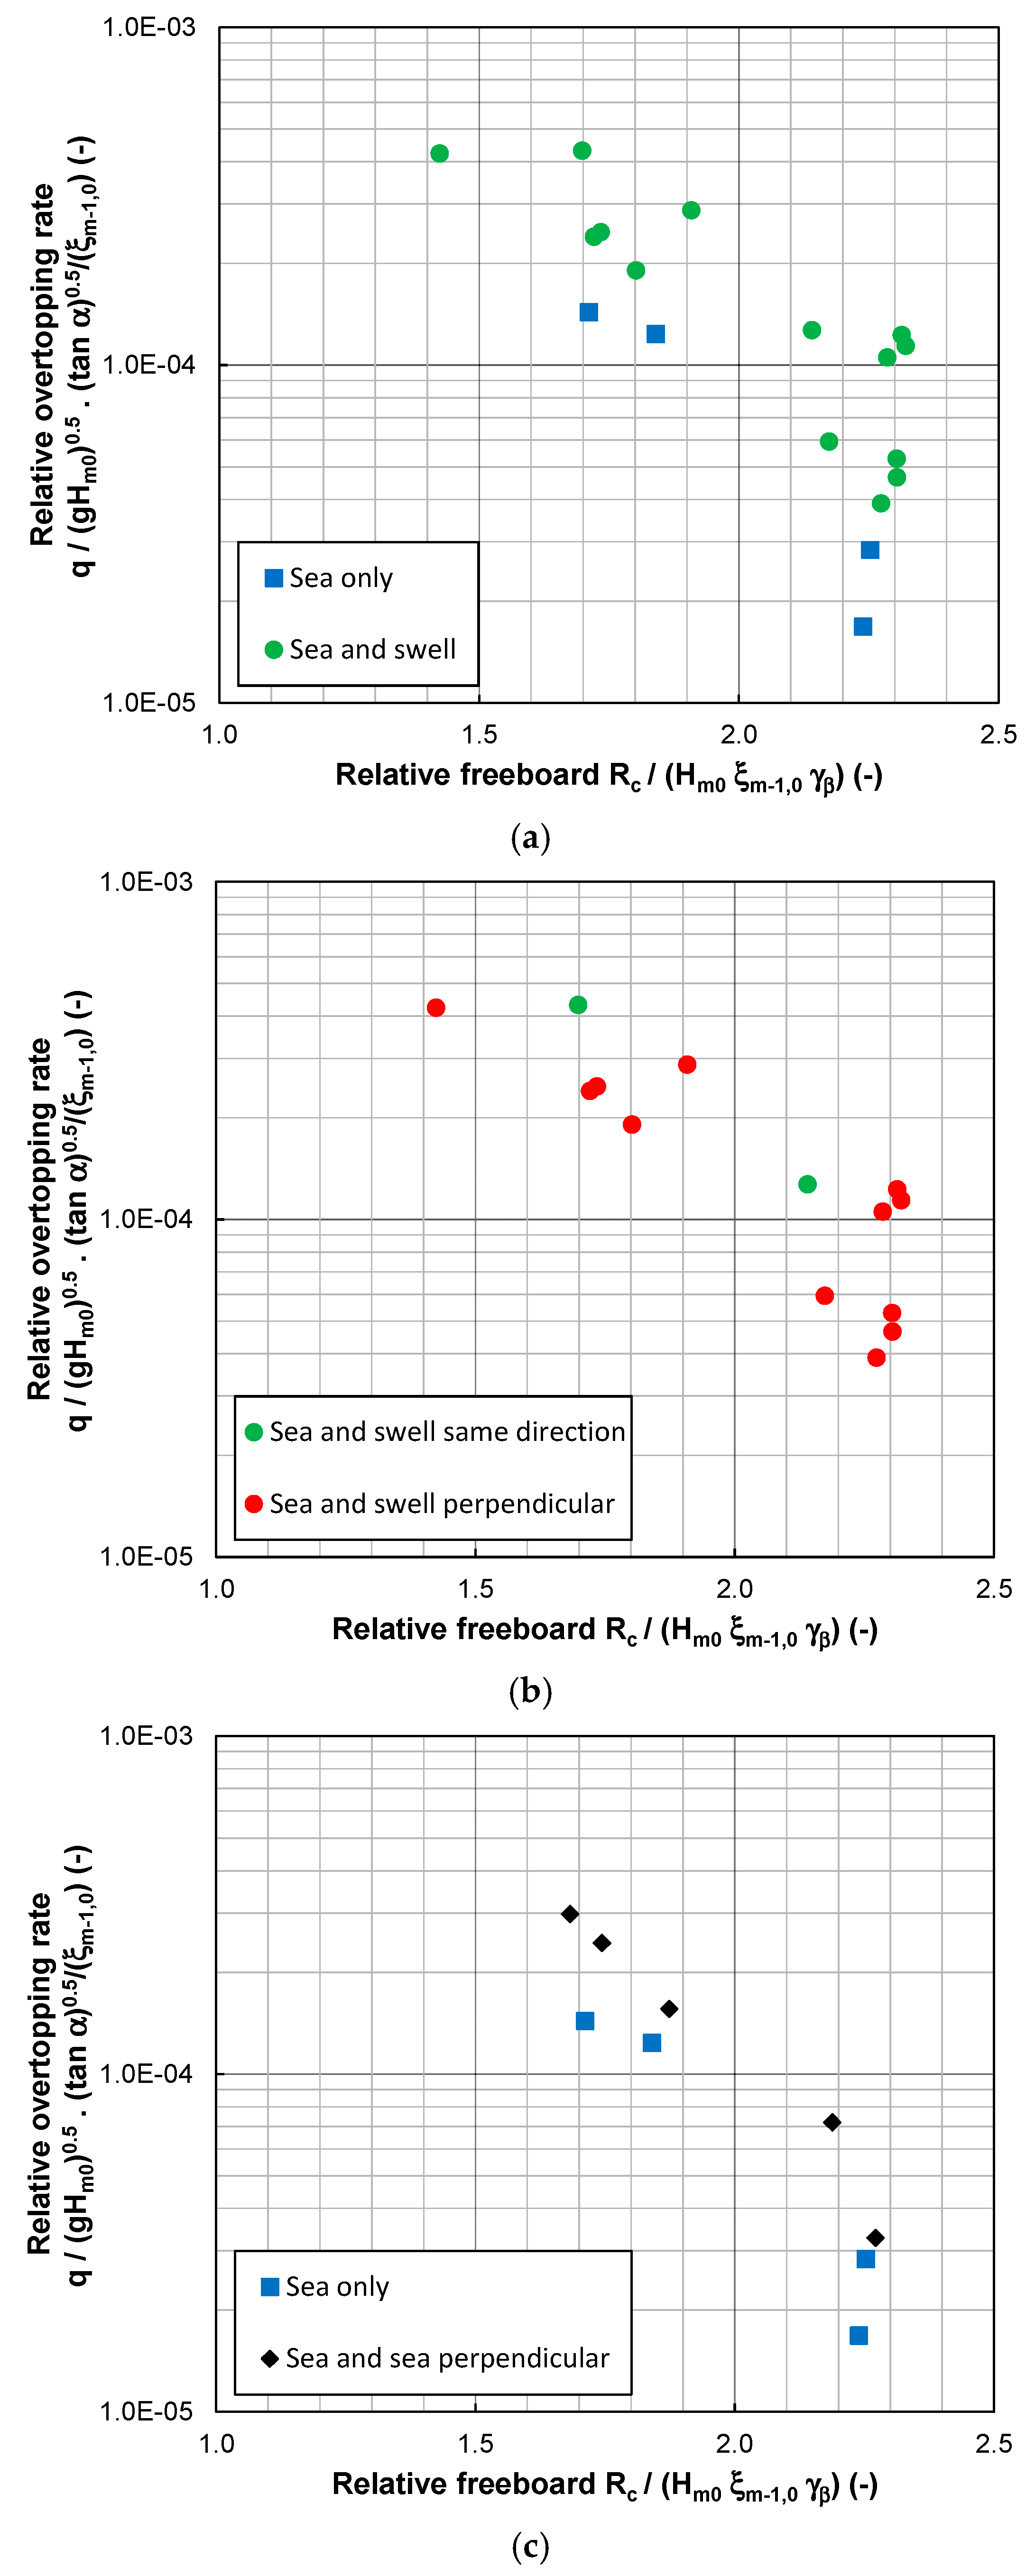
3. Analysis of Test Results
Table 1 and
Figure 5 show the test results. In
Figure 5 the test results are presented where on the horizontal axis the relative free board (
Rc/(
Hm0 ξm−1,0 γβ) is shown (
Hm0 and
ξm−1,0 are based on the conditions of the wind waves: “sea”) and on the vertical axis the relative overtopping rate
q/(
gHm0)
0.5×(tan α)
0.5/
ξm−1,0.
Adding swell from the same direction to these sea conditions leads to larger overtopping discharges (compare Test S1-02 to Test S2-01 or Test S1-04 to Test S2-02 in
Table 1). If swell is added from the perpendicular direction (i.e., sea under an angle of 45° and swell from an angle of −45°) the overtopping discharge is also larger than for sea waves only (compare for instance Test S1-01 to Test S3-01 or Test S1-02 to Test S3-02, or Test S1-04 to Test S3-04 in
Table 1). In the upper graph of
Figure 5 the “sea” conditions and the “sea + swell” conditions are shown. Adding the swell conditions to the wind waves (“sea”) leads to a higher amount of wave energy approaching the structure. Therefore, it is not surprising that the overtopping is larger for the “sea + swell” conditions.
Comparing sea and swell conditions from the different directions to sea and swell conditions from the same direction does not lead to significantly different wave overtopping discharges (compare Test S2-01 to Test S3-09 in
Table 1). The middle graph of
Figure 5 shows the “sea + swell” conditions where they approach the structure in the same direction and the “sea + swell” conditions where the “sea” and “swell” are perpendicular to each other. The direction of the swell (same direction or perpendicular to the wind waves) does not seem to be very important; the (limited) conditions of “sea + swell” conditions where they approach the structure in the same direction (green triangles) correspond to conditions that are in the higher range of overtopping discharges of “sea” and “swell” perpendicular to each other (upper red dots).
In the lower graph of
Figure 5 the “sea” conditions and the “sea + sea” conditions (crossing seas) are shown, where the total amount of incident waves energy (thus irrespective of the exact direction) is accounted for in the incident wave height
Hm0. Two sea states with waves from two different directions (i.e., 45° and −45°) lead to somewhat larger overtopping discharges compared to waves from one direction only (compare also Test S1-02 to Test S4-01 or Test S1-03 to Test S4-02 in
Table 1).
This analysis indicates that:
- (1)
The presence of swell leads to more overtopping.
- (2)
The direction of the swell (same direction or perpendicular to wind waves) seems to be less relevant for wave overtopping discharges.
- (3)
Two sea states with waves from two different directions (i.e., 45° and −45°) seem to lead to somewhat larger overtopping discharges compared to waves from one direction (i.e., 45°) with the same total incident wave height at the toe.
The test results are compared to existing empirical expressions to estimate wave overtopping discharges. All tested wave conditions were with long-crested waves under an angle of 45° and with a smooth, impermeable slope. Therefore, Equation (7) has been used to account for an oblique wave attack. This leads to a reduction factor of
γβ = 0.67 for wave obliquity. First, Equations (1) and (2) have been used. Since there is a systematic difference between the measured overtopping discharges and the predictions for wind waves only, the coefficient 4.75 needs to be adapted to 3.4 to account for the bias. The bias may be caused by variations of wave overtopping along the crest of the structure with locations that have an overtopping discharge that is on average larger and locations that are on average lower than the mean discharge along the structure. This would mean that the overtopping box is located at a position with an overtopping discharge that is larger than the average overtopping discharge along the structure. Equations (1) and (2) have been adapted to account for the second wave field which is swell with a low wave steepness. For the wave height
Hm0 and the surf similarity parameter
ξm−1,0 the parameters of the wind waves (“sea”) have been used. The swell (with a very low wave steepness in the range of
sp = 0.0005 to 0.0025) has been incorporated by treating the swell as a water level increase leading to a fictitious lower freeboard. The resulting expression is as follows:
where
Hm0 is the spectral significant wave height of the wind waves (“sea”),
Hm0−Swell is the spectral significant wave height of the swell, and
ξm−1,0 is the breaker parameter based on the wind waves (“sea”). This expression is considered valid only for swell conditions with a wave steepness of
sm−1,0 ≤ 0.005 or
sp ≤ 0.005. As mentioned previously, the bias of the measured discharge was incorporated by changing the coefficient
c1 from 4.75 to 3.45. For practical applications, it is advised to use the coefficient 4.75 since this coefficient appeared to be optimal for all available data for sloping structures. The coefficient
c2 was calibrated based on the present data-set:
c2 = 0.5.
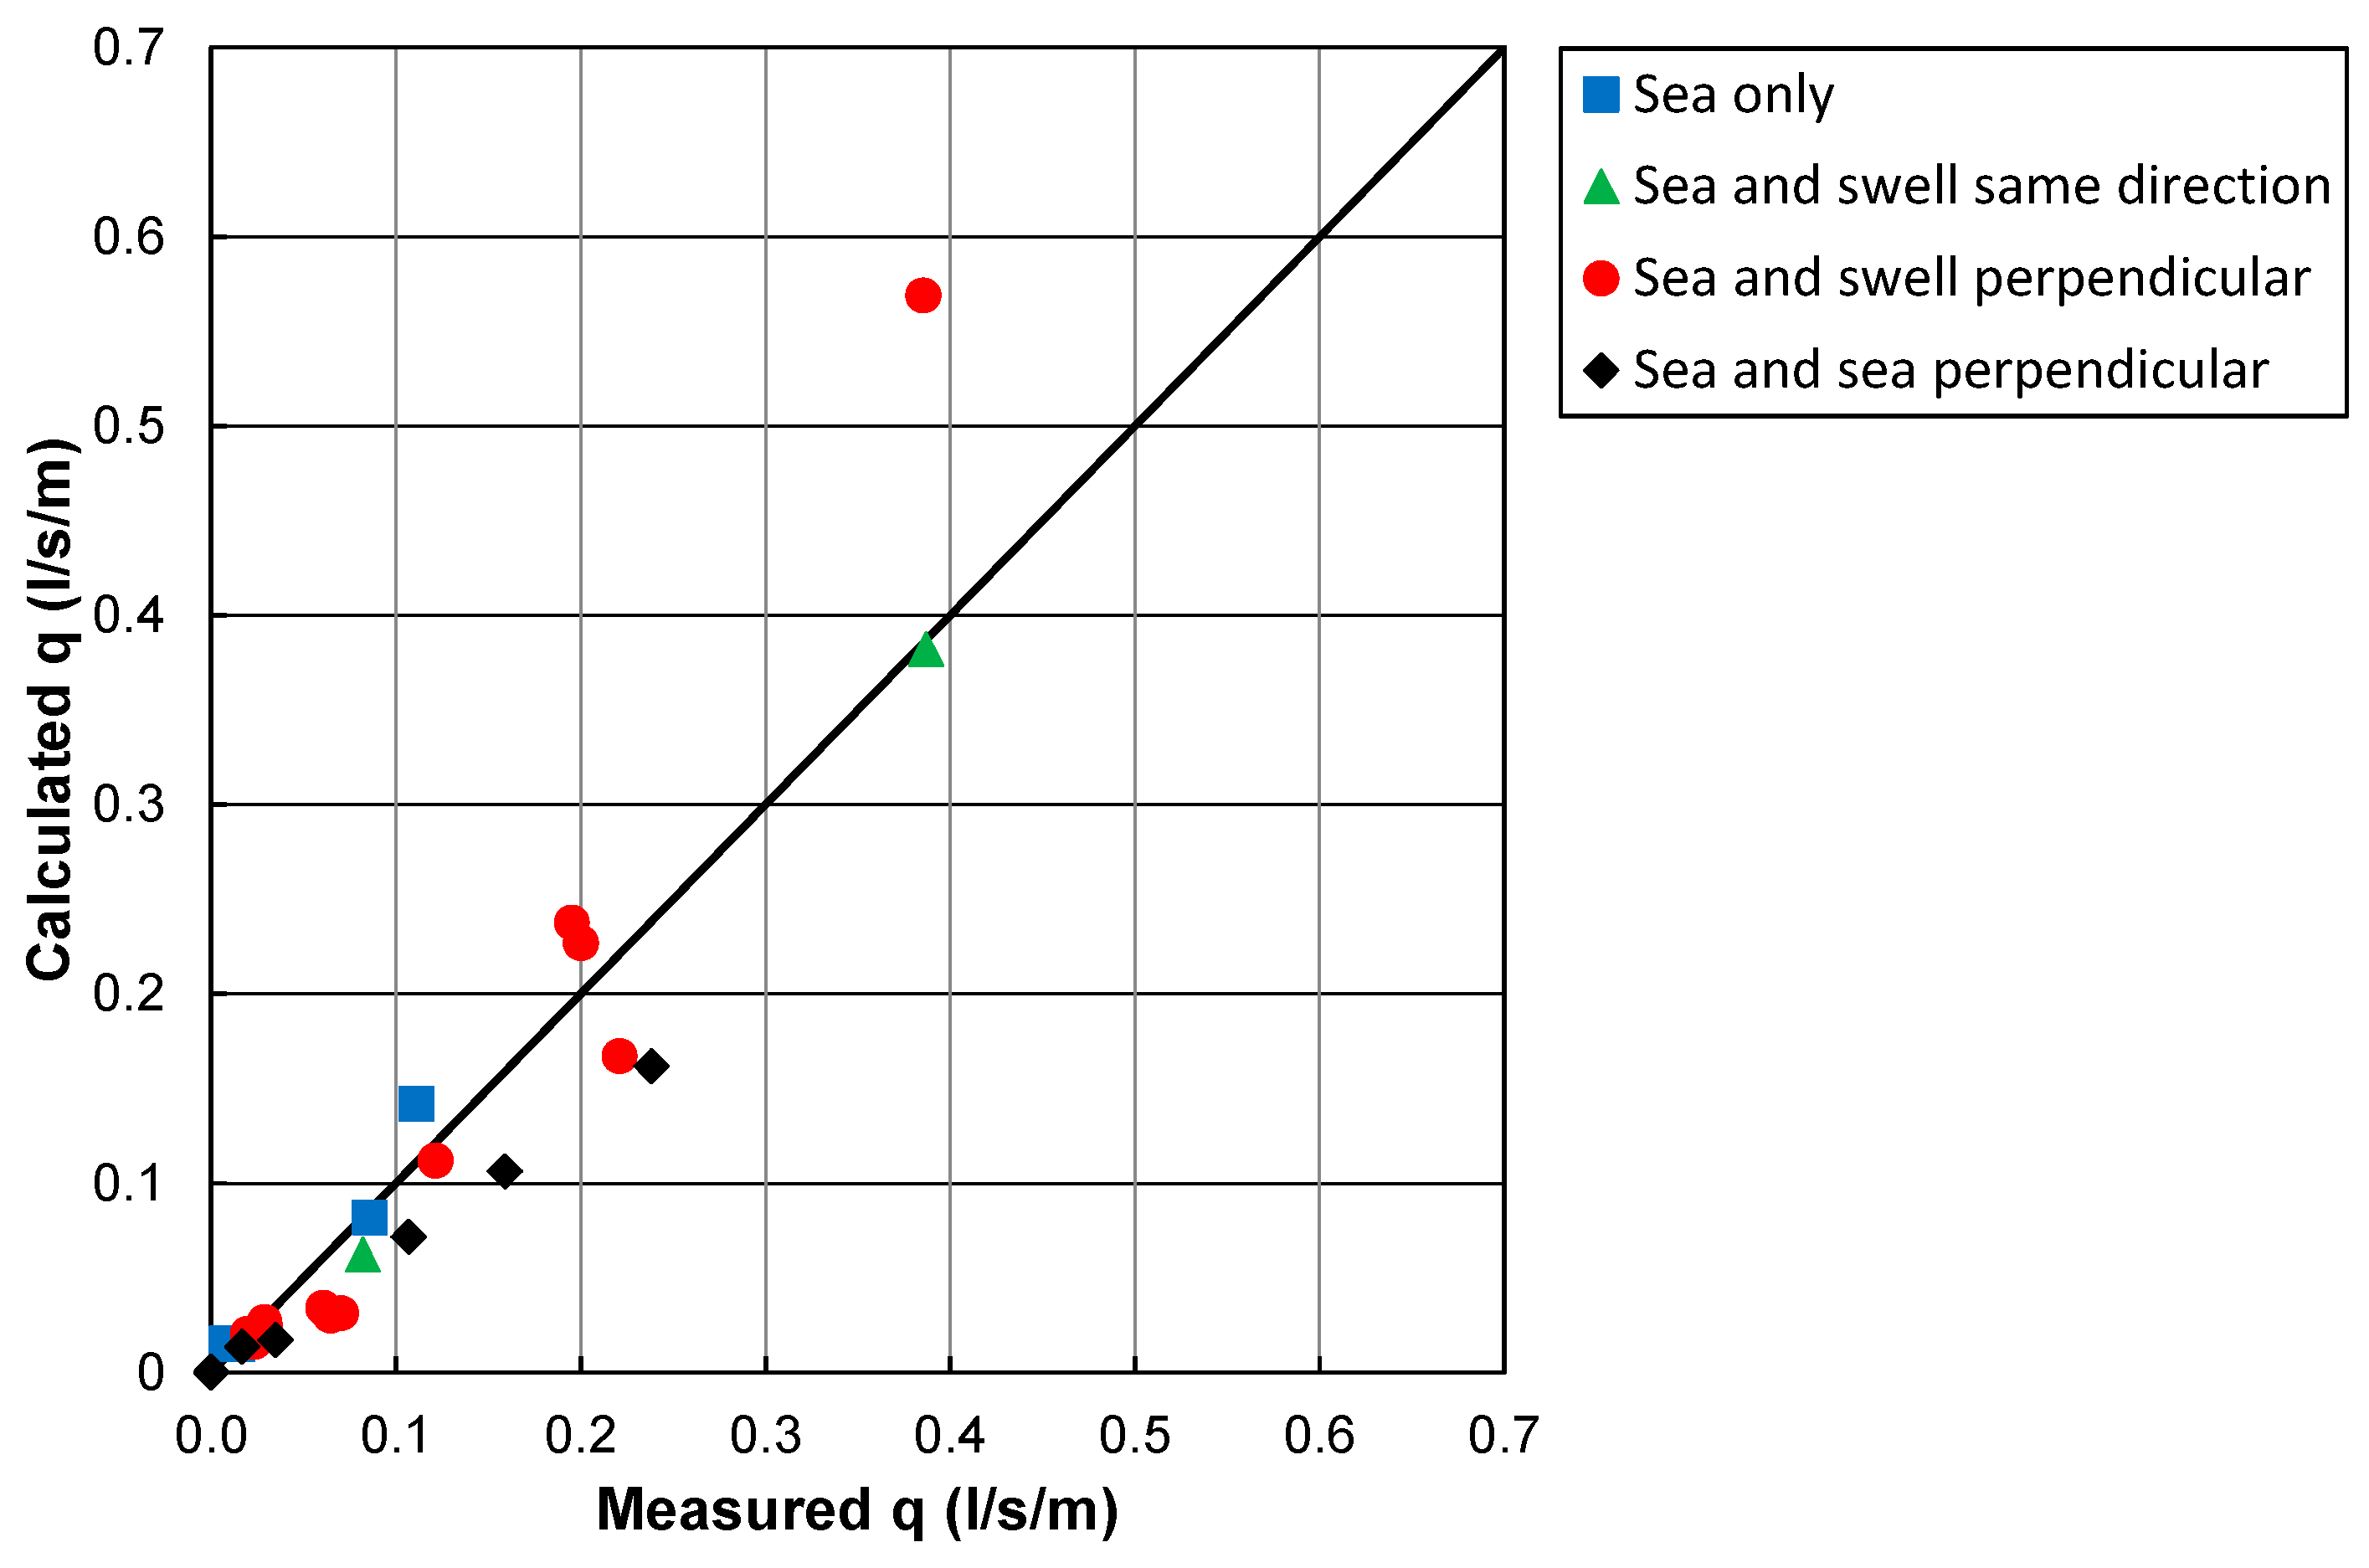
Figure 6 shows the calculated versus the measured overtopping discharges on a linear scale, for each of the four types of wave loading. This figure confirms that the presence of swell leads to more overtopping and that Equation (12) accounts for this increased overtopping due to swell (with a low wave steepness). Two sea states with waves from two different directions (i.e., 45° and −45°, denoted by black diamonds in
Figure 6) lead to somewhat larger overtopping discharges compared to waves from one direction (i.e., 45°, denoted by blue squares in
Figure 6). The differences are in the order of magnitude of 35% (i.e., 35% more overtopping for these crossing sea states than for wind waves from one direction only). This additional overtopping can be incorporated in Equation (12) by adding a fifth influence factor with a value of
γ# =1.05 for crossing sea states to the four reduction factors
γ. However, it remains unknown to what extent the additional overtopping discharge for crossing sea states depends on the wave angle of both sea states.
Equation (12) is an extension of Equation (1) to account for swell conditions. Compared to Equation (1), Equation (5) is a slightly different expression based on [
5]. Within the range of the tested single sea states, Equation (5) leads to very similar results compared to Equation (1) for single sea states. Nevertheless, Equation (5) can also be extended to account for swell waves in the same way as Equation (1) was extended to Equation (12). Equation (13) shows the extension of Equation (5) to account for swell waves:
As mentioned before the bias of the measured discharge can be incorporated by changing the coefficient
c1 (here from 3.6 to 2.7). For practical applications it is advised to use the coefficient 3.6 since this coefficient appeared to be optimal for all available data for sloping structures. The coefficient
c2 was calibrated based on the present data-set:
c2 = 0.5.
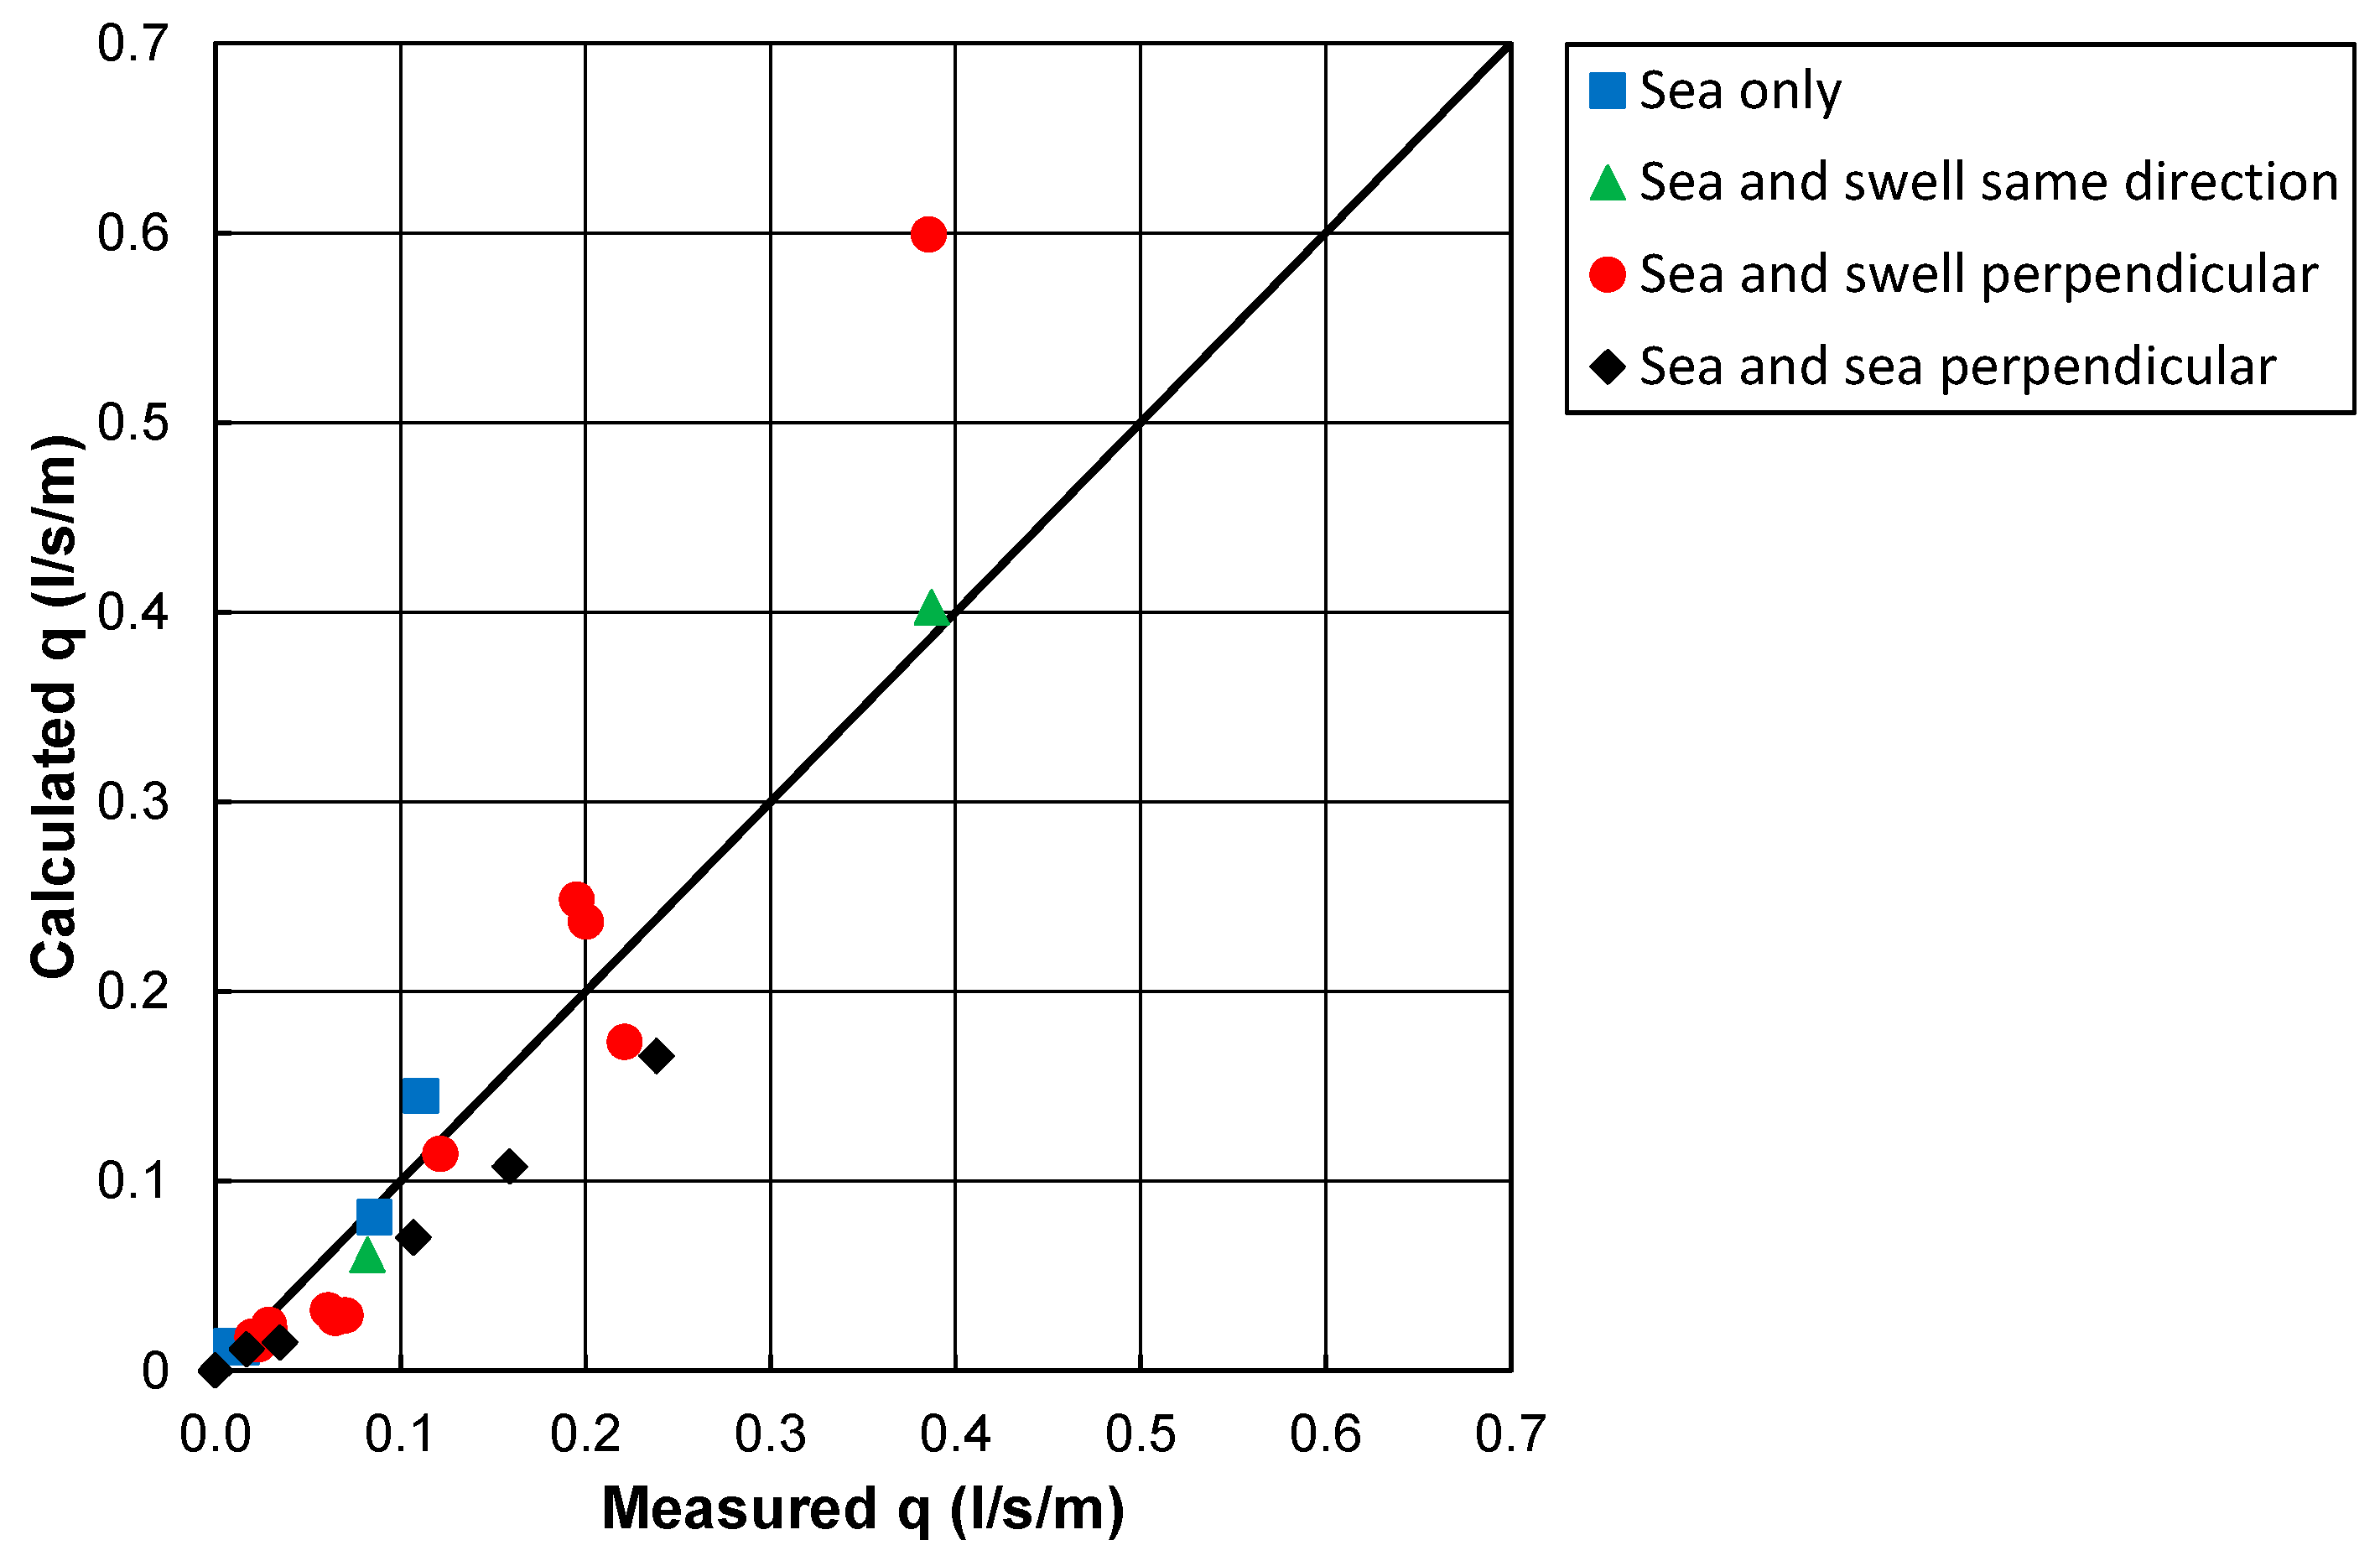
Figure 7 shows the calculated versus the measured overtopping discharges on a linear scale, for each of the four types of wave loading. Since the performance of the original Equations (1) and (5) for single sea states is very similar in the tested range, also the performance of the extended Equations (12) and (13) to account for swell waves, is similar (i.e., the differences between
Figure 6 and
Figure 7 are small).
4. Conclusions, Recommendations, and Future Research
Wave overtopping over dikes with oblique wind and swell waves has been studied by performing physical model tests with various types of wave loading. The analysis of the test results shows that the presence of swell (with a low steepness; sm−1,0 ≤ 0.005 or sp ≤ 0.005) leads to more wave overtopping. This effect has been accounted for in new empirical formulae for the mean wave overtopping discharge. The direction of these swell waves with a low steepness (same direction as wind waves or perpendicular to wind waves) is less relevant for wave overtopping discharges. Two sea states with wind waves from two different directions (i.e., β = 45° and β = −45° in the present tests) seem to lead to somewhat larger overtopping discharges compared to wind waves from one direction only (i.e., β = 45° in the present tests). In our tests, this additional wave overtopping was about 35%, which can be represented by an influence factor for crossing seas of γ# = 1.05 in an empirical formulae. However, it remains unknown to what extent the additional overtopping for crossing seas depends on the wave angle of both sea states. If besides a certain sea state also a second wave field is present, a swell condition (with a low wave steepness) leads to more additional wave overtopping than a second wave field with the same wave height and a higher wave steepness).
Using the generally applied wave overtopping formula in [
4] as a basis, the extended wave overtopping formulae are as follows:
with a maximum of
where
ξm−1,0 is the breaker parameter based on the wind waves at the toe of the structure,
Hm0−Swell is based on the energy in the swell component (with peak wave periods that are a factor 3 or more larger than the peak wave period of the wind waves, and a wave steepness that is smaller than 0.005), and
γ# = 1.05 is to account for additional wave overtopping for situations in which two sea states approach the structure simultaneously under different angles (“crossing seas”). Since Equations (14) and (15) are extensions of a presently applied wave-overtopping formula for single sea states, the field of application of Equations (14) and (15) includes single sea states, crossing sea states, and sea states combined with swell.
Although Equations (14) and (15) are preferred, alternative expressions to estimate wave overtopping discharges are as follows:
with a maximum of
In the present study the bimodal waves with sea states that approach the structure under different angles indicate that such crossing seas lead to somewhat larger wave overtopping discharges than if waves approach the structure under one angle. Since only perpendicular sea states (i.e., β = 45° and β = −45°) have been tested it is advised to analyse the influence of crossing seas also for other wave angles. Since only long-crested waves have been studied it is advised to analyse also the influence of short-crested waves for such crossing seas.
Several influence factors are present in empirical overtopping formulae (e.g., friction, oblique waves, berms, crest elements, and crossing waves). These influence factors are based on physical model tests to quantify these influence factors. However, the combination of these influence factors has not been validated systematically and therefore the accuracy of the term
γb γf γβ γ# γν is unknown. It is advised to validate the combination of the various influence factors. As long as such a validation has not been performed, it is advised to apply a maximum influence of the reduction factors to wave overtopping
γb γf γβ γν ≥ 0.4 (as proposed in [
4]) to avoid too large reductions that have not been based on data.
In the present study the mean overtopping discharge has been studied. The interaction of waves from two different directions may also be of importance for individual overtopping events. It is advised to analyze such effects on volumes of individual overtopping waves and other parameters describing individual overtopping events like water layer thicknesses and velocities during overtopping events.


