Article

Anthropogenic and Natural Radiative Forcing: Positive Feedbacks

Independent Scholar, 96, rue du Port David, 45370 Dry, France
J. Mar. Sci. Eng. 2018, 6(4), 146; https://doi.org/10.3390/jmse6040146
Submission received: 24 October 2018 / Revised: 26 November 2018 / Accepted: 27 November 2018 / Published: 30 November 2018

Abstract

:
This article is based on recent work intended to estimate the impact of solar forcing mediated by long-period ocean Rossby waves that are resonantly forced—the ‘Gyral Rossby Waves’ (GRWs). Here, we deduce both the part of the anthropogenic and climate components within the instrumental surface temperature spatial patterns. The natural variations in temperature are estimated from a weighted sum of sea surface temperature anomalies in preselected areas of subtropical gyres representative of long-period GRWs. The temperature response to anthropogenic forcing is deduced by subtracting the climate component from the instrumental temperature. Depending on whether the inland regions are primarily impacted by latent or sensible heat fluxes from the oceans, positive feedbacks occur. This suggests that the lapse rate and the high troposphere cloud cover have a driving role in the amplification effect of anthropogenic climate forcing, while specifying the involved mechanisms.

1. Introduction

How changes in the earth’s surface temperature are influenced by solar irradiance is probably one of the greatest mysteries of modern climate science. However, accurate evaluation of the impact of climate forcing on the instrumental surface temperature T s is required to extract from the latter the response to anthropogenic forcing: this would remove doubts about its exact magnitude. On the other hand, the spatial pattern of the temperature response to anthropogenic forcing would be a source of information essential for understanding and quantifying the underlying positive feedbacks.
The archives of the past climate confirm that solar and orbital forcing are the main source of variability of the climate (e.g., [1,2,3,4,5,6,7,8,9,10]). However, a positive feedback loop amplifies the effects of the insolation gradient on the climate system and a resonance phenomenon occurs, filtering out some frequencies in favor of others. If climate changes are responses to external forcing mechanisms, they are, however, largely regulated by the processes of oceanic heat transfer (e.g., [11,12,13,14,15,16]). Recent research shows that solar and orbital forcing are mainly mediated by long-period ocean Rossby waves that are resonantly forced, the gyral Rossby waves (GRWs), which is supported by both theoretical and observational studies [17,18]. Besides, surface temperatures essentially reflected the signatures of GRWs before the 1970s, which is attested by their strong variations that occurred between 1930 and 1950 without being related to anthropogenic forcing straightforwardly.
Within this work, new avenues of research are explored on the amplifying effects acting on the anthropogenic climate forcing. From the gridded (5° × 5° resolution) instrumental data, the anthropogenic component in surface temperature since 1970 will be estimated, taking into account the natural variability of this surface temperature. This will be deduced from the analysis of instrumental temperatures before 1970 by fitting the variations observed from a combination of the sea surface temperature (SST) anomalies at areas particular to each ocean, reflecting the persistence of the vertical thermal gradient induced by the corresponding GRWs. From the spatial pattern of the temperature response to anthropogenic forcing, the nature of the positive feedback loop responsible for amplification processes will be inferred.

2. Gyral Rossby Waves (GRWs)

This paragraph is a preamble to what will be exposed in the results section. Based on previous papers recently published, the climatic implications of GRWs are exposed, without which the rest of the paper would be inapprehensible.

2.1. A New Concept

Variations of the vertical thermal gradient in the upper ocean at midlatitudes that are known to have a direct effect on global climate [17] are a consequence of a mechanism of much greater scope involving the resonance of long-period Rossby waves wrapping around the subtropical gyres [18,19]. Specifically, the theoretical foundations of Gyral Rossby Waves (GRWs) are laid, supported by the observation of long-term SST anomalies around the North Atlantic subtropical gyre. Concerning the past climate, GRWs are a new concept that allows us to explain from proven physical bases the transition problem, variations in the forcing efficiency, and how some resonance frequencies are filtered out in favor of others.
As a result of their annular structure, GRWs are subject to a positive feedback loop in which solar and orbital forcing induce an increase in the magnitude of the oscillation of the pycnocline. The speed of the steady anticyclonically wind-driven circulation being higher than the phase velocity of cyclonically propagating Rossby waves, amplified forcing effects occur. Lowering of the pycnocline and acceleration of the convergent radial current while the intensity of forcing increases make the GRWs behave as a heat sink because of downwelling. Half a period later, uprising of the pycnocline and acceleration of the divergent radial flow while forcing intensity is decreasing make the GRWs restore the accumulated heat: they then act as a heat source due to upwelling. The positive feedback results from the acceleration or the deceleration of the polar geostrophic current, in phase with the pycnocline oscillation. Indeed, the western boundary current carries more or less heat from the tropics toward the poles, which, in turn, amplifies the pycnocline oscillation.
Multifrequency GRWs, sharing the same modulated geostrophic current where the western boundary current leaves the continent to re-enter the interior flow of the subtropical gyre, are coupled. Consequently, as occurs in the general case of coupled oscillators with inertia, they are subject to a subharmonic mode locking giving the dynamic system an optimal stability [18]. Resonance phenomena may then occur when the natural period of GRWs is tuned to the period of solar and orbital forcing, as a result of drifting of the centroid of the gyres. In this way, GRWs influence the variations of the vertical thermal gradient in the upper ocean at midlatitudes, producing SST anomalies [17].
The natural periods of GRWs are integer numbers of years which are deduced by recurrence [18]. To the long periods corresponds an integer number of turns made by the GRW around the gyre (anticyclonically) during half a period. This number of turns is the subharmonic mode. For the 128-year period, the gyral Rossby wave travels 2 turns, except in the South Pacific where it is 1 and the south of the Indian Ocean where it is 3/2.

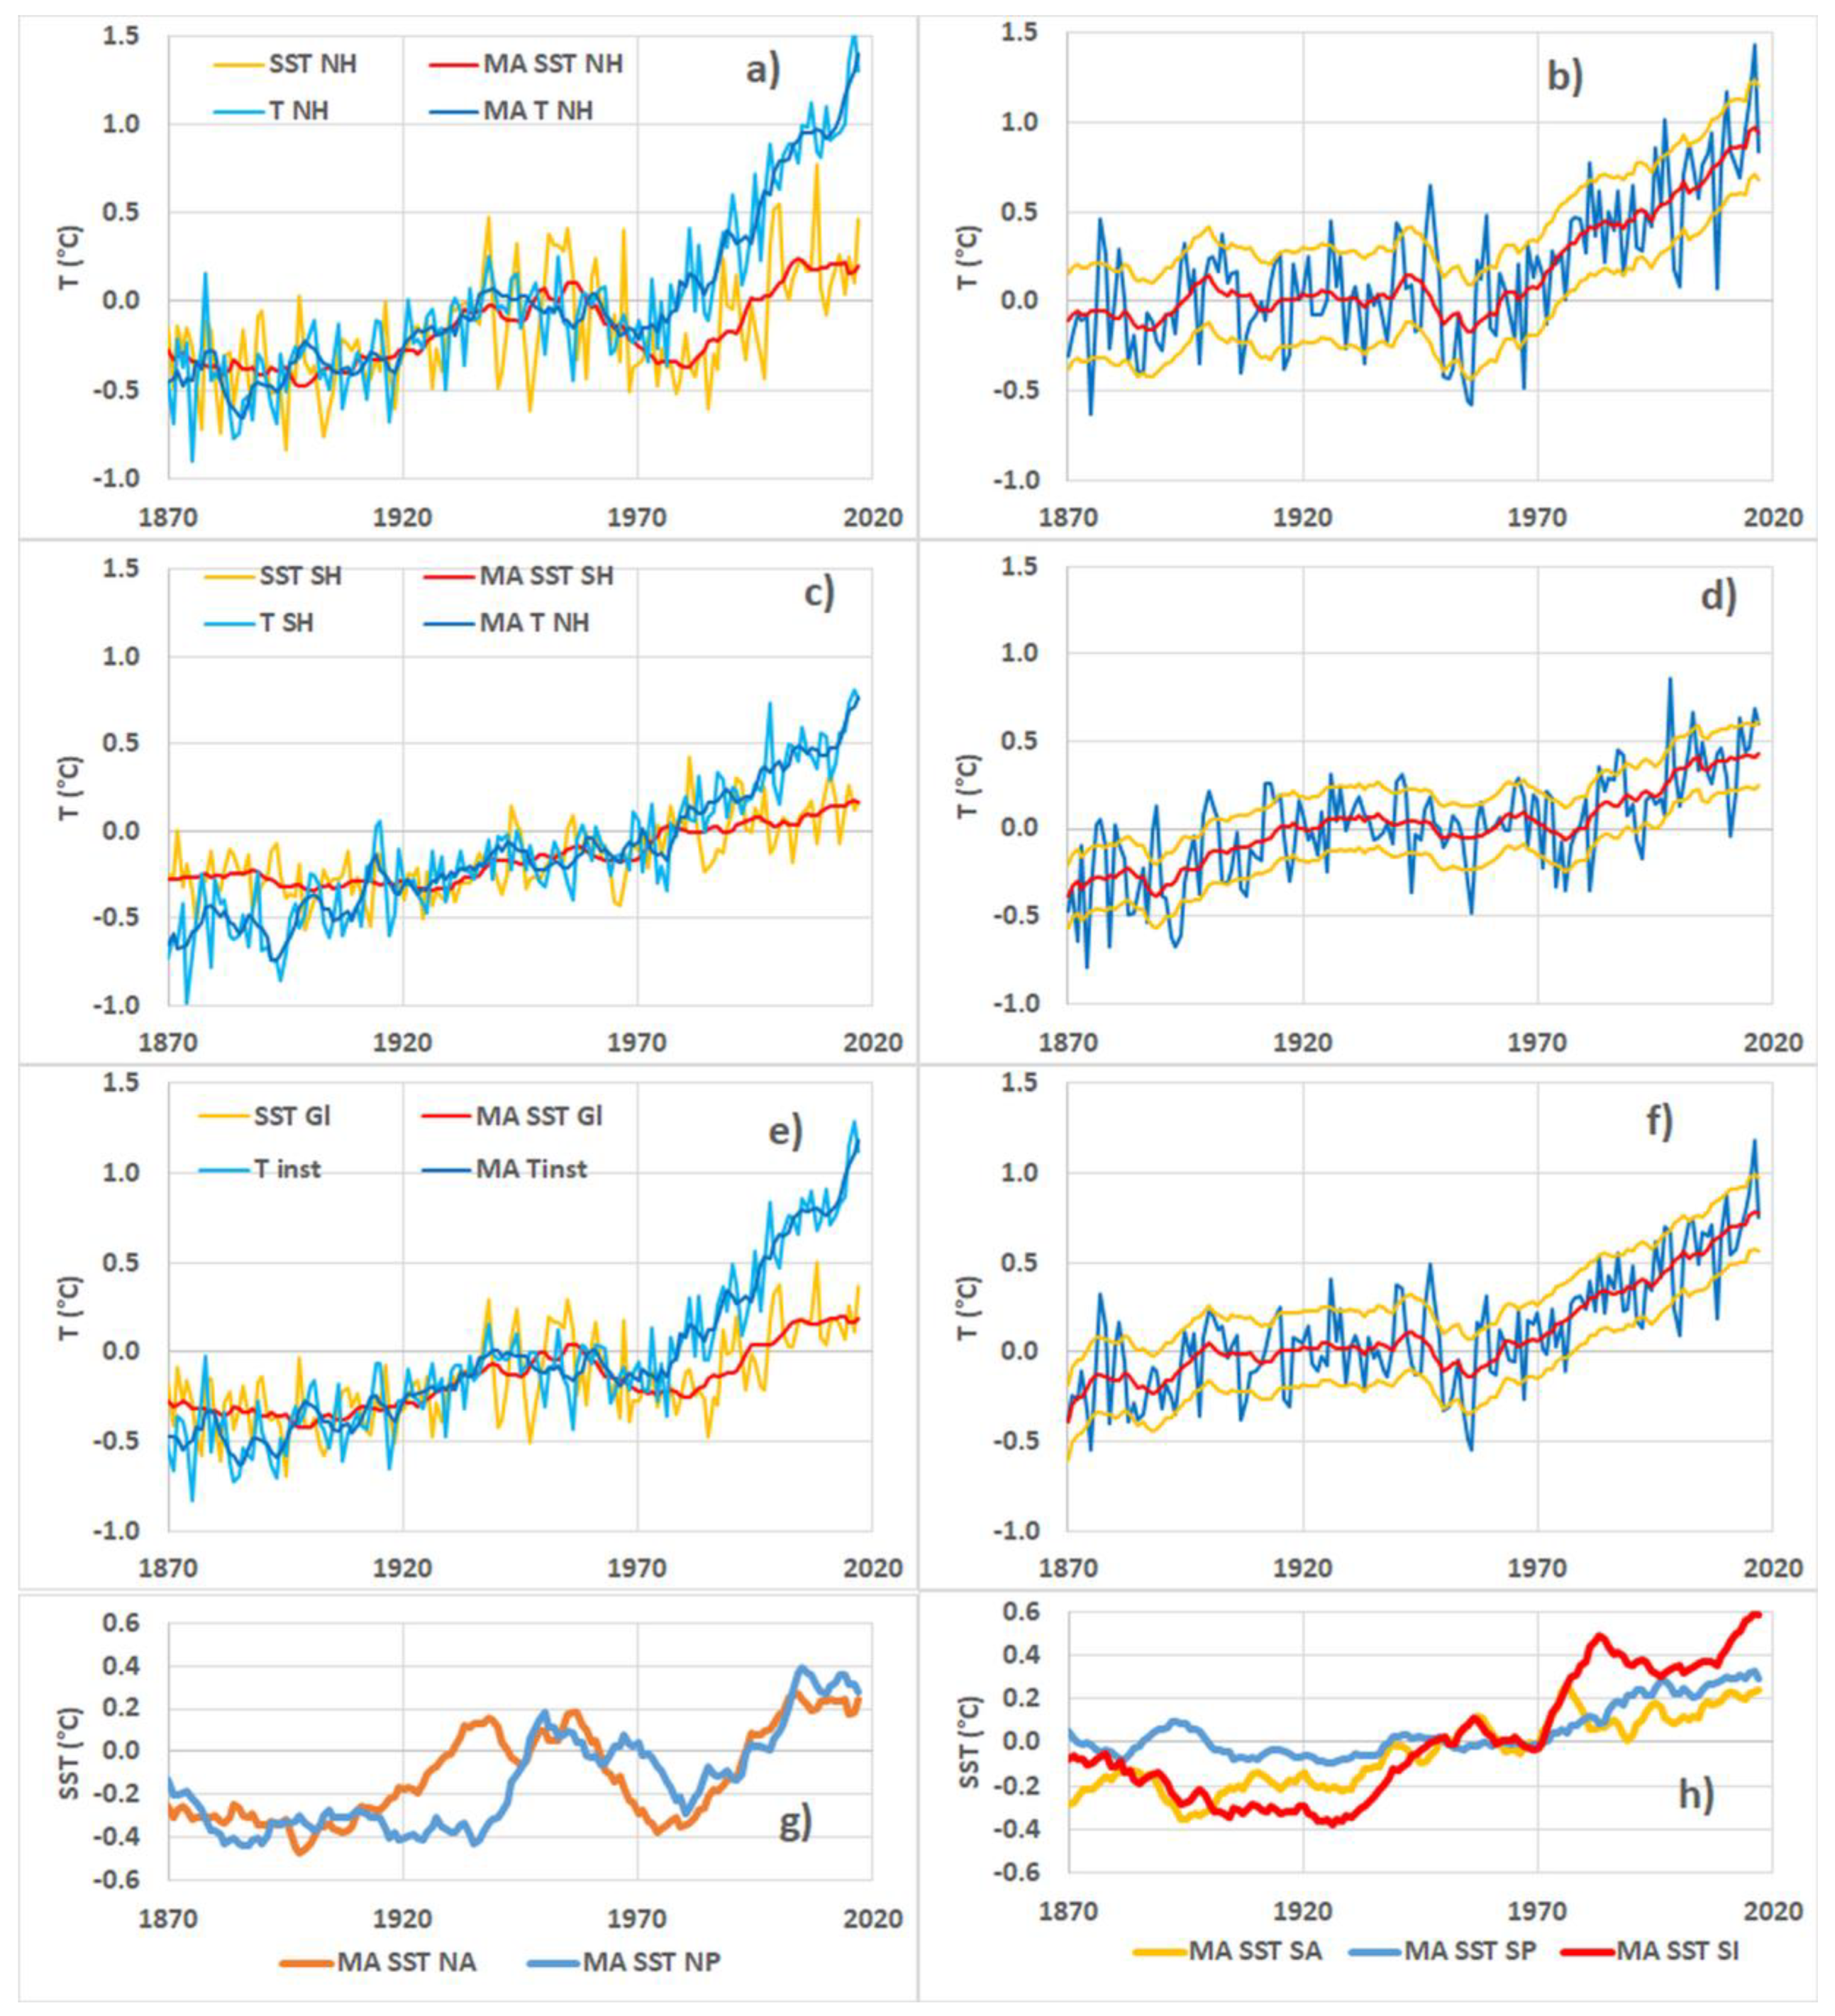
2.2. Estimate the Part of the Climate Component within the Instrumental Surface Temperature T s

The climate component of temperature is calculated by considering the unperturbed state of the global climate system for which the average energy captured by the Earth is completely re-emitted in space. This supposes that the energy transfers are averaged over one or even several years to remove imprints of transient phenomena that cause an imbalance in energy budget during the annual cycle, for example, the formation of sea ice during the winter followed by its melting during the summer. Furthermore, the anthropogenic forcing causes a slow drift in the radiative balance of the undisturbed state, without jeopardizing it as a result of transient alterations of the climate system.
Then, the perturbed state resulting from the imbalance in energy budget due to heat transfer toward high latitudes of the gyres behaves, which concerns ocean–atmosphere exchanges, like a quasi-isolated thermodynamic system [17]. This is because thermal exchanges are mainly ruled by latent and sensible heat fluxes. Indeed, the difference in radiative fluxes between the surface of the gyres and that of the surrounding ocean is very low in comparison with other heat fluxes. This implies that the heat dissipated at the ocean–atmosphere interface at midlatitudes is conserved on a planetary scale. Compared to the undisturbed system, the perturbed state of the system tends to a new steady state in which a new thermal equilibrium occurs between the sea surface perturbation ΔT and the continents. Due to its persistence, which reflects the renewal of the mixed layer at high latitudes of the gyres while maintaining the vertical temperature gradient, ΔT tends to balance with the surface temperature perturbation of the continents.
It should be noted that the gyres can only be considered as thermally quasi-isolated in the context of ocean–atmosphere exchange. There are very strong poleward heat transports in the oceans with substantial differences between the fluxes at the northern and southern boundaries, as has been shown in the North Atlantic Ocean [20]. But heat transfer mainly occurs where the polar current partly leaves the gyre to form the drift current flowing poleward.

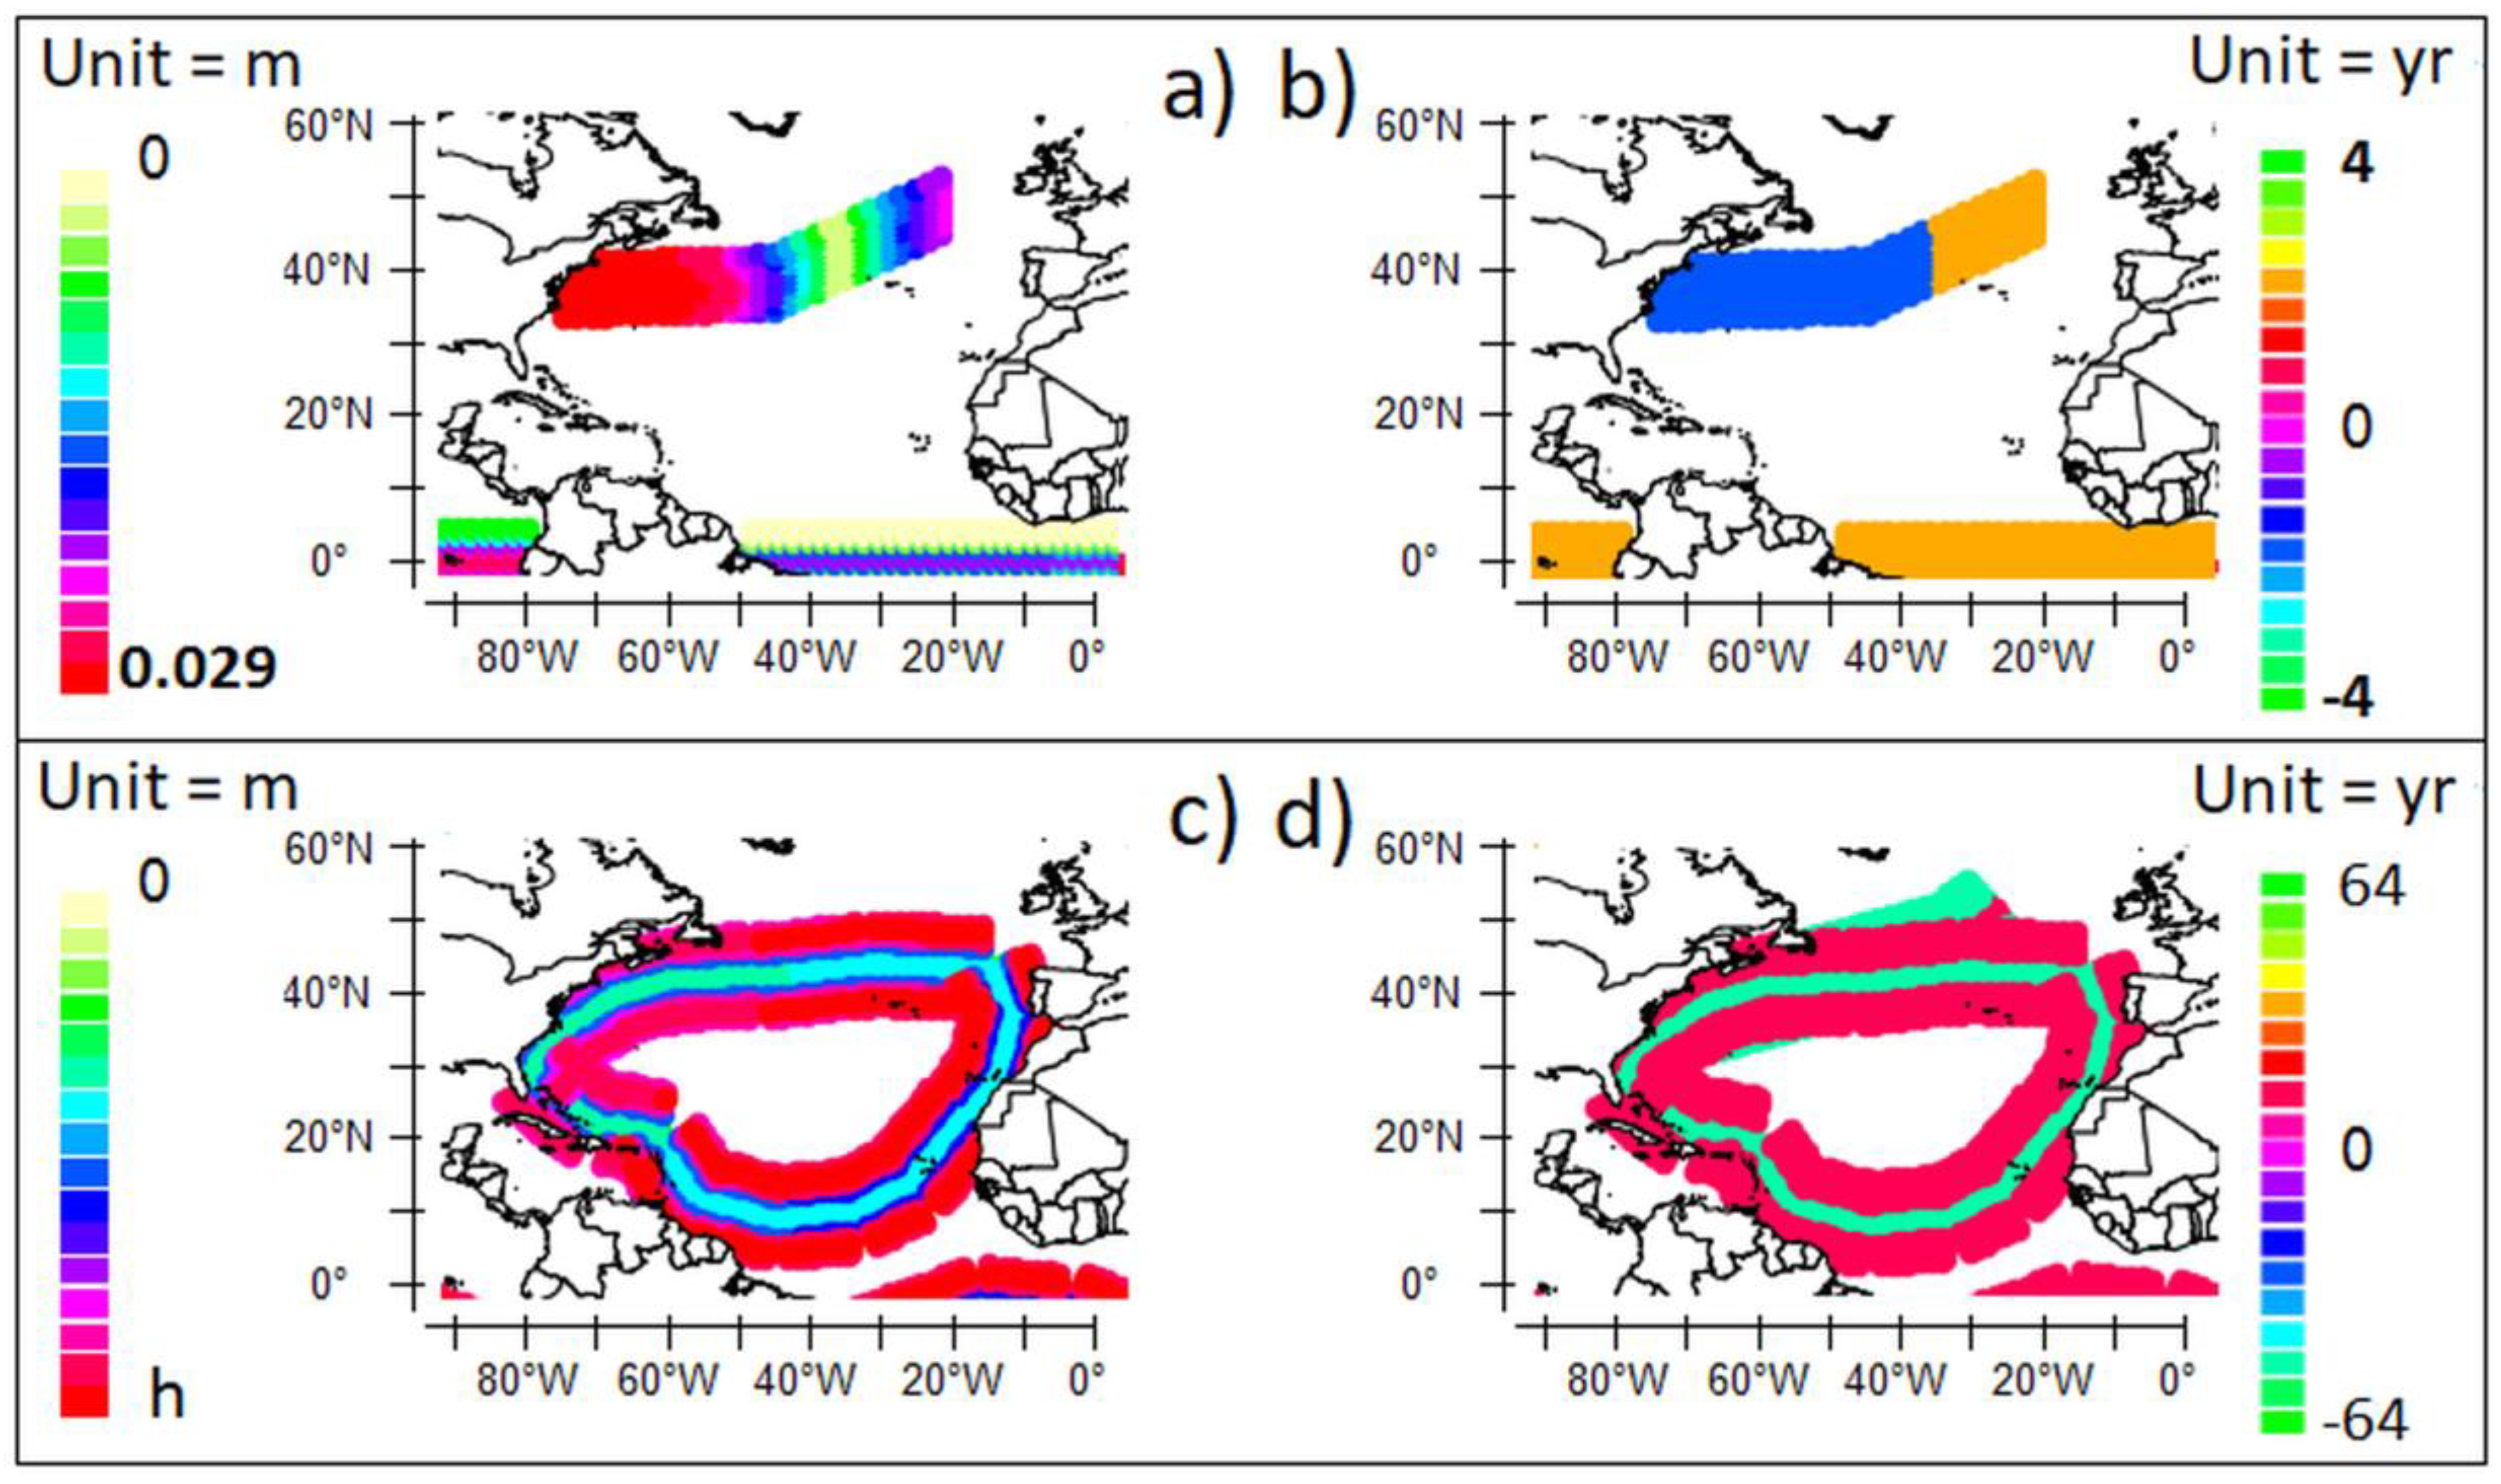
2.3. Oceanic Signatures

The impact on climate of the sea surface perturbation ΔT, which reflects the persistence of the vertical thermal gradient, either reinforces or, on the contrary, reduces evaporation. This results from atmospheric baroclinic instabilities that may lead to the formation of cyclonic systems. Because baroclinic instabilities of the atmosphere are most active when the resulting synoptic-scale eddies are stimulated and guided by the subtropical jet streams, SST anomalies are located at high latitudes of the gyres around 40°. They have to be representative of long-period GRWs, which correspond to high subharmonic modes [18], to accurately reflect the persistence of their continental replicas. Representativeness of SST anomalies requires that the areas from which they are averaged are as small as possible not to integrate short-term exchanges. Indeed, the thermal balance between oceanic and continental perturbations requires several years to occur. In this way, the short-period thermal imprints on the continents are evanescent, and only the long-period imprints can reach thermal equilibrium.
Short-term and long-term exchanges are governed by short-wavelength and long-wavelength GRWs, respectively (Figure 1). Internal antinodes (along the gyre, as opposed to external antinodes outside the gyre) of short-wavelength GRWs extend from where the western boundary current leaves the coast to the bifurcation of the recirculating, wind-driven current of the gyre and the drift current leaving the gyre. Internal antinodes of long-wavelength GRWs extend all around the gyres so that areas representative of persistent exchanges are necessarily located to the east of the short-period internal antinodes.
To each ocean SST anomalies exhibit particular signatures that reflect the amplitudes of the different subharmonic modes of GRWs. Areas from which they are averaged are defined to best represent the global surface temperature T ¯ s on each of the hemispheres before the temperature response to anthropogenic forcing was dominant. This is achieved from a weighted sum of SST anomalies of the various subtropical gyres. Despite being averaged over the relevant areas, the SST anomalies remain noisy, which reflects the extreme complexity of exchanges at the ocean–atmosphere interface. Convective processes, which are ruled by the vertical thermal gradient of the upper ocean, heat the surface of the ocean. This stimulates evaporation, producing a cooling of the surface. So the SST results from two phenomena whose effects are antagonistic, which makes its measurement chaotic while being strongly correlated over a grid whose mesh size is 1° × 1°.
In both hemispheres, the weights associated with the SST anomalies are estimated by using the least squares method, that is, by minimizing the sum of the squares of the differences between the mean surface temperatures T ¯ s and the resultant SST anomaly. In the northern hemisphere, w N A S S T N A + w N P S S T N P + C s t = T ¯ s with w N A + w N P = 1 where the indexes NA and NP represent the north subtropical gyres of the Atlantic and the Pacific, respectively. An equivalent relationship is used for the southern hemisphere, w S A S S T S A + w S P S S T S P + w S I S S T S I + C s t = T ¯ s with w S I + w S A + w S P = 1 where the indexes SA, SP, and SI refer to the south subtropical gyres of the Atlantic, the Pacific and the Indian oceans, respectively. The purpose of the constant C s t is to have the same reference for both SSTs and T ¯ s .
Areas that achieve the best compromise to meet both the representativeness and the accuracy of the SST anomalies are displayed in Figure 2. Their size is 10° in longitude by 3° in latitude, so that they are located approximately midway between the western and eastern boundaries of the oceans. They are located [36° N, 39° N] × [30° W, 40° W] in the North Atlantic, [30° N, 33° N] × [170° E, 180° E] in the North Pacific, [39° S, 42° S] × [16° W, 26° W] in the South Atlantic, [39° S, 42° S] × [120° E, 130° W] in the South Pacific, and [39° S, 42° S] × [79° E, 89° E] in the South Indian Ocean.
In Figure 3, the weighted sums of SST anomalies are averaged over the northern hemisphere w N A = 0.75 ,   w N P = 0.25 (a,b), the southern hemisphere w S A = 0.45 , w S P = 0.40 , w S I = 0.15 (c,d) and both hemispheres (global) w N A = 0.50 ,   w N P = 0.17 ,   w S A = 0.15 , w S P = 0.13 , w S I = 0.05 (e,f). The time interval on which the fitting is performed is 1900–1970. Before 1900, errors on instrumental temperature increase. After 1970, the temperature response to anthropogenic forcing grows almost linearly, which makes the method no longer meaningful (Figure 3b,d,f). Oceanic signatures are displayed in Figure 3g,h.

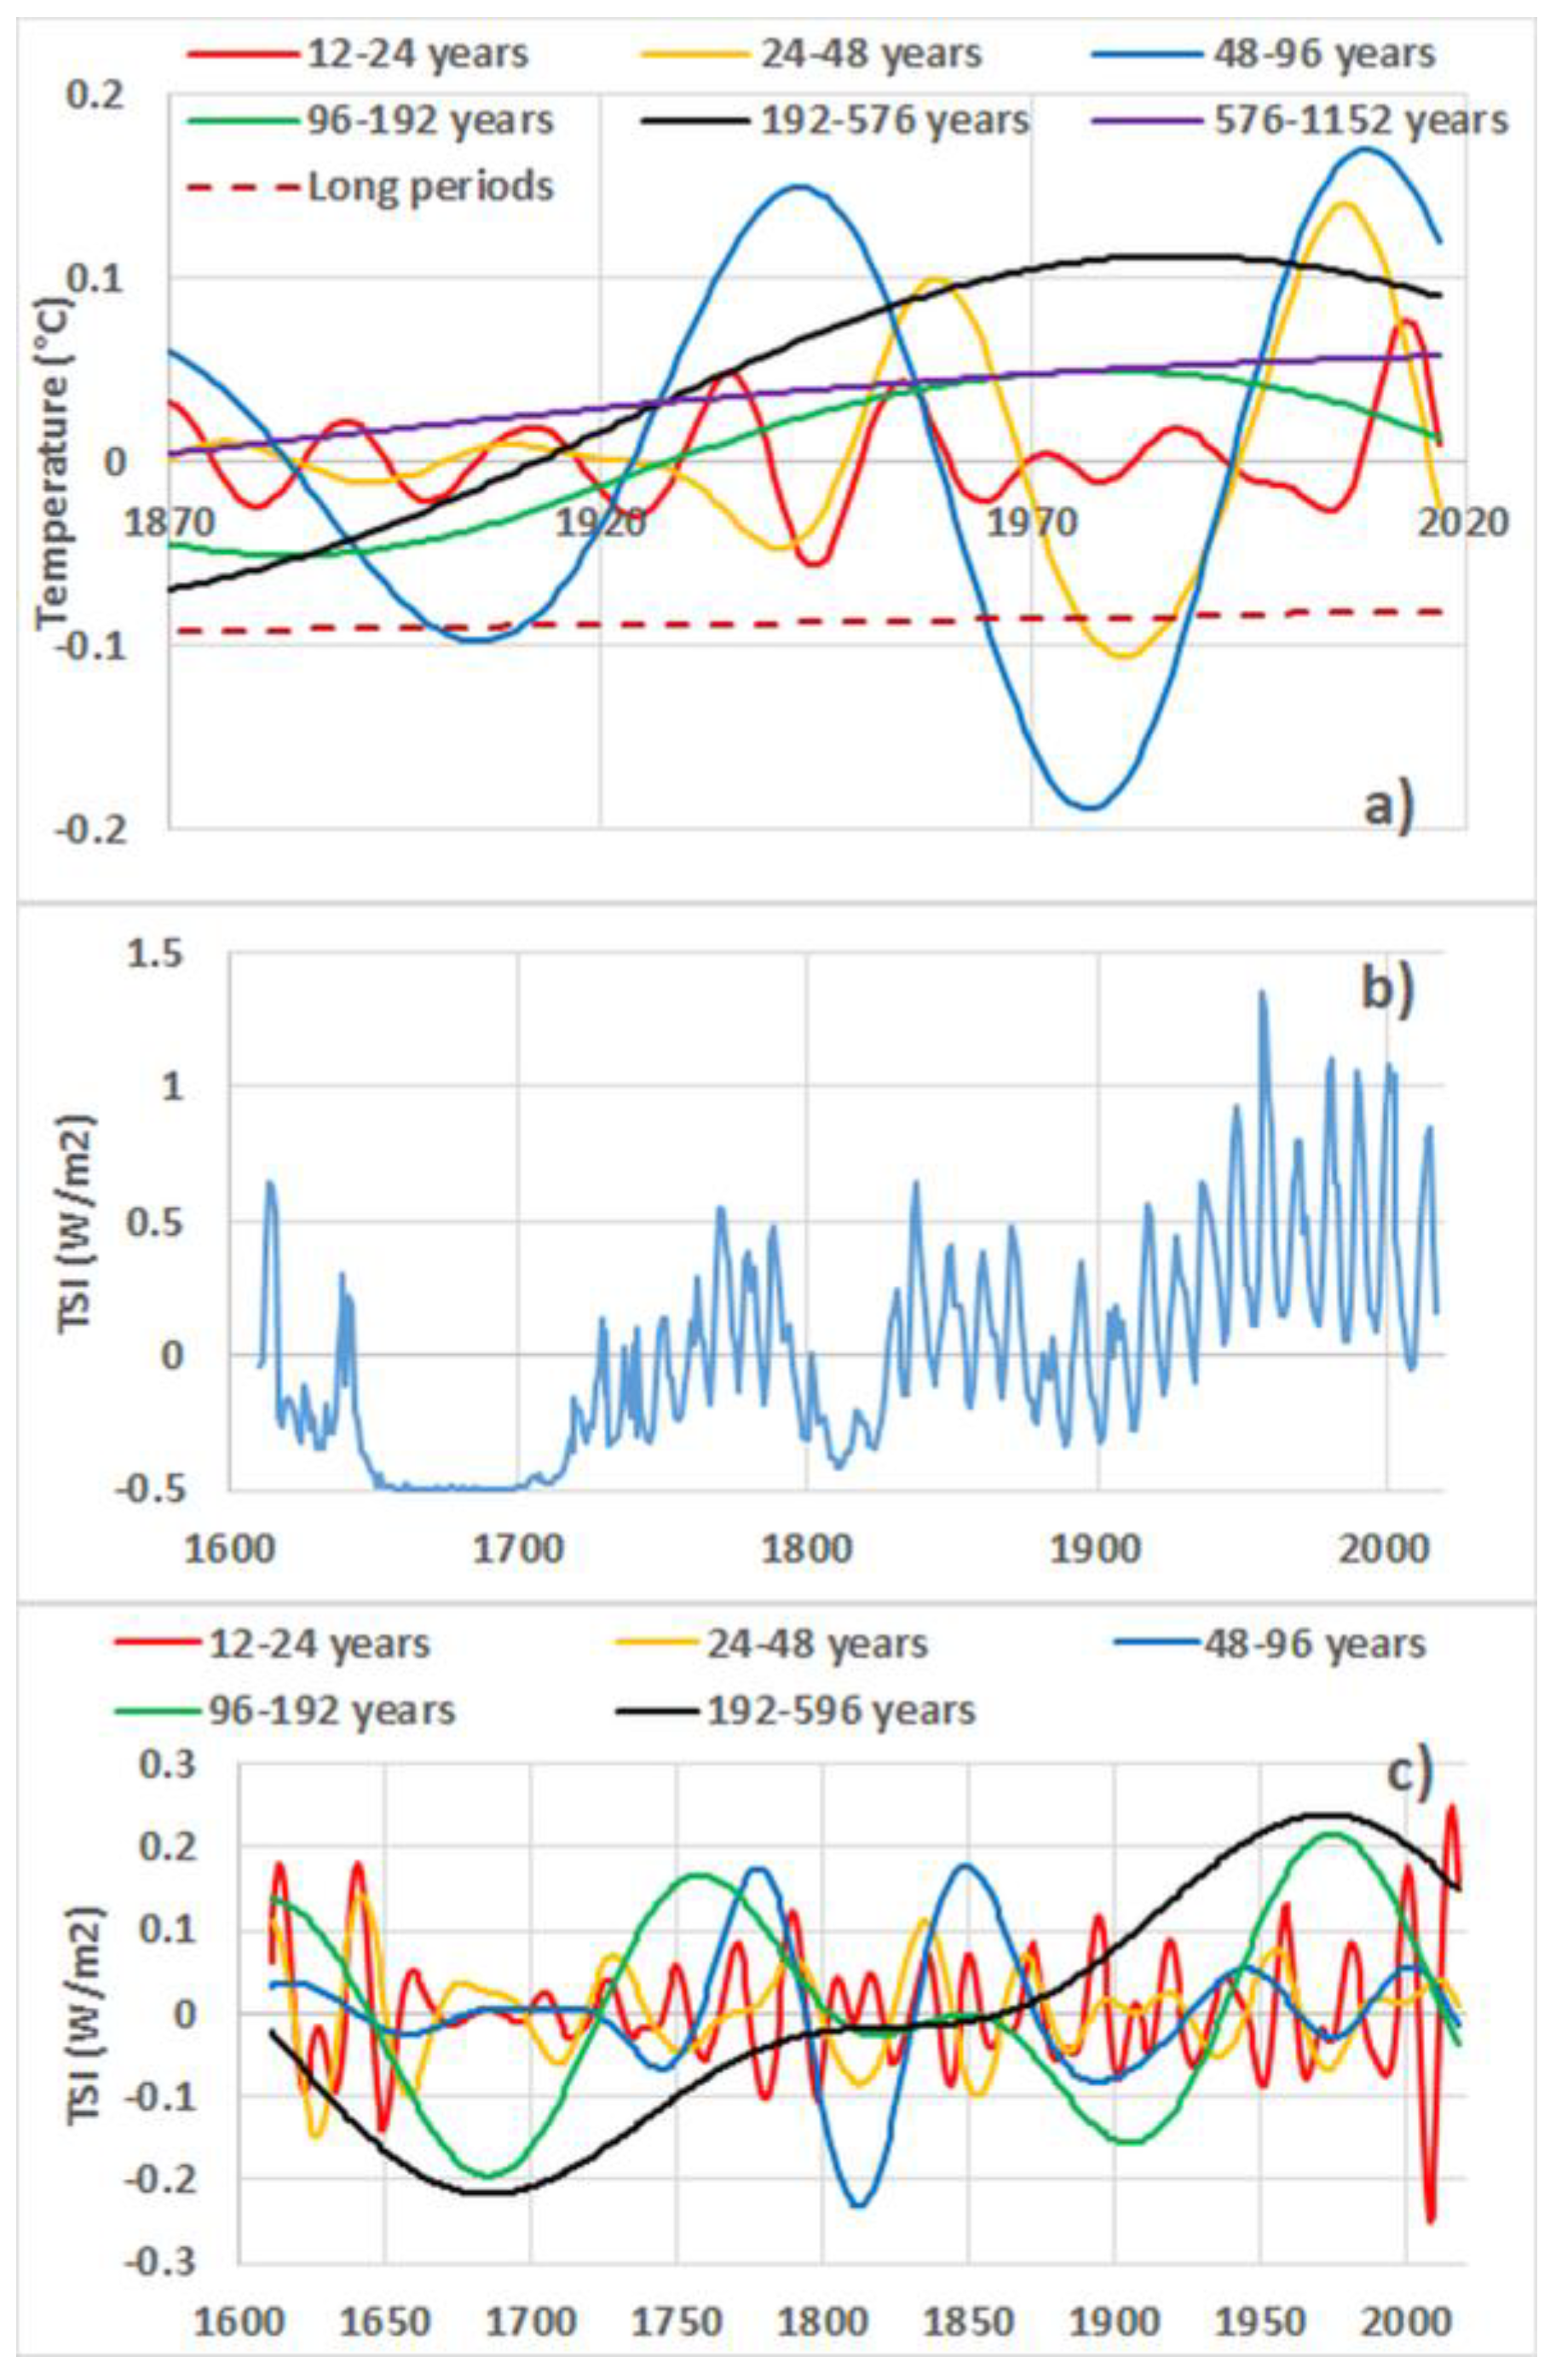
2.4. Subharmonic Modes
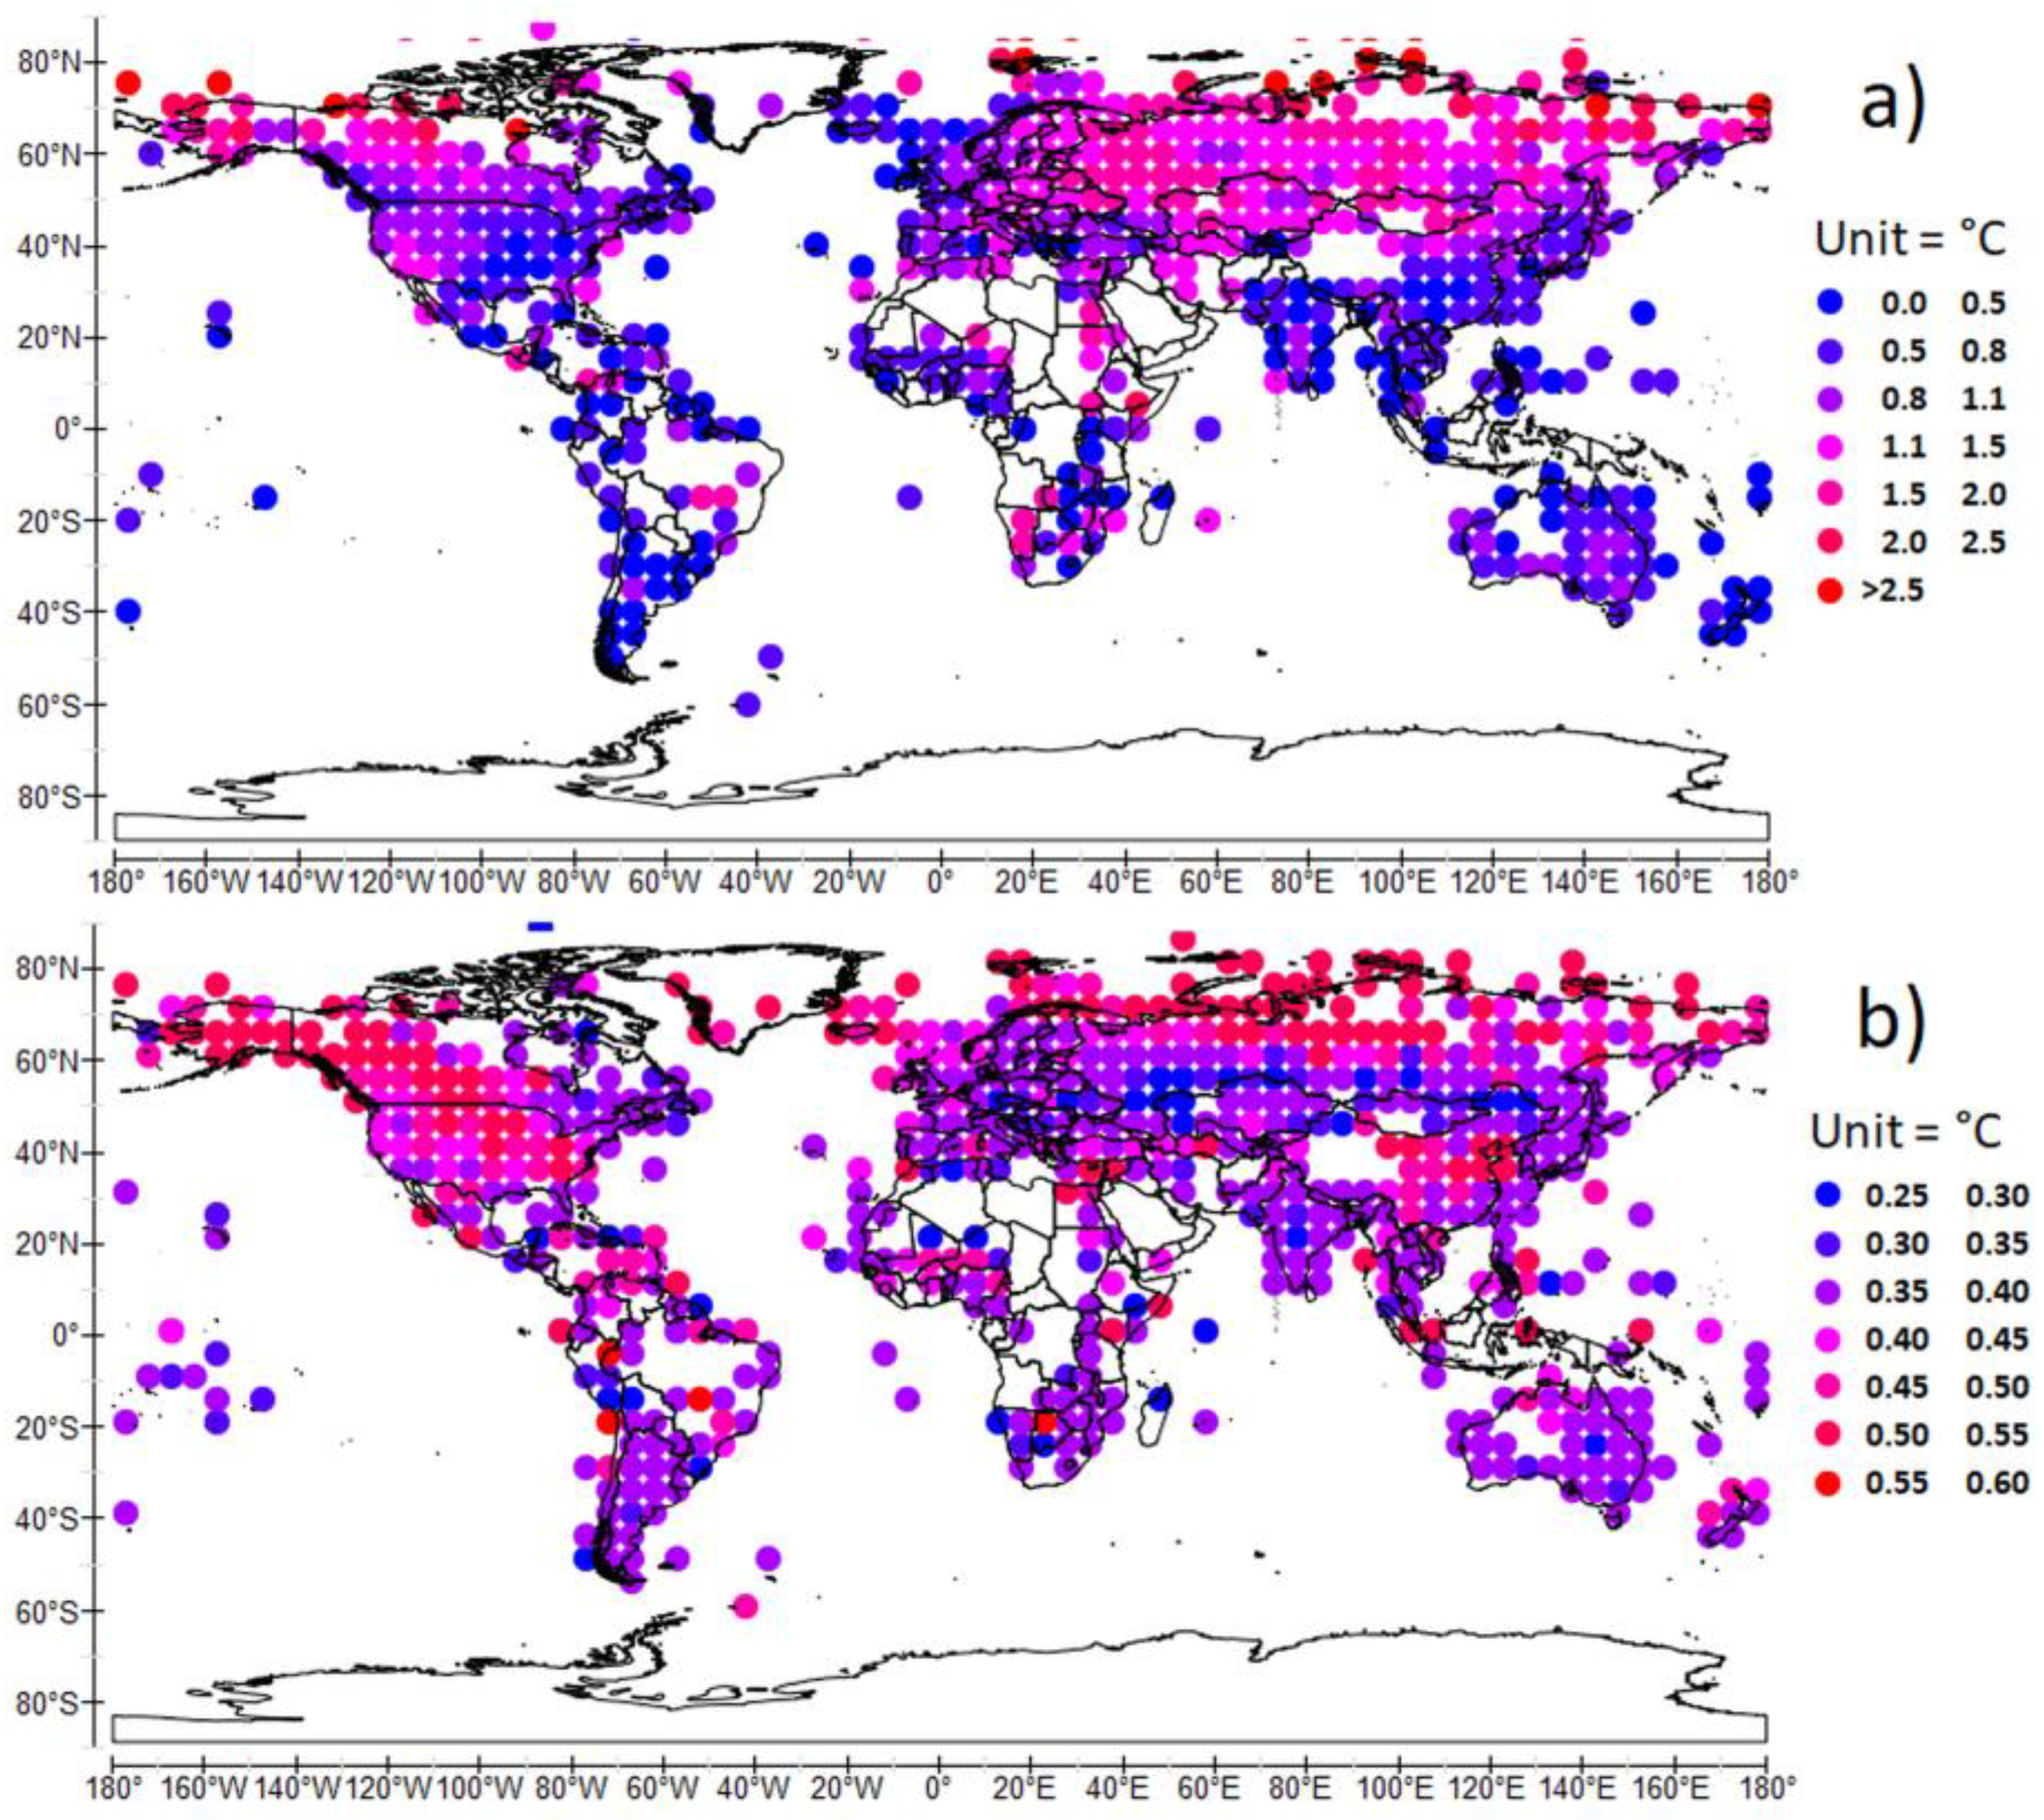
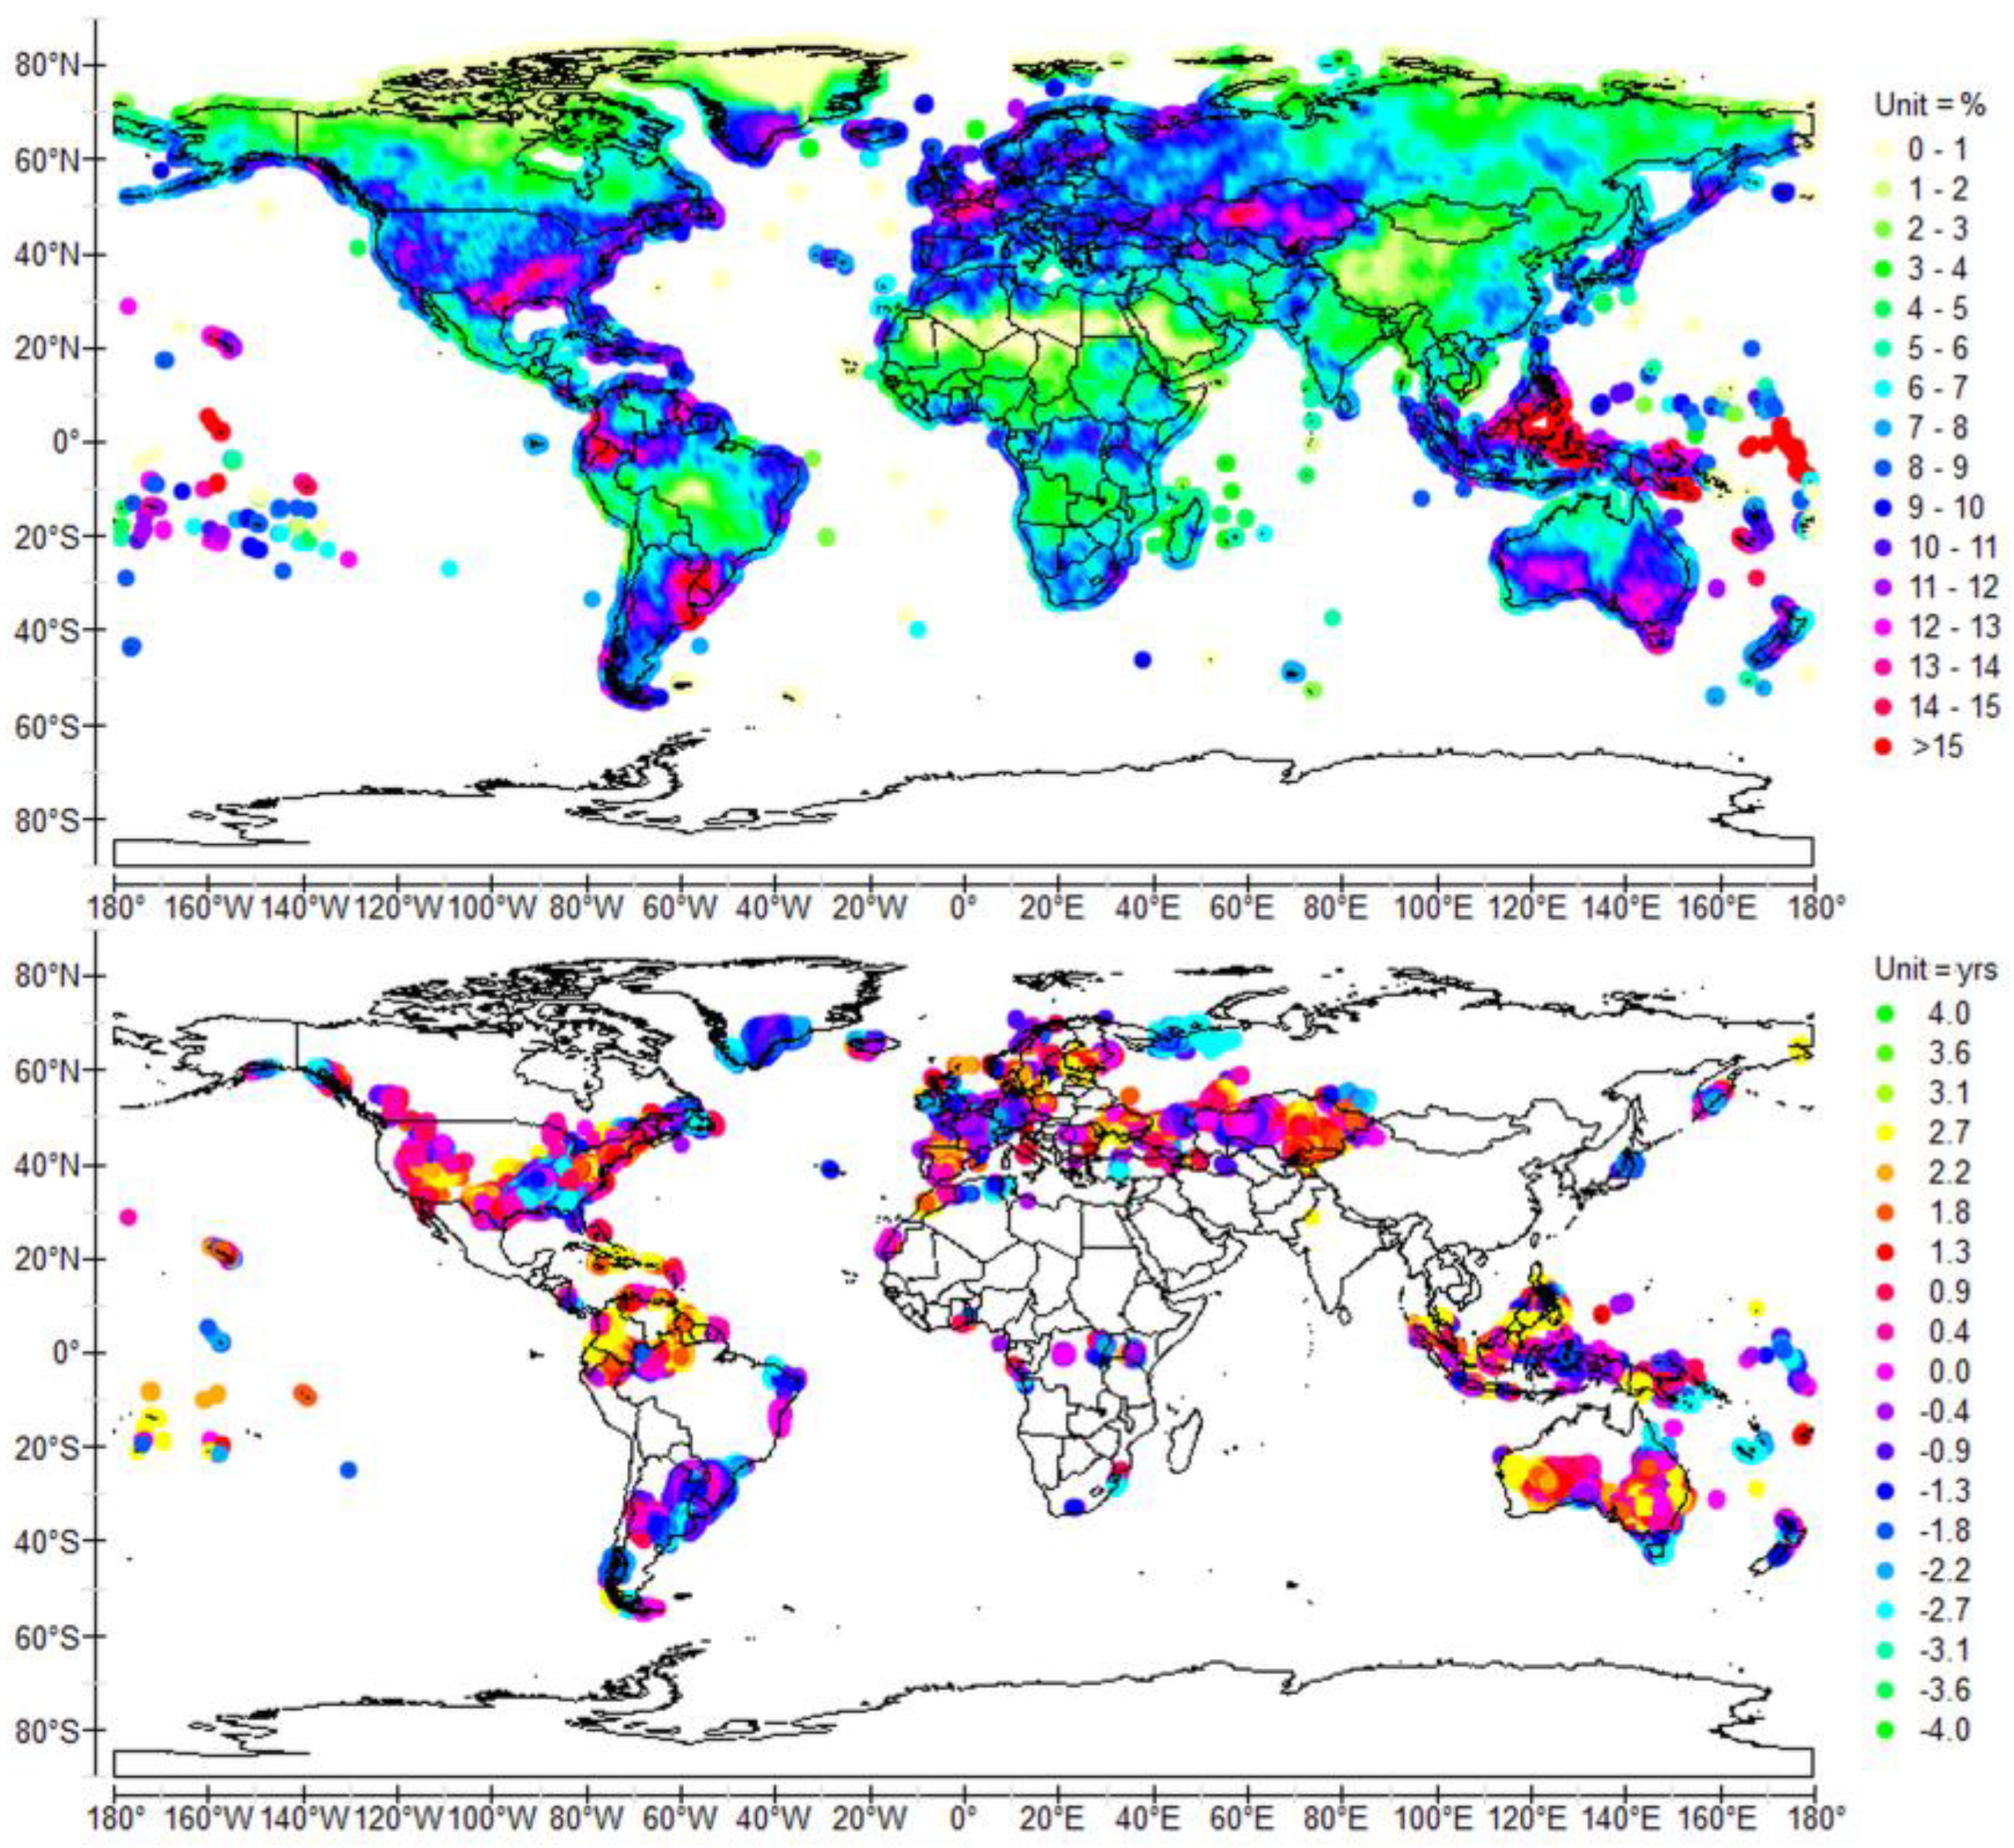
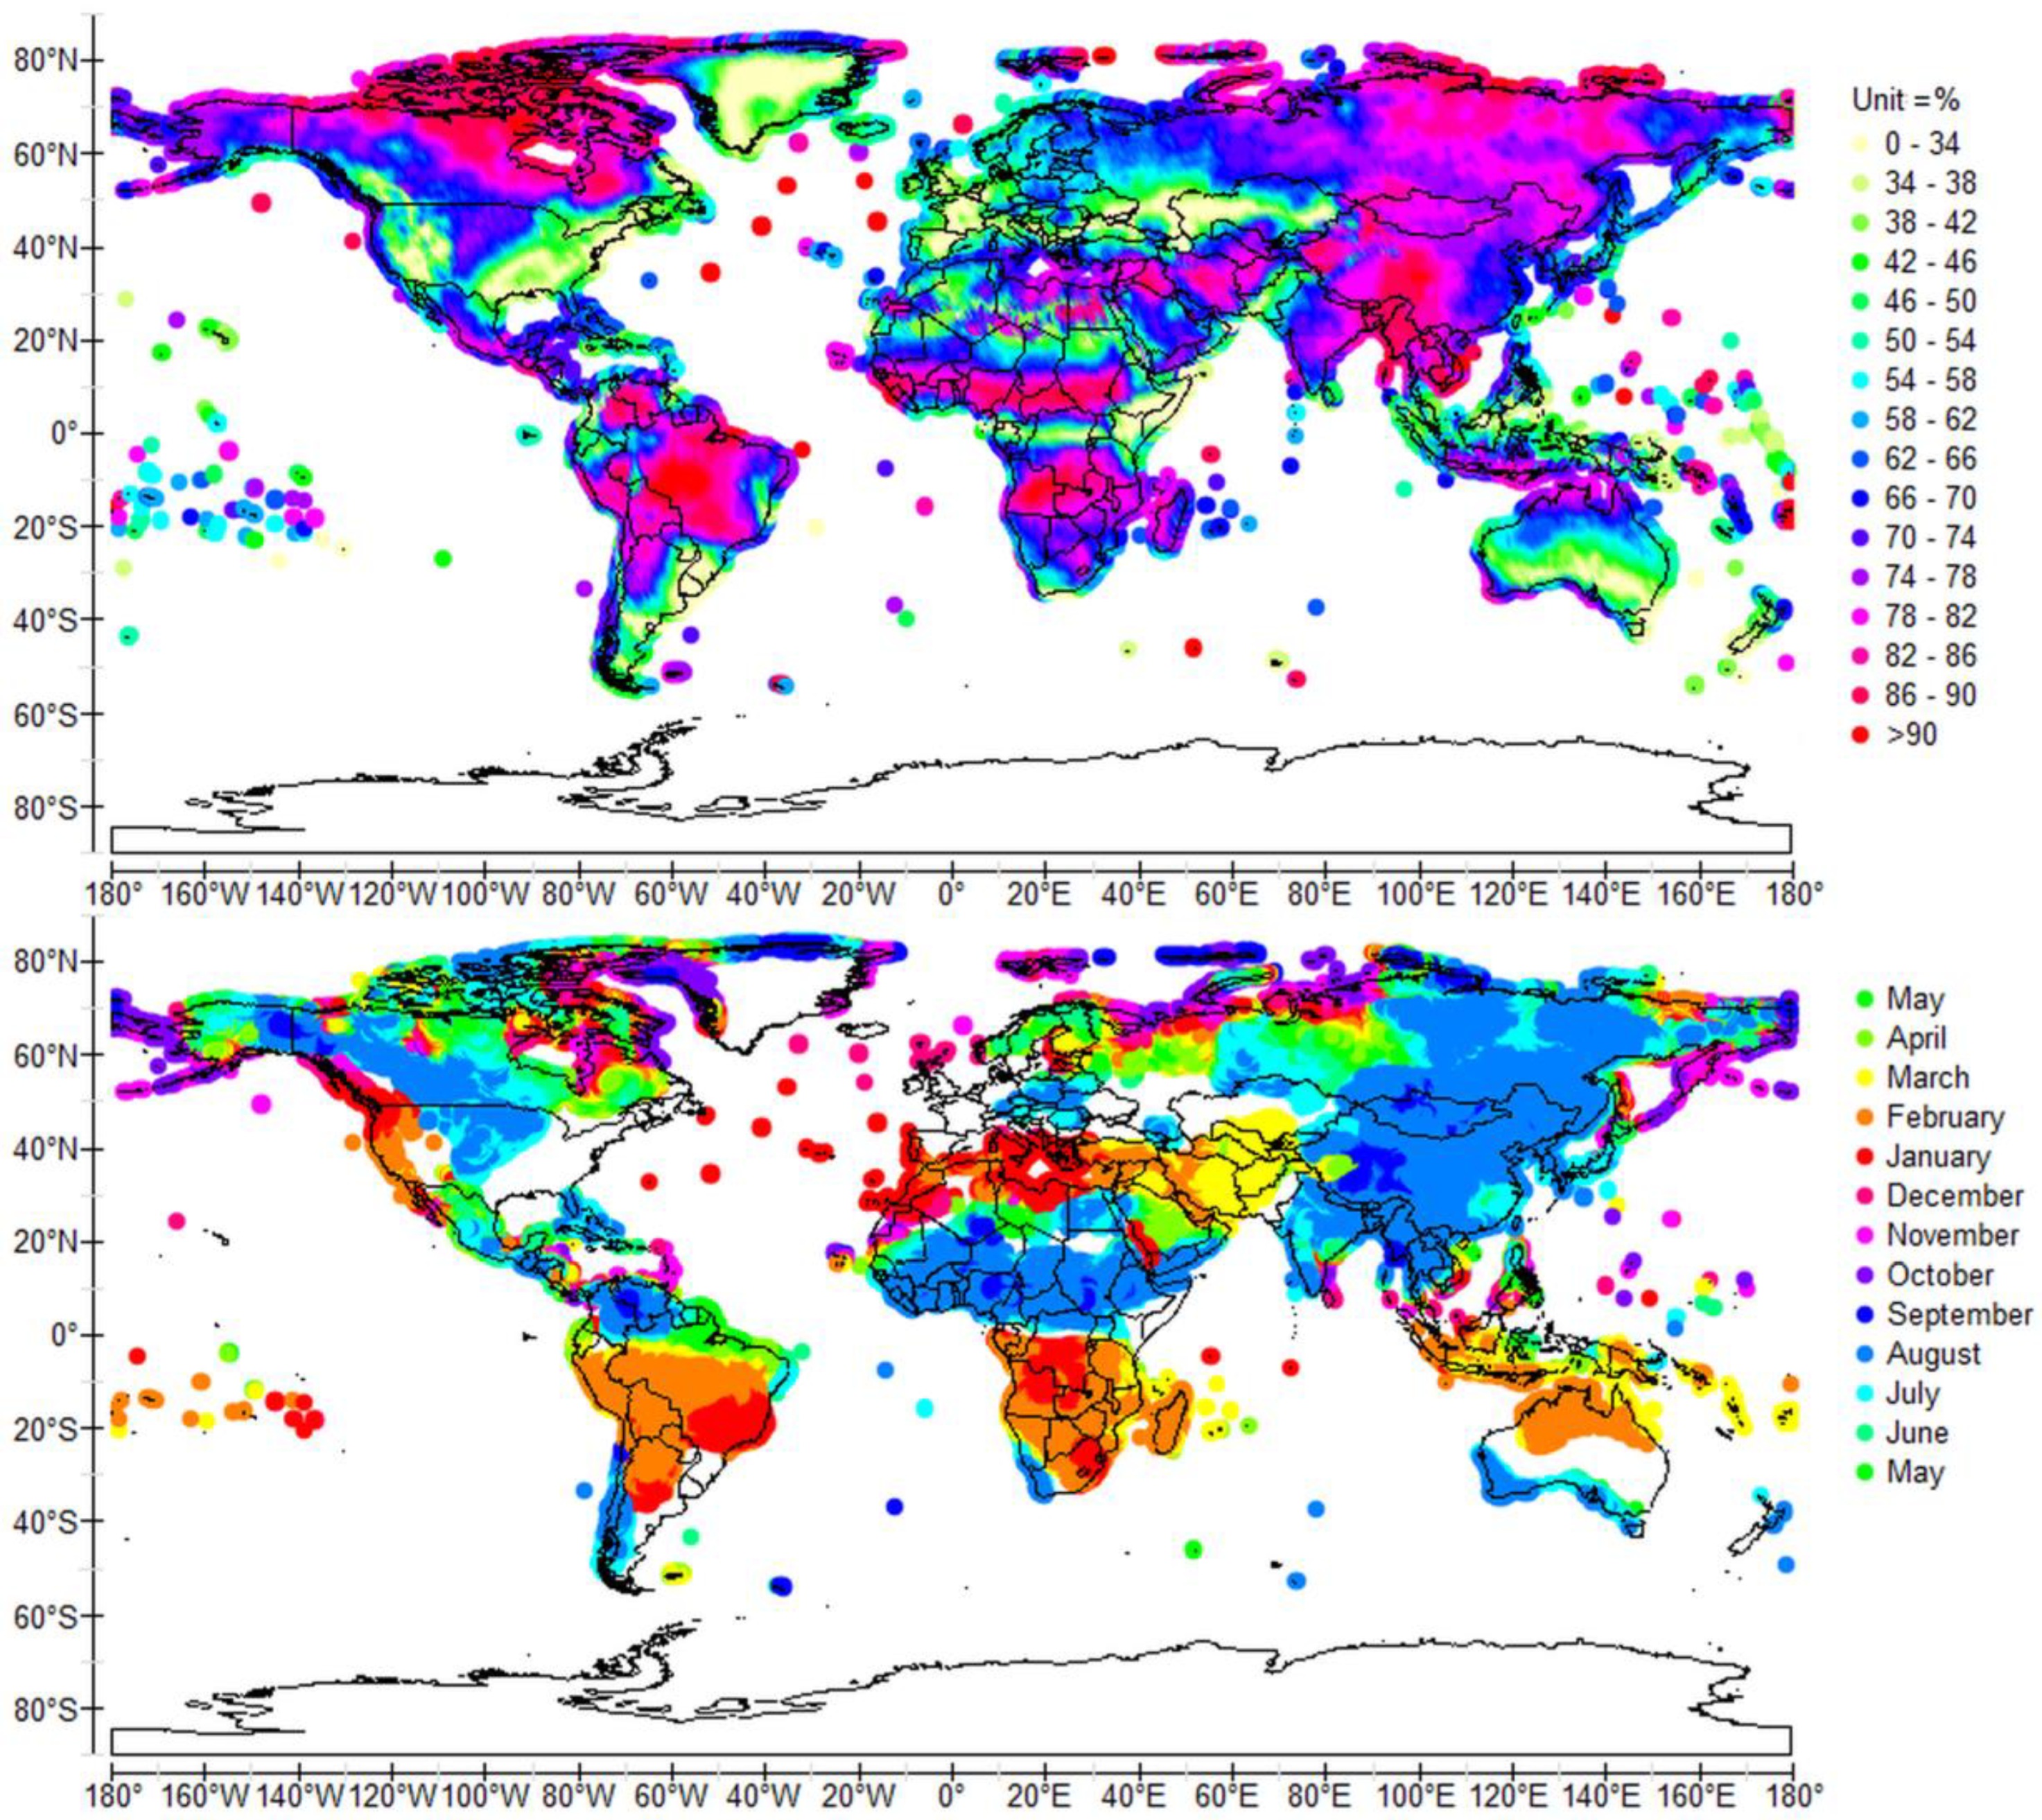
Filtering of the SST anomalies representative of GRWs, considered separately, into the characteristic bands of subharmonic modes would require series of data covering several centuries to prevent edge effects [22]. Because of the shortness of SST series, only the decomposition of the surface temperature in the northern hemisphere, considered as a whole, is presented (Figure 4a). In this way, the surface temperature deduced from the SSTs of the Atlantic and Pacific oceans is extended from 1000 to 1870 by using the data obtained by Crowley [23]. The contribution of long periods is deduced from the residual, namely the component of the global temperature that is not explained from the sum of the signals filtered into the characteristic bands of subharmonic modes, compatible with the duration of the observations.
The contribution of the component in the band 48–96 years, whose amplitude of variation is 0.3 °C, is significant, as well as that in the band 192–576 years, which varies between ± 0.1 °C. The latter can be considered as a rebound following the little ice age, although this subharmonic mode is weakly exogenously forced and behaves as a harmonic of lower frequency GRWs [24,25] (Figure 4c). The 256-year average period GRWs are indeed coupled to those of the 128-year average period, which are forced by the Gleissberg cycle of the Sun: the forcing efficiency in the 96–192-year band calculated from the maximum oscillation occurring in 1980 for both the TSI and the surface temperature is 0.27 °C × (W/m2)−1, which coincides with the lowest values observed during the Holocene. Thus, the variability of the temperature response to the solar irradiance is low during the period of observation, the resonance in the 96–192-year band being the main driver of harmonics and subharmonics.

3. Results

The weights associated with the SST anomalies that best represent the gridded surface temperatures T s are estimated by using the same least squares method as that explained previously. Here, the time interval from which the fitting is performed is 1940–1970, for which the weights are the most precise and the most representative of climate forcing when the surface temperatures are considered individually in the 5° × 5° grid. This choice allows us to minimize the noise in the spatial pattern of the natural variations in temperature (Figure 5b). However, the estimation of the response to anthropogenic forcing within T s by subtracting from the latter the weighted sum of the SST anomalies depends very little on the time interval, 1900–1970 or 1940–1970 (Figure 5a).
The temperature response to the natural radiative forcing exhibits a low spatial variability in both hemispheres (Figure 5b). In the northern hemisphere, it is because the temperature responses in the Atlantic and the Pacific oceans in 2015 are close (the temperature increase since 1970 in the Pacific is slightly lower than in the Atlantic: Figure 3g). The influence of the Pacific can be seen in central Asia whereas eastern North America and Europe are rather influenced by the Atlantic. The southern hemisphere reflects the influence of the warmer Indian Ocean rather than the other two oceans (Figure 3h). Everywhere the natural variation in temperature is positive because all oceanic signatures increased since the 1970s. The increase is most noticeable in North America and north of 60° N, where it reaches 0.6 °C.
In contrast to the climate variability, the response to anthropogenic forcing within the instrumental surface temperature T s shows considerable spatial disparities (Figure 5a): lower than 0.8 °C and even 0.5 °C in Australia, southern South America, eastern North America, northern and western Europe, India and Southeast Asia; overreaching 2 °C in eastern Europe, Russia, Kazakhstan, Mongolia, west of North America, east of Brazil, eastern Africa, Angola, Namibia; and even more than 2.5 °C north of 70° N. This great disparity questions the nature of the positive feedback loop responsible for such amplification in some regions, regardless of the latitude.

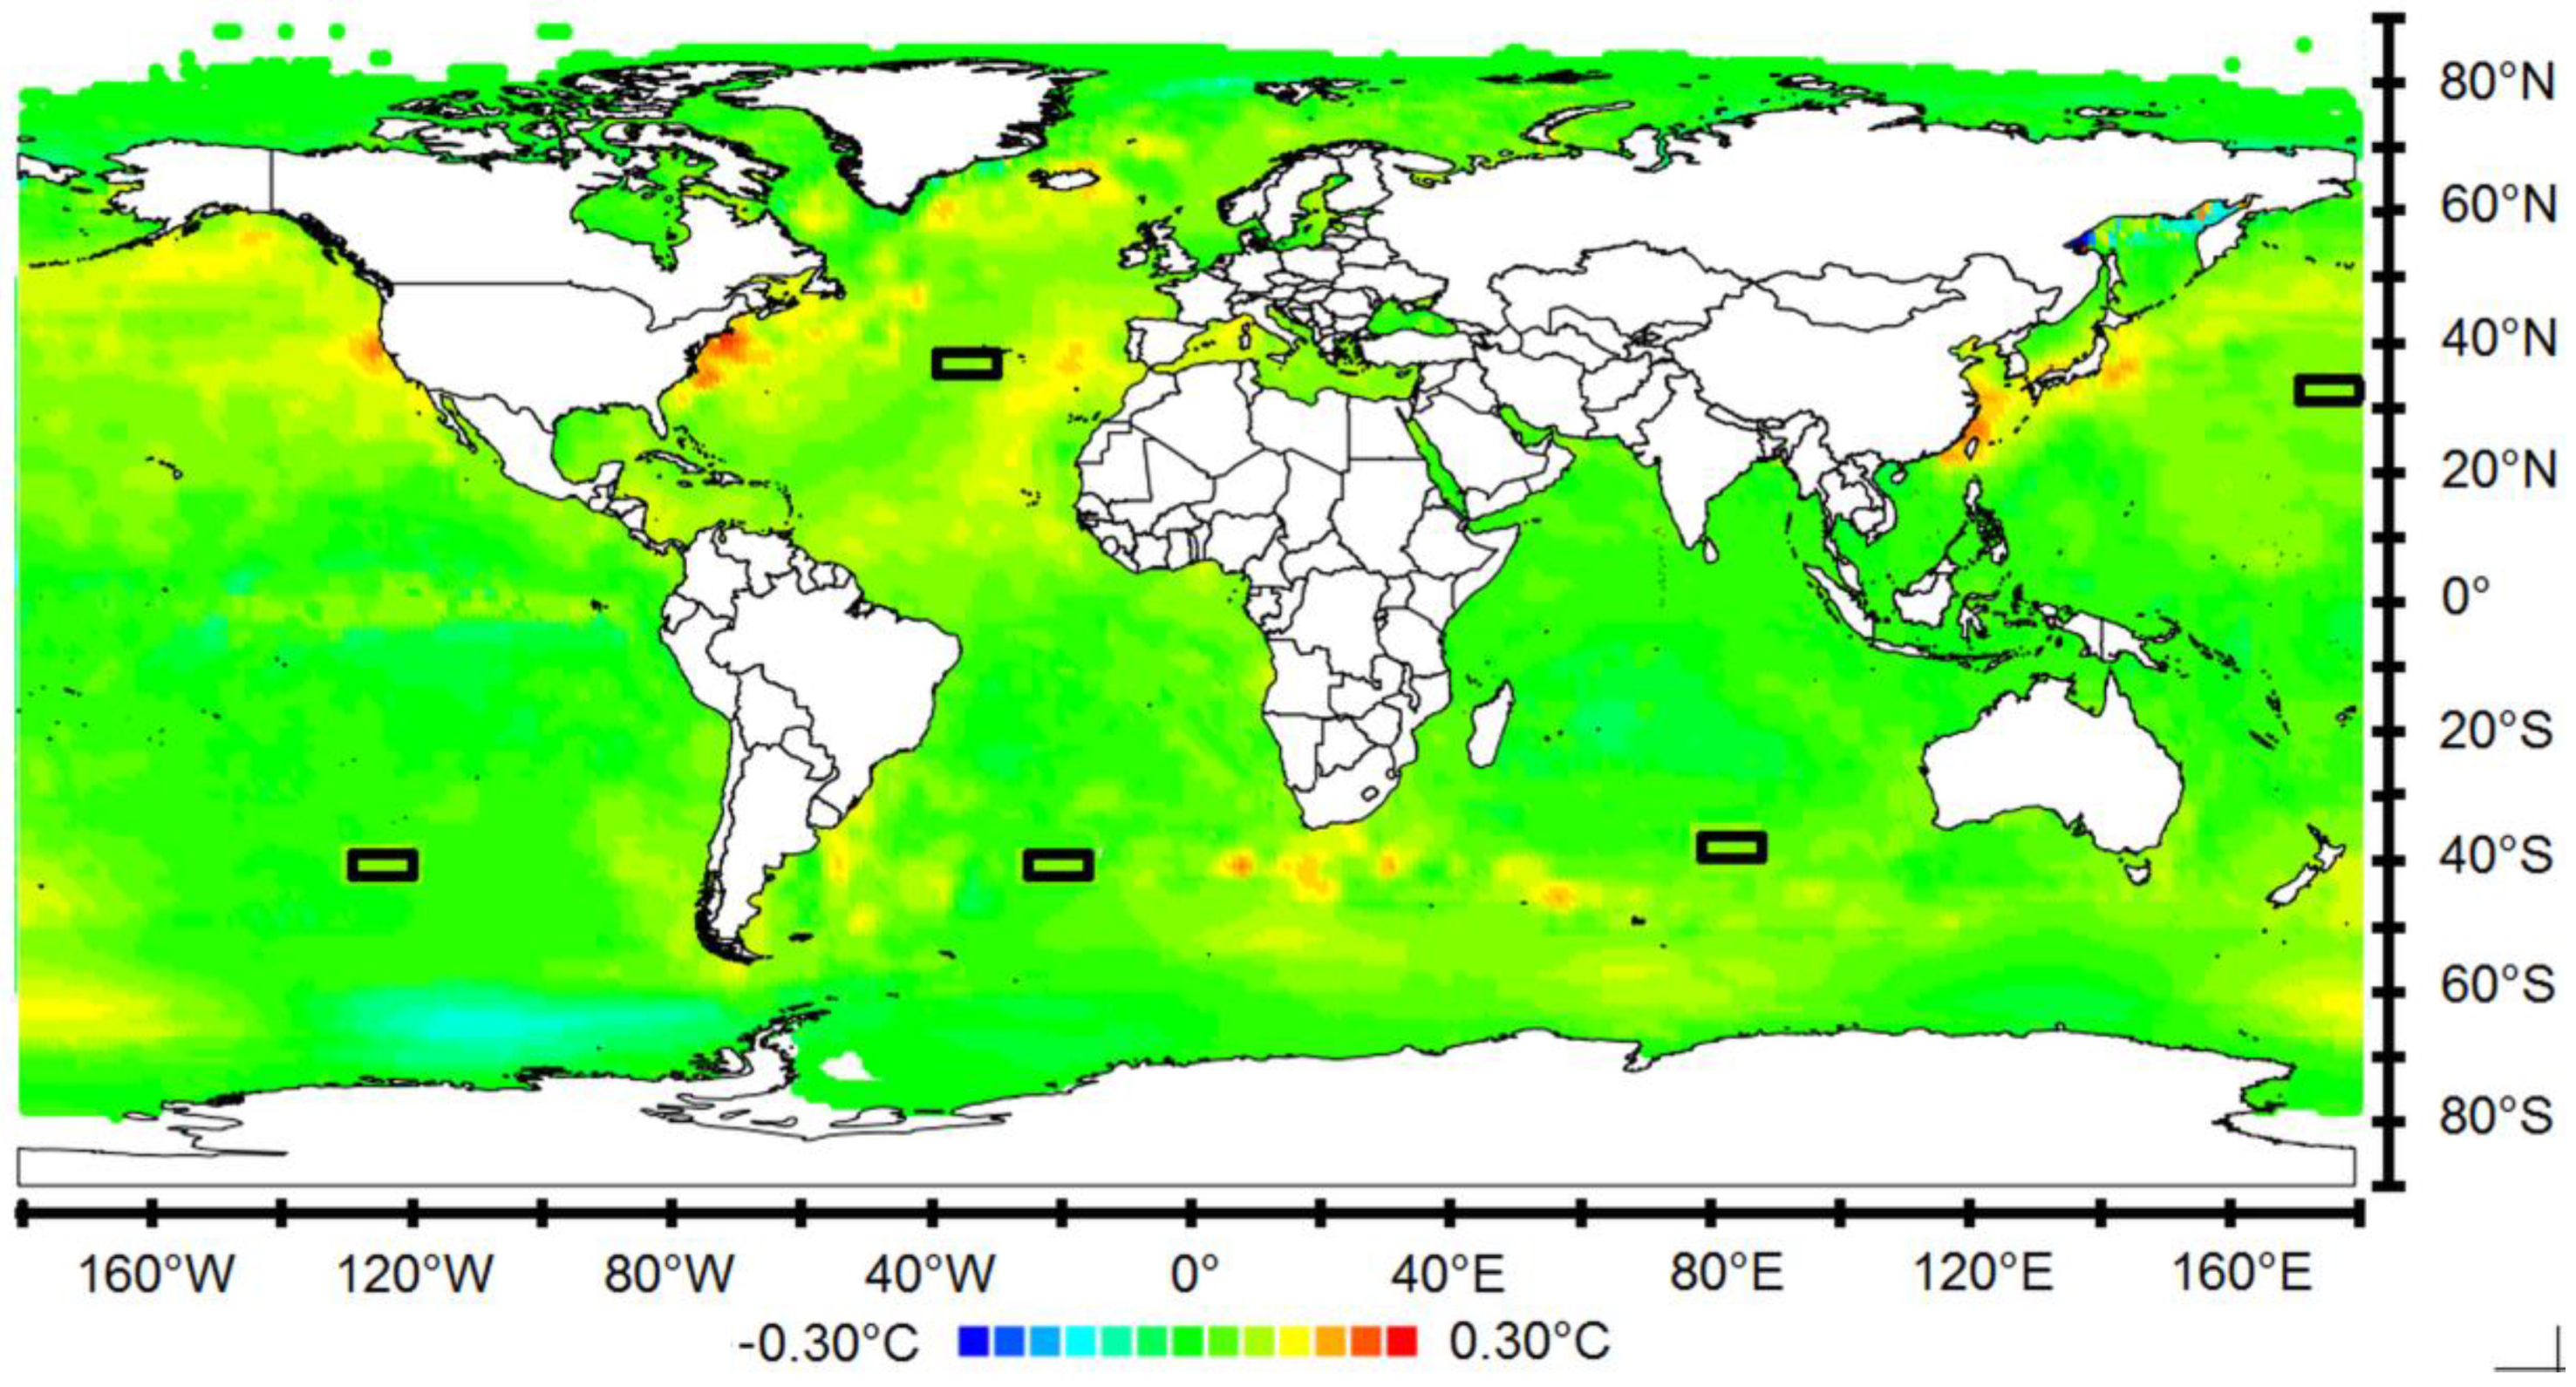
3.1. Regions Primarily Impacted by Latent Heat Fluxes from the Oceans

The distribution of extratropical regions with low anthropogenic impact coincides with those subject to the rainfall oscillation in the 5–10-year band [28,29] (Figure 6). In the North American continent, these are mainly the regions of eastern and southwestern United States. In South America, this concerns the countries of the north, and both eastern and southern Argentina. In Europe, these are southern Greenland and the western and northern countries. In Asia, only the eastern continent is subject to the rainfall oscillation. In Kazakhstan, the annual average is less than 200 mm over most of the country with a high variability and low representativeness of the measurements during a significant part of the observation period, which makes the high amplitude displayed in Figure 6 unlikely. In Africa, the oscillation concerns the North of the Maghreb countries and South Africa. In Oceania, the oscillation is observable almost everywhere.
The 5–10-year band rainfall oscillation characterizes regions impacted by latent heat transfers from the oceans where low pressure systems are stimulated and guided by the jet streams towards the continents. It mainly reflects exchanges resulting from the eight-year average period subharmonic mode of GRWs as have been highlighted by jointly analyzing, both in space and time, SST and rainfall oscillation in the 5–10-year band at the planetary scale. It is clearly distinct from the characteristic band of the El Niño–Southern Oscillation (ENSO), that is, 1.5–7 years, the latter being centered on the four-year period [30,31]. Overlapping of these two bands is weak because the absence of any ENSO event during more than five years is rare.
Within the intertropical convergence zone, monsoonal regions are weakly impacted by anthropogenic warming, that is, Central America, Western Africa, India, and Southeast Asia.

3.2. Regions Primarily Impacted by Sensible Heat Fluxes from the Oceans

The areas that are heavily impacted by anthropogenic warming are characterized by a high amplitude of the rainfall oscillation in the 0.5–1.5-year band, exhibiting a strong seasonality as shown in Figure 7 [29]. The annual rainfall pattern displays a peak time in late boreal and austral summer, that is, when the difference between the temperature of the air aloft and the surface temperature is the greatest, leading to the greatest potential for instability. In this way, the precipitation occurs endogenously within the continents, and mainly sensible heat transfer arises from the oceans as a result of high-pressure systems. In particular, strong anticyclones occur over snow-covered portions of Asia and North America in the winter when clear, dry air masses cool from a loss of infrared radiation, while little sunlight is absorbed to offset that infrared cooling [33]. In Asia, extensive anticyclones may develop, pushing eastward the low-pressure zone that usually forms over the Western Pacific’s warm SST anomalies. Such high-pressure systems print the signature of GRWs to the surface temperature of the central part of the continent as a result of their persistence.
It should be noted that Figure 7 does not make it possible to distinguish between regions that are subject to endogenous continental precipitation processes and monsoonal regions where seasonal changes in atmospheric circulation and precipitation are associated with the asymmetric heating of land and sea. Although the mechanisms involved are different, as is their involvement in the positive feedback, both produce precipitation in late summer.

4. Discussion

Clearly, amplifying effects on the temperature response to anthropogenic forcing do not depend on the latitude, but on the way in which the thermal exchanges occur between the oceans and the continents. The south Greenland and eastern Africa are, respectively, little and heavily impacted, which is contrary to the general trend. On the other hand, contrary to commonly accepted ideas, amplifying effects are not a consequence of the greenhouse effect resulting from the supposed increased atmospheric water vapor associated with the increased temperature. According to this theory, the saturation vapor pressure increases when the atmosphere is warmed, and the amount of water vapor in the atmosphere will tend to increase. Since water vapor is a greenhouse gas, the increase in water vapor content makes the atmosphere warm further; this warming causes the atmosphere to hold still more water vapor (a positive feedback) [34]. But the regions least affected by anthropogenic warming are such that the increase in water vapor with temperature occurs in the free troposphere.
In regions impacted by latent heat fluxes, extratropical free tropospheric water vapor (above the boundary layer) is mostly associated with low-pressure systems to saturate the atmosphere with water vapor from oceans. An increase in the temperature of the atmosphere increases its water-holding capacity, in proportion with the Clausius–Clapeyron relation. In contrast, free tropospheric water vapor in regions impacted by sensible heat fluxes is mainly associated with high-pressure systems. Strong seasonality of precipitation shows that it is controlled by the difference between the temperature of the air aloft and the surface temperature.
Those findings reinforce the idea that the climate response is closely linked to the top of atmosphere flux as suggested by the spatial pattern of climate feedback [35,36,37]. The only way indeed to explain the spatial distribution of the temperature response to anthropogenic forcing is to assign a driving role in the amplification effect of the high troposphere cloud cover, which involves the lapse rate, surface albedo, and cloud feedbacks. More precisely, the results suggest that:
  • A moist adiabatic adjustment [38,39,40,41] may occur in regions more often subject to latent heat fluxes: moist convection establishes a “moist adiabatic” temperature profile that is neutrally buoyant with respect to ascending, condensing parcels, which means that these regions are little affected by positive climate feedbacks.
  • On the contrary, in regions whose precipitation regime is governed by endogenous continental processes, the lapse rate is subject to strong seasonality. Dry adiabatic lapse rate may happen and even superadiabatic lapse rate primarily in the boundary layer, but also in the free troposphere, mainly during the summer when limited vertical mixing and no evaporational cooling occur. A parcel of air will gain buoyancy as it rises both below and above the convective condensation level, possibly up to the equilibrium level. Consequently, these regions are heavily affected by positive climate feedbacks resulting from upward displacement of the higher troposphere cloud cover, which results in reducing the emission to space of long-wavelength radiation [42].

5. Conclusions

Where the natural variability of temperature is of the same order as the response to anthropogenic forcing, the increase in temperature is expected to slow down in the next few decades, when the climate component of temperature decreases, without, however, reversing the trend of the resultant temperature. This is because the increase in the temperature response to anthropogenic forcing will be higher than the decrease in the climate component of temperature, whatever the scenario envisaged. Elsewhere, that is in Eastern Europe, Central Asia and northwestern North America, the natural variations in temperature will remain negligible in comparison with the response to anthropogenic forcing that is subject to a strong feedback loop.
The spatial pattern of the temperature response to anthropogenic forcing reinforces the idea that the climate response is closely linked to the top of atmosphere flux resulting in the main climate feedback. Observational evidence lays the groundwork to specify how the lapse rate and the high troposphere cloud cover are involved in climate forcing. These deductions will have to be validated by the use of actual experimental data. They should arouse and feed new debates about climate change and its future.

Funding

This research received no external funding.

Acknowledgments

We thank the associated editor and the reviewers for their helpful comments.

Conflicts of Interest

The author declares no conflict of interest.

References

  1. Cubasch, U.; Zorita, E.; Kaspar, F.; Gonzales-Rouco, J.F.; von Storch, H.; Prommel, K. Simulation of the role of solar and orbital forcing on climate. Adv. Space Res. 2005, 37, 1629–1634. [Google Scholar] [CrossRef]
  2. Davis, B.A.S.; Brewer, S. Orbital forcing and role of the latitudinal insolation/temperature gradient. Clim. Dyn. 2008, 32, 143–165. [Google Scholar] [CrossRef]
  3. Kawamura, K.; Parrenin, F.; Lisiecki, L.; Uemura, R.; Vimeux, F.; Severinghaus, J.P.; Hutterli, M.A.; Nakazawa, T.; Aoki, S.; Jouzel, J.; et al. Northern Hemisphere forcing of climatic cycles in Antarctica over the past 360,000 years. Nature 2007, 448, 912–916. [Google Scholar] [CrossRef] [PubMed]
  4. Kerr, R.A. Milankovitch Climate Cycles Through the Ages: Earth’s orbital variations that bring on ice ages have been modulating climate for hundreds of millions of years. Science 1987, 235, 973–974. [Google Scholar] [CrossRef] [PubMed]
  5. Hays, J.D.; Imbrie, J.; Shackleton, N.J. Variations in the Earth’s Orbit: Pacemaker of the Ice Ages. Science 1976, 194, 1121–1132. [Google Scholar] [CrossRef] [PubMed]
  6. Milankovitch, M. Canon of Insolation and the Ice Age Problem; Zavod za Udžbenike i Nastavna Sredstva: Belgrade, Serbia, 1941. [Google Scholar]
  7. Rial, J.A. Earth’s orbital Eccentricity and the rhythm of the Pleistocene ice ages: The concealed pacemaker. Glob. Planet. Chang. 2003, 41, 81–93. [Google Scholar] [CrossRef]
  8. Carl, W. Quantitative estimate of the Milankovitch-forced contribution to observed Quaternary climate change. Quat. Sci. Rev. 2004, 23, 1001–1012. [Google Scholar]
  9. Zachos, J.C.; Shackleton, N.J.; Revenaugh, J.S.; Pälike, H.; Flower, B.P. Climate response to orbital forcing across the Oligocene-Miocene boundary. Science 2001, 292, 27–48. [Google Scholar] [CrossRef] [PubMed]
  10. Richard, M.; MacDonald, A.; Gordon, J.F. Glacial Cycles and Astronomical Forcing. Science 1997, 277, 215–218. [Google Scholar] [Green Version]
  11. Broecker, W.S. The Glacial World According to Wally; Eldigio Press: New York, NY, USA, 1995. [Google Scholar]
  12. Keigwin, L.W.B.; Lehman, C.S.J.; Johnsen, S. The role of the deep ocean in North Atlantic climate change between 70 and 130 kyr ago. Nature 1994, 371, 323–329. [Google Scholar] [CrossRef]
  13. Shaffer, G.; Bendtsen, J. Role of the Bering Strait in controlling North Atlantic Ocean circulation and climate. Nature 1994, 367, 354–357. [Google Scholar] [CrossRef]
  14. Jones, P.D.; Bradley, R.S.; Jouzel, J. (Eds.) Climatic Variations and Forcing Mechanisms over the Last 2000 Year; Springer: Berlin, Germany, 1996. [Google Scholar]
  15. Rahmstorf, S.; Marotzke, J.; Willebrand, J. Stability of the Thermohaline Circulation. In The Warmwater-Sphere of the North Atlantic Ocean; Kraus, W., Ed.; Gebruder Borntrager: Berlin, Germant, 1996; pp. 129–157. [Google Scholar]
  16. Seidov, D.; Maslin, M. North Atlantic Deep Water circulation collapse during the Heinrich events. Geology 1999, 27, 23–26. [Google Scholar] [CrossRef]
  17. Pinault, J.-L. Modulated response of subtropical gyres: Positive feedback loop, subharmonic modes, resonant solar and orbital forcing. J. Mar. Sci. Eng. 2018, 6, 107. [Google Scholar] [CrossRef]
  18. Pinault, J.-L. Resonantly Forced Baroclinic Waves in the Oceans: Subharmonic Modes. J. Mar. Sci. Eng. 2018, 6, 78. [Google Scholar] [CrossRef]
  19. Explain with Realism Climate Variability. Available online: http://climatorealist.neowordpress.fr/long-period-gyral-waves/ (accessed on 8 November 2018).
  20. Ganachaud, A.; Wunsch, C. Improved estimates of global ocean circulation, heat transport and mixing from hydrographic data. Nature 2000, 408, 453–457. [Google Scholar] [CrossRef] [PubMed]
  21. Rayner, N.A.; Parker, D.E.; Horton, E.B.; Folland, C.K.; Alexander, L.V.; Rowell, D.P.; Kent, E.C.; Kaplan, A. Global analyses of sea surface temperature, sea ice, and night marine air temperature since the late nineteenth century. J. Geophys. Res. 2003, 108, 4407. [Google Scholar] [CrossRef]
  22. Torrence, C.; Compo, G.P. A practical guide for wavelet analysis. Bull. Am. Meteorol. Soc. 1998, 79, 61–78. [Google Scholar] [CrossRef]
  23. Crowley, T.J. Causes of Climate Change Over the Past 1000 Years. Science 2000, 289, 270–277. [Google Scholar] [CrossRef] [PubMed]
  24. Pinault, J.-L. Resonantly forced ‘Gyral Rossby Waves’ and the past climate. Submitted.
  25. Explain with Realism Climate Variability. Available online: http://climatorealist.neowordpress.fr/holocene/ (accessed on 8 November 2018).
  26. Coddington, O. Solar Irradiance Climate Data Record. In BAMS; Laboratory for Atmospheric and Space Physics, University of Colorado Boulder: Boulder, CO, USA, 2015. [Google Scholar]
  27. Jones, P.D.; Lister, D.H.; Osborn, T.J.; Harpham, C.; Salmon, M.; Morice, C.P. Hemispheric and large-scale land surface air temperature variations: An extensive revision and an update to 2010. J. Geophys. Res. 2012, 117, D05127. [Google Scholar] [CrossRef]
  28. Pinault, J.-L. Global warming and rainfall oscillation in the 5–10 year band in Western Europe and Eastern North America. Clim. Chang. 2012, 114. [Google Scholar] [CrossRef]
  29. Pinault, J.-L. Regions Subject to Rainfall Oscillation in the 5–10 Year Band. Climate 2018, 6, 2. [Google Scholar] [CrossRef]
  30. Pinault, J.-L. Anticipation of ENSO: What teach us the resonantly forced baroclinic waves. Geophys. Astrophys. Fluid Dyn. 2016, 110, 518–528. [Google Scholar] [CrossRef]
  31. Pinault, J.-L. The Anticipation of the ENSO: What Resonantly Forced Baroclinic Waves Can Teach Us (Part II). J. Mar. Sci. Eng. 2018, 6, 63. [Google Scholar] [CrossRef]
  32. Monthly Southern Oscillation Index from the National Centre for Atmospheric Research (NCAR). Available online: http://www.cgd.ucar.edu/cas/catalog/climind/soi.html (accessed on 1 September 2017).
  33. Ioannidou, L.; Yau, M.K. A climatology of the Northern Hemisphere winter anticyclones. J. Geophys. Res. 2008, 113, D08119. [Google Scholar] [CrossRef]
  34. Soden, B.J.; Held, I.M. An Assessment of Climate Feedbacks in Coupled Ocean—Atmosphere Models. J. Clim. 2006, 19, 3354. [Google Scholar] [CrossRef]
  35. Boer, G.J.; Yu, B. Climate sensitivity and response. Clim. Dyn. 2003, 20, 415–429. [Google Scholar] [CrossRef] [Green Version]
  36. Taylor, P.C.; Ellingson, R.G.; Cai, M. Seasonal variations of climate feedbacks in the NCAR CCSM3. J. Clim. 2011, 24, 3433–3444. [Google Scholar] [CrossRef]
  37. Ming, Y.; Ramaswamy, V. Nonlocal component of radiative flux perturbation. Geophys. Res. Lett. 2012, 39, L22706. [Google Scholar] [CrossRef]
  38. Arakawa, A.; Schubert, W.H. Interaction of a cumulus cloud ensemble with the large-scale environment. Part I. J. Atmos. Sci. 1974, 31, 674–701. [Google Scholar] [CrossRef]
  39. Emanuel, K. A scheme for representing cumulus convection in large scale models. J. Atmos. Sci. 1991, 48, 2313–2333. [Google Scholar] [CrossRef]
  40. Betts, A.K. Saturation Point Analysis of Moist Convective Overturning. J. Atmos. Sci. 1982, 39, 1484–1505. [Google Scholar] [CrossRef] [Green Version]
  41. Xu, K.M.; Emanuel, K.A. Is the tropical atmosphere conditionally unstable? Mon. Weather Rev. 1989, 117, 1471–1479. [Google Scholar] [CrossRef]
  42. Manabe, S.; Wetherald, R.T. Large-scale changes of soil wetness induced by an increase in atmospheric carbon dioxide. J. Atmos. Sci. 1987, 44, 1211–1235. [Google Scholar] [CrossRef]
Figure 1. The perturbation η of the sea surface height obtained by solving the equations of motion of the north Atlantic Gyral Rossby Waves (GRWs) dragged by the wind-driven current (a) amplitude of the 8-year period GRW: the apparent half-wavelength of the GRW extends from where the boundary current leaves the North American coast to the drift current [18] (b) the phase (c) amplitude of the 128-year period GRW: the apparent half-wavelength of the GRW winds two turns around the gyre [17] (d) the phase.
Jmse 06 00146 g001
Figure 2. Wavelet power of SST in 1958, scale-averaged over the 48–96-year band (64-year average period). Areas from which SST anomalies are averaged are displayed. Data are provided by the “Met Office Hadley Centre” [21].
Jmse 06 00146 g002
Figure 3. The instrumental temperature Tinst and the weighted sum of SST anomalies in the northern hemisphere (a), the southern hemisphere (c), and global (e). The Moving Average (MA) over 5 years is displayed—temperature response to anthropogenic forcing obtained by subtracting the climate component from Tinst in the northern hemisphere (b), the southern hemisphere (d), and global (f). The envelope Tinst ± σ is represented, where σ is the standard deviation (the l 2 norm of the residual obtained from the least squares method)—moving average over 13 years of the SST in the northern and southern hemispheres (g,h). Signals are centered over the period 1940–1970.
Jmse 06 00146 g003
Figure 4. (a) Components of the weighted sum of the SST anomalies into the bands characteristic of subharmonic modes (surface temperature in the northern hemisphere); (b) the Total Solar Irradiance (TSI); (c) the components of the TSI within the bands characteristic of subharmonic modes (signals are centered). TSI reconstruction is based on NRLTSI2 [26].
Jmse 06 00146 g004
Figure 5. (a) The response to anthropogenic forcing within the surface temperature T s in 2015; (b) the natural variations in temperature w N A S S T N A + w N P S S T N P in the northern hemisphere and w S A S S T S A + w S P S S T S P + w S I S S T S I in the southern hemisphere. 1970 is the year from which the temperature change is estimated. Areas without dots have no data. Data are provided by the Climatic Research Unit (CRU) at the University of East Anglia [27].
Jmse 06 00146 g005
Figure 6. Cross-wavelet power (top) and coherence phase (bottom) of reduced rainfall height, scale-averaged over the 5–10-year band, time-averaged over 1901–2009. –SOI (the opposite of the southern oscillation index beginning January 1866, provided by the National Centre for Atmospheric Research [32]) is used as the temporal reference [22]. The reduced rainfall height is the rainfall height divided by its mean value [29]. The wavelet power spectrum is normalized by the total variance, so it represents the percentage of variance explained in the stated bandwidth (5–10-year band). The Cross-Wavelet and the Complex Empirical Orthogonal Function (EOF) analyses have similarities, the latter being more familiar to marine scientists and climatologists. However, if the two methods are similar for typical frequency domain analyses, that is, the power spectral and coherency analyses, they are far different in terms of the time domain. In complex EOF analysis, the time lag between time series is basically the computation of eigenvector and eigenvalue of a covariance or a correlation matrix computed from a group of original time series data. In contrast, the cross-wavelet analysis is well suited to highlight the time lag between time series when it varies continuously (here, the reduced rainfall height and –SOI used as the time reference). Rainfall height data are provided by the NOAA (National Oceanic and Atmospheric Administration). ftp://ftp.cpc.ncep.noaa.gov/precip/cmap/monthly/.
Jmse 06 00146 g006
Figure 7. Cross-wavelet power (top) and coherence phase (bottom) of reduced rainfall height, scale-averaged over the 0.5–1.5-year band, time-averaged over 1901–2009.
Jmse 06 00146 g007

