
Improvement of Mooring Configurations in Geraldton Harbour

Abstract
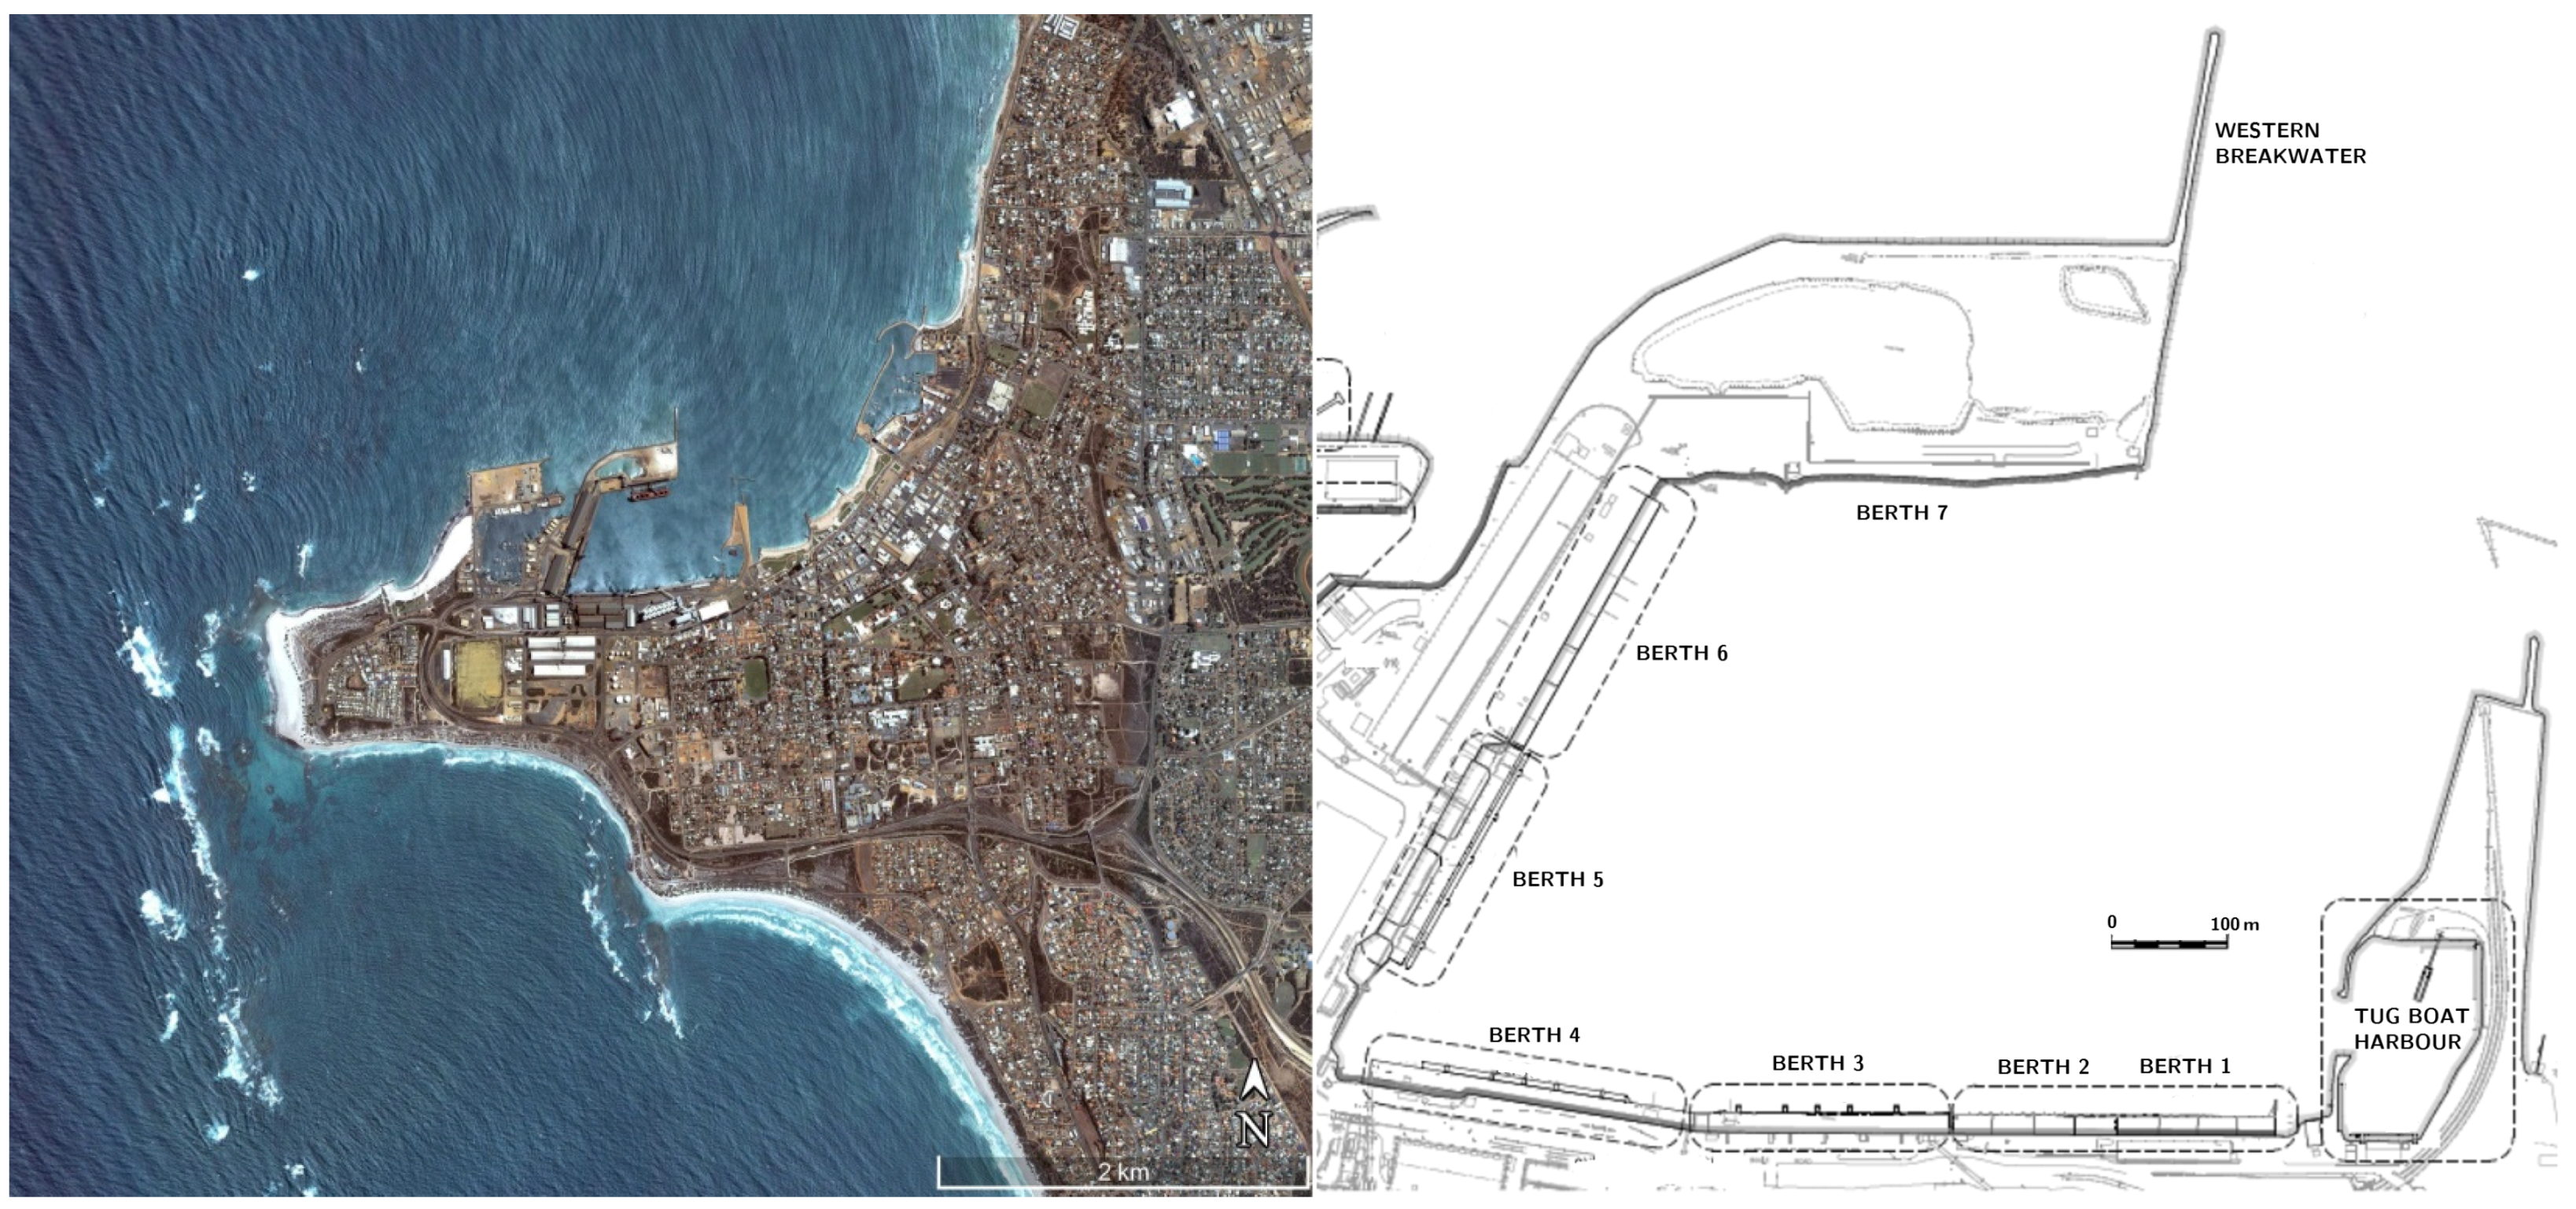
:1. Introduction
- the addition of Berth 6,
- the construction of the Batavia Coast Marina to the east of the port,
- the deepening of the entrance channel and port basin.

2. Assessment of the Mooring Configuration
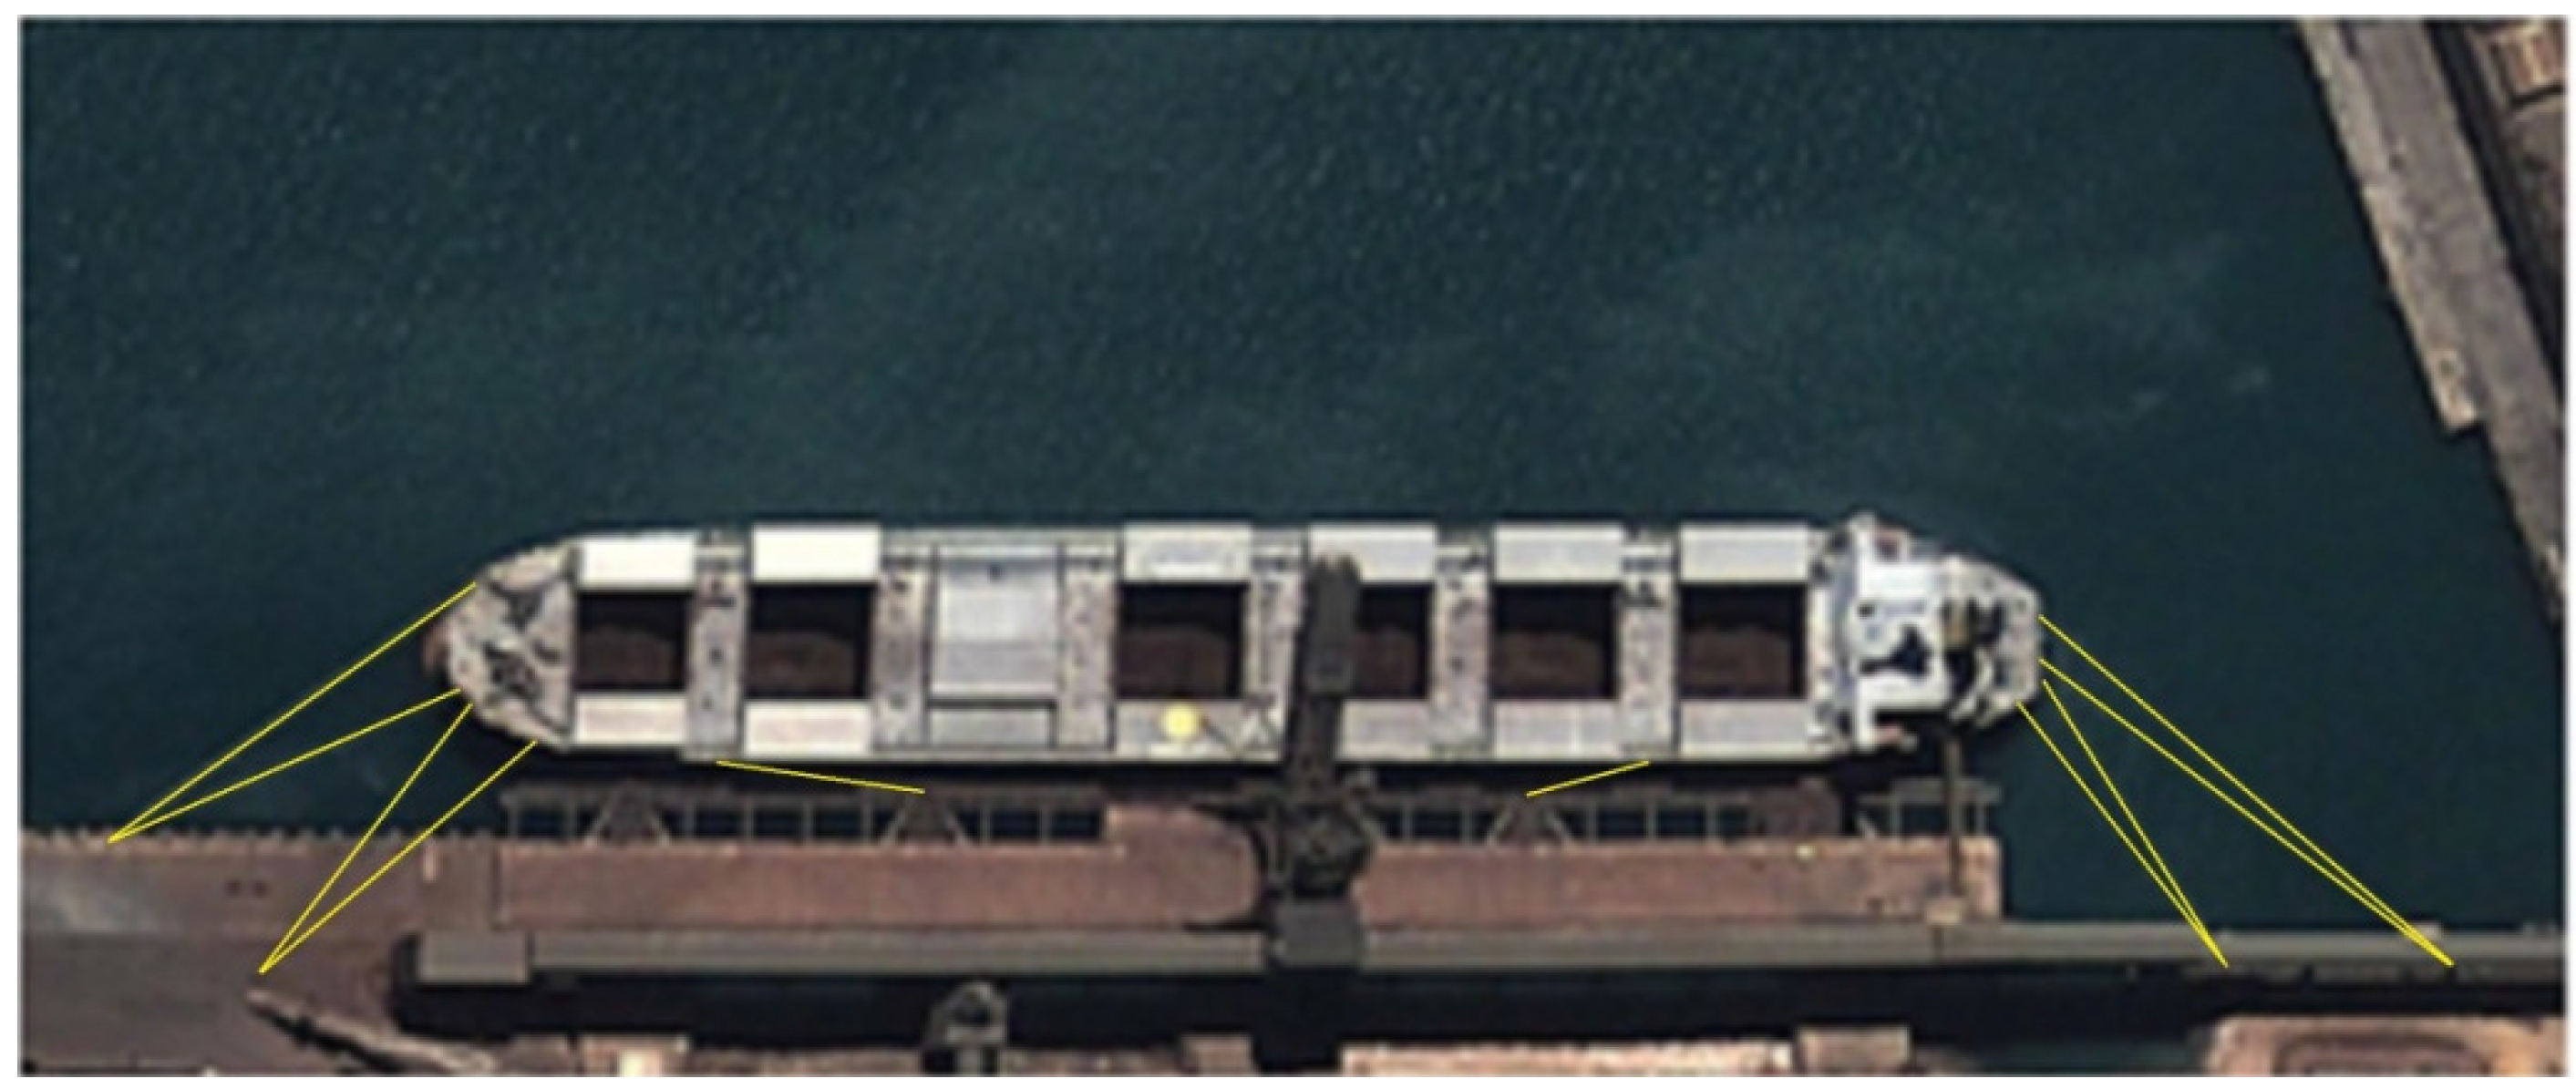
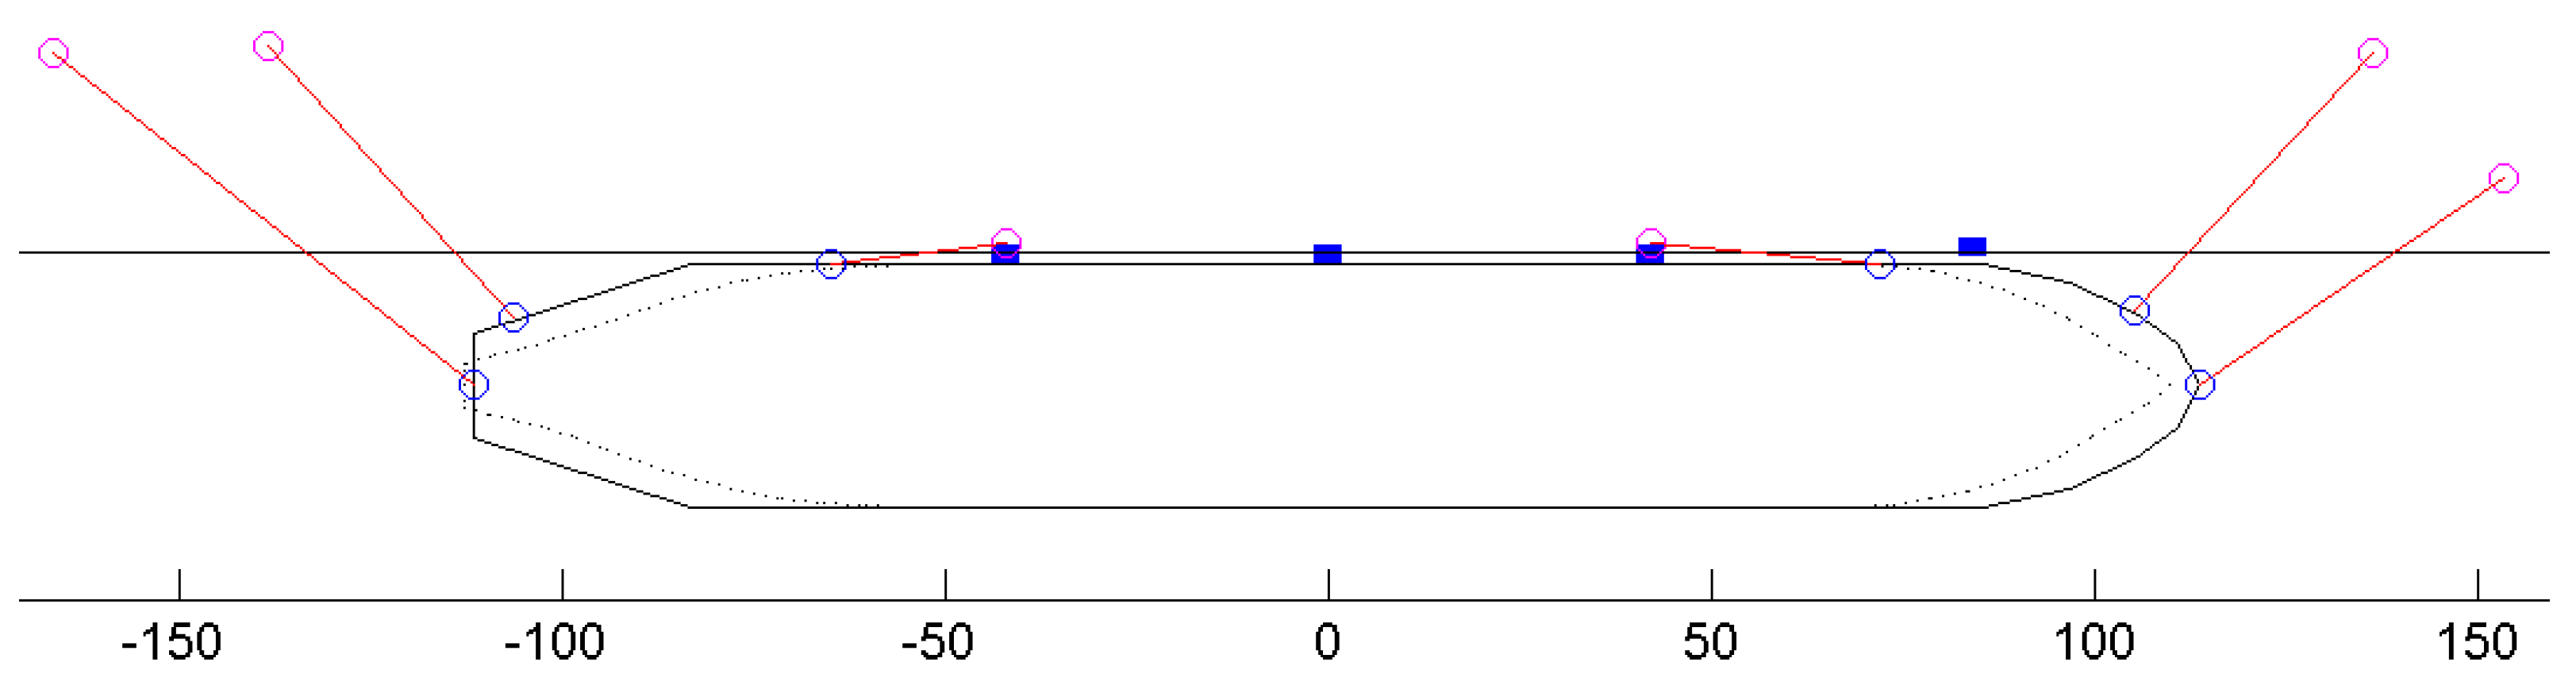
2.1. Existing Mooring Configuration at Berth 5
2.2. Possible Mitigation Measures to Improve the Mooring Configuration
- Reducing mooring loads by softening the mooring system;
- Reducing the response of the ship by constraining it more.
- Shore-based mooring lines,
- Softer fenders,
- A combination of softer fenders and shore-based mooring lines,
- MoorMaster vacuum mooring system,
- ShoreTension hydraulic mooring system,
- Dock Lock magnetic mooring system.
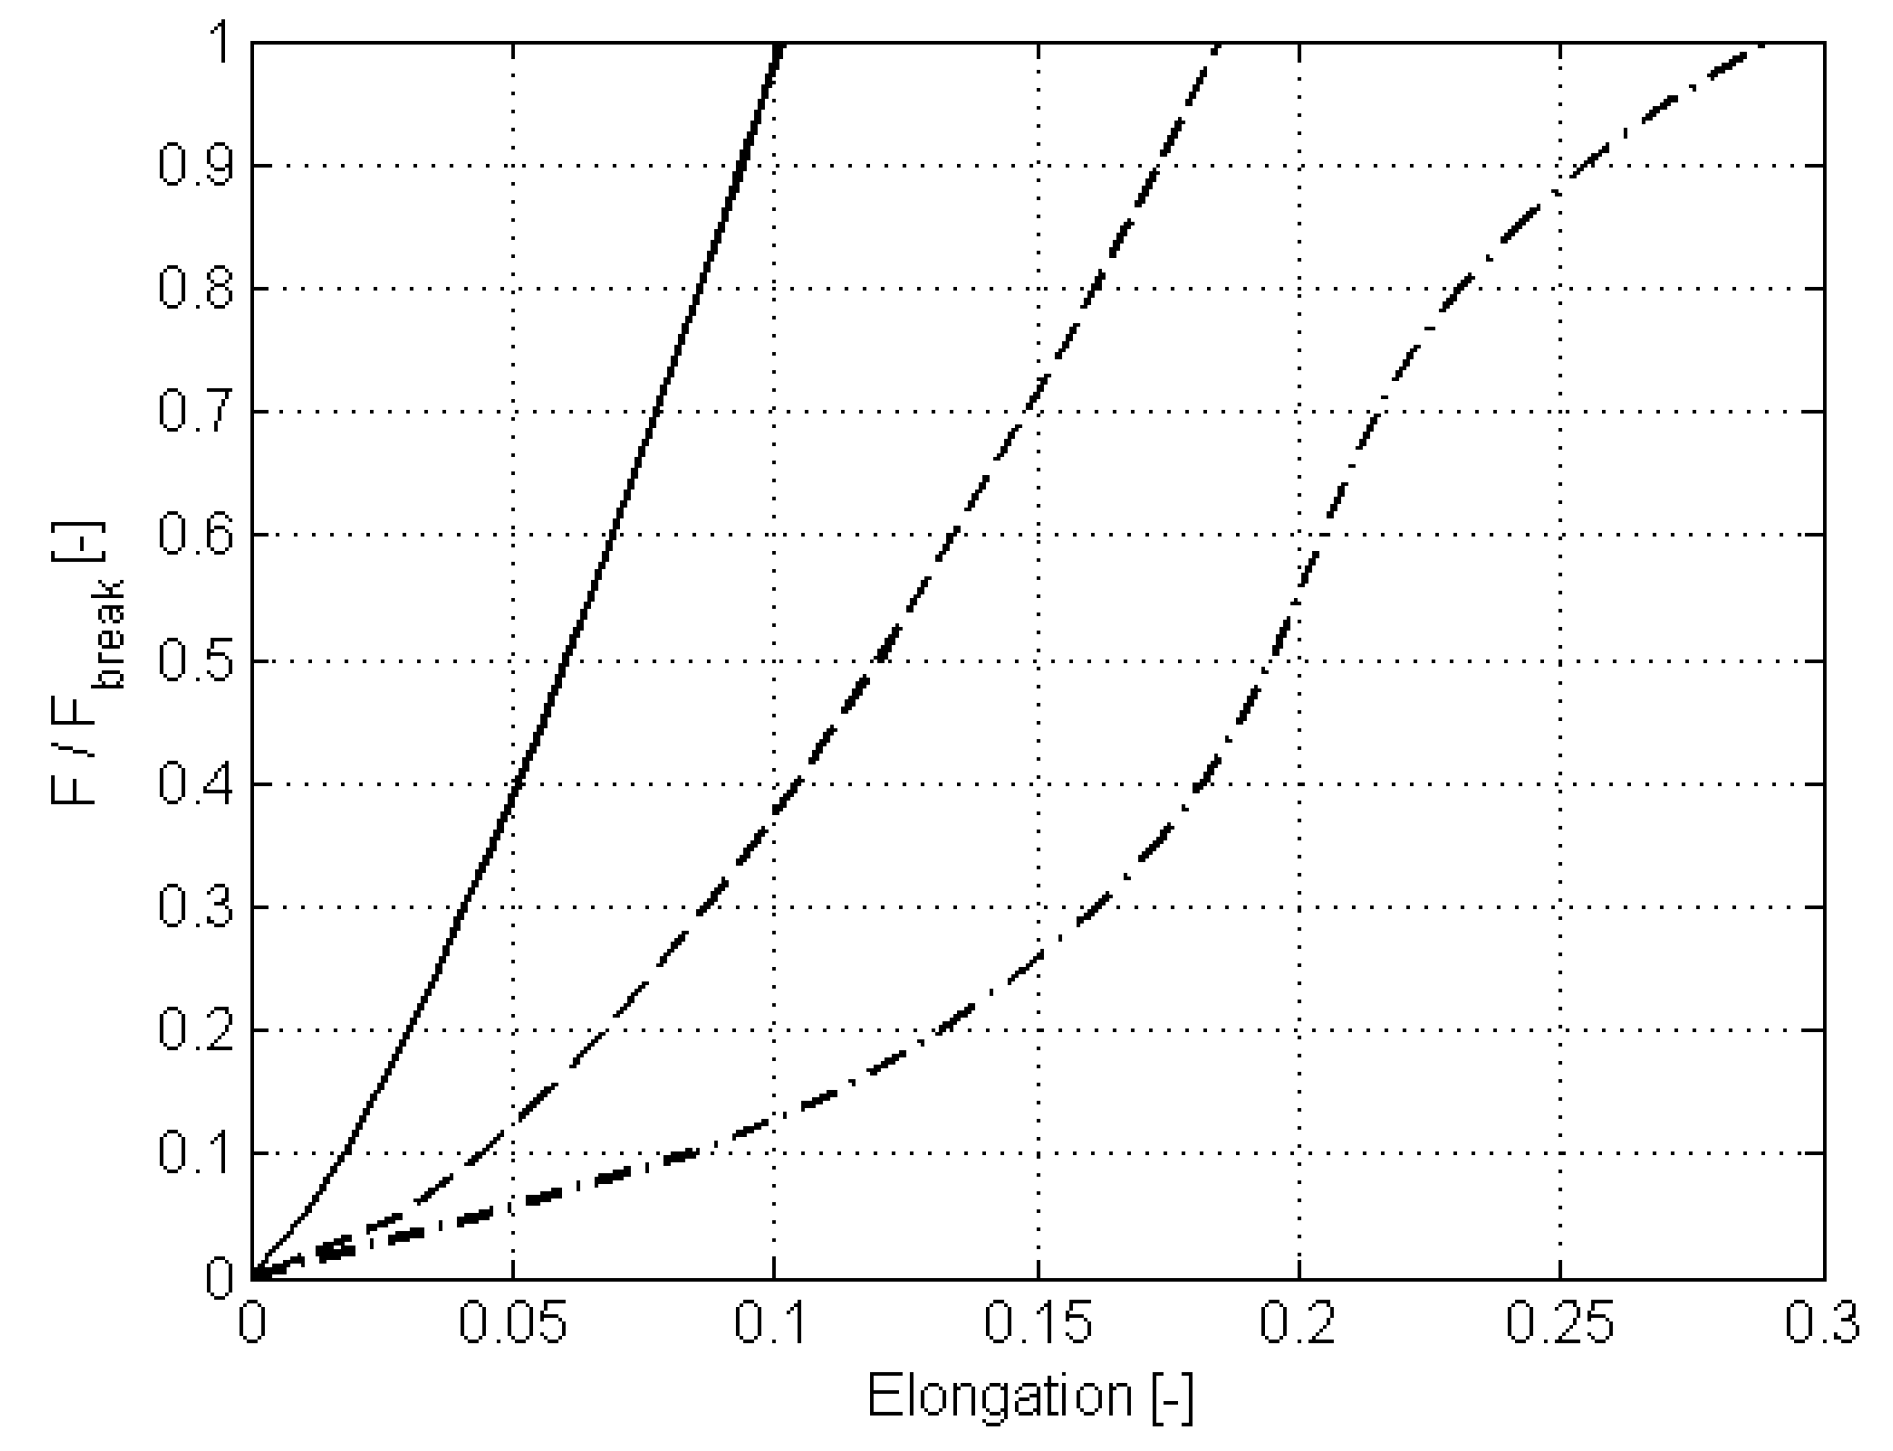
2.2.1. Shore-Based Mooring Lines
- Provide flexible nylon mooring tails. The tails can be connected to the ship’s lines to provide more flexibility. The ship’s winches can be used to provide pretension.
- Provide strong and stiff Dyneema lines with flexible nylon tails. These lines are strong and light for easy handling. The nylon tails provide the required flexibility to reduce the line loads. A towing motor is used to apply pretension.
- Provide strong and flexible nylon breast lines. These lines can be put under a high pretension without critically risking line breakage, because the ropes are very soft. A regular brake winch on the wharf is used to set and manually change pretension.
- Provide strong and fairly stiff breast lines connected to a constant tension winch on the wharf. The winch pays the line in and out as the vessel sways and yaws to maintain the set pretension value.
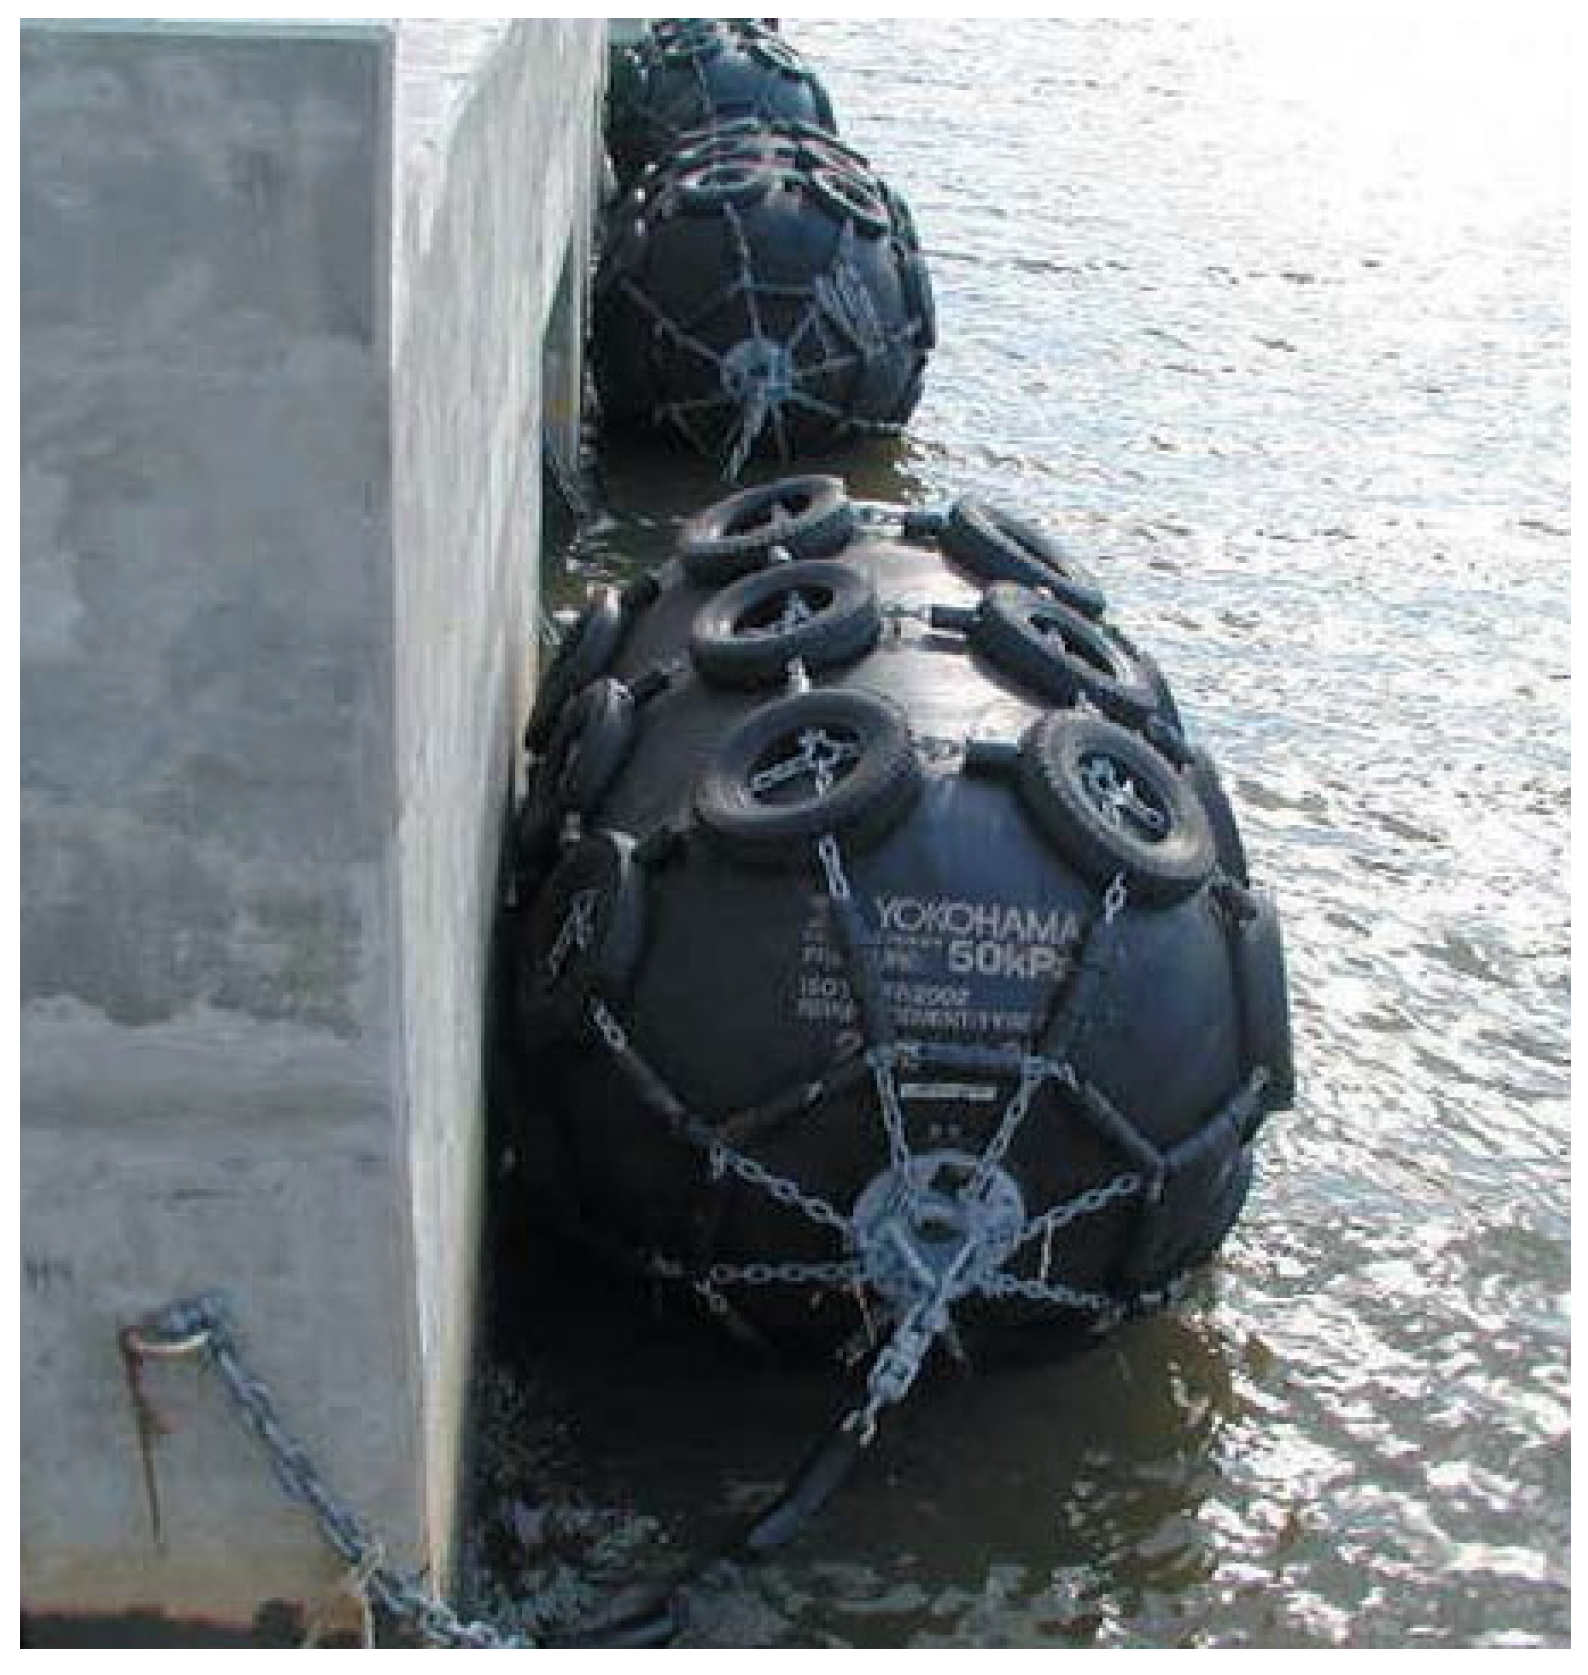
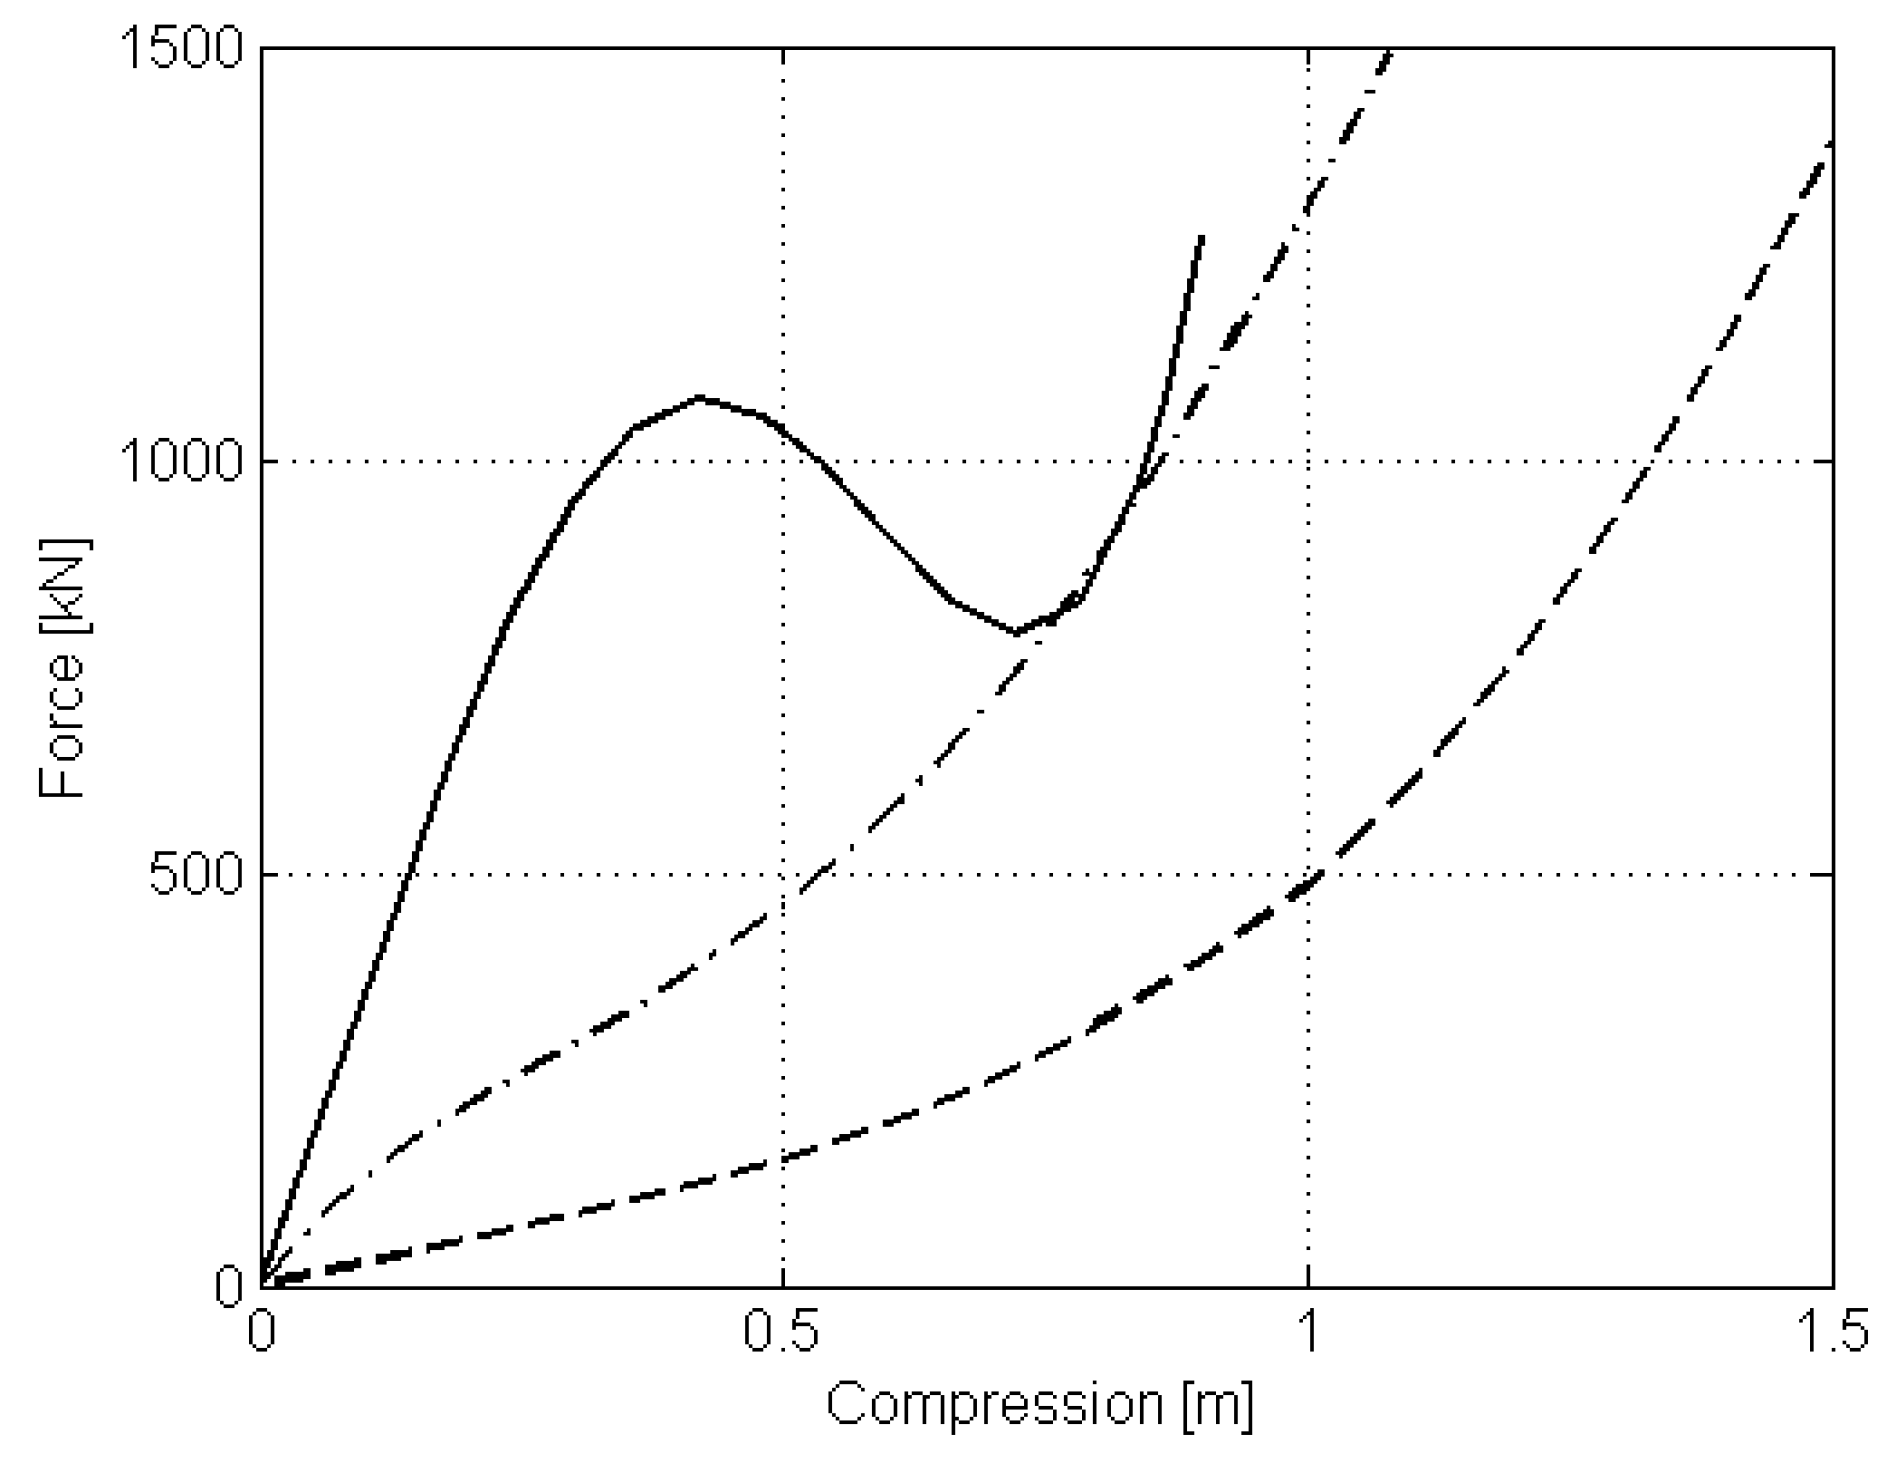
2.2.2. Soft Fenders
- pneumatic fenders, or
- air block fenders.

2.2.3. Combination of Soft Fenders and Large Tension in Breast Lines
- pneumatic fenders and shore-based nylon breast lines,
- pneumatic fenders and constant tension winches on the breast lines,
- air block fenders and constant tension winches on the breast lines.
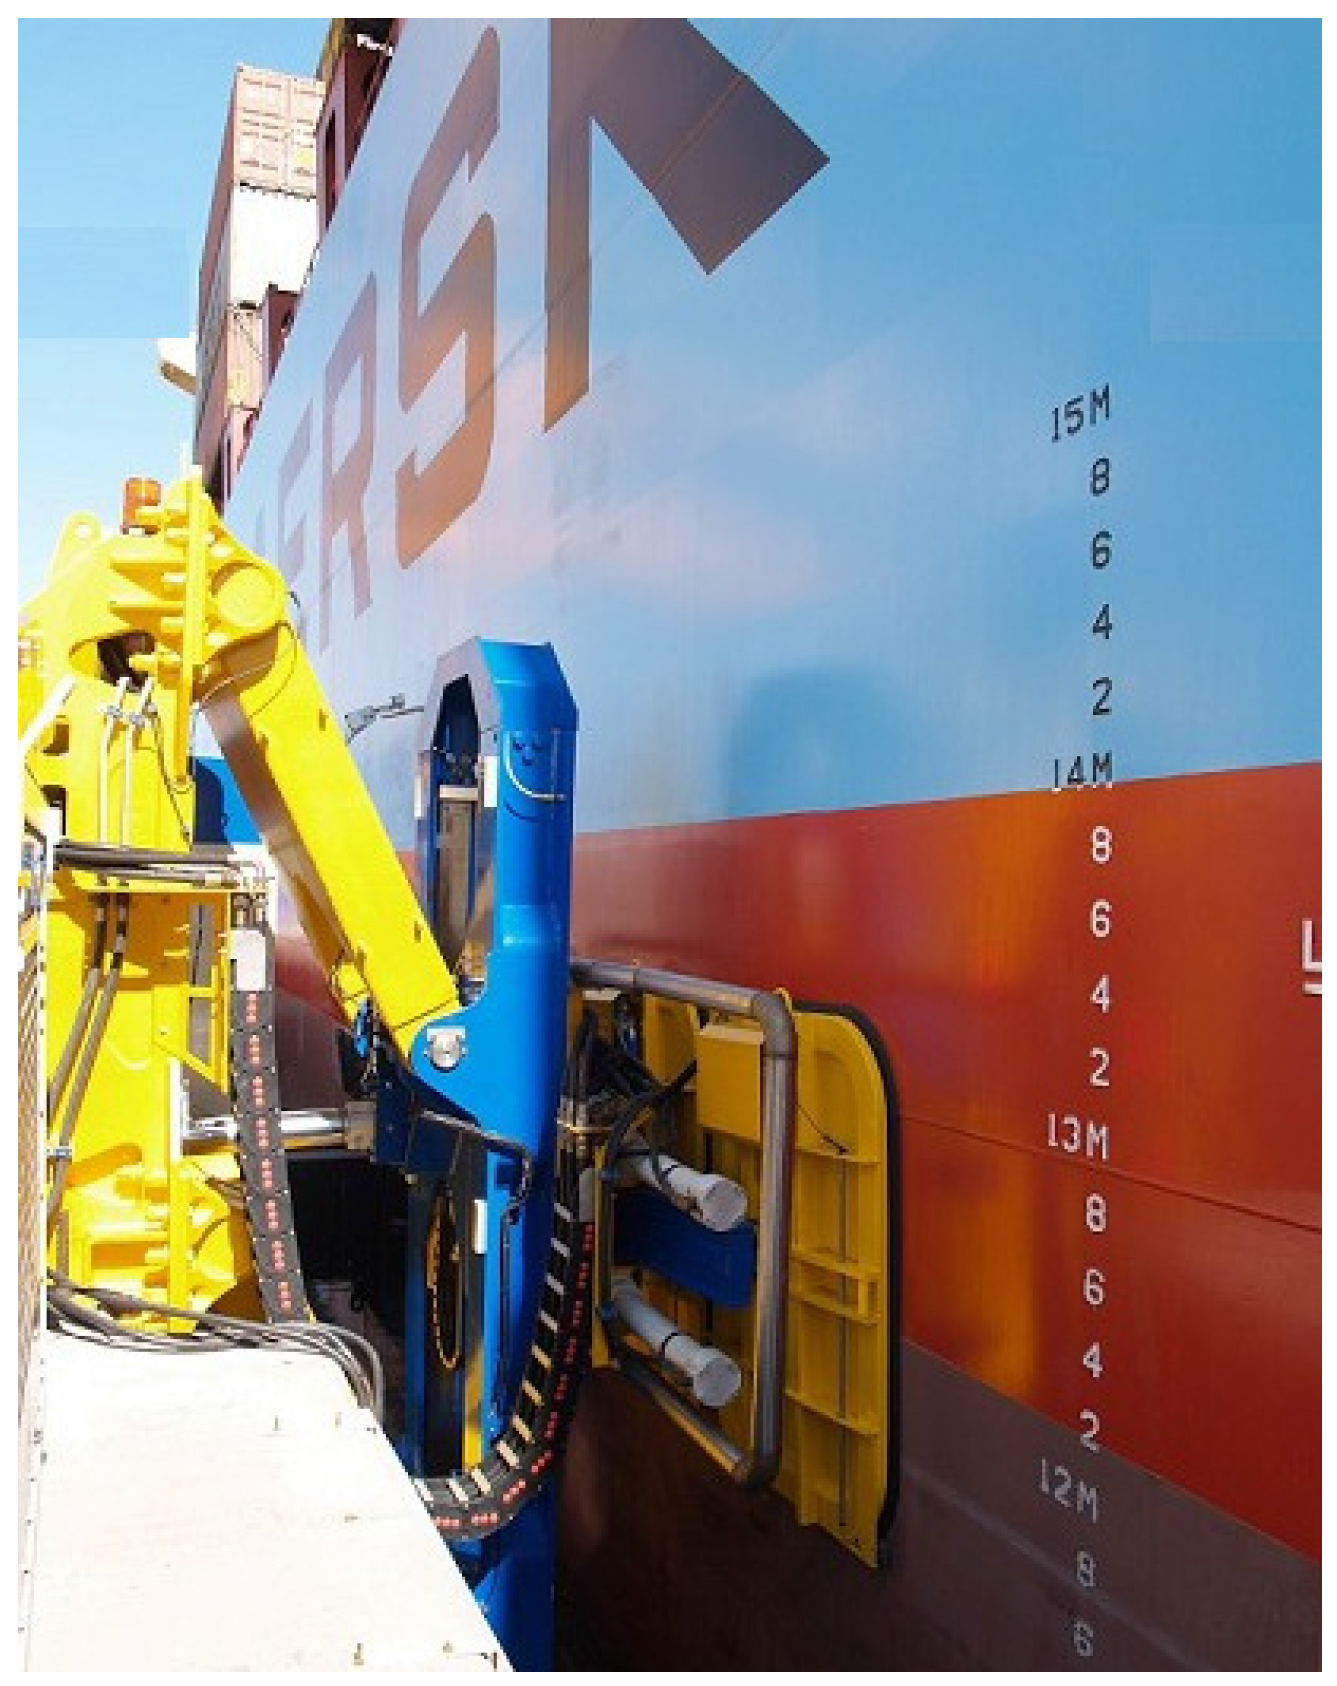
2.2.4. MoorMaster™ Vacuum Mooring System
2.2.5. Other Alternative Mooring Systems
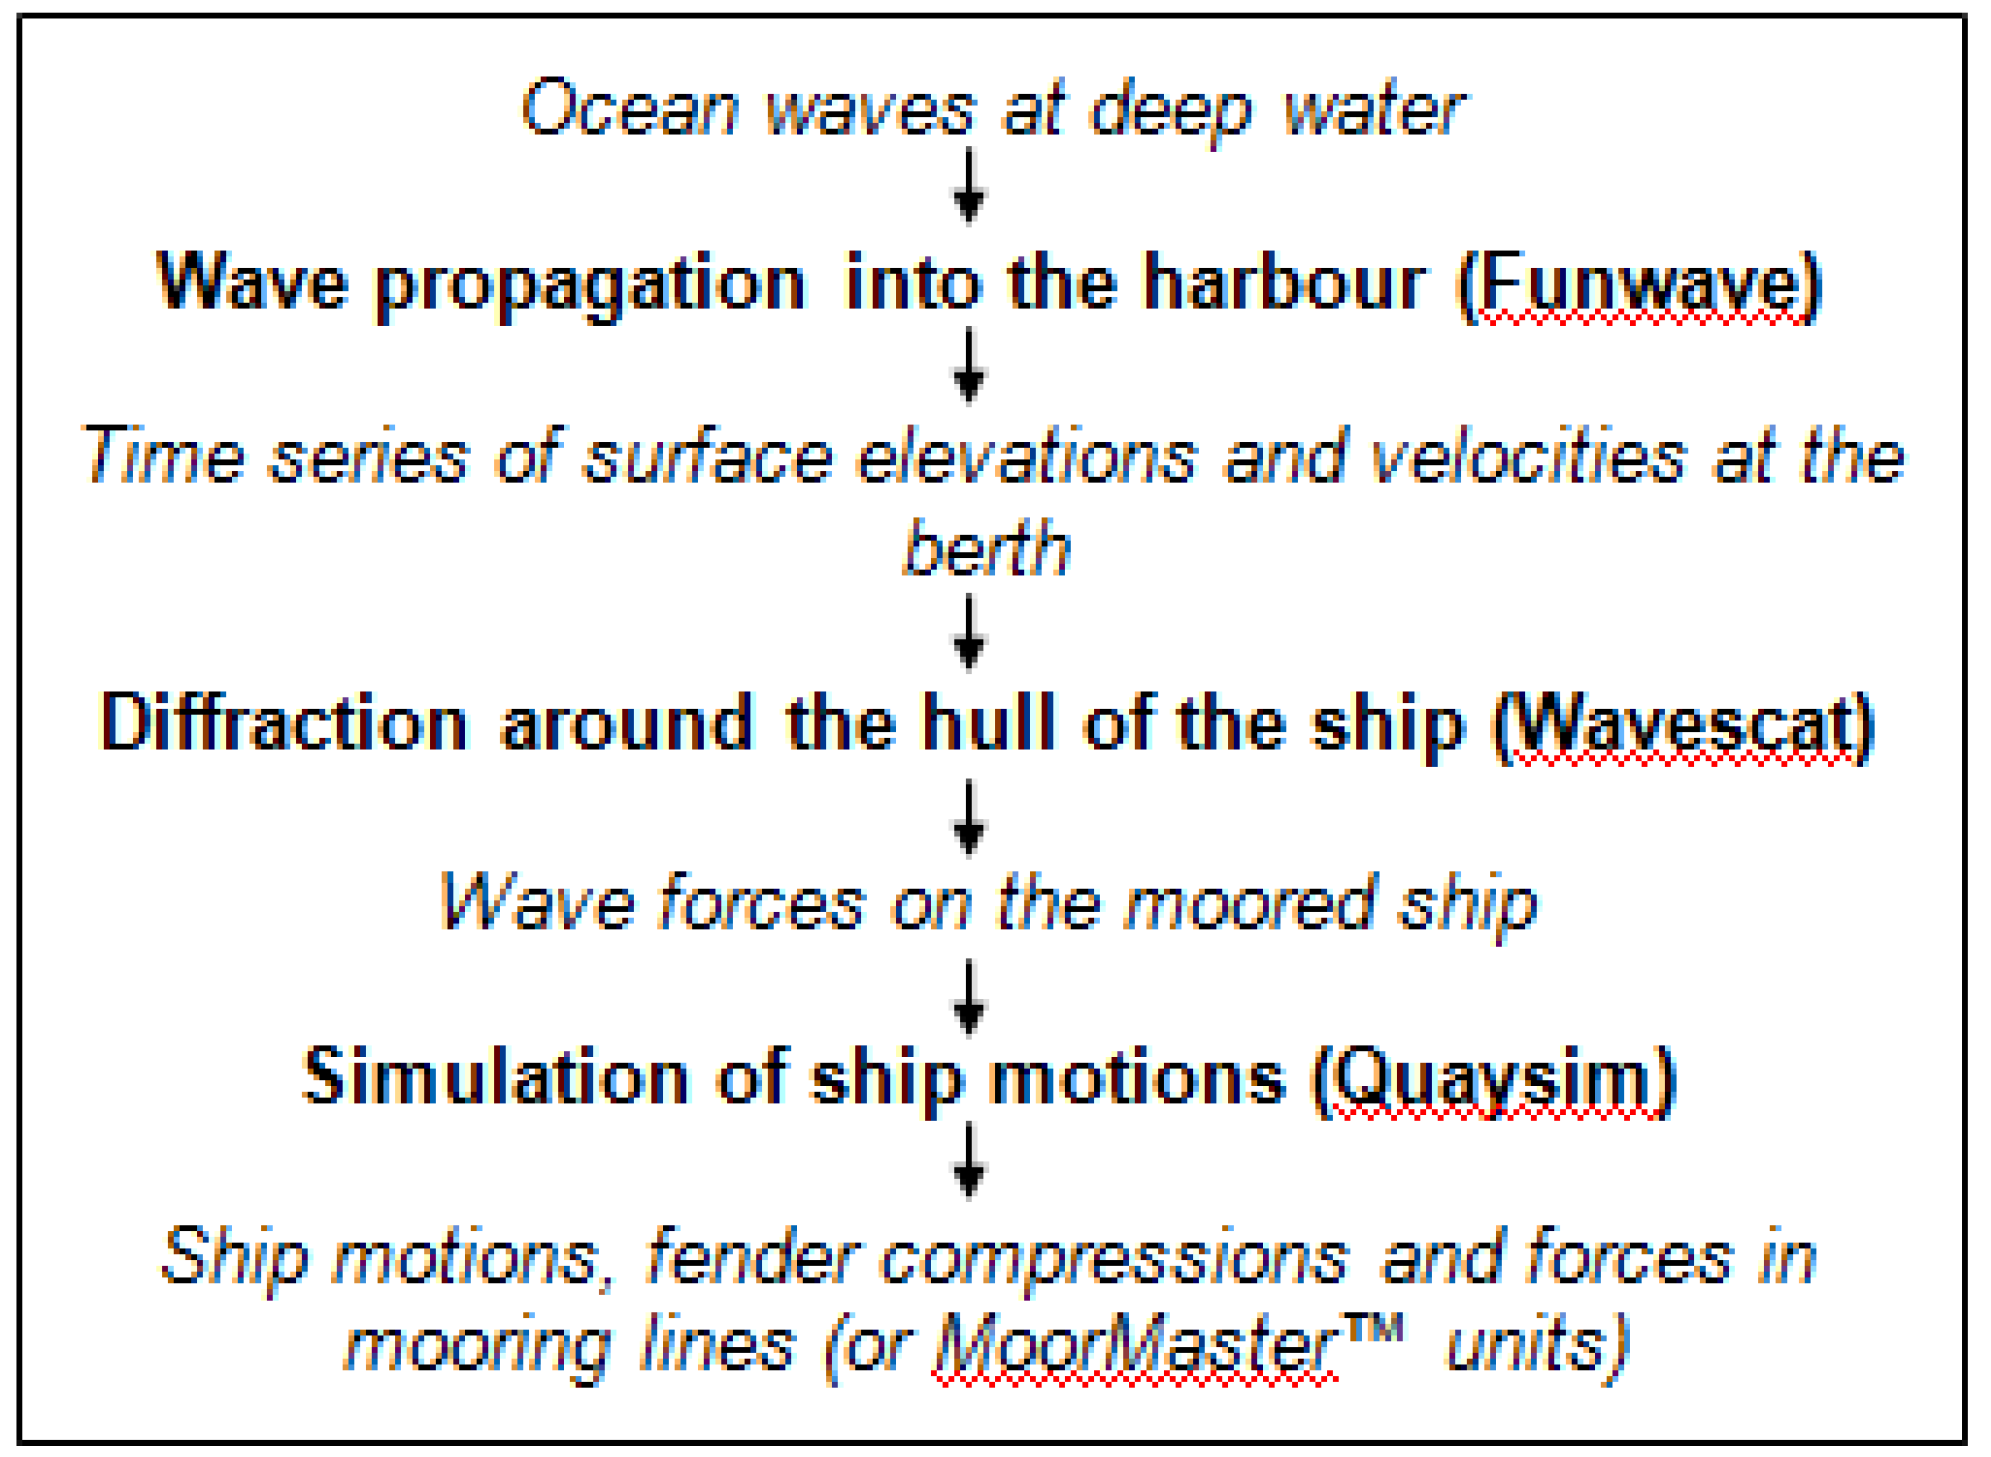
3. Methodology

3.1. Wavescat
3.2. Quaysim
4. Model Set-Up

| Length Over All | 225.00 | m |
| Beam | 32.24 | m |
| Draft | 12.50 | m |
- nylon tails,
- Dyneema lines with nylon tails,
- nylon breast lines,
- constant tension winches on breast lines,
- pneumatic fenders,
- air block fenders,
- pneumatic fenders + nylon breast lines,
- pneumatic fenders + constant tension winches on breast lines,
- air block fenders + constant tension winches on breast lines,
- MoorMaster™.


Base Case
5. Results
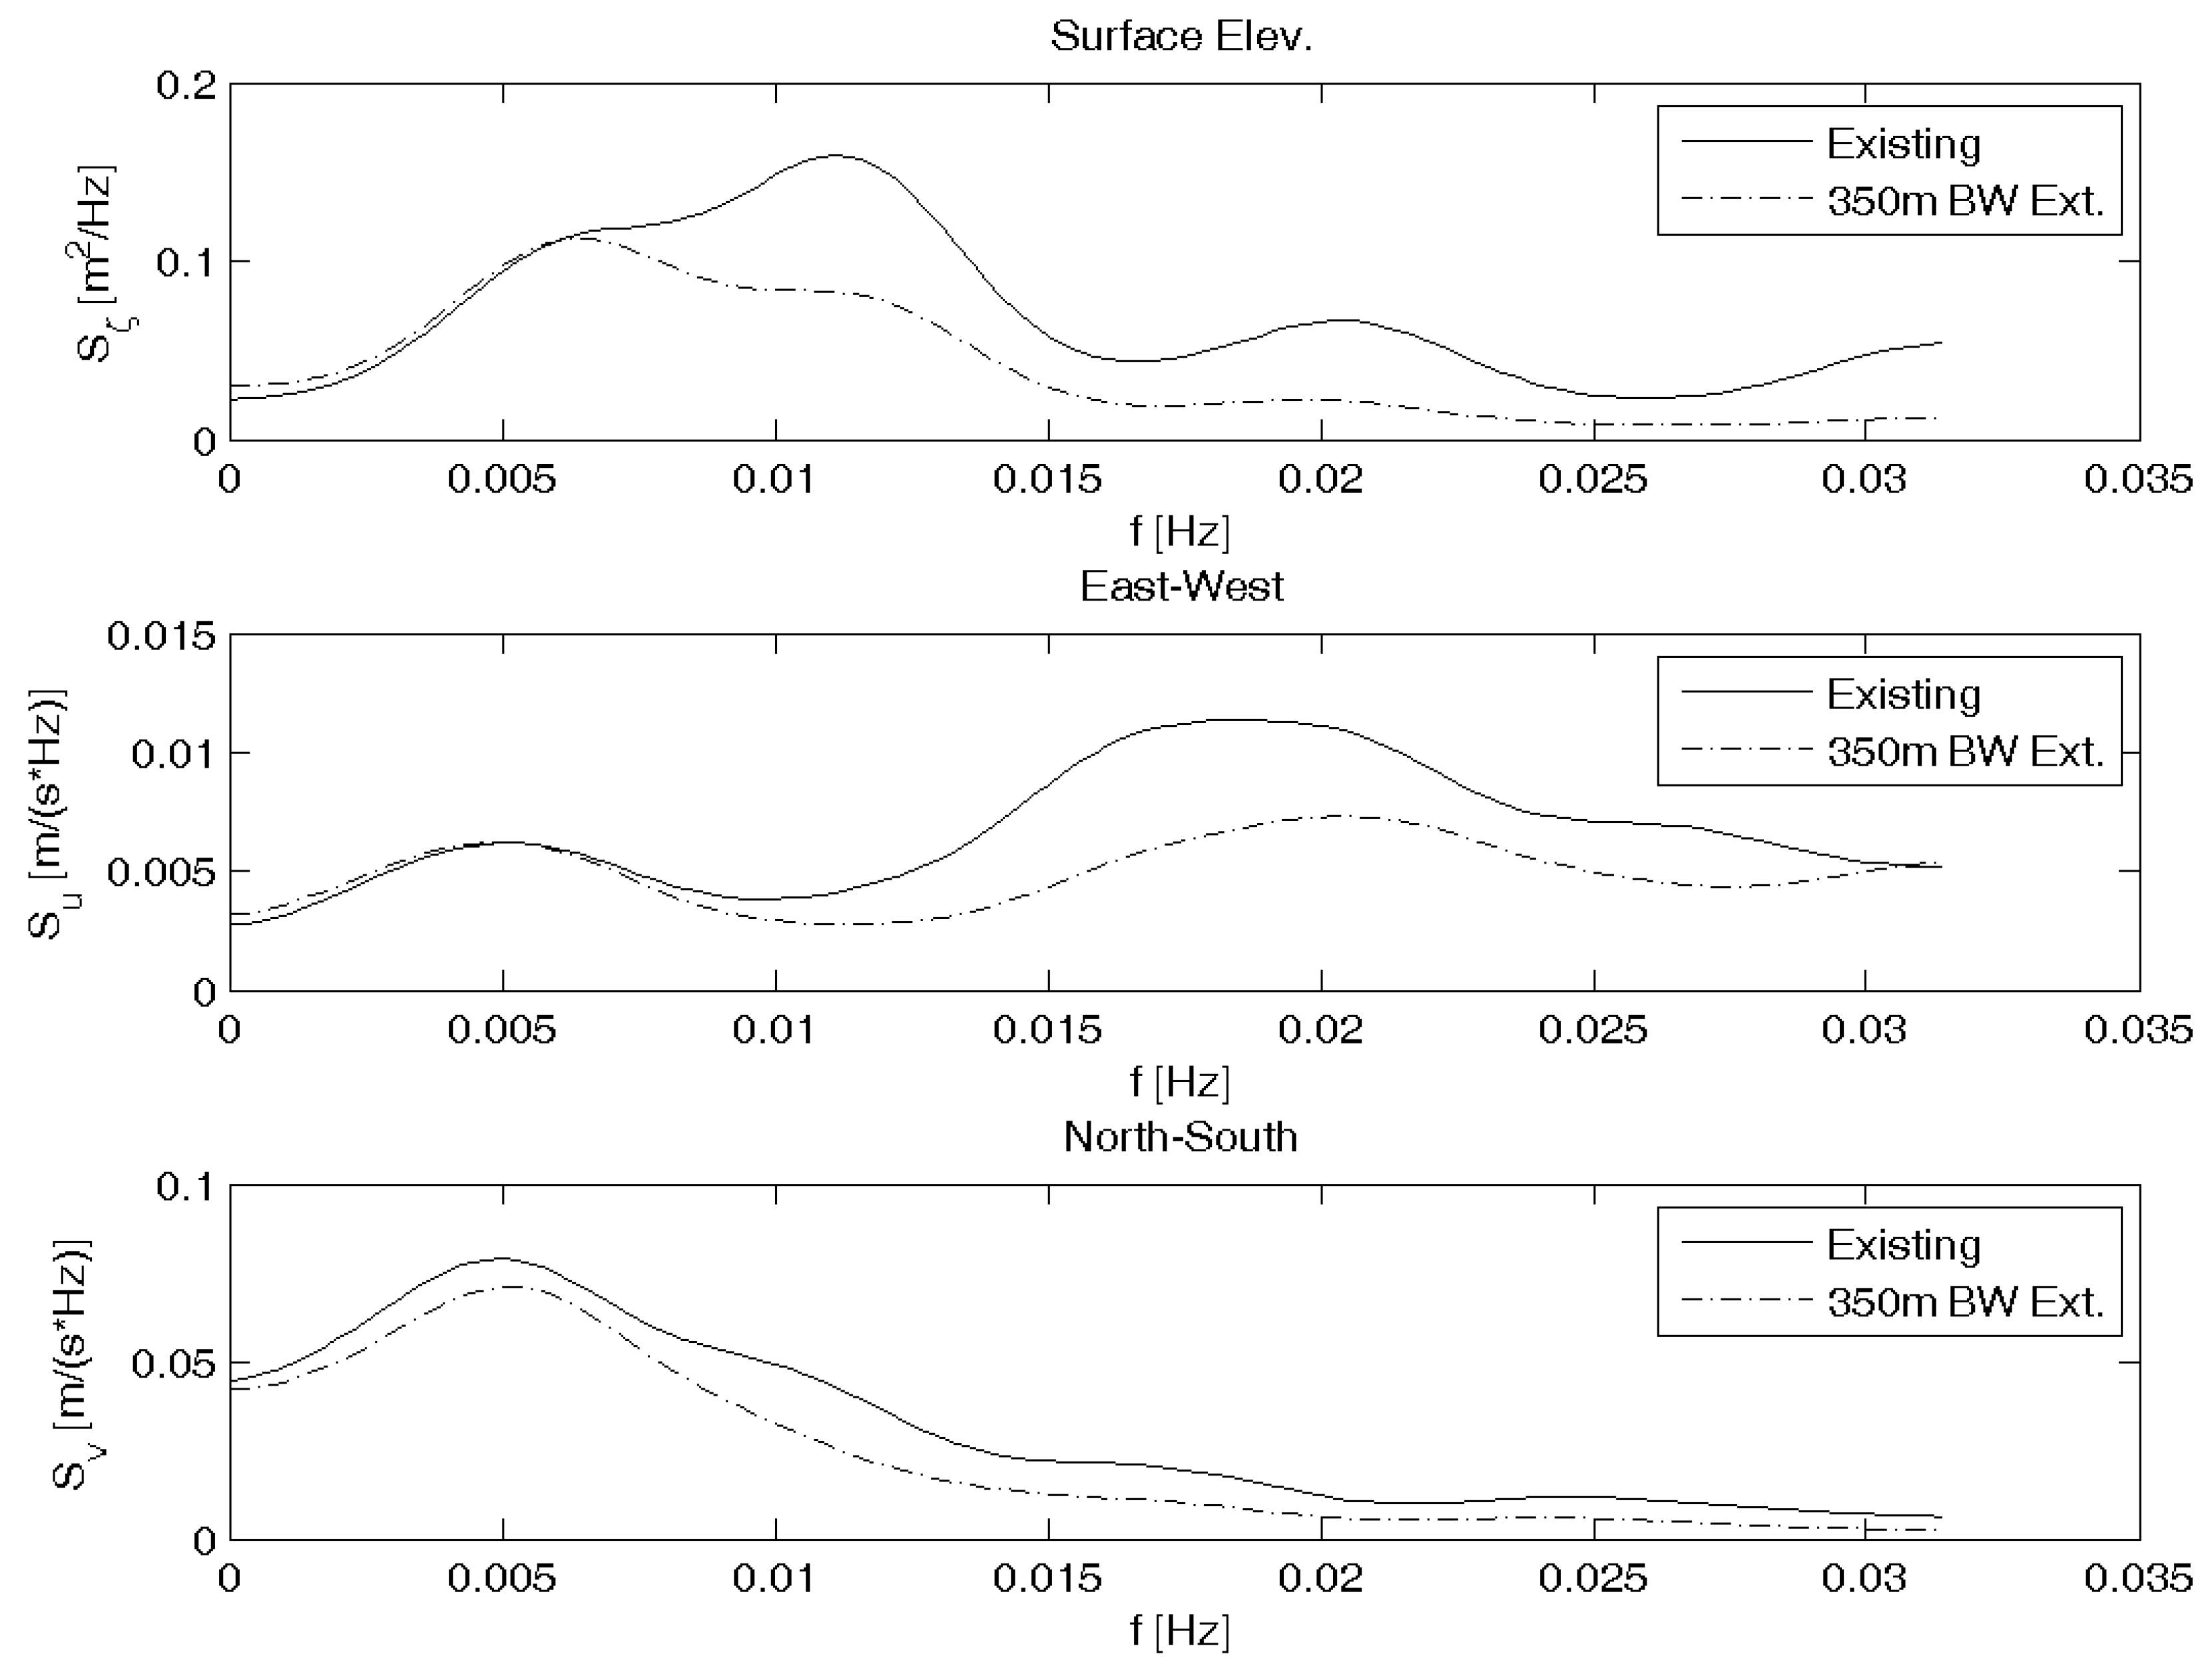
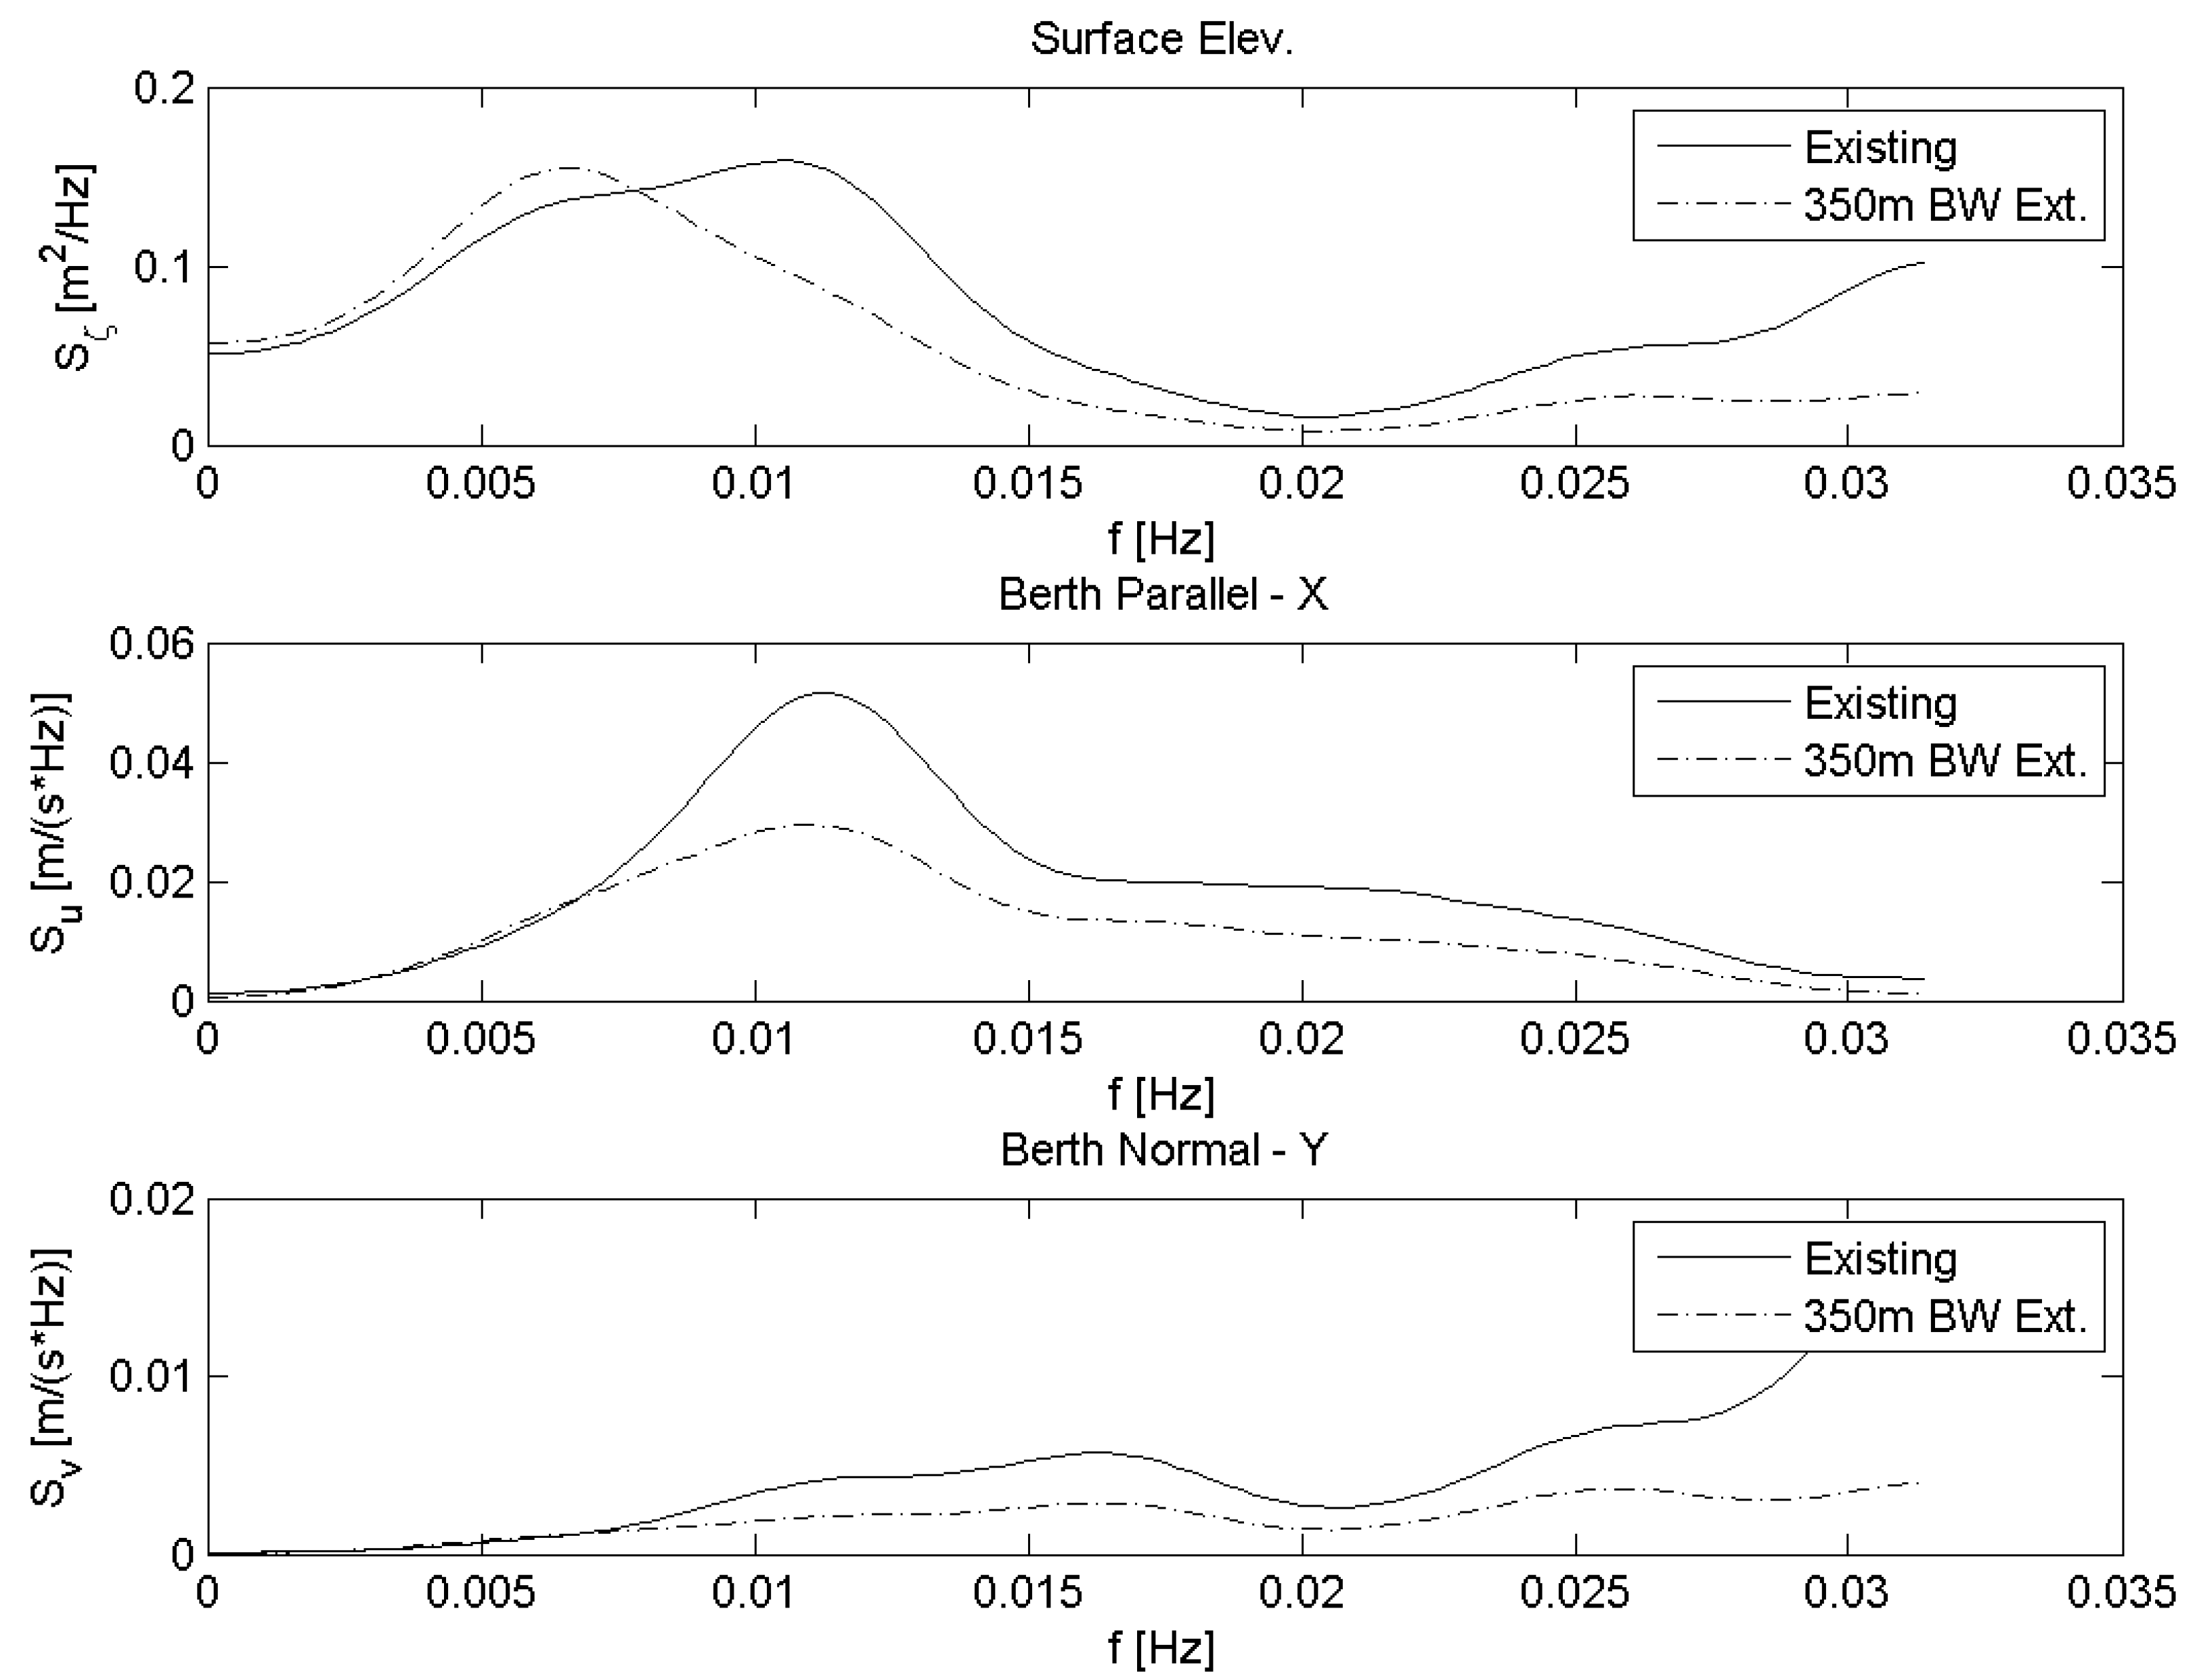
5.1. Long Waves in the Harbour
- East-West direction, first mode between 160 s and 180 s, and second mode near 65 s,
- North-South direction, first mode near 90 s and second mode near 45 s.
| Event | Breakwater | Hm0,LPW | ||
|---|---|---|---|---|
| Extension | Offshore | B3W | B5 | |
| Event 1 | 0 m | 0.09 | 0.18 | 0.20 |
| 200 m | 0.09 | 0.15 | 0.18 | |
| 350 m | 0.09 | 0.13 | 0.17 | |
| Event 3 | 0 m | 0.07 | 0.14 | 0.16 |
| 200 m | 0.07 | 0.12 | 0.15 | |
| 350 m | 0.07 | 0.11 | 0.13 | |
| Event 4 | 0 m | 0.10 | 0.22 | 0.23 |
| 200 m | 0.10 | 0.18 | 0.20 | |
| 350 m | 0.10 | 0.15 | 0.18 | |


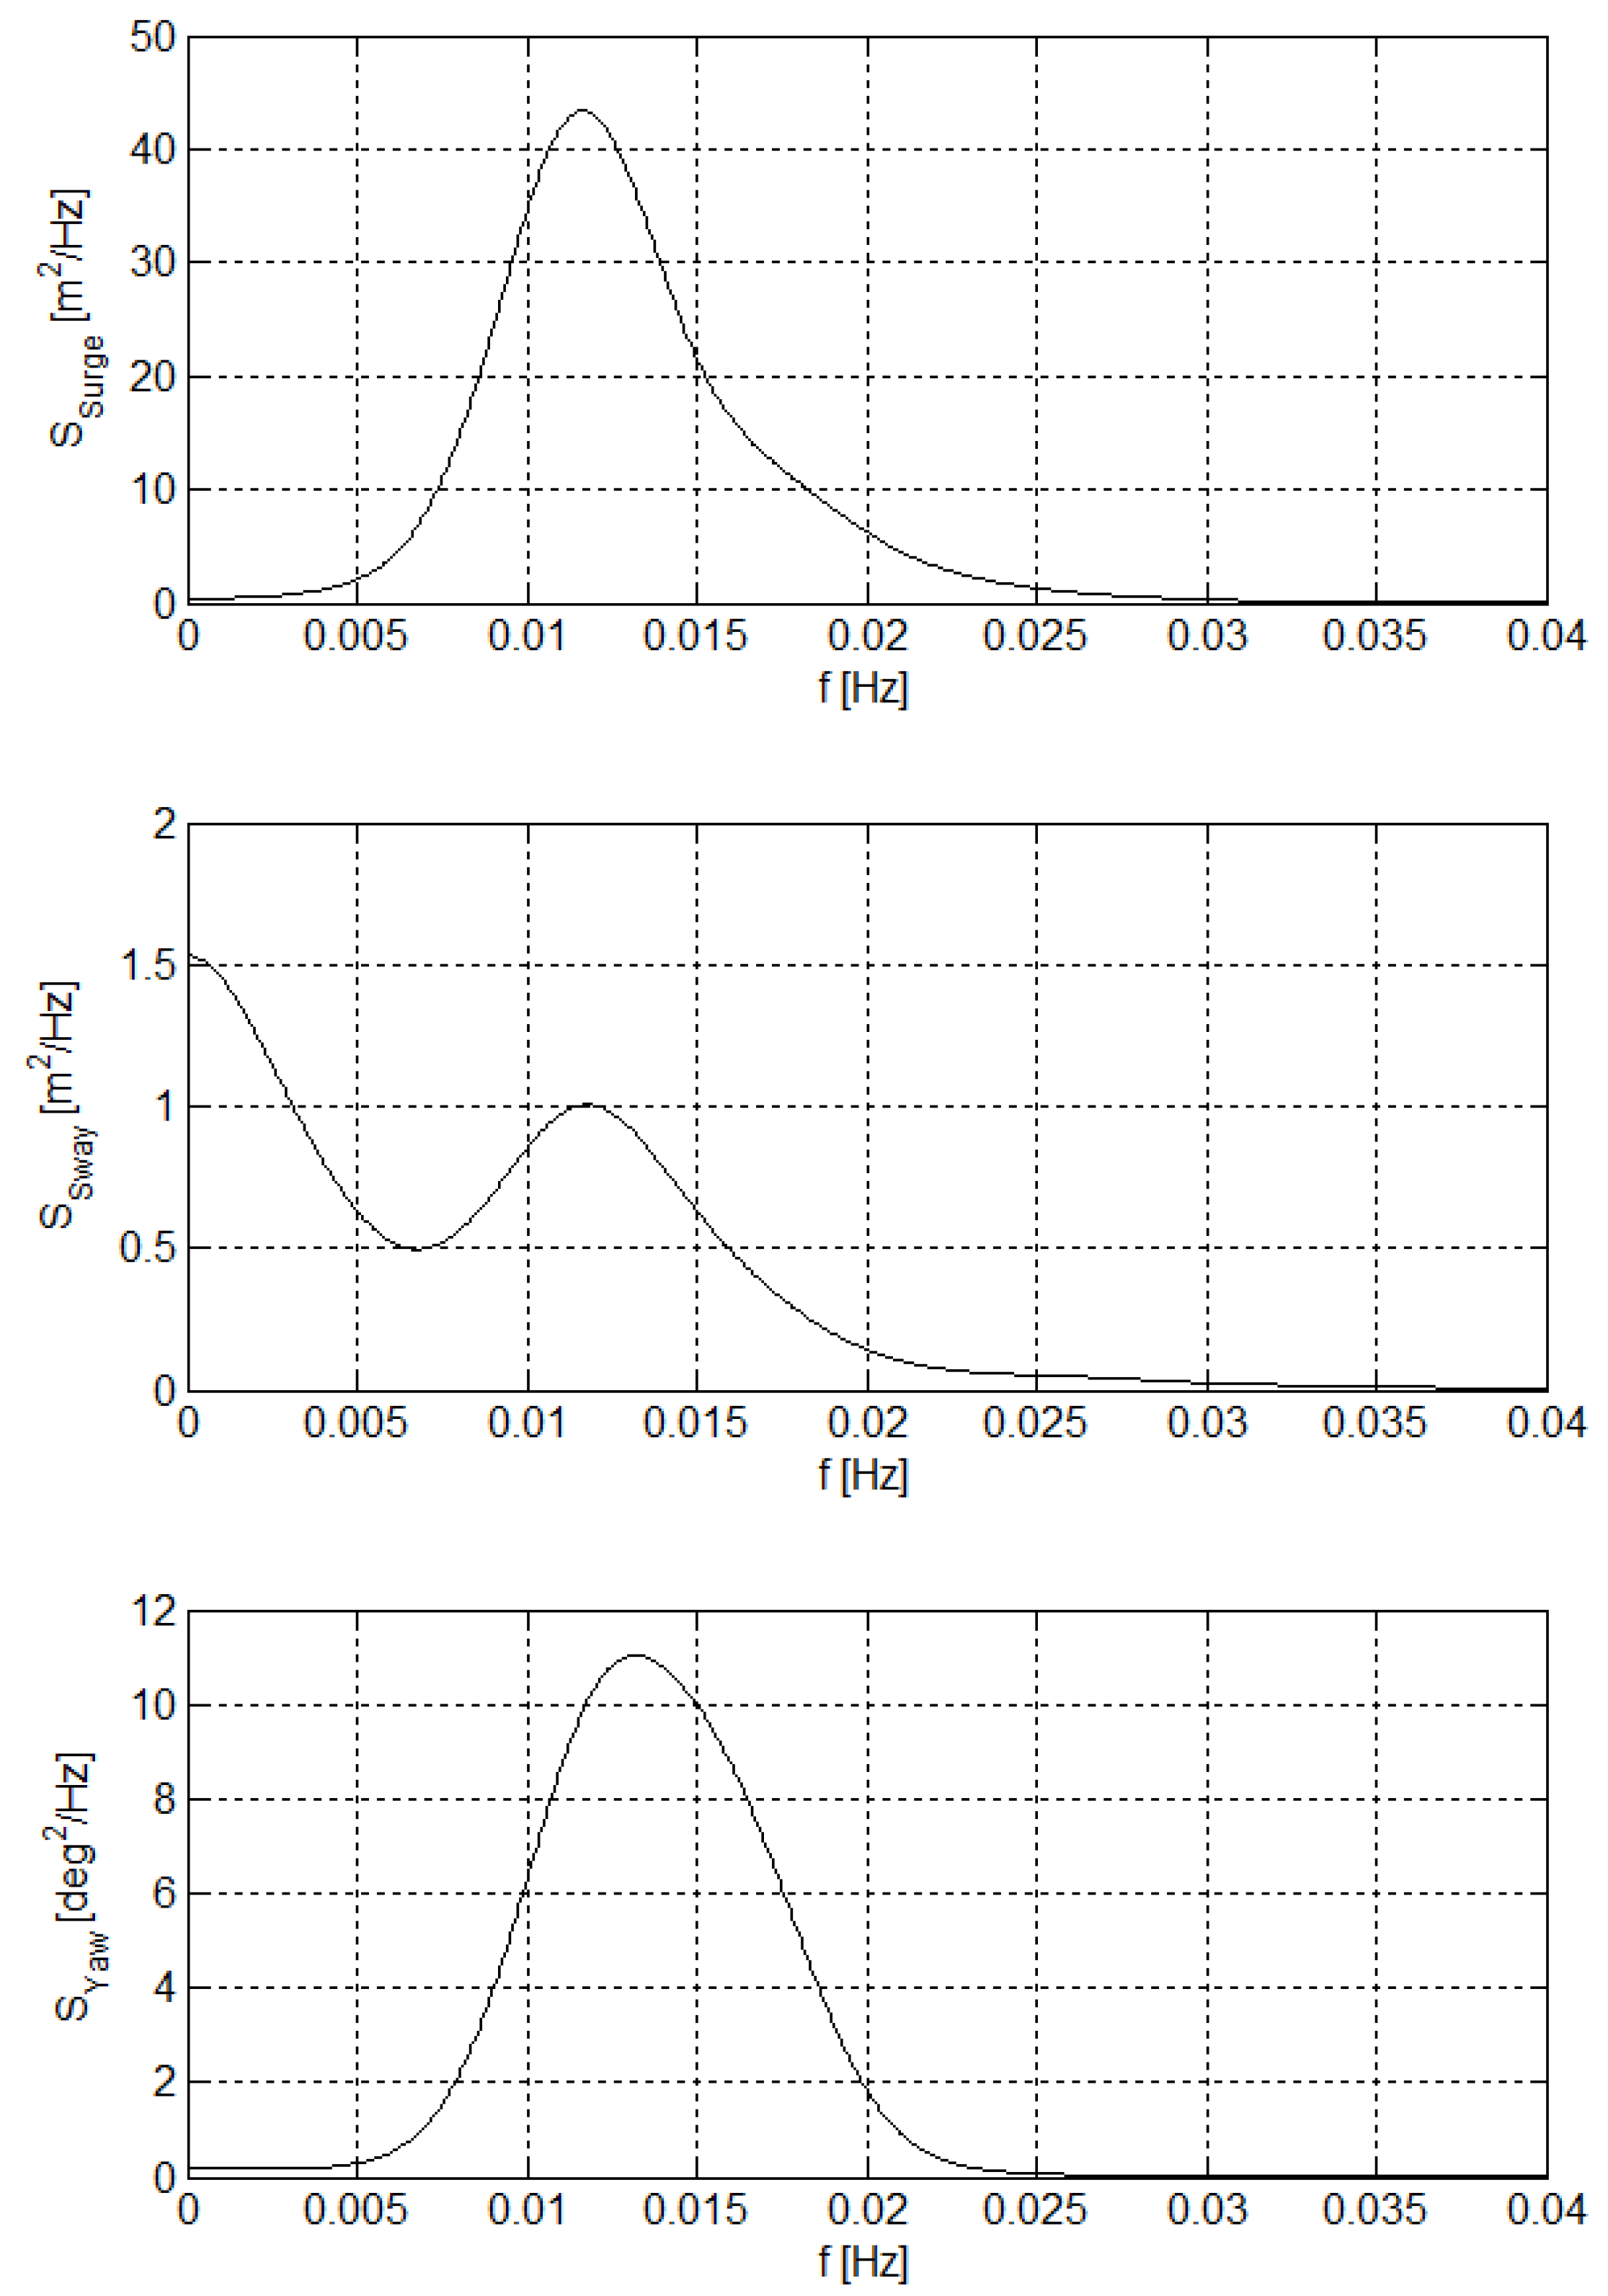
5.2. Vessel Motions and Mooring Forces
5.2.1. Results for the Base Case
| Mode of Motion | Unit | Event | ||
|---|---|---|---|---|
| 1 | 3 | 4 | ||
| Surge | m | 2.66 | 2.30 | 3.00 |
| Sway | m | 0.71 | 0.69 | 0.86 |
| Heave | m | 0.16 | 0.15 | 0.24 |
| Roll | deg | 0.37 | 0.32 | 0.43 |
| Pitch | deg | 0.16 | 0.15 | 0.25 |
| Yaw | deg | 1.51 | 1.18 | 1.57 |
| Mode of Motion | Unit | Event | ||
|---|---|---|---|---|
| 1 | 3 | 4 | ||
| Surge | m | 4.04 | 3.19 | 4.66 |
| Sway | m | 1.09 | 0.89 | 1.22 |
| Heave | m | 0.26 | 0.23 | 0.35 |
| Roll | deg | 0.68 | 0.53 | 0.72 |
| Pitch | deg | 0.28 | 0.23 | 0.39 |
| Yaw | deg | 2.64 | 1.95 | 2.53 |
| Mooring lines | Unit | Event | ||
|---|---|---|---|---|
| 1 | 3 | 4 | ||
| Stern lines | kN | 200 | 144 | 209 |
| Aft breast lines | kN | 285 | 189 | 277 |
| Aft spring lines | kN | 336 | 258 | 317 |
| Forward spring lines | kN | 298 | 232 | 364 |
| Forward breast lines | kN | 223 | 178 | 236 |
| Bow lines | kN | 222 | 178 | 233 |
| Fender | Unit | Event | ||
|---|---|---|---|---|
| 1 | 3 | 4 | ||
| F1 (aft) | m | 0.00 | 0.00 | 0.00 |
| F2 | m | 1.01 | 0.70 | 0.85 |
| F3 | m | 0.29 | 0.21 | 0.32 |
| F4 | m | 0.49 | 0.43 | 0.51 |
| F5 (forward) | m | 0.18 | 0.06 | 0.24 |

- some worn-out mooring lines break at lower loads than the design line force,
- the vessel response is slightly underestimated due to approximations in the calculation of the long wave forces on the ship, or
- the vessel response is larger in some conditions in reality due to the effect of wind.
5.2.2. Results for Extending the Western Breakwater and Different Mooring Configurations
| Mooring Config./Breakw. Ext. | Event | ||
|---|---|---|---|
| 1 | 3 | 4 | |
| Base case, polypropylene lines | 4.04 | 3.19 | 4.66 |
| Breakwater extension, 200 m | 4.00 | 3.03 | 4.01 |
| Breakwater extension, 350 m | 3.64 | 2.62 | 3.51 |
| Nylon tails | 4.65 | 3.57 | 4.84 |
| Dyneema lines with nylon tails | 2.82 | 2.21 | 3.84 |
| Nylon breast lines | 4.19 | 2.56 | 3.73 |
| Constant tension winches | 4.16 | 2.46 | 3.79 |
| Pneumatic fenders | 3.74 | 2.18 | 4.14 |
| Air block fenders | 4.20 | 3.17 | 4.75 |
| Pneumatic f. + Nylon breast lines | 1.86 | 1.23 | 2.96 |
| Pneum. f. + Const. tens. winches | 2.45 | 1.15 | 2.92 |
| Air bl. f. + Const. tens. winches | 3.80 | 2.22 | 3.71 |
| MoorMaster (12 units) | 0.52 | 0.26 | 3.97 |
| Mooring Config./Breakw. Ext. | Event | ||
|---|---|---|---|
| 1 | 3 | 4 | |
| Base case, polypropylene lines | 1.09 | 0.89 | 1.22 |
| Breakwater extension, 200 m | 1.10 | 0.90 | 1.05 |
| Breakwater extension, 350 m | 0.97 | 0.83 | 0.94 |
| Nylon tails | 1.22 | 0.90 | 1.30 |
| Dyneema lines with nylon tails | 0.84 | 0.71 | 0.98 |
| Nylon breast lines | 0.65 | 0.29 | 0.69 |
| Constant tension winches | 0.31 | 0.28 | 0.66 |
| Pneumatic fenders | 1.46 | 1.01 | 1.64 |
| Air block fenders | 1.45 | 1.11 | 1.72 |
| Pneumatic f. + Nylon breast lines | 0.89 | 0.72 | 0.89 |
| Pneum. f. + Const. tens. winches | 1.20 | 0.87 | 0.93 |
| Air bl. f. + Const. tens. winches | 0.97 | 0.70 | 0.75 |
| MoorMaster (12 units) | 0.26 | 0.18 | 1.01 |
| Mooring Config./Breakw. Ext. | Event | ||
|---|---|---|---|
| 1 | 3 | 4 | |
| Base case, polypropylene lines | 2.64 | 1.95 | 2.53 |
| Breakwater extension, 200 m | 2.39 | 1.64 | 2.21 |
| Breakwater extension, 350 m | 2.11 | 1.33 | 2.02 |
| Nylon tails | 2.59 | 1.96 | 2.67 |
| Dyneema lines with nylon tails | 1.53 | 1.06 | 1.90 |
| Nylon breast lines | 1.30 | 0.67 | 1.25 |
| Constant tension winches | 0.57 | 0.52 | 0.93 |
| Pneumatic fenders | 2.09 | 1.45 | 2.06 |
| Air block fenders | 2.59 | 2.05 | 2.77 |
| Pneumatic f. + Nylon breast lines | 1.26 | 1.04 | 1.40 |
| Pneum. f. + Const. tens. winches | 1.83 | 1.38 | 1.49 |
| Air bl. f. + Const. tens. winches | 1.51 | 1.29 | 1.29 |
| MoorMaster (12 units) | 0.78 | 0.58 | 1.92 |
| Mooring Config./Breakw. Ext. | Event | ||
|---|---|---|---|
| 1 | 3 | 4 | |
| Base case, polypropylene lines | 222 | 178 | 233 |
| Breakwater extension, 200 m | 201 | 168 | 203 |
| Breakwater extension, 350 m | 176 | 148 | 187 |
| Nylon tails | 219 | 170 | 239 |
| Dyneema lines with nylon tails | 335 | 241 | 529 |
| Nylon breast lines | 187 | 140 | 208 |
| Constant tension winches | 196 | 142 | 212 |
| Pneumatic fenders | 208 | 154 | 249 |
| Air block fenders | 253 | 193 | 273 |
| Pneumatic f. + Nylon breast lines | 167 | 135 | 197 |
| Pneum. f. + Const. tens. winches | 188 | 152 | 192 |
| Air bl. f. + Const. tens. winches | 219 | 172 | 215 |
| MoorMaster (12 units) | - | - | - |
| Mooring Config./Breakw. Ext. | Event | ||
|---|---|---|---|
| 1 | 3 | 4 | |
| Base case, polypropylene lines | 285 | 189 | 277 |
| Breakwater extension, 200 m | 249 | 161 | 234 |
| Breakwater extension, 350 m | 216 | 141 | 212 |
| Nylon tails | 268 | 182 | 244 |
| Dyneema lines with nylon tails | 304 | 261 | 490 |
| Nylon breast lines | 342 | 305 | 365 |
| Constant tension winches | 296 | 296 | 296 |
| Pneumatic fenders | 271 | 183 | 269 |
| Air block fenders | 317 | 222 | 312 |
| Pneumatic f. + Nylon breast lines | 371 | 335 | 404 |
| Pneum. f. + Const. tens. winches | 297 | 297 | 297 |
| Air bl. f. + Const. tens. winches | 297 | 297 | 297 |
| MoorMaster (12 units) | - | - | - |
| Mooring Config./Breakw. Ext. | Event | ||
|---|---|---|---|
| 1 | 3 | 4 | |
| Base case, polypropylene lines | 336 | 258 | 364 |
| Breakwater extension, 200 m | 323 | 240 | 296 |
| Breakwater extension, 350 m | 276 | 193 | 273 |
| Nylon tails | 305 | 224 | 301 |
| Dyneema lines with nylon tails | 497 | 340 | 651 |
| Nylon breast lines | 292 | 175 | 272 |
| Constant tension winches | 252 | 145 | 251 |
| Pneumatic fenders | 281 | 153 | 310 |
| Air block fenders | 324 | 254 | 376 |
| Pneumatic f. + Nylon breast lines | 149 | 99 | 206 |
| Pneum. f. + Const. tens. winches | 185 | 89 | 222 |
| Air bl. f. + Const. tens. winches | 282 | 150 | 285 |
| MoorMaster (12 units) | - | - | - |
| Mooring Config./Breakw. Ext. | Event | ||
|---|---|---|---|
| 1 | 3 | 4 | |
| Base case, polypropylene lines | 1.01 | 0.70 | 0.85 |
| Breakwater extension, 200 m | 0.87 | 0.60 | 0.68 |
| Breakwater extension, 350 m | 0.71 | 0.47 | 0.66 |
| Nylon tails | 1.00 | 0.69 | 0.90 |
| Dyneema lines with nylon tails | 0.63 | 0.41 | 0.92 |
| Nylon breast lines | 0.59 | 0.37 | 0.66 |
| Constant tension winches | 0.39 | 0.37 | 0.51 |
| Pneumatic fenders | 1.47 | 1.25 | 1.57 |
| Air block fenders | 1.27 | 1.03 | 1.31 |
| Pneumatic f. + Nylon breast lines | 1.52 | 1.39 | 1.58 |
| Pneum. f. + Const. tens. winches | 1.74 | 1.54 | 1.53 |
| Air bl. f. + Const. tens. winches | 1.16 | 1.03 | 1.01 |
| MoorMaster (12 units) | 0.23 | 0.21 | 0.61 |
5.2.3. Discussion of the Results for Extension of the Western Breakwater
5.2.4. Discussion of the Results for Different Mooring Configurations
- The forces are slightly reduced by using nylon mooring tails.
- The forces become larger when using Dyneema mooring lines with nylon tails. However, this could, in practice, still be a better solution than the ship’s mooring lines, since the shore-based lines are better maintained.
- Addition of strong nylon breast lines under a high pretension of 25 t or breast lines under a constant tension of 30 t significantly reduces the vessel motions and mooring forces.
- Use of pneumatic fenders leads to a similar significant improvement as the nylon breast lines, while the improvement with air block fenders is less. This is because the pneumatic fenders are softer than air block fenders.
- MoorMaster units effectively reduce the vessel motions. However, the motions exceed the thresholds for maximum excursions of the arms of the MoorMaster units for Event 4. This means that more than the 12 units as tested are required.
- The largest reduction of vessel motions and mooring forces, not considering the MoorMaster units, are achieved with the combination of pneumatic fenders and nylon breast lines or constant tension winches.
5.3. Threshold Long Wave Heights
| Mooring Configuration/Breakwater Ext. | Threshold |
|---|---|
| Base case, polypropylene lines | 0.12 |
| Breakwater extension, 350 m | 0.15 |
| Nylon breast lines | 0.14 |
| Constant tension winches | 0.14 |
| Pneumatic fenders | 0.15 |
| Pneumatic fenders + Nylon breast lines | 0.18 |
| Pneumatic fenders + Const. tens. winches | 0.18 |
- The effectiveness of the 350 m breakwater extension, nylon breast lines, constant tension winches, and pneumatic fenders are fairly similar.
- A significantly better improvement is achieved when combining the pneumatic fenders with nylon breast lines or constant tension winches.
- It is interesting to note that the effectiveness of pneumatic fenders and nylon breast lines or constant tension winches is more than the sum of the improvements of pneumatic fenders and tensioned breast lines (nylon or constant tension). This confirms the statement that mooring lines and fenders work very well together in the combined option to keep the vessel in the fenders and reduce the surge motions.
6. Conclusions
Author Contributions
Conflicts of Interest
References
- Cardno Lawson Treloar. Wave and Ship Mooring Study; Report J2321/R2163; Cardno Lawson Treloar: Gordon, Australia, 2004. [Google Scholar]
- MetOcean Solutions. Long Waves at Geraldton; MetOcean Solutions: New Plymouth, New Zealand, 2006. [Google Scholar]
- MetOcean Solutions. Long Period Waves at Geraldton Port. Wave Measurements from 2013; Report P0146–02; MetOcean Solutions: New Plymouth, New Zealand, 2014. [Google Scholar]
- McComb, P.; Johnson, D.; Beamsley, B. Numerical study of options to reduce swell and long waves at port geraldton. In Proceedings of the Coasts & Ports 2009, Wellington, New Zealand, 16–18 September 2009.
- Ahuja, M.M.; Mani, C.S.; Joshi, A.K. LNG Berths for Open Seas. Part 2: Dahej LNG Terminal, a Case Study. Port Technol. Int. 2010, 46, 125–129. [Google Scholar]
- Yoneyama, H.; Asakura, K.; Kawasaki, T.; Otake, Y. Development of a reduction system for low-frequency ship motions and its field experiments by using a large ship. In Proceedings of the 19th ISOPE Conference, Osaka, Japan, 21–26 June 2009; pp. 1117–1123.
- Sakakibara, S.; Kubo, M. Effect of Mooring System on Moored Ship Motions and Harbour Tranquility. Int. J. Ocean Syst. Manag. 2008, 1, 84–99. [Google Scholar] [CrossRef]
- Goring, D.B. Ship surging induced by long waves in Port of Salalah, Oman. In Proceedings of the Coasts & Ports 2005 Conference, Adelaide, Australia, 20–23 July 2005.
- Van Deyzen, A.F.J.; Beimers, P.B.; Van der Lem, J.C.; Messiter, D.; De Bont, J.A.M. To improve the efficiency of ports exposed to swell. In Proceedings of the Coasts & Ports 2015 Conference, Auckland, New Zealand, 15–18 September 2015.
- Oil Companies International Marine Forum (OCIMF). Mooring Equipment Guidelines, 3rd Ed. ed; Witherby: London, UK, 2008; p. 278. [Google Scholar]
- De Bont, J.A.M.; van der Molen, W.; van der Lem, J.C.; Mühlestein, D.; Ligteringen, H.; Howie, M. Calculations of the motions of a ship moored with the Moormaster™ units. In Proceedings of the 32nd PIANC International Navigation Congress, Liverpool, UK, 10–14 May 2010; pp. 622–635.
- Cavotec Home Cavotec Home Page. Available online: www.cavotec.com (accessed on 5 October 2015).
- Van der Burg, G. ShoreTension: Secured to shore all times. Port Technol. Int. 2012, 52, 43–45. [Google Scholar]
- Van Deyzen, A.F.J.; Van der Lem, J.C.; Beimers, P.B.; De Bont, J.A.M. The effect of active motion dampening systems on the behaviour of moored ships. In Proceedings of the 33rd PIANC World Congress, San Francisco, CA, USA, 1–5 June 2014.
- Van Reenen, W. Dock Lock: Automatic Magnetic Mooring. United Nations Economic Commission for Europe. Available online: www.unece.org/trans/main/dgdb/ac2/ac2inf23.html (accessed on 5 October 2015).
- Wei, G.; Kirby, J.T. Time-dependent Numerical Code for Extended Boussinesq Equations. J. Waterw. Port Coast. Ocean Eng. 1995, 129, 124–135. [Google Scholar] [CrossRef]
- Metocean Solutions. Reducing Long Period Wave Energy at Geraldton. In Numerical Modelling of Changes to Long Period Wave Energy in the Geraldton Harbour Basin Resulting from Breakwater Extensions; Report 0015-05; Metocean Solutions: New Plymouth, New Zealand, 2011. [Google Scholar]
- Johnson, D.; McComb, P. Modelling long wave generation and propagation around and within ports. In Proceedings of the Coasts & Ports 2011, Perth, Australia, 28–30 September 2011.
- Johnson, D. DIWASP, A Directional Wave Spectra Toolbox for MATLAB®: User Manual; Research Report WP-1601-DJ (V1.1); Centre for Water Research, University of Western Australia: Perth, Australia, 2002. [Google Scholar]
- Van der Molen, W. Boundary Element Model Wavescat: Description and Validation; W.F. Baird & Associates Report: Ottawa, QC, Canada, 2014. [Google Scholar]
- Shiraishi, S.; Kubo, M.; Sakakibara, S.; Sasa, K. A study on numerical simulation methods to reproduce long-period ship motions. In Proceedings of the 9th ISOPE Conference, Brest, France, 30 May–4 June 1999; pp. 536–543.
- Van der Molen, W.; Monárdez, P.; Van Dongeren, A.R. Numerical Simulation of Long-Period Waves and Ship Motions in Tomakomai Port, Japan. Coast. Eng. J. 2006, 48, 59–79. [Google Scholar] [CrossRef]
- The World Association for Waterborne Transport Infrastructure (PIANC). Criteria for Movement of Moored Ships in Harbours: A Practical Guide (Supplement to Bulletin No 88) Report of Working Group PCT II-24. PIANC: Bruxelles, Belgium, 1995. [Google Scholar]
© 2015 by the authors; licensee MDPI, Basel, Switzerland. This article is an open access article distributed under the terms and conditions of the Creative Commons Attribution license ( http://creativecommons.org/licenses/by/4.0/).
Share and Cite
Van der Molen, W.; Scott, D.; Taylor, D.; Elliott, T. Improvement of Mooring Configurations in Geraldton Harbour. J. Mar. Sci. Eng. 2016, 4, 3. https://doi.org/10.3390/jmse4010003
Van der Molen W, Scott D, Taylor D, Elliott T. Improvement of Mooring Configurations in Geraldton Harbour. Journal of Marine Science and Engineering. 2016; 4(1):3. https://doi.org/10.3390/jmse4010003
Chicago/Turabian StyleVan der Molen, Wim, Doug Scott, David Taylor, and Trevor Elliott. 2016. "Improvement of Mooring Configurations in Geraldton Harbour" Journal of Marine Science and Engineering 4, no. 1: 3. https://doi.org/10.3390/jmse4010003
APA StyleVan der Molen, W., Scott, D., Taylor, D., & Elliott, T. (2016). Improvement of Mooring Configurations in Geraldton Harbour. Journal of Marine Science and Engineering, 4(1), 3. https://doi.org/10.3390/jmse4010003