
Coastal Flood Assessment Based on Field Debris Measurements and Wave Runup Empirical Model


Abstract
:1. Introduction
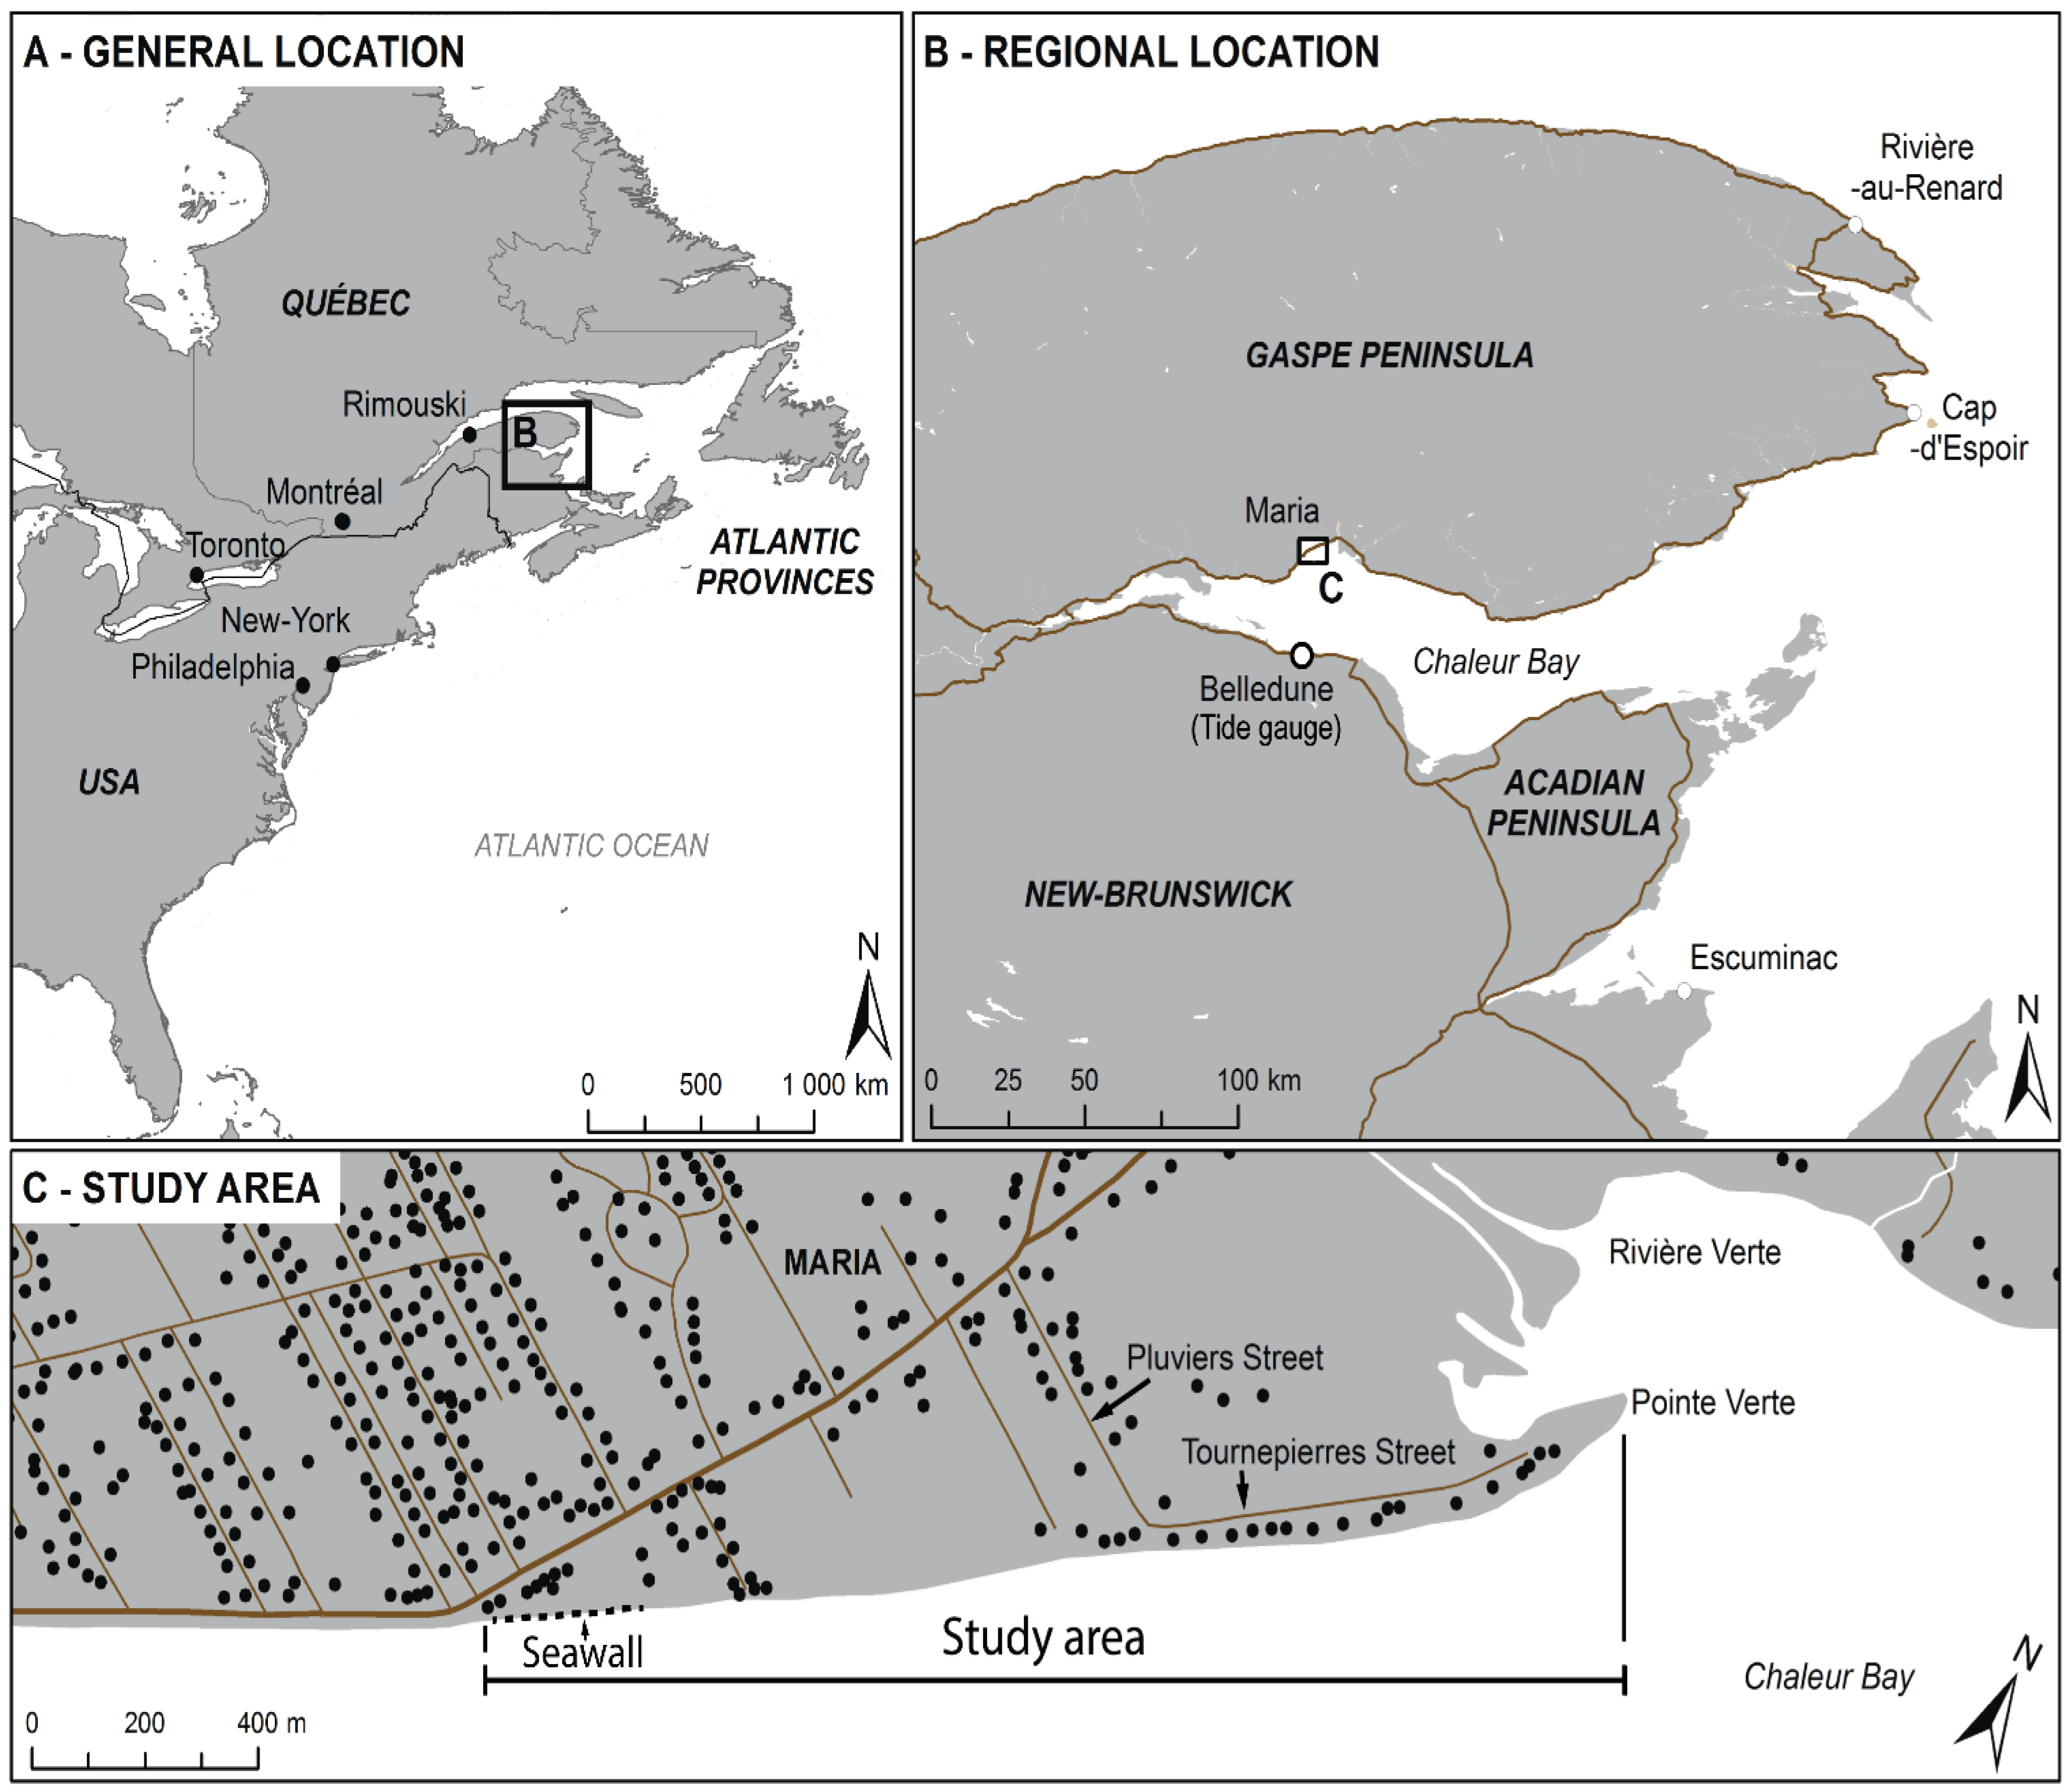
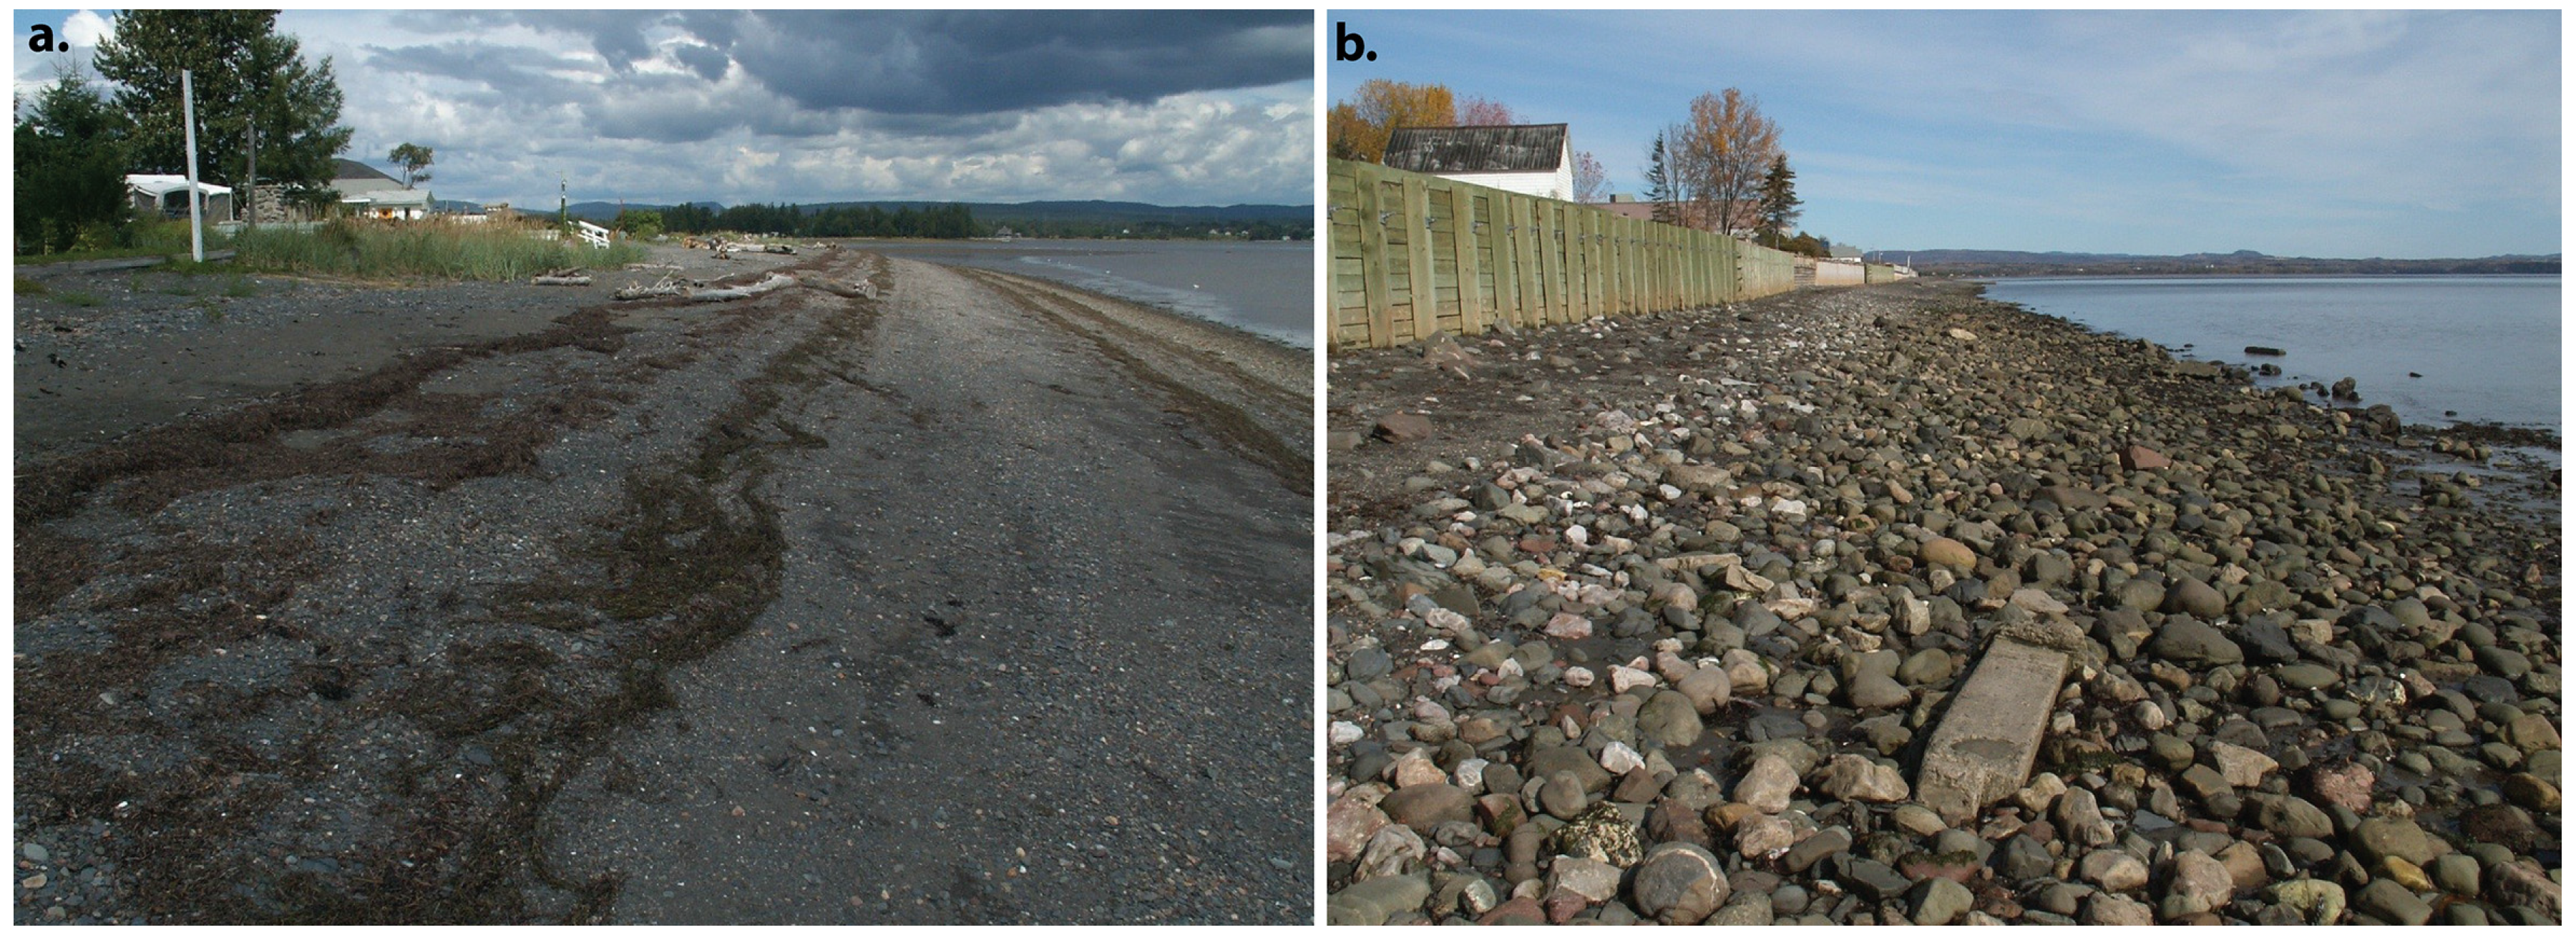
2. Study Area


| Water Levels | Mean Estimated Value (2010) Chart Datum (CD) | Canadian Geodetic Vertical Datum 1928 (CGVD28) |
|---|---|---|
| Extreme level (tide + storm surge) | 3.64 | 2.46 |
| Highest Astronomical Tide (HAT) | 2.84 | 1.66 |
| Mean Sea Level (MSL) | 1.33 | 0.15 |
| Lowest Astronomical tide (LAT) | 0.1 | −1.08 |
3. Methodology
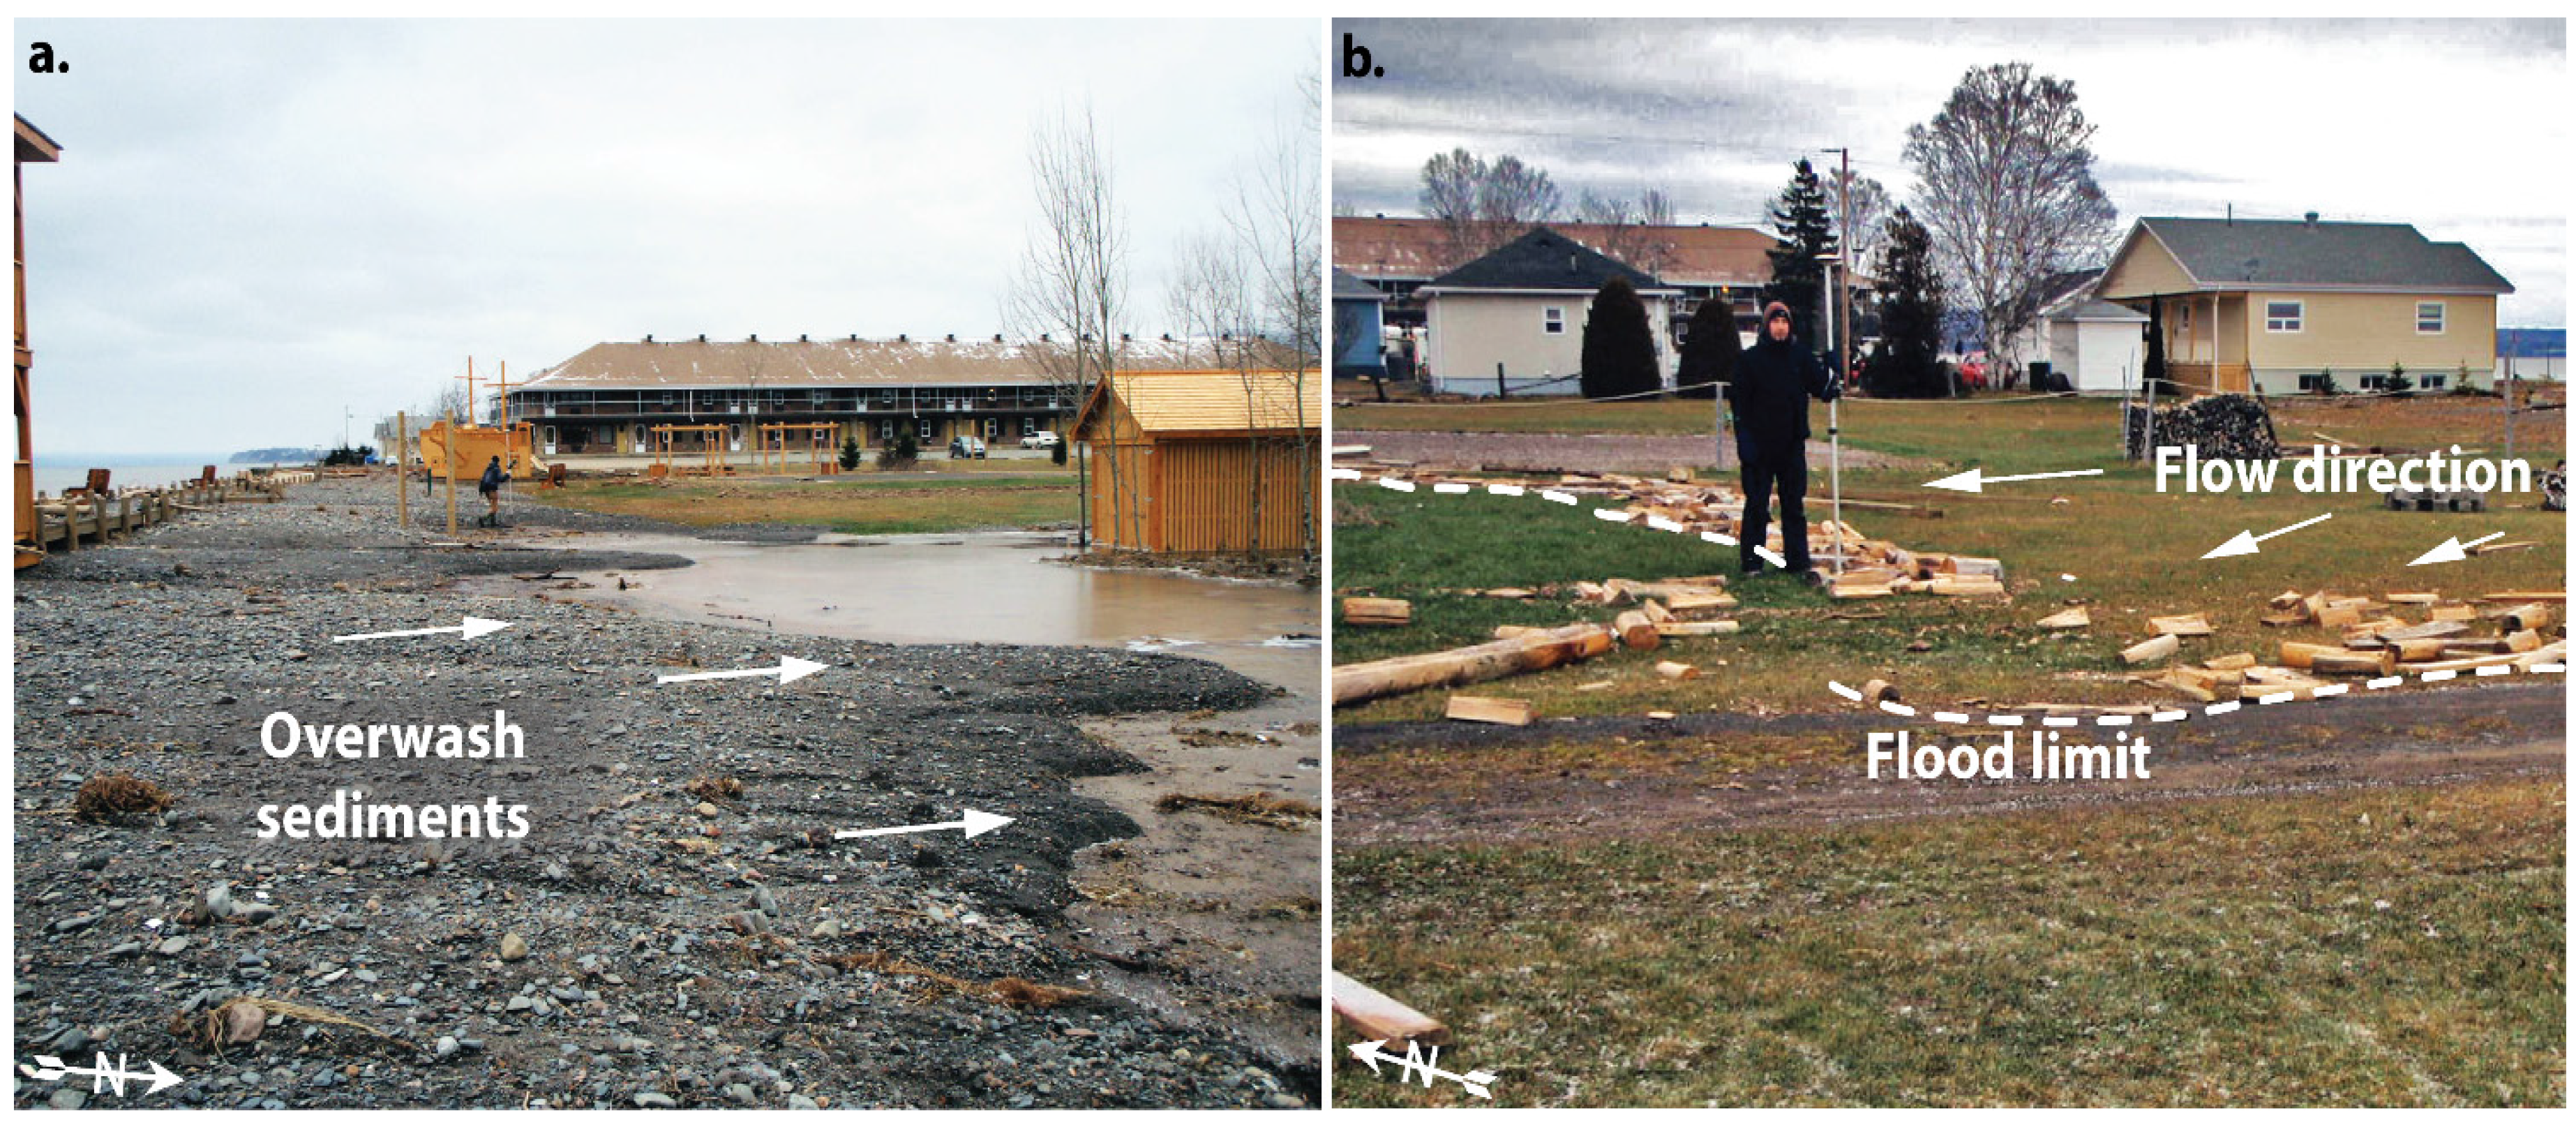
3.1. Post-Storm Surveys
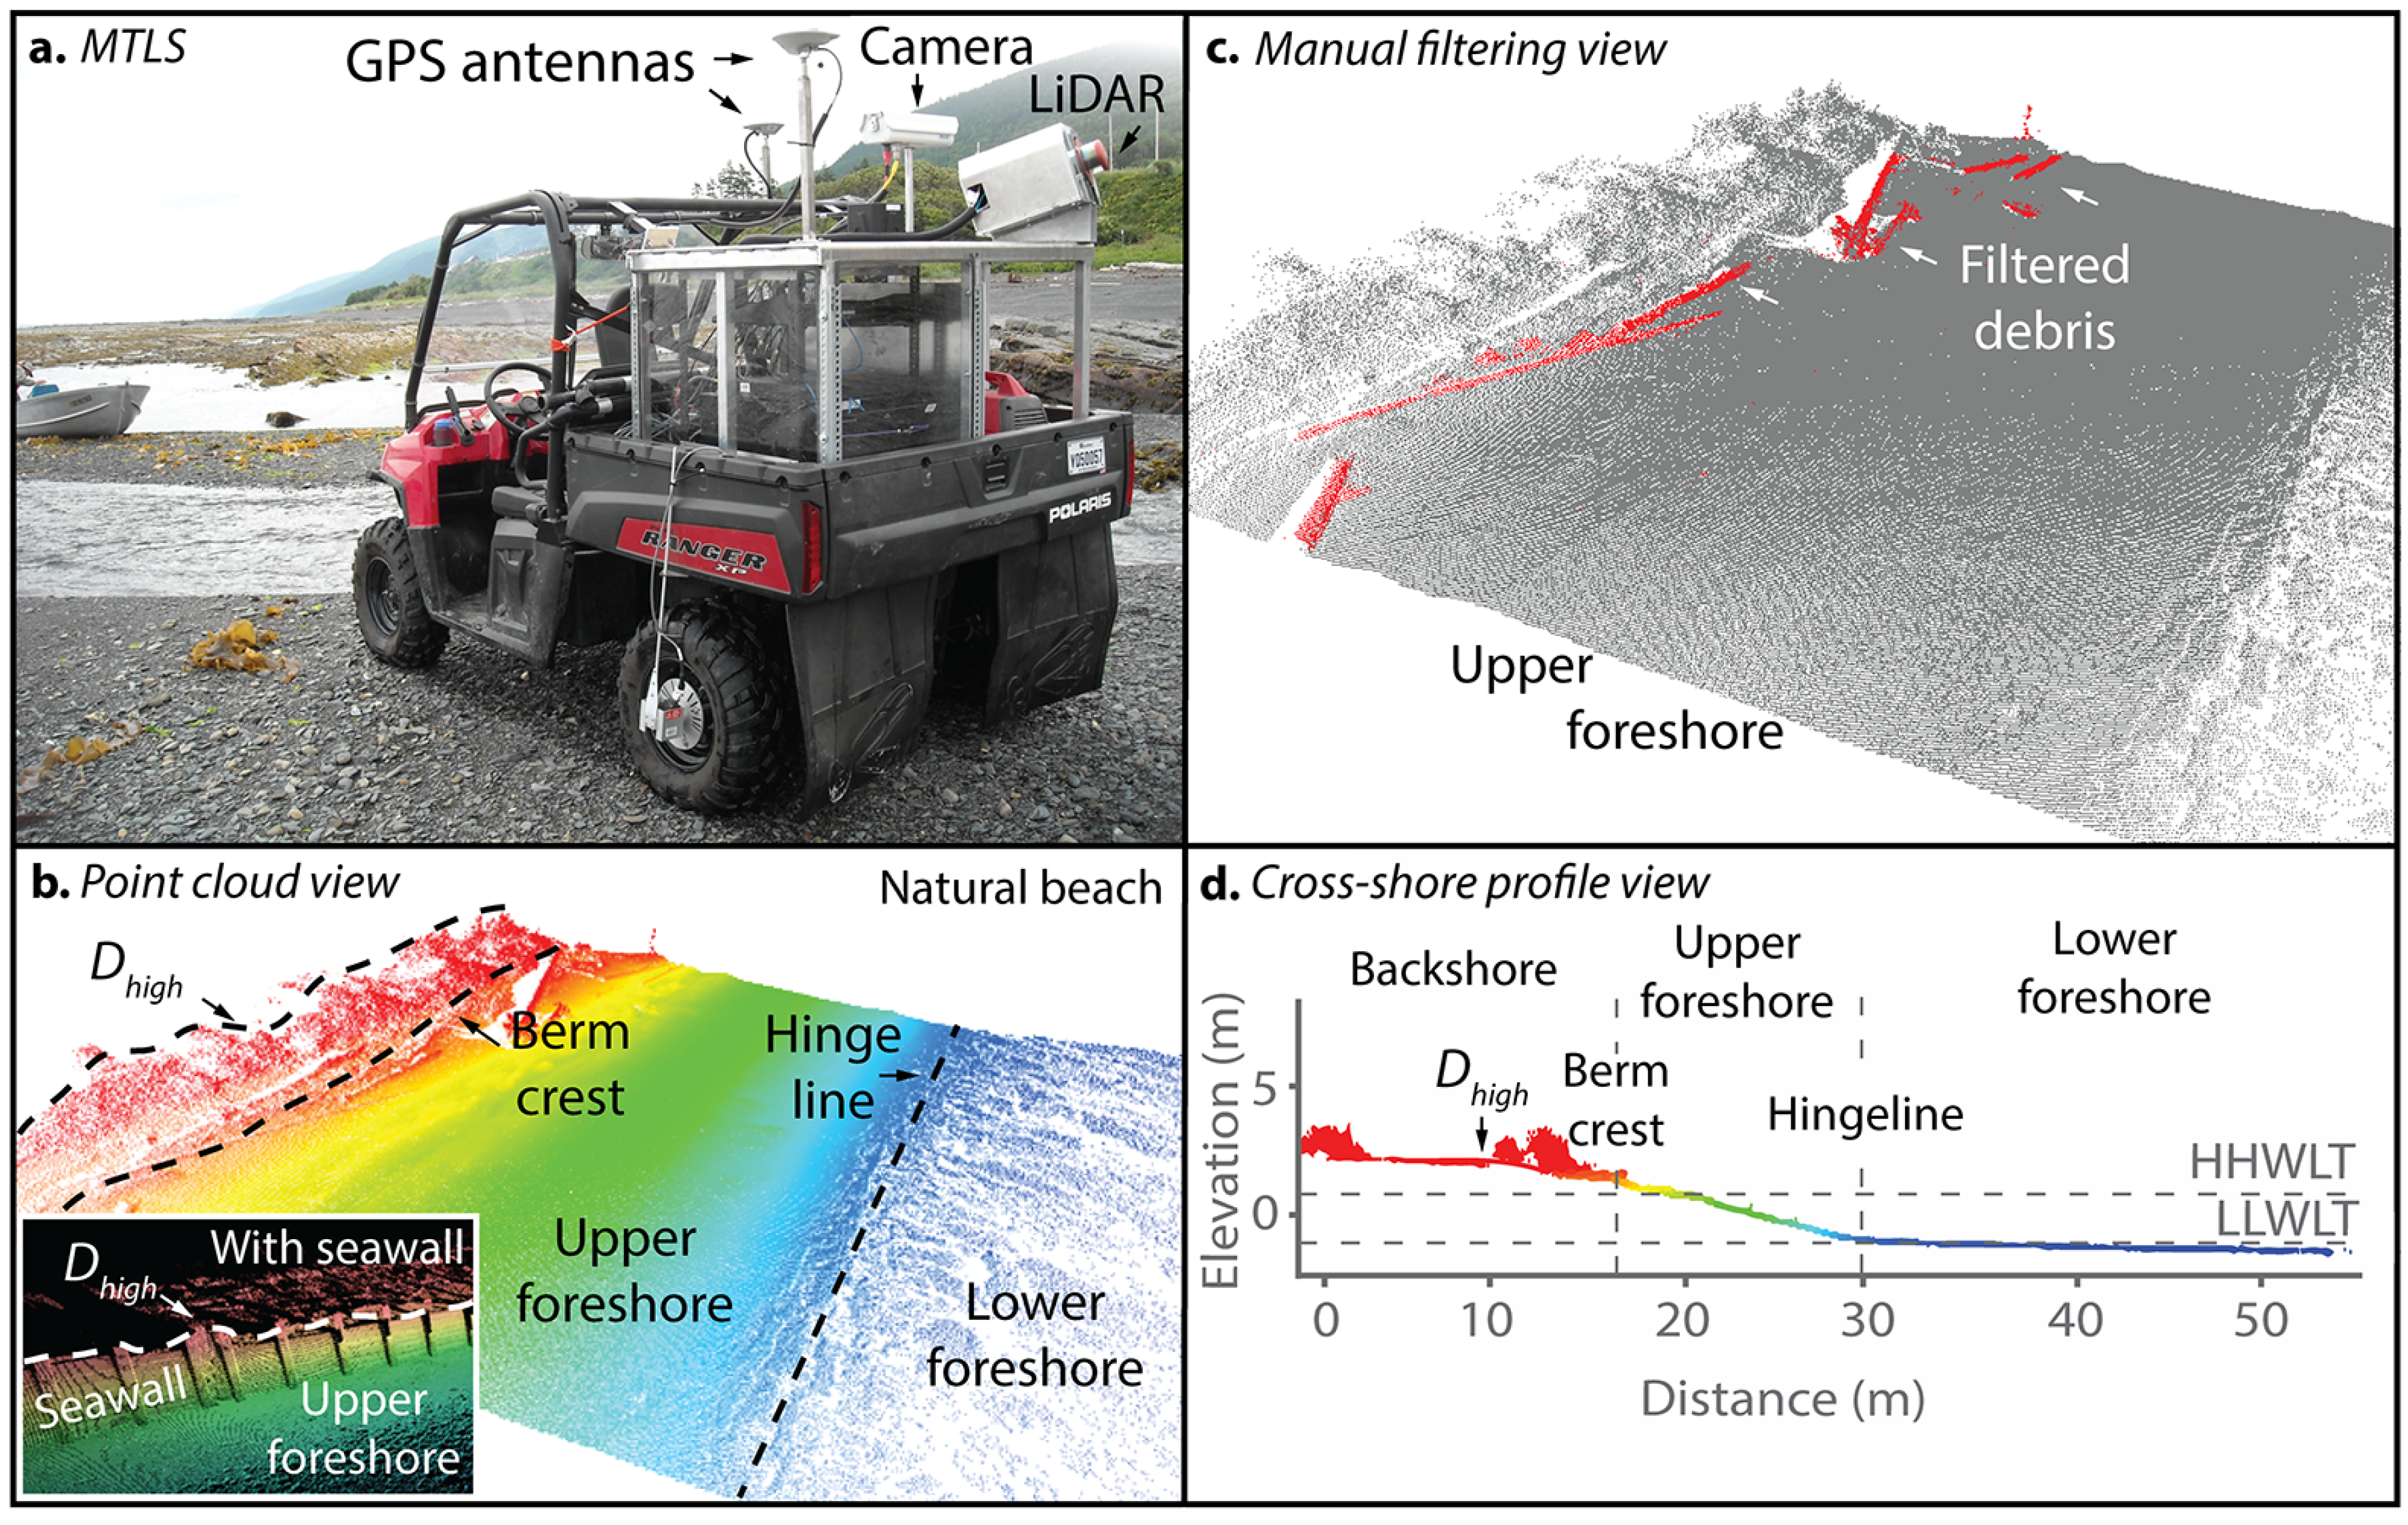
3.2. Mobile Terrestrial LiDAR Data Acquisition


3.3. Hydrodynamic Data Analysis
3.3.1. Wave Dataset
3.3.2. Determination of Near-Shore Wave Parameters
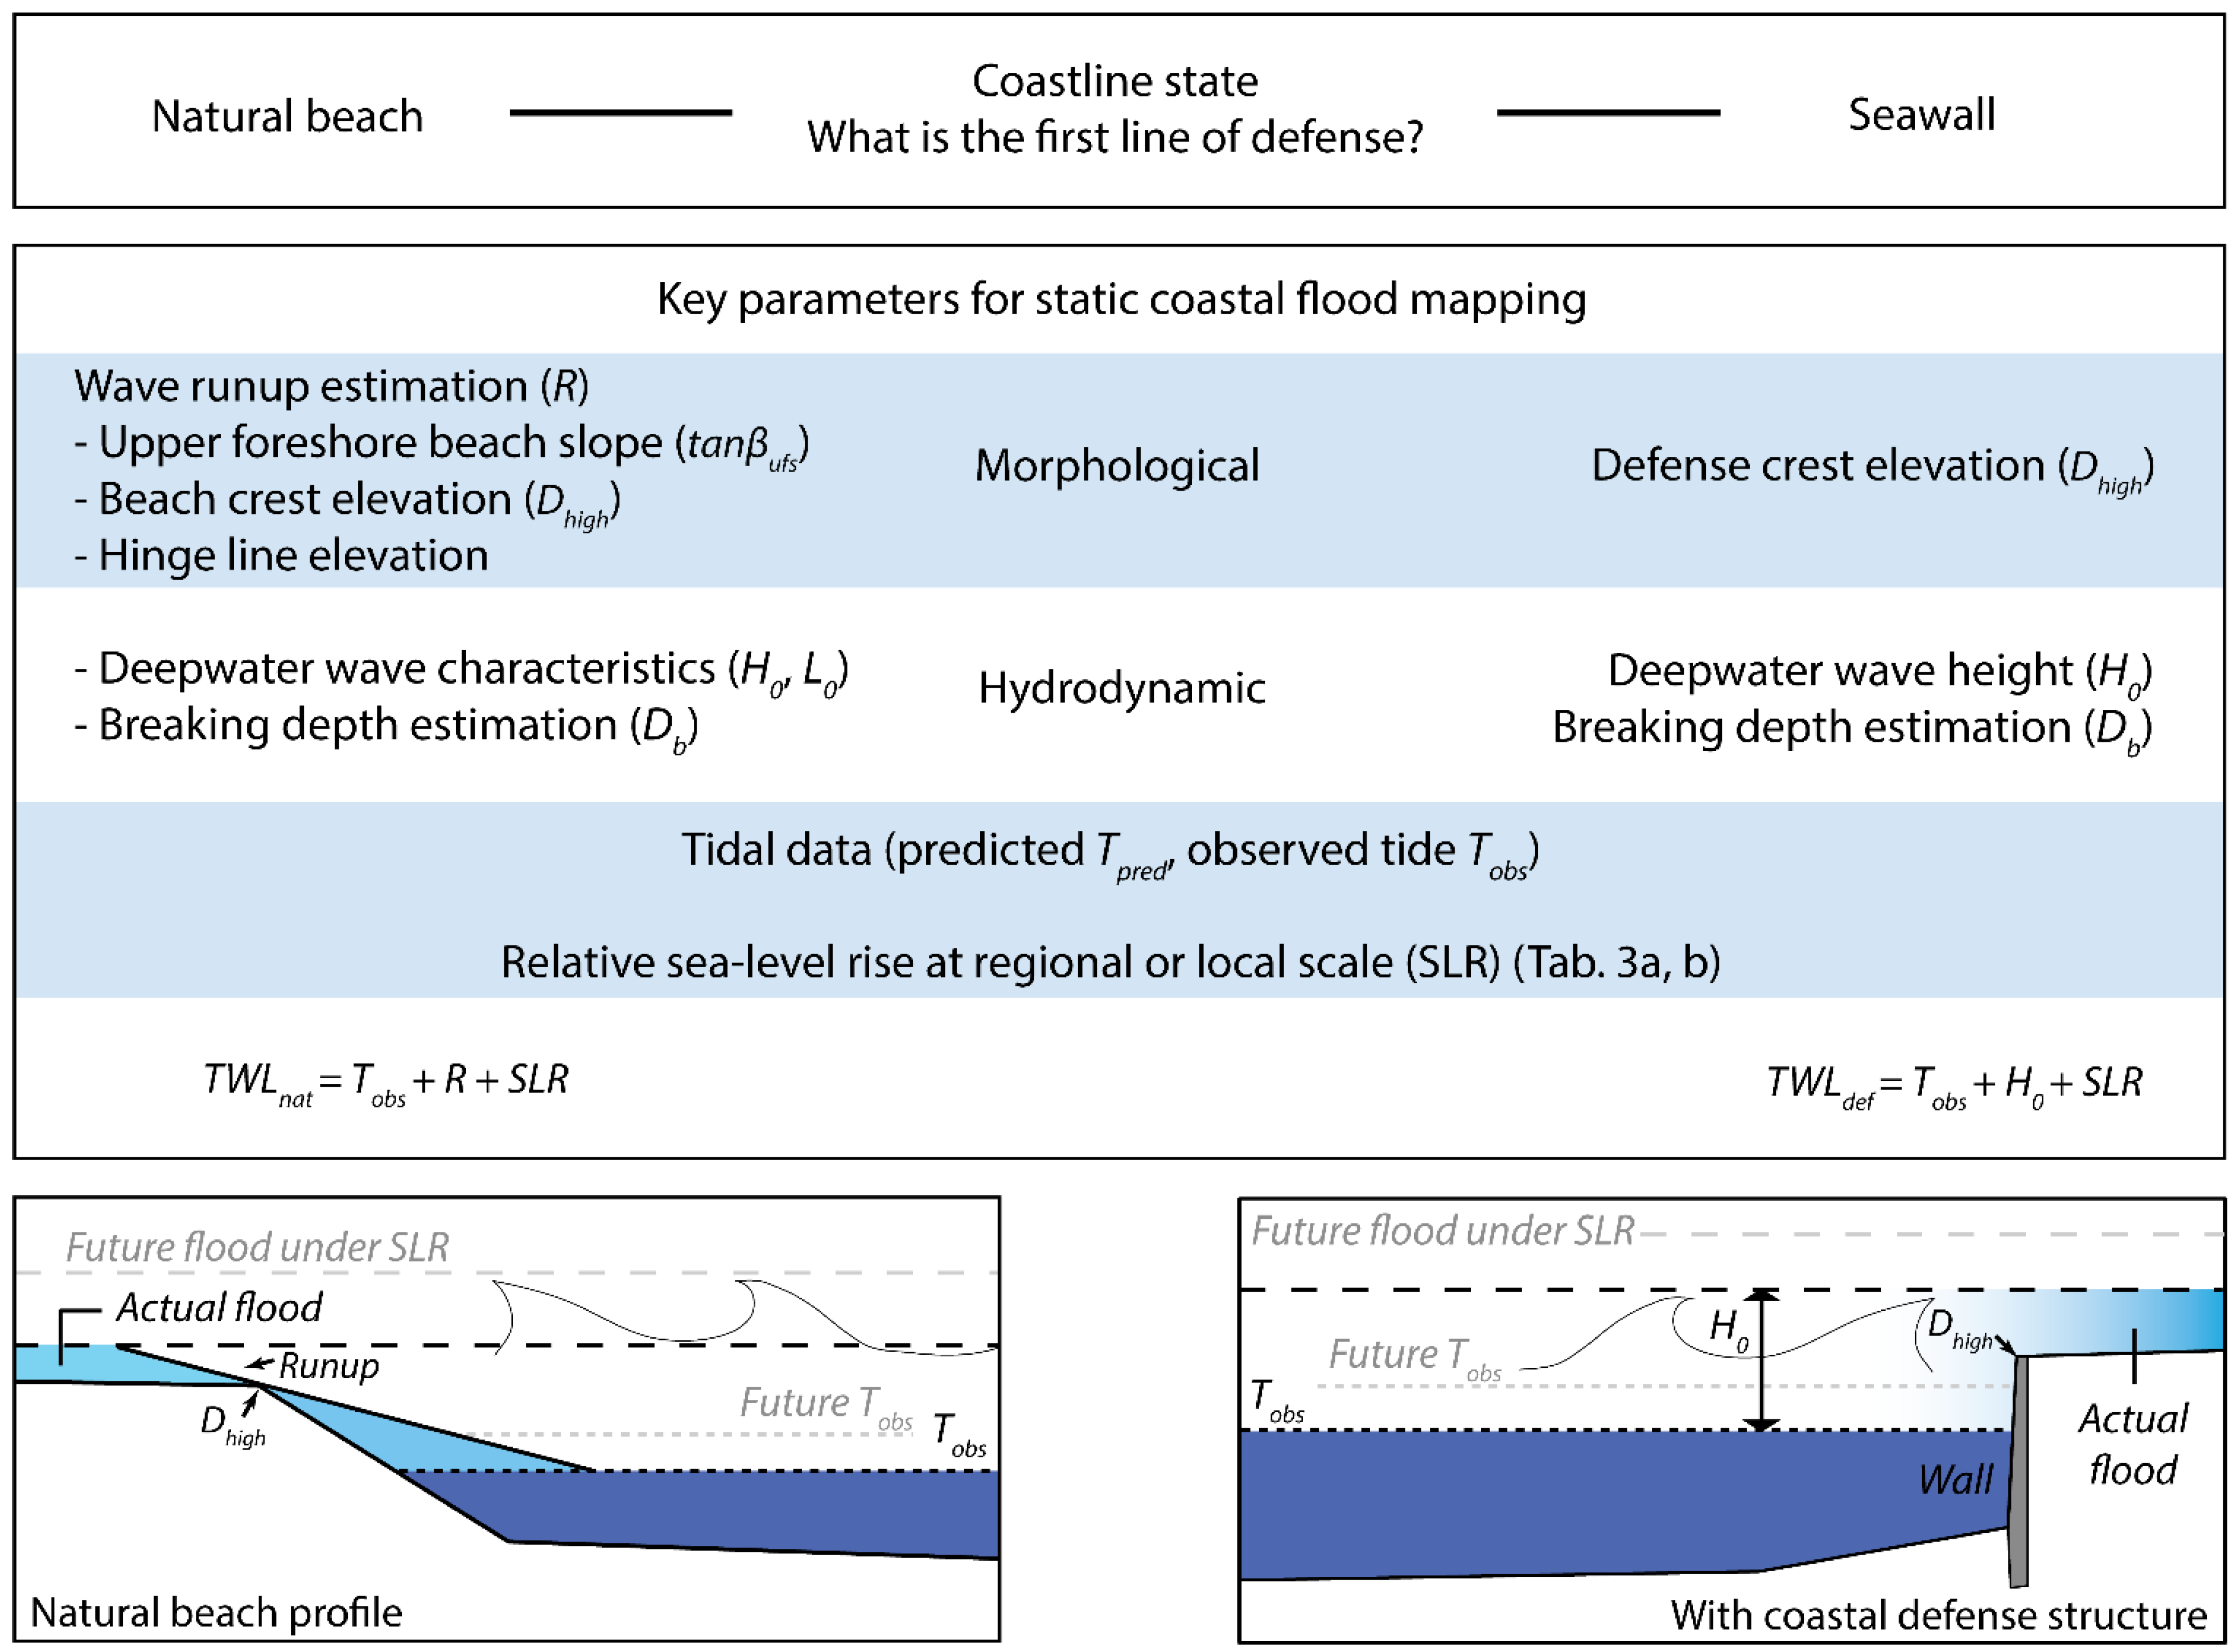
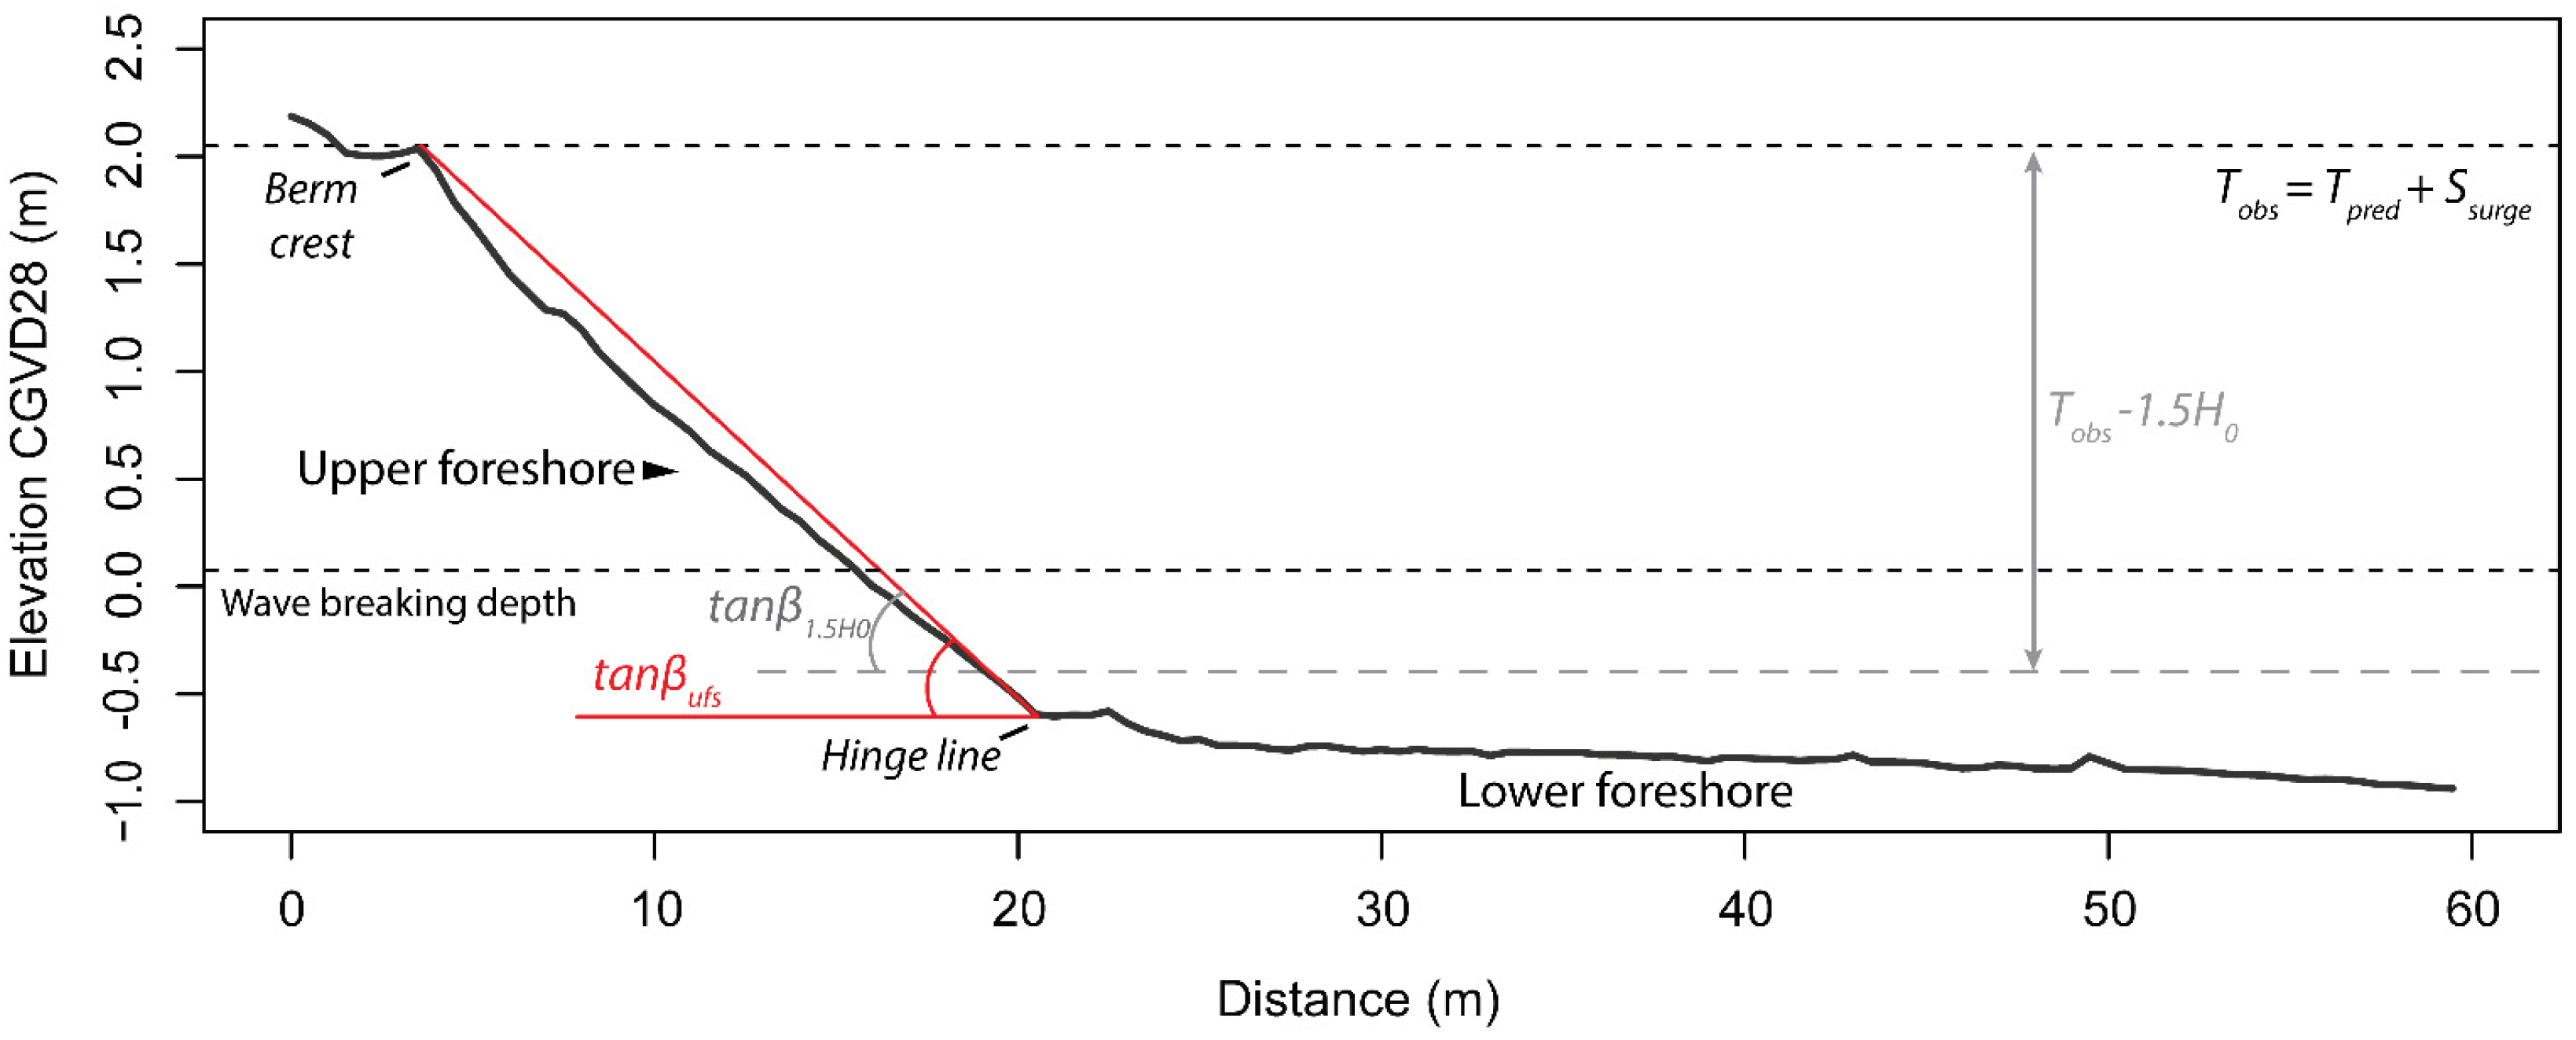
3.4. Wave Runup Estimation and Coastal Morphology
3.5. Sea-Level Rise Projection and Flood Mapping
3.5.1. Sea-Level Analysis
3.5.2. Estimation of Return Periods for Extreme Water Levels

4. Results
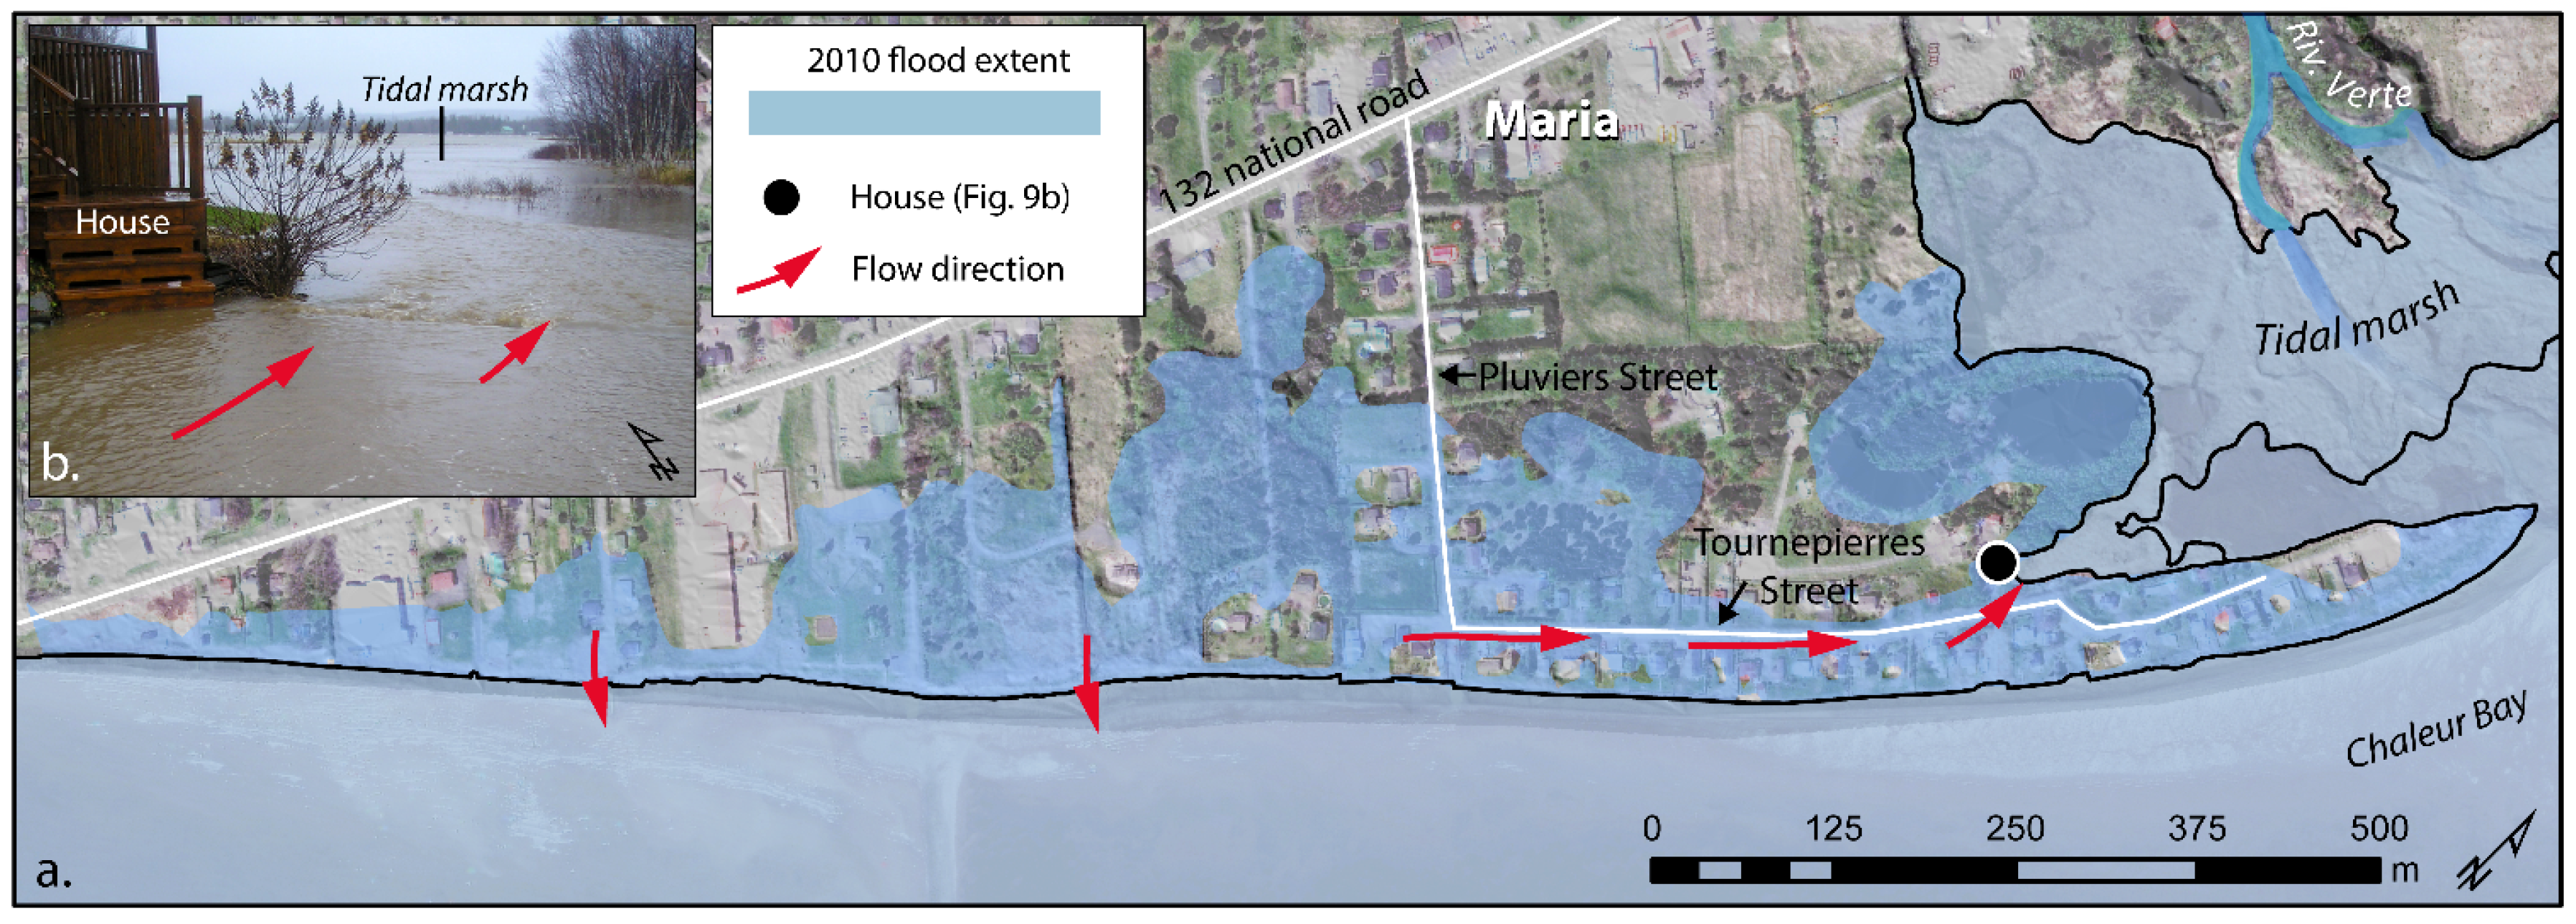
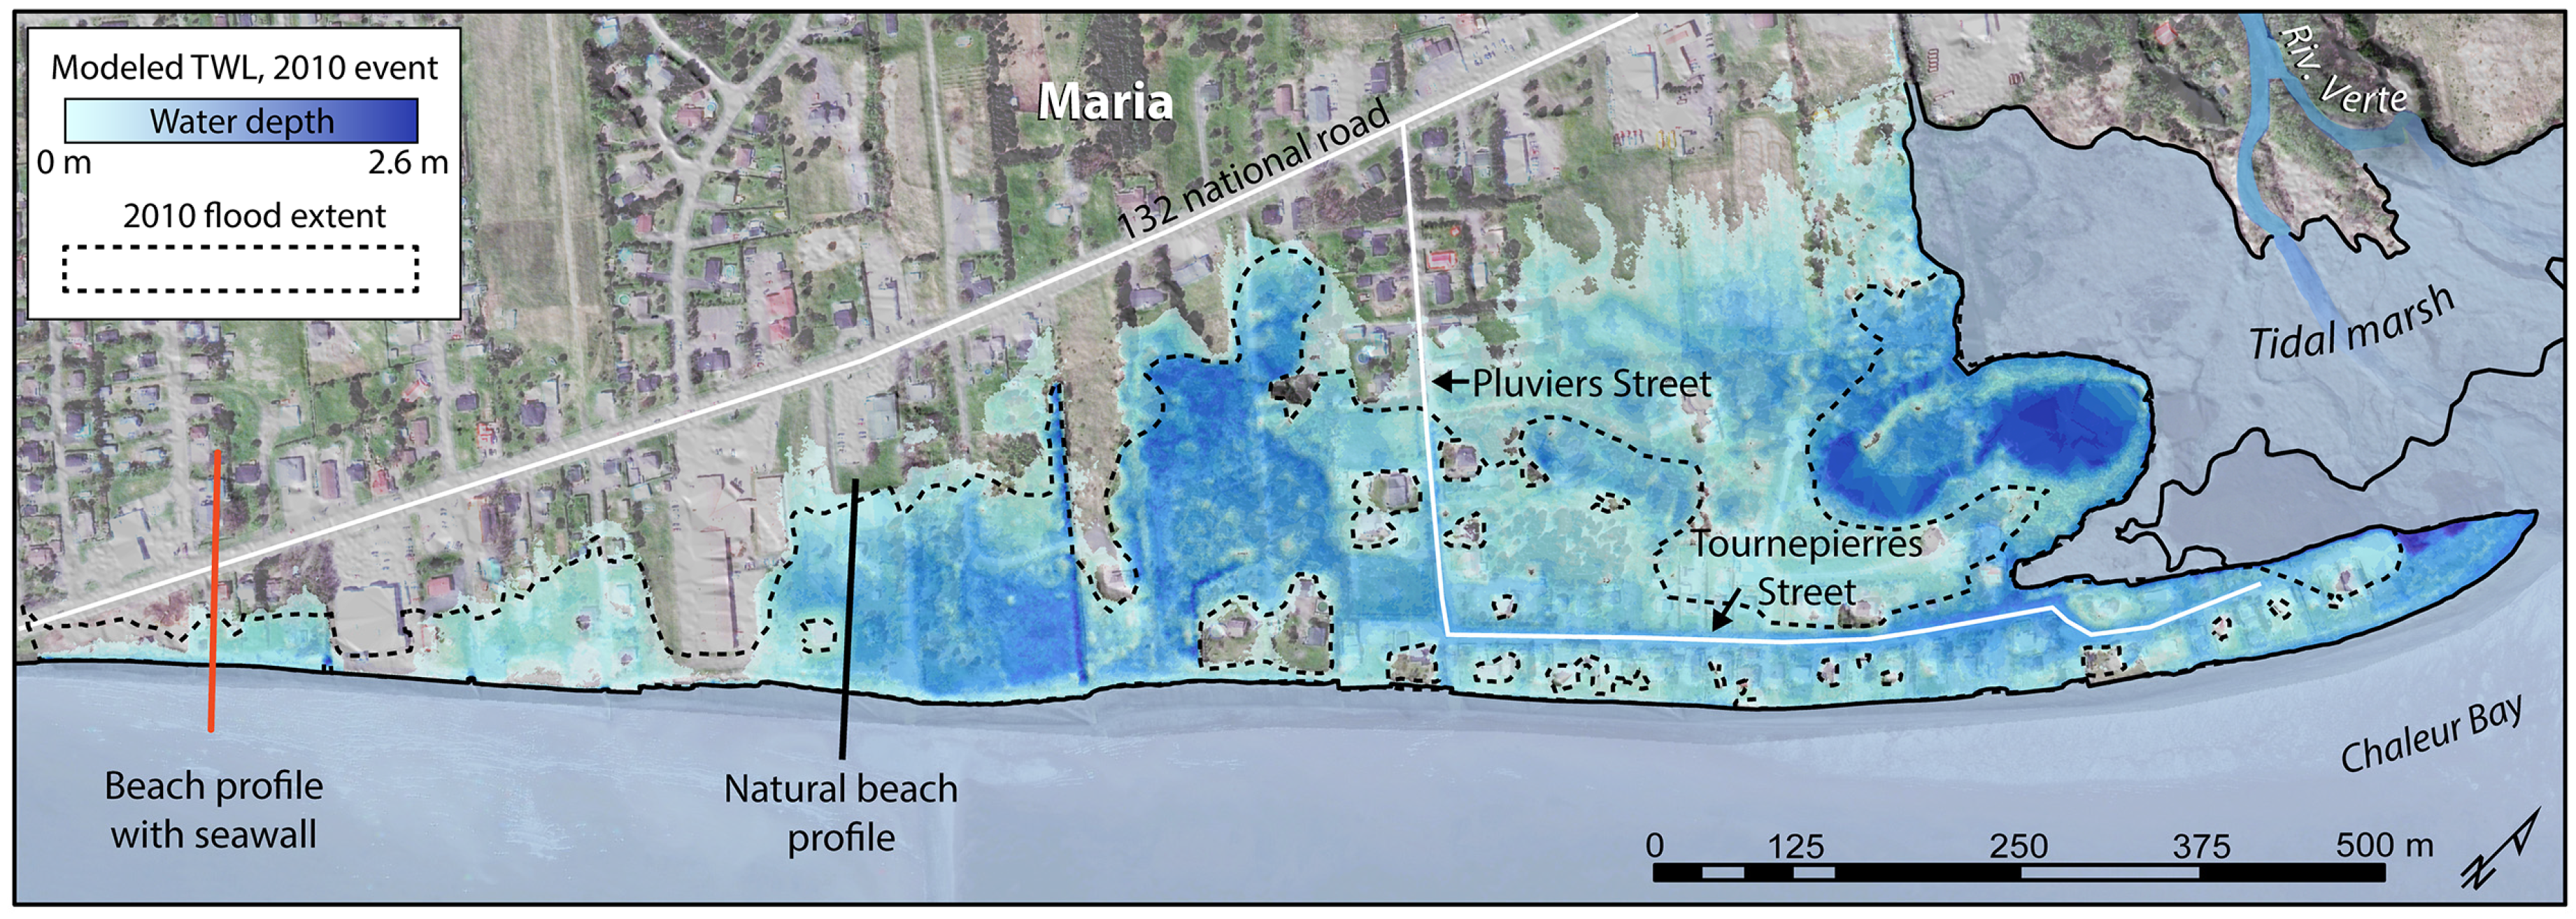
4.1. Coastal Flood Mapping for the 6 December Event
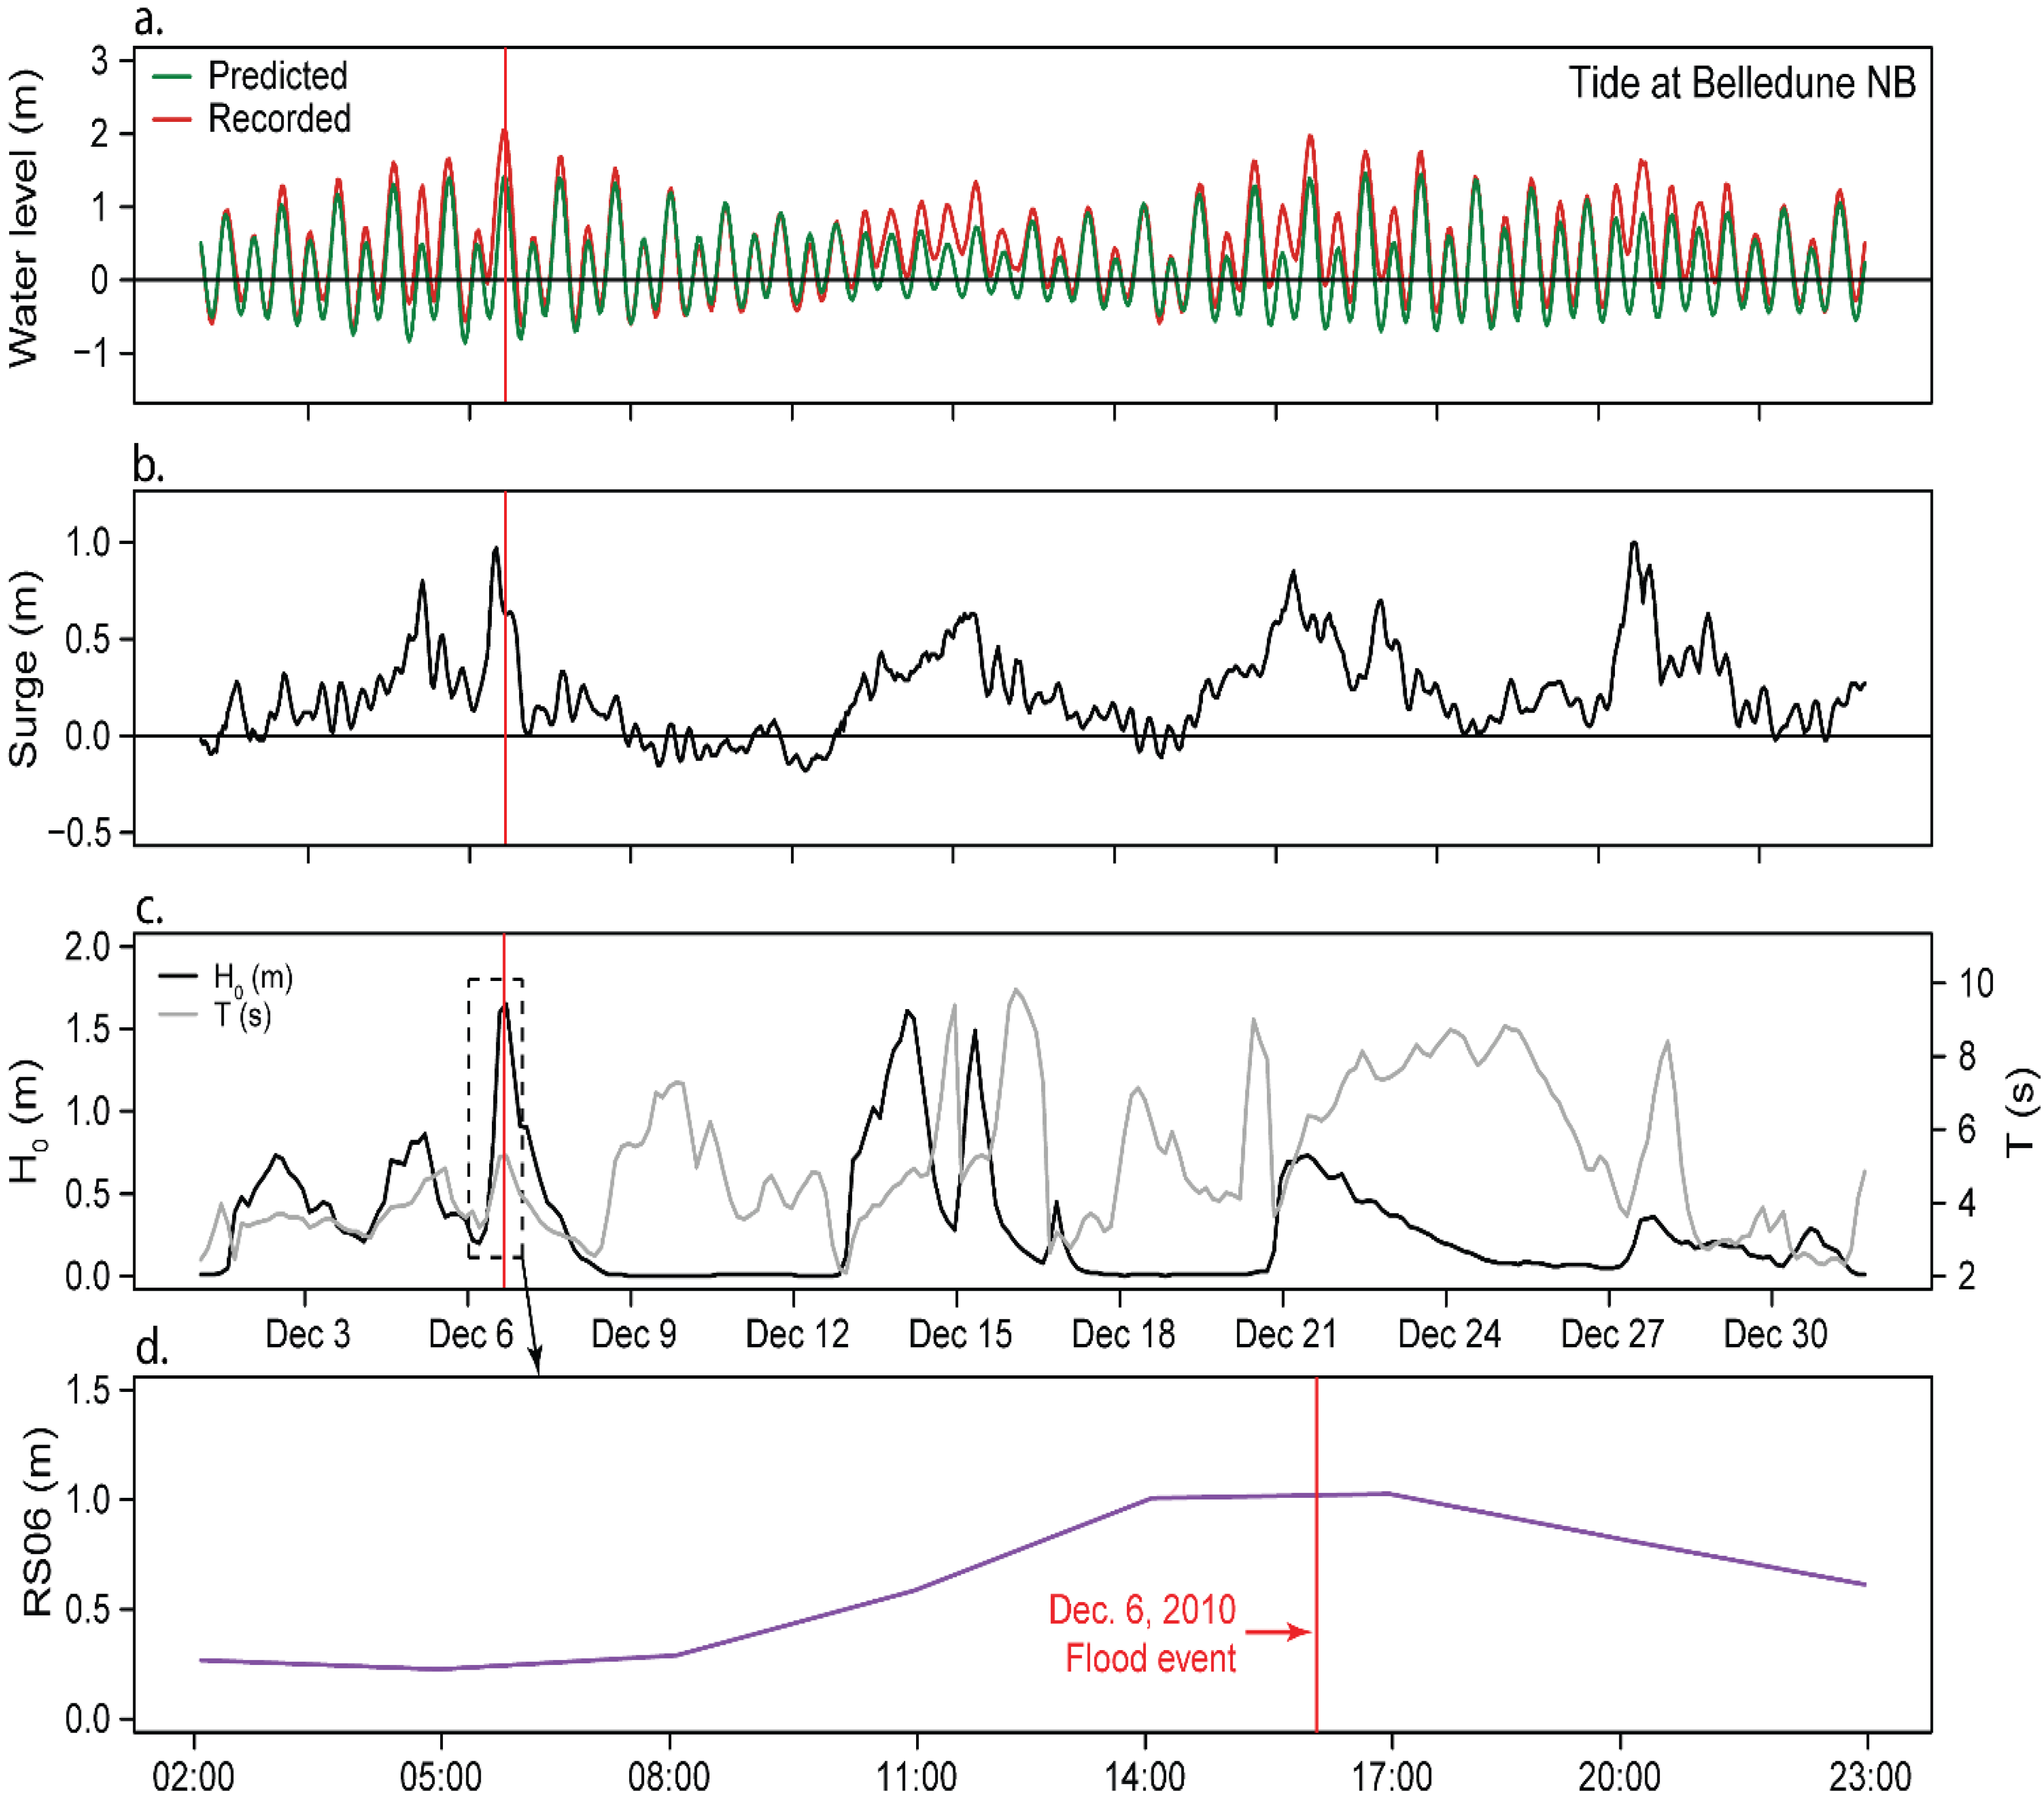
4.1.1. Flood Event Analysis


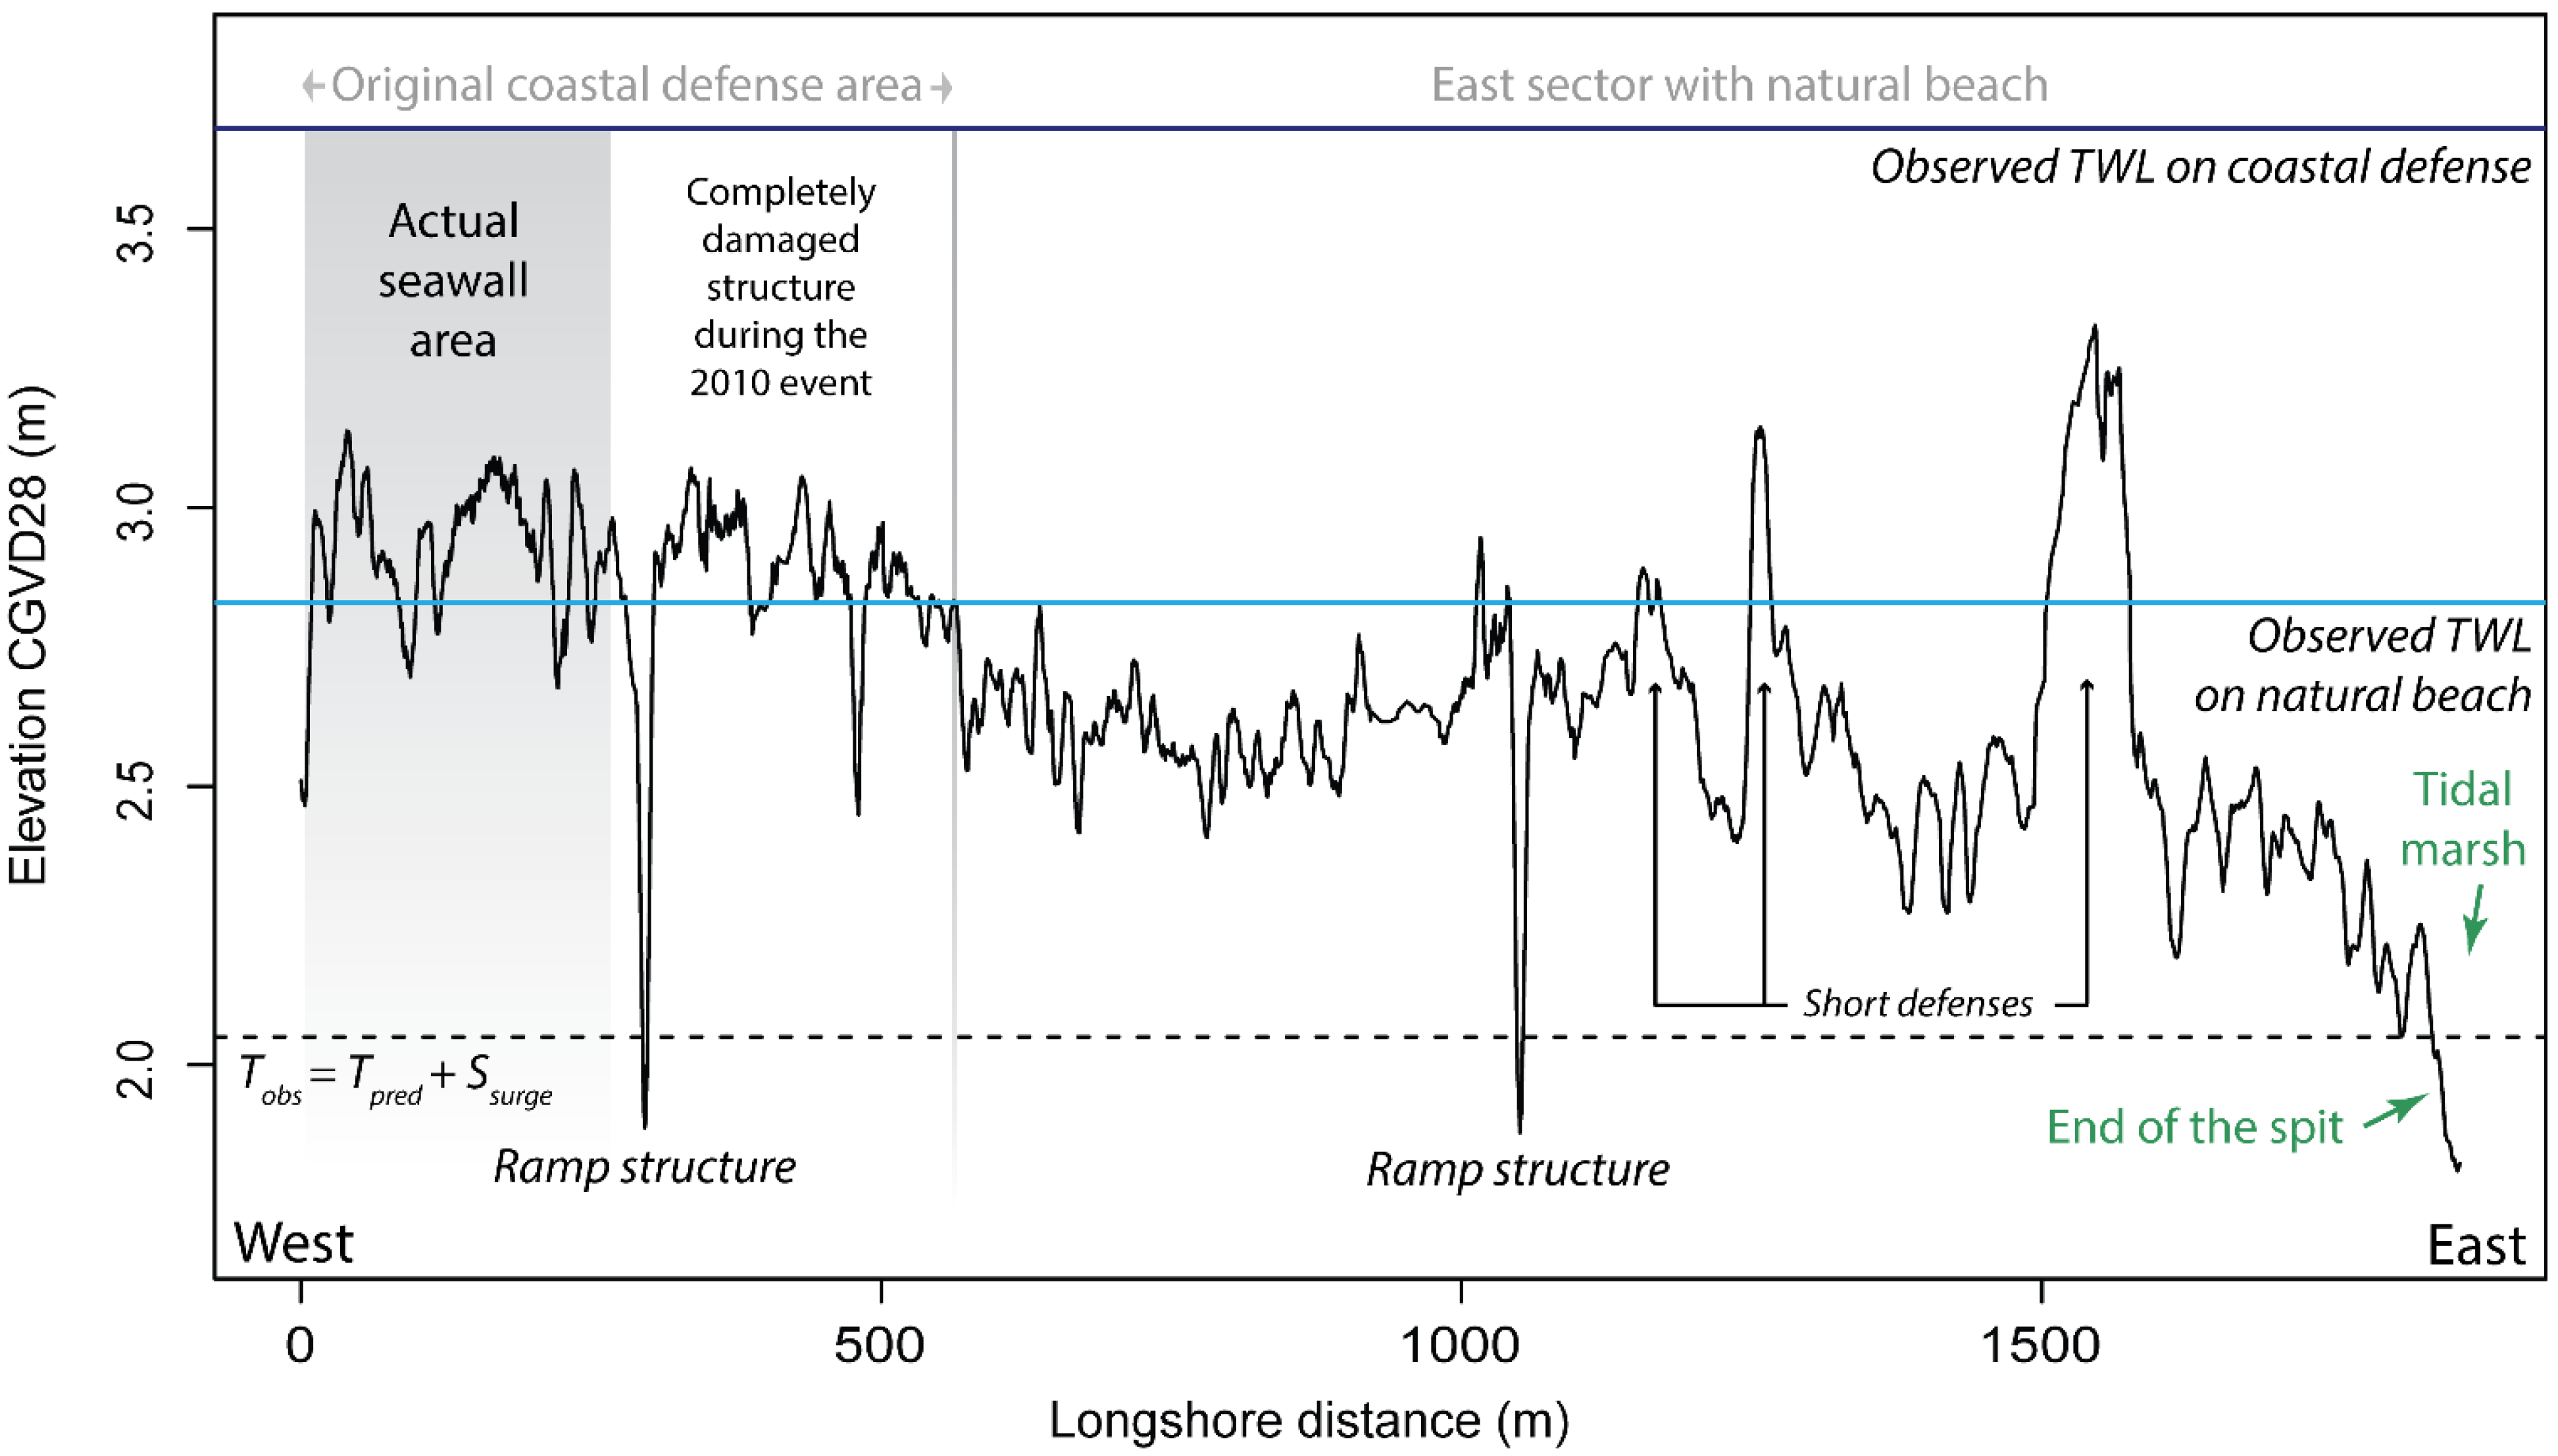
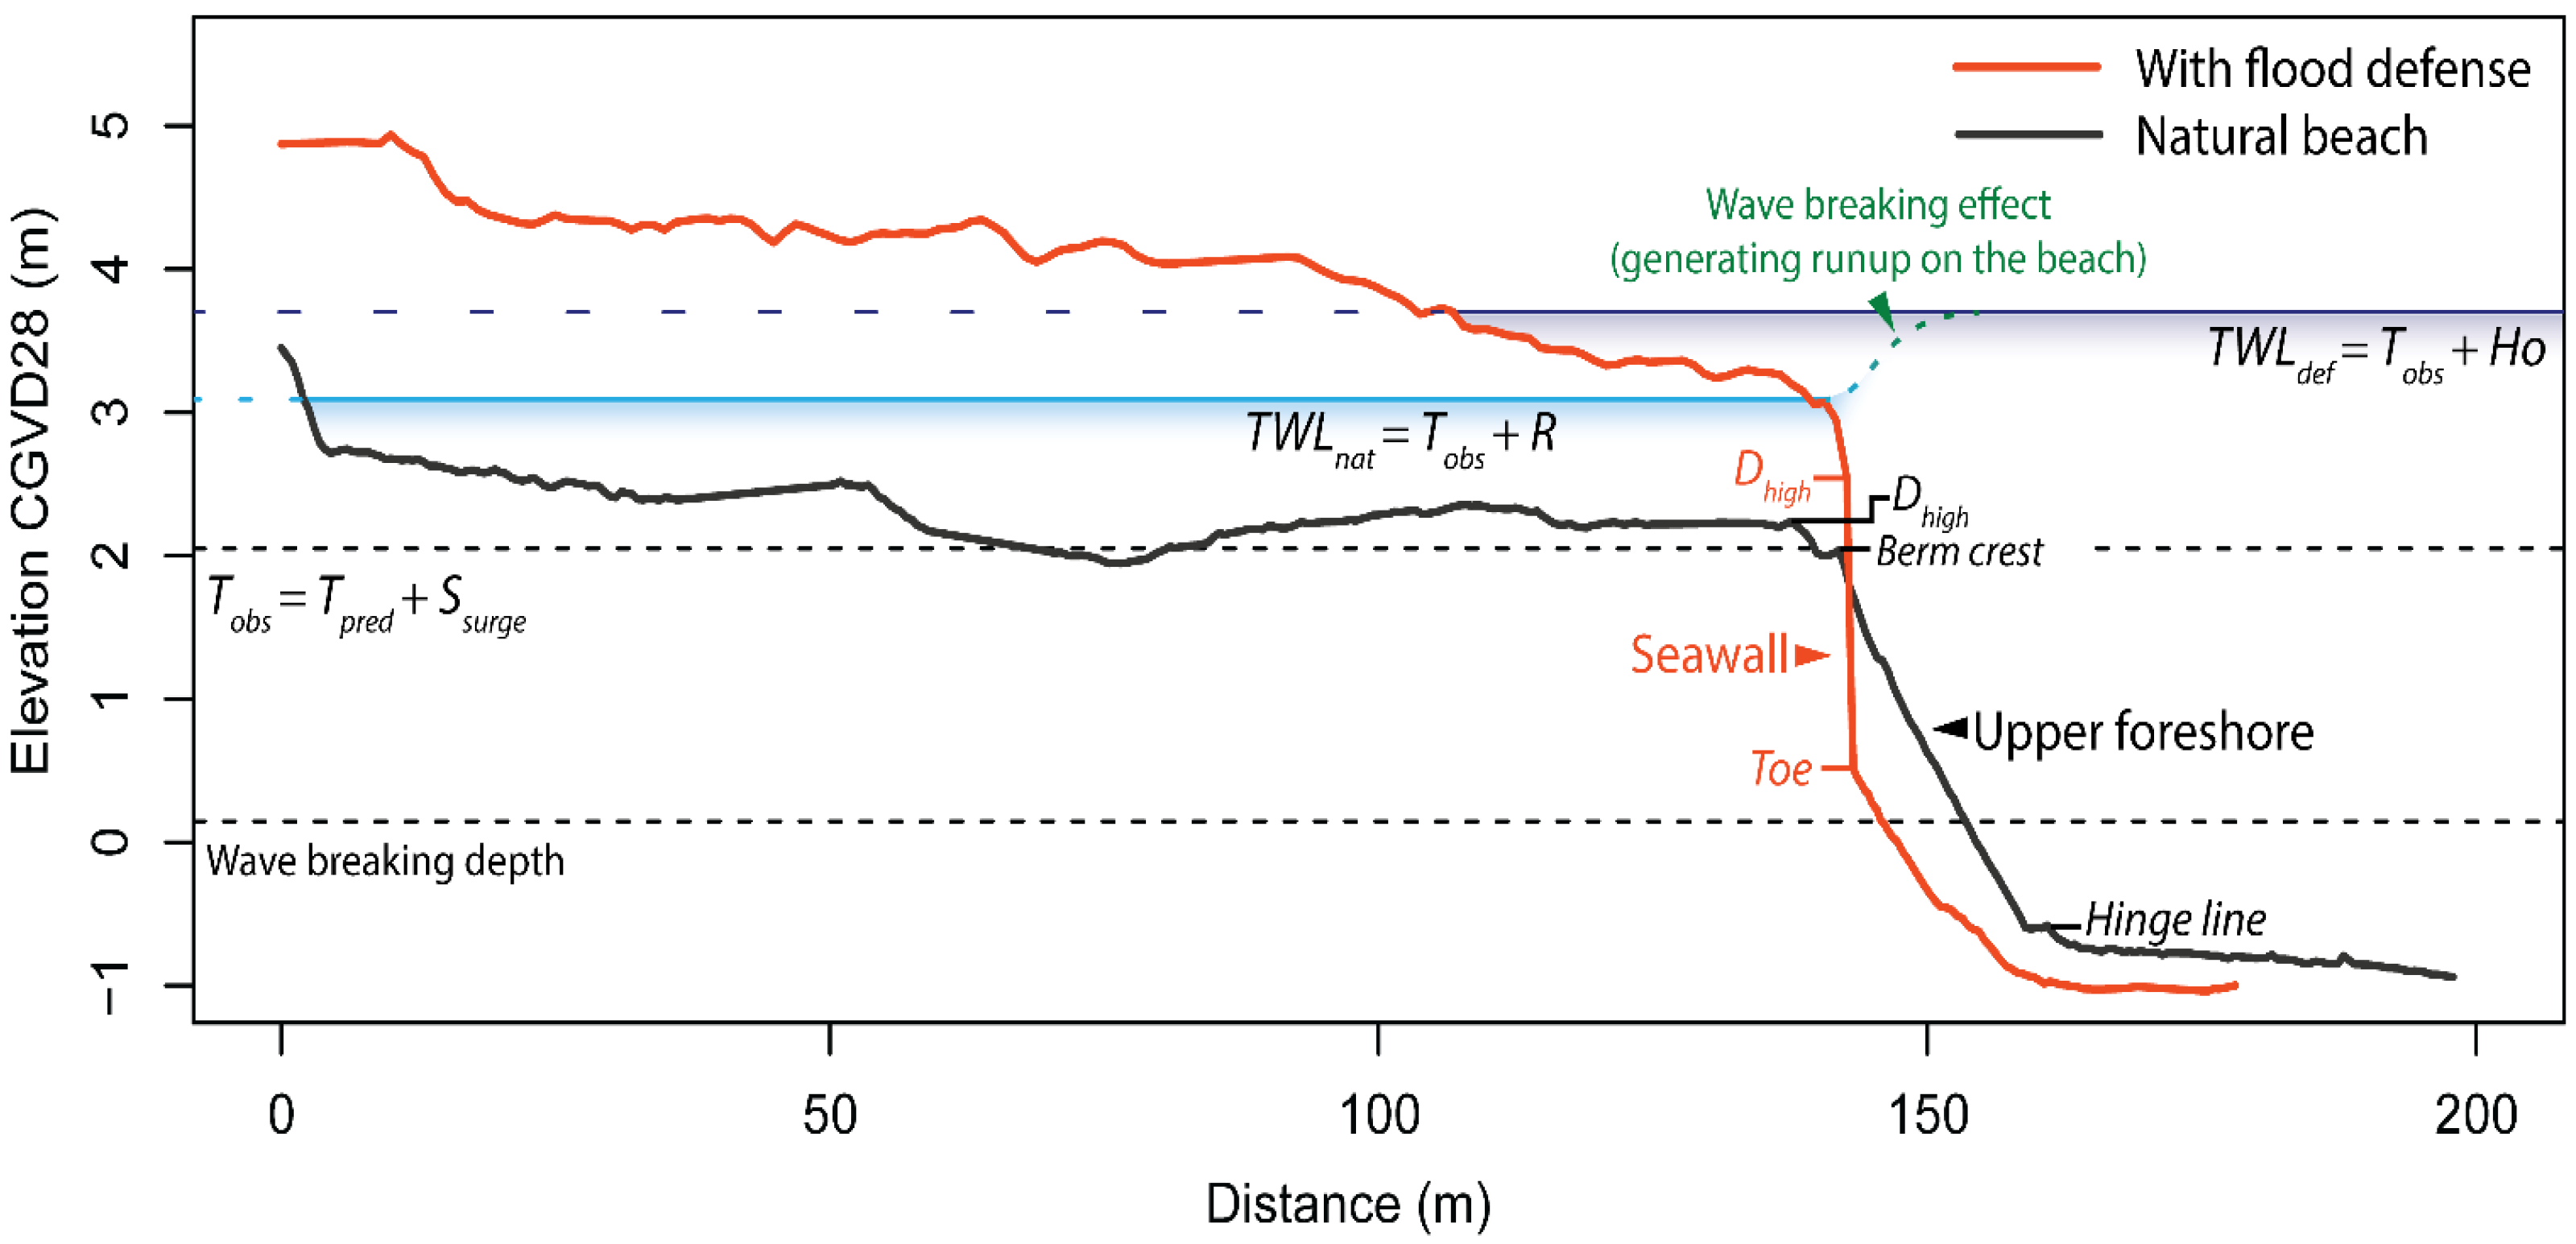
4.1.2. Wave Runup Implications in Modelling Total Water Level for Flood Mapping
| 2010 flood characteristics | ||
|---|---|---|
| Coastline state | Natural beach | Coastal defense |
| Wave components (m) | Runup | H0 |
| 1.02 | 1.63 | |
| Time (UTC) | 20:00 | |
| Predicted tide | 1.42 | |
| Observed tide + Surge | 2.05 | |
| Surge only | 0.63 | |
| Estimated TWL (m) | 3.07 | 3.68 |
| Mean observed TWL (m) (post-storm survey) | 2.83 | 3.69 |
| Estimated flood area (km2) | Observed flood area (km2) | |
| Entire study area | 0.267 | 0.179 |
| West of Pluviers Street only | 0.096 | 0.092 |
| East of Pluviers Street only | 0.171 | 0.087 |
| West area with coastal structure | 0.005 | 0.006 |
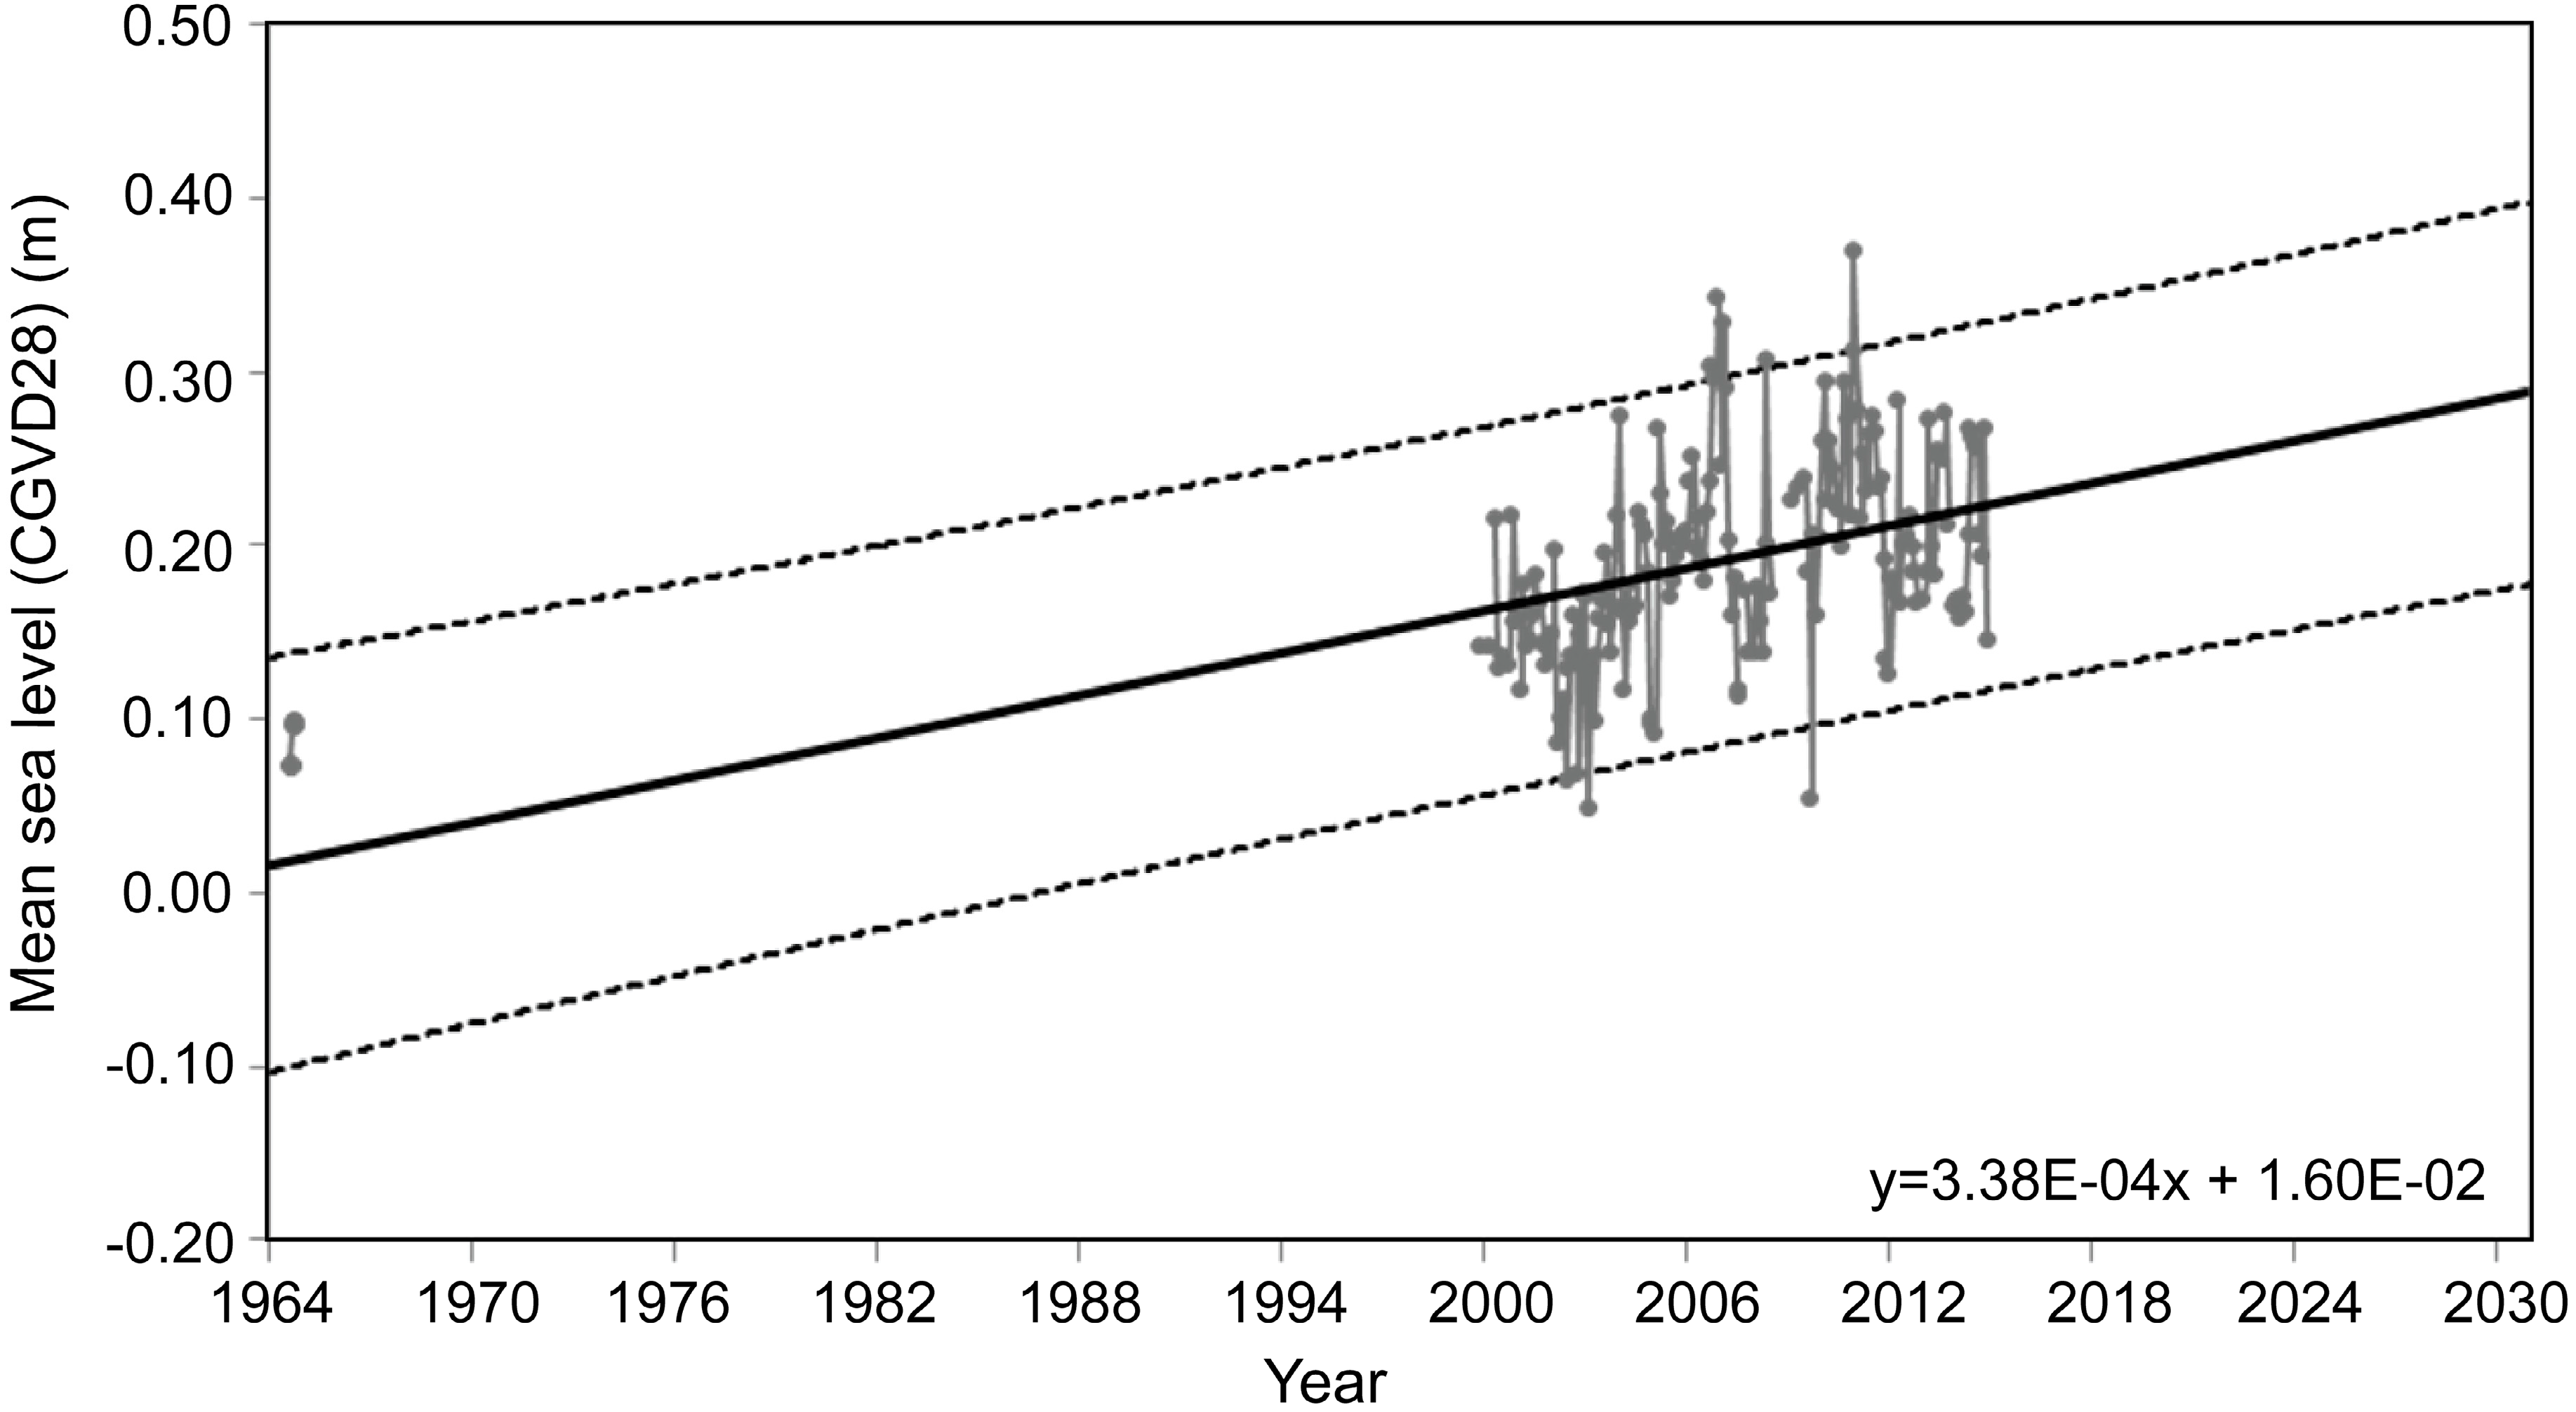
4.2. Tidal Analysis and Sea-Level Trend

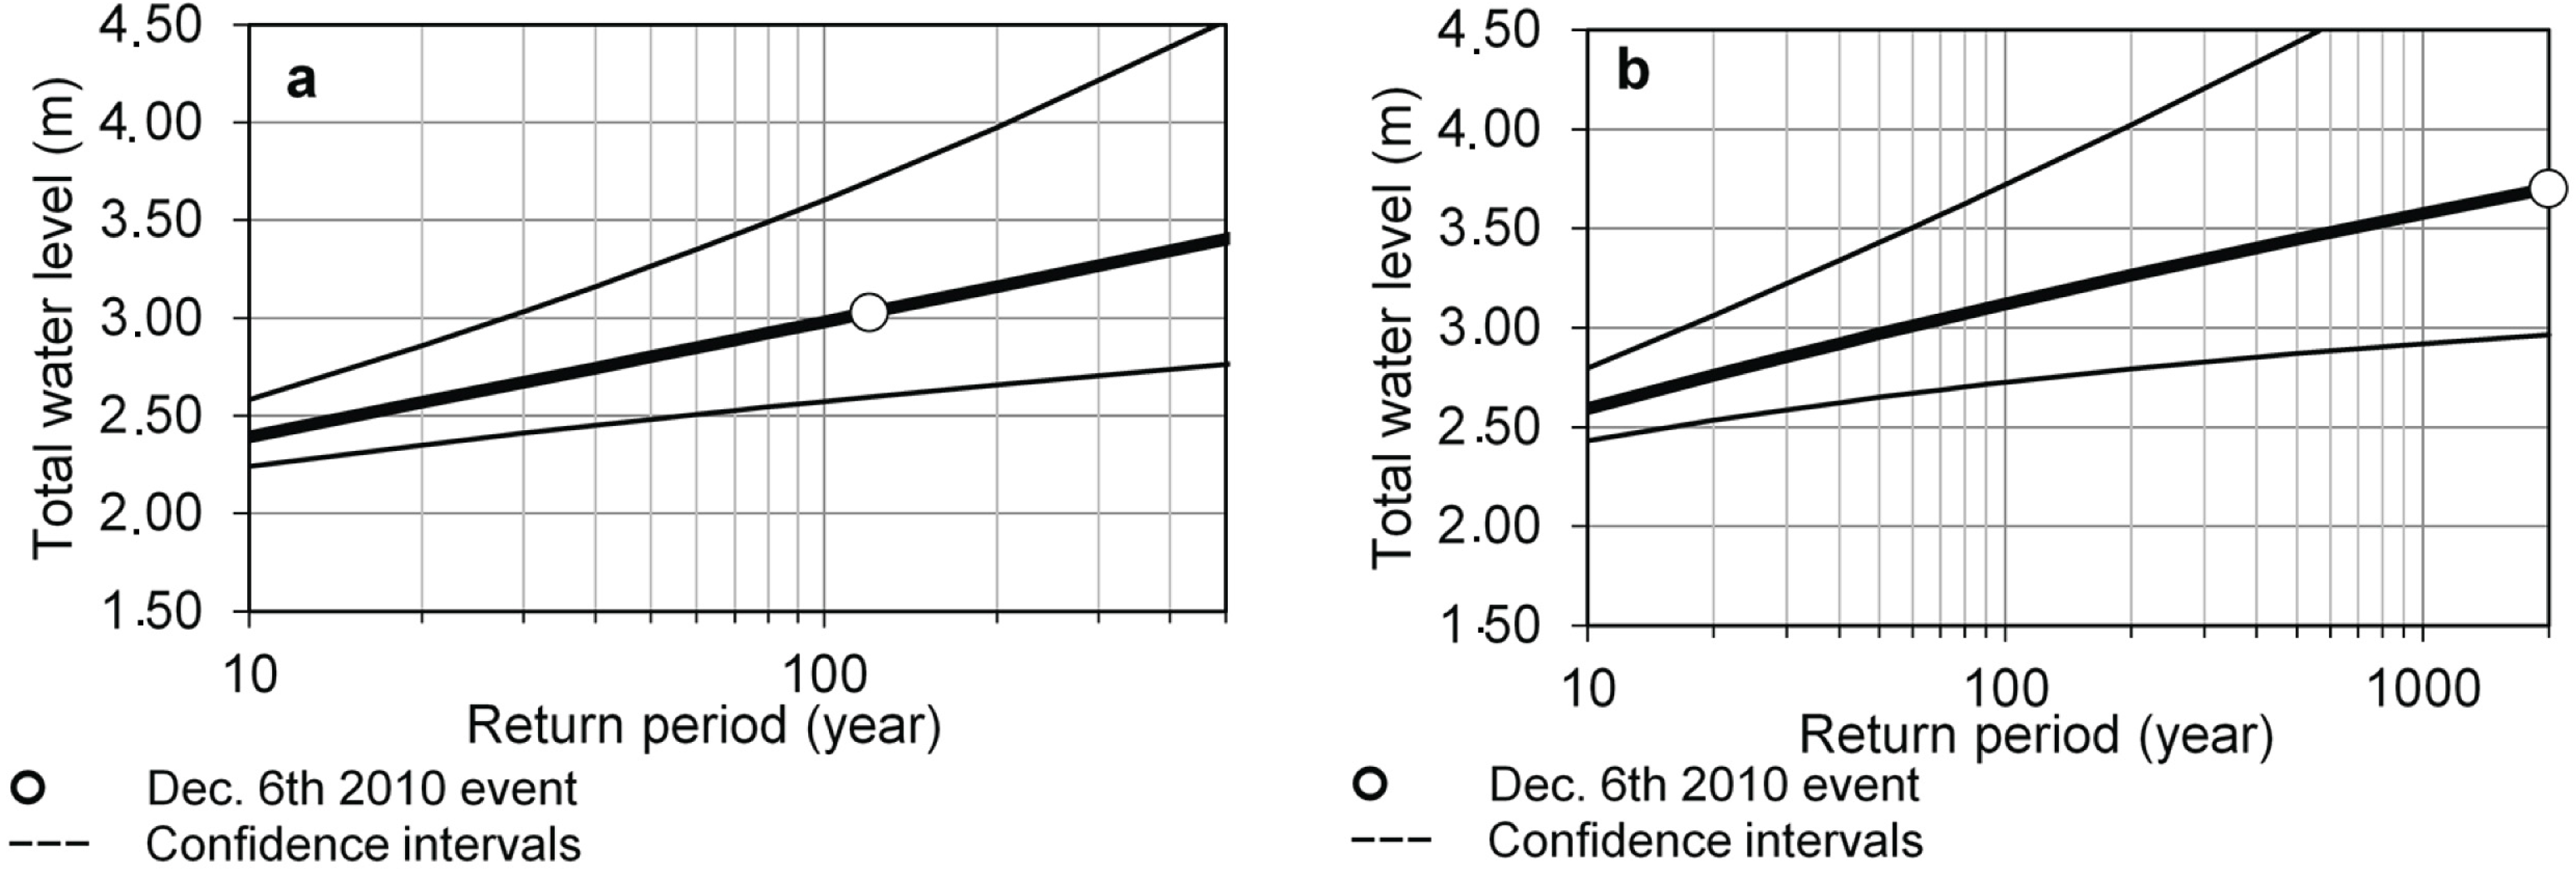
| Estimated total water levels return periods | ||||
|---|---|---|---|---|
| (a) | ||||
| Return Period | Level 2005 | Level 2010 | Level 2020 | Level 2030 |
| 1 year | 1.78 ± 0.11 | 1.80 ± 0.11 | 1.84 ± 0.11 | 1.89 ± 0.11 |
| 2 years | 1.95 ± 0.14 | 1.97 ± 0.14 | 2.02 ± 0.14 | 2.06 ± 0.15 |
| 10 years | 2.36 ± 0.30 | 2.38 ± 0.30 | 2.42 ± 0.30 | 2.46 ± 0.30 |
| 30 years | 2.63 ± 0.47 | 2.65 ± 0.47 | 2.69 ± 0.47 | 2.74 ± 0.47 |
| 50 years | 2.76 ± 0.57 | 2.79 ± 0.57 | 2.83 ± 0.57 | 2.87 ± 0.57 |
| 100 years | 2.94 ± 0.73 | 2.96 ± 0.73 | 3.00 ± 0.73 | 3.05 ± 0.73 |
| (b) | ||||
| Return Period | Level 2005 | Level 2010 | Level 2020 | Level 2030 |
| 1 year | 1.95 ± 0.11 | 1.97 ± 0.11 | 2.01 ± 0.11 | 2.05 ± 0.11 |
| 2 years | 2.14 ± 0.15 | 2.16 ± 0.15 | 2.20 ± 0.15 | 2.24 ± 0.15 |
| 10 years | 2.56 ± 0.31 | 2.58 ± 0.31 | 2.62 ± 0.31 | 2.66 ± 0.31 |
| 30 years | 2.82 ± 0.47 | 2.84 ± 0.47 | 2.88 ± 0.48 | 2.92 ± 0.48 |
| 50 years | 2.93 ± 0.57 | 2.95 ± 0.57 | 2.99 ± 0.57 | 3.03 ± 0.57 |
| 100 years | 3.08 ± 0.71 | 3.10 ± 0.71 | 3.14 ± 0.71 | 3.18 ± 0.71 |
5. Discussion

5.1. The Need for a Wave-Tide-Surge Integrated Approach
5.2. Inland Drainage and Sea-Level Rise
6. Conclusions
Acknowledgments
Author Contributions
Conflicts of Interest
References
- Nicholls, R.J.; Tol, R.S.J. Impacts and responses to sea-level rise: A global analysis of the SRES scenarios over the twenty-first century. Philos. Trans. A 2006, 364, 1073–1095. [Google Scholar] [CrossRef] [PubMed]
- Nicholls, R.J.; Cazenave, A. Sea-level rise and its impact on coastal zones. Science 2010, 328, 1517–1520. [Google Scholar] [CrossRef] [PubMed]
- Church, J.A.; White, N.J. Sea-Level Rise from the Late 19th to the Early 21st Century. Surv. Geophys. 2011, 32, 585–602. [Google Scholar] [CrossRef]
- Rahmstorf, S.; Foster, G.; Cazenave, A. Comparing climate projections to observations up to 2011. Environ. Res. Lett. 2012, 7, 044035. [Google Scholar] [CrossRef] [Green Version]
- Pfeffer, W.T.; Harper, J.T.; O’Neel, S. Kinematic Constraints on Glacier Contributions to 21st-Century Sea-Level Rise. Science 2008, 321, 1340–1343. [Google Scholar] [CrossRef] [PubMed]
- Church, J.A.; Clark, P.U.; Cazenave, A.; Gregory, J.M.; Jevrejava, S.; Levermann, A.; Merrifield, M.A.; Milne, G.A.; Nerem, R.S.; Nunn, P.D.; et al. Sea Level Change. In IPCC. Climate Change 2013: The Physical Science Basis; Stocker, T.F., Qin, D., Plattner, G.K., Tignor, M., Allen, S.K., Boschung, J., Nauels, A., Xia, Y., Bex, V., Midgley, P.M., Eds.; Cambridge University Press: Cambridge, UK; New York, NY, USA, 2013. [Google Scholar]
- Horton, B.P.; Rahmstorf, S.; Engelhart, S.E.; Kemp, A.C. Expert assessment of sea-level rise by AD 2100 and AD 2300. Quat. Sci. Rev. 2014, 84, 1–6. [Google Scholar] [CrossRef]
- Parris, A.; Bromirski, P.; Burkett, V.; Cayan, D.; Culver, M.; Hall, J.; Horton, R.; Knuuti, K.; Moss, R.; Obeysekera, J.; et al. Global Sea Level Rise Scenarios for the US National Climate Assessment; NOAA: Silver Spring, MD, USA, 2012. [Google Scholar]
- Yin, J.; Schlesinger, M.E.; Stouffer, R.J. Model projections of rapid sea-level rise on the northeast coast of the United States. Nat. Geosci. 2009, 462, 262–266. [Google Scholar] [CrossRef]
- Howard, T.; Pardaens, A.K.; Lowe, J.A.; Ridley, J.; Hurkmans, R.T.W.L.; Bamber, J.L.; Spada, G.; Vaughan, D. Sources of 21st century regional sea level rise along the coast of North-West Europe. Ocean Sci. Discuss. 2013, 10, 2433–2459. [Google Scholar] [CrossRef]
- Obeysekera, J.; Park, J. Scenario-based projection of extreme sea levels. J. Coast. Res. 2012, 29, 1–7. [Google Scholar] [CrossRef]
- Vafeidis, A.T.; Nicholls, R.J.; Mcfadden, L.; Tol, R.S.J.; Hinkel, J.; Spencer, T.; Grashoff, P.S.; Boot, G.; Klein, R.J.T. A new global coastal database for impact and vulnerability analysis to sea-level rise. J. Coast. Res. 2008, 24, 917–924. [Google Scholar] [CrossRef]
- Gornitz, V.M.; Daniels, R.C.; White, T.W.; Birdwell, K.R. The Development of a Coastal Risk Assessment Database: Vulnerability to Sea-Level Rise in the U.S. Southeast. J. Coast. Res. 1994, 371, 327–338. [Google Scholar]
- Jallow, B.P.; Toure, S.; Barrow, M.M.K.; Mathieu, A.A. Coastal zone of The Gambia and the Abidjan region in Cote d’Ivoire: Sea level rise vulnerability, response strategies, and adaptation options. Clim. Res. 1999, 12, 129–136. [Google Scholar] [CrossRef]
- Titus, J.G.; Richman, C. Maps of lands vulnerble to sea level rise: Modeled elevations along the US Atlantic and Gulf coasts. Clim. Res. 2001, 18, 205–228. [Google Scholar] [CrossRef]
- Solomon, S.; Qin, D.; Manning, M. IPCC. Climate Change 2007. The Physical Science Basis; Cambridge University Press: Cambridge, UK; New York, NY, USA, 2007. [Google Scholar]
- Stocker, T.F.; Qin, D.; Plattner, G.K.; Tignor, M.; Allen, S.K.; Boschung, J.; Nauels, A.; Xia, Y.; Bex, V.; Midgley, P.M.; et al. IPCC. Climate Change 2013: The Physical Science Basis; Cambridge University Press: Cambridge, UK; New York, NY, USA, 2013. [Google Scholar]
- Rao, K.N.; Subraelu, P.; Rao, T.V.; Malini, B.H.; Ratheesh, R.; Bhattacharya, S.; Rajawat, A.S. Sea-level rise and coastal vulnerability: An assessment of Andhra Pradesh coast, India through remote sensing and GIS. J. Coast. Conserv. 2008, 12, 195–207. [Google Scholar]
- Nicholls, R.J.; Hoozemans, F.M.J.; Marchand, M. Increasing flood risk and wetland losses due to global sea-level rise: Regional and global analyses. Glob. Environ. Chang. 1999, 9, S69–S87. [Google Scholar] [CrossRef]
- FEMA. Atlantic Ocean and Gulf of Mexico coastal guidelines update. Final draft; Federal Emergency Management Agency: Washington, DC, USA, 2007. [Google Scholar]
- Walsh, K.J.E.; Betts, H.; Church, J.; Pittock, A.B.; McInnes, K.L.; Jackett, D.R.; McDougall, T.J. Using sea level rise projections for urban planning in Australia. J. Coast. Res. 2004, 20, 586–598. [Google Scholar] [CrossRef]
- Gehrels, W.R.; Milne, G.A.; Kirby, J.R.; Patterson, R.T.; Belknap, D.F. Late Holocene sea-level changes and isostatic crustal movements in Atlantic Canada. Quat. Int. 2004, 120, 79–89. [Google Scholar] [CrossRef]
- Koohzare, A.; Vaníček, P.; Santos, M. Pattern of recent vertical crustal movements in Canada. J. Geodyn. 2008, 45, 133–145. [Google Scholar] [CrossRef]
- Sallenger, A.H. Storm impact scale for barrier islands. J. Coast. Res. 2000, 16, 890–895. [Google Scholar]
- Stockdon, H.F.; Sallenger, A.H.; Holman, R.A.; Howd, P.A. A simple model for the spatially-variable coastal response to hurricanes. Mar. Geol. 2007, 238, 1–20. [Google Scholar] [CrossRef]
- Benavente, J.; Del Río, L.; Gracia, F.J.; Martínez-del-Pozo, J.A. Coastal flooding hazard related to storms and coastal evolution in Valdelagrana spit (Cadiz Bay Natural Park, SW Spain). Cont. Shelf Res. 2006, 2, 1061–1076. [Google Scholar] [CrossRef]
- Soldini, L.; Antuono, M.; Brocchini, M. Numerical Modeling of the Influence of the Beach Profile on Wave Run-Up. J. Waterw. Port Coast. Ocean Eng. 2012, 139, 115. [Google Scholar] [CrossRef]
- Bauer, B.O.; Greenwood, B. Surf zone similarity. Geogr. Rev. 1988, 78, 137–147. [Google Scholar] [CrossRef]
- Stockdon, H.; Holman, R.; Howd, P.; Sallenger, A. Empirical parameterization of setup, swash, and runup. Coast. Eng. 2006, 53, 573–588. [Google Scholar] [CrossRef]
- Komar, P.D. Beach processes and sedimentation, 2nd ed.; Prentice Hall, Inglewood Cliffs: Upper Saddle River, NJ, USA, 1998. [Google Scholar]
- Cariolet, J.M.; Suanez, S.; Meur-Férec, C.; Postec, A. Cartographie de l'aléa de submersion marine et PPR: Éléments de réflexion à partir de l’analyse de la commune de Guissény (Finistère, France). Cybergeo 2012, 2012, 1–21. [Google Scholar] [CrossRef]
- Cariolet, J.M.; Suanez, S. Runup estimations on a macrotidal sandy beach. Coast. Eng. 2013, 74, 11–18. [Google Scholar] [CrossRef]
- Ruggiero, P. Is the intensifying wave climate of the U.S. Pacific Northwest increasing flooding and erosion risk faster than sea level rise? J. Waterw. Port Coast. Ocean Eng. 2012, 139, 88–97. [Google Scholar] [CrossRef]
- Ruggiero, P.; Komar, P.D.; McDougal, W.G.; Marra, J.J.; Reggie, A. Wave runup, extreme water levels and the erosion of properties backing beaches. J. Coast. Res. 2001, 17, 407–419. [Google Scholar]
- Seabloom, E.W.; Ruggiero, P.; Hacker, S.D.; Mull, J.; Zarnetske, P. Invasive grasses, climate change, and exposure to storm-wave overtopping in coastal dune ecosystems. Glob. Chang. Biol. 2013, 19, 824–832. [Google Scholar] [CrossRef] [PubMed]
- Battjes, J.A. Surf similarity. In Proceedings of the 14th International Conference on Coastal Engineering ASCE, Copenhagen, Denmark, 24–28 June 1974; pp. 466–480.
- Cariolet, J.M. Quantification du runup sur une plage macrotidale à partir des conditions morphologiques et hydrodynamiques. Geomorphol. Reli. Process. Environ. 2011, 1, 95–108. [Google Scholar] [CrossRef]
- Stockdon, H.F.; Thompson, D.M.; Plant, N.G.; Long, J.W. Evaluation of wave runup predictions from numerical and parametric models. Coast. Eng. 2014, 92, 1–11. [Google Scholar] [CrossRef]
- Holman, R.A.; Sallenger, A.H. Setup and swash on a natural beach. J. Geophys. Res. 1985, 90, 945–953. [Google Scholar] [CrossRef]
- Hughes, S.A. Wave momentum flux parameter: a descriptor for nearshore waves. Coast. Eng. 2004, 51, 1067–1084. [Google Scholar] [CrossRef]
- Mase, H.; Asce, M.; Tamada, T.; Yasuda, T.; Hedges, T.S.; Reis, M.T. Wave runup and overtopping at seawalls built on land and in very shallow water. J. Waterw. Port Coast. Ocean Eng. 2013, 139, 346–357. [Google Scholar] [CrossRef]
- Na, S.J.; Do, K.D.; Suh, K.-D. Forecast of wave run-up on coastal structure using offshore wave forecast data. Coast. Eng. 2011, 58, 739–748. [Google Scholar] [CrossRef]
- Pullen, T.; Allsop, N.W.H.; Bruce, T.; Kirtenhaus, A.; Schüttrumpf, H.; van der Meer, J.W. Eurotop: Wave overtopping of sea defences and related structures: assessment manual; Environment Agency: Rotherham, UK; Expertise Netwerk Waterkeren: Utrecht, The Netherlands; Kuratorium fur Forschung im Kusteningenieurwesen: Hamburg, Germany, 2007. [Google Scholar]
- Carbone, F.; Dutykh, D.; Dudley, J.M.; Dias, F. Extreme wave runup on a vertical cliff. Geophys. Res. Lett. 2013, 40, 3138–3143. [Google Scholar] [CrossRef] [Green Version]
- Chen, X.; Hofand, B.; Altomare, C.; Suzuki, T.; Uijttewaal, W. Forces on a vertical wall on a dike crest due to overtopping flow. Coast. Eng. 2015, 95, 94–104. [Google Scholar] [CrossRef]
- Peng, Z.; Zou, Q.-P. Spatial distribution of wave overtopping water behind coastal structures. Coast. Eng. 2011, 58, 489–498. [Google Scholar] [CrossRef]
- Van der Meer, J.W.; Verhaeghe, H.; Steendam, G.J. The new wave overtopping database for coastal structures. Coast. Eng. 2009, 56, 108–120. [Google Scholar] [CrossRef]
- Molines, J.; Medina, J.R. Calibration of overtopping roughness factors for concrete armor units in non-breaking conditions using the CLASH database. Coast. Eng. 2015, 96, 62–70. [Google Scholar] [CrossRef]
- Van Gent, M.R.A.; Van den Boogaard, H.F.P.; Pozueta, B.; Medina, J.R. Neural network modelling of wave overtopping at coastal structures. Coast. Eng. 2007, 54, 586–593. [Google Scholar] [CrossRef]
- Sabino, A.; Rodrigues, A.; Araujo, J.; Poseiro, P.; Reis, M.T.; Fortes, C.J. Wave overtopping analysis and early warning forecast system. In Proceedings of the ICCSA 2014, Le Havre, France, 23–26 June 2014; Murgante, B., Misra, S., Rocha, A.M.A.C., Torre, C., Rocha, J.G., Falcão, M.I., Taniar, D., Apduhan, B.O., Gervasi, O., Eds.; Springer: Cham, Switzerland, 2014. [Google Scholar]
- Bernatchez, P.; Fraser, C. Evolution of coastal defence structures and consequences for beach width trends, Québec, Canada. J. Coast. Res. 2012, 285, 1550–1566. [Google Scholar] [CrossRef]
- Bernatchez, P.; Fraser, C.; Lefaivre, D.; Dugas, S. Integrating anthropogenic factors, geomorphological indicators and local knowledge in the analysis of coastal flooding and erosion hazards. Ocean Coast. Manag. 2011, 54, 621–632. [Google Scholar] [CrossRef]
- Chini, N.; Stansby, P.K. Coupling TOMAWAC and Eurotop for uncertainty estimation in wave overtopping predictions. In Advances in Hydroinformatics, Springer Hydrogeology; Gourbesville, P., Cunge, J., Caignaert, G., Eds.; Springer: Singapore, Singapore, 2014. [Google Scholar]
- Dawson, R.J.; Dickson, M.E.; Nicholls, R.J.; Hall, J.W.; Walkden, M.J.A.; Stansby, P.K.; Mokrech, M.; Richards, J.; Zhou, J.; Milligan, J.; et al. Integrated analysis of risks of coastal flooding and cliff erosion under scenarios of long term change. Clim. Chang. 2009, 95, 249–288. [Google Scholar] [CrossRef] [Green Version]
- Guimarães, P.V.; Farina, L.; Toldo, E.; Diaz-Hernandez, G.; Akhmatskaya, E. Numerical simulation of extreme wave runup during storm events in Tramandaí Beach, Rio Grande do Sul, Brazil. Coast. Eng. 2015, 95, 171–180. [Google Scholar] [CrossRef]
- Ruggiero, P.; Holman, R.A.; Beach, R.A. Wave run-up on a high-energy dissipative beach. J. Geophys. Res. 2004, 109, 1–12. [Google Scholar] [CrossRef]
- Holman, R. Extreme value statistics for wave run-up on a natural beach. Coast. Eng. 1986, 9, 527–544. [Google Scholar] [CrossRef]
- Gallien, T.W.; Schubert, J.E.; Sanders, B.F. Predicting tidal flooding of urbanized embayments: A modeling framework and data requirements. Coast. Eng. 2011, 58, 567–577. [Google Scholar] [CrossRef]
- Daigle, R.J. Sea level rise estimates for New Brunswick municipalities: Saint John, Sackville, Richibucto, Shippagan, Caraquet, Le Goulet; The Atlantic Climate Adaptation Solutions Association: New-Brunswick, QC, Canada, 2011. [Google Scholar]
- Perherin, C.; Roche, A. Évolution des méthodes de caractérisation des aléas littoraux. In Proceedings of the XIèmes Journées Natl. Génie Côtier-Génie Civil, Les Sables d’Olonne, France, 22–25 June 2010; pp. 609–616.
- Richards, W.; Daigle, R. Scenarios and Guidance for Adaptation to Climate Change and Sea Level Rise- NS and PEI Municipalities; Atlantic Climate Adaptation Solutions Association: Halifax, NS, Canada, 2011; p. 87. [Google Scholar]
- Prime, T.; Brown, J.M.; Plater, A.J. Physical and economic impacts of sea-level rise and low probability flooding events on coastal communities. PLoS ONE 2015, 10, e0117030. [Google Scholar] [CrossRef] [PubMed]
- Daigle, R. Sea-Level Rise and Flooding Estimates for New Brunswick Coastal Sections; The Atlantic Climate Adaption Solutions Association: Halifax, NS, Canada, 2012. [Google Scholar]
- Webster, T.; McGuigan, K.; Collins, K.; MacDonald, C. Integrated river and coastal hydrodynamic flood risk mapping of the lahave river estuary and town of Bridgewater, Nova Scotia, Canada. Integrated river and coastal hydrodynamic flood risk mapping of the lahave river estuary and town of Bridgewater, Nova Scotia, Canada. Water 2014, 6, 517–546. [Google Scholar]
- Pirazzoli, P.A.; Tomasin, A. Estimation of return periods for extreme sea levels: A simplified empirical correction of the joint probabilities method with examples from the French Atlantic coast and three ports in the southwest of the UK. Ocean Dyn. 2007, 57, 91–107. [Google Scholar] [CrossRef]
- Thompson, K.R.; Bernier, N.B.; Chan, P. Extreme sea levels, coastal flooding and climate change with a focus on Atlantic Canada. Nat. Hazards 2009, 51, 139–150. [Google Scholar] [CrossRef]
- Gallien, T.W.; Sanders, B.F.; Flick, R.E. Urban coastal flood prediction: Integrating wave overtopping, flood defenses and drainage. Coast. Eng. 2014, 91, 18–28. [Google Scholar] [CrossRef]
- Webster, T.L.; Forbes, D.L.; Dickie, S.; Shreenan, R. Using topographic lidar to map flood risk from storm-surge events for Charlottetown, Prince Edward Island, Canada. Can. J. Remote Sens. 2004, 30, 64–76. [Google Scholar] [CrossRef]
- Néelz, S.; Pender, G.; Villanueva, I.; Wilson, M.; Wright, N.G.; Bates, P.; Mason, D.; Whitlow, C. Using remotely sensed data to support flood modelling. Water Management 2006, 159, 35–43. [Google Scholar] [CrossRef]
- Ozdemir, H.; Sampson, C.C.; de Almeida, G.A.M.; Bates, P.D. Evaluating scale and roughness effects in urban flood modelling using terrestrial LIDAR data. Hydrol. Earth Syst. Sci. 2013, 17, 4015–4030. [Google Scholar] [CrossRef]
- Forbes, D.L.; Parkes, G.S.; Manson, G.K.; Ketch, L.A. Storms and shoreline retreat in the southern Gulf of St. Lawrence. Mar. Geol. 2004, 210, 169–204. [Google Scholar] [CrossRef]
- Masson, A.; Catto, N. Extratropical Transitions in Atlantic Canada: Impacts and Adaptive Responses. Geophy. Res. Abstr. 2013, 15, 3149. [Google Scholar]
- Boyer-Villemaire, U.; Bernatchez, P.; Benavente, J.; Cooper, J.A.G. Quantifying community’s functional awareness of coastal changes and hazards from citizen perception analysis in Canada, UK and Spain. Ocean Coast. Manag. 2014, 93, 106–120. [Google Scholar] [CrossRef]
- Drejza, S.; Frieseinger, S.; Bernatchez, P. Exposition des infrastructures routières de l’Est du Québec (Canada) à l'érosion et à la submersion. In Proceedings of the Actes du Colloque International Connaissance et Compréhension des Risques Côtiers: Aléas, Enjeux, Représentations, Gestion, Brest, France, 3–4 July 2014.
- Bernatchez, P.; Boucher-Brossard, G.; Sigouin-Cantin, M. Contribution des archives à l’étude des événements météorologiques et géomorphologiques causant des dommages aux côtes du Québec maritime et analyse des tendances, des fréquences et des temps de retour des conditions météo-marines extrêmes; Chaire de recherche en géoscience côtière, Laboratoire de dynamique et de gestion intégrée des zones côtières, Université du Québec à Rimouski; Rapport remis au ministère de la Sécurité publique du Québec: Rimouski, QC, Canada, 2012; p. 140. [Google Scholar]
- MacCaulay, P.; Canadian Hydrographic Service, Dartmouth, N.S., Canada. Personal communication, 2015.
- Didier, D.; Bernatchez, P.; Marie, G. Évaluation de la submersion côtière grâce à l’estimation in situ du wave runup sur les côtes basses du Bas-Saint-Laurent, Canada (Québec). In Proceedings of the Actes du Colloque International Connaissance et Compréhension des Risques Côtiers: Aléas, Enjeux, Représentations, Gestion, Brest, France, 3–4 July 2014.
- Ramana Murthy, M.V.; Reddy, N.T.; Pari, Y.; Usha, T.; Mishra, P. Mapping of seawater inundation along Nagapattinam based on field observations. Nat. Hazards 2012, 60, 161–179. [Google Scholar] [CrossRef]
- Cariolet, J.-M. Use of high water marks and eyewitness accounts to delineate flooded coastal areas: The case of Storm Johanna (10 March 2008) in Brittany, France. Ocean Coast. Management 2010, 53, 679–690. [Google Scholar] [CrossRef]
- Van-Wierts, S.; Bernatchez, P. Relevé LiDAR terrestre à Sainte-Luce dans le secteur de l’Anse aux Coques dans le cadre d’une étude de recharge de plage en zone d’affouillement; Chaire de recherche en géoscience côtière, Laboratoire de dynamique et de gestion intégrée des zones côtières, Université du Québec à Rimouski; Rapport remis au ministère de la Sécurité publique du Québec: Rimouski, QC, Canada, 2012; p. 29. [Google Scholar]
- WAMDI Group. The WAM Model: A Third Generation Ocean Wave Prediction Model. J. Phys. Oceanogr. 1988, 18, 1775–1810. [Google Scholar]
- Komen, G.J.; Cavaleri, L.; Donelan, M.; Hasselmann, K.; Hasselmann, S.; Janssen, P.A.E.M. Dynamic and Modelling of Ocean Waves; Cambridge University Press: New York, NY, USA; p. 556.
- Monbaliu, J.; Hargreaves, J.C.; Carretero, J.C.; Gerritsen, H.; Flather, R. Wave modelling in the PROMISE project. Coast. Eng. 1999, 37, 379–407. [Google Scholar] [CrossRef]
- Jacob, D.; Perrie, W.; Toulany, B.; Saucier, F.; Lefaivre, D.; Turcotte, V. Wave model validation in the St. Lawrence river eastuary. In Proceedings of the 7th International Workshop on Wave Hindcasting and Forecasting, Banff, AB, Canada, 21–25 October 2004.
- Janssen, P.A.E.M. Quasi-linear theory of wind–wave generation applied to wave forecasting. J. Phys. Oceanogr. 1991, 21, 1631–1642. [Google Scholar] [CrossRef]
- Cavaleri, L.; Rizzoli, P.M. Wind wave prediction in shallow water: Theory and applications. J. Geophys. Res. 1981, 86, 10961–10973. [Google Scholar] [CrossRef]
- Hasselmann, K.; Barnett, T.P.; Bouws, E.; Carlson, H.; Cartwright, D.E.; Enke, K.; Ewing, J.A.; Gienapp, H.; Hasselmann, D.E.; Kruseman, P.; et al. Measurements of Wind-Wave Growth and Swell Decay During the Joint North Sea Wave Project (JONSWAP); Deutches Hydrographisches Institute: Delft, Netherlands, 1973. [Google Scholar]
- Battjes, J.A.; Janssen, J.P.F.M. Energy loss and set-up due to breaking of random waves. In Proceedings of the 16th International Conference Coastal Engineering, Hamburg, Germany, 27 August–3 September 1978; pp. 569–587.
- Lambert, A.; Neumeier, U.; Jacob, D. Évaluation du modèle WAM opéré par Environnement Canada dans le Golfe du Saint-Laurent; résultats préliminaires pour les tempêtes de l’automne 2010; Institut des sciences de la mer de Rimouski, Université du Québec à Rimouski; Rapport technique remis au Ministère des Transports du Québec: Rimouski, QC, Canada, 2012. [Google Scholar]
- Lambert, A.P.; Neumeier, U.; Jacob, D.; Savard, J.-P. Are regional operational wind–waves models usable to predict coastal and nearshore wave climate? In Proceedings of the 2012 AGU Fall Meeting; San Francisco, CA, USA: 3–7 December 2012.
- Lambert, A.; Neumeier, U.; Jacob, D.; Savard, J.-P. Évaluation du modèle WAM opéré par Environnement Canada dans le Golfe du Saint-Laurent; résultats intermédiaires pour les années 2010-2011; Institut des sciences de la mer de Rimouski, Université du Québec à Rimouski; Rapport technique remis au Ministère des Transports du Québec: Rimouski, QC, Canada, 2013. [Google Scholar]
- Dalrymple, R.A.; Eubanks, R.A.; Birkemeier, W.A. Wave-induced circulation in shallow basins. J. Waterw. Ports Coast. Ocean Div. 1977, 103, 117–135. [Google Scholar]
- Matias, A.; Williams, J.J.; Masselink, G.; Ferreira, Ó. Overwash threshold for gravel barriers. Coast. Eng. 2012, 63, 48–61. [Google Scholar] [CrossRef]
- Melby, J.A.; Nadal-Caraballo, N.C.; Kobayashi, N. Wave runup prediction for flood mapping. Coast. Eng. Proc. 2012, 33, 1–15. [Google Scholar] [CrossRef]
- Kergadallan, X. Analyse statistique des niveaux d’eau extrêmes. Environnement maritime et estuarien; CETMEF: Margny Lès Compiègne, France, 2013; p. 179. [Google Scholar]
- Vousdoukas, M.I.; Wziatek, D.; Almeida, L.P. Coastal vulnerability assessment based on video wave run-up observations at a mesotidal, steep-sloped beach. Ocean Dyn. 2011, 62, 123–137. [Google Scholar] [CrossRef]
- Nielsen, P.; Hanslow, D.J. Wave runup distributions on natural beaches. J. Coast. Res. 1991, 7, 1139–1152. [Google Scholar]
- Dean, R.G.; Dalrymple, R.A. Water waves mechanics for engineers and scientists. Advances Series on Ocean Engineering; World Scientific: Singapore, Singapore, 1991; p. 368. [Google Scholar]
- Shaw, J.; Taylor, R.B.; Solomon, S.; Christian, H.A.; Forbes, D. Potential impacts of sea-level rise on Canadian coasts. Can. Geogr. 1998, 42, 365–379. [Google Scholar] [CrossRef]
- Koohzare, A.; University of New-Brunswick, Fredericton, NB, Canada. Personal communication, 2015.
- Fisheries and Oceans Canada. Canadian Tides and Water Levels data Archives. Available online: http://www.isdm-gdsi.gc.ca/isdm-gdsi/twl-mne/index-eng.htm (accessed on 20 March 2015).
- CHS–Canadian Hydrographic Service. Predicted Water Levels, numerical dataset. 2012. Available online: http://www.tides.gc.ca/eng/info/WebServicesWLD (accessed on 24 October 2012).
- Garner, K.L.; Chang, M.Y.; Fulda, M.T.; Berlin, J.A.; Freed, R.E.; Soo-Hoo, M.M.; Revell, D.L.; Ikegami, M.; Flint, L.E.; Flint, A.L.; et al. Impacts of sea level rise and climate change on coastal plant species in the central California coast. PeerJ 2015, 3, e958. [Google Scholar] [CrossRef] [PubMed]
- Boon, J.D. Evidence of sea level acceleration at U.S. and Canadian tide stations, Atlantic Coast, North America. J. Coast. Res. 2012, 285, 1437–1445. [Google Scholar] [CrossRef]
- Gumbel, E.J. Statistics of Extremes; Columbia University Press: New York, NY, USA, 1958; p. 375. [Google Scholar]
- Coles, S. An Introduction to Statistical Modeling of Extreme Values; Springer: London, UK, 2001. [Google Scholar]
- Pugh, D.T.; Vassie, J.M. Extreme sea-levels from tide and surge probability. In Proceedings of the 16th on Coastal Engineering Conference, Hamburg, Germany, 27 August–3 September 1978; pp. 911–930.
- Arns, A.; Wahl, T.; Haigh, I.D.; Jensen, J.; Pattiaratchi, C. Estimating extreme water level probabilities: A comparison of the direct methods and recommendations for best practice. Coast. Eng. 2013, 81, 51–66. [Google Scholar] [CrossRef]
- Petrov, V.; Guedes Soares, C.; Gotovac, H. Prediction of extreme significant wave heights using maximum entropy. Coast. Eng. 2013, 74, 1–10. [Google Scholar] [CrossRef]
- Tebaldi, C.; Strauss, B.H.; Zervas, C.E. Modelling sea level rise impacts on storm surges along US coasts. Environ. Res. Lett. 2012, 7, 014032. [Google Scholar] [CrossRef]
- Laudier, N.A.; Thornton, E.B.; MacMahan, J. Measured and modeled wave overtopping on a natural beach. Coast. Eng. 2011, 58, 815–825. [Google Scholar] [CrossRef]
- Holman, R.A.; Guza, R.T. Measuring run-up on a natural beach. Coast. Eng. 1984, 8, 129–140. [Google Scholar] [CrossRef]
- Holland, K.; Holman, R.; Sallenger, A. Estimation of overwash bore velocities using video techniques. In Proceedings of 1991 coastal sediments conference, Seattle, WA, USA, 25–27 June 1991; pp. 489–497.
- Holman, R.; Stanley, J. The history and technical capabilities of Argus. Coast. Eng. 2007, 54, 477–491. [Google Scholar] [CrossRef]
- Bertin, X.; Li, K.; Roland, A.; Bidlot, J.-R. The contribution of short-waves in storm surges: Two case studies in the Bay of Biscay. Cont. Shelf Res. 2015, 96, 1–15. [Google Scholar] [CrossRef]
- FEMA. Guidelines Specifications for Flood Mapping Partners, Appendix D. Guidance for Coastal Flooding Analysis and Mapping; Federal emergency management agency: Wichita, KS, USA, 2012. [Google Scholar]
- FEMA. Wave Runup and Overtopping-FEMA Coastal Flood Hazard Analysis and Mapping Guidelines; Focused Study Report for FEMA: Seattle, WA, USA, February 2005. [Google Scholar]
- FEMA. Great Lakes Coastal Guidelines, Appendix D.3. http://greatlakescoast.org/pubs/reports/Great_Lakes_Coastal_Guidelines_Update_Jan2014.pdf (accessed on 2 June 2015).
- Holland, K.T.; Holman, R.A. The statistical distribution of swash maxima on natural beaches. J. Geophys. Res. 1993, 98, 10271. [Google Scholar] [CrossRef]
- Mase, H. Random wave runup height on gentle slope. J. Waterw. Port Coast. Ocean Eng. 1989, 115, 649–661. [Google Scholar] [CrossRef]
- Saitoh, T.; Kobayashi, N. Wave transformation and cross-shore sediment transport on sloping beach in front of vertical wall. J. Coast. Res. 2012, 280, 354–359. [Google Scholar] [CrossRef]
- Sabatier, F.; Anthony, E.J.; Héquette, A.; Suanez, S.; Musereau, J.; Ruz, M.H.; Regnauld, H. Morphodynamics of beach/dune systems: Examples from the coast of France. Géomorphol. Reli. Processes Environ. 2009, 1, 3–22. [Google Scholar] [CrossRef] [Green Version]
- Jones, A.F.; Brewer, P.A.; Johnstone, E.; Macklin, M.G. High-resolution interpretative geomorphological mapping of river valley environments using airborne LiDAR data. Earth Surf. Processes Landforms 2007, 32, 1574–1592. [Google Scholar] [CrossRef]
- Leon, J.X.; Heuvelink, G.B.M.; Phinn, S.R. Incorporating DEM Uncertainty in Coastal Inundation Mapping. PLoS ONE 2014, 9, e108727. [Google Scholar] [CrossRef] [PubMed]
- Hodgson, M.E.; Jensen, J.R.; Schmidt, L.; Schill, S.; Davis, B. An evaluation of LIDAR- and IFSAR-derived digital elevation models in leaf-on conditions with USGS Level 1 and Level 2 DEMs. Remote Sens. Environ. 2003, 84, 295–308. [Google Scholar] [CrossRef]
- Aguilar, F.; Mills, J.P.; Delagado, J.; Aguilar, M.A.; Negreiros, J.G.; Pérez, J.L. Modelling vertical error in LiDAR-derived digital elevation models. ISPRS J. Photogramm. Remote Sens. 2010, 65, 103–110. [Google Scholar] [CrossRef]
- Han, J.; Kim, S. Spatial zonation of storm surge hazardous area in the Nakdong Estuary of Korea using high precision terrain data acquired with airborne LiDAR system and geospatial analysis. J. Coast. Res. 2013, 65, 1385–1390. [Google Scholar]
- Schubert, J.E.; Gallien, T.W.; Majd, M.S.; Sanders, B.F. Terrestrial Laser Scanning of Anthropogenic Beach Berm Erosion and Overtopping. J. Coast. Res. 2015, 299, 47–60. [Google Scholar] [CrossRef]
- Arkema, K.K.; Guannel, G.; Verutes, G.; Wood, S.A.; Guerry, A.; Ruckelshaus, M.; Kareiva, P.; Lacayo, M.; Silver, J.M. Coastal habitats shield people and property from sea-level rise and storms. Nat. Clim. Chang. 2013, 3, 913–918. [Google Scholar] [CrossRef]
- Gedan, K.B.; Kirwan, M.L.; Wolanski, E.; Barbier, E.B.; Silliman, B.R. The present and future role of coastal wetland vegetation in protecting shorelines: Answering recent challenges to the paradigm. Clim. Chang. 2011, 106, 7–29. [Google Scholar] [CrossRef]
- Prather, M.; Flato, G.; Friedlingstein, P.; Jones, C.; Lamarque, J.-F.; Liao, H.; Rasch, P. Annex II: Climate System Scenario Tables. In IPCC. Climate Change 2013: The Physical Science Basis; Stocker, T.F., Qin, D., Plattner, G.-K., Tignor, M., Allen, S.K., Boschung, J., Nauels, A., Xia, Y., Bex, V., Midgley, P.M., Eds.; Cambridge University Press: Cambridge, UK; New York, NY, USA, 2013. [Google Scholar]
- Senneville, S.; St-Onge Drouin, S.; Dumont, D.; Bihan-Poudec, A.-C.; Belemaalem, Z.; Corriveau, M.; Bernatchez, P.; Bélanger, S.; Tolszczuk-Leclerc, S.; Villeneuve, R. Rapport final : Modélisation des glaces dans l’estuaire et le golfe du Saint-Laurent dans la perspective des changements climatiques; ISMER-UQAR, Rapport final présenté au ministère des Transports du Québec: Rimouski, QC, Canada, 2014. [Google Scholar]
- Church, J.A.; Monselesan, D.; Gregory, J.M.; Marzeion, B. Evaluating the ability of process based models to project sea-level change. Environ. Res. Lett. 2013, 8, 014051. [Google Scholar] [CrossRef]
- Bittermann, K.; Rahmstorf, S.; Perrette, M.; Vermeer, M. Predictability of twentieth century sea-level rise from past data. Environ. Res. Lett. 2013, 8, 014013. [Google Scholar] [CrossRef]
- Gehrels, W.R.; Woodworth, P.L. When did modern rates of sea-level rise start? Glob. Planet. Chang. 2013, 100, 263–277. [Google Scholar] [CrossRef]
- Barnett, R.L.; Gehrels, W.R.; Charman, D.J.; Saher, M.H.; Marshall, W.A. Late Holocene sea-level change in Arctic Norway. Quat. Sci. Rev. 2015, 107, 214–230. [Google Scholar] [CrossRef]
© 2015 by the authors; licensee MDPI, Basel, Switzerland. This article is an open access article distributed under the terms and conditions of the Creative Commons Attribution license ( http://creativecommons.org/licenses/by/4.0/).
Share and Cite
Didier, D.; Bernatchez, P.; Boucher-Brossard, G.; Lambert, A.; Fraser, C.; Barnett, R.L.; Van-Wierts, S. Coastal Flood Assessment Based on Field Debris Measurements and Wave Runup Empirical Model. J. Mar. Sci. Eng. 2015, 3, 560-590. https://doi.org/10.3390/jmse3030560
Didier D, Bernatchez P, Boucher-Brossard G, Lambert A, Fraser C, Barnett RL, Van-Wierts S. Coastal Flood Assessment Based on Field Debris Measurements and Wave Runup Empirical Model. Journal of Marine Science and Engineering. 2015; 3(3):560-590. https://doi.org/10.3390/jmse3030560
Chicago/Turabian StyleDidier, David, Pascal Bernatchez, Geneviève Boucher-Brossard, Adrien Lambert, Christian Fraser, Robert L. Barnett, and Stefanie Van-Wierts. 2015. "Coastal Flood Assessment Based on Field Debris Measurements and Wave Runup Empirical Model" Journal of Marine Science and Engineering 3, no. 3: 560-590. https://doi.org/10.3390/jmse3030560
APA StyleDidier, D., Bernatchez, P., Boucher-Brossard, G., Lambert, A., Fraser, C., Barnett, R. L., & Van-Wierts, S. (2015). Coastal Flood Assessment Based on Field Debris Measurements and Wave Runup Empirical Model. Journal of Marine Science and Engineering, 3(3), 560-590. https://doi.org/10.3390/jmse3030560