1. Introduction
In coastal high-speed railway lines, bridges constitute a significant portion of the infrastructure [
1], and their safety directly affects the reliability of the overall transportation network. As numerous existing and planned coastal railways traverse major tsunami-prone seismic zones—particularly the Circum-Pacific Belt (which includes China’s southeastern coast) and parts of the Indian Ocean region—severe tsunami waves pose a tangible threat to bridge girders. The 2004 Indian Ocean tsunami illustrates this hazard: in several Southeast Asian coastal areas along the Pan-Asian route (e.g., Thailand, Myanmar, and Malaysia), severe tsunami-wave-induced damage to bridge girders disrupted transport continuity, impeded emergency response, and delayed the recovery of critical lifeline corridors [
2,
3]. Therefore, a clear understanding of the mechanical behavior of coastal high-speed railway box girders under tsunami waves is essential for both reliable force assessment and the design of protective measures.
Current studies on tsunami wave forces acting on bridge girders have largely centered on the T-girders widely used in highway bridges, with some studies also involving multi-box girders and plate-girders. The tsunami waves investigated mainly fall into two categories: unbroken tsunami waves and broken tsunami waves. Among those focusing on unbroken tsunami wave forces on bridge girders, Guo et al. [
4] experimentally explored the component makeup of tsunami wave forces on T-girders under periodic and solitary waves, and evaluated how the horizontal force responds to changes in girder clearance, incident wave height, and wave period. In addition, the girder force assessment procedures proposed by Douglass [
5] and AASHTO [
6] were further refined. Ho et al. [
7] carried out numerical simulations to examine the response of coastal bridges to solitary wave impacts. Key parameters—including wave height, water depth, girder clearance, and the number of longitudinal girders—were varied to assess their effects on the horizontal and vertical wave forces. The results showed that peak horizontal and vertical wave forces increase approximately linearly with wave height, and that air entrainment noticeably amplifies the vertical wave force. Mazinani [
8] combined Extreme Learning Machine (ELM) with physical experiments and used experimental datasets covering water depth, wave height, and girder geometry to develop predictive models for the key response quantities, namely the horizontal and vertical wave forces and the associated overturning moment. Xiang [
9] employed both experiments and numerical simulations to examine the solitary wave-induced responses of steel–concrete composite girder bridges, including the horizontal and vertical wave forces and the overturning moment. The study further evaluated how girder height and wave height affect the resulting impact forces. Deng et al. [
10] conducted numerical simulations of inclined T-girders and box girders subjected to solitary wave forces. The simulations demonstrated clear contrasts in force characteristics for these configurations across a range of submergence conditions, and further showed that a positive inclination angle can lower bridge damage risk once the girder becomes fully submerged. Xu et al. [
11] employed numerical modeling to quantify freak-wave-induced forces for T-girders and box girders, focusing on the roles of focus position and wave height in shaping the force characteristics. It was found that the forces associated with freak waves are substantially larger than those produced by regular waves.
Focusing on broken tsunami wave forces on bridge girders, Tang et al. [
12] explored breaking wave actions on box girders and revealed that the distance between the structure and the breaking point controls the peak slamming force, whereas the overall wave force escalates with wave steepness and decreases as bridge clearance increases. Fu et al. [
13] conducted a comparative experimental study on T-girders under broken and unbroken waves. The results indicated that a higher horizontal impact peak force is obtained when the girder is located closer to the midpoint of the incident wave height. In contrast, the dependence of the vertical impact peak force on girder clearance depends on the wave front profile. Nakao et al. [
14] compared the force–time histories of five girder sections with varying cross-sections under dam-break waves, and the shape of the T-girder was optimized accordingly. Yang et al. [
15] experimentally investigated the force characteristics of plate-girders and T-girders under a range of dam-break waves. The results showed how these forces vary with initial water depth and incoming wave height, and how they are further modulated by girder clearance. Based on the findings, corresponding force calculation methods were proposed.
Prior studies indicate that the time history characteristics and peak forces are governed by the wave profile and girder clearance, and are further remarkably influenced by the girder’s cross-sectional geometry. Meanwhile, for coastal high-speed railway box girders, which are characterized by a significant height-to-width ratio, large cantilevers, and complex ancillary facilities on the girder top, their geometric configurations differ markedly from those of the T-girders, multi-box girders and plate-girders commonly considered in existing studies. Consequently, their force mechanisms under tsunami waves are expected to differ significantly. However, to the best of our knowledge, studies on the interaction between railway box girders and tsunami waves are lacking, necessitating further in-depth investigation.
In addition, most of the girders in prior studies were treated as fixed. In real engineering, coastal girders may undergo certain lateral displacements under wave action (vertical and rotational displacements are relatively limited and typically negligible), and such mobility may alter the resulting wave forces. To account for girder mobility, several studies have examined how lateral motion influences girder forces using models with laterally movable girders. In their studies, the magnitude of lateral displacement was adjusted by varying the lateral stiffness. Here, the lateral stiffness serves as an overall representation of the stiffness of the substructure piers and the connection stiffness between the pile cap and the girder. The connection stiffness is governed by the bearing type and the specific configurations of protective measures, such as shear keys, restraint cables, and shape memory alloys. In this field, Bradner et al. [
16] experimentally explored the effects of regular waves on both fixed and laterally movable T-girders, and the results indicate that the wave forces exhibit a slight increase when the girder is allowed to move laterally, although the extent of the increase is very limited. Xu and Cai [
17] established a numerical model for a laterally movable T-girder subjected to solitary waves using a dynamic mesh updating approach. Their results showed that the vertical wave force is insensitive to the lateral stiffness, whereas the combined horizontal wave force and inertia force decreases as lateral stiffness increases. Xu et al. [
18] further showed that for twin T-girders under solitary waves, neither horizontal nor vertical forces differ significantly between movable and fixed configurations. Xu and Cai [
19] numerically explored the interaction between Stokes waves and a T-girder, and found that an increase in lateral stiffness does not necessarily lead to a reduction in horizontal and vertical wave forces, but it consistently reduces the sum of the horizontal wave force and the inertia force. Following the dynamic mesh update technology of Xu and Cai [
17], Chen et al. [
20] numerically studied the effect of lateral stiffness on the solitary wave forces acting on the box girder, and found that lowering the lateral stiffness observably reduces the horizontal and vertical wave forces. Further, Huang et al. [
21] investigated periodic waves and indicated that, compared to a fixed girder, both the horizontal and vertical wave forces on a laterally movable girder are reduced, and the wave forces decrease further as the stiffness diminishes, with the maximum reduction reaching 28.0% in horizontal wave force and 22.5% in vertical wave force. Yang et al. [
22] performed numerical simulations to assess the role of lateral stiffness under dam-break wave action, showing that a laterally movable girder experiences significantly reduced horizontal and vertical wave forces (15.5–21.0%) compared to a fixed girder, while being insensitive to stiffness variations. Chen et al. [
23] constructed a laterally movable girder model to analyze solitary-wave interaction with a T-girder and a box girder, showing that the lateral displacement of both girders first increases and then decreases with girder clearance, and their relative displacement magnitude depends on the clearance. Chen et al. [
24] further examined periodic waves and found that differences in girder geometric shape cause significant variations in force–time history and lateral displacement. The above research indicates that no general consensus has yet been reached regarding the effect mechanism of lateral displacement on the interaction between tsunami waves and girders, nor on the variation in wave forces. This implies that the mechanism depends closely on both the wave profile and the girder geometry. Given that the effect mechanism of lateral displacement on a high-speed railway box girder has not been reported in the literature, dedicated research is urgently needed.
Consequently, addressing the practical challenge of tsunami wave threats to coastal high-speed railway box girders, conducting in-depth research on their force mechanisms under tsunami wave is a pressing scientific priority for the construction and maintenance of coastal railway lines. In light of this, this study takes the widely used single-track high-speed railway box girder as the research object, focusing on the investigation of the mechanical behavior of fixed and laterally movable railway box girders under unbroken and broken tsunami waves. The remainder of this paper is organized as follows:
Section 2 describes the establishment and validation of the numerical models for the interaction of unbroken and broken tsunami waves with the fixed railway box girder; the characteristics of the interaction process and the variation in the maximum forces with girder clearance are presented and interpreted in
Section 3 and
Section 4; in
Section 5, a mass–spring–damper system is introduced and the numerical models for the laterally movable girder are established and validated through existing studies, and the effects of lateral displacement on girder wave forces are analyzed and highlighted; and finally, the main conclusions are summarized in
Section 6. Given that the girder type investigated in this study differs significantly from the commonly studied girders in the existing literature (e.g., plate-girders and T-girders), the findings of this study differ markedly from those of existing research. This study aims to provide theoretical support for the risk assessment of high-speed railway box girders under tsunami wave action.
2. Methodology
This section outlines the overall research methodology. The study employs a two-phase numerical approach based on the Reynolds-averaged Navier–Stokes (RANS) equations coupled with the Volume of Fluid (VOF) method to simulate tsunami wave interaction with a fixed railway box girder. Two representative wave types are comparatively considered: dam-break waves to model broken tsunami waves, and fifth-order solitary waves to represent unbroken tsunami waves. The numerical setup, including the computational domain, boundary conditions, and mesh generation using the overset mesh technique, is described in detail. The models are rigorously validated against both theoretical solutions and experimental data to ensure the reliability of the subsequent parametric investigations.
2.1. Governing Equations
Previous studies have applied Ansys Fluent to numerical simulations of tsunami wave–structure interactions, including bridges [
25,
26], coastal protective walls [
27,
28], and buildings [
29,
30]. In the present work, Ansys Fluent is used to simulate tsunami wave propagation and its interaction with a coastal single-track high-speed railway box girder. The flow is modeled as a two-phase (air–water) system, with both fluids treated as Newtonian and incompressible. To balance accuracy and computational cost, a two-dimensional (2D) model is adopted. The flow field is described by the Reynolds-averaged Navier–Stokes (RANS) equations:
where
and
are the time-averaged velocities in the
direction and
direction, respectively, which can be defined as
, as the velocity
consists of the time-averaged velocity
and the fluctuating velocity
, i.e.,
;
represents the time-averaged pressure;
represents the fluid density; and
represents the fluid dynamic viscosity. Since the numerical model explicitly considers the two-phase (air–water) flow, the VOF approach [
31,
32] is employed to capture the interface between the two fluids.
Several turbulence models are commonly adopted in numerical studies of hydrodynamic simulations, such as the
-
, standard
-
, and RNG
-
models. Previous studies (e.g., Yang et al. [
33]) suggest that these models generally exhibit comparable capability in reproducing the main characteristics of tsunami-induced flow fields. For wave impact problems involving bridge girders, however, a substantial amount of literature [
34] suggests that the RNG
-
model tends to deliver more reliable predictions. Therefore, the RNG
-
model is adopted in the present study. The turbulent kinetic energy
k and the dissipation rate
are determined using the equations:
where
,
,
= 1.42,
and
= 0.0845, respectively.
2.2. The Theory of Dam-Break Wave and Solitary Wave
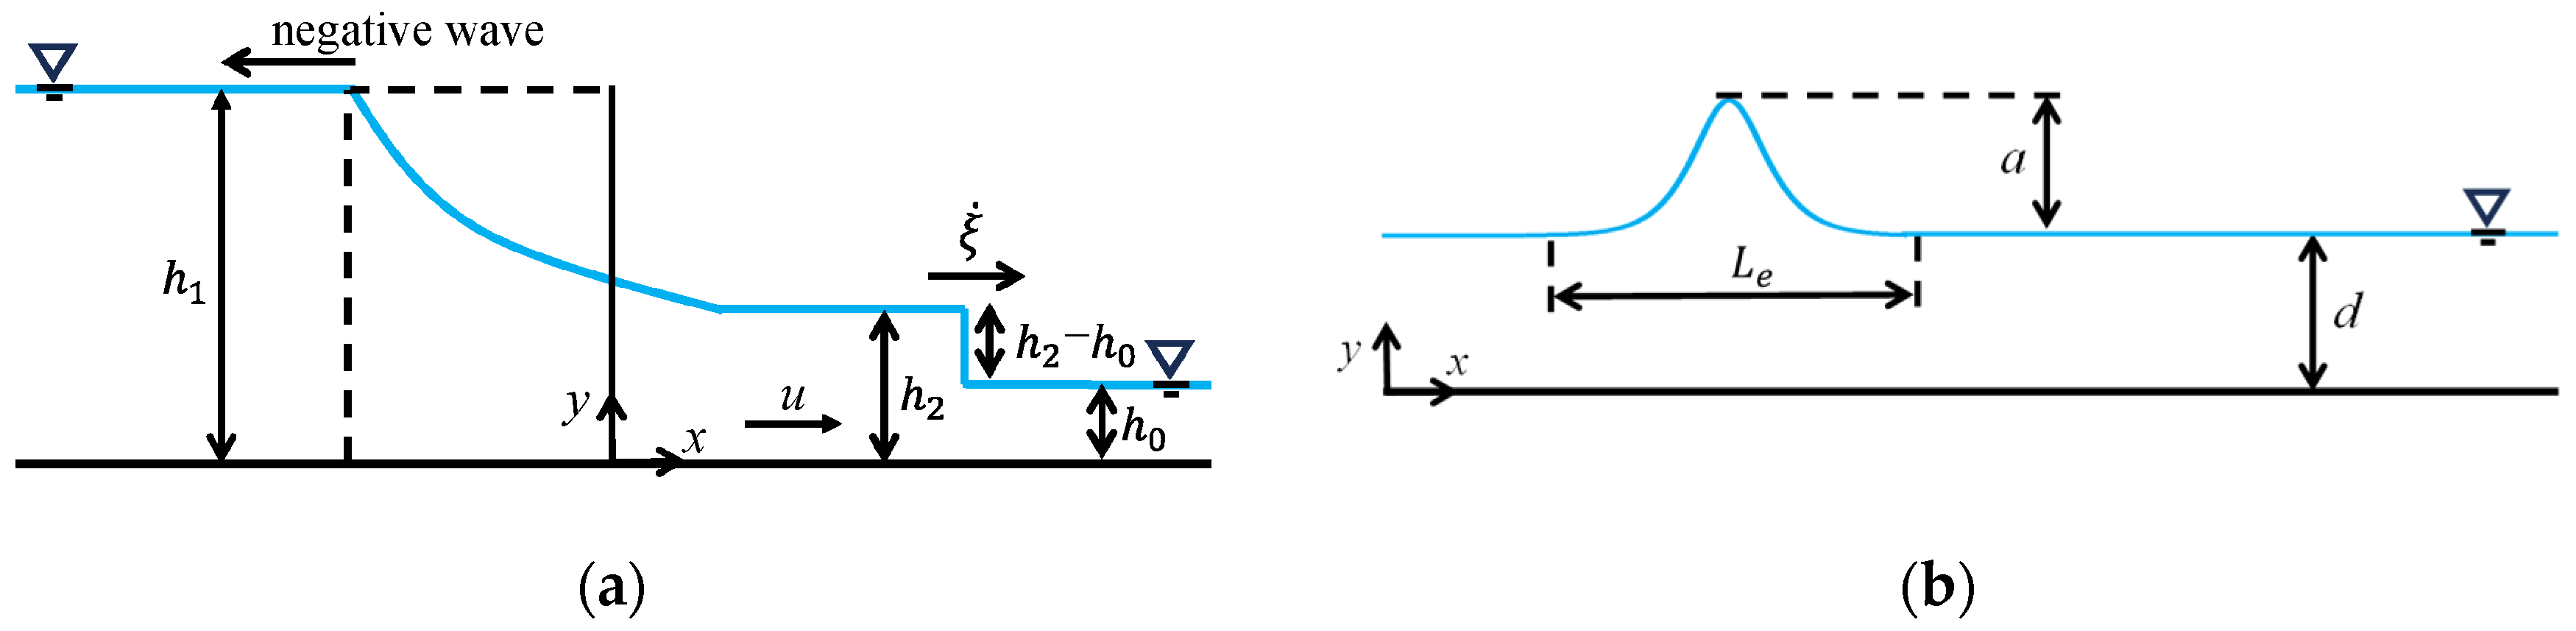
For the dam-break wave, the theoretical solution is described in Equations (6) and (7), and its physical interpretation is shown in
Figure 1a.
among them,
t is the propagation time;
h1 is the initial upstream water depth;
h0 is the initial downstream water depth;
h2 is the wave height;
u2 is the wave velocity;
is the celerity of the wave front;
;
;
.
can be obtained by iterative calculation using Equation (8); further details can be found in Yang et al. [
35].
For the fifth-order solitary wave, as interpretated in
Figure 1b, the free-surface elevation
and the wave celerity
c can be expressed as:
where
a is the wave height and
d is the water depth,
denotes the amplitude (weight) of the
th term in the representation of the free-surface elevation, and
is the corresponding wave number (length-scale) parameter that controls the spatial decay/width of the wave profile. In numerical simulations, an effective wave length
is often introduced for wave generation and parameterization [
17]. In this study,
is estimated as
.
2.3. Numerical Model Setup
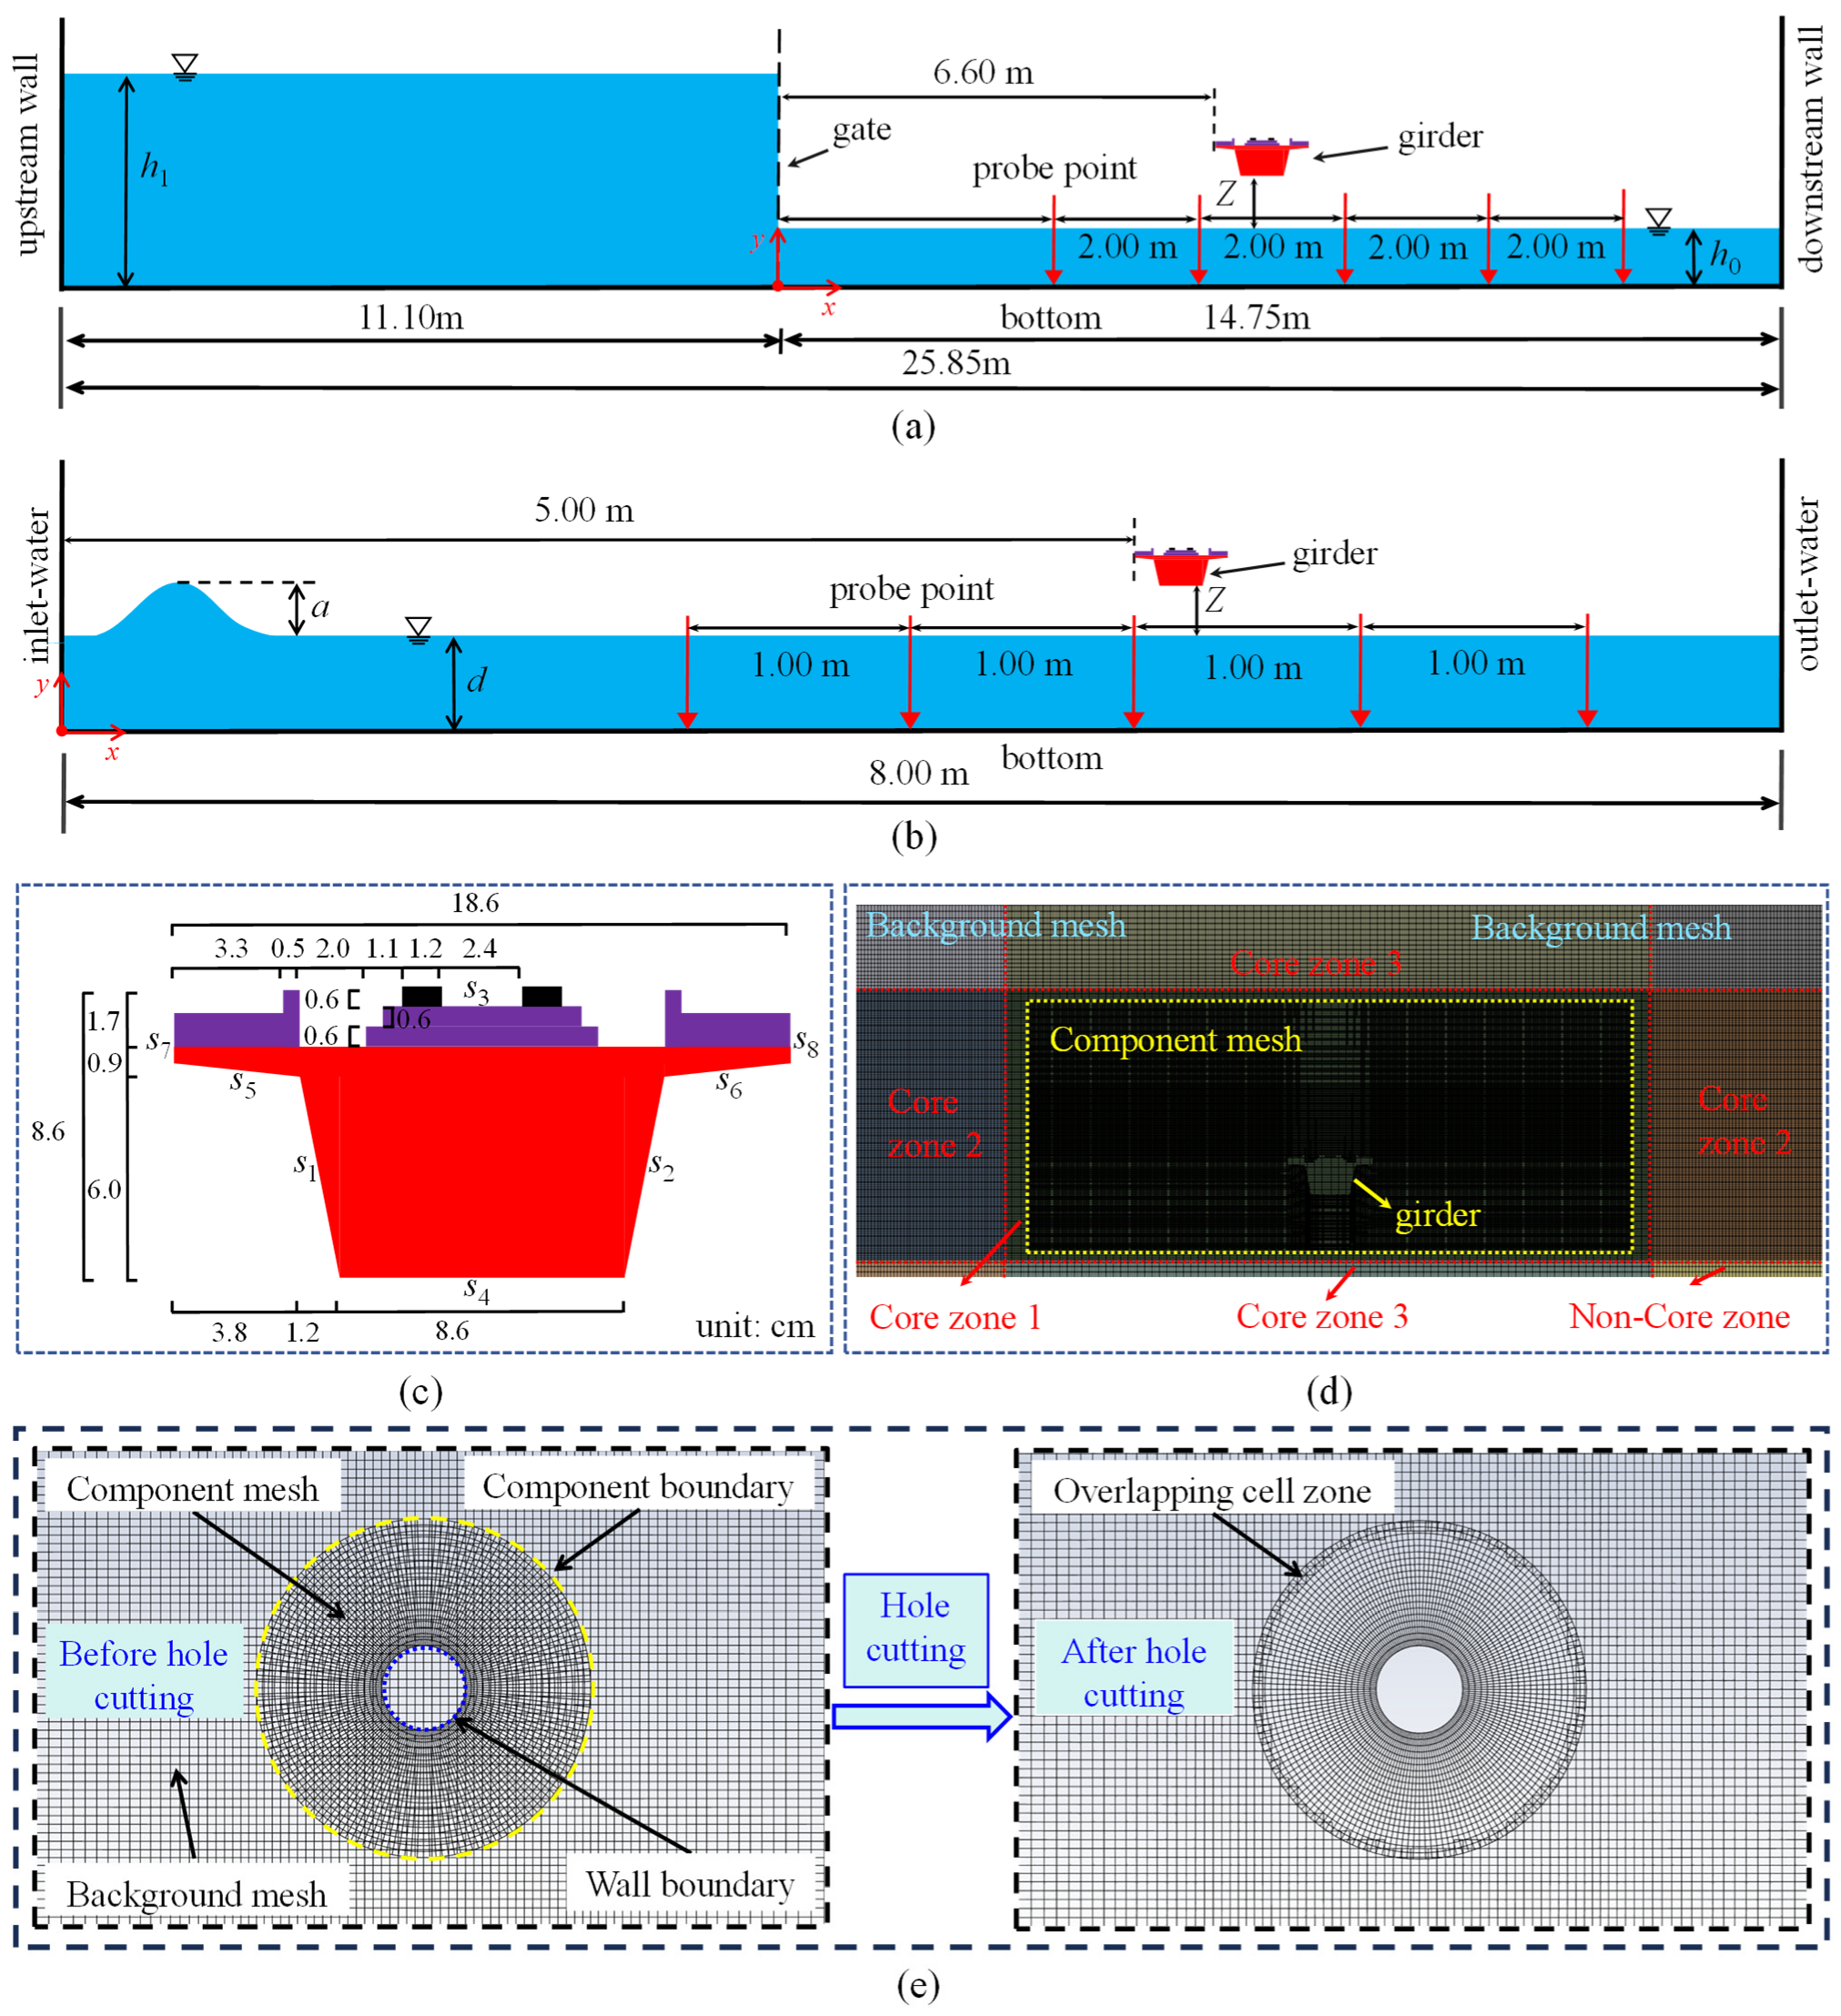
The setup of the two numerical models for the dam-break wave and the solitary wave are shown in
Figure 2a,b, respectively, in which the numerical dam-break wave flume is designed with reference to the physical wave flume at Zhengzhou University, for the purpose of comparison and validation with the experimental results obtained in this flume, which will be presented and detailed in a subsequent section. The flume has a total length of 25.85 m, consisting of an upstream reservoir of 11.10 m and a downstream region of 14.75 m, with a height of 0.80 m. The initial upstream and downstream water depths are specified as
h1 and
h0, respectively. The gate is taken to be removed instantaneously; therefore, the gate-opening process is not considered in this study. No-slip boundary conditions are imposed on the bottom as well as the upstream and downstream walls, whereas the top boundary is specified as a pressure outlet at atmospheric pressure (101,325 Pa), allowing air to move freely. Meanwhile, the solitary wave flume has a total length of 8.00 m, also with a height of 0.80 m. The solitary wave height and wave depth are denoted by
a and
d, respectively. Boundary conditions are specified as follows: an inlet-water boundary at the upstream side, an outlet-water boundary at the downstream side, a no-slip wall at the bottom, and a pressure-outlet condition at the top with an atmospheric pressure of 101,325 Pa. The kinematic viscosities of water and air for the above two models are 1.0030 × 10
−6 m
2/s and 1.7894 × 10
−5 m
2/s, respectively, with corresponding densities of 998.2 kg/m
3 and 1.225 kg/m
3.
The bridge model adopted in this study is derived from the coastal single-track high-speed railway box girder. Based on the Froude similarity criterion, a 1:40 scale model was obtained from the widely used 32.0 m span box girder of a Chinese standard high-speed (350 km/h) railway bridge, including its ancillary components. The girder model features a width of 23.7 cm and a height of 8.1 cm, as shown in
Figure 2c. The outer faces of the girder are defined as follows: the upstream inclined web face is denoted as
s1, the downstream inclined web face as
s2, the top face as
s3, the bottom face as
s4, the beveled faces beneath the upstream and downstream cantilevers as
s5 and
s6, the front face of the upstream cantilever as s
7, and the back face of the downstream cantilever as s
8. The distance from the girder front to the gate in
Figure 2a is 6.60 m, and to the inlet-water boundary in
Figure 2b is 5.00 m; the corresponding clearance between the girder bottom and the initial downstream water level is denoted as
Z. Five probe points are set in the numerical flume to record the wave height time history.
In this study, the overset mesh method is adopted, where the computational domain is decomposed into a background mesh and a component mesh (
Figure 2d). Unlike traditional meshing strategies, the background mesh and component mesh in the overset mesh method are generated independently, as interpreted in
Figure 2e, and the flow information from one mesh system is interpolated from its cells to the adjacent overlapping cell zone and then transferred to the cells of the other mesh system, a procedure which is carried out in both directions [
24]. Specifically, the component mesh is defined as a rectangular region surrounding the girder, with a length of 2.0 m and a width of 0.4 m. Meanwhile, the background mesh is further partitioned into four sub-zones: core zone 1 is defined as a rectangular region surrounding the girder, with a length of 3.0 m and a width of 0.6 m, of which the expansion in the upstream and downstream direction forms core zone 2, while the expansion in the upward and downward direction forms core zone 3. The region outside these zones constitutes the non-core zone.
The mesh resolution has a direct impact on the accuracy of the numerical results, especially in the vicinity of the girder where strong velocity gradients and flow separation may occur during wave impact. To accurately capture the hydrodynamic characteristics of the wave–structure interaction, a mesh sensitivity analysis is performed using the dam-break wave interaction with the girder (
Figure 2a), under the condition of
h1 = 55.47 cm and
h0 = 12.00 cm and a girder clearance of
Z = 6.00 cm. Four levels of mesh resolution are generated by progressively refining both the background mesh and component mesh, as shown in
Table 1.
The cell size of dx = dy = 9.0 mm, 6.0 mm, 3.0 mm, and 1.5 mm is tested for the component mesh. In core zone 1, the cell size of dx = dy =12.0 mm, 8.0 mm, 4.0 mm and 2 mm is tested. In core zone 2, dy is kept identical to that in core zone 1, while dx is set as 15.0 mm, 12.0 mm, 10.0 mm, and 4.0 mm and stretched toward both the upstream and downstream directions using a growth ratio of 1.2. In core zone 3, dx is kept the same as in core zone 1, whereas dy is set as 15.0 mm, 12.0 mm, 10.0 mm, and 4.0 mm and stretched toward the upward and downward directions with the same growth ratio of 1.2. In the non-core zone, the base cell size is set to dx = dy = 15.0 mm, 12.0 mm, 10.0 mm, and 4.0 mm, and a growth ratio of 1.2 is applied in both directions.
The resulting total cell numbers are 1,741,834, 365,883, 183,400 and 96,520, respectively.
Table 2 summarizes the horizontal and vertical peak forces on the girder, and the corresponding computational cost. A time-step sensitivity test (
0.0002 s, 0.0005 s, and 0.001 s) indicates that
= 0.0005 s provides a satisfactory compromise between accuracy and efficiency and is therefore adopted. The results in
Table 2 indicate that with the gradual refinement of the mesh, the third grid resolution has converged with high accuracy while maintaining computational efficiency. A cell size of
dx =
dy = 3.0 mm is adopted for the component mesh. And in the background mesh,
dx =
dy = 4.0 mm for core zone 1, while
dx = 10.0 mm and
dy = 4.0 mm for core zone 2,
dx = 4.0 mm and
dy = 10.0 mm for core zone 3, and
dx =
dy = 10.0 mm for the non-core zone, simultaneously with a growth ratio of 1.2, are adopted. Hence, this mesh configuration is employed in the following simulations.
2.4. Validation of the Numerical Model
To ensure the capability and reliability of the numerical model, this section focuses on the validation of the numerical model, including three aspects: the wave front profile, the wave propagation celerity, and the time history of the wave forces on the girder.
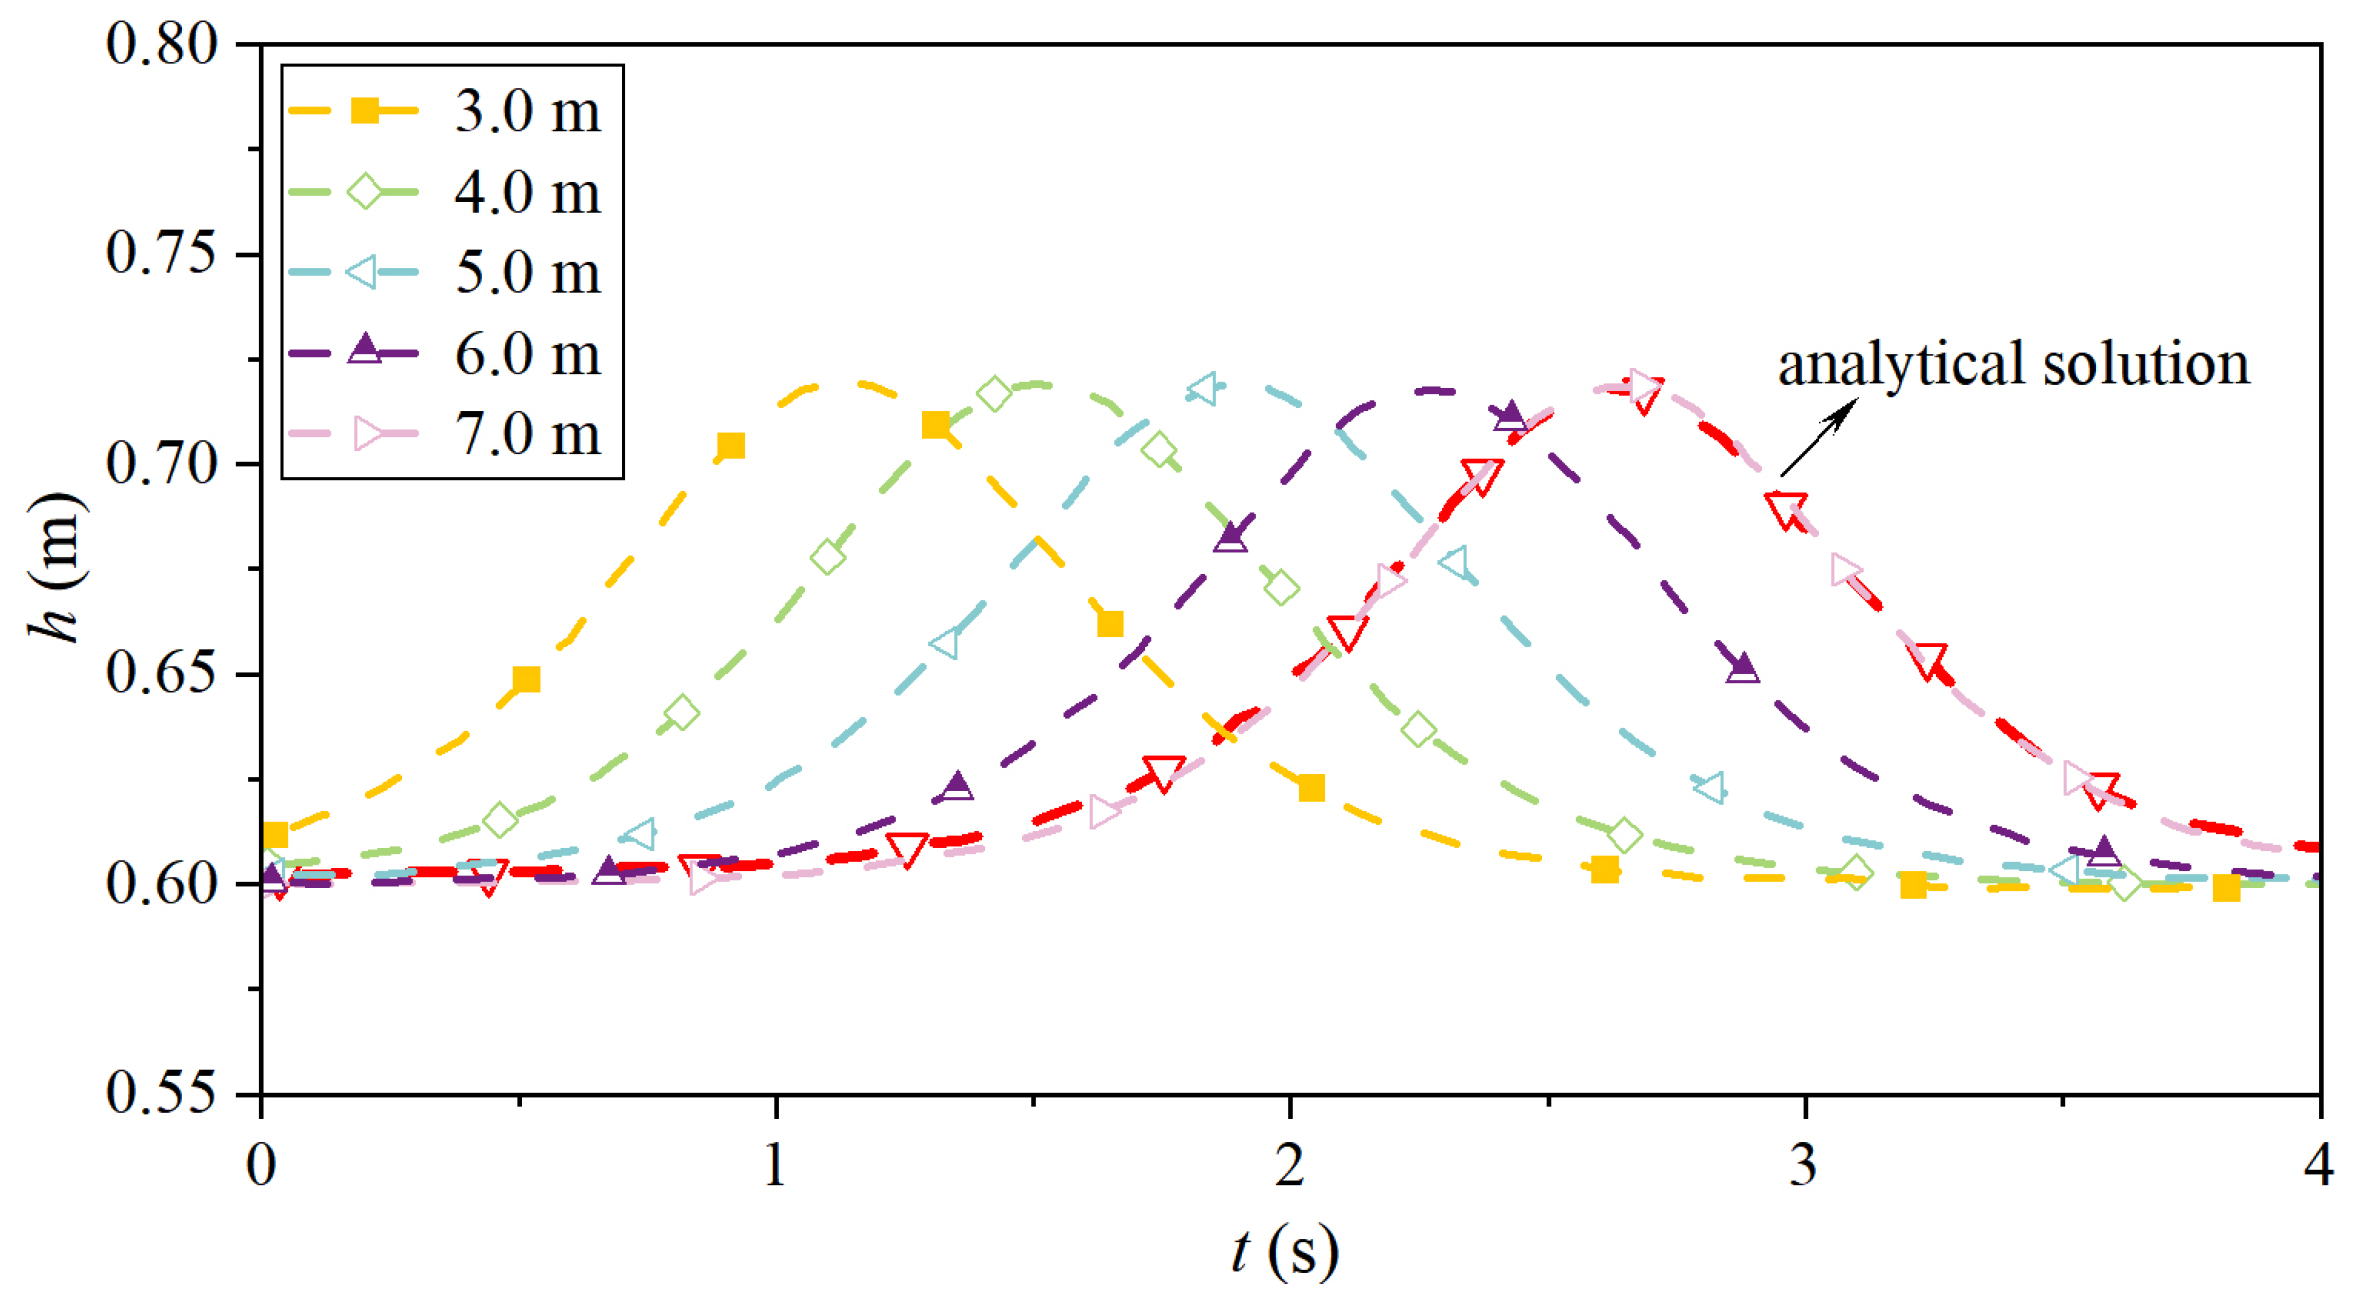
For the fifth-order solitary wave, firstly, the free-surface elevation
recorded at 3.0 m, 4.0 m, 5.0 m, 6.0 m and 7.0 m are plotted in
Figure 3 for the wave case of
d = 0.60 m and
a = 0.12 m, together with the theoretical solution at 7.0 m. The comparisons demonstrate that the numerical results agree well with the theoretical solution, and the wave profile stays stable and no noticeable wave height attenuation is observed with propagation. Secondly, the arrival times of the wave crest at each probe point and their spacing can be used to calculate the wave propagation celerity. The propagation celerity calculated based on the three positions at 3.0 m, 5.0 m, and 7.0 m are 2.651, 2.653, and 2.652, respectively, with the relative error of 0.26%, 0.19%, and 0.23%, respectively, when compared with the theoretical celerity of 2.658 m/s, verifying the accuracy of the propagation celerity.
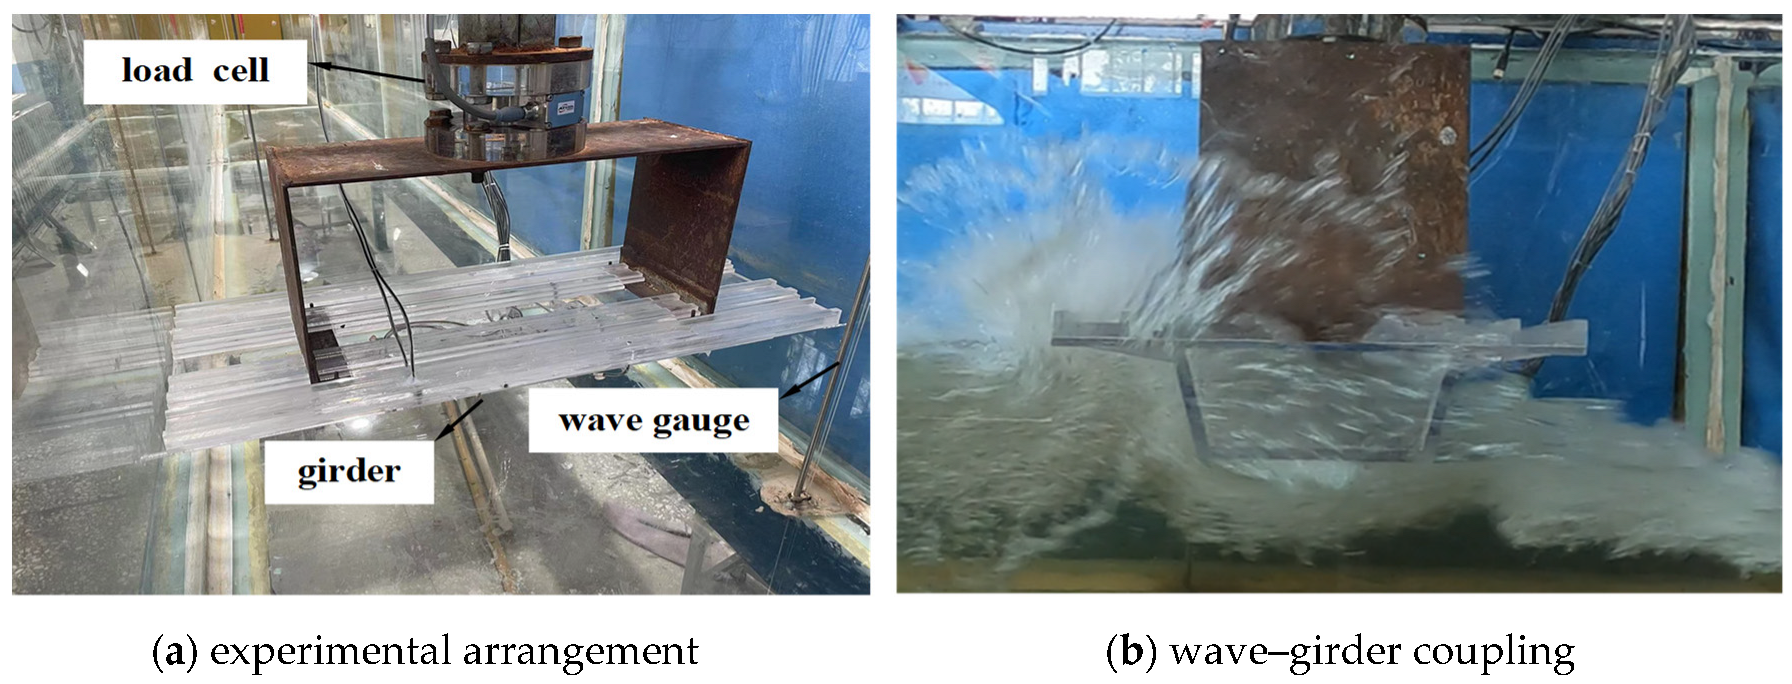
For the dam-break wave, the numerical model was validated against experimental measurements conducted by the authors in the dam-break flume at Zhengzhou University (see
Figure 4). The flume geometry is provided in
Figure 2a, and its width is 0.8 m. A representative case with
h1 = 54.6 cm and
h0 = 16.0 cm is selected, and a 1:40 scaled coastal twin-track high-speed railway box girder model is placed at 6.6 m, with the girder clearance of
Z = 4.0 cm; in addition, five wave gauges (100 Hz; ±0.5 mm) are installed at 4.0 m, 6.0 m, 8.0 m, 10.0 m, and 12.0 m, sharing the same positions with the probe points in
Figure 2a; in addition, the girder wave forces were recorded by a load cell (1000 Hz; ±5/16 N) installed above the girder. Firstly, the arrival times of wave front tip at each probe point and their spacing are used to calculate the wave front celerity. The celerity calculated from the three probes at 4.0 m, 6.0 m, and 8.0 m are compared with the experimental results and theoretical solution, as shown in
Table 3; the very limited relative errors verify the accuracy of the wave front celerity.
Secondly, following Yang et al. [
35] and Ramsden [
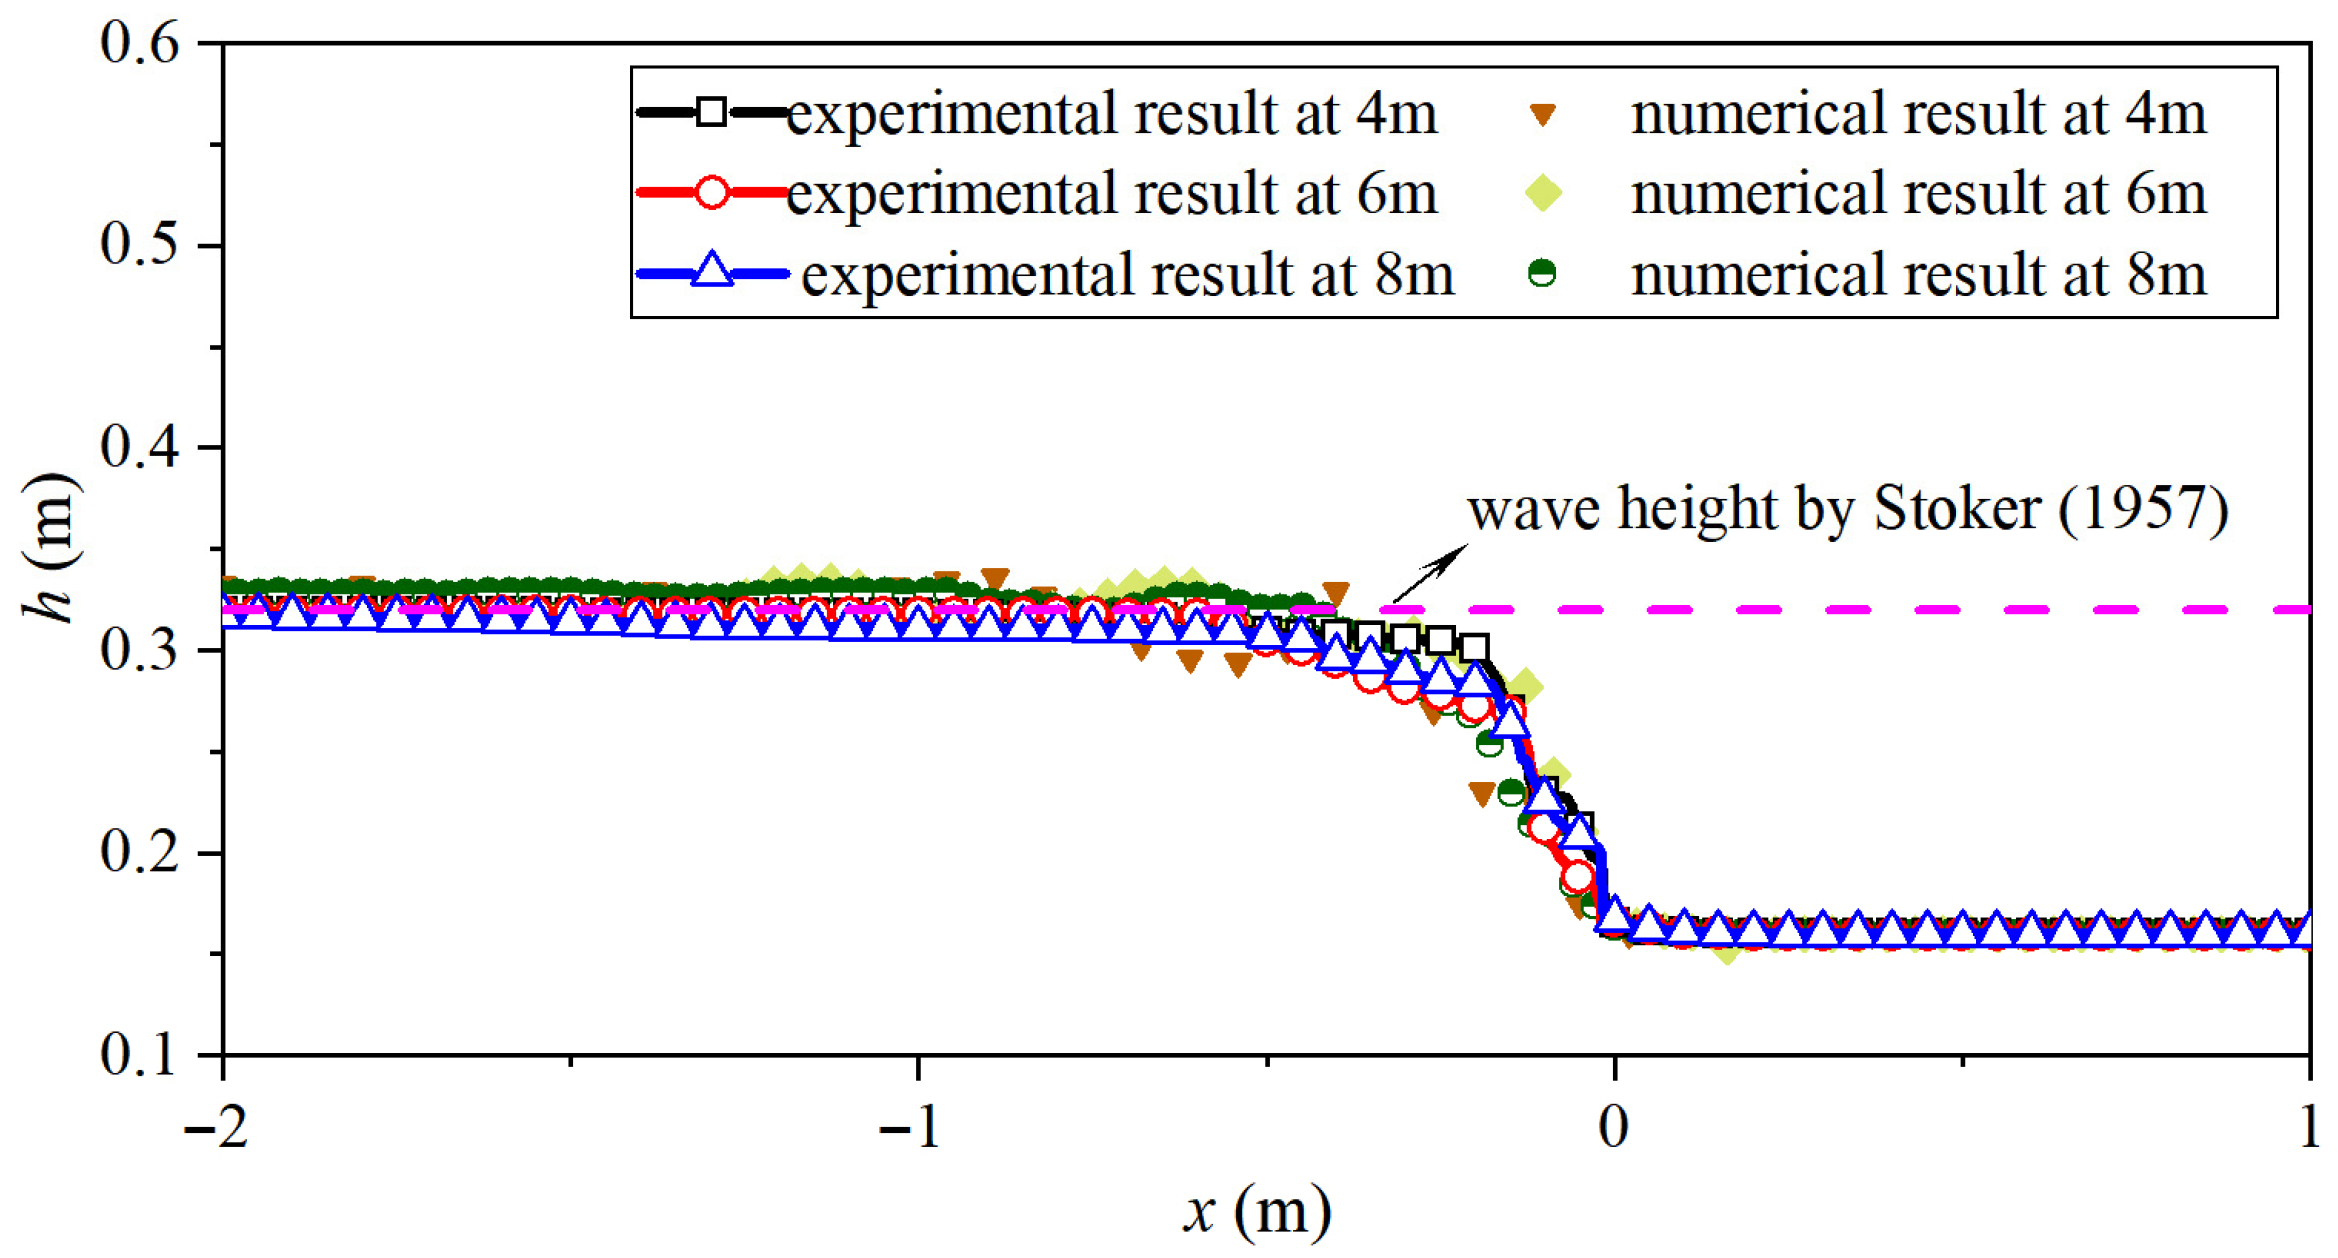
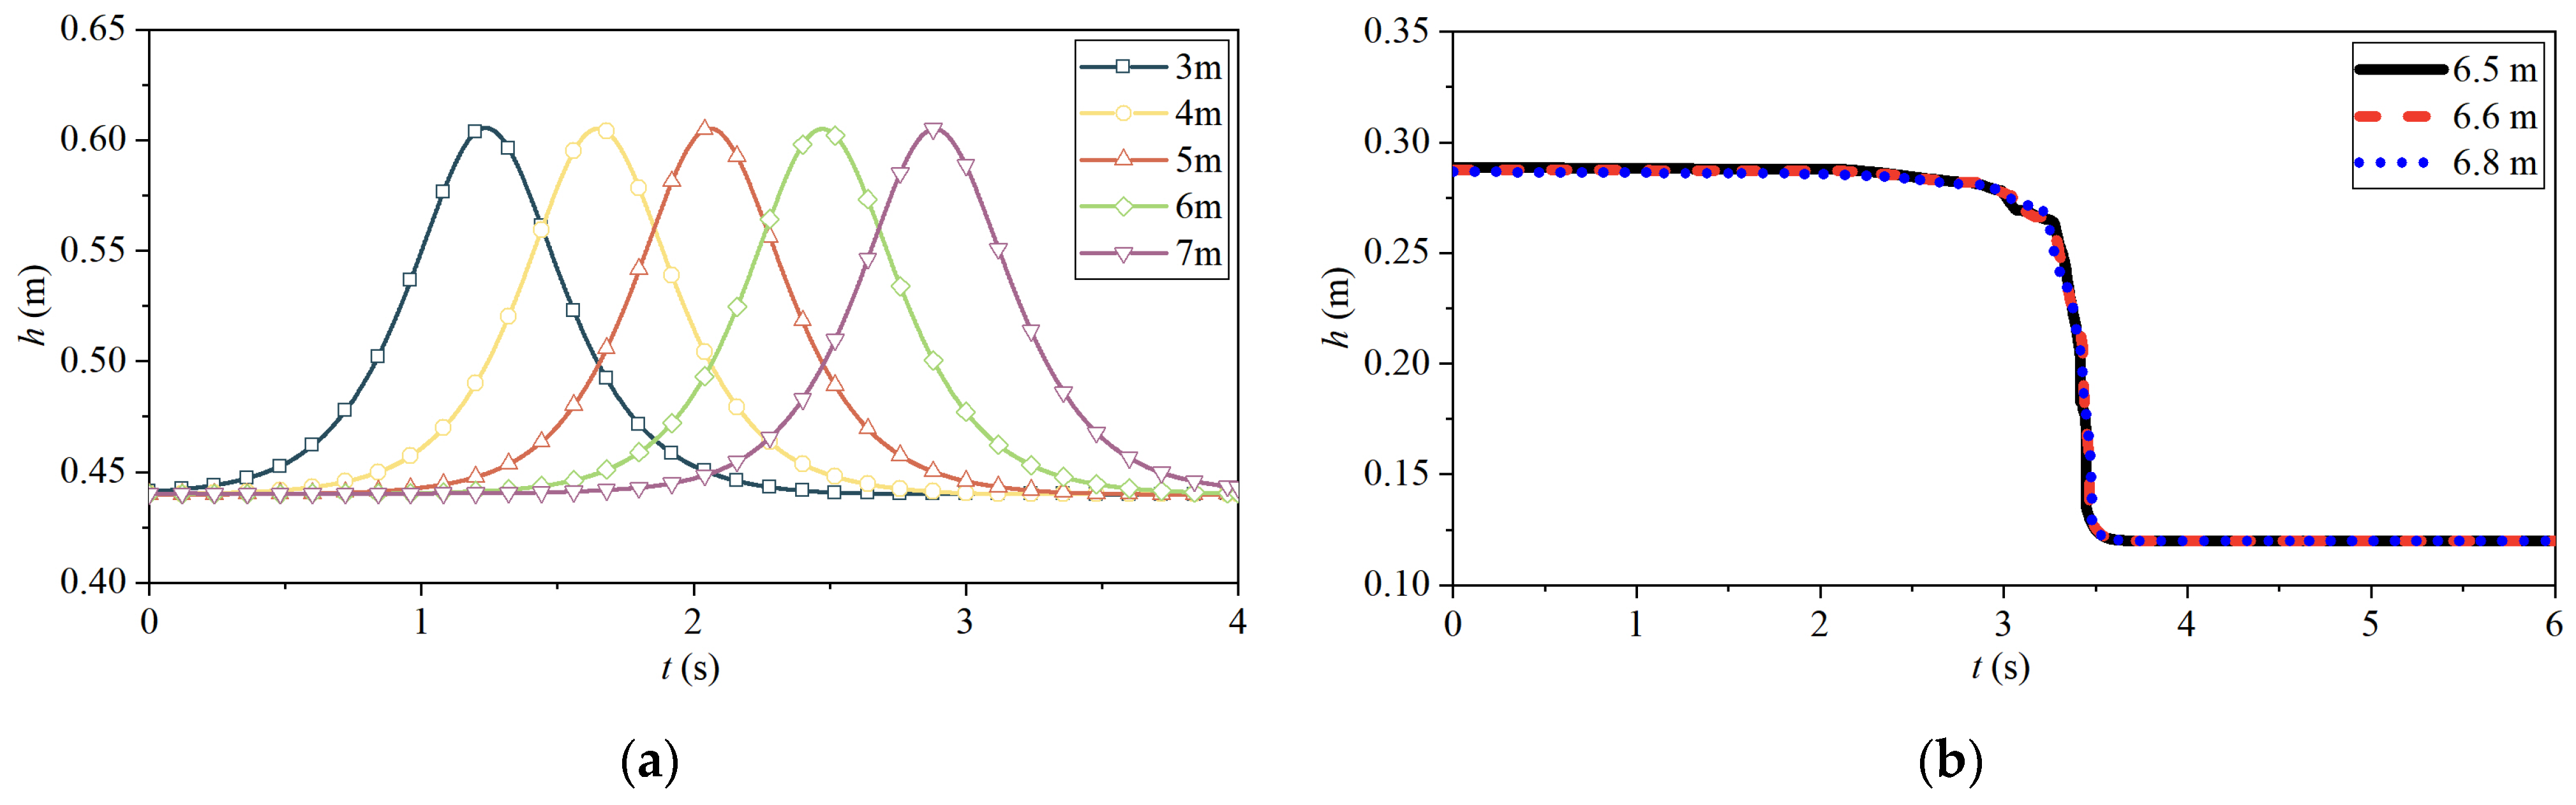
36], the wave front profiles can be obtained from the multiplication of the wave height time history recorded at the downstream probe points and corresponding constant wave front celerity, as shown in
Figure 5, together compared with the experimental wave front profiles and the theoretical wave height by Stoker [
37]. The good agreement in
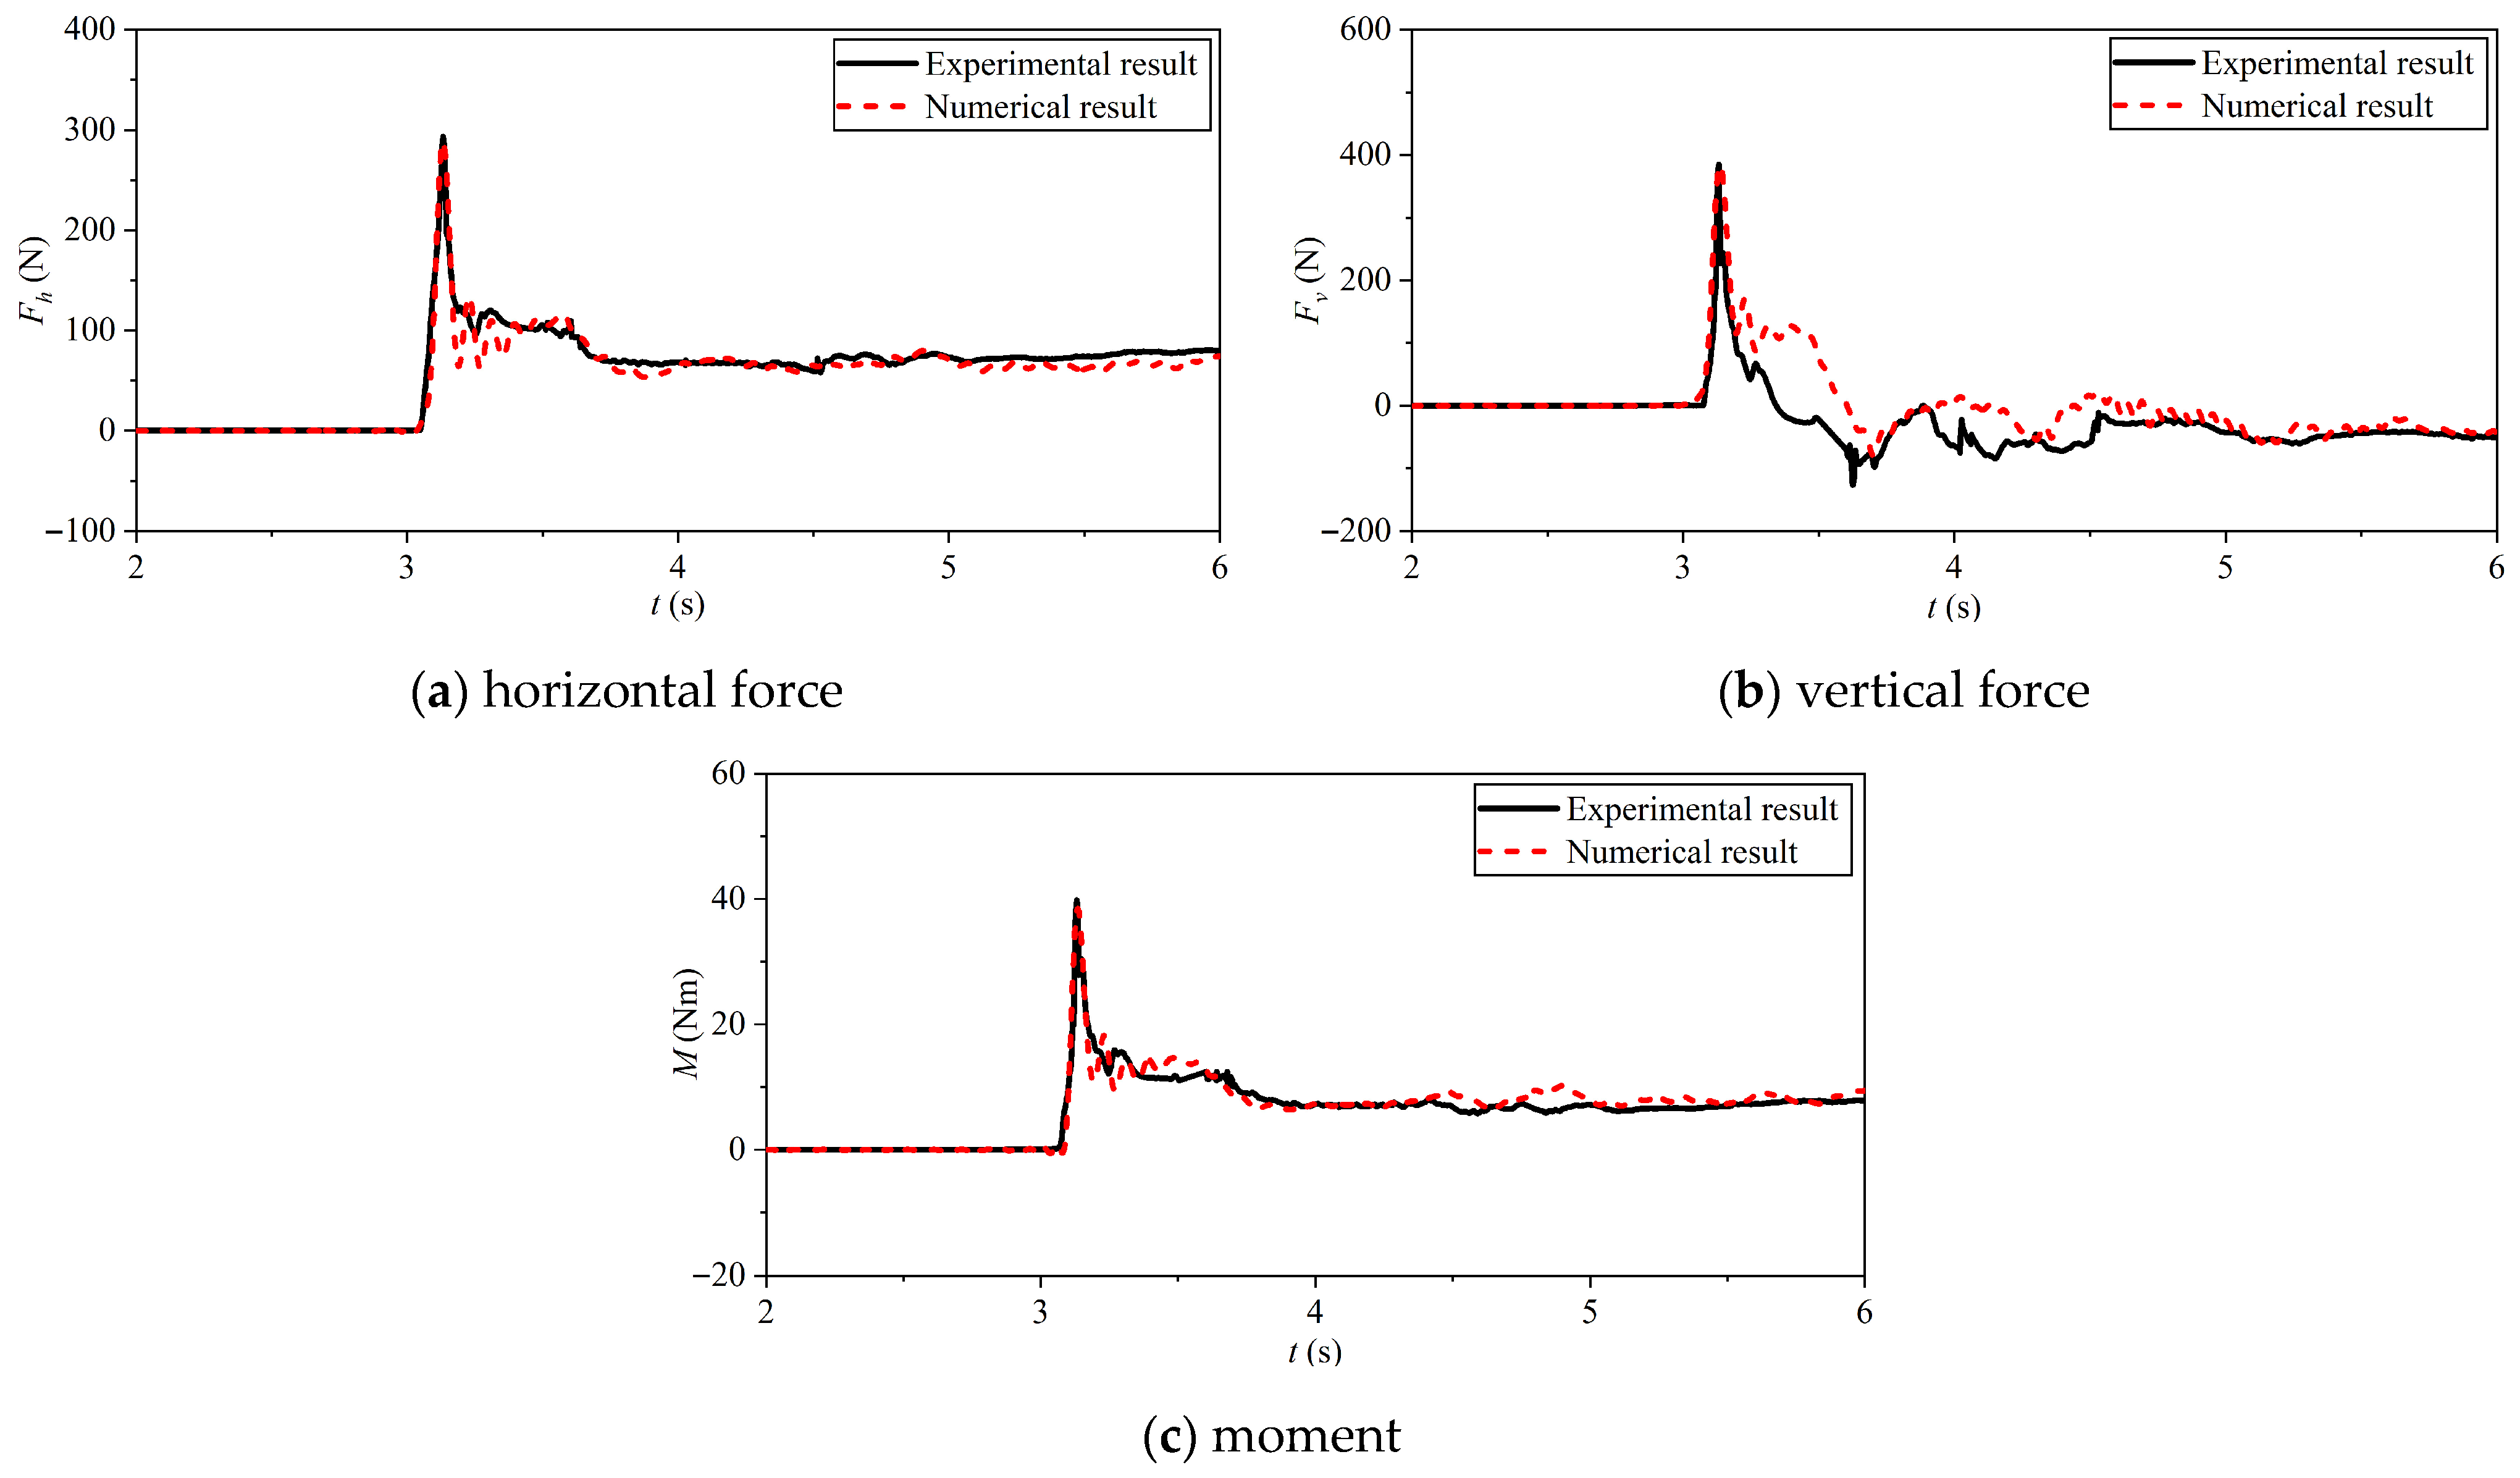
Figure 5 demonstrates that the wave front profile keeps stable with high accuracy when propagating downstream. Thirdly, for the wave force–time histories on the twin-track high-speed railway box girder, the numerical results are compared with the experimental results (per unit length), as shown in
Figure 6. The results indicate that both the numerical peak force and the force in the quasi-steady stage agree very well with that of the experimental results, with the related errors of the horizontal peak force, vertical peak force, and peak moment merely 1.57%, 0.23%, and 4.08%, respectively. Small discrepancies were observed during the fluctuation stage, e.g., the vertical force in
Figure 6b can be attributed to the fact that: (1) small gaps between the girder model and the flume sidewalls in the experiment are not represented in the 2D numerical model; and (2) the flow field in this stage undergoes intense variations with a high level of wave breaking and strong turbulence intensity, exhibiting pronounced three-dimensional characteristics that cannot be adequately captured by the 2D model of this study.
From the verification above, it is evident that despite appropriate caution in refined three-dimensional flow field characteristics, the 2D numerical model of this study is highly reliable and can accurately reproduce both the wave front characteristics (i.e., wave front celerity and wave front profile) and the forces on the girder (i.e., peak force and the force in the quasi-steady stage). Therefore, the numerical models of this study can be confidently adopted in the following sections.
3. Characteristics of Interaction Process
To reveal how the wave front profile governs the interaction with a single-track high-speed railway box girder, two representative waves with the same wave heights are compared: an unbroken fifth-order solitary wave (named W-I, with a wave height of
a = 16.50 cm and water depth of
d = 44.00 cm) and a broken dam-break wave (named W-II, with initial downstream and upstream water depths of
h0 = 12.00 cm and
h1 = 55.47 cm, featuring a converged wave height upstream of the wave front of
h2 −
h0 = 16.99 cm), which are presented in
Figure 7a and
Figure 7b, respectively. The numerical models in
Figure 2a,b are adopted, and a series of simulation cases are carried out in this section, as plotted in
Table 4, in which the girder clearance
Z varies from −10.00 cm to 14.00 cm in increments of 2.00 cm. The numerical results under
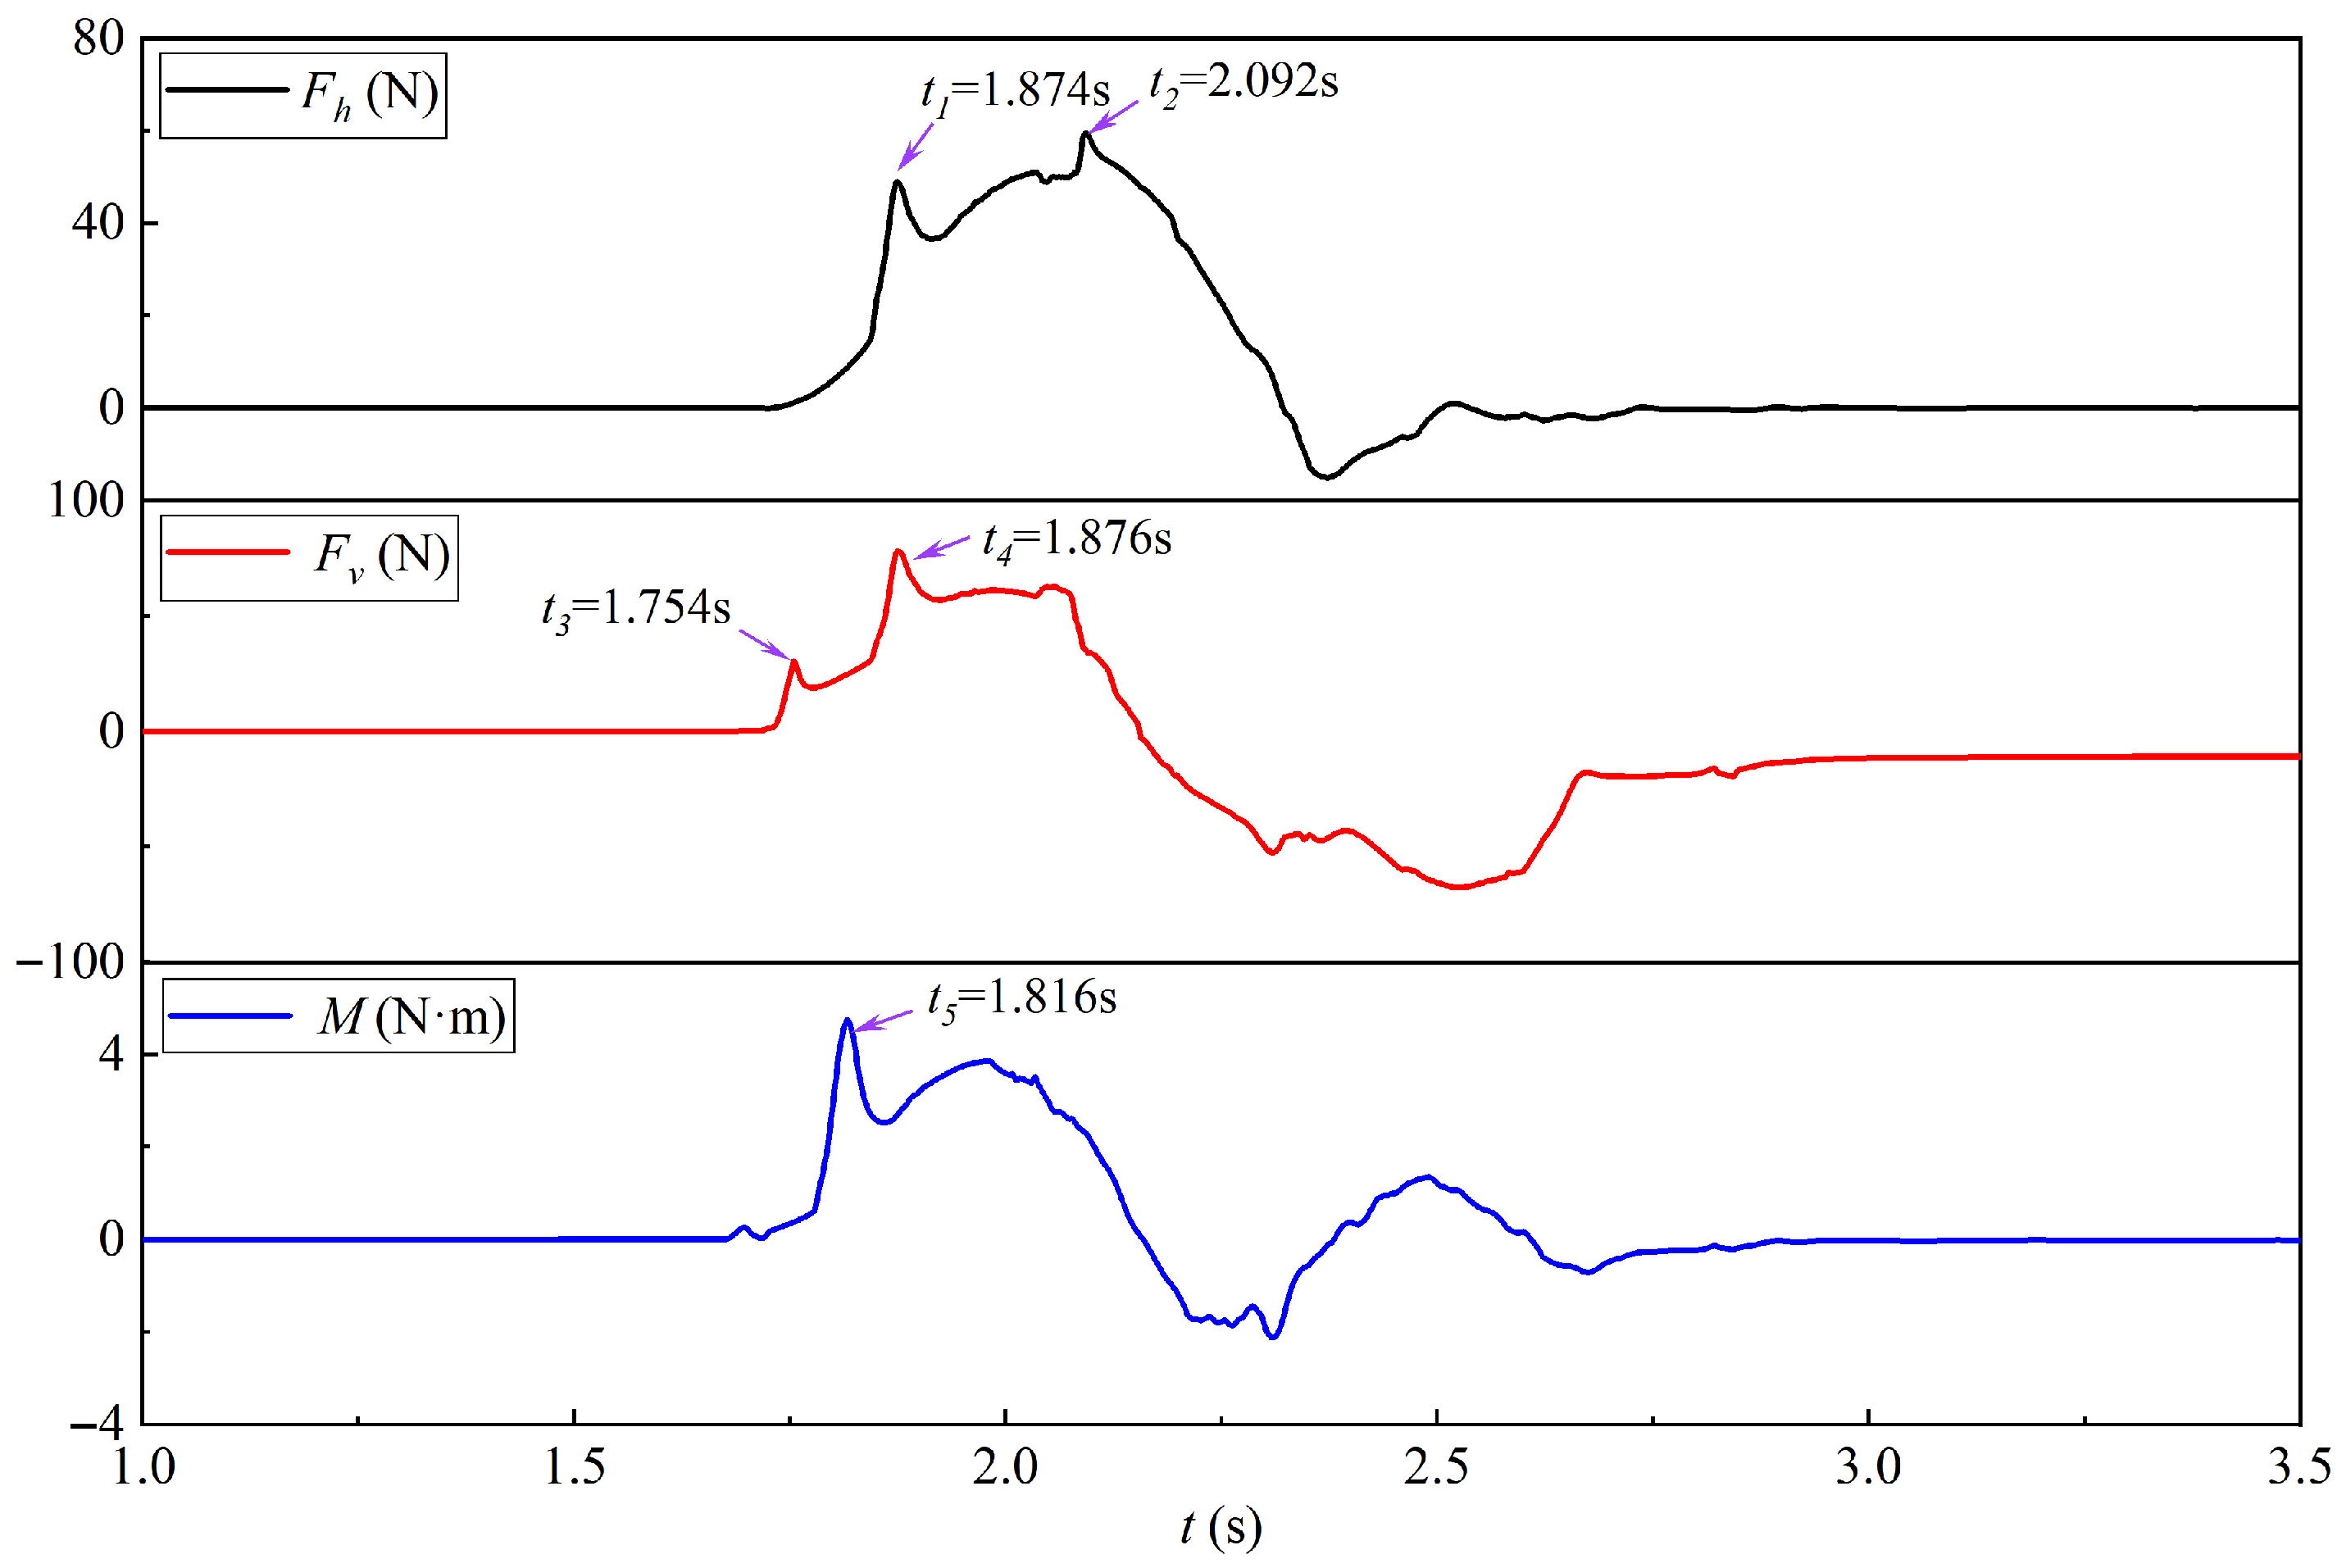
Z = 6.00 cm are chosen here as a representative, and the time histories of the horizontal force
Fh (downstream), vertical force
Fv (upward) and moment
M (clockwise, reference to the girder bottom center) are plotted in
Figure 8 and
Figure 9 for W-I and W-II, respectively.
Figure 10.
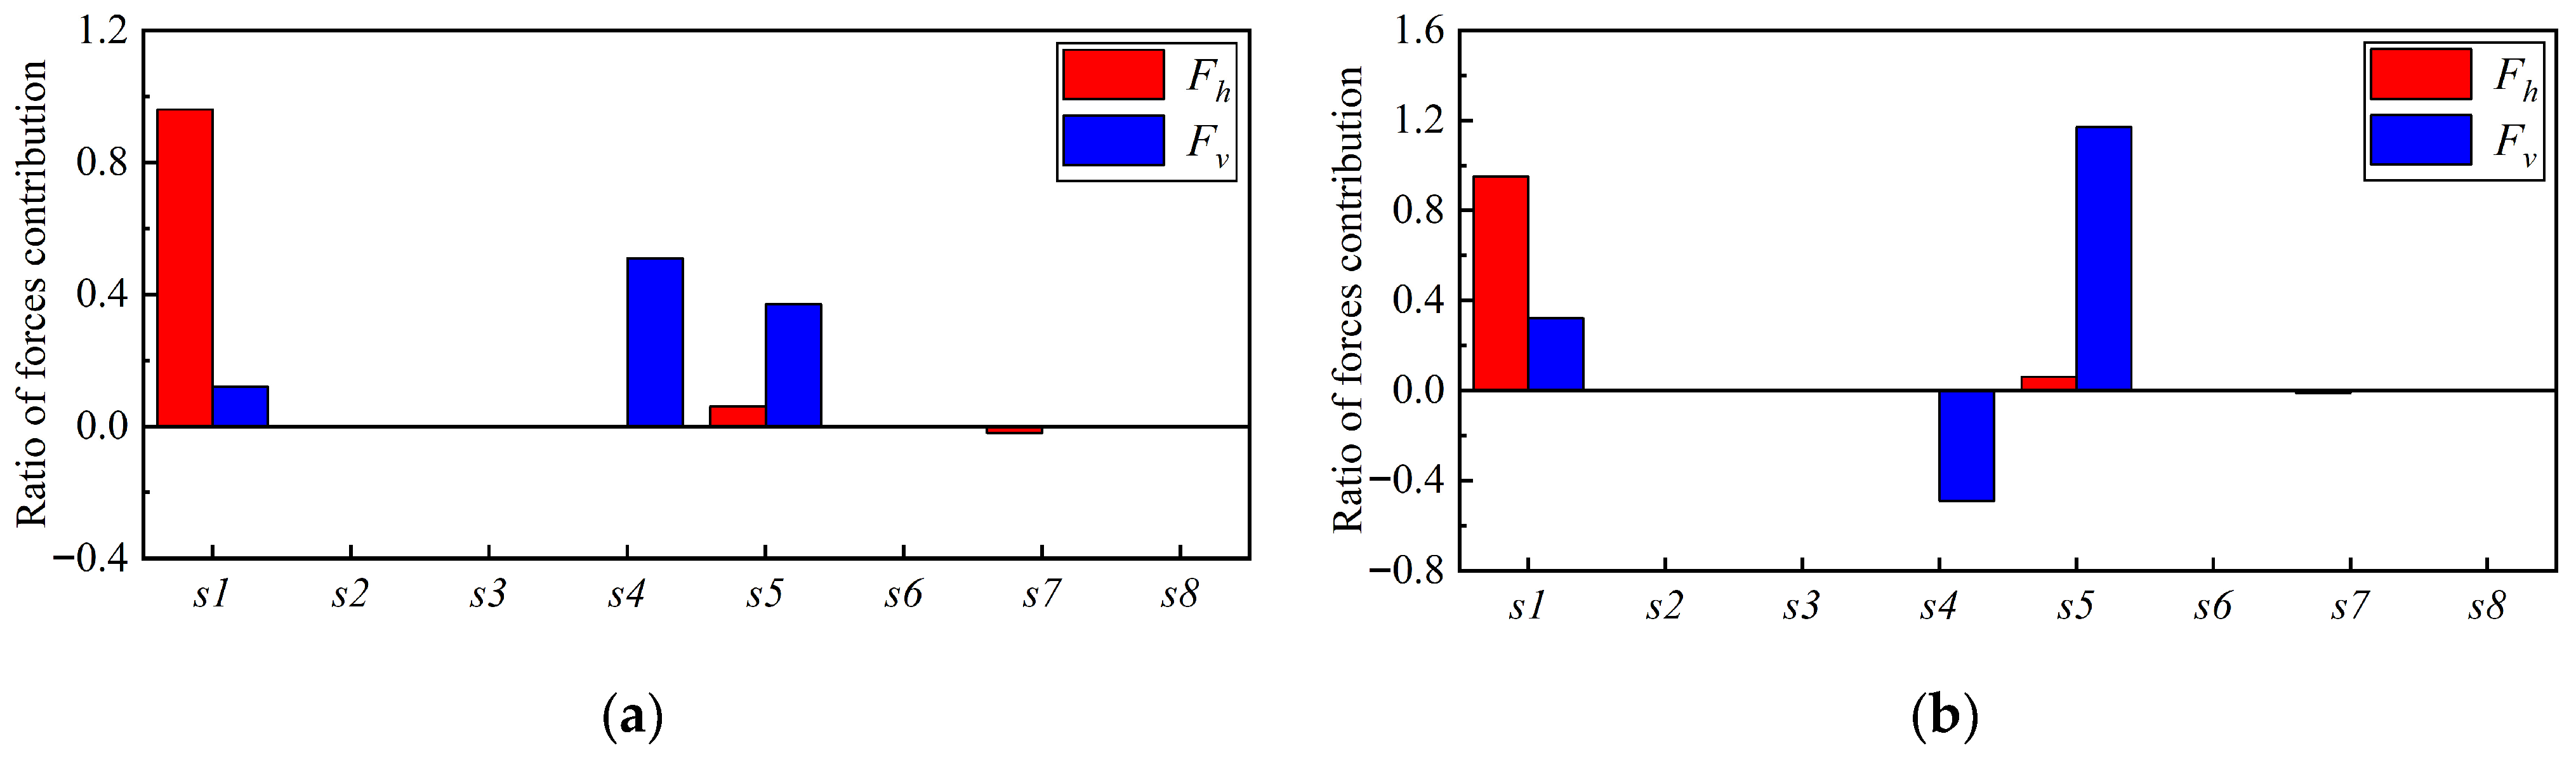
Contribution rate of each girder face to the maximum force for W-I (a) and W-II (b).
Figure 10.
Contribution rate of each girder face to the maximum force for W-I (a) and W-II (b).
3.1. Unbroken Tsunami Wave
For the unbroken tsunami wave W-I, the interaction process is progressive and staged. Owing to the smooth crest and gentle front slope, the water surface rises continuously along the front side of the girder, and the interaction evolves from initial bottom contact to climbing flow and then to overtopping. As a result, the vertical and horizontal forces do not reach their maxima simultaneously, as compared in
Figure 8. The vertical force responds first, because it is highly sensitive to the upward pressure generated when the rising water contacts the girder bottom and then impacts the bottom of the upstream cantilever (
Figure 11a,b). By contrast, the horizontal force develops more gradually and reaches its maximum only after the raised-up water strikes and overtops the front cantilever, when the frontal pressure on the girder becomes most pronounced (
Figure 11c,d). In this process, the maximum horizontal force is mainly governed by the pressure acting on the upstream inclined web face, whereas the maximum vertical force is jointly governed by the pressure on the girder bottom and on the beveled face beneath the upstream cantilever, as indicated by
Figure 10a.
After the crest passes, the interaction gradually weakens. The overtopping water falls onto the girder top and then drains downstream, while the flow that passed the girder bottom rises up at the rear side of the girder. Consequently, both the horizontal and vertical forces decrease rapidly. The horizontal force approaches zero as the pressure difference between the front side and back side vanishes, whereas the vertical force remains slightly negative because part of the overtopping water is retained on the girder top by the track system and other ancillary components (
Figure 12). The moment follows the same general evolution: it reaches its maximum slightly earlier than the maximum horizontal and vertical forces, because the bottom pressure in the early stage is strongly asymmetric, and then decays toward zero as the pressure distribution becomes more balanced.
Therefore, under the unbroken tsunami wave, the interaction is characterized by a staged and temporally asynchronous process, which is governed by the gradual rise of the free surface and the subsequent development of overtopping. This behavior differs significantly from that of T-girders [
38,
39], mainly because the present girder has a markedly different geometry with a broad box chamber and large cantilevers.
3.2. Broken Tsunami Wave
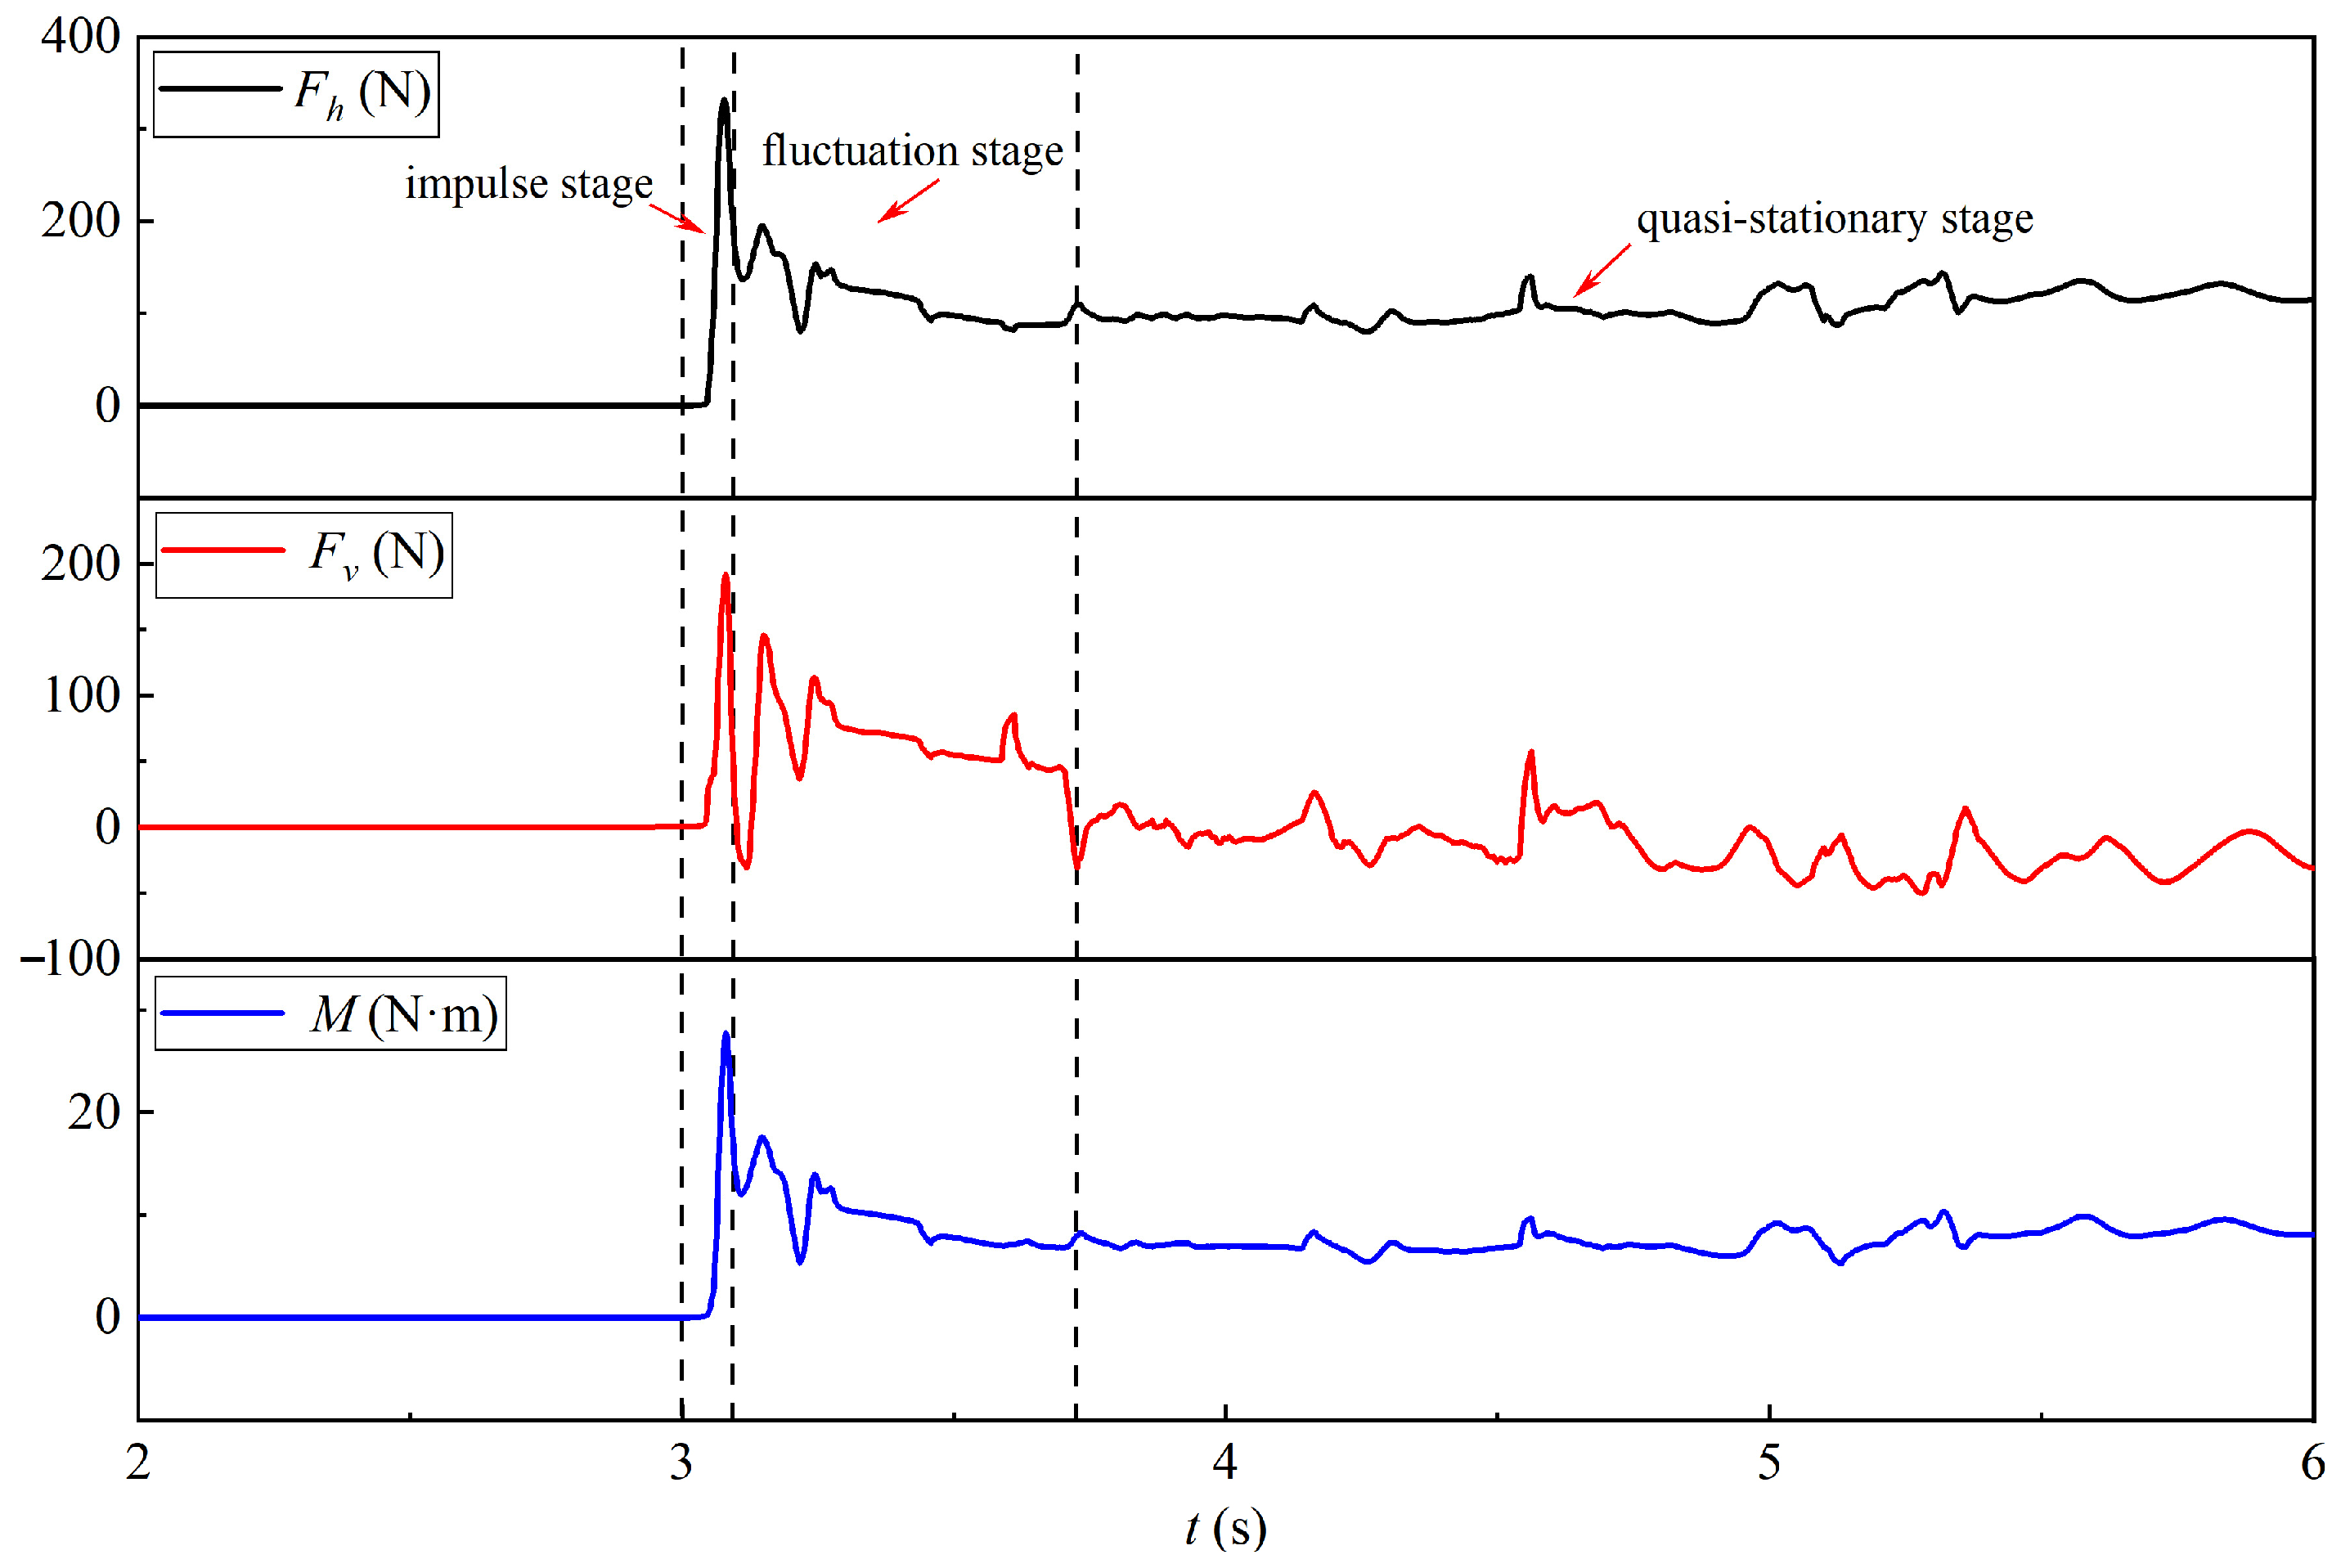
For the broken tsunami wave W-II, the interaction process differs fundamentally from that under W-I. Because the broken wave front is steep, fast, and highly turbulent, the interaction is dominated by impact rather than by gradual accumulation. The overall force response can be divided into three stages, the impulse, fluctuation, and quasi-stationary stages, as shown in
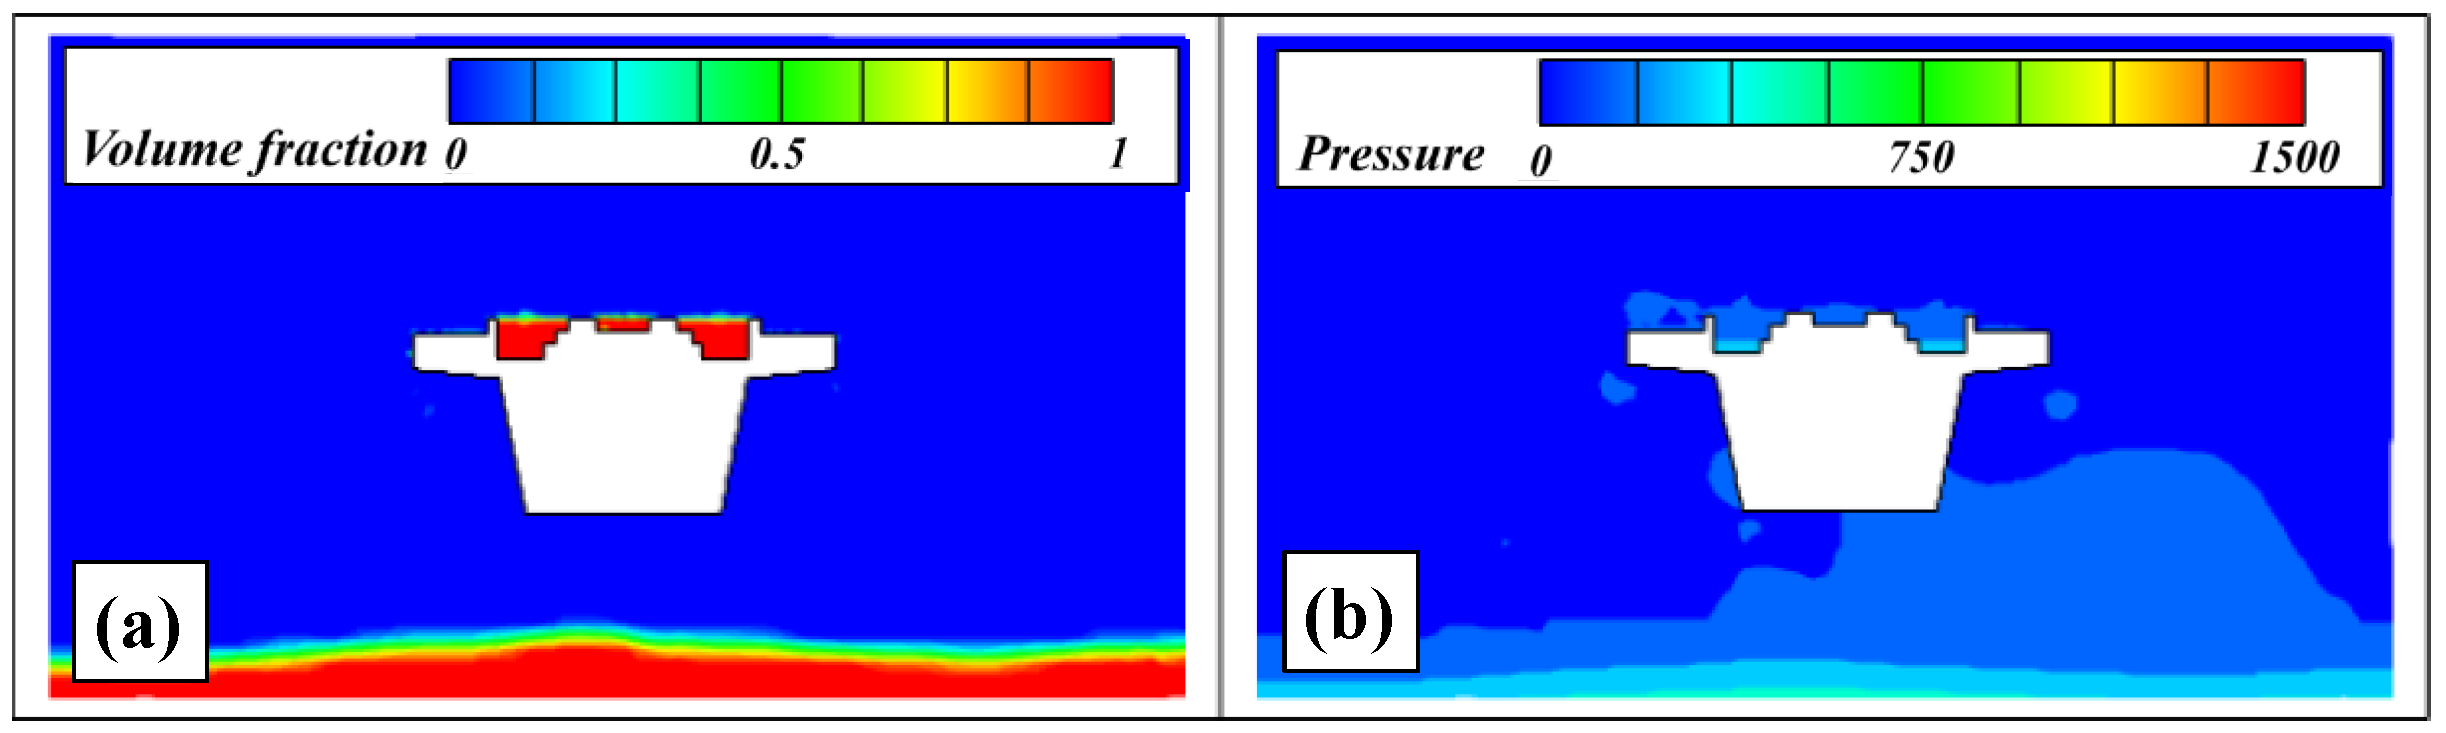
Figure 9. In the impulse stage, the high-velocity wave front directly strikes the upstream inclined web face and then the bottom of the upstream cantilever. This direct impact causes the horizontal and vertical forces to attain their maximum almost simultaneously. Similar to W-I, the horizontal force is still mainly governed by the upstream inclined web face; however, the vertical force is dominated much more strongly by the beveled face beneath the upstream cantilever, rather than by the girder bottom. In addition, local suction may develop beneath the girder bottom because the high-speed separated flow and entrapped air reduce the pressure in the recirculation zone, which explains the temporary negative pressure beneath the chamber shown in
Figure 10b and
Figure 13a,b.
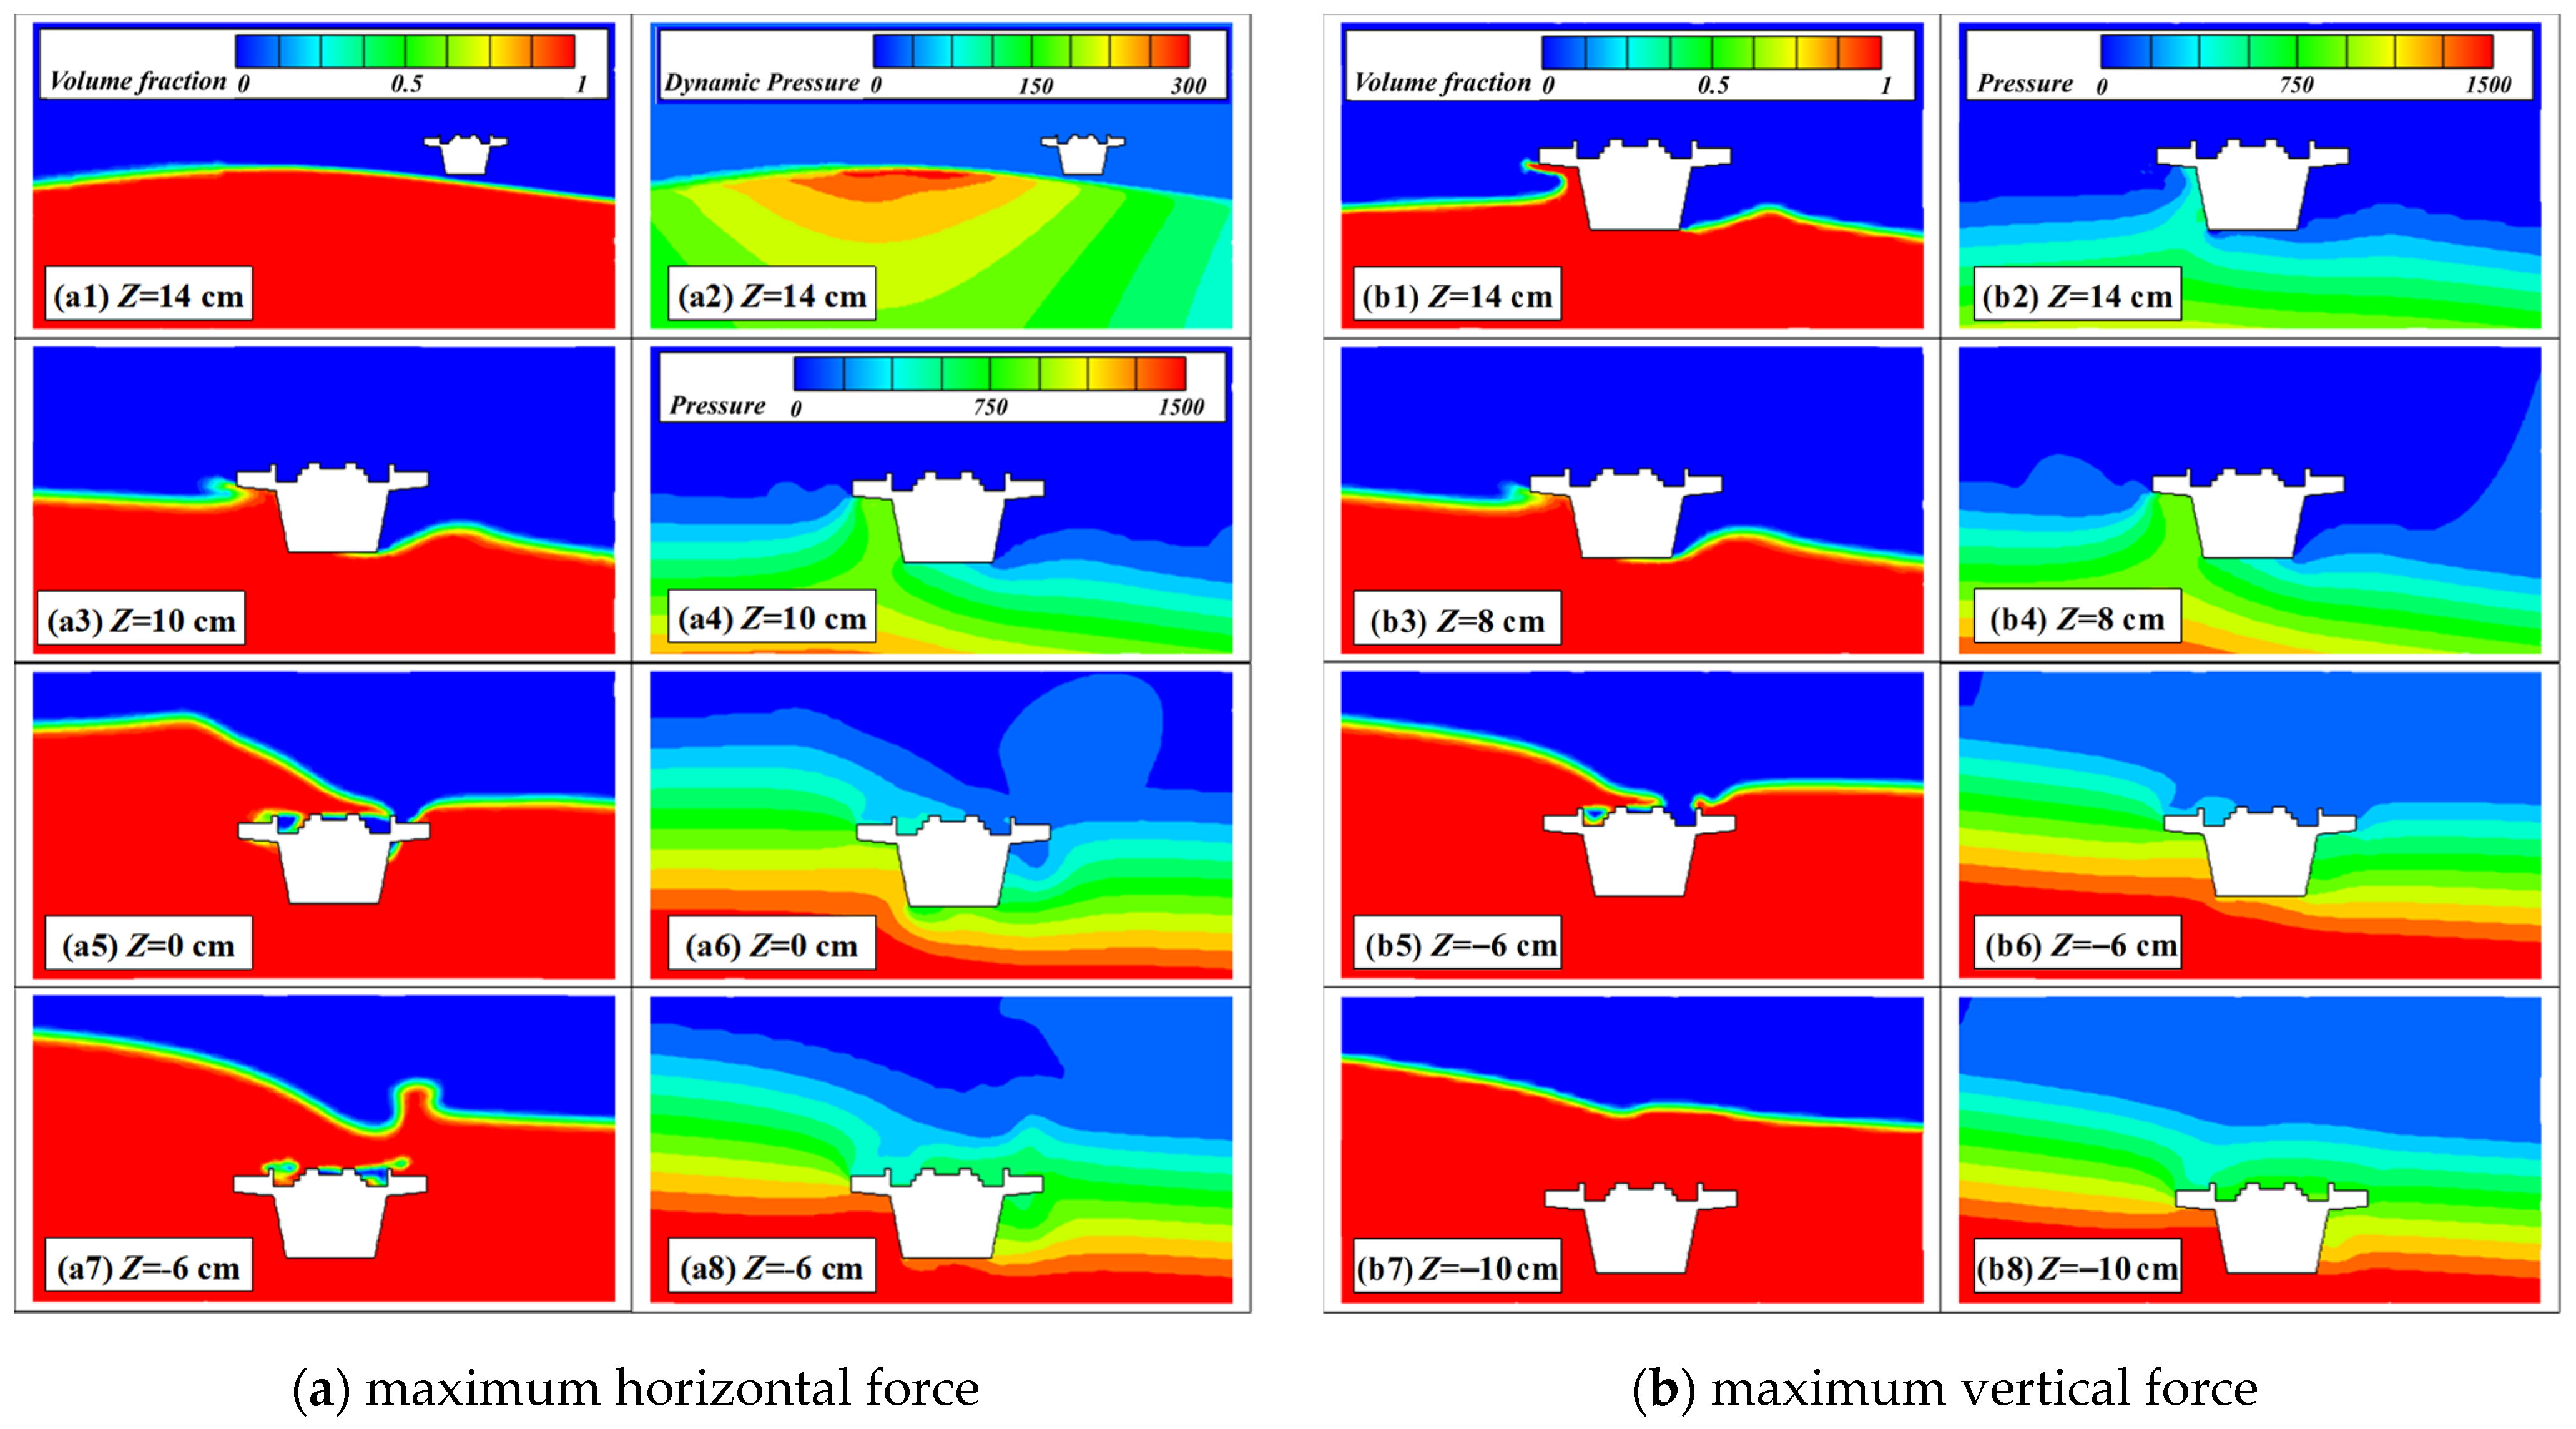
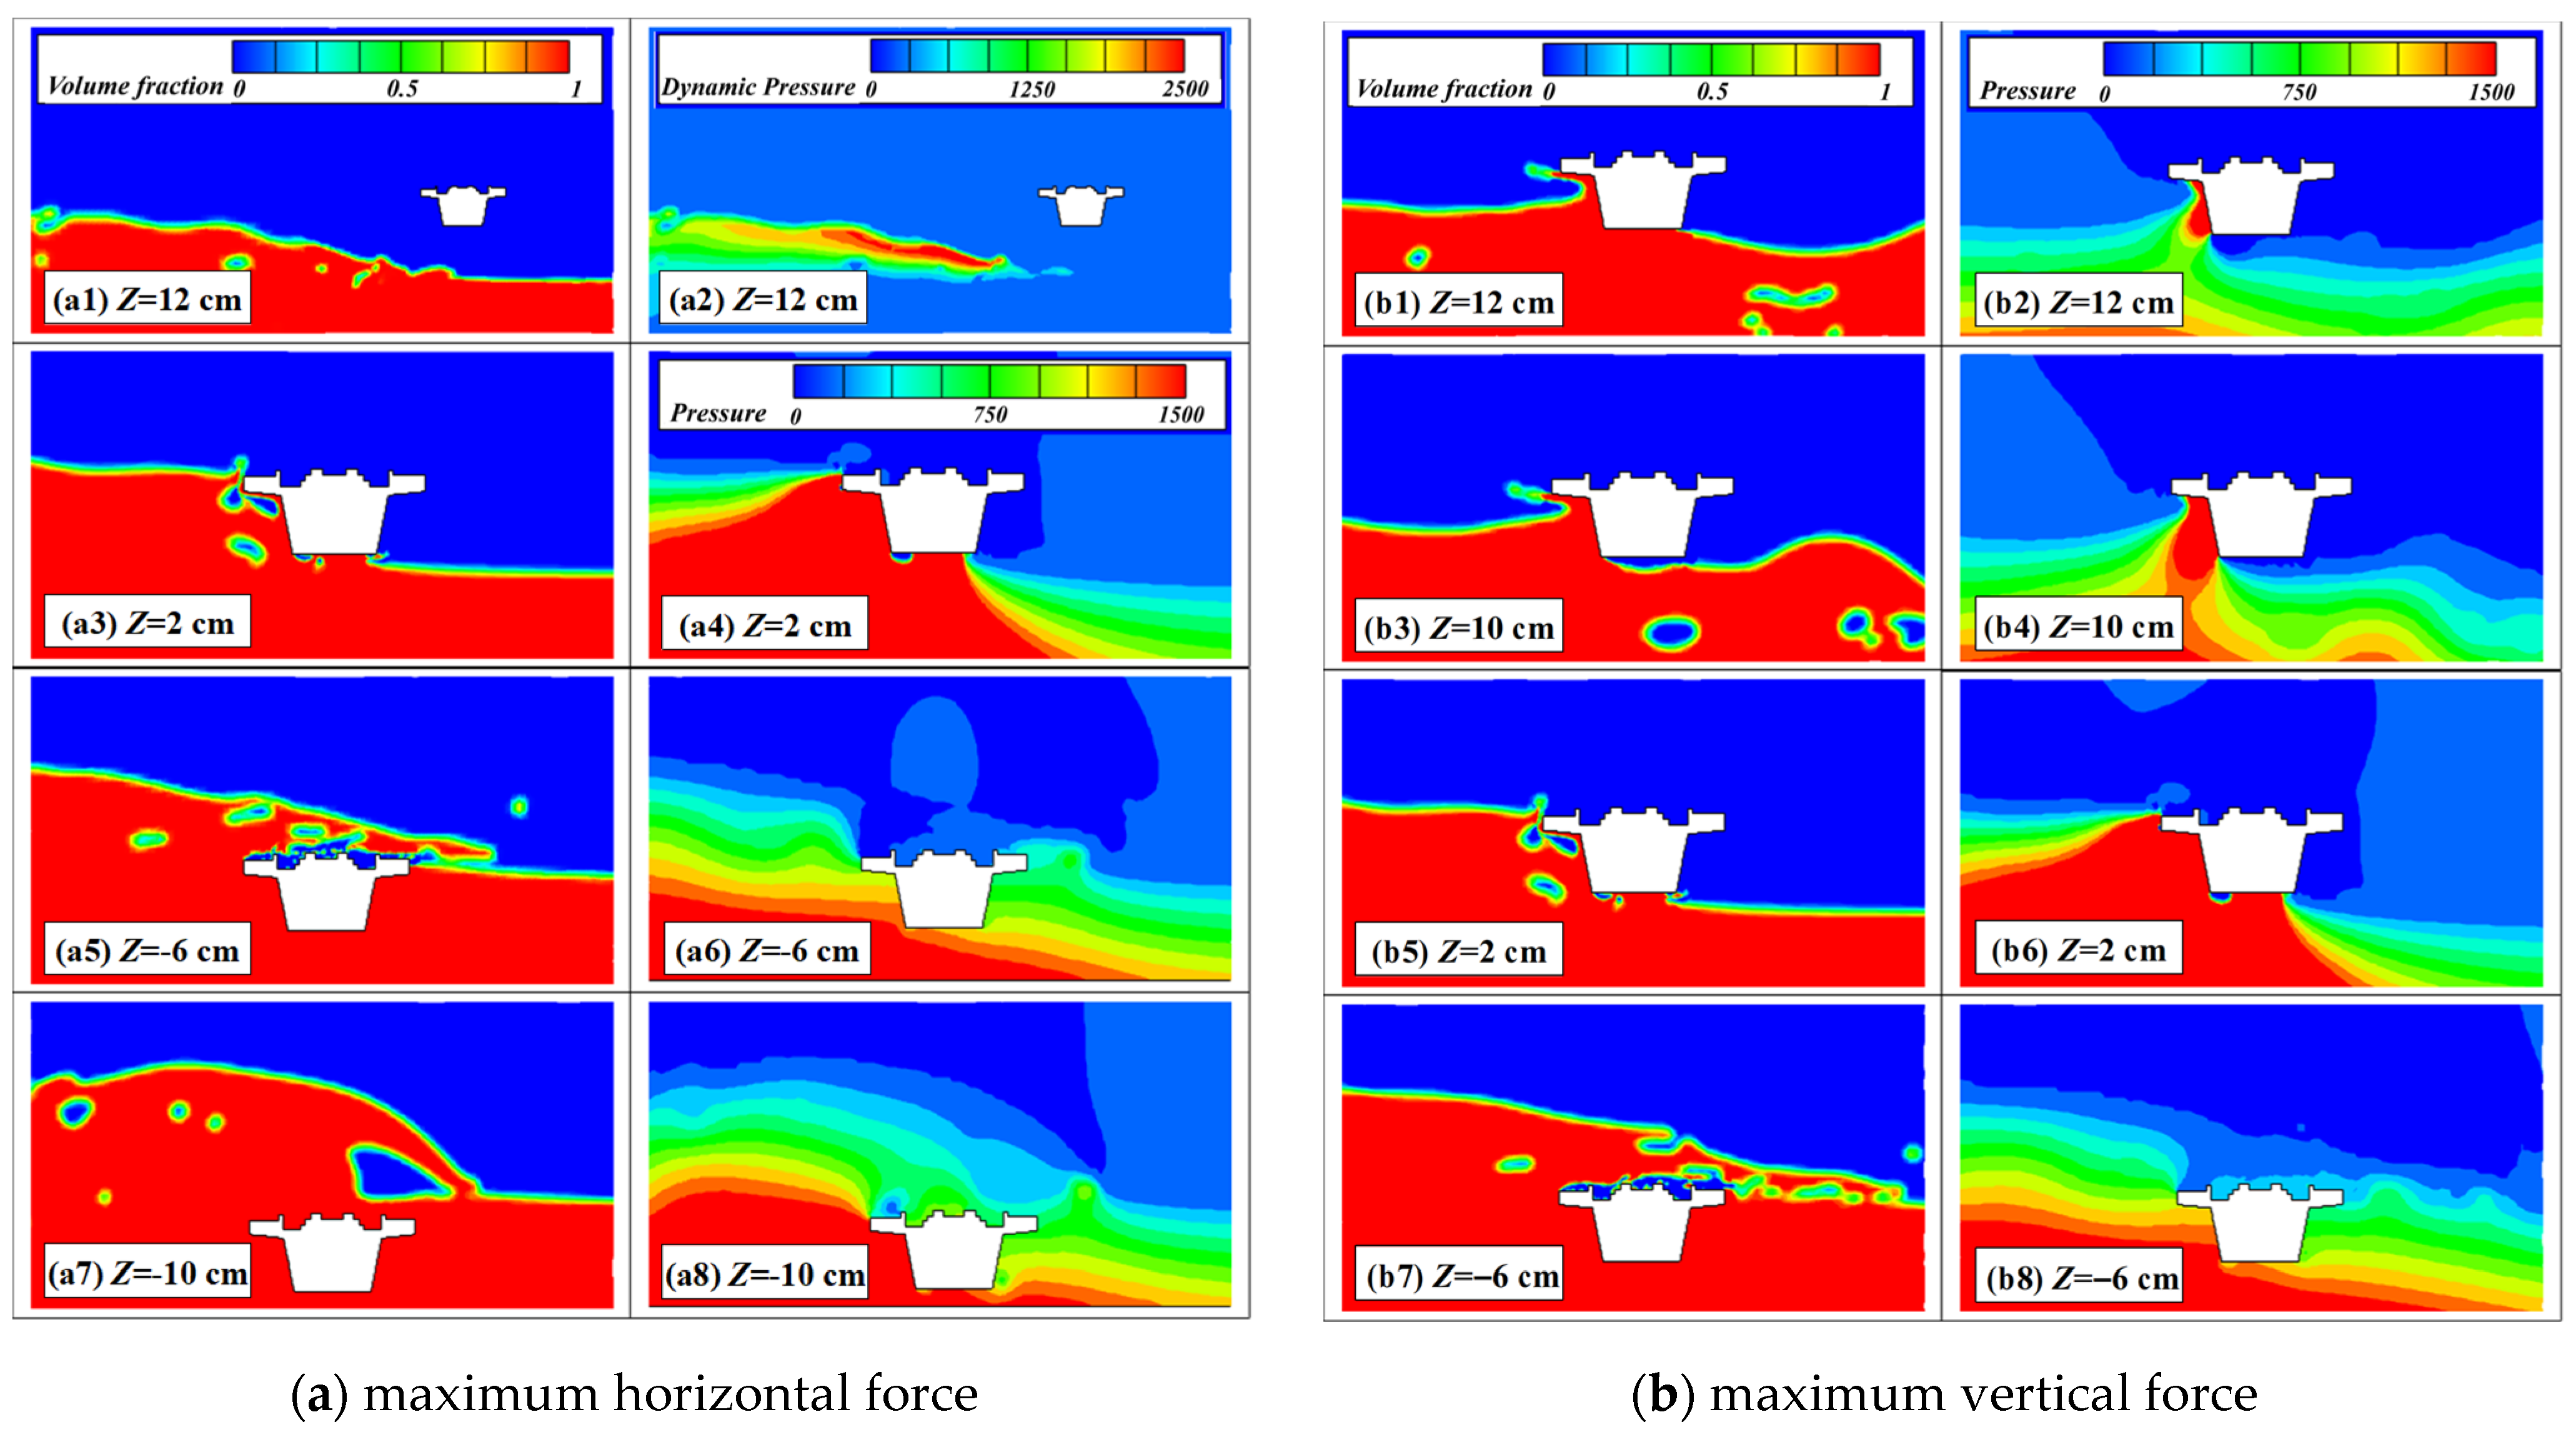
After the initial impact, the response enters a fluctuation stage with much stronger temporal variability than that under W-I. The rapid rise of the water tongue in front of the girder causes a sharp reduction in frontal pressure, and both horizontal and vertical forces drop quickly. As the air entrained beneath the girder dissipates and the suction effect weakens, the vertical force recovers temporarily because the beveled face beneath the upstream cantilever is again strongly acted on. Thereafter, the overtopping and surrounding flow continue to interact, producing pronounced oscillations in both the free surface and the pressure field, and hence in the force–time histories. In the subsequent quasi-stationary stage, the girder becomes deeply submerged in a high-velocity flow. Continuous overflow across the girder top and the sustained difference in water depth between the front and rear sides maintain a considerable horizontal force, while the vertical force becomes relatively small because the downward pressure on the girder top slightly exceeds the upward pressure beneath the girder, as illustrated in
Figure 13c,d. The moment remains positive because the horizontal force contribution dominates the moment generated by the relatively small net downward vertical force.
In summary, broken tsunami waves produce an impact-dominated and strongly fluctuating response, whereas unbroken tsunami waves produce a staged and more gradual response. The essential difference is that the unbroken wave acts on the girder through continuous water surface rise, climbing flow, and overtopping development, while the broken wave acts on the girder through the direct impact of a steep, high-velocity turbulent front followed by fluctuating flow around the girder. Therefore, even for the same wave heights, the force generation mechanisms and the associated time history characteristics are fundamentally different for unbroken and broken tsunami waves. These differences should be carefully taken into account in the practical assessment and protection design of coastal railway box girders under tsunami wave action.
5. Lateral Displacement Effects on Girder Wave Forces
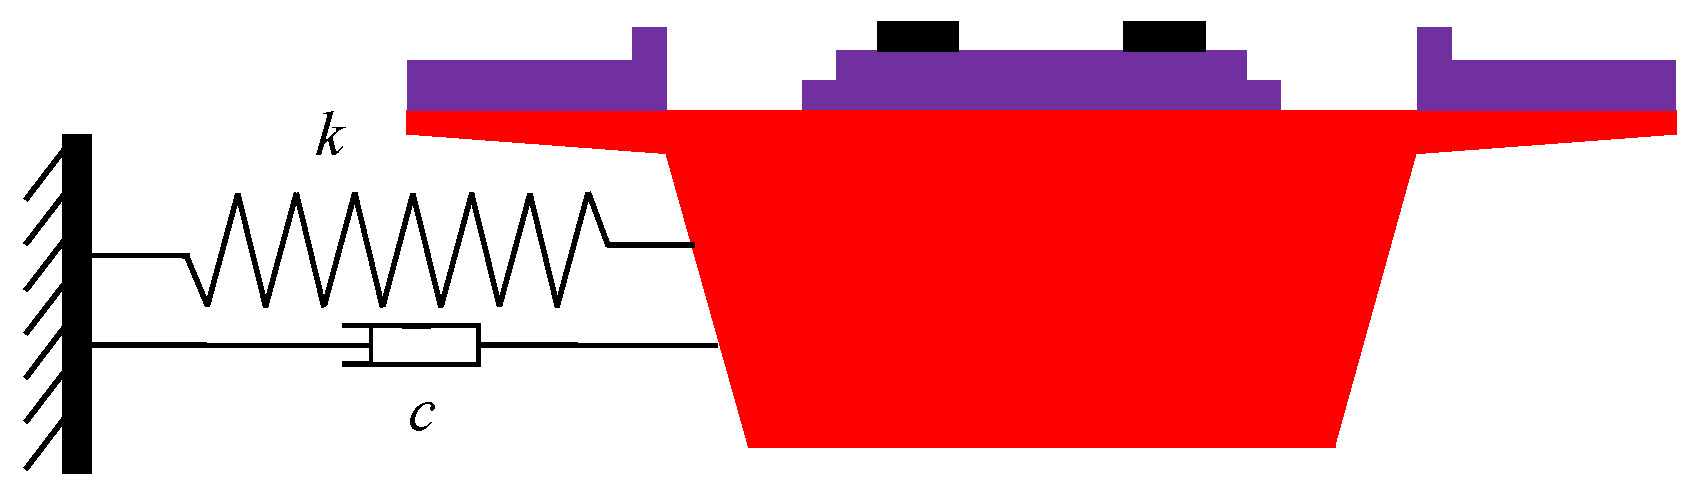
To investigate the effect mechanism of lateral displacement on the tsunami wave-induced forces acting on the single-track high-speed railway box girder, the mass–spring–damper system of Xu and Cai [
17], as illustrated in
Figure 18, is introduced into the numerical model of
Figure 2a,b to replace the fixed girder through the dynamic mesh updating technology, thereby establishing numerical models for the laterally movable girder. These models are employed to analyze the variation mechanism of wave forces under a range of lateral stiffnesses. According to the Introduction, the lateral stiffness comprises the stiffness of the substructure piers and that of the pile cap–girder connection. This connection stiffness varies with the bearing type and the presence of protective measures like shear keys, restraint cables, and shape memory alloys. The equation of the mass–spring–damper system is expressed as follows:
in which m = 8.83 kg/m is the mass per unit length of the girder;
,
, and
represent the horizontal displacement, speed and acceleration of the girder;
denotes the damping coefficient;
denotes the damping ratio and is taken as 0.0064 here;
represents the natural frequency;
is the vibration period;
denotes the lateral stiffness; and
represents the instantaneous horizontal wave force on the girder. A lateral stiffness k = 39,700 N/m, which is scaled (using Froude similarity criterion with the ratio 1:40) from the bearing lateral stiffness of an actual single-track high-speed railway box girder, is taken as the reference value here. A series of lateral stiffnesses, i.e., 0.1 k, 0.5 k, 1.0 k, 2.0 k, and 5.0 k, are set in this section, and the corresponding parameters are listed in
Table 5.
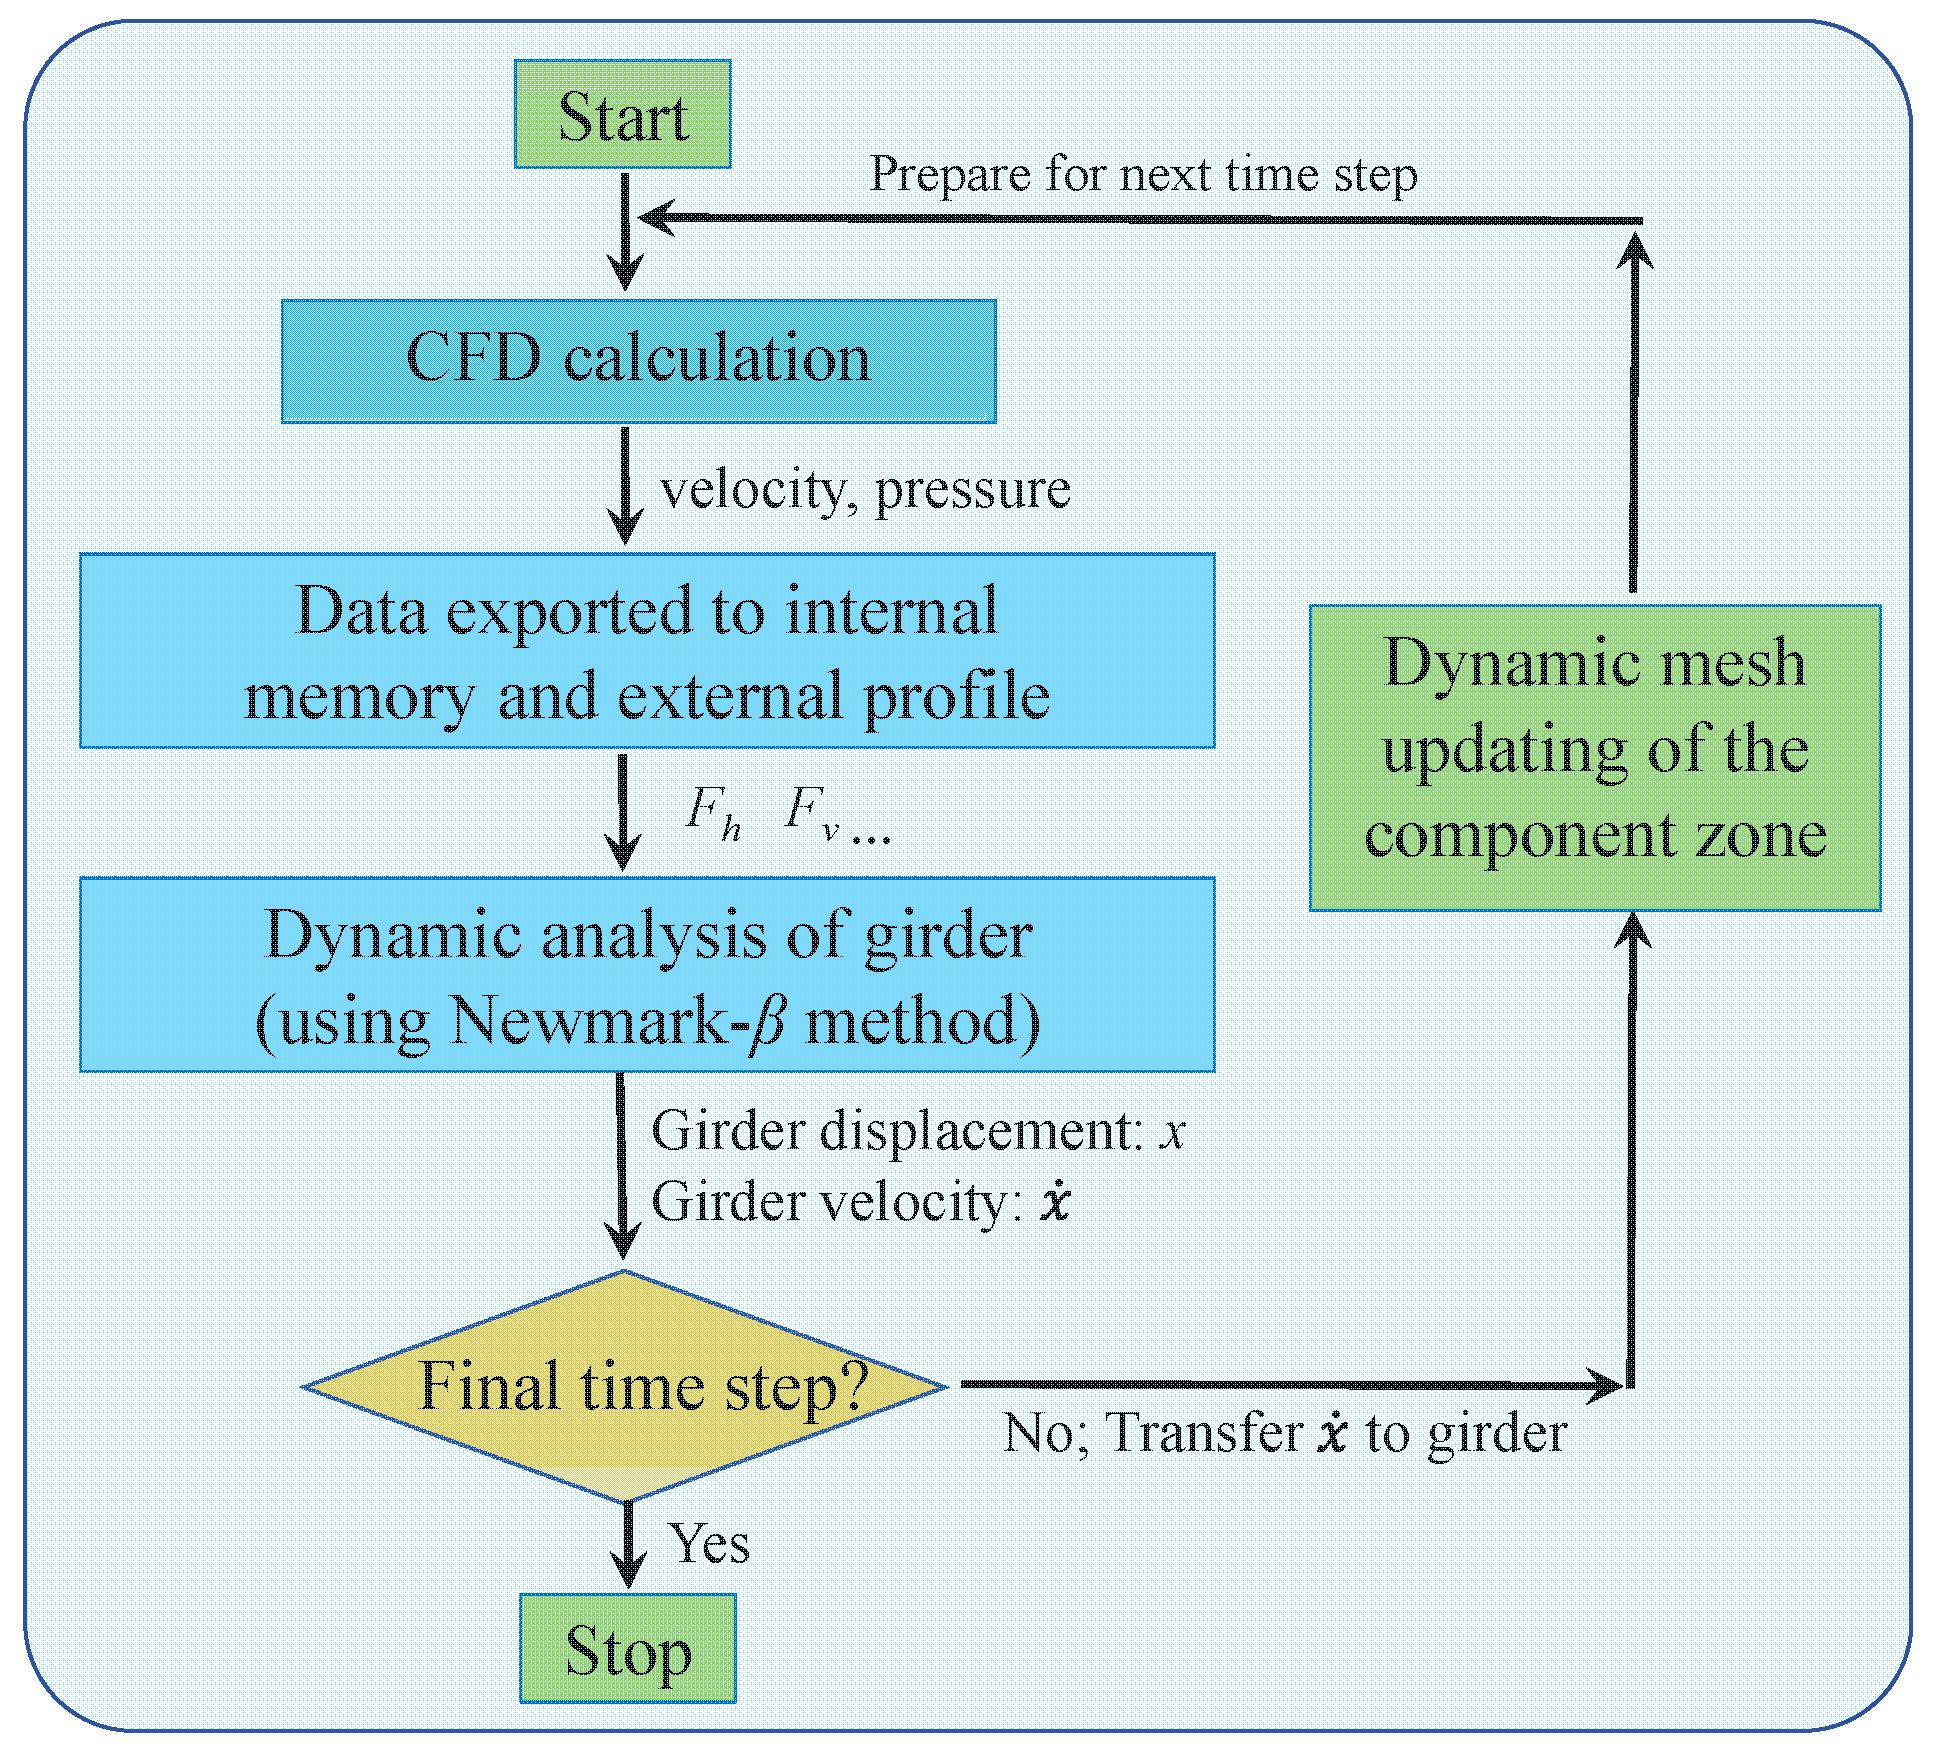
The dynamic mesh updating procedure adopted for the girder–wave simulation is presented in
Figure 19. For each time increment, the CFD solver first updates the velocity and pressure fields, and the resulting forces on the girder (horizontal and vertical forces, as well as the moment) are evaluated and stored, both internally and in output files. The computed horizontal force is then introduced into Equation (14), and the girder velocity is advanced using the Newmark-β method. The updated velocity is subsequently used to update the position of the rigid girder, after which the component mesh region is refreshed to accommodate the motion. The refreshed grid defines the computational domain for the next flow solution, and this cycle is repeated until the prescribed end time. The above coupling procedure is implemented in Fluent via user-defined functions (UDFs); further details can be found in Xu and Cai [
17].
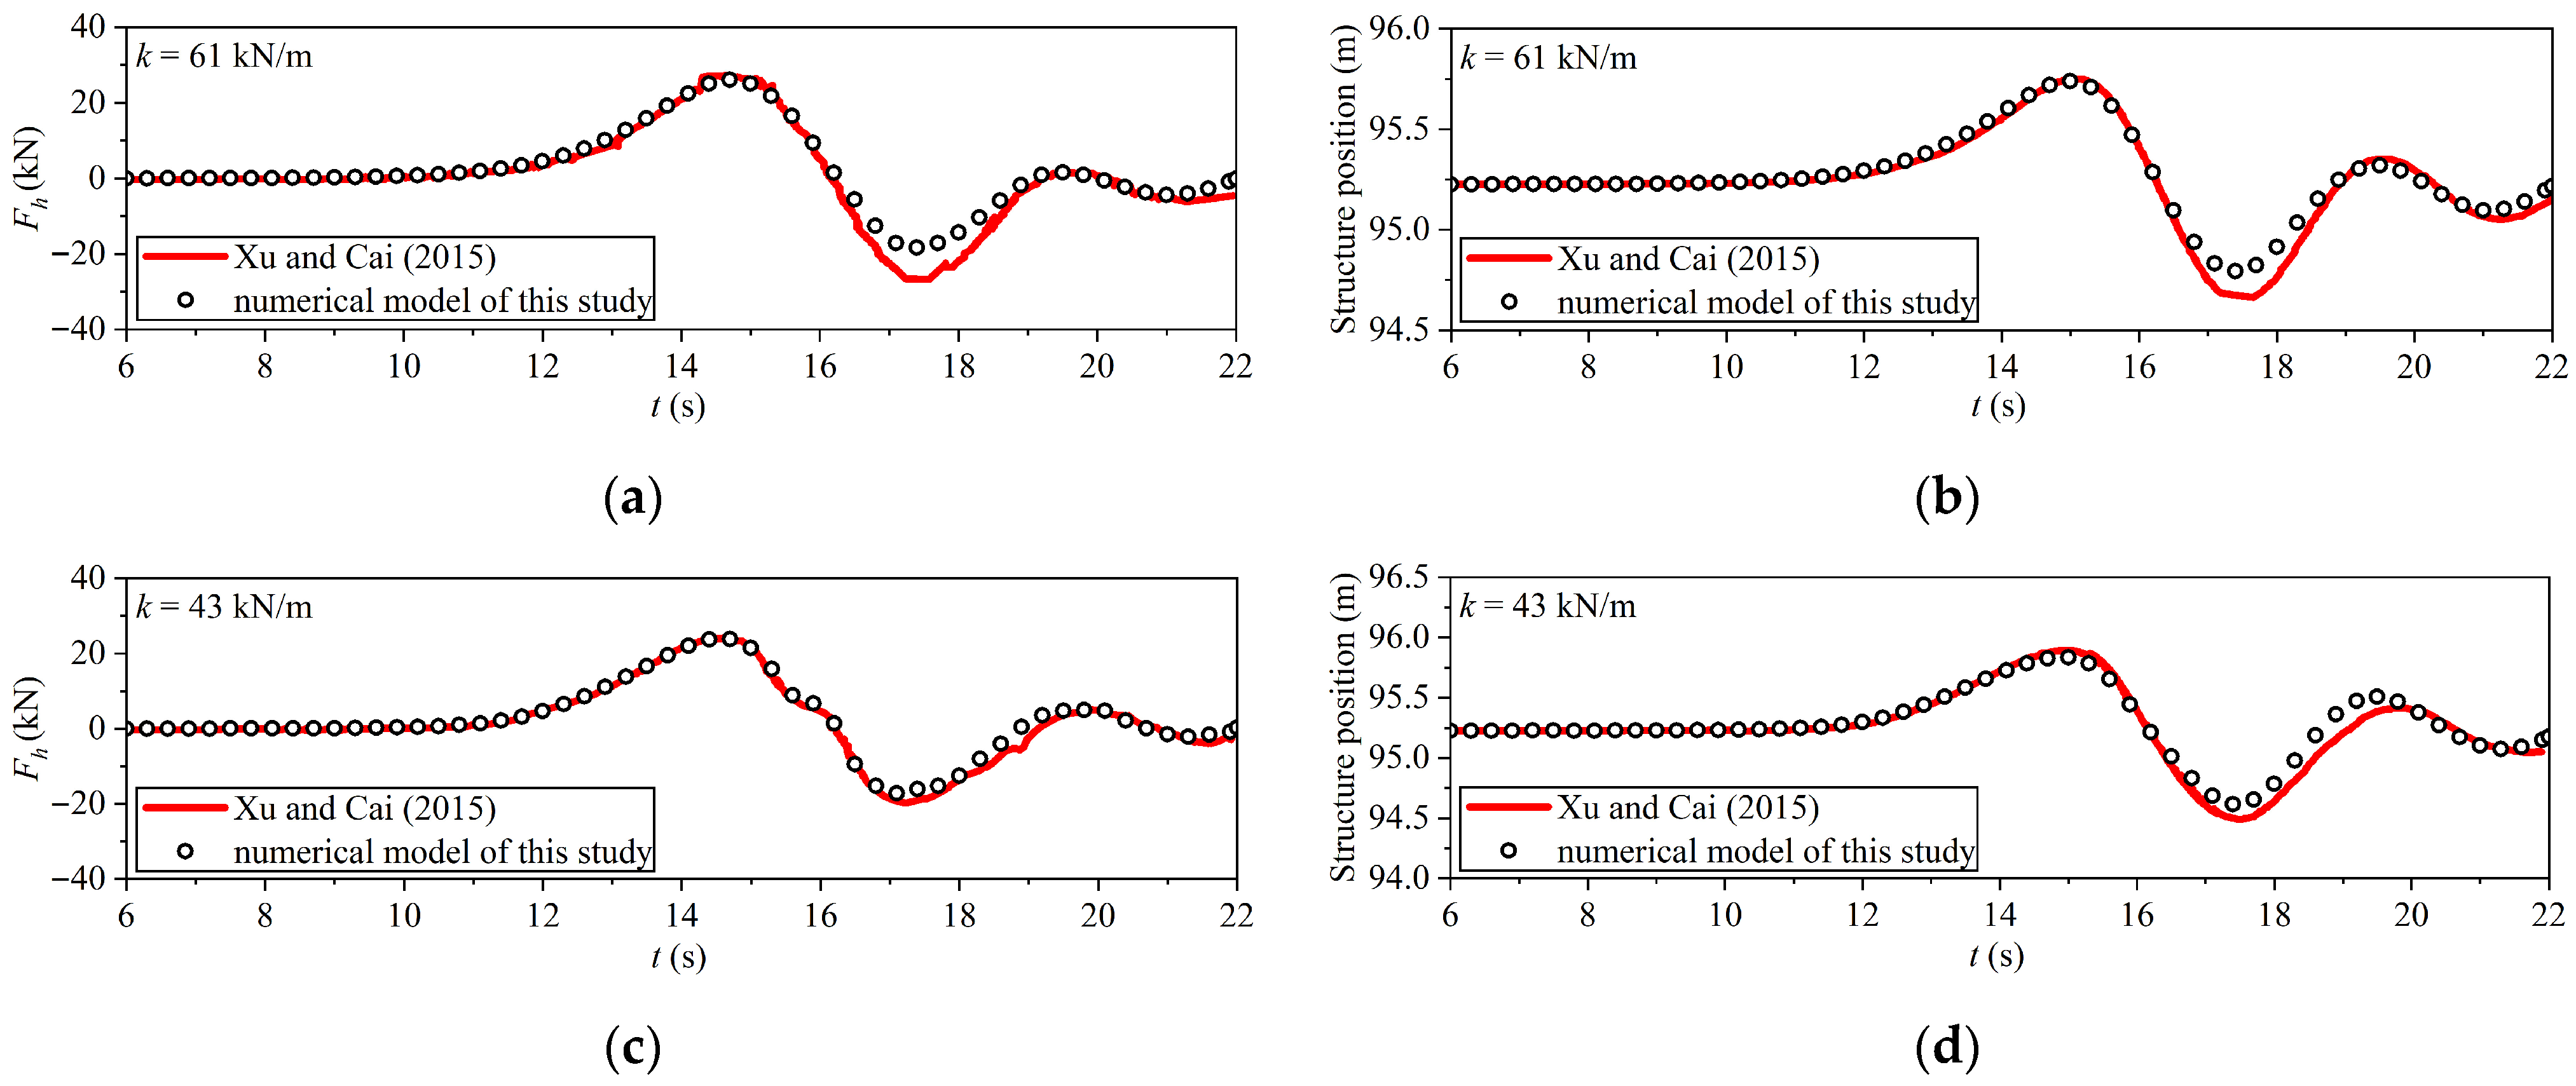
To verify the capability and the accuracy of the established numerical model, following the modeling approach of this study, two computational cases from Xu and Cai [
17] involving the interaction between a prototype T-girder and solitary waves are carried out and calculated. The corresponding numerical results are compared with that of Xu and Cai [
17] in
Figure 20, in which the water depth d is 7.20 m and the wave height a is 2.20 m. The girder clearance is 6.525 m for
Figure 20a,b and 5.175 m for
Figure 20c,d. The slight discrepancies observed in
Figure 20, i.e., the relative error of 2.24% for the positive peak force and 0.11% for the positive peak displacement in
Figure 20a,b, and the relative error of 2.92% for the positive peak force and 0.52% for the positive peak displacement in
Figure 20c,d, are mainly attributed to the different meshing strategies of this study (overset mesh method) and Xu and Cai [
17] (remeshing method). The comparison demonstrates that the numerical model of this study can accurately reproduce the time histories of the wave force and the lateral displacement, both for the variation characteristics and peak values, hence it can be confidently used in the following simulations.
In this section, the five distinct levels of lateral stiffness models under unbroken and broken tsunami waves (
Figure 7) are simulated with a girder clearance of 4.3 cm (as this region witnesses significant wave forces). Representative results are presented in
Figure 21 and
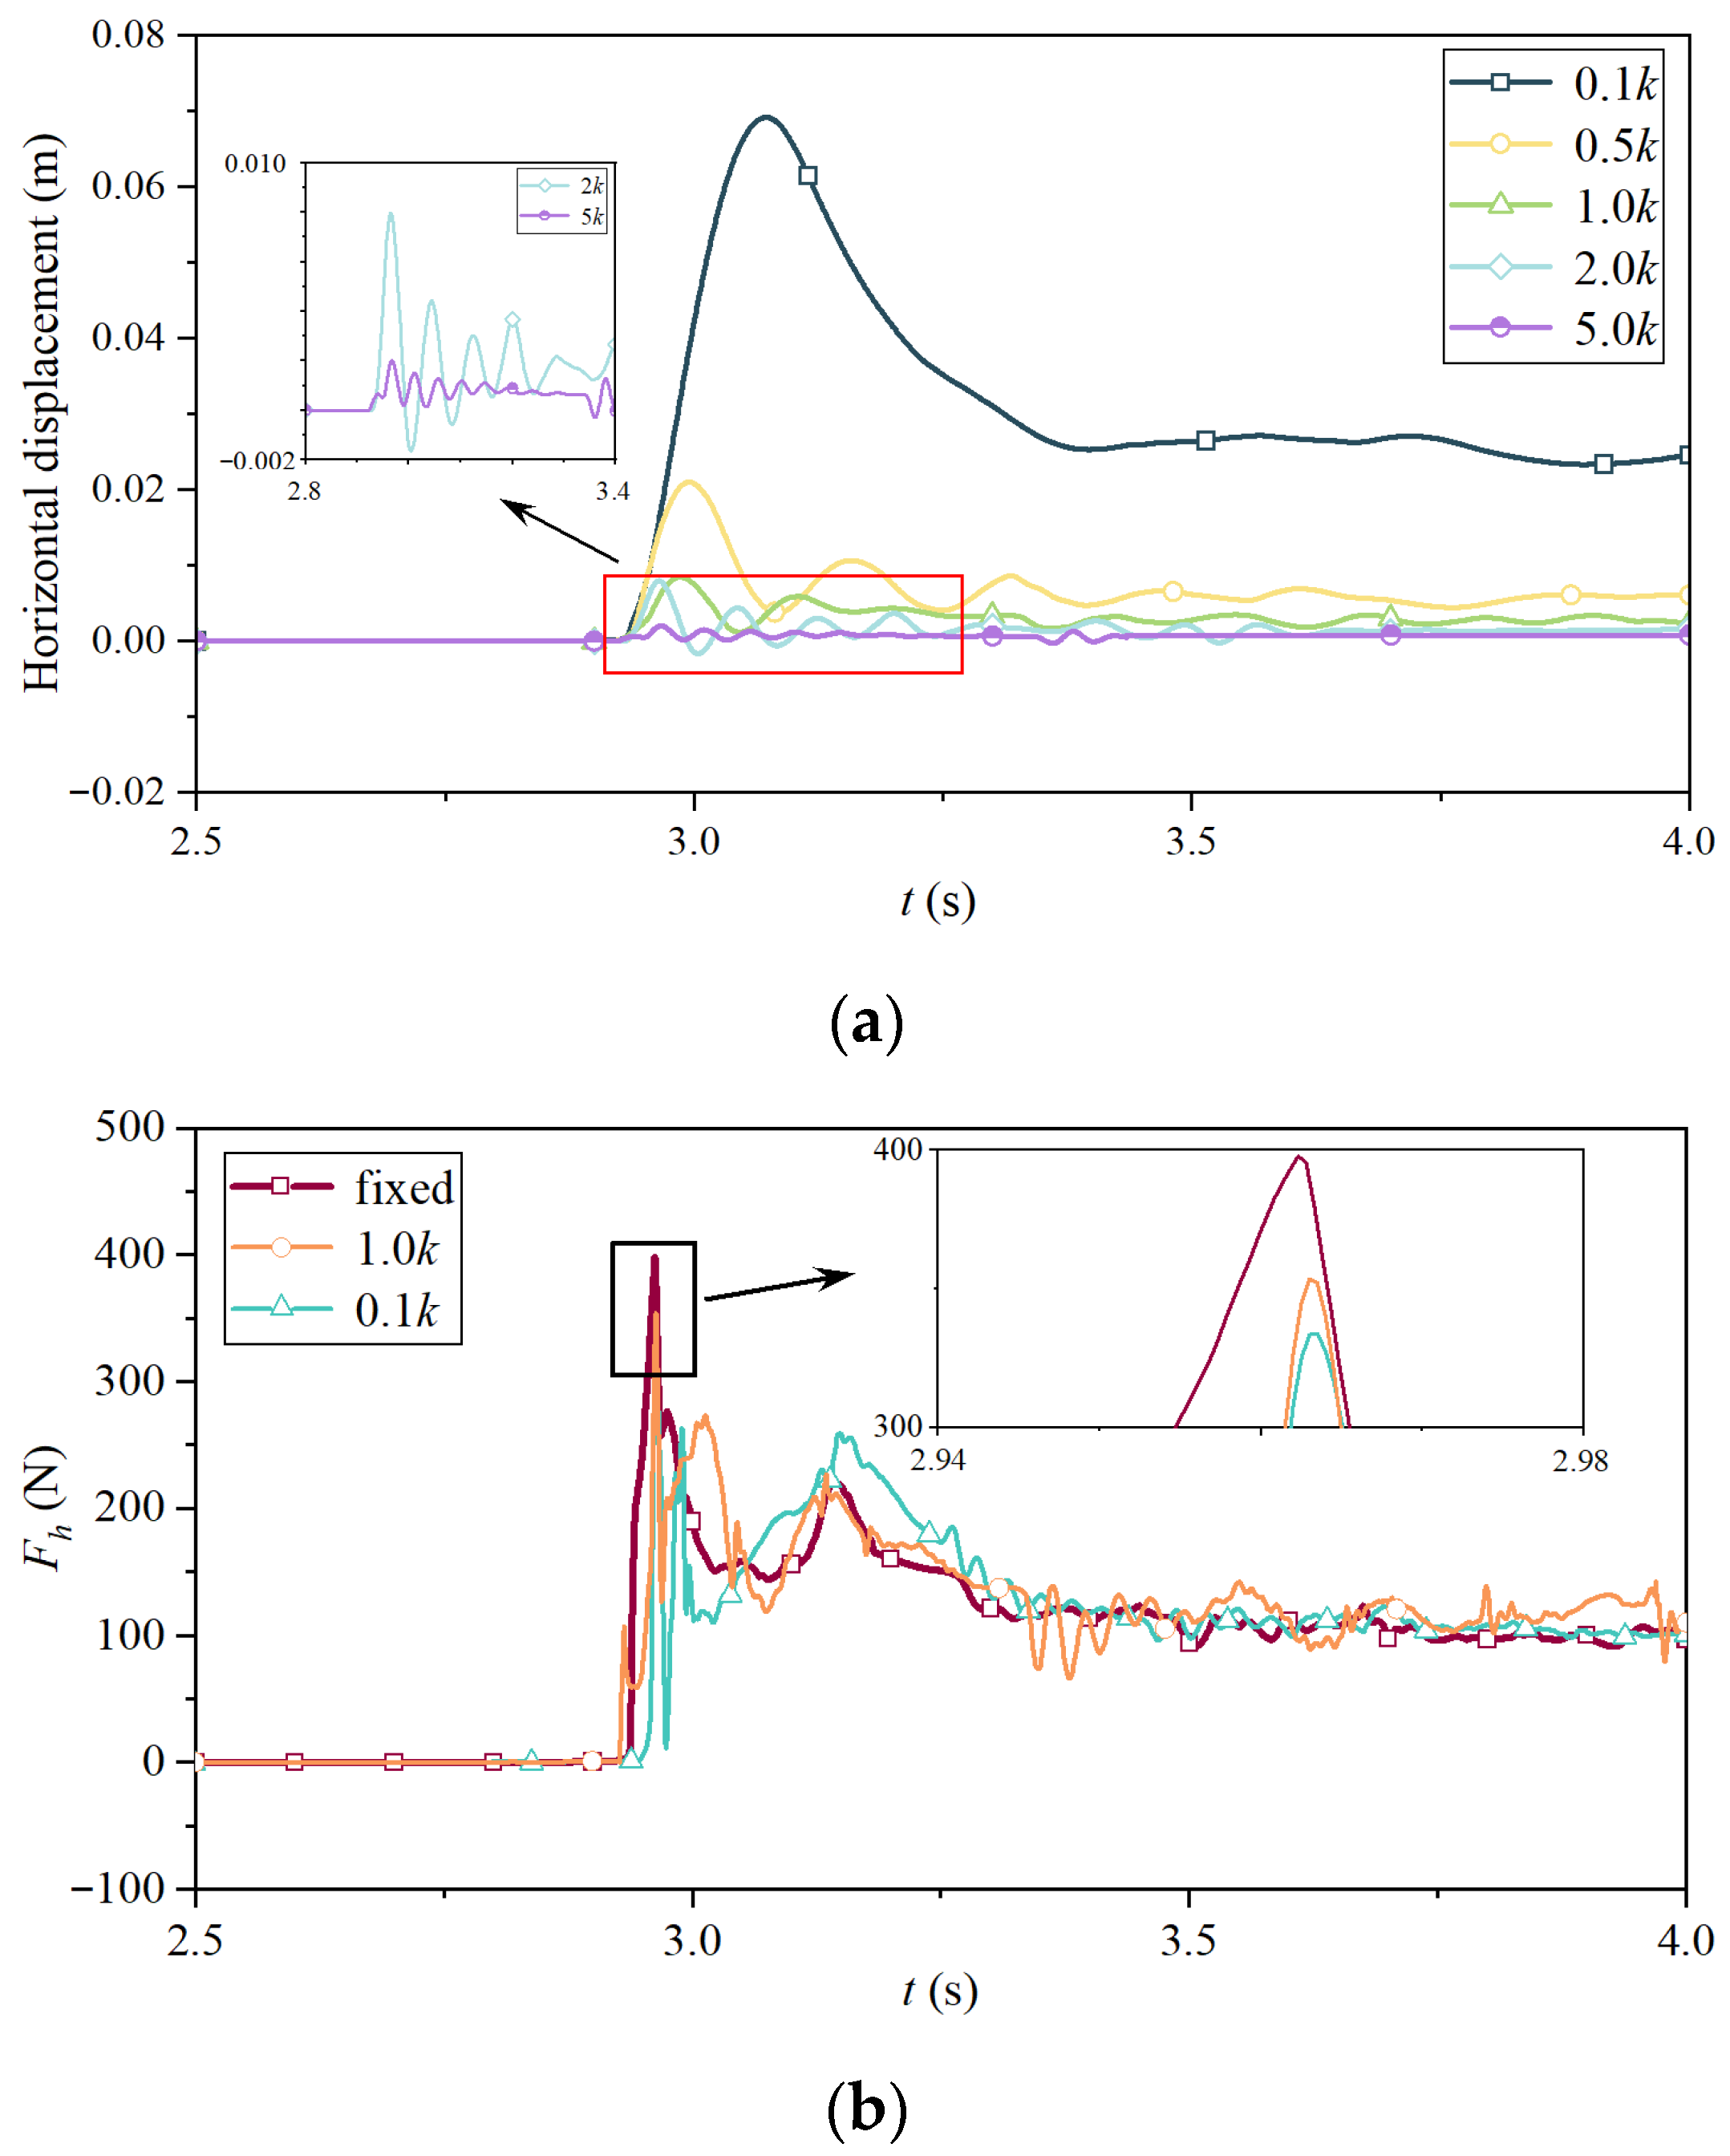
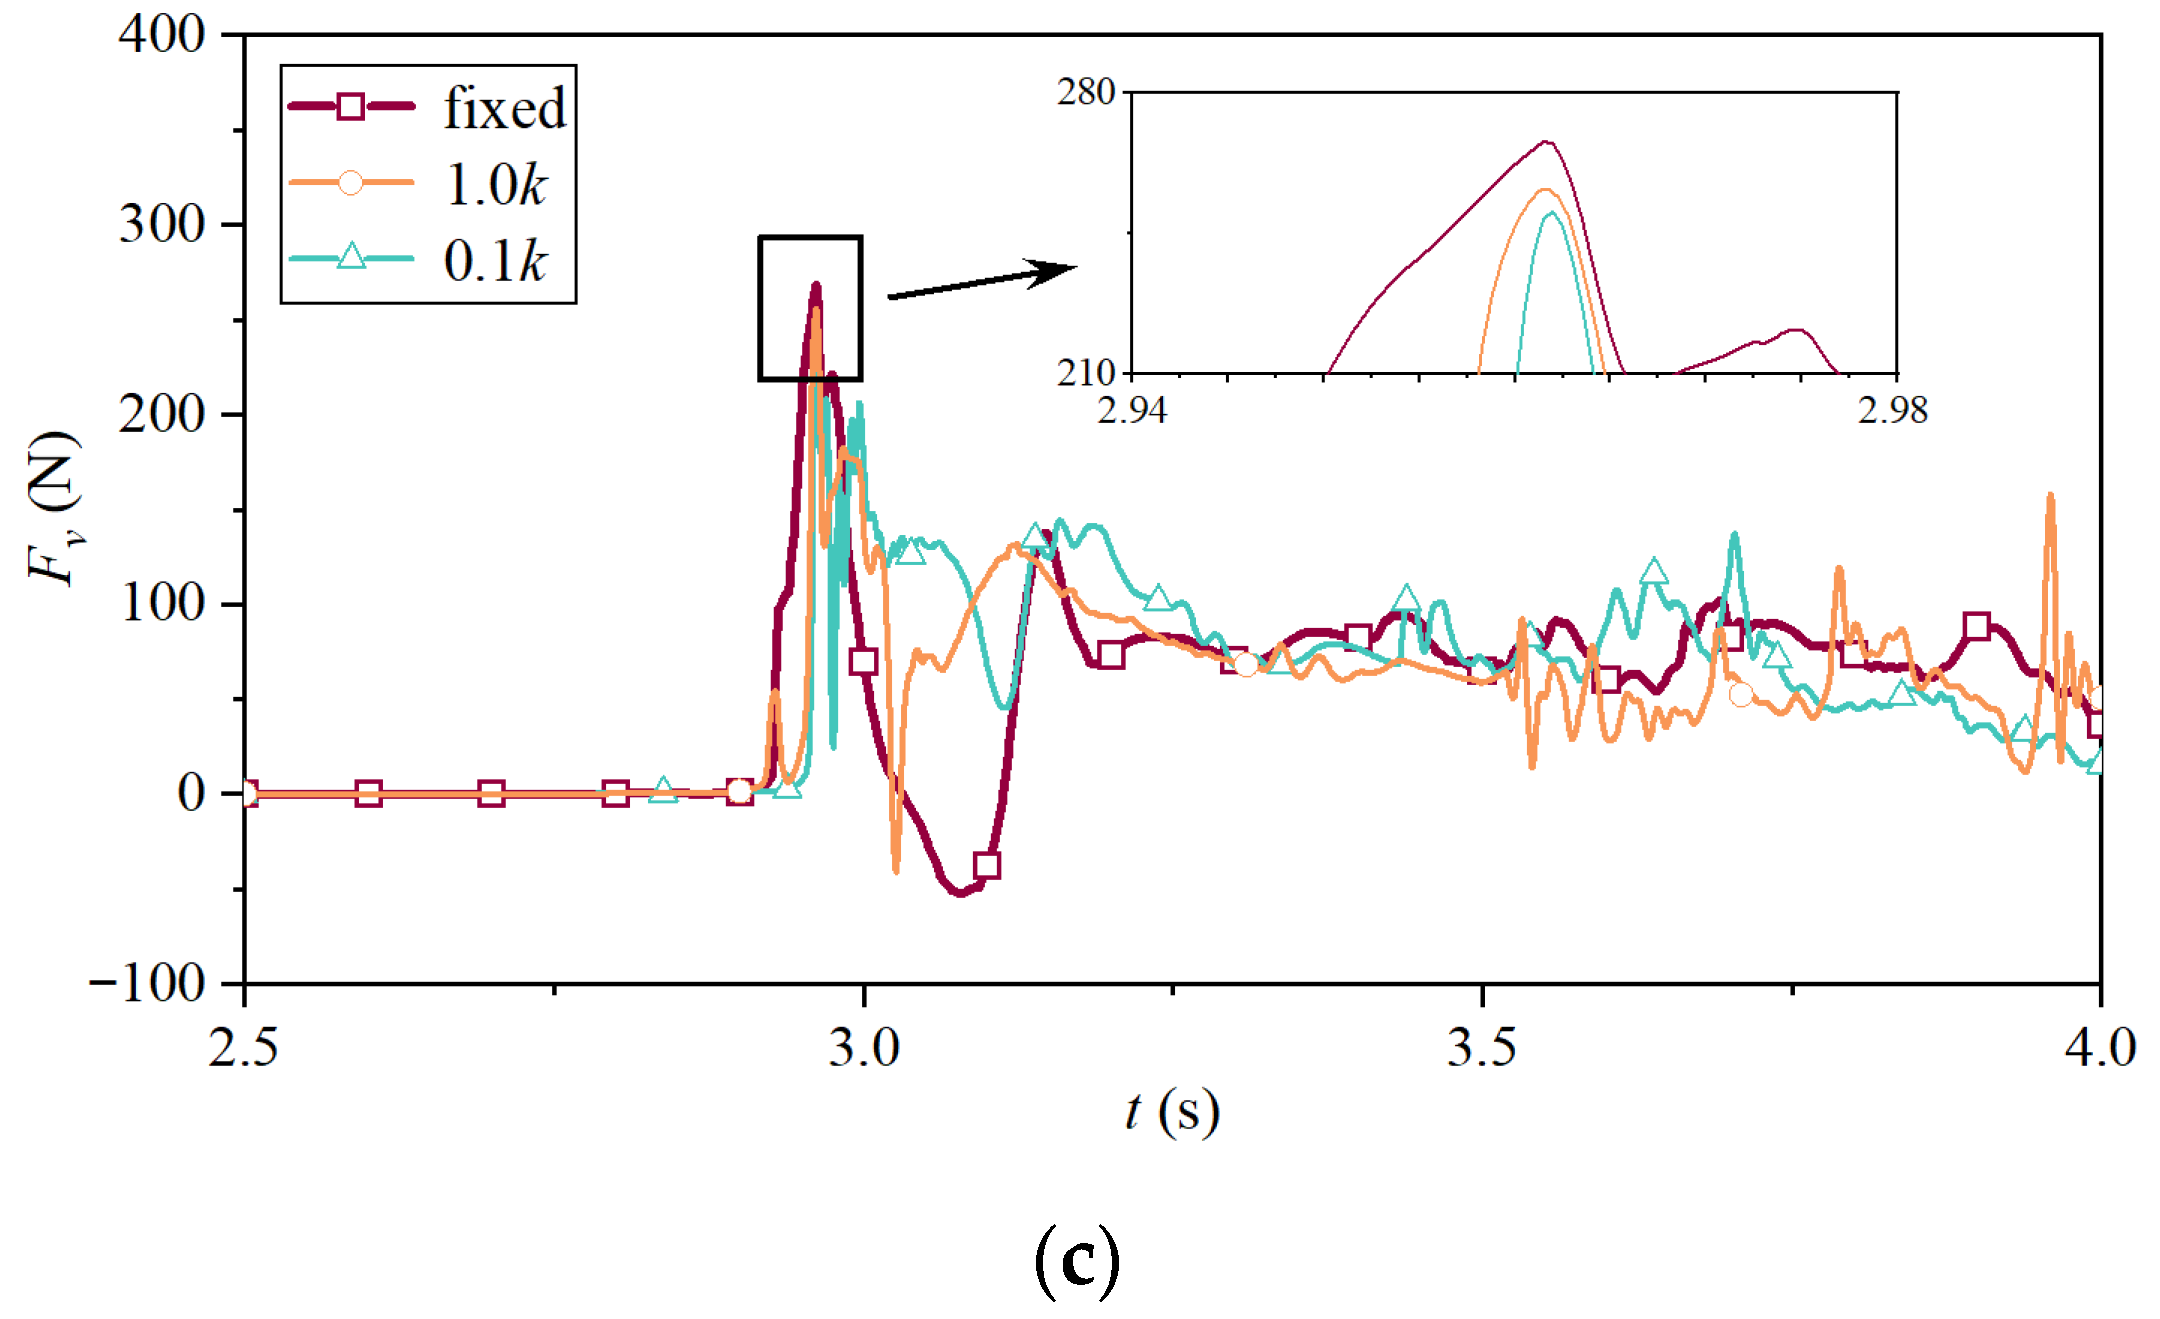
Figure 22 for the unbroken tsunami wave and the broken tsunami wave, respectively, together with the results of the fixed girder. The results indicated that:
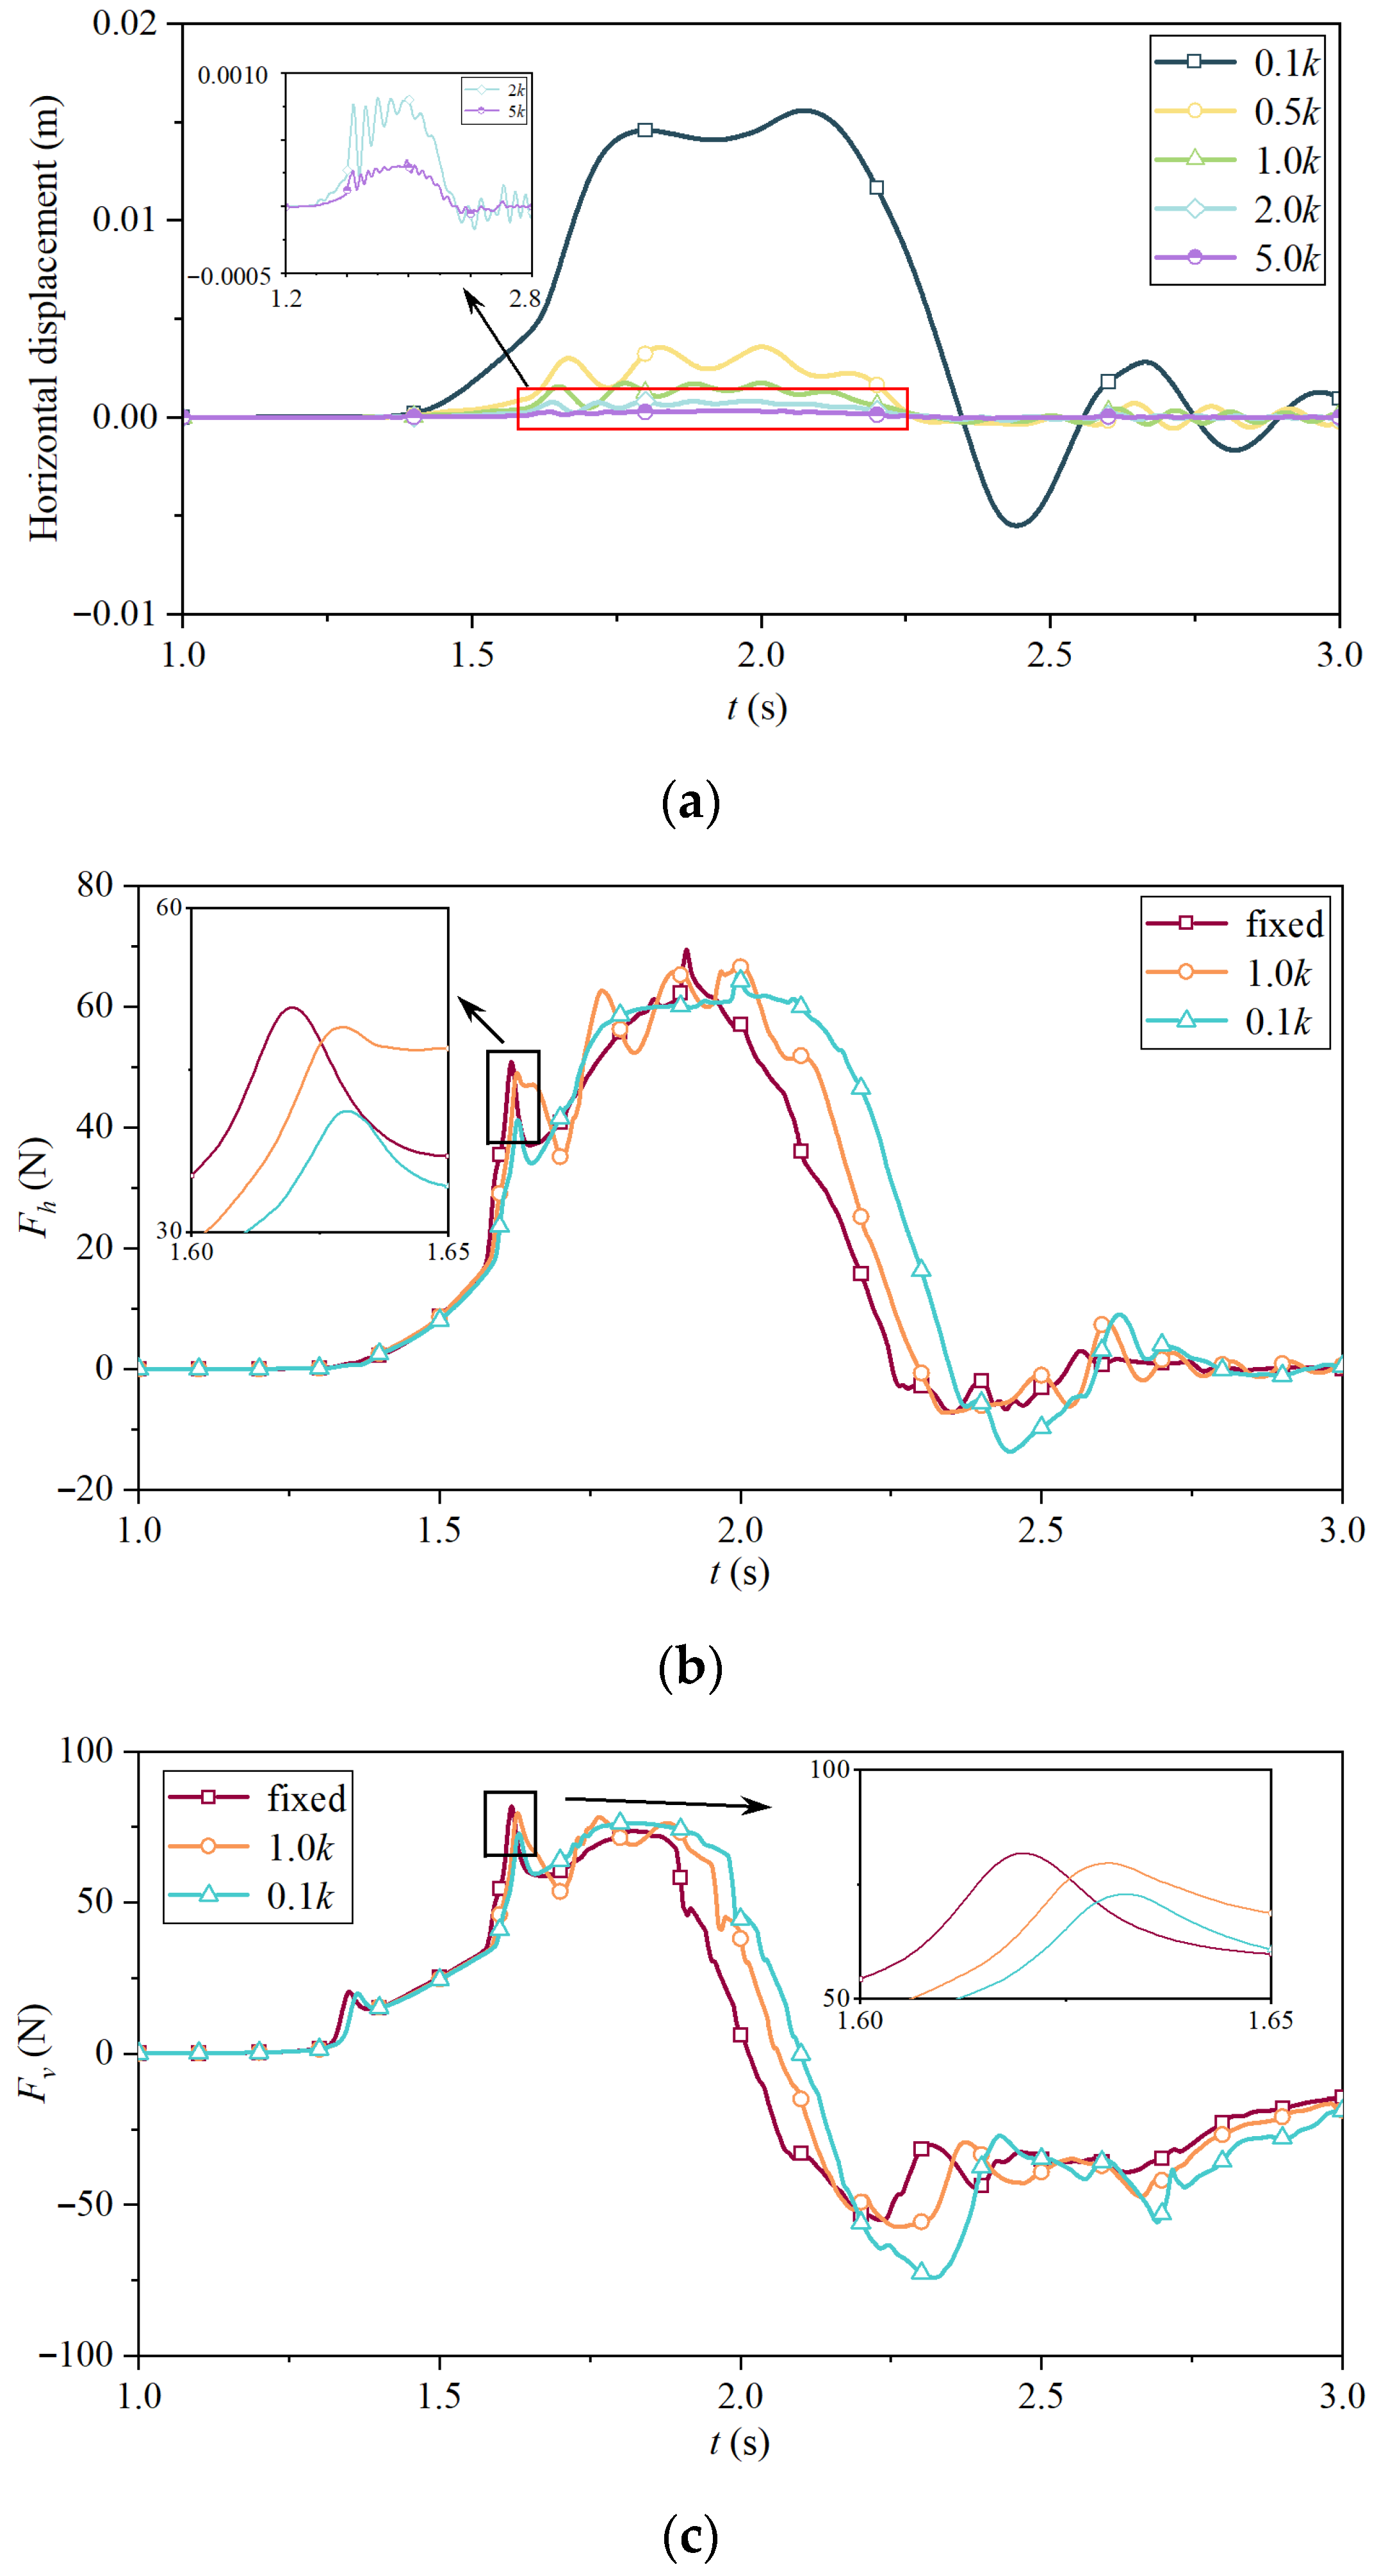
For the unbroken tsunami wave, firstly, when the wave front approaches and impacts the bottom of the box, the girder only undergoes minimal lateral displacement (0.07 mm) due to inertia. As the lateral stiffness decreases, the first vertical peak force exhibits no noticeable variation in magnitude but a slight delay in occurrence time. Secondly, when the water impacts the bottom of the front cantilever, the girder has already undergone slight lateral displacement (5.70 mm). When compared with the fixed girder, part of the wave impact during this stage is transformed into the kinetic energy of girder motion, which slightly reduces the pressure around the movable girder and thus decreases the wave force. As the lateral stiffness decreases, the second vertical peak force (maximum) witnesses a noticeable reduction in magnitude (10.5%) and a slight delay in occurrence time (
Figure 21c); meanwhile, the first horizontal peak force presents an obvious decrease in magnitude (19.3%) and slight delay in occurrence time. Thirdly, when the raised-up water impacts and overtops the front cantilever, the girder has already undergone significant lateral displacement (14.60 mm,
Figure 21a). With decreasing lateral stiffness, the pressure on the front side is notably lower than that on the fixed girder, resulting in a notable reduction (6.0%) in the second horizontal peak force (maximum) and a pronounced delay in its occurrence time (
Figure 21b). Compared with the first peak force, although the displacement at this stage increases significantly, the second peak force occurs with a greater delay relative to the fixed girder, allowing a larger volume of water to accumulate in front of the girder, while the impact effect of the raised-up water is weakened. As a result, the reduction in the second peak force is smaller than that of the first peak force. Subsequently, with decreasing lateral stiffness, larger lateral displacement leads to a progressively increasing delay in the force–time history. Relative to the fixed girder, the horizontal force–time history of the lateral movable girder exhibits a certain increase in fluctuation, which diminishes as the lateral stiffness decreases. The lateral displacement generally exhibits a pattern of an initial increase with sustained oscillations (the frequency of which decreases as the lateral stiffness reduces) to its maximum value, followed by a decline that gradually decays to zero. And the maximum lateral displacement increases rapidly as the lateral stiffness decreases (e.g., 0.017 m for 0.1 k), and it occurs later than the maximum horizontal force due to the inertia effect.
For the broken tsunami wave, when the wave front strikes the upstream inclined web and subsequently impacts the bottom of the front cantilever, the girder undergoes only minimal lateral displacement (8.13 mm) due to inertia. However, the broken tsunami wave has higher flow velocity than the unbroken tsunami wave and produces a more pronounced horizontal impact. As a result, the lateral displacement at the peak force instant is greater than that at the first horizontal peak force under the unbroken tsunami wave. Compared with the fixed girder, the pressure around the movable girder is notably reduced. In addition, as the lateral stiffness decreases, the magnitude of the maximum horizontal force decreases progressively and obviously (16.01%), while the magnitude of the maximum vertical force decreases progressively and notably (6.53%), as shown in
Figure 22b,c. Compared with the fixed girder, the horizontal and vertical force–time histories of the movable girder exhibit increased fluctuation during the quasi-stationary stage. The lateral displacement generally presents a pattern of a rapid increase to its maximum value, followed by a sharp decrease and subsequent gradual decay with oscillations. Its oscillation frequency decreases with decreasing lateral stiffness (
Figure 22a). Similar to the unbroken tsunami wave, the maximum lateral displacement increases rapidly as the lateral stiffness decreases (e.g., 0.07 m for 0.1 k), and it occurs later than the maximum horizontal and vertical forces due to the inertia effect, and this delay becomes more pronounced as the lateral stiffness is reduced.
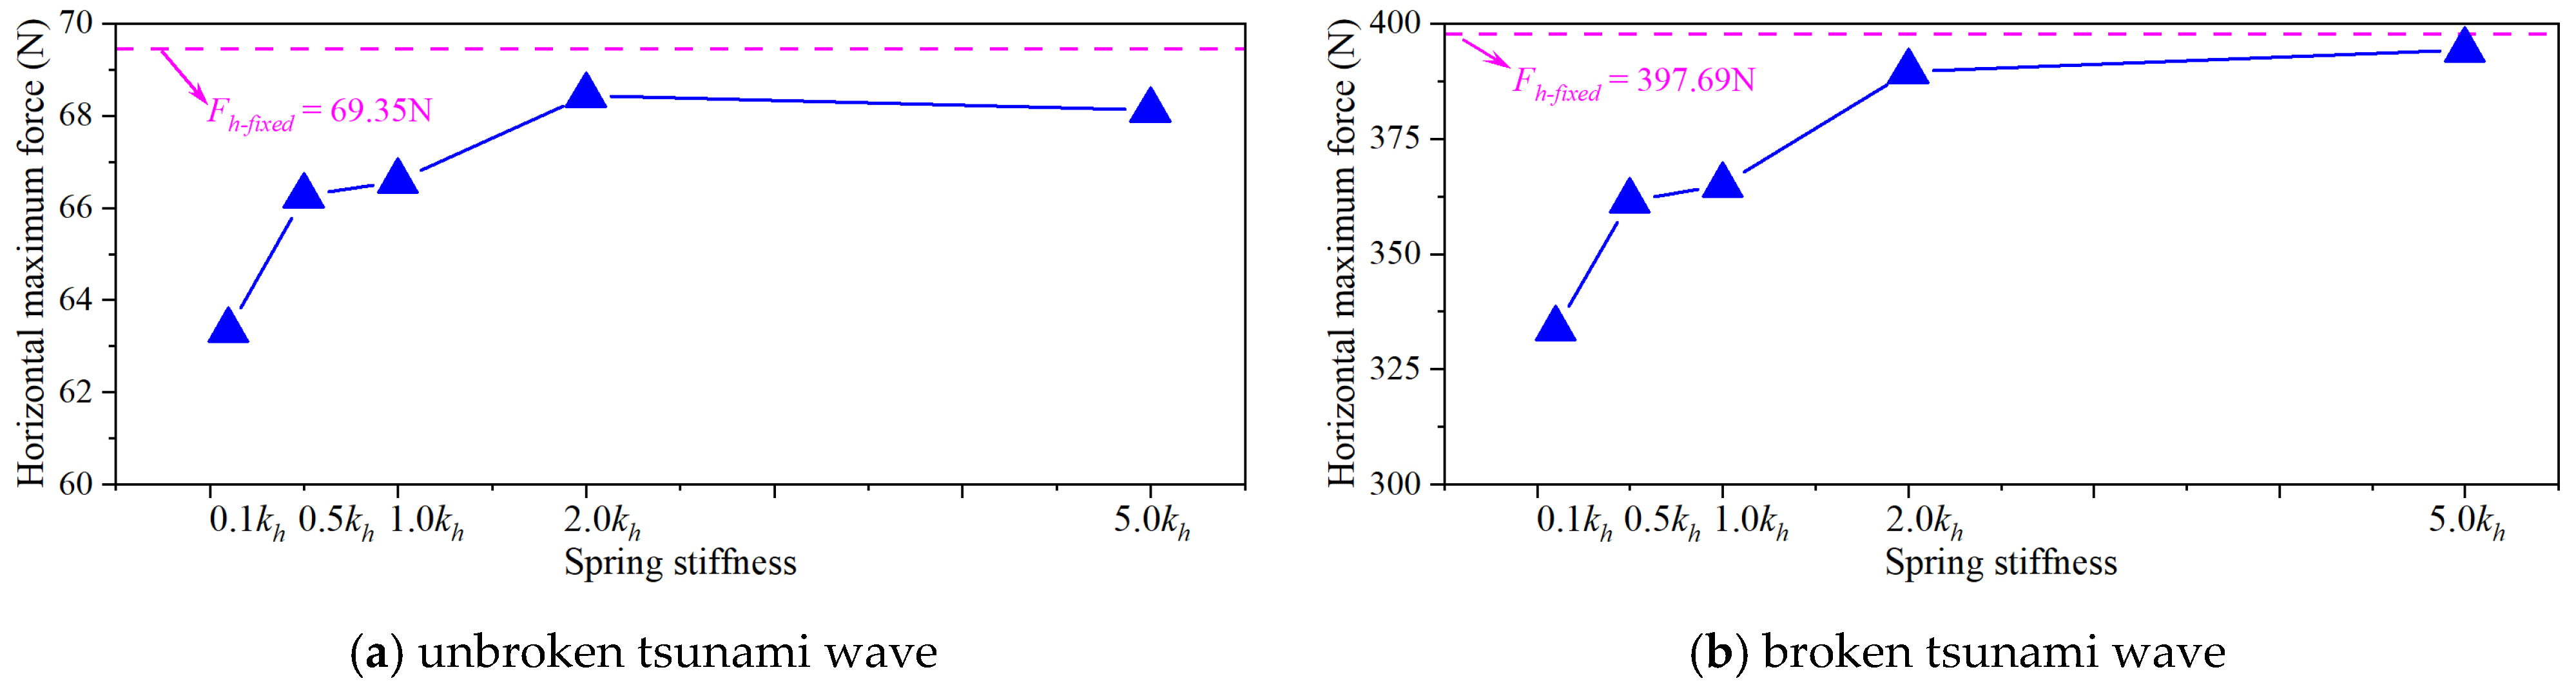
The above findings reveal that, with decreasing lateral stiffness, the wave forces on the girder are reduced more significantly for broken tsunami waves than for unbroken ones, a consequence of the former’s stronger impact effect. Additionally, the decline in the maximum horizontal force surpasses that observed for the maximum vertical force. The evolutions of the maximum horizontal force with lateral stiffness under the unbroken and broken tsunami waves are shown in
Figure 23a,b, respectively.
Compared with the fixed girder, for the reference stiffness of an actual railway box girder bearing, the reduction in the maximum horizontal force under unbroken and broken tsunami waves are merely 3.9% and 8.3%, respectively, which are less than 10.0%—a relatively limited reduction. The underlying reason is that, at the reference stiffness, the lateral displacement at the instant of the maximum horizontal force is only 1.74 mm under the unbroken tsunami wave and 5.44 mm under the broken tsunami wave, both of which are far smaller than the corresponding peak displacements. Accordingly, only a small fraction of the wave energy is transferred into the kinetic energy of girder motion at this stage, and the resulting reduction in the maximum horizontal force remains limited. From the above analysis, it implies that, for practical engineering applications, using the fixed girder model to estimate wave forces on an actual laterally movable girder is a slightly conservative, reasonable and feasible approach, which also validates the rationality of existing studies on wave forces based on fixed girders. When the lateral stiffness is reduced to 10.0% of the reference stiffness, the reduction in the maximum horizontal force under unbroken and broken tsunami waves increases to 8.7% and 16.1%, respectively. However, this leads to a substantial increase in lateral displacement, far exceeding the allowable lateral deformation capacity of an actual bearing. This indicates that, in future engineering applications where lateral displacement effects are considered for reducing wave forces on girders, the lateral stiffness should be determined through a comprehensive balance between the desired force reduction and the allowable deformation capacity of the bearing.
6. Conclusions
This study focuses on the mechanical behavior of a single-track high-speed railway box girder under unbroken and broken tsunami waves, and fifth-order solitary waves and dam-break waves are adopted to simulate the unbroken and broken tsunami waves. The force–time history characteristics, the evolution of the maximum horizontal and vertical wave forces with girder clearance, and the lateral displacement effects on girder wave forces are comprehensively and thoroughly explored and revealed, and the key findings are summarized as follows:
(1) For the single-track high-speed railway box girder under the non-submerged condition, the characteristics of the interaction process differ distinctly between unbroken and broken tsunami waves. For unbroken waves, the vertical force exhibits two peaks—with the maximum occurring upon impact at the front cantilever bottom—while the horizontal force also peaks twice, reaching its maximum when overtopping flow strikes the front cantilever. For broken waves, the horizontal and vertical forces attain their maximum almost simultaneously during the impulse stage, decrease sharply with dramatic fluctuations in the fluctuation stage, and then remain relatively stable with slight fluctuations in the quasi-stationary stage.
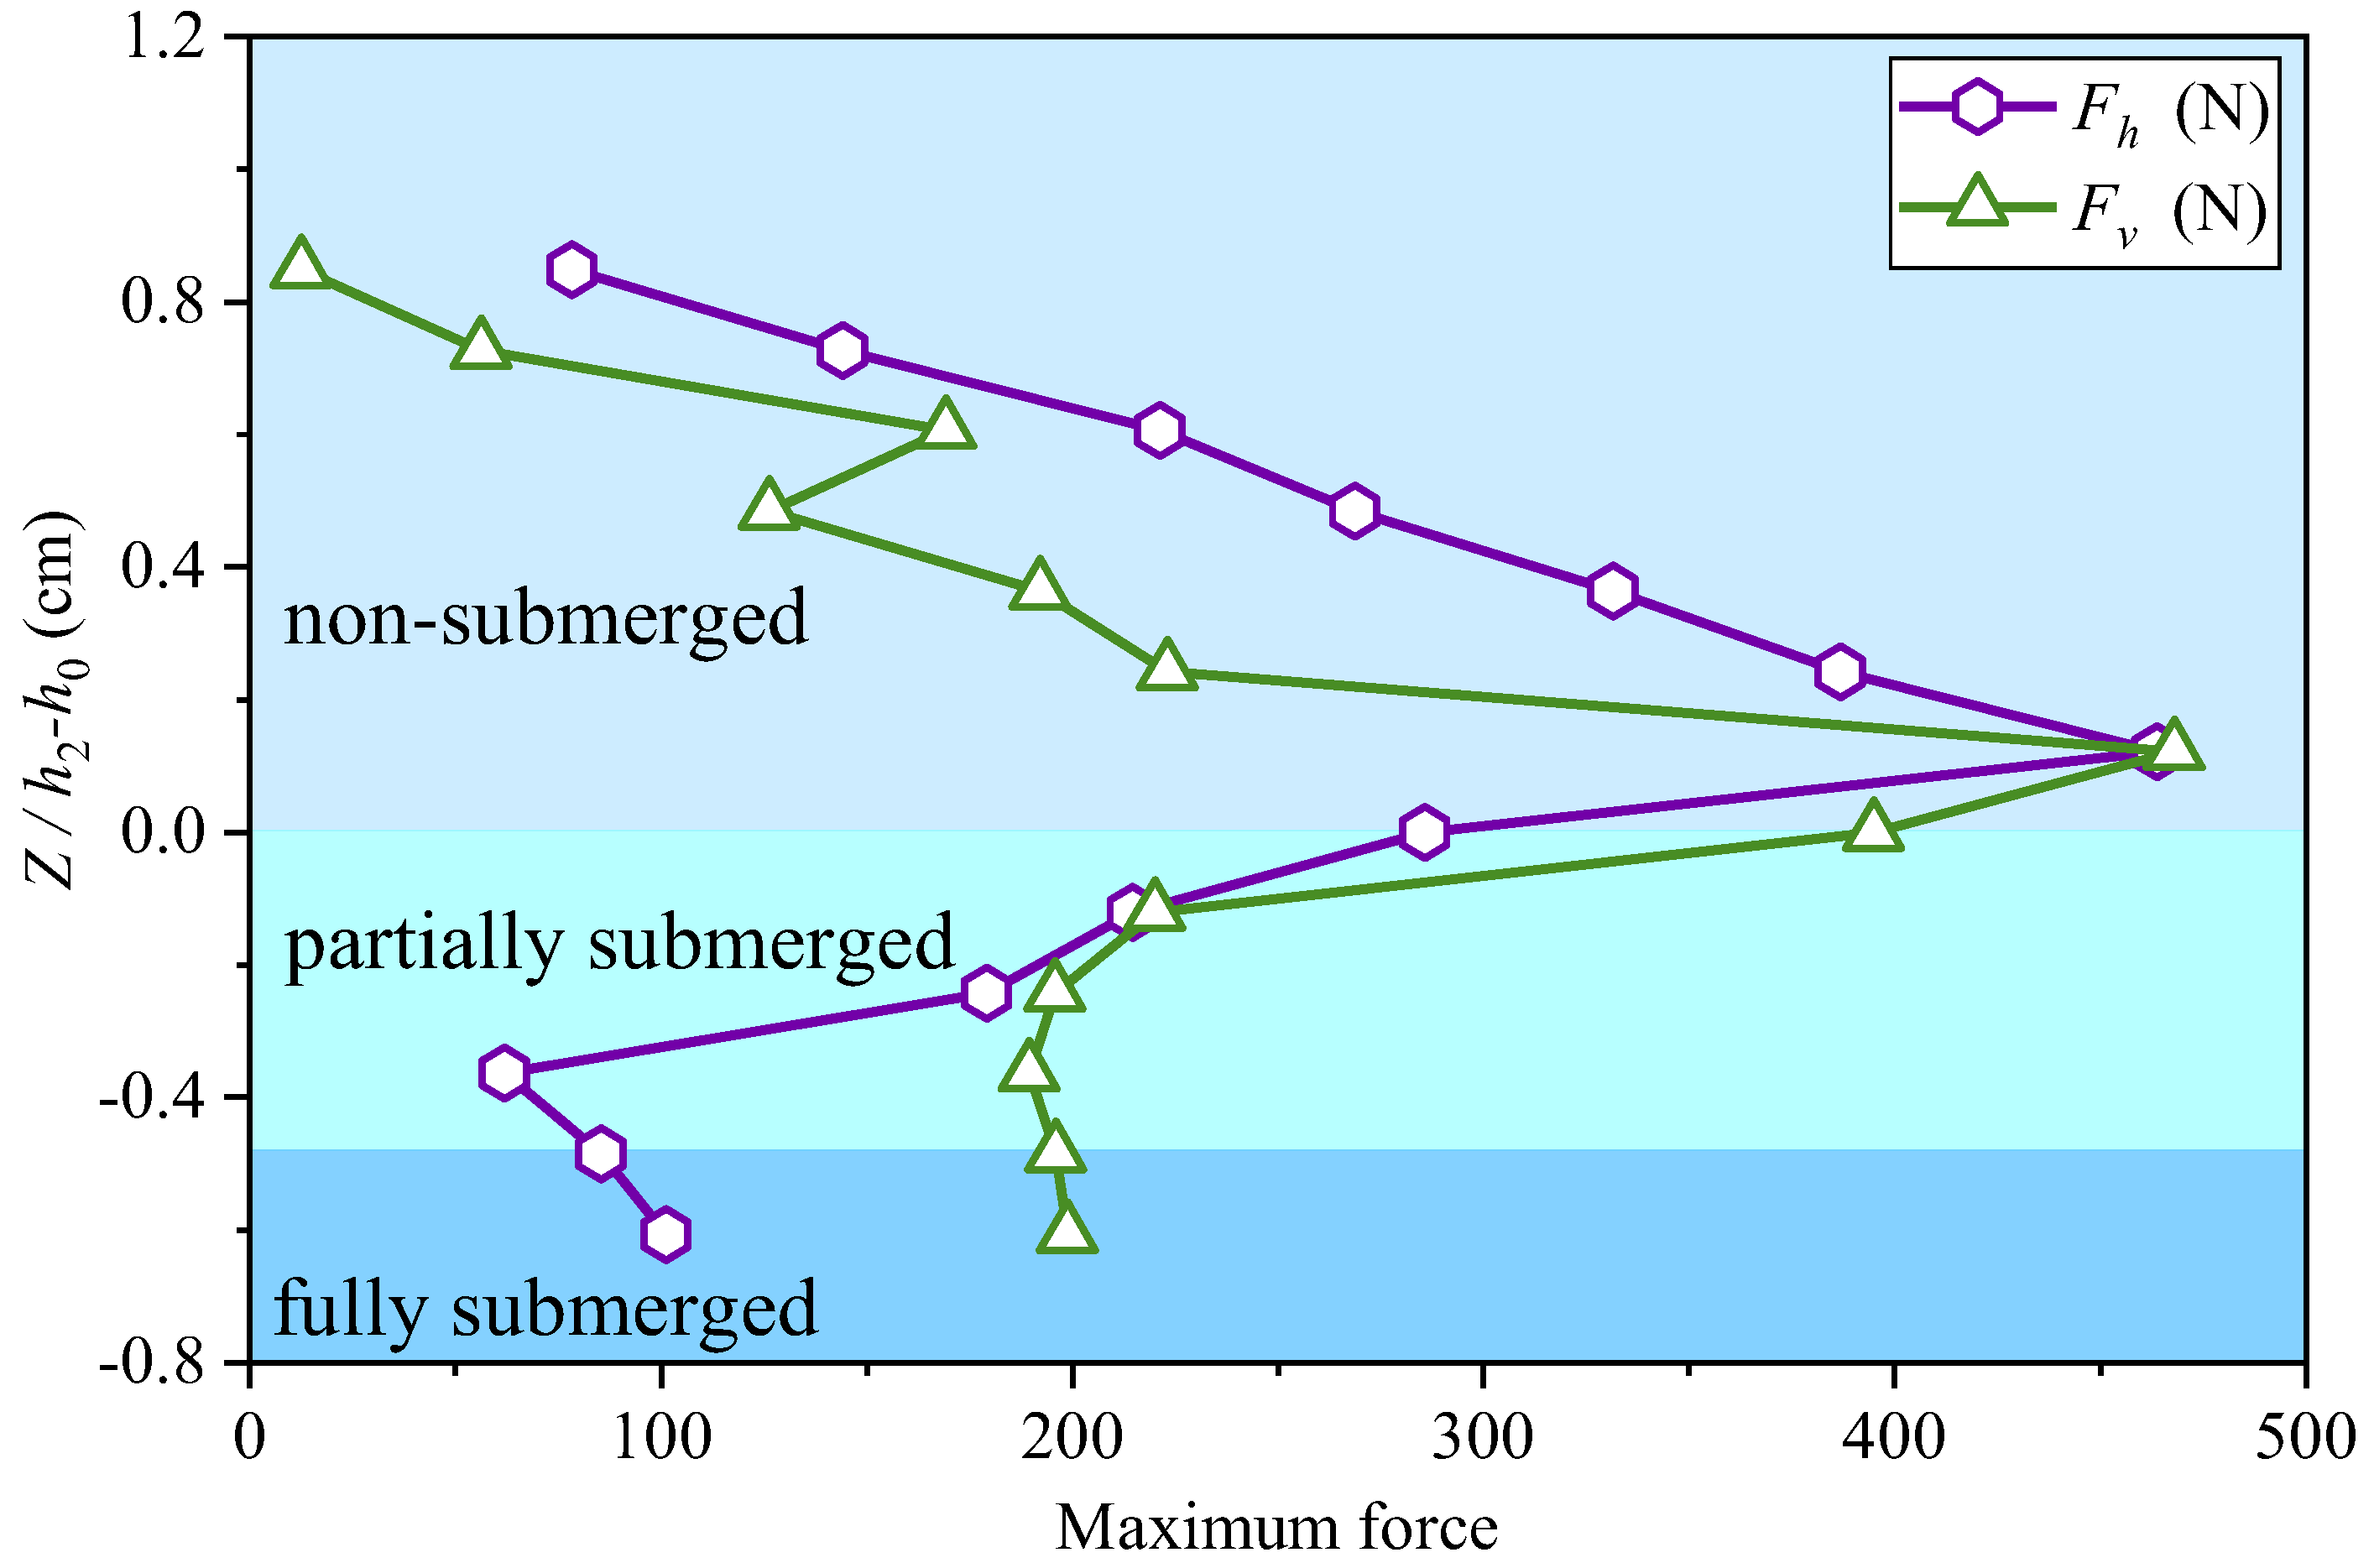
(2) Under unbroken tsunami waves, the variation in the maximum horizontal and vertical forces exhibits a pattern of initial increase and subsequent decrease, followed by another rise and final decline with girder clearance. The horizontal force attains its first peak value when the girder top is close to the wave crest, and attains its second peak value (maximum) when the girder bottom descends to the initial water surface. The vertical force reaches its first peak value as the girder bottom descends to the upper-middle region of the wave crest, and reaches its second peak value (maximum) when the root of the cantilever descends to the initial water surface. The maximum vertical force is significantly larger than the maximum horizontal force for all girder clearances.
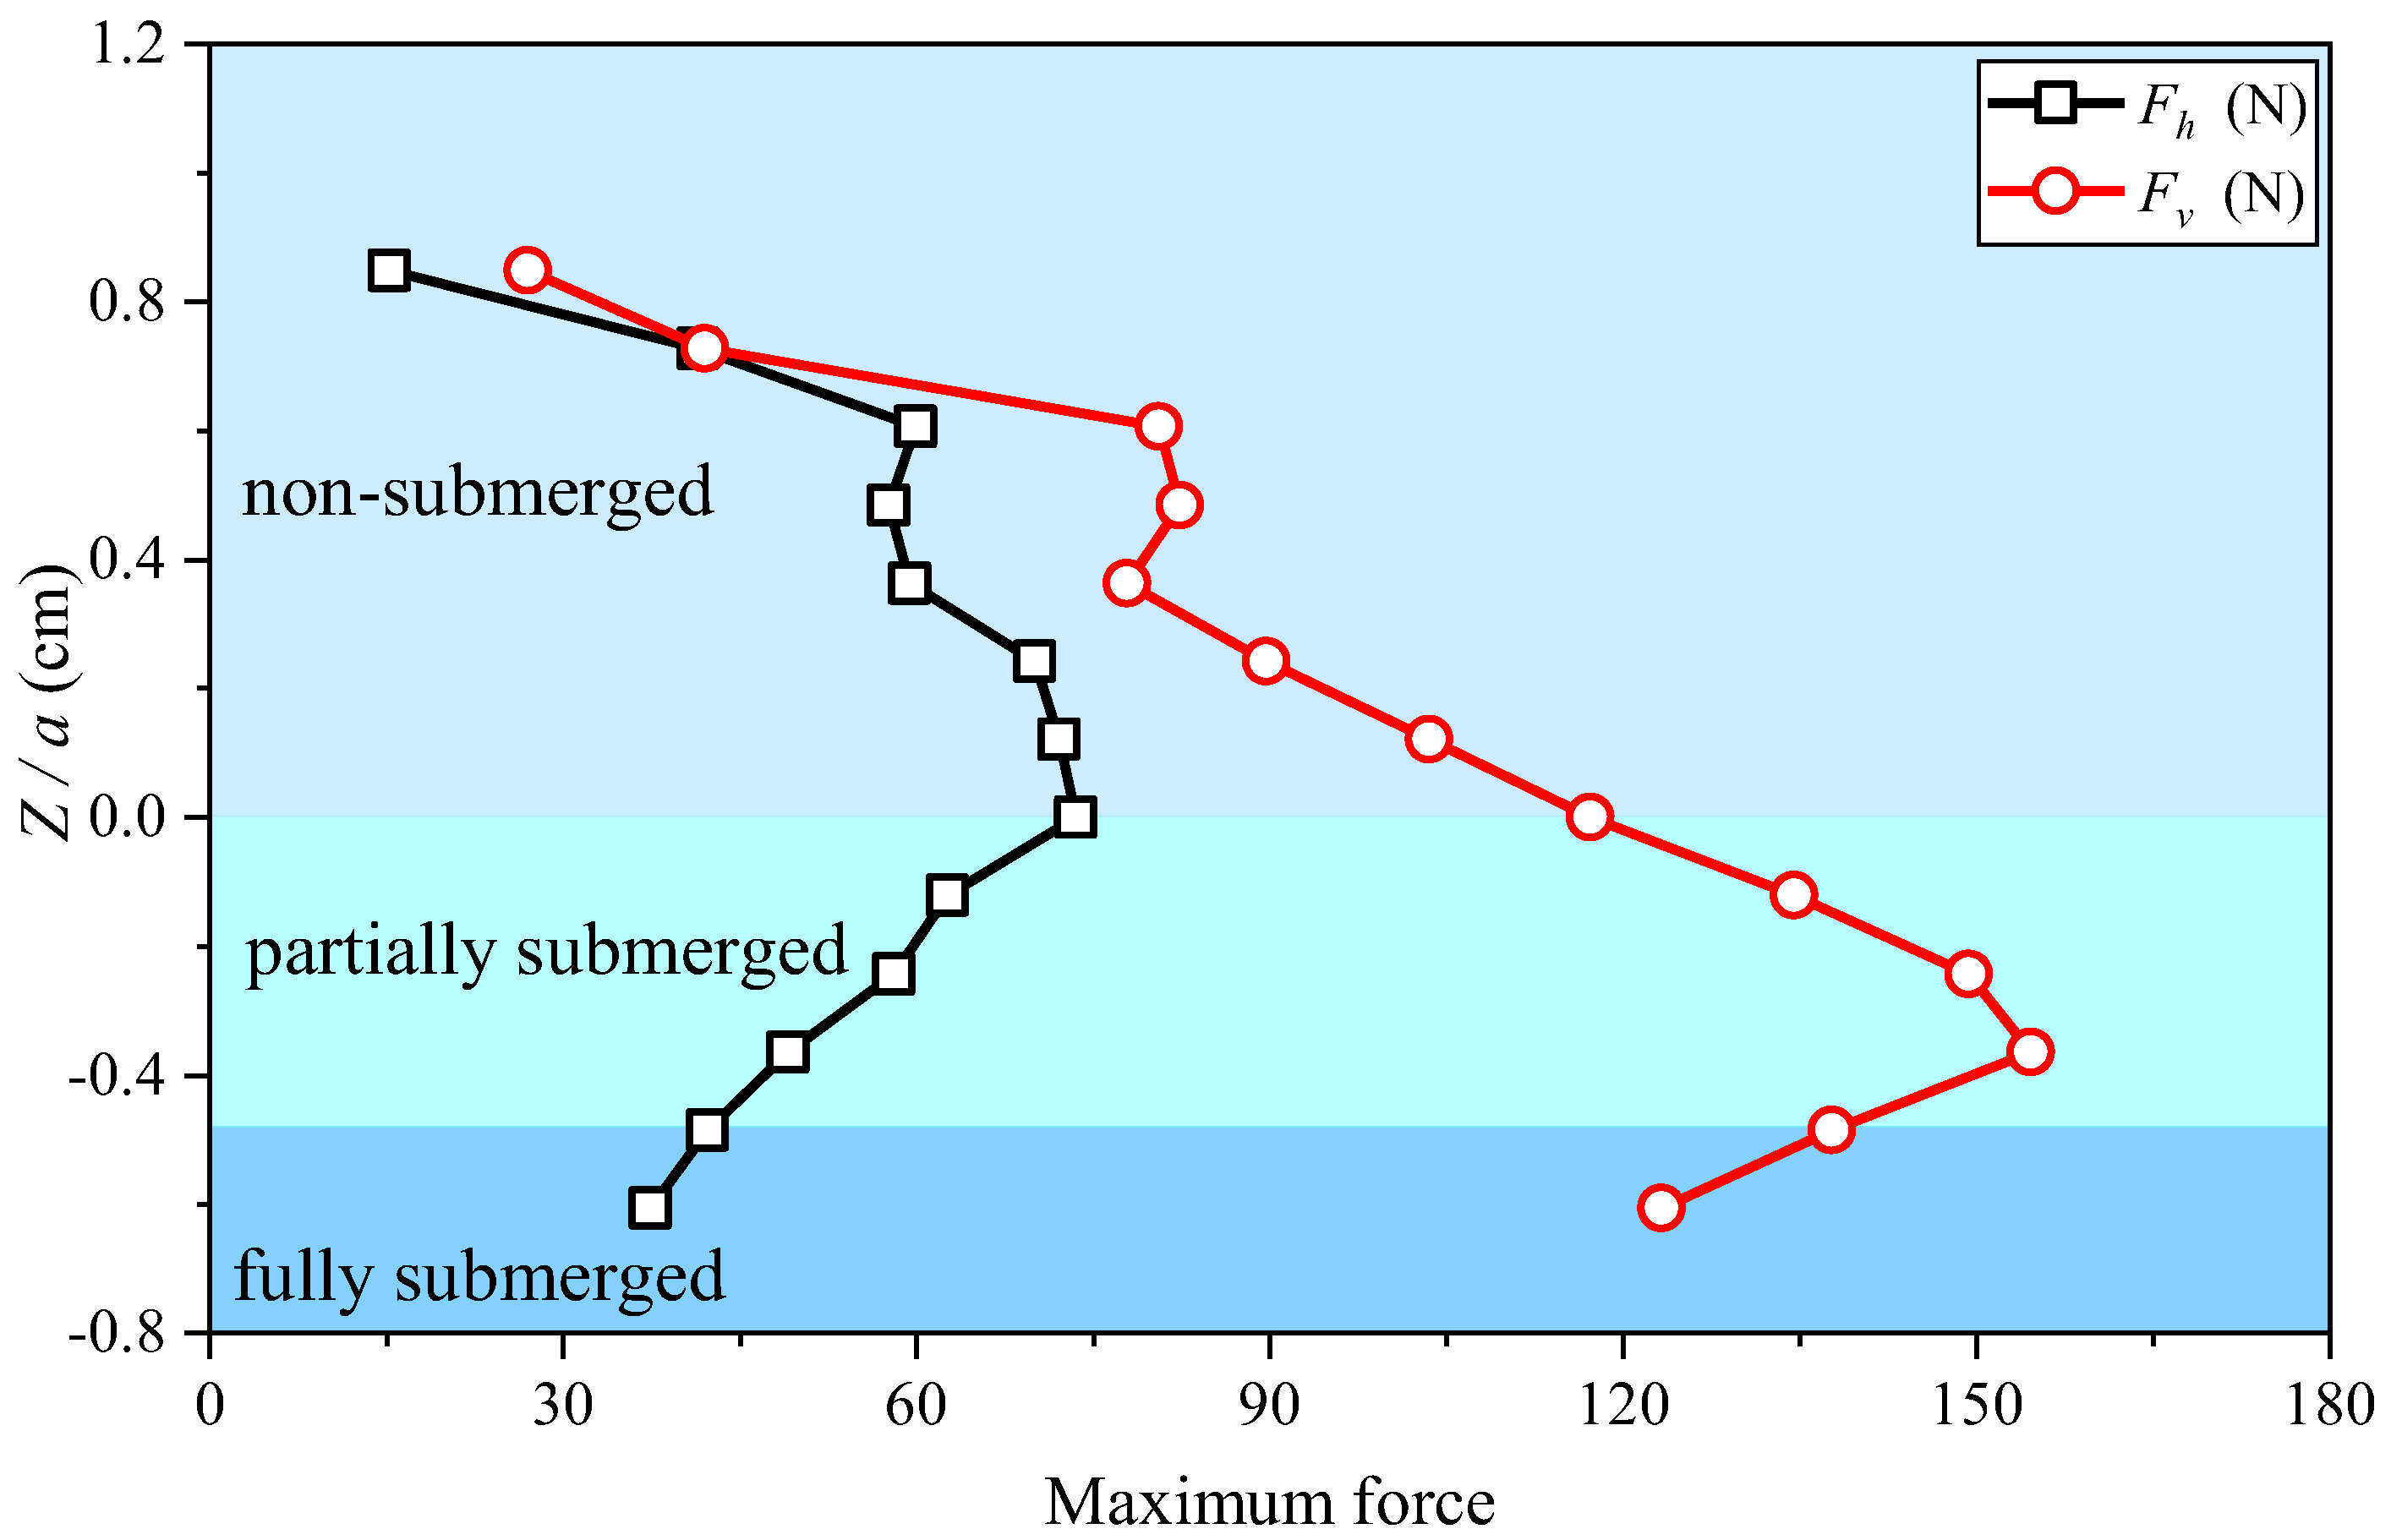
(3) Under broken tsunami waves, with decreasing girder clearance, the maximum horizontal force exhibits a trend of an initial increase, followed by a decrease, and then another increase; meanwhile, the maximum vertical force shows an overall trend of non-monotonic, multi-stage variation—rising, falling, rising again, and falling again—before eventually stabilizing. The horizontal and vertical forces simultaneously reach their maximum values when the girder bottom is close to the water surface with a small clearance, and the horizontal force is larger above this clearance, while the vertical force becomes larger below it.
(4) Compared with the fixed girder, lateral displacement can reduce wave forces on the girder, with the reduction for broken waves being more notable than that for unbroken waves, as is the case for the maximum horizontal and vertical forces. However, the reduction is quite limited—remaining below 10% at the reference stiffness of an actual bearing. This validates that using a fixed girder model to estimate wave forces on an actual laterally movable girder is a slightly conservative, reasonable and feasible approach.
Limitations and future work: This study helps deepen the understanding of the mechanical behavior of coastal high-speed railway box girders under unbroken and broken tsunami waves. However, in the present study, waves impact the girder vertically. In reality, waves may attack the girder at arbitrary oblique angles. Furthermore, given the considerable facade height of the front cantilever of high-speed railway box girders, installing a suitable fairing is expected to mitigate the wave forces. Therefore, the influence of oblique wave angles and the force reduction mechanism of fairings need to be further explored. In addition, for the analysis of the effects of lateral displacement, only lateral stiffness was considered in this study; the ultimate capacity of the lateral connection—which is crucial for developing a good mitigation strategy that balances both the pier and girder performance—is not addressed. This will be the focus of future research.



 and
and