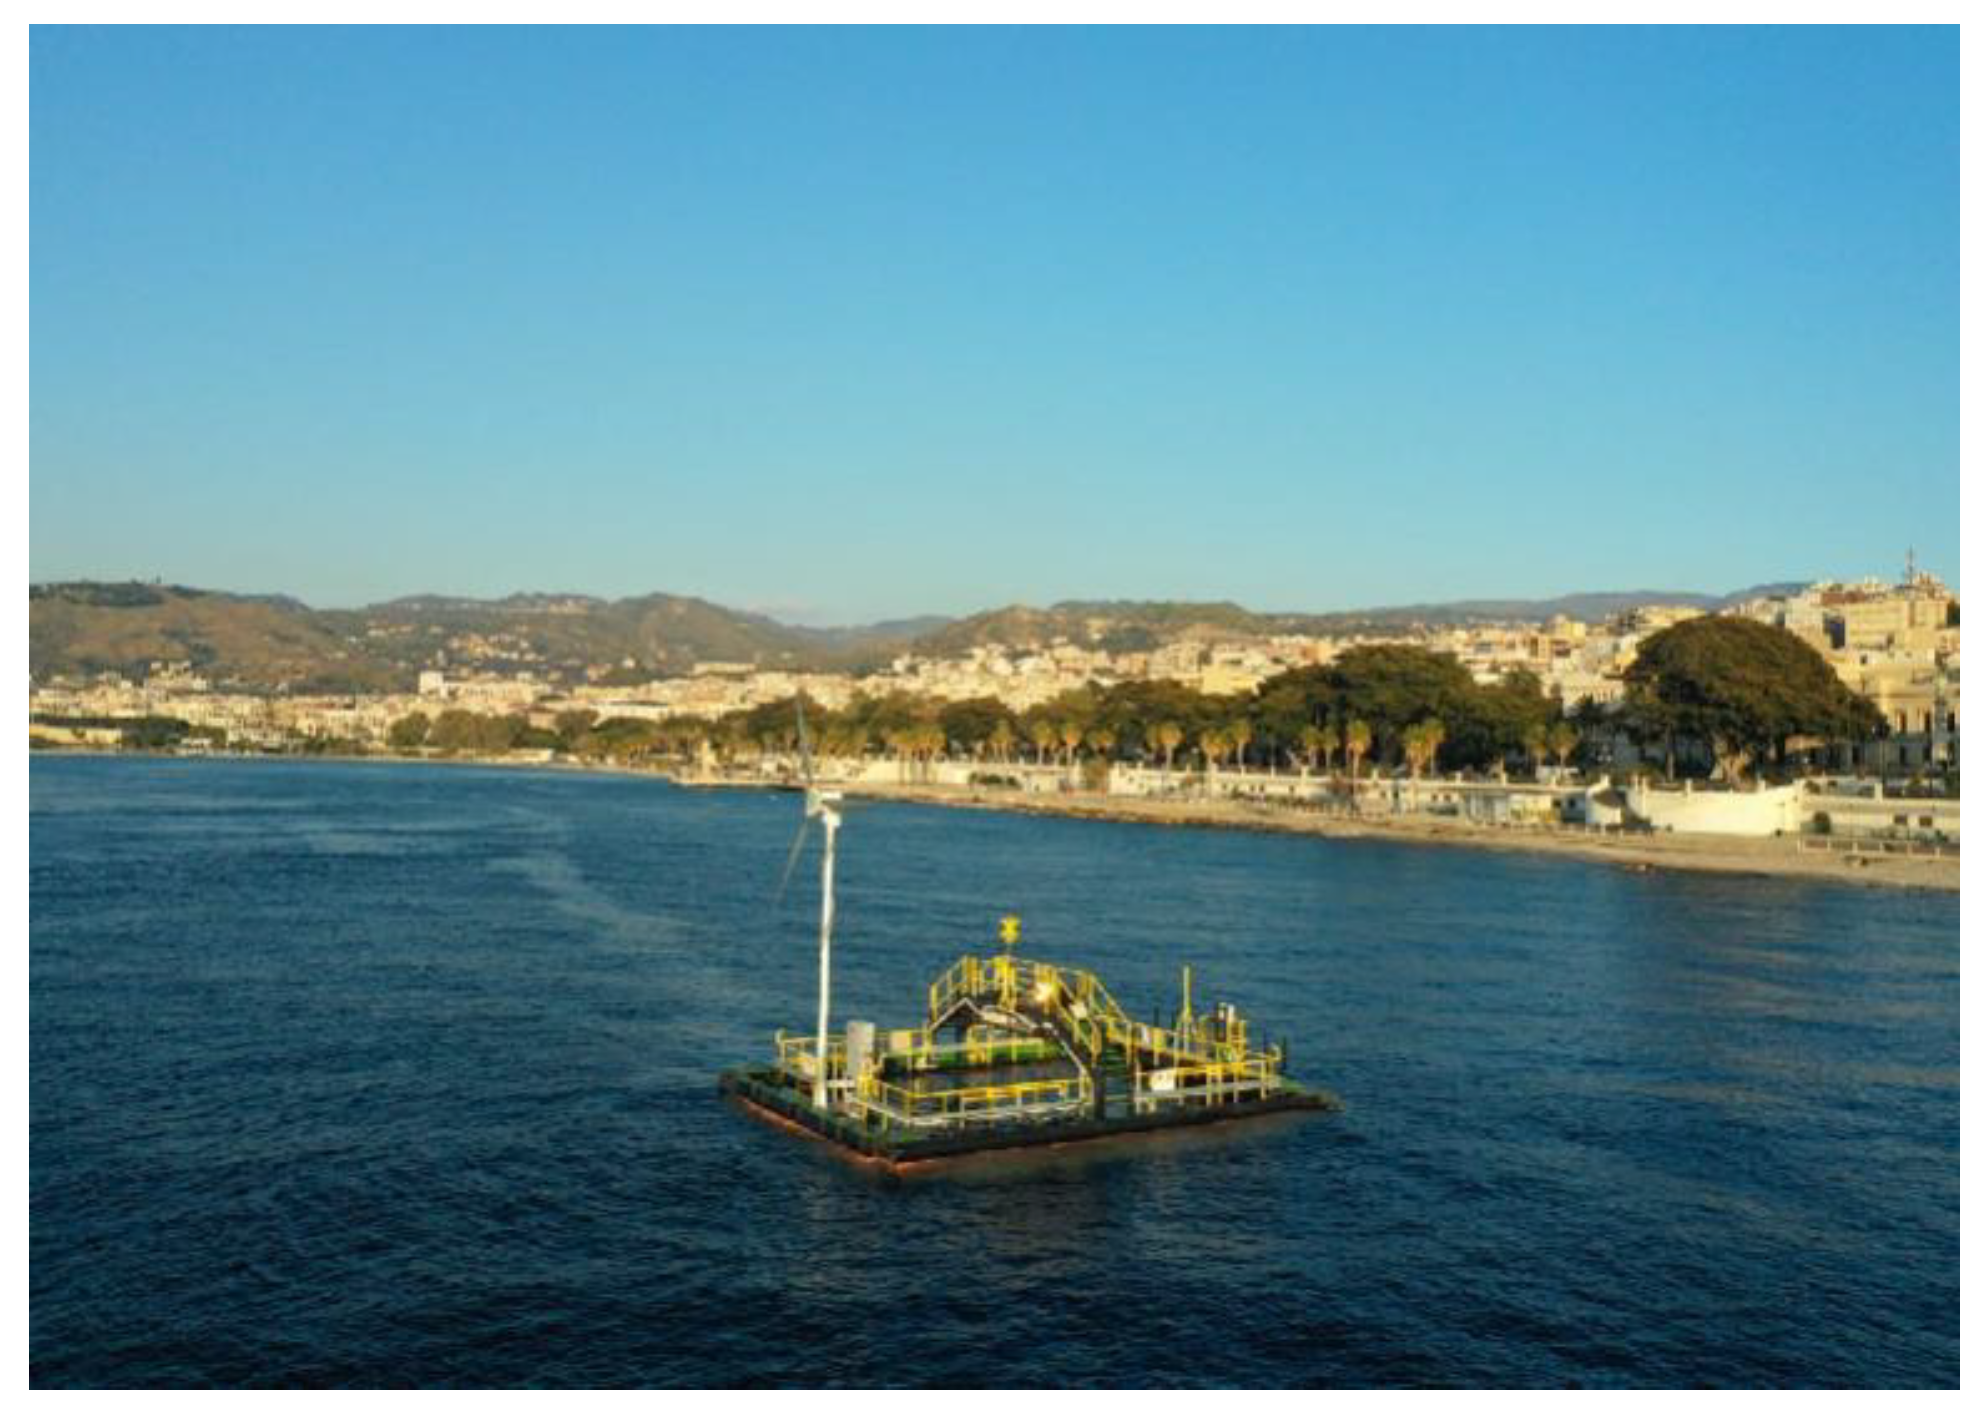
Figure 1.
Outdoor experiment ‘Aurora’ prototype photo (drone view from sea).
Figure 1.
Outdoor experiment ‘Aurora’ prototype photo (drone view from sea).
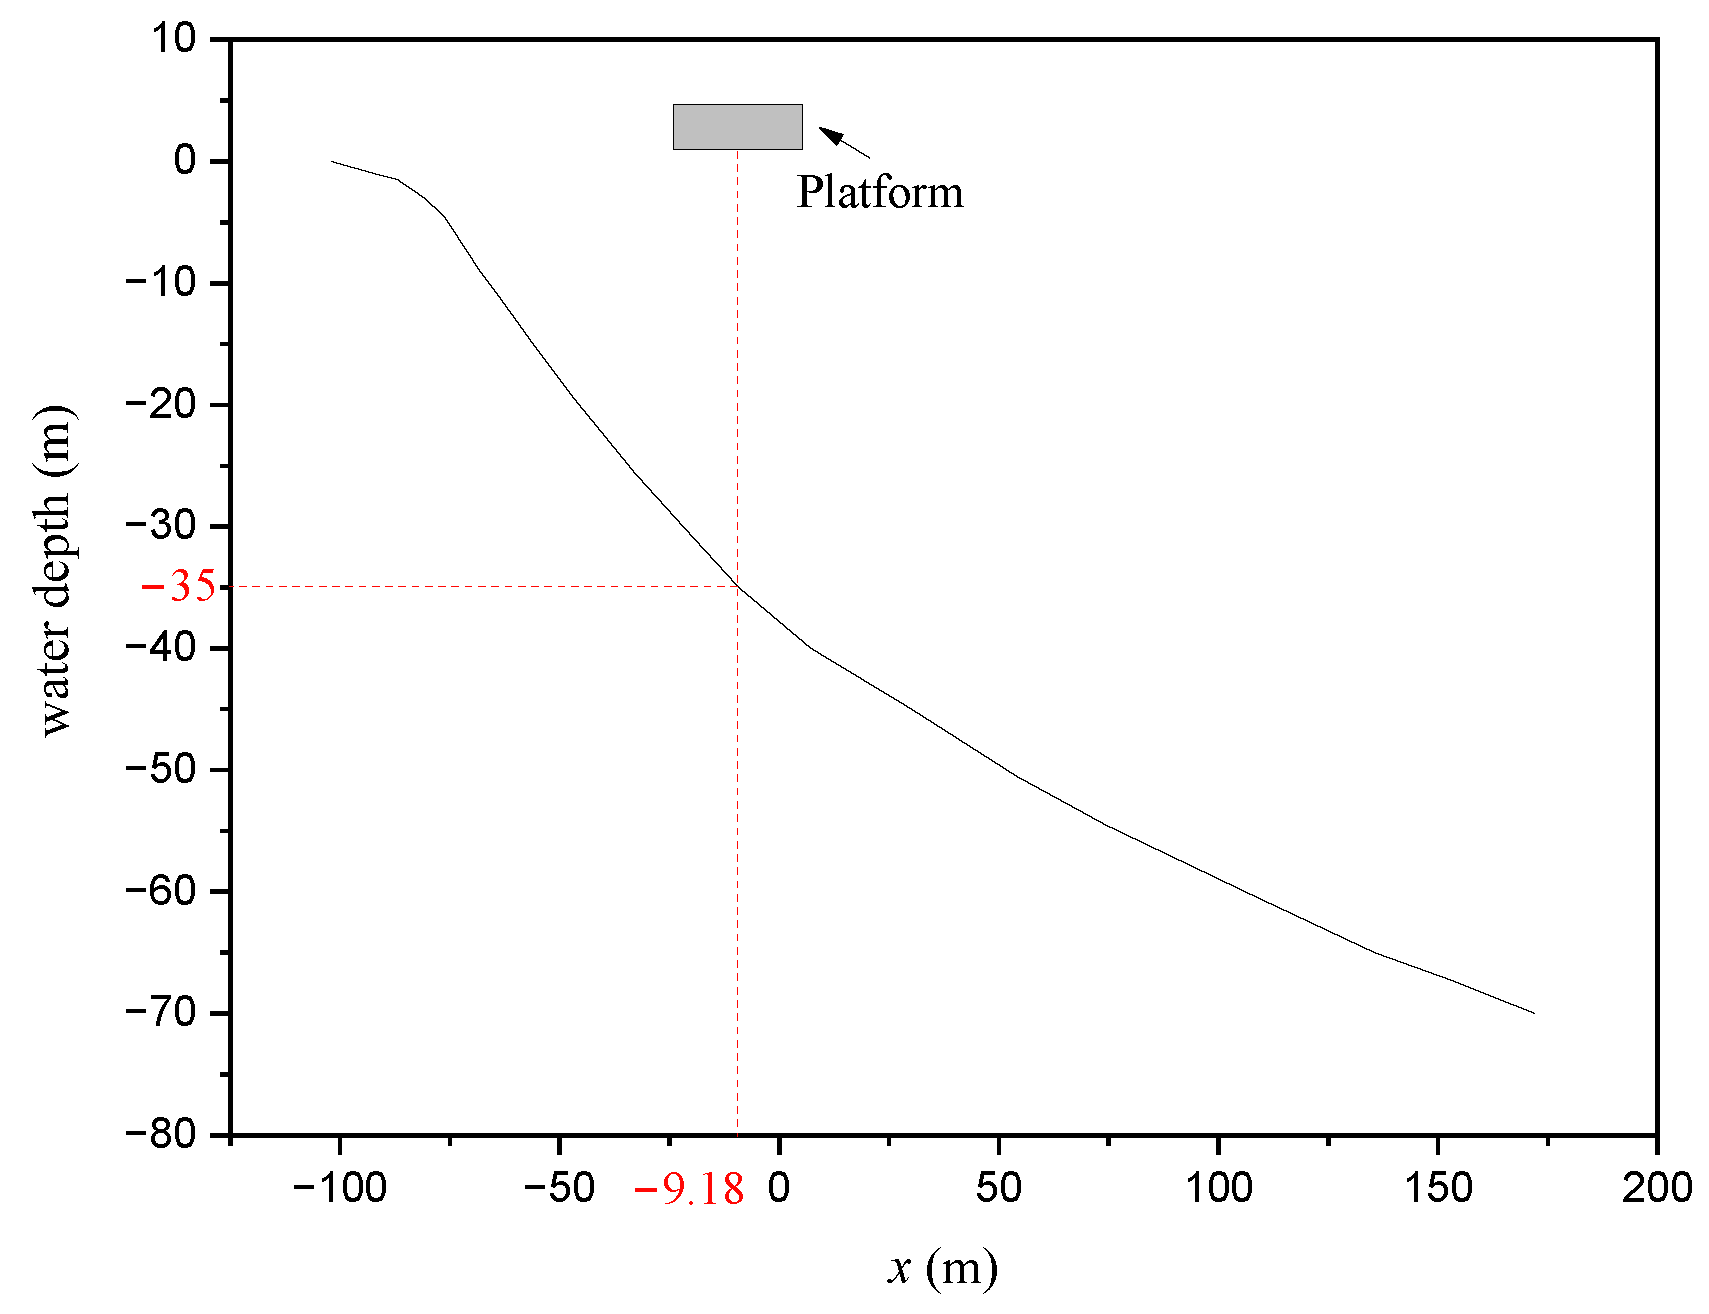
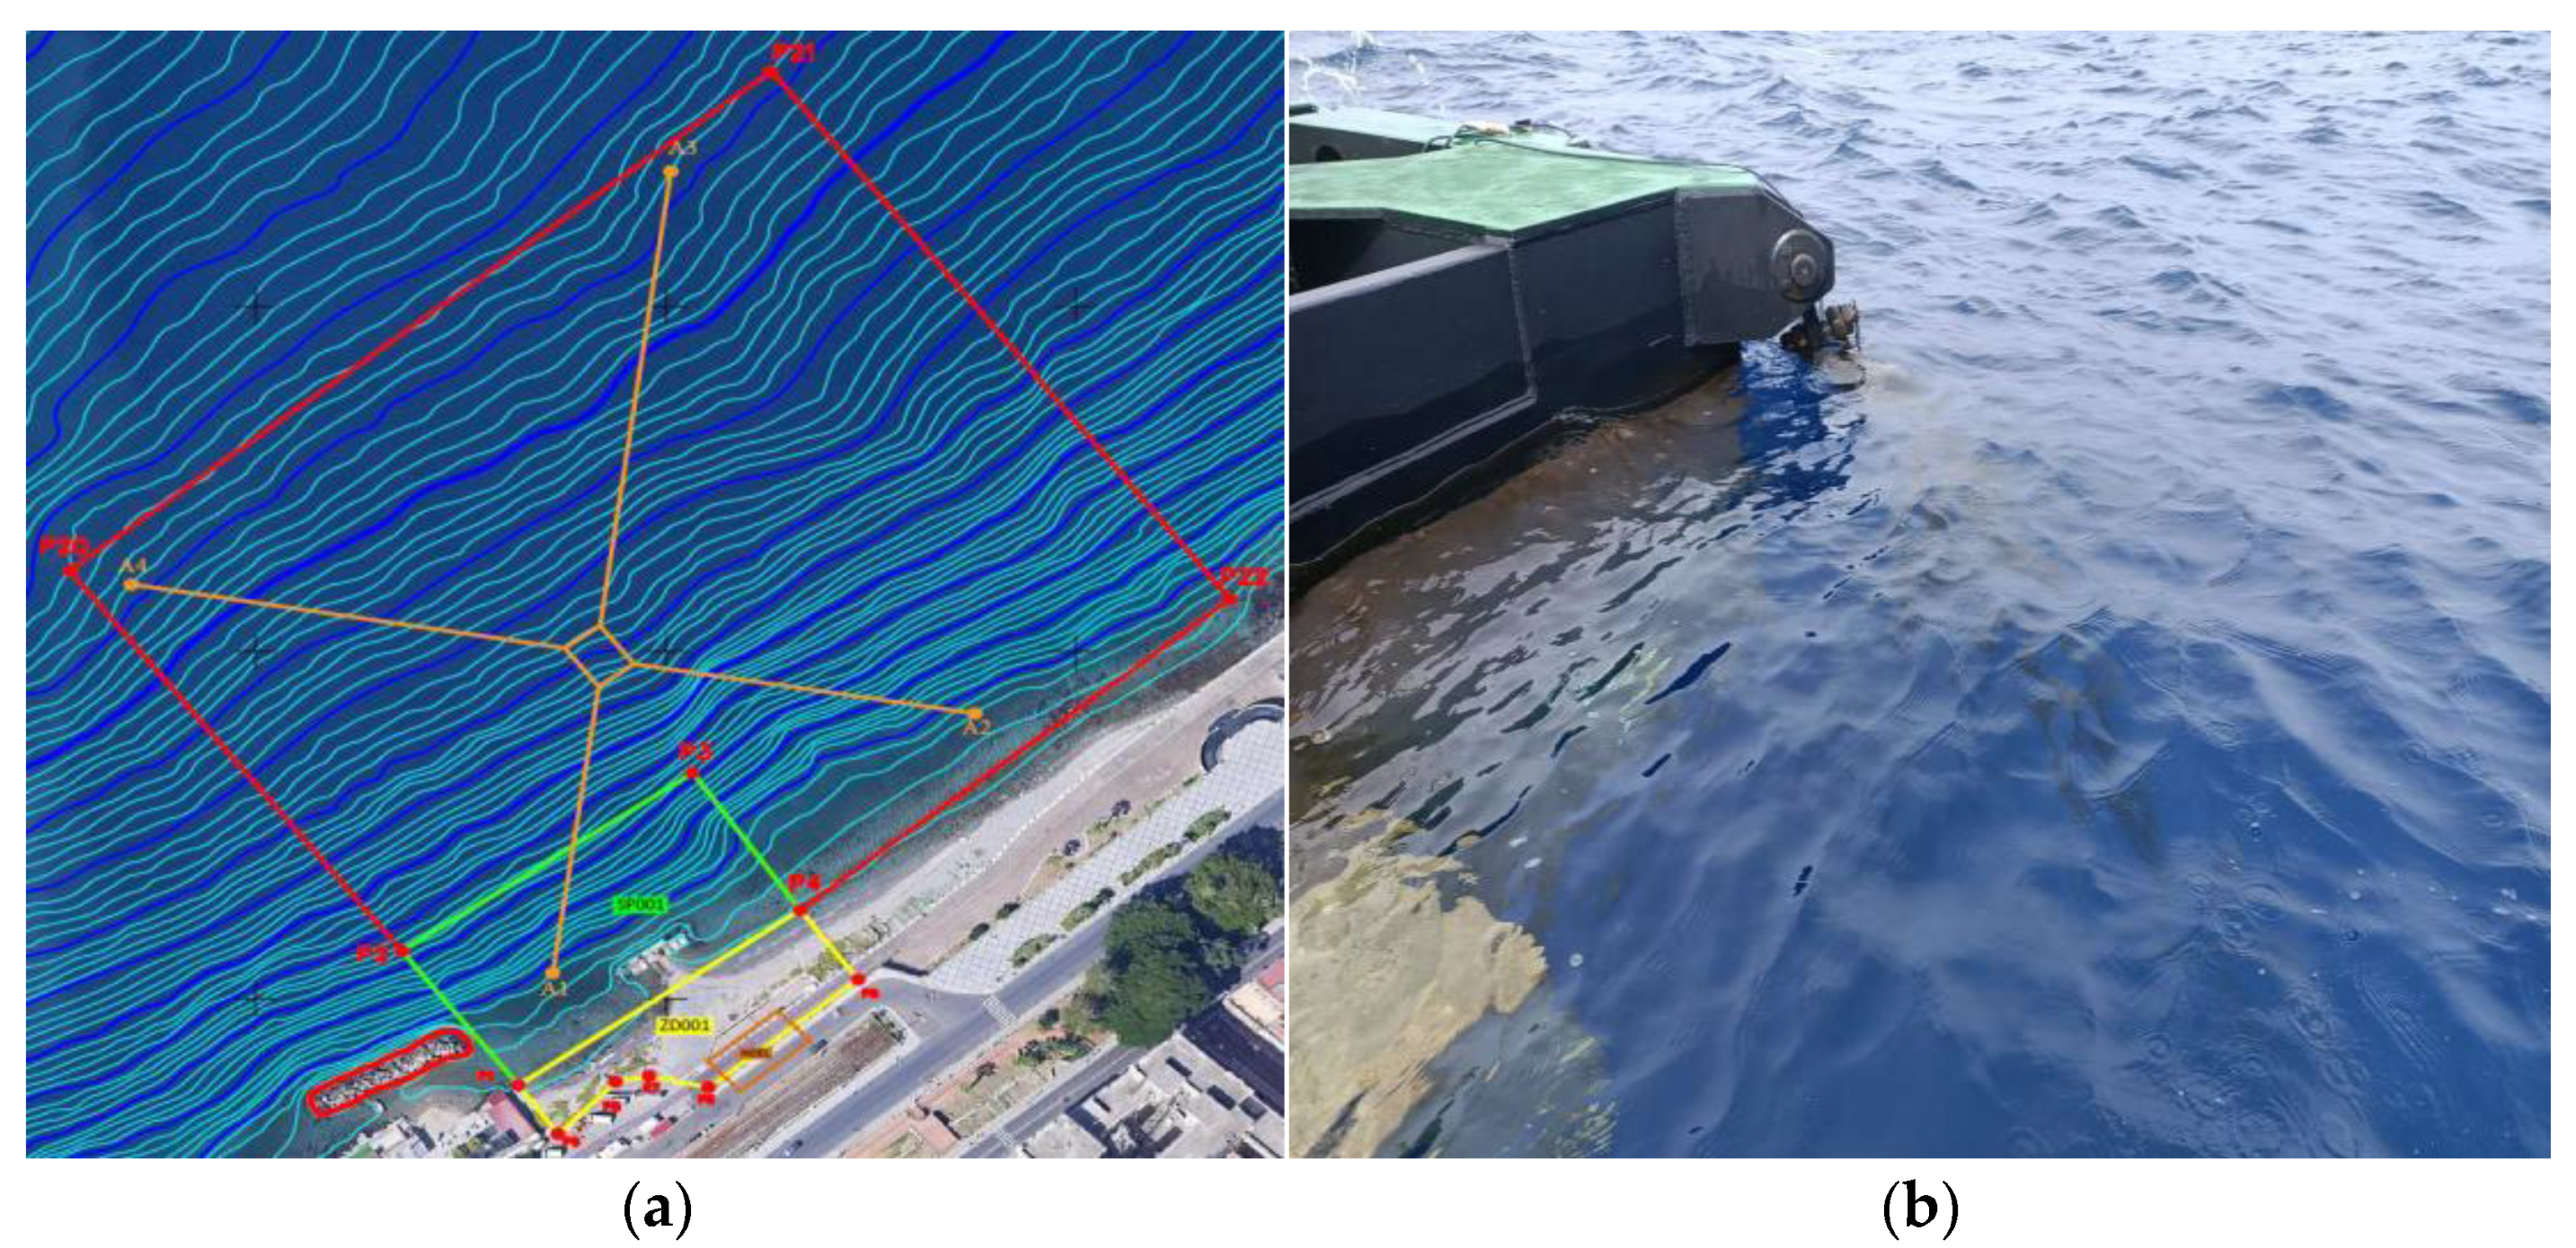
Figure 2.
Experiment region seabed figure.
Figure 2.
Experiment region seabed figure.
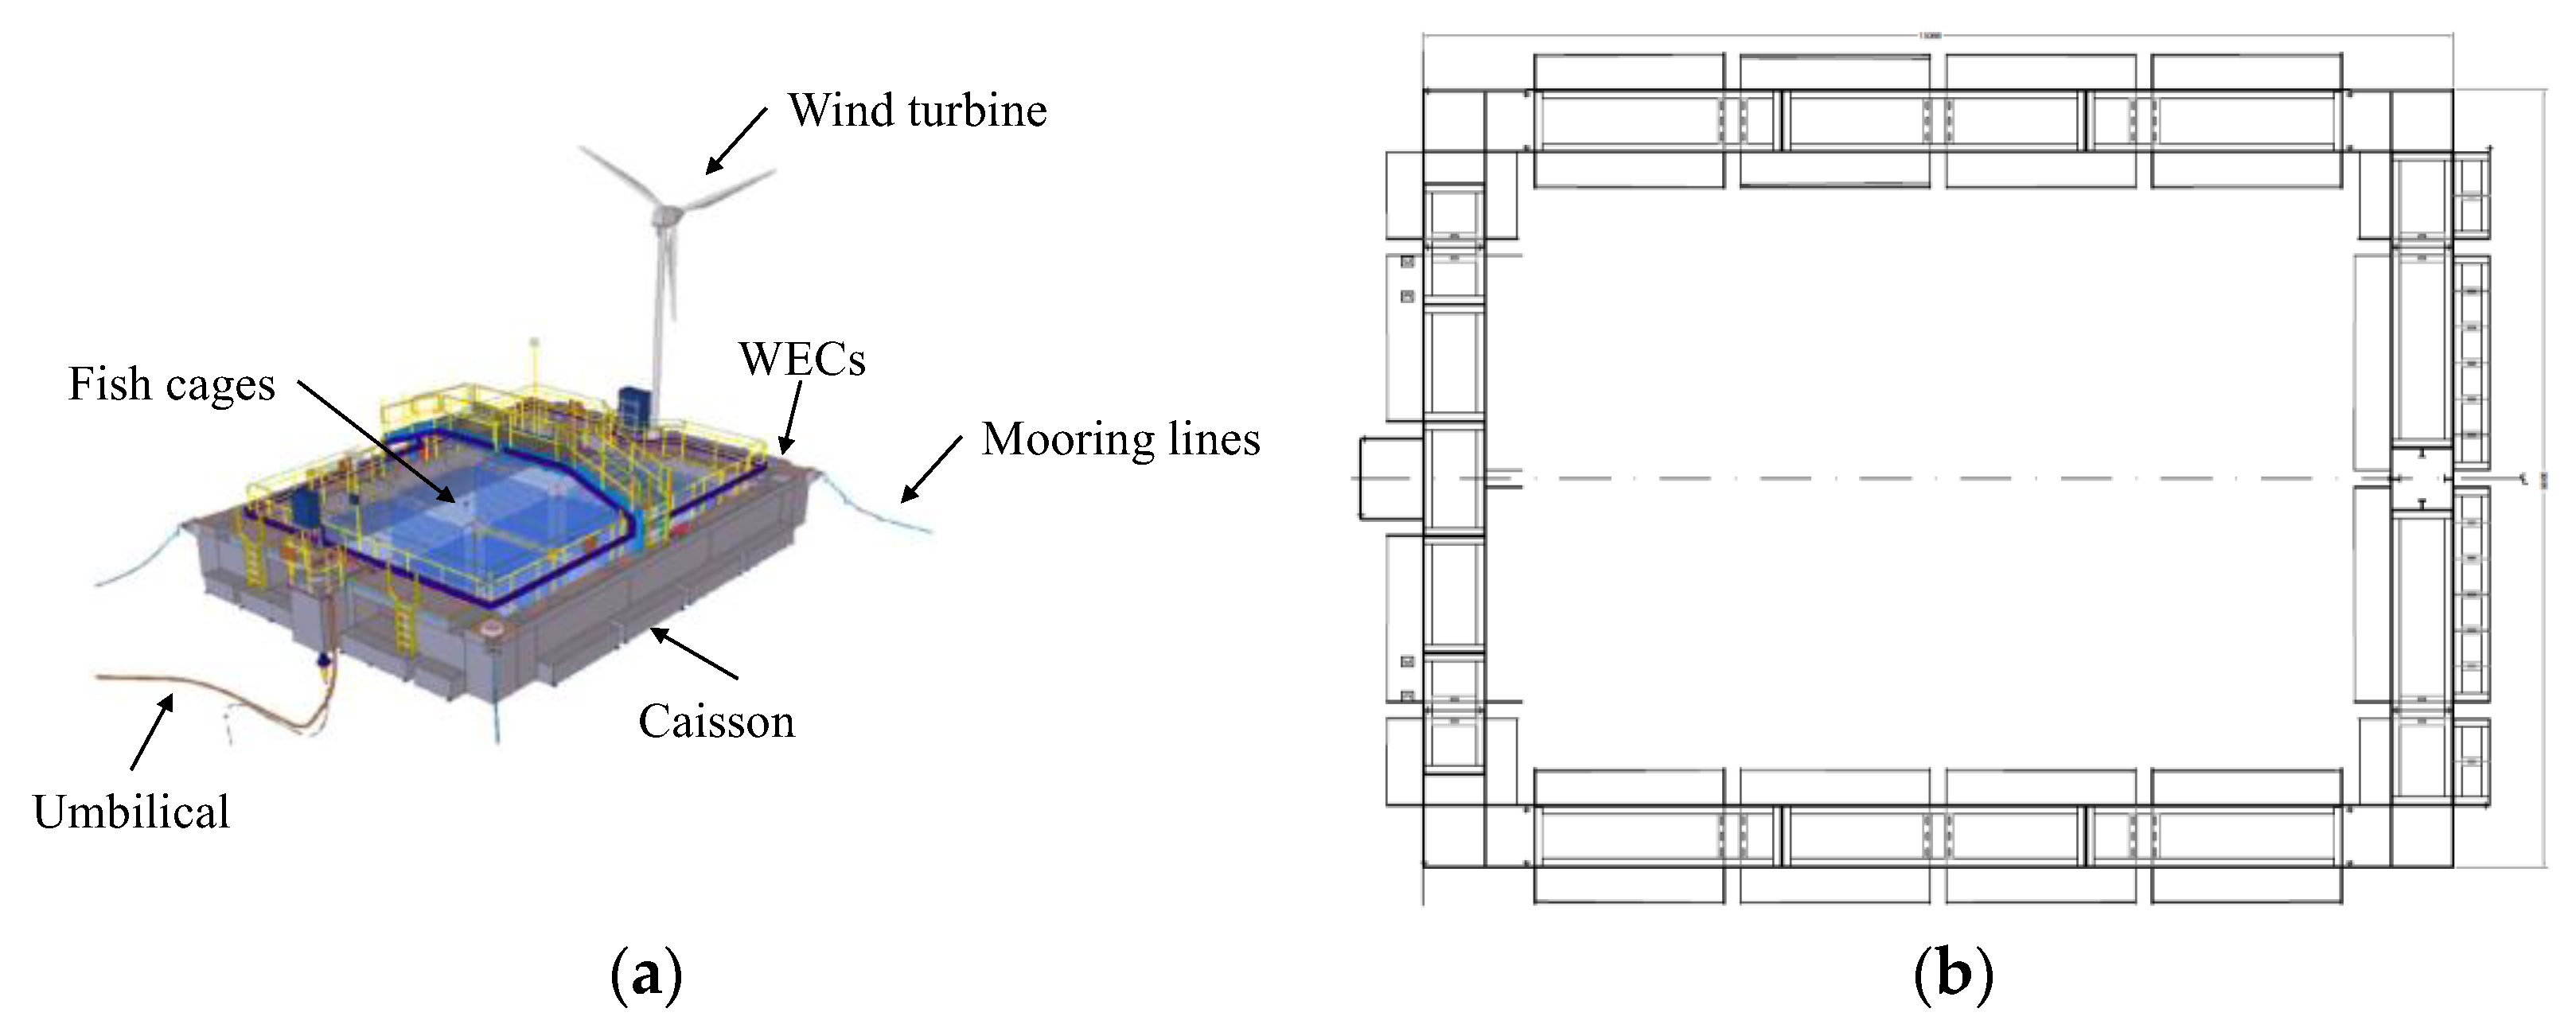
Figure 3.
The outdoor prototype (a) 3D model and (b) sketch of the platform in the top view.
Figure 3.
The outdoor prototype (a) 3D model and (b) sketch of the platform in the top view.
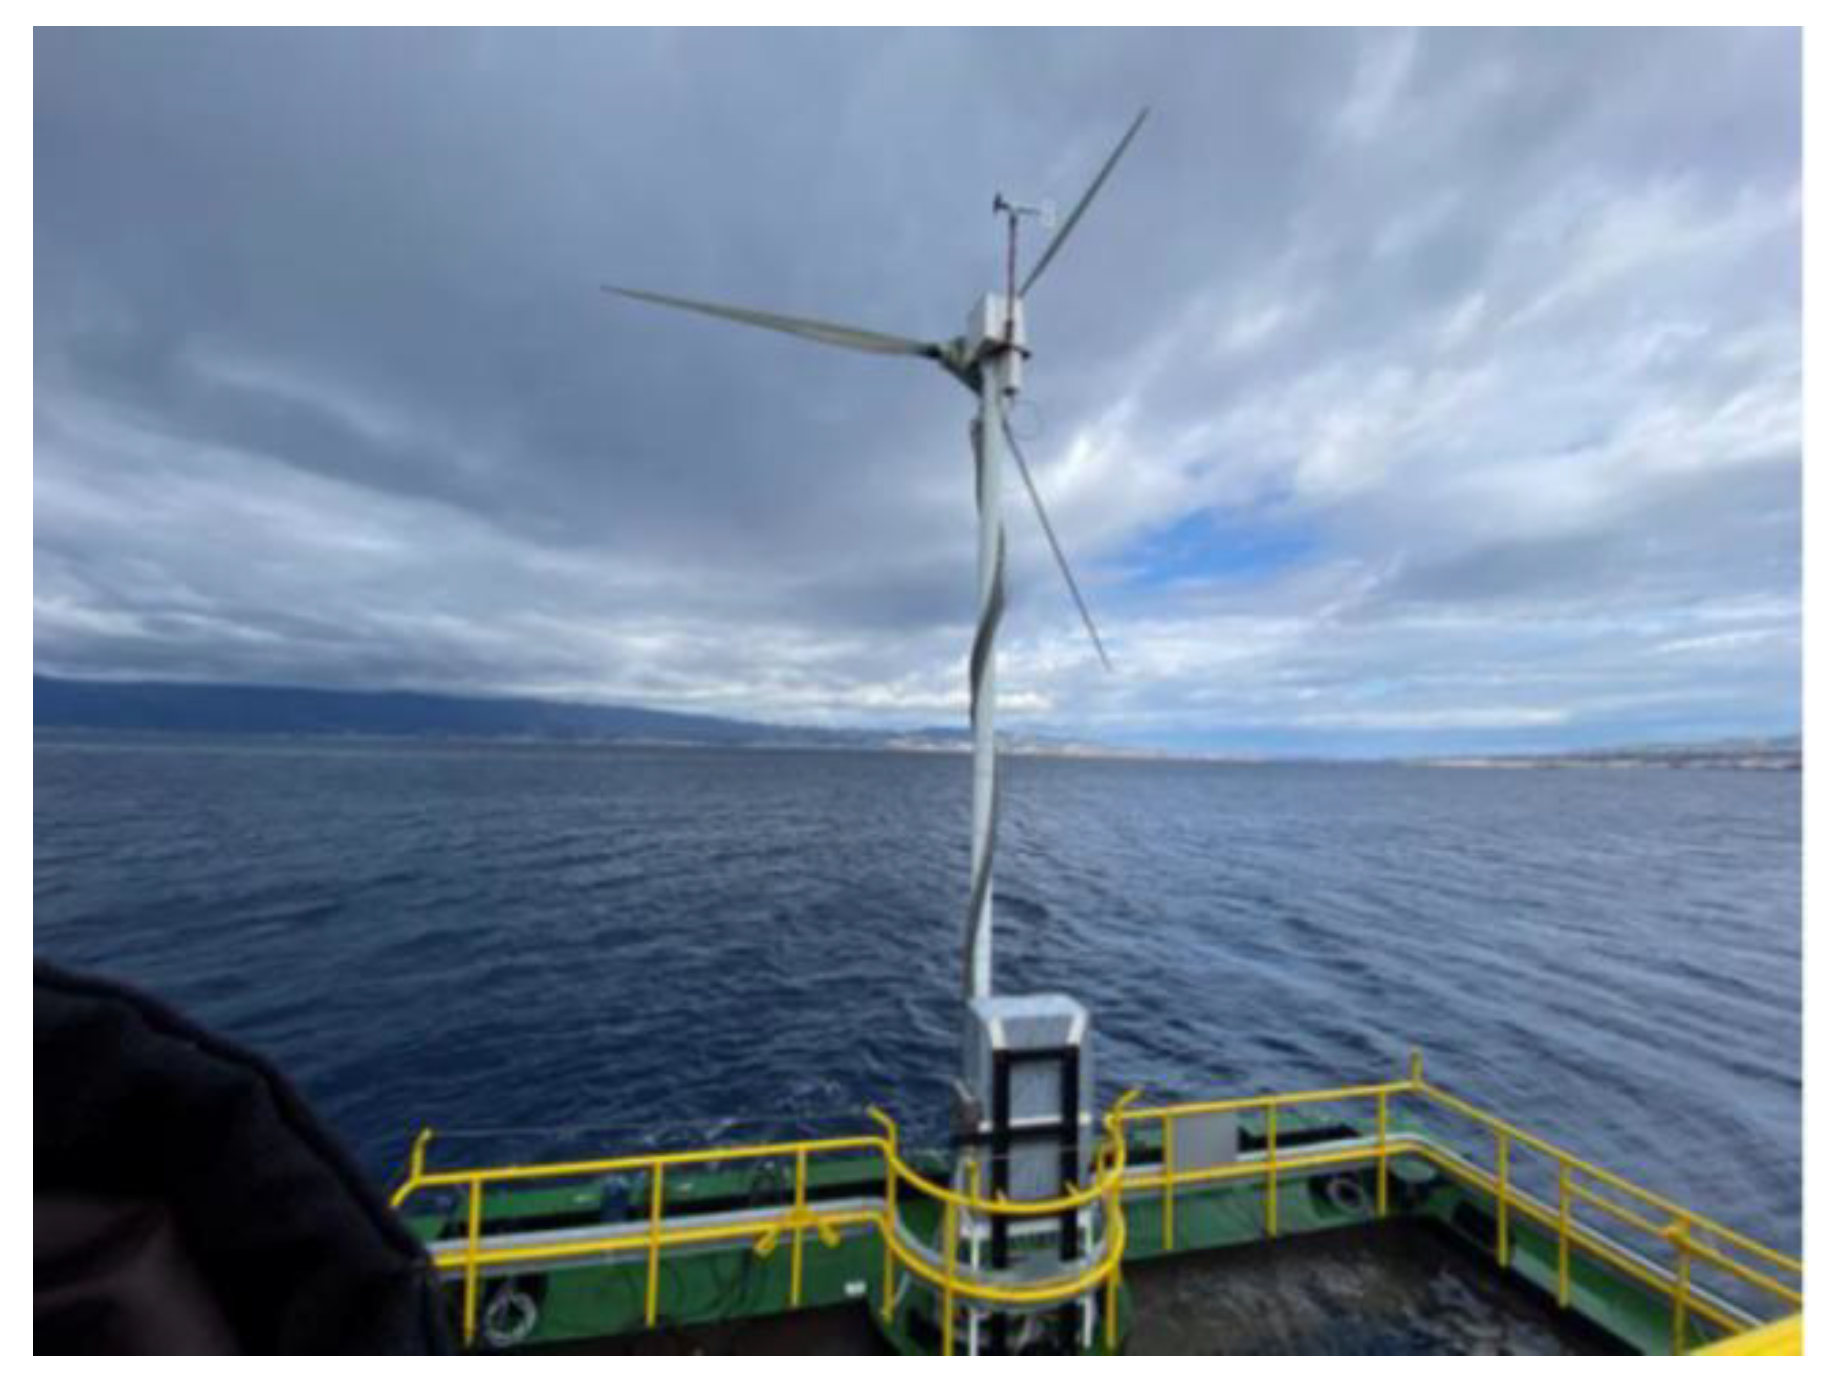
Figure 4.
The 1:15 scaled wind turbine installed on the platform.
Figure 4.
The 1:15 scaled wind turbine installed on the platform.
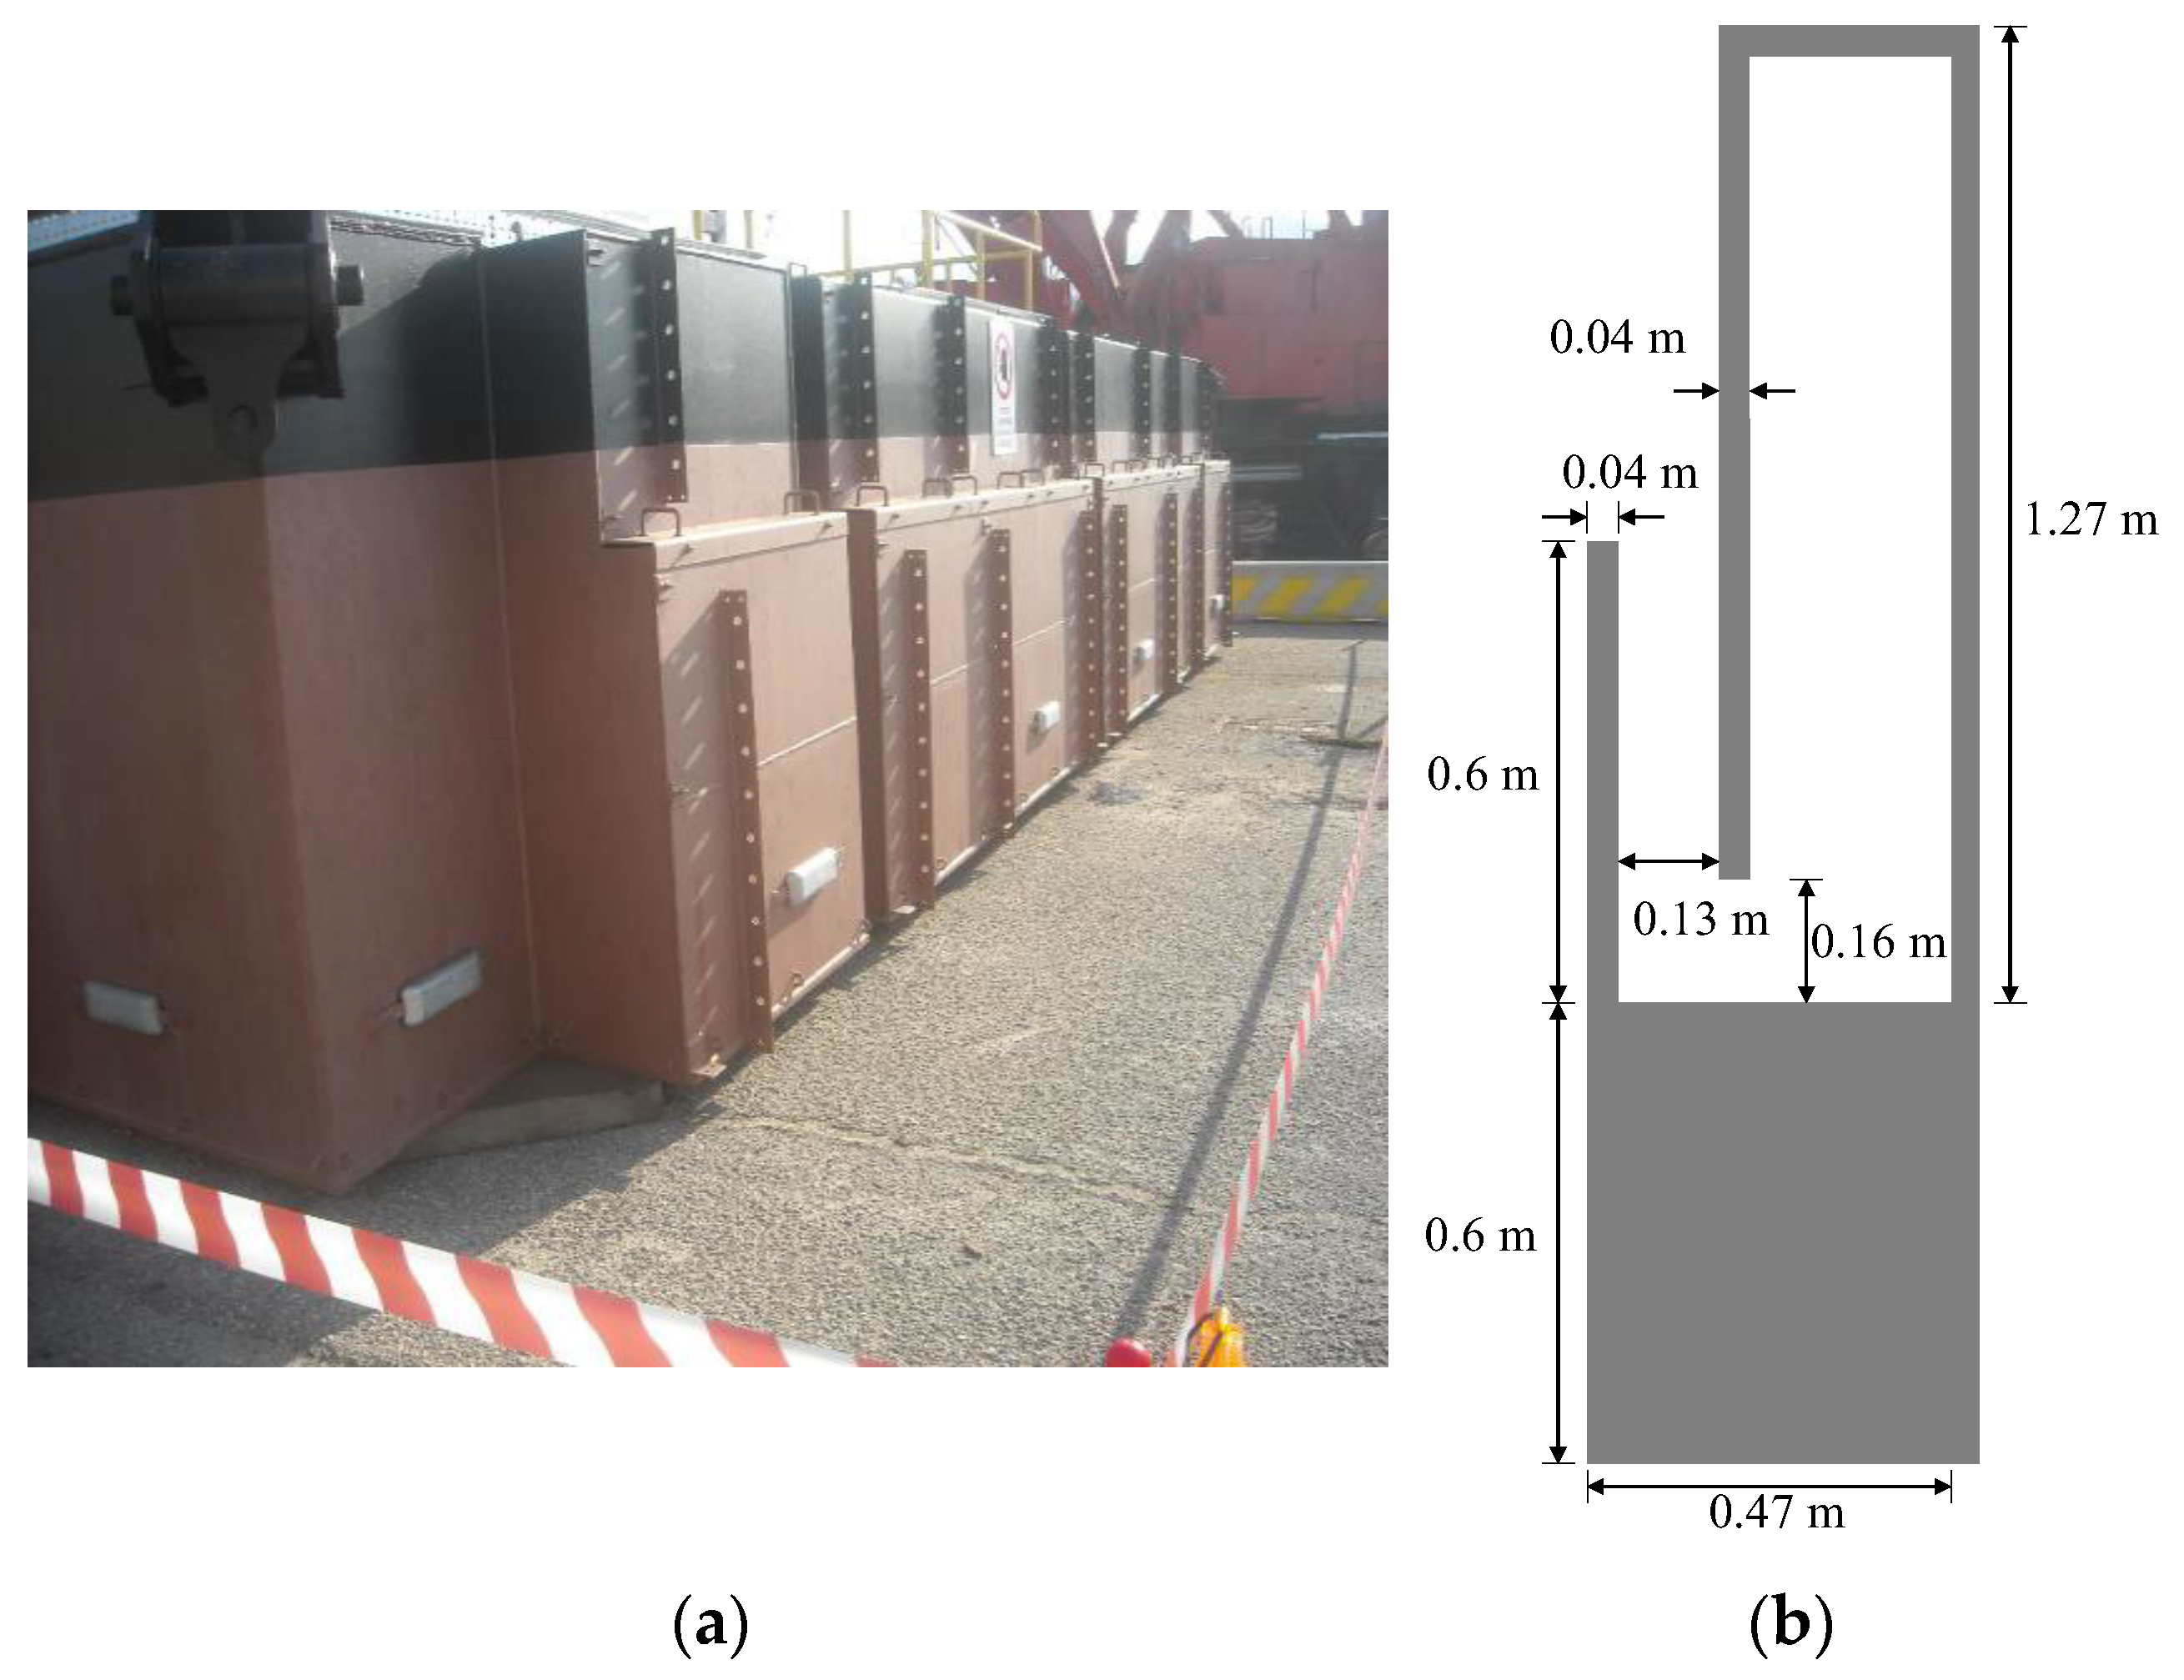
Figure 5.
WECs in closed configuration, (a) the outdoor experiment and (b) geometry dimensions.
Figure 5.
WECs in closed configuration, (a) the outdoor experiment and (b) geometry dimensions.
Figure 6.
Mooring systems for the outdoor experiment: (a) layout of the mooring lines zone and (b) Fairlead at the corner of the platform.
Figure 6.
Mooring systems for the outdoor experiment: (a) layout of the mooring lines zone and (b) Fairlead at the corner of the platform.
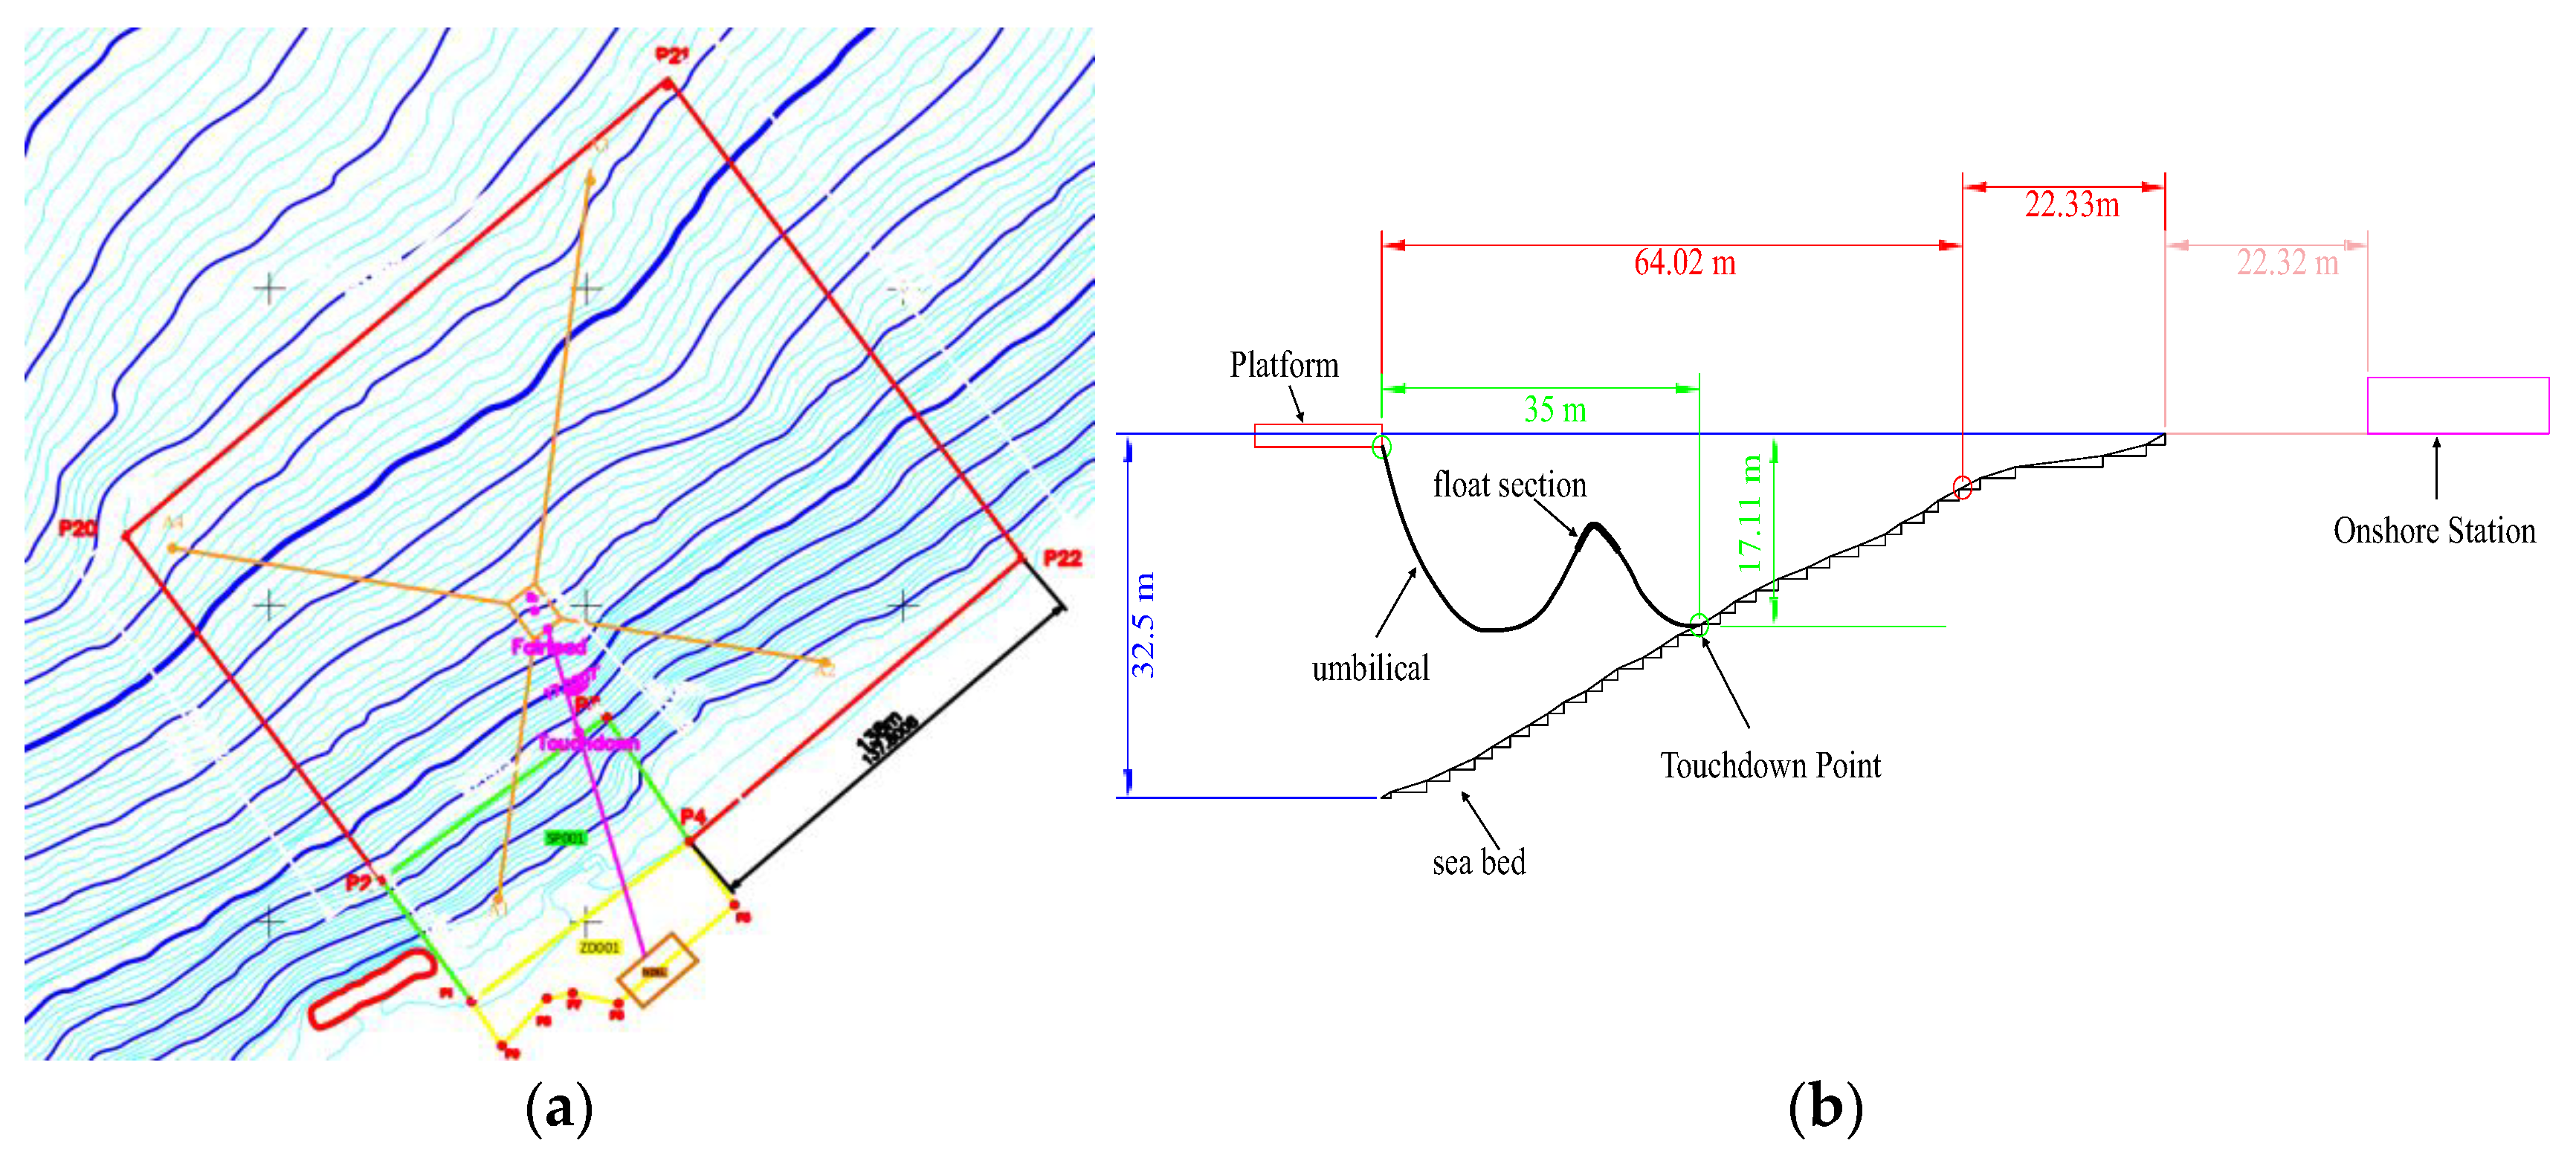
Figure 7.
Layout of the umbilical for (a) general description and (b) dimensions in side view.
Figure 7.
Layout of the umbilical for (a) general description and (b) dimensions in side view.
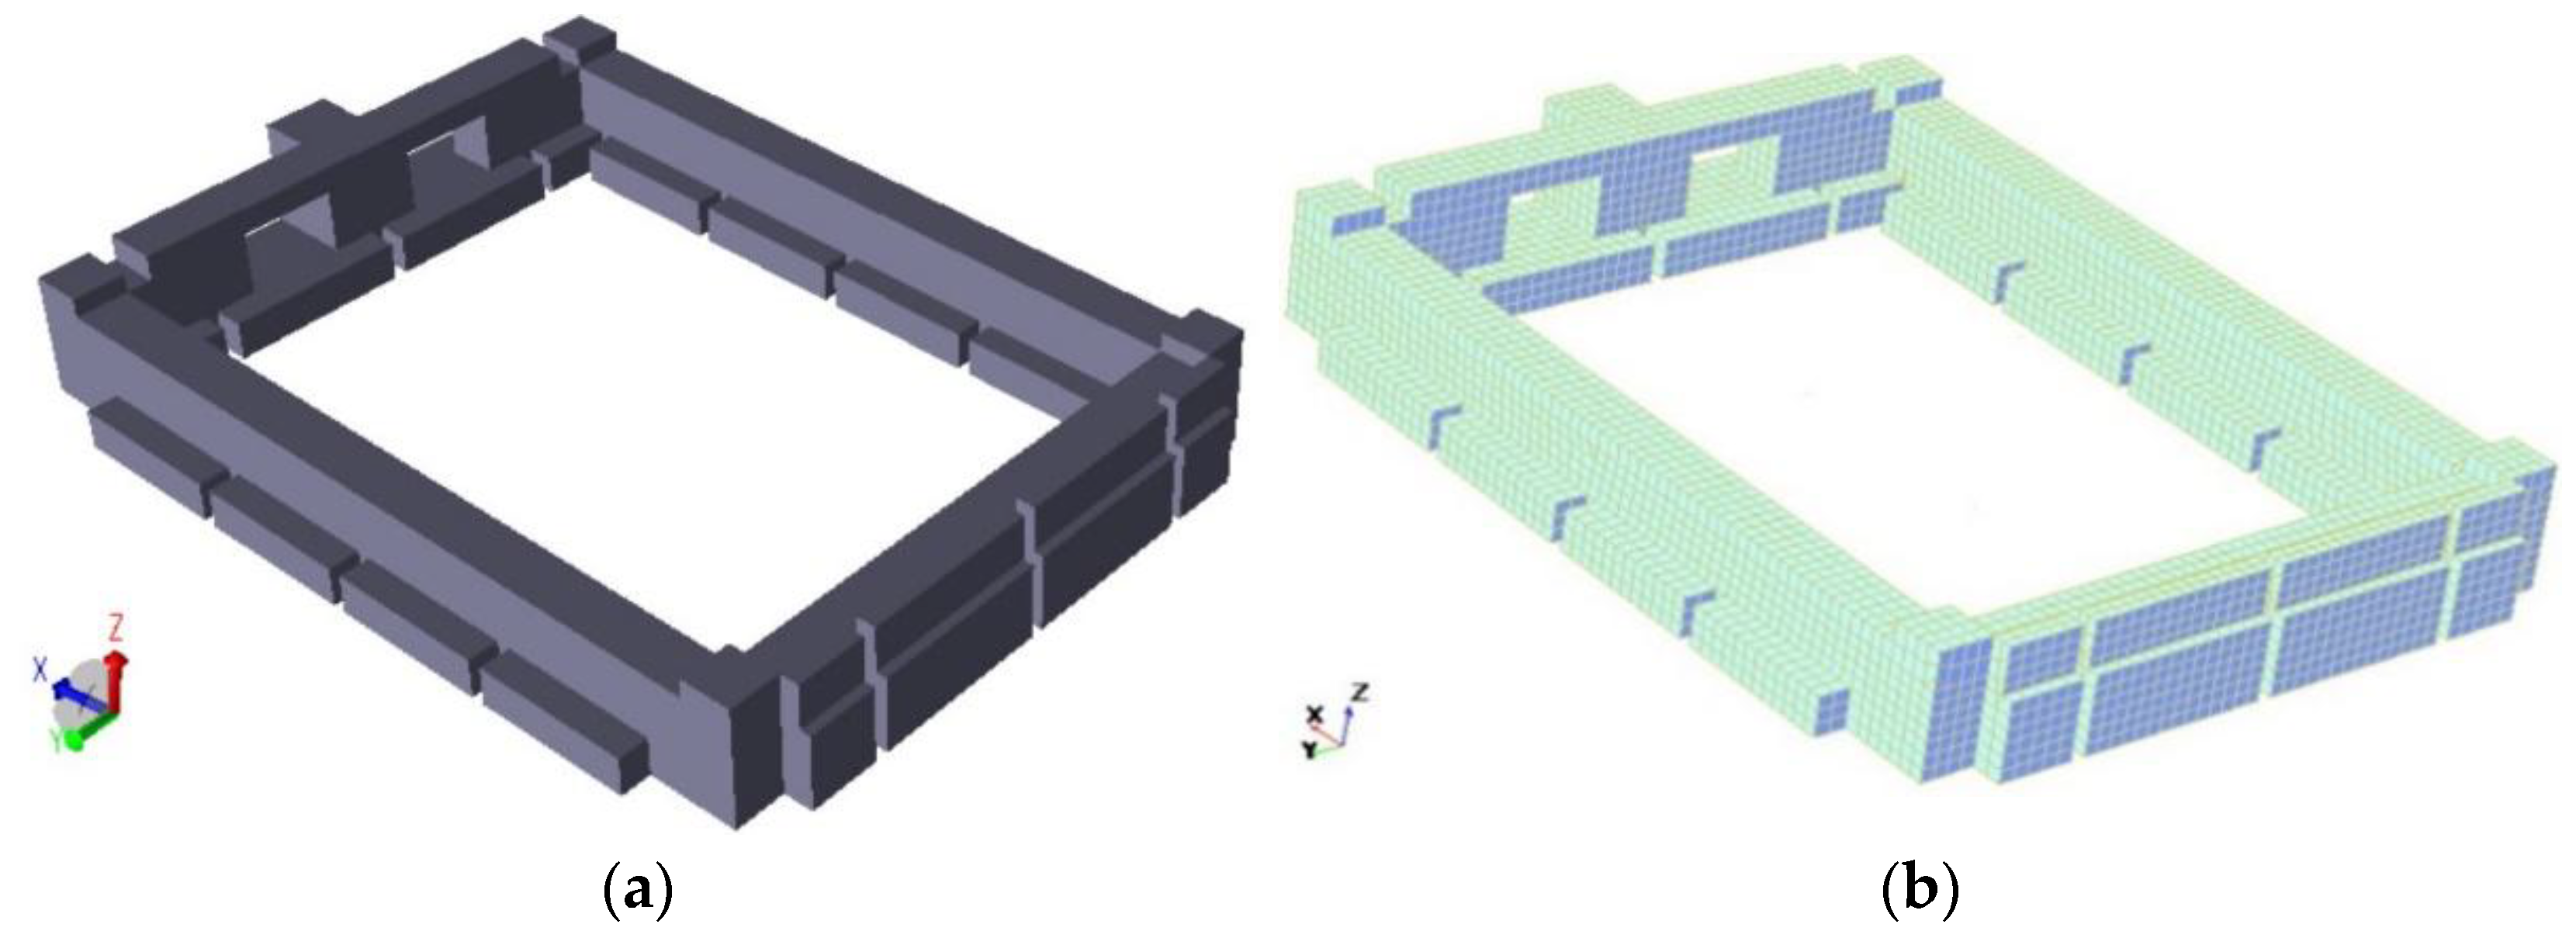
Figure 8.
Closed WEC chamber configuration (a) panel model and (b) FEM model.
Figure 8.
Closed WEC chamber configuration (a) panel model and (b) FEM model.
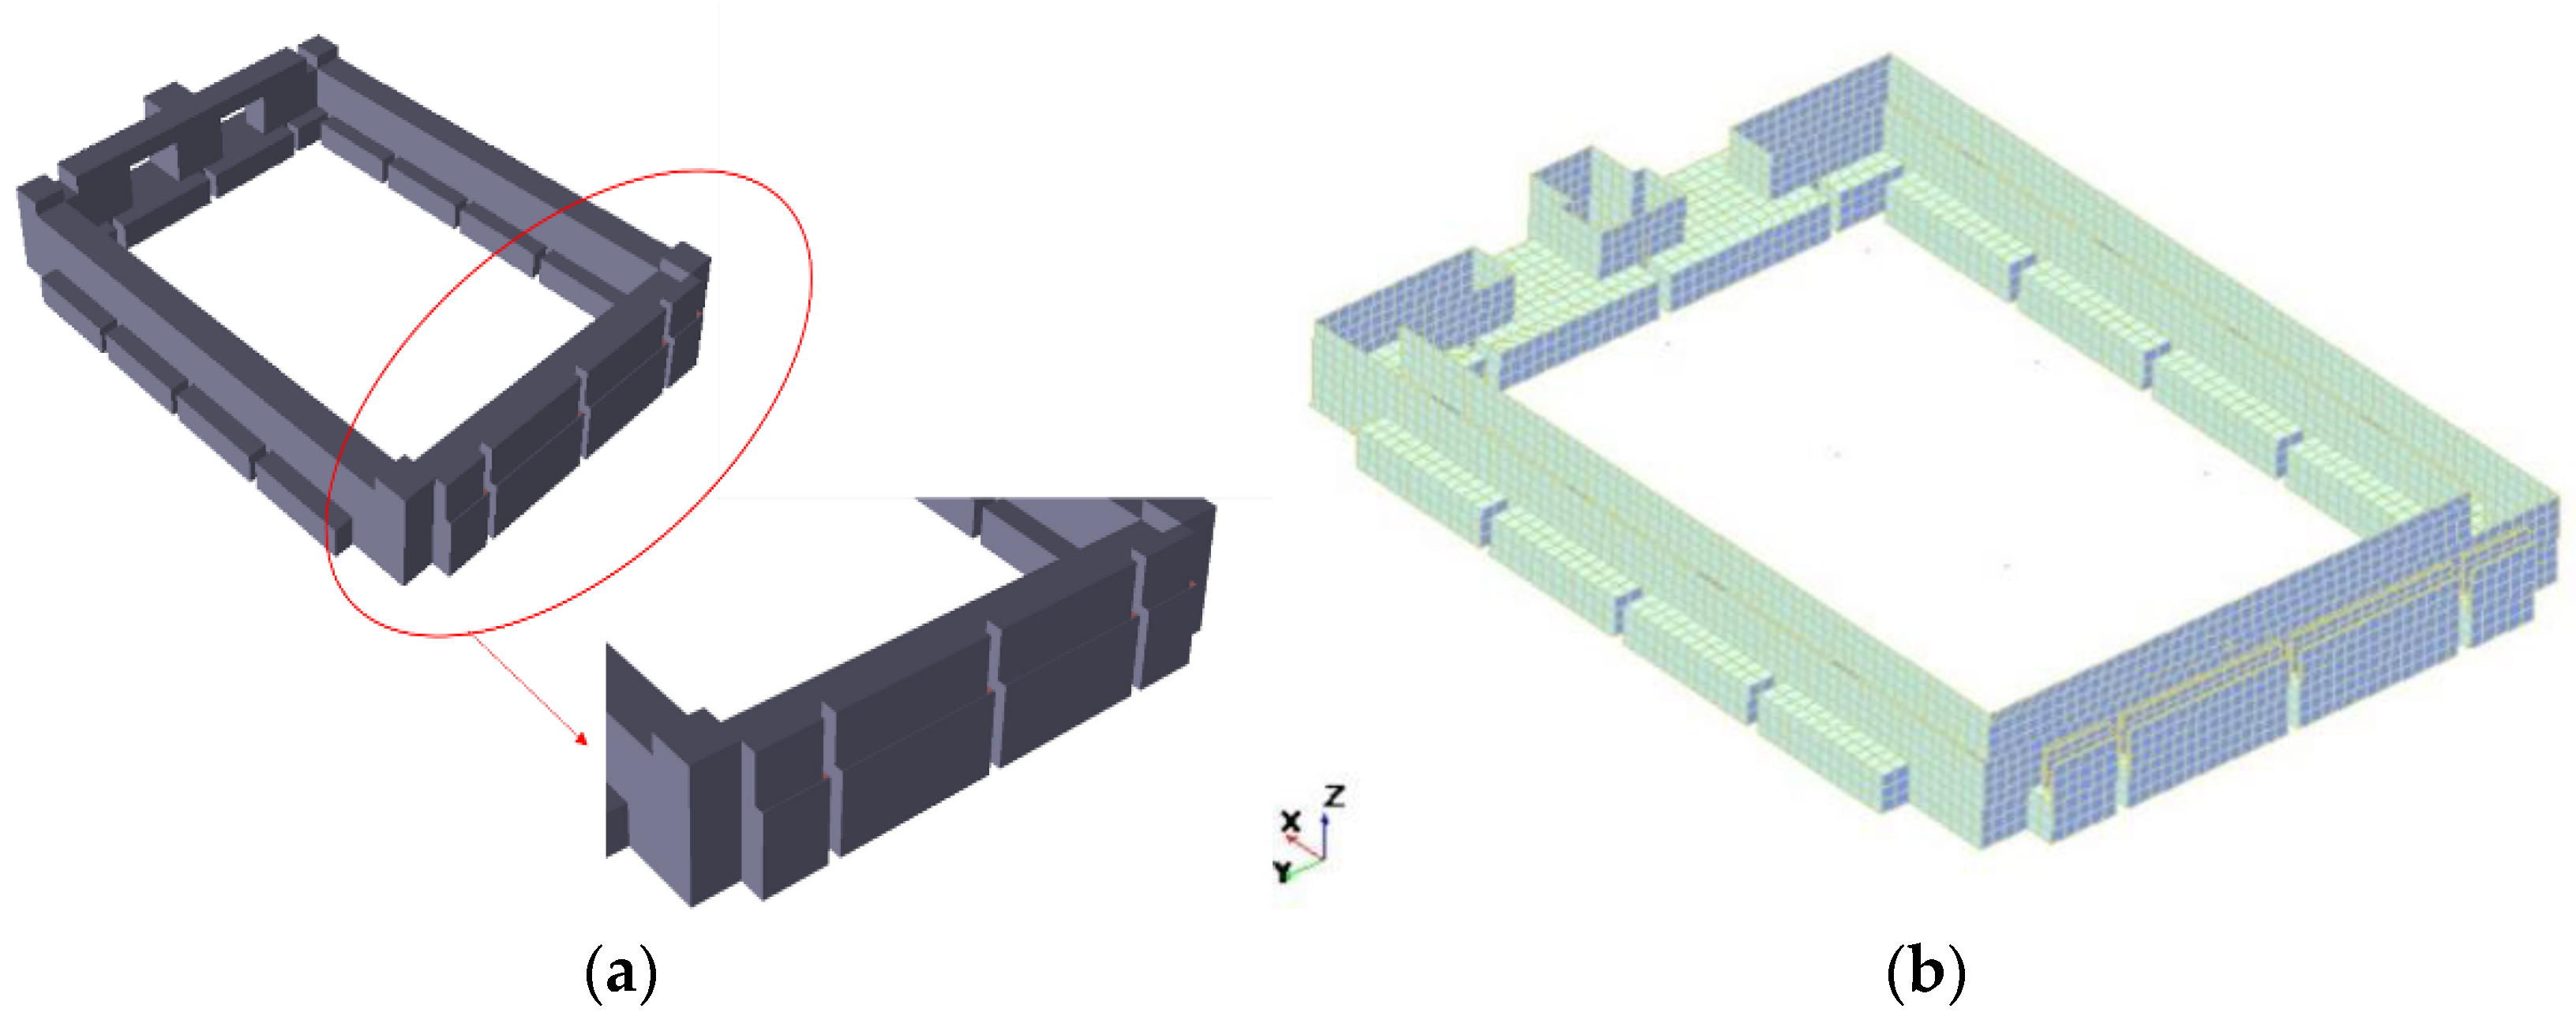
Figure 9.
Open WEC chamber configuration (a) panel model and (b) FEM model.
Figure 9.
Open WEC chamber configuration (a) panel model and (b) FEM model.
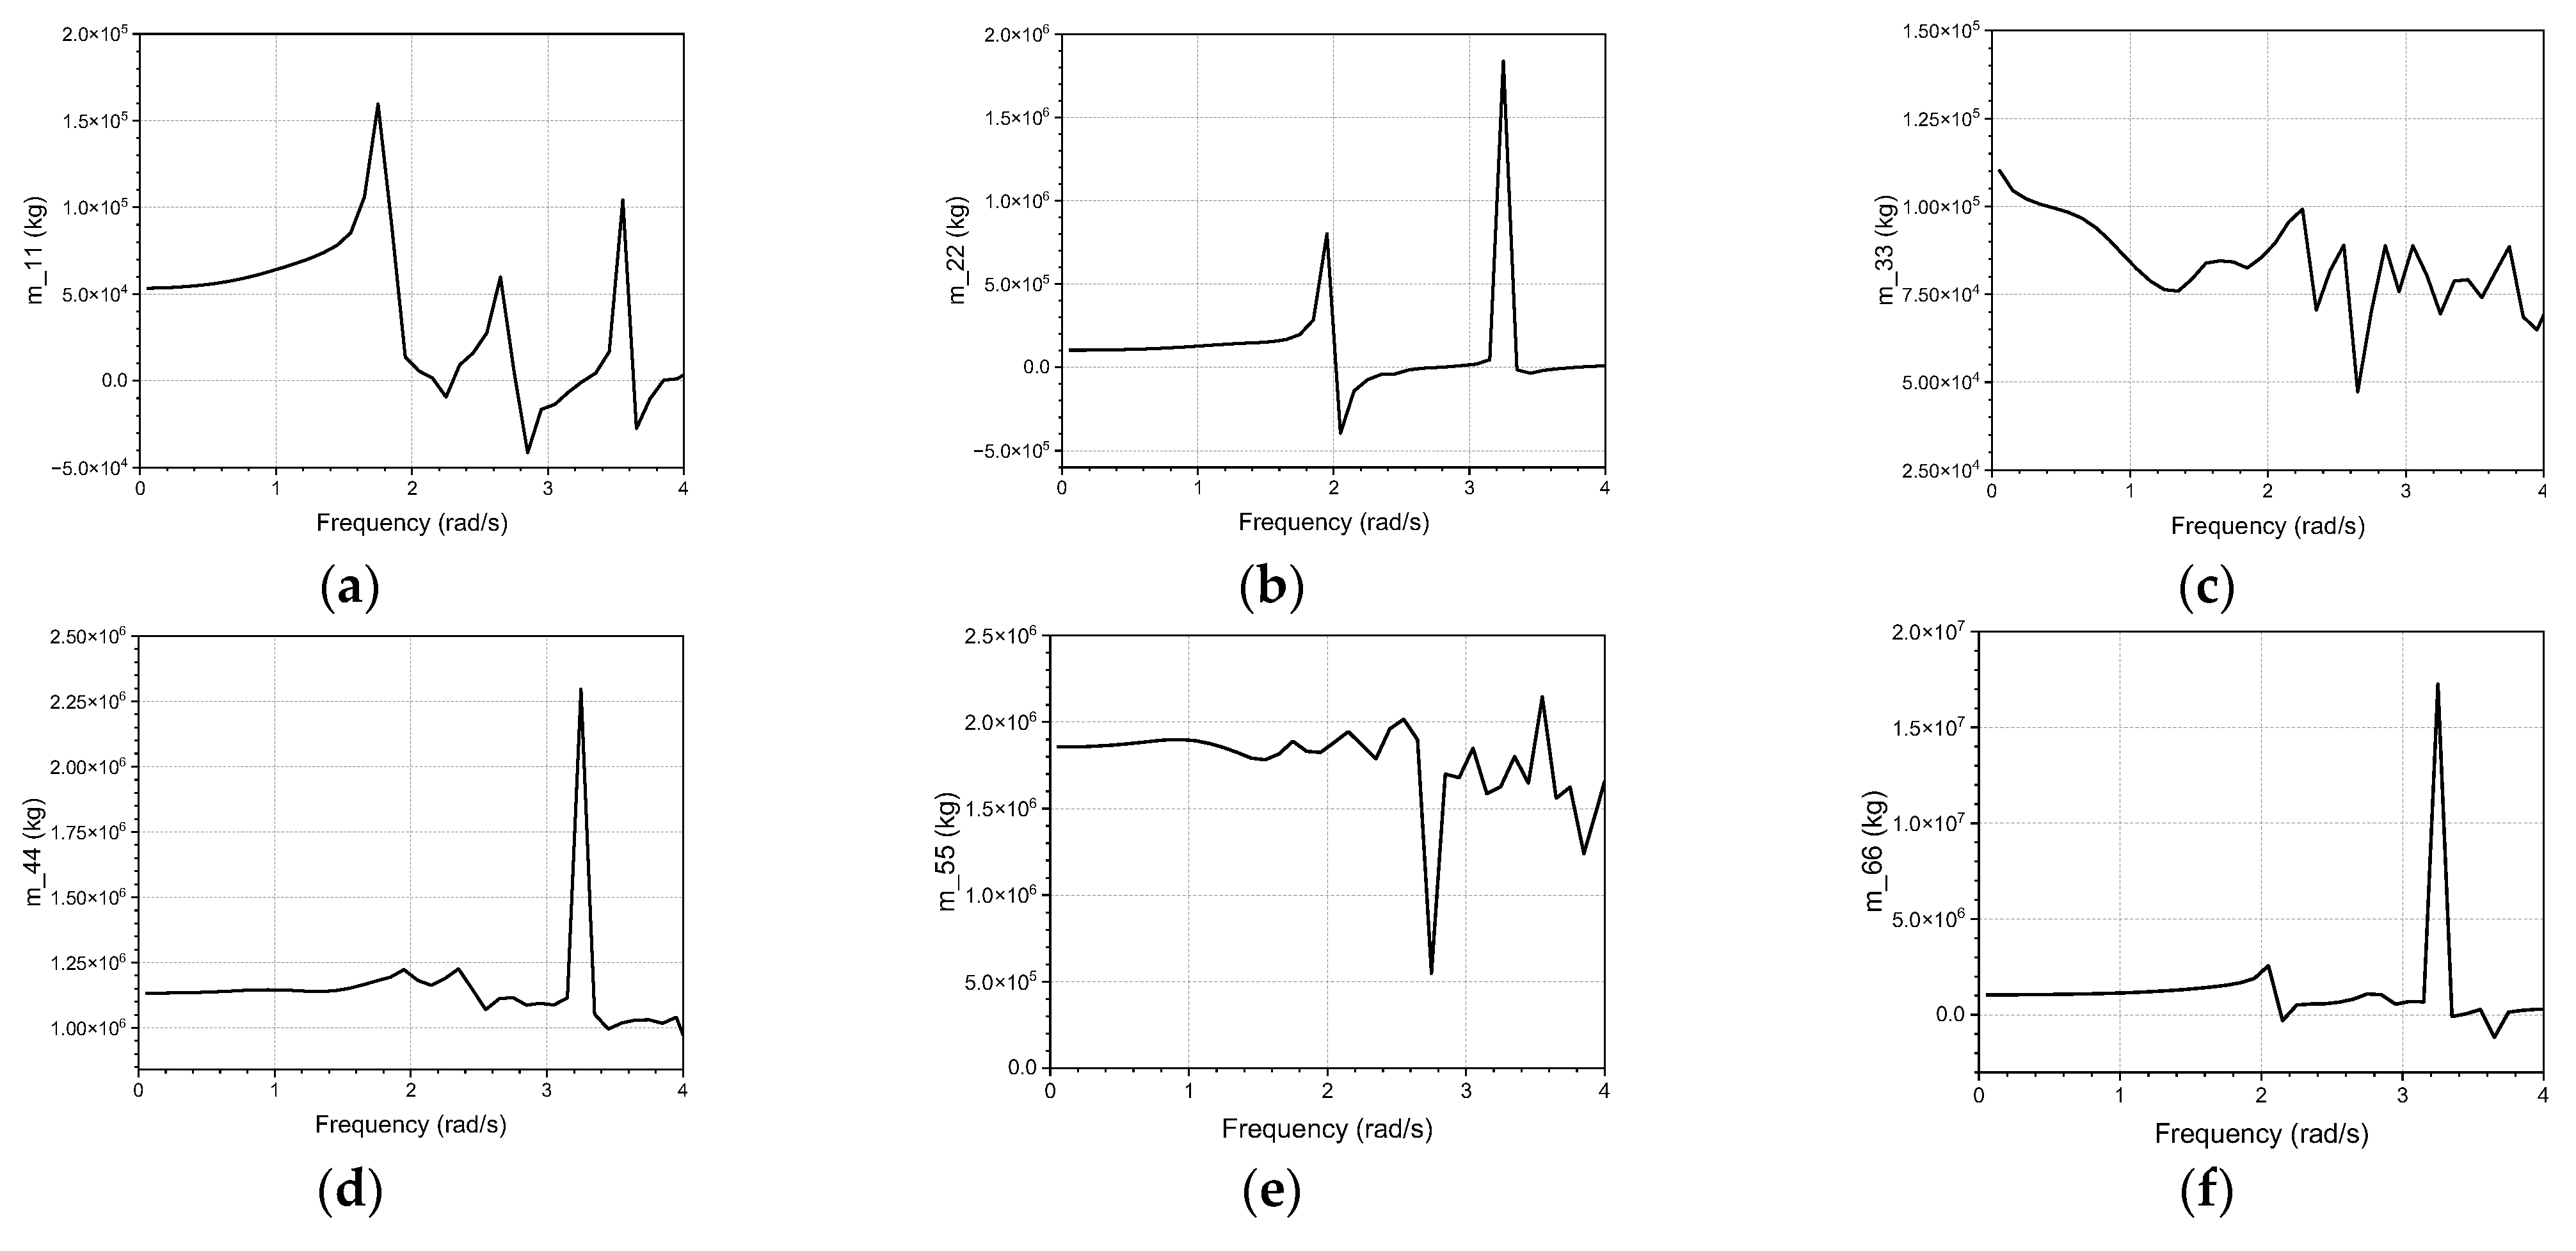
Figure 10.
Added mass for the closed WEC chambers configuration. (a) Added mass of surge-surge for the closed WEC. (b) Added mass of sway-sway for the closed WEC. (c) Added mass of heave-heave for the closed WEC. (d) Added mass of roll-roll for the closed WEC. (e) Added mass of pitch-pitch for the closed WEC. (f) Added mass of yaw-yaw for the closed WEC.
Figure 10.
Added mass for the closed WEC chambers configuration. (a) Added mass of surge-surge for the closed WEC. (b) Added mass of sway-sway for the closed WEC. (c) Added mass of heave-heave for the closed WEC. (d) Added mass of roll-roll for the closed WEC. (e) Added mass of pitch-pitch for the closed WEC. (f) Added mass of yaw-yaw for the closed WEC.
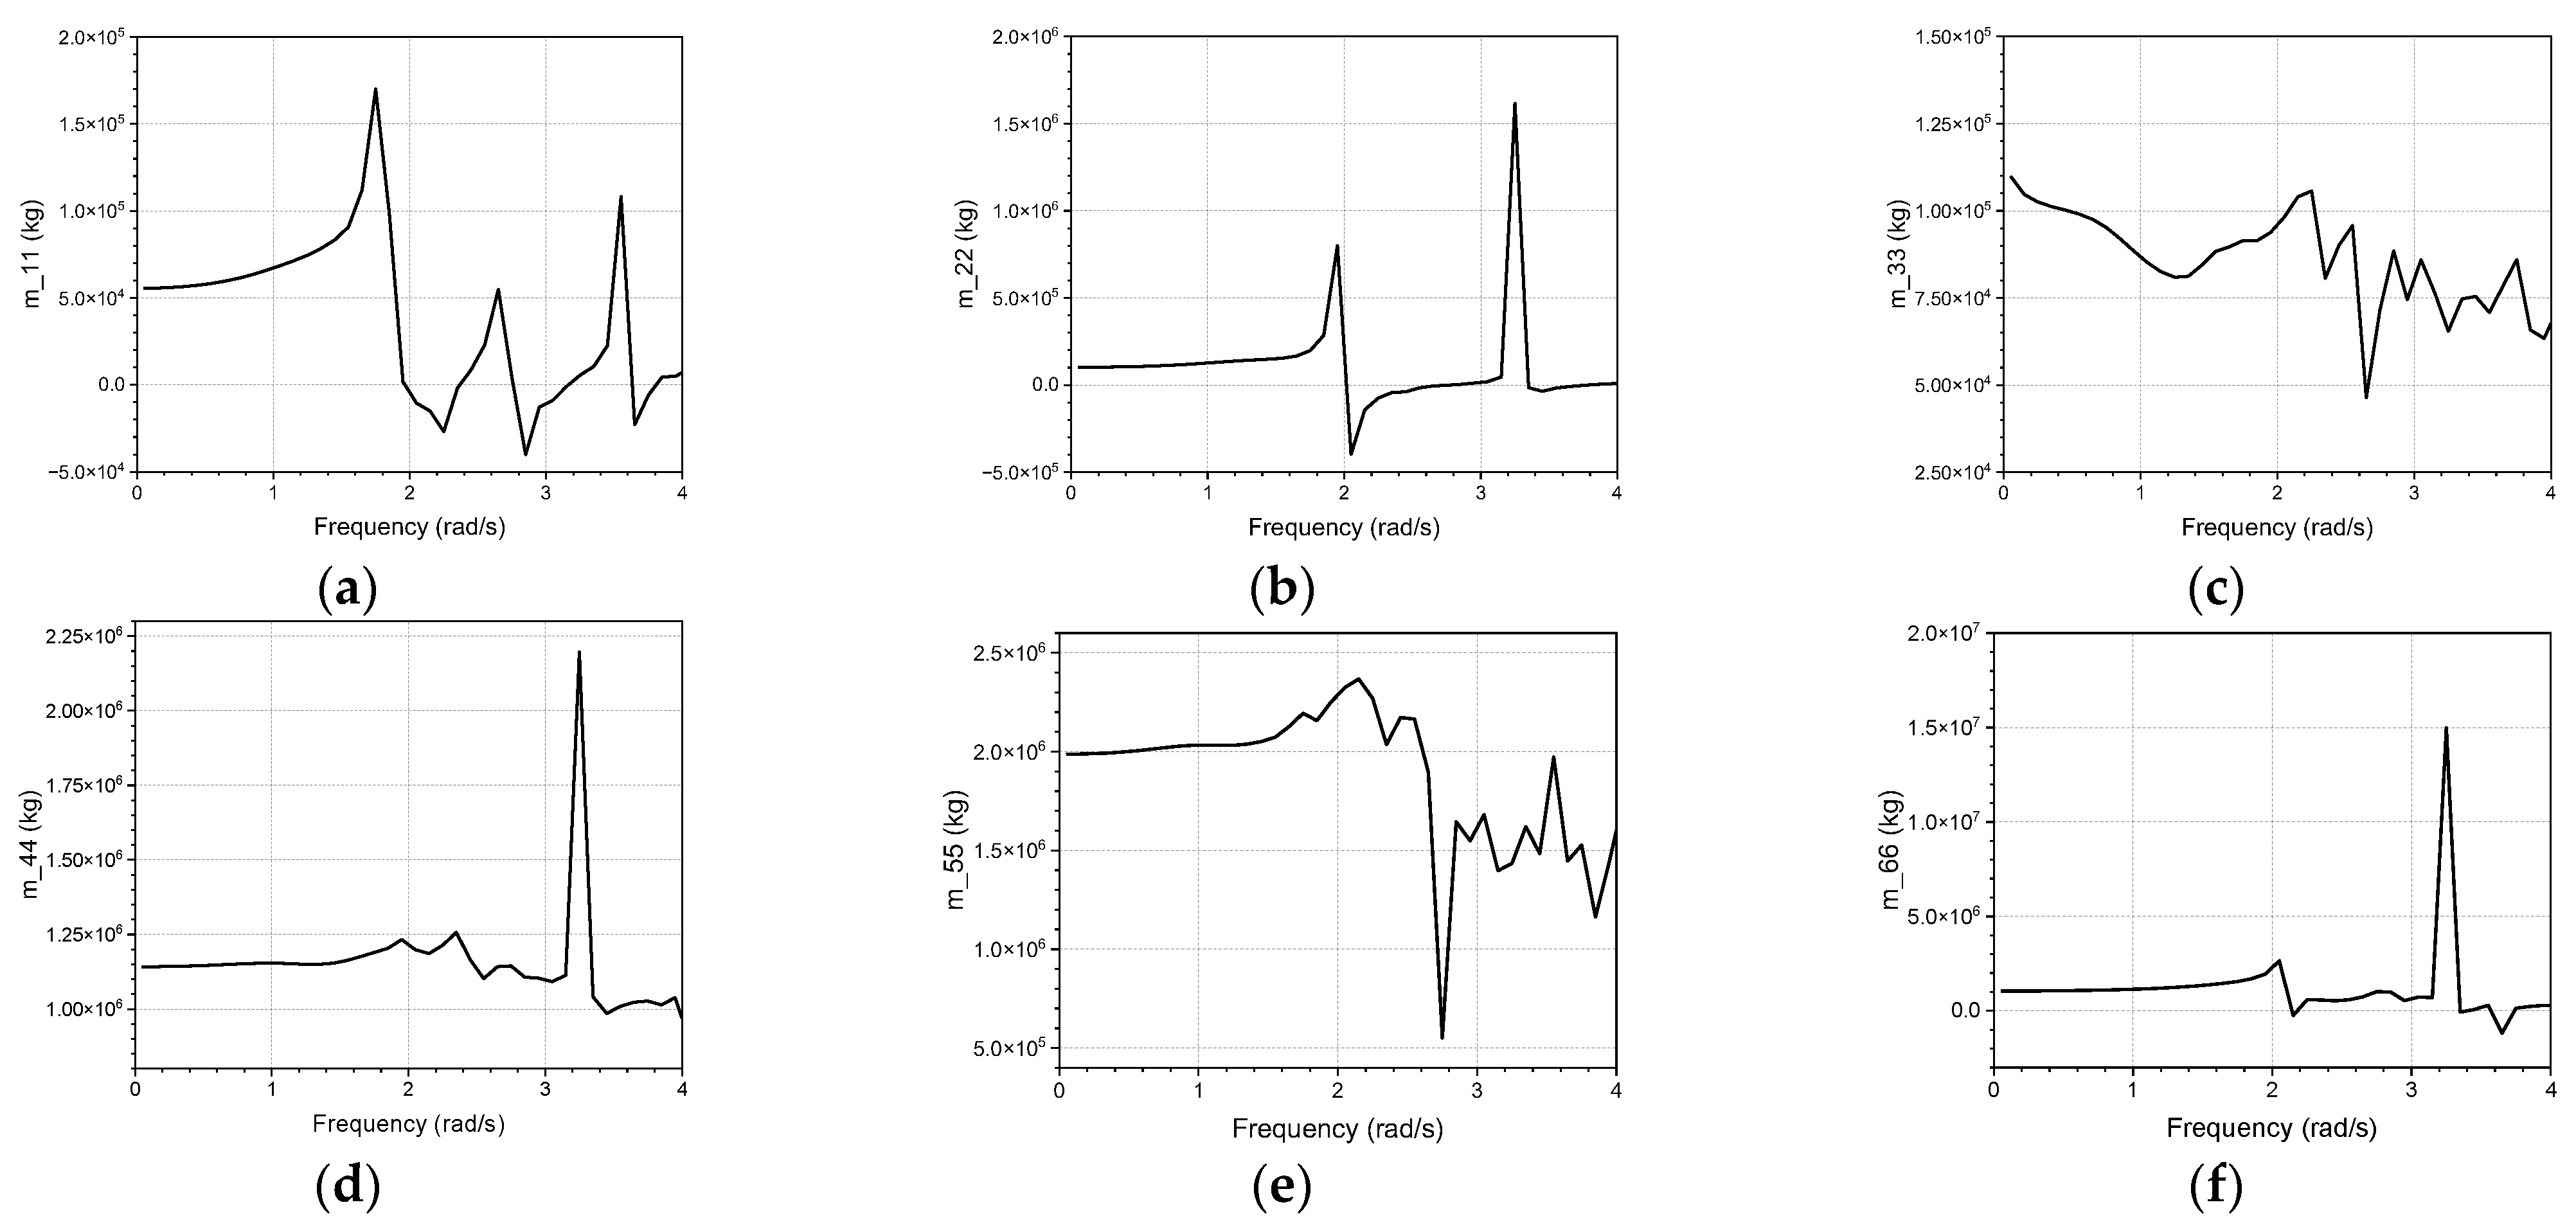
Figure 11.
Added mass for the open WEC chambers configuration. (a) Added mass of surge-surge for the open WEC. (b) Added mass of sway-sway for the open WEC. (c) Added mass of heave-heave for the open WEC. (d) Added mass of roll-roll for the open WEC. (e) Added mass of pitch-pitch for the open WEC. (f) Added mass of yaw-yaw for the open WEC.
Figure 11.
Added mass for the open WEC chambers configuration. (a) Added mass of surge-surge for the open WEC. (b) Added mass of sway-sway for the open WEC. (c) Added mass of heave-heave for the open WEC. (d) Added mass of roll-roll for the open WEC. (e) Added mass of pitch-pitch for the open WEC. (f) Added mass of yaw-yaw for the open WEC.
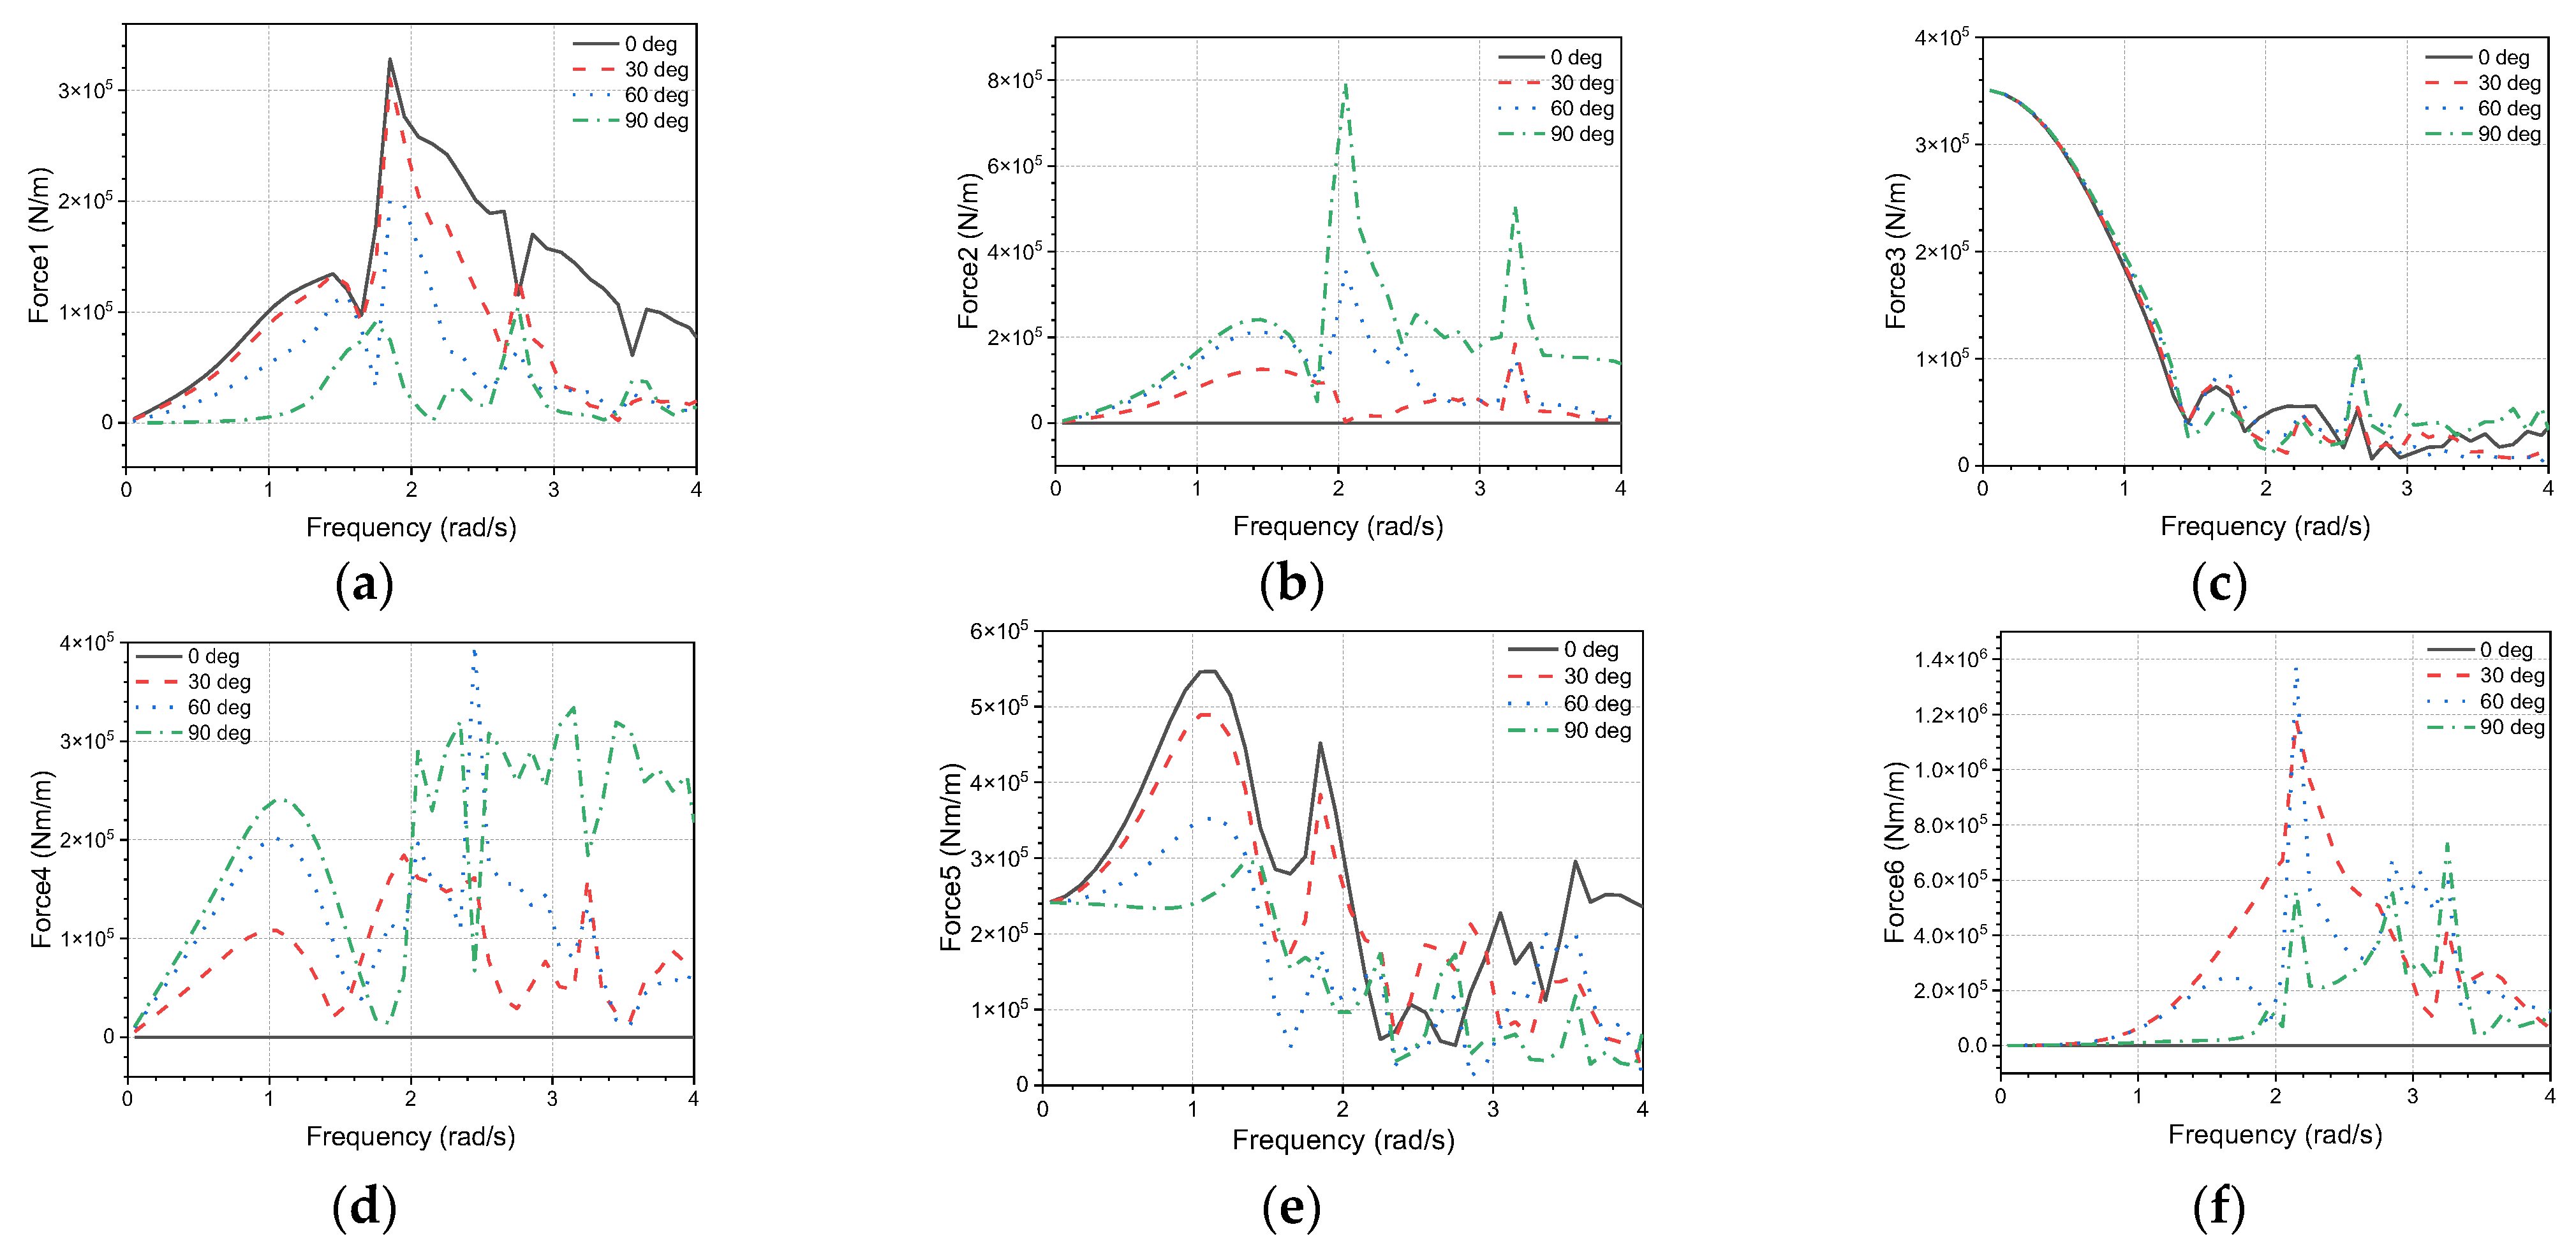
Figure 12.
Wave force transfer function, WEC with closed chambers. (a) Wave force transfer function of surge for the closed WEC. (b) Wave force transfer function of sway for the closed WEC. (c) Wave force transfer function of heave for the closed WEC. (d) Wave force transfer function of roll for the closed WEC. (e) Wave force transfer function of pitch for the closed WEC. (f) Wave force transfer function of yaw for the closed WEC.
Figure 12.
Wave force transfer function, WEC with closed chambers. (a) Wave force transfer function of surge for the closed WEC. (b) Wave force transfer function of sway for the closed WEC. (c) Wave force transfer function of heave for the closed WEC. (d) Wave force transfer function of roll for the closed WEC. (e) Wave force transfer function of pitch for the closed WEC. (f) Wave force transfer function of yaw for the closed WEC.
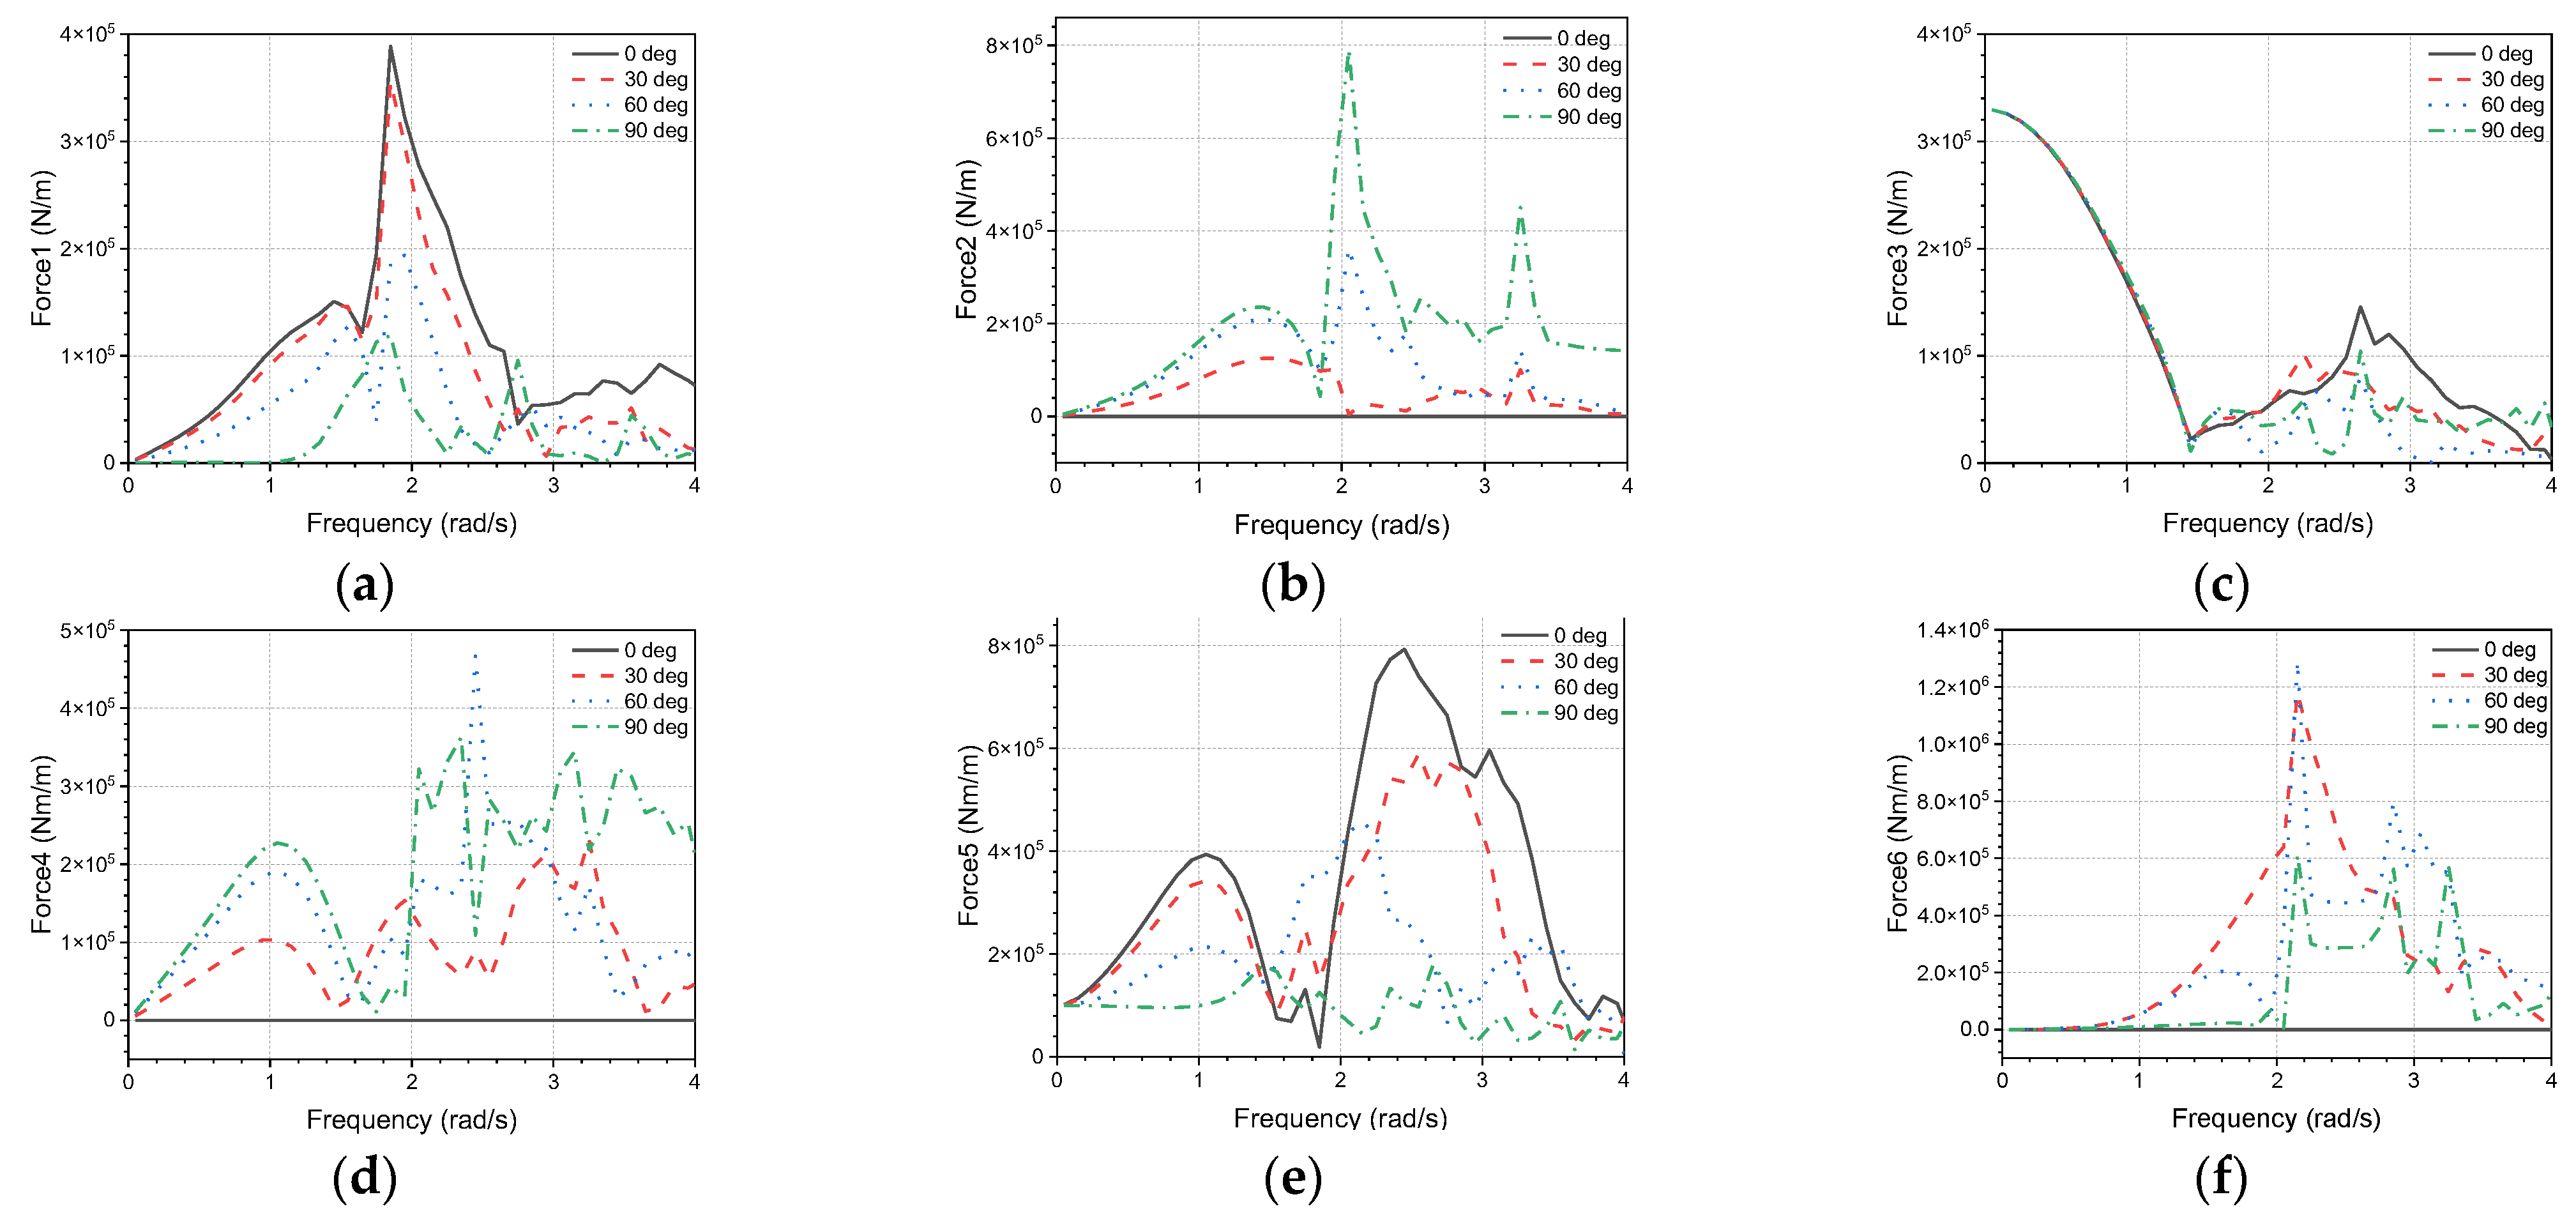
Figure 13.
Wave force transfer function, WEC with open chambers. (a) Wave force transfer function of surge for the open WEC. (b) Wave force transfer function of sway for the open WEC. (c) Wave force transfer function of heave for the open WEC. (d) Wave force transfer function of roll for the open WEC. (e) Wave force transfer function of pitch for the open WEC. (f) Wave force transfer function of yaw for the open WEC.
Figure 13.
Wave force transfer function, WEC with open chambers. (a) Wave force transfer function of surge for the open WEC. (b) Wave force transfer function of sway for the open WEC. (c) Wave force transfer function of heave for the open WEC. (d) Wave force transfer function of roll for the open WEC. (e) Wave force transfer function of pitch for the open WEC. (f) Wave force transfer function of yaw for the open WEC.
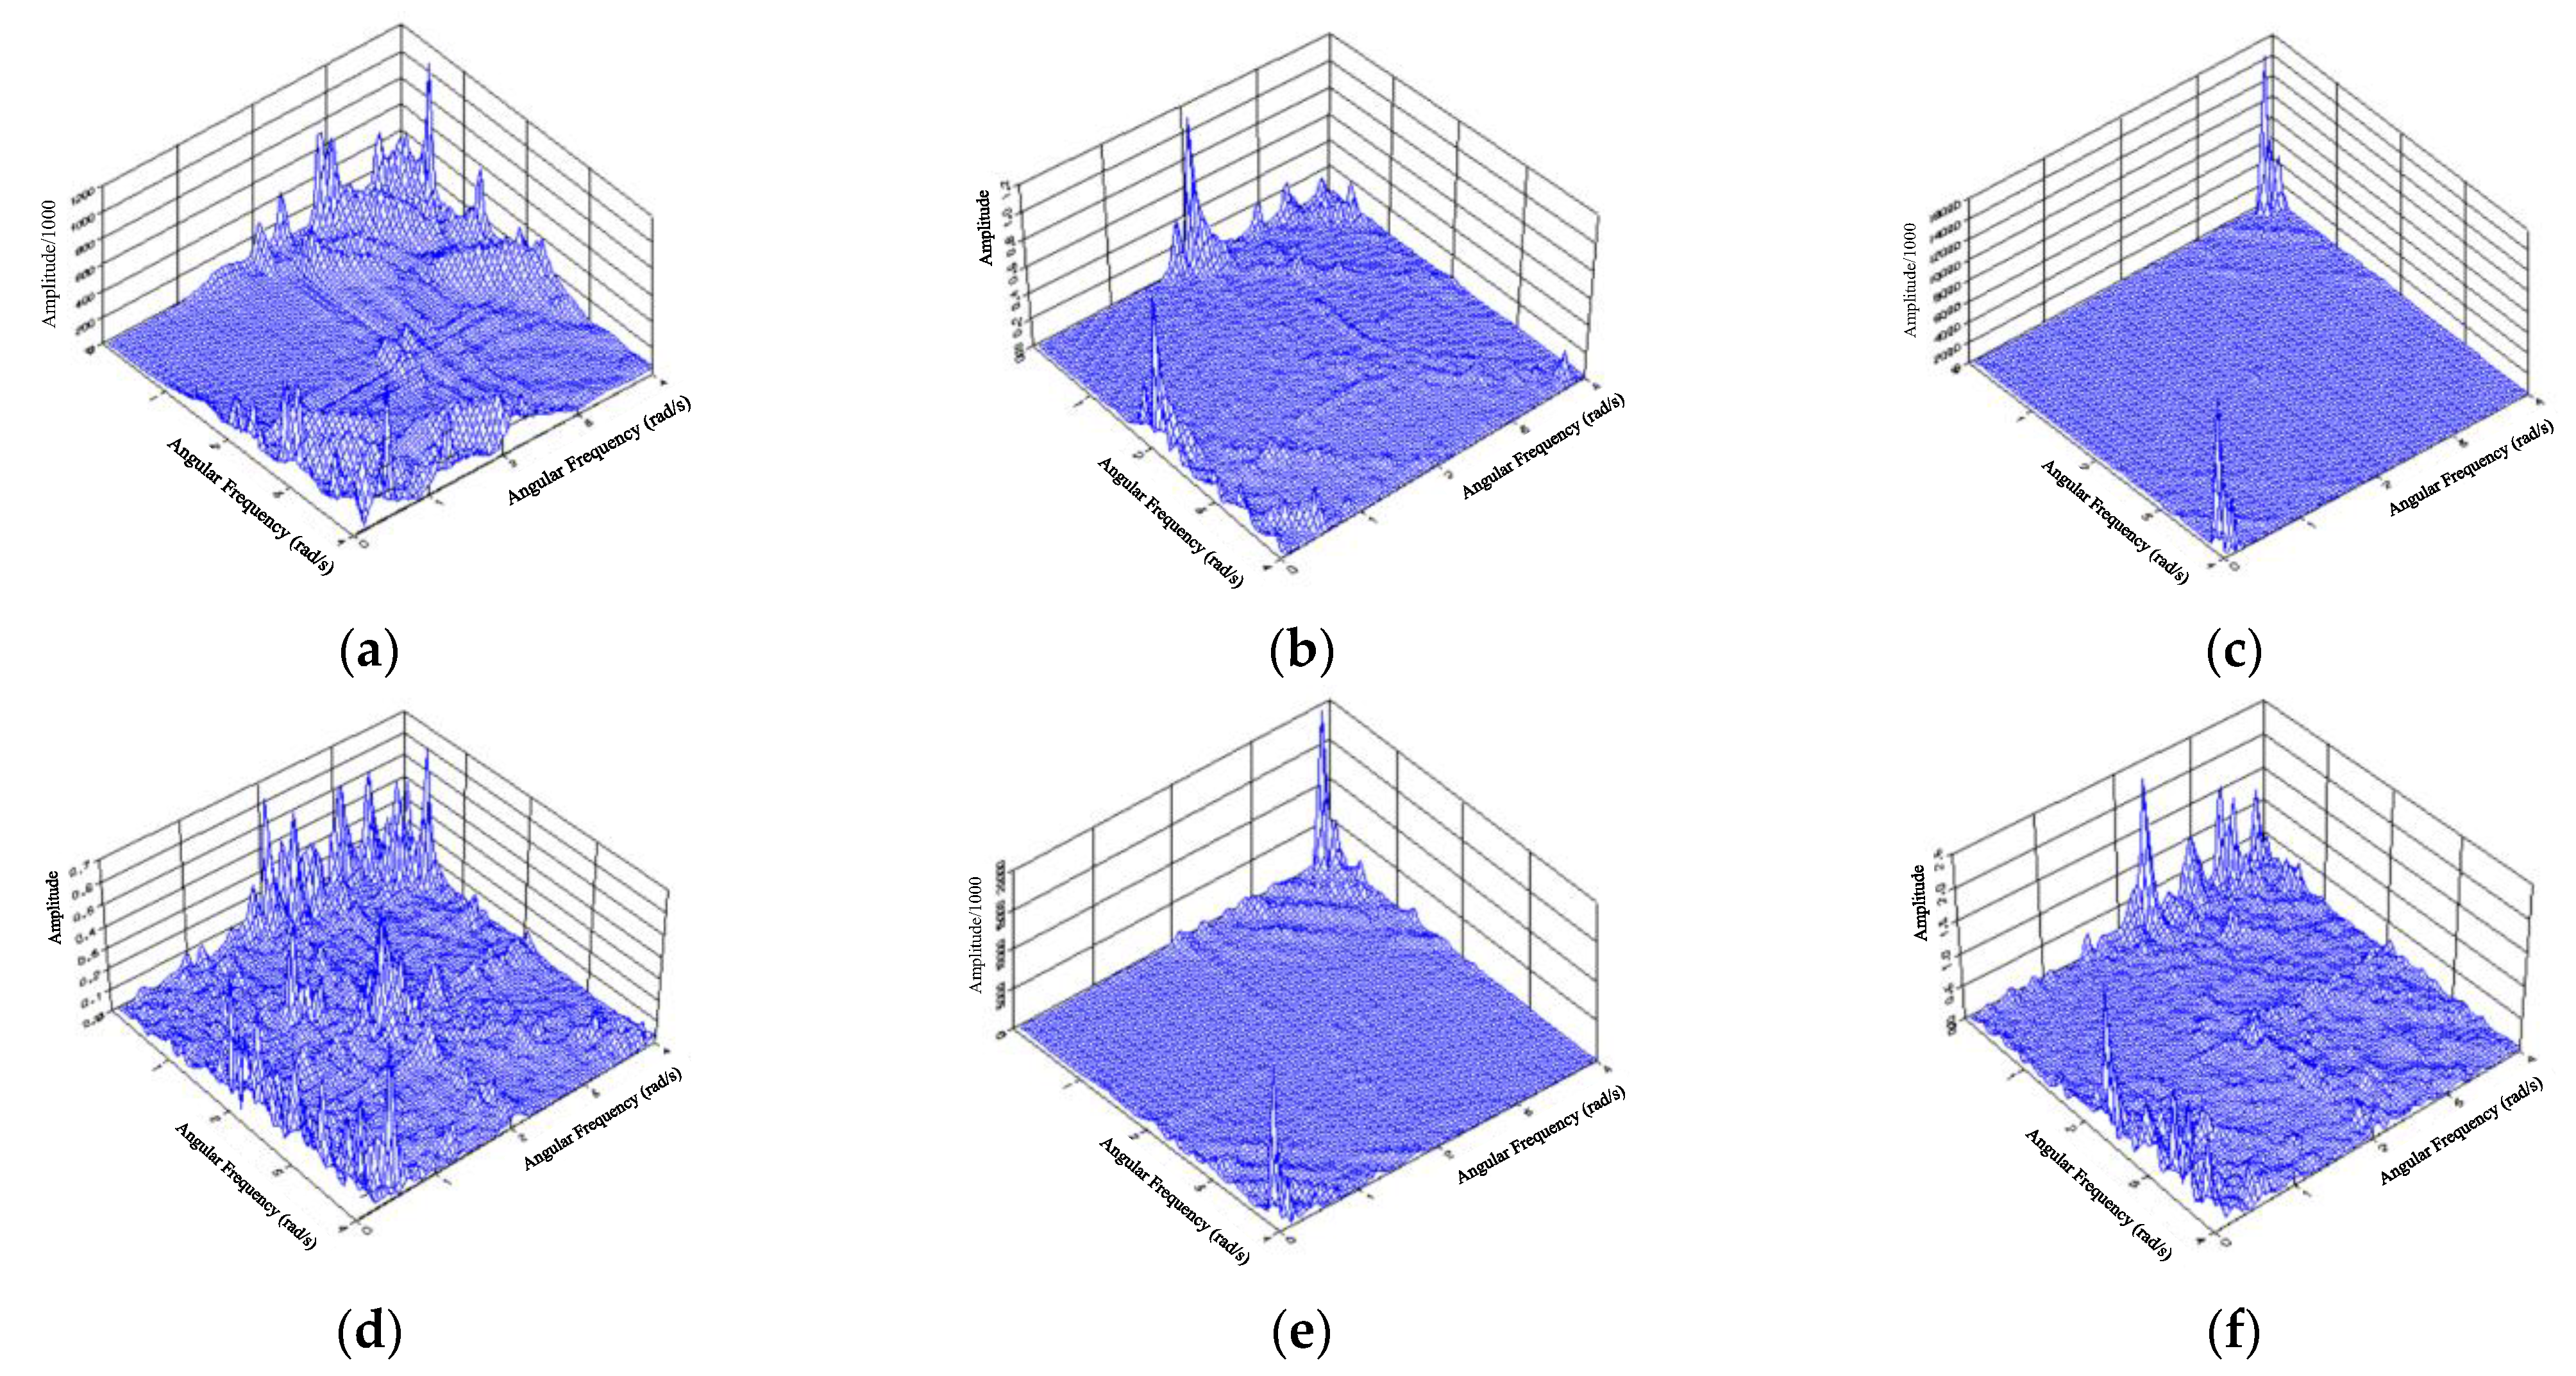
Figure 14.
Second-order drift force (N·m/m2) for the closed WEC chambers configuration, where x and y represent angular frequency (rad/s) from 0 to 4, and z represents amplitude. (a) Second-order drift force of surge for the closed WEC. (b) Second-order drift force of sway for the closed WEC. (c) Second-order drift force of heave for the closed WEC. (d) Second-order drift force of roll for the closed WEC. (e) Second-order drift force of pitch for the closed WEC. (f) Second-order drift force of yaw for the closed WEC.
Figure 14.
Second-order drift force (N·m/m2) for the closed WEC chambers configuration, where x and y represent angular frequency (rad/s) from 0 to 4, and z represents amplitude. (a) Second-order drift force of surge for the closed WEC. (b) Second-order drift force of sway for the closed WEC. (c) Second-order drift force of heave for the closed WEC. (d) Second-order drift force of roll for the closed WEC. (e) Second-order drift force of pitch for the closed WEC. (f) Second-order drift force of yaw for the closed WEC.
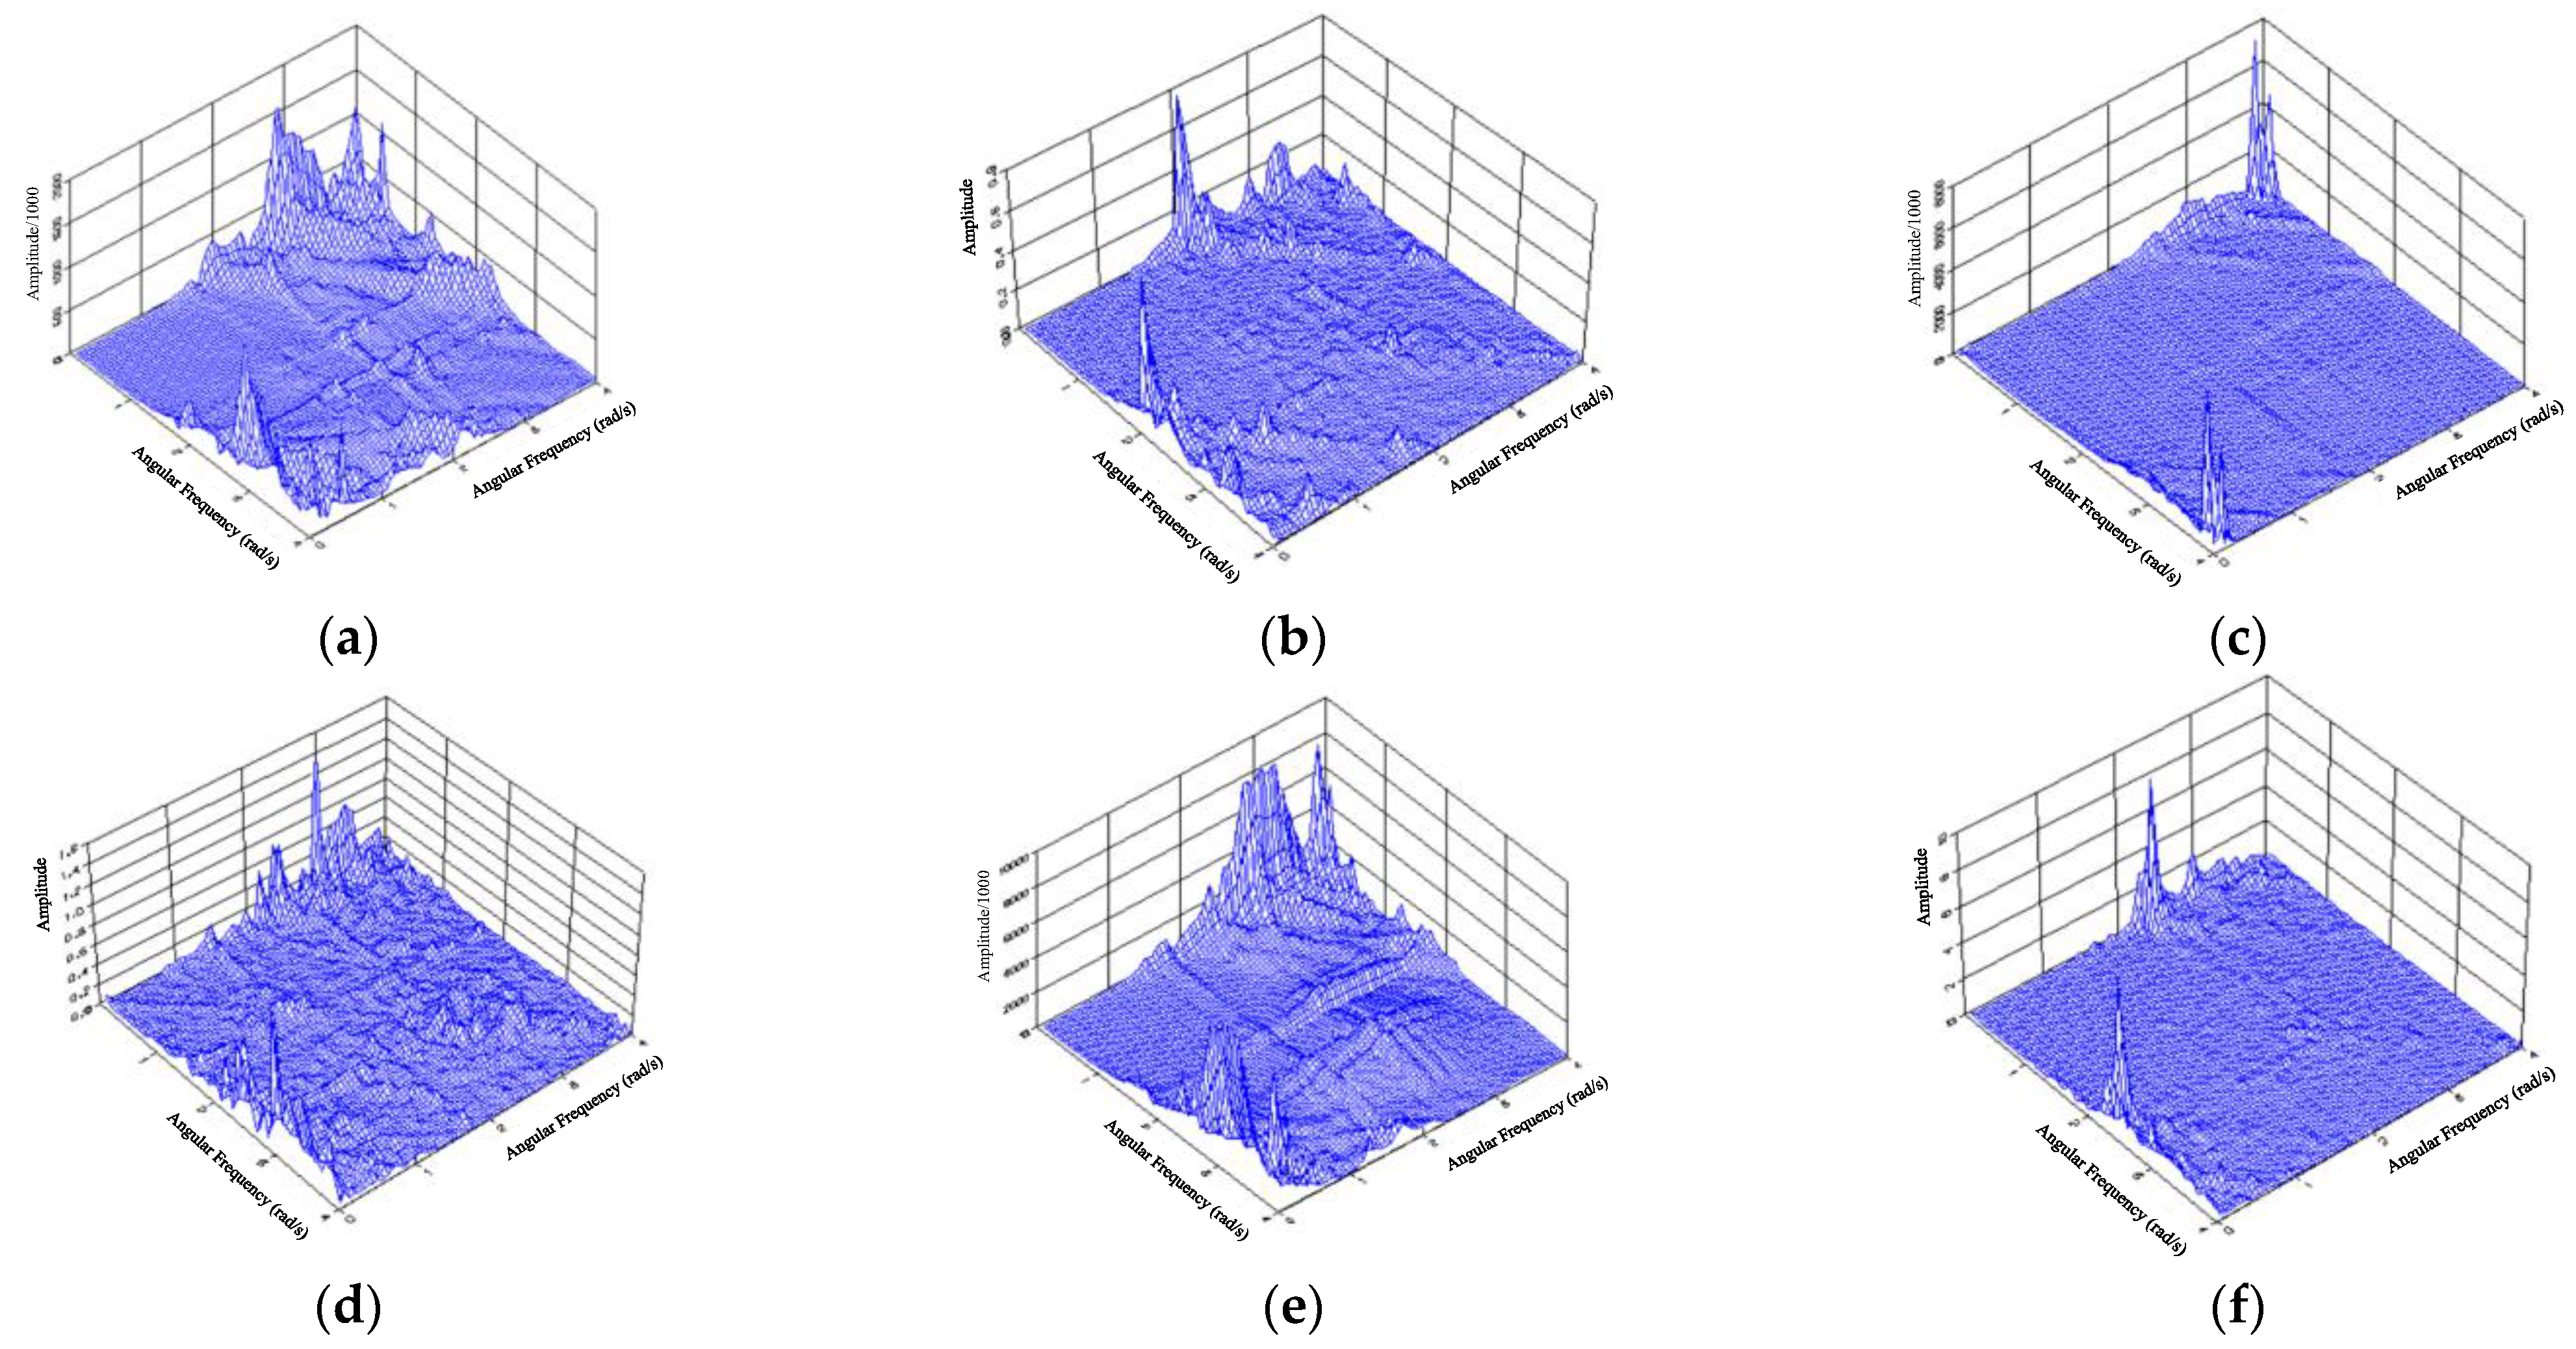
Figure 15.
Second-order drift force (N·m/m2) for the open WEC chambers configuration, where x and y represent angular frequency (rad/s) from 0 to 4, and z represents amplitude. (a) Second-order drift force of surge for the closed WEC. (b) Second-order drift force of sway for the closed WEC. (c) Second-order drift force of heave for the closed WEC. (d) Second-order drift force of roll for the closed WEC. (e) Second-order drift force of pitch for the closed WEC. (f) Second-order drift force of yaw for the closed WEC.
Figure 15.
Second-order drift force (N·m/m2) for the open WEC chambers configuration, where x and y represent angular frequency (rad/s) from 0 to 4, and z represents amplitude. (a) Second-order drift force of surge for the closed WEC. (b) Second-order drift force of sway for the closed WEC. (c) Second-order drift force of heave for the closed WEC. (d) Second-order drift force of roll for the closed WEC. (e) Second-order drift force of pitch for the closed WEC. (f) Second-order drift force of yaw for the closed WEC.
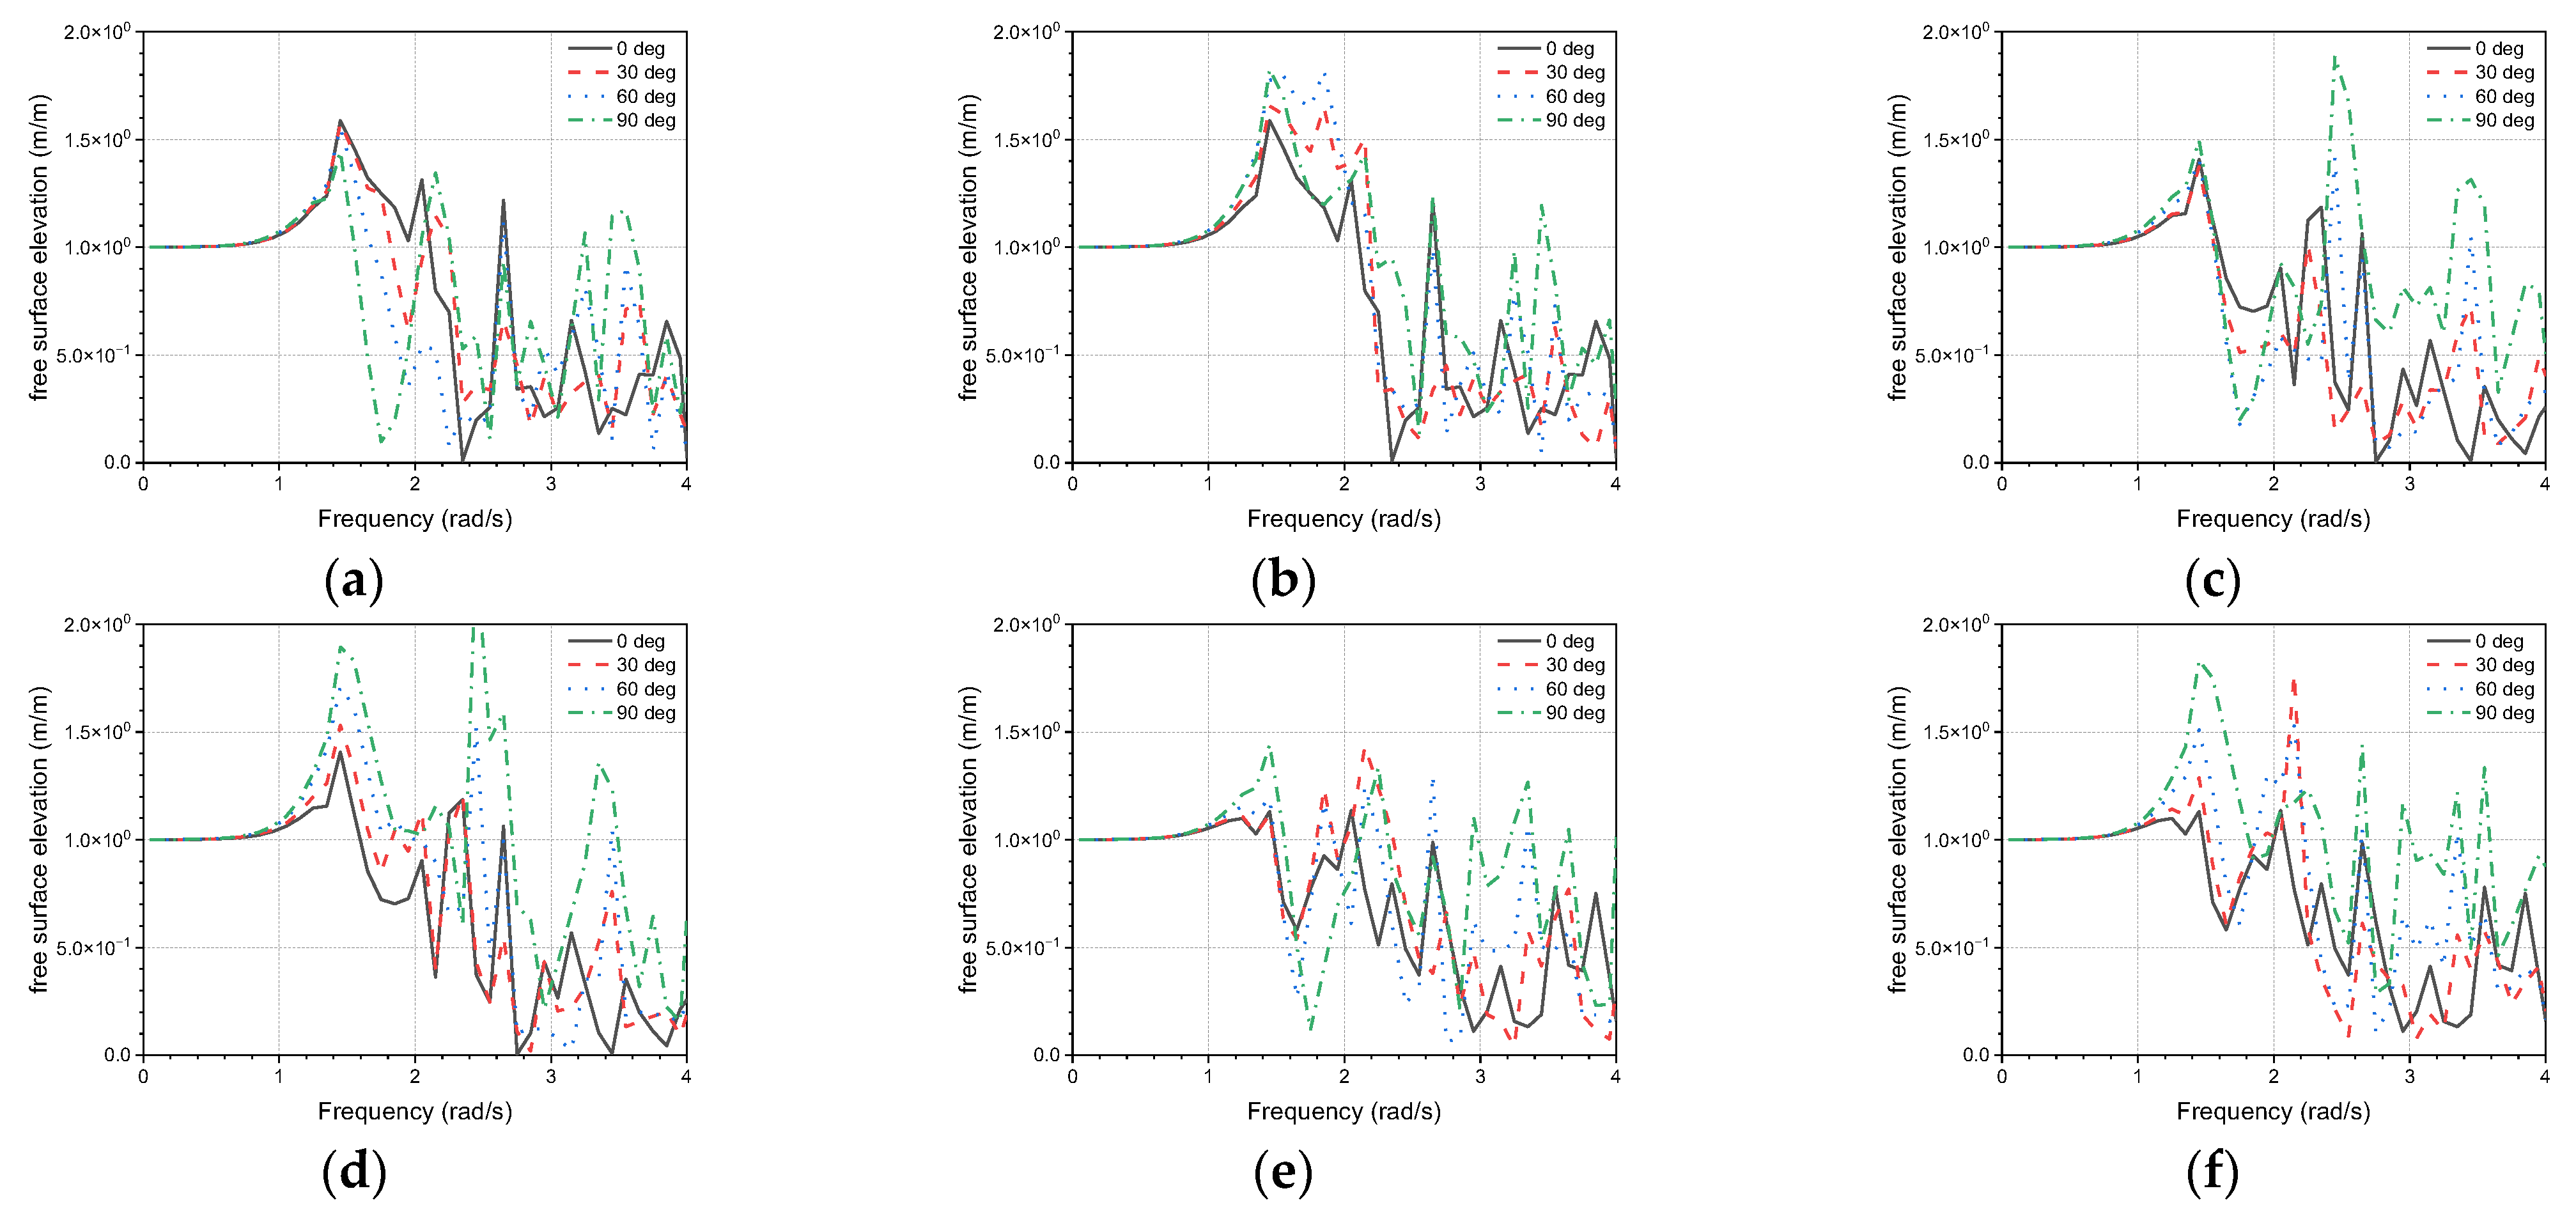
Figure 16.
Free surface elevations at the six points for the closed WEC chamber configuration. (a) Free surface elevations at Point 1 for closed WEC. (b) Free surface elevations at Point 2 for closed WEC. (c) Free surface elevations at Point 3 for closed WEC. (d) Free surface elevations at Point 4 for closed WEC. (e) Free surface elevations at Point 5 for closed WEC. (f) Free surface elevations at Point 6 for closed WEC.
Figure 16.
Free surface elevations at the six points for the closed WEC chamber configuration. (a) Free surface elevations at Point 1 for closed WEC. (b) Free surface elevations at Point 2 for closed WEC. (c) Free surface elevations at Point 3 for closed WEC. (d) Free surface elevations at Point 4 for closed WEC. (e) Free surface elevations at Point 5 for closed WEC. (f) Free surface elevations at Point 6 for closed WEC.
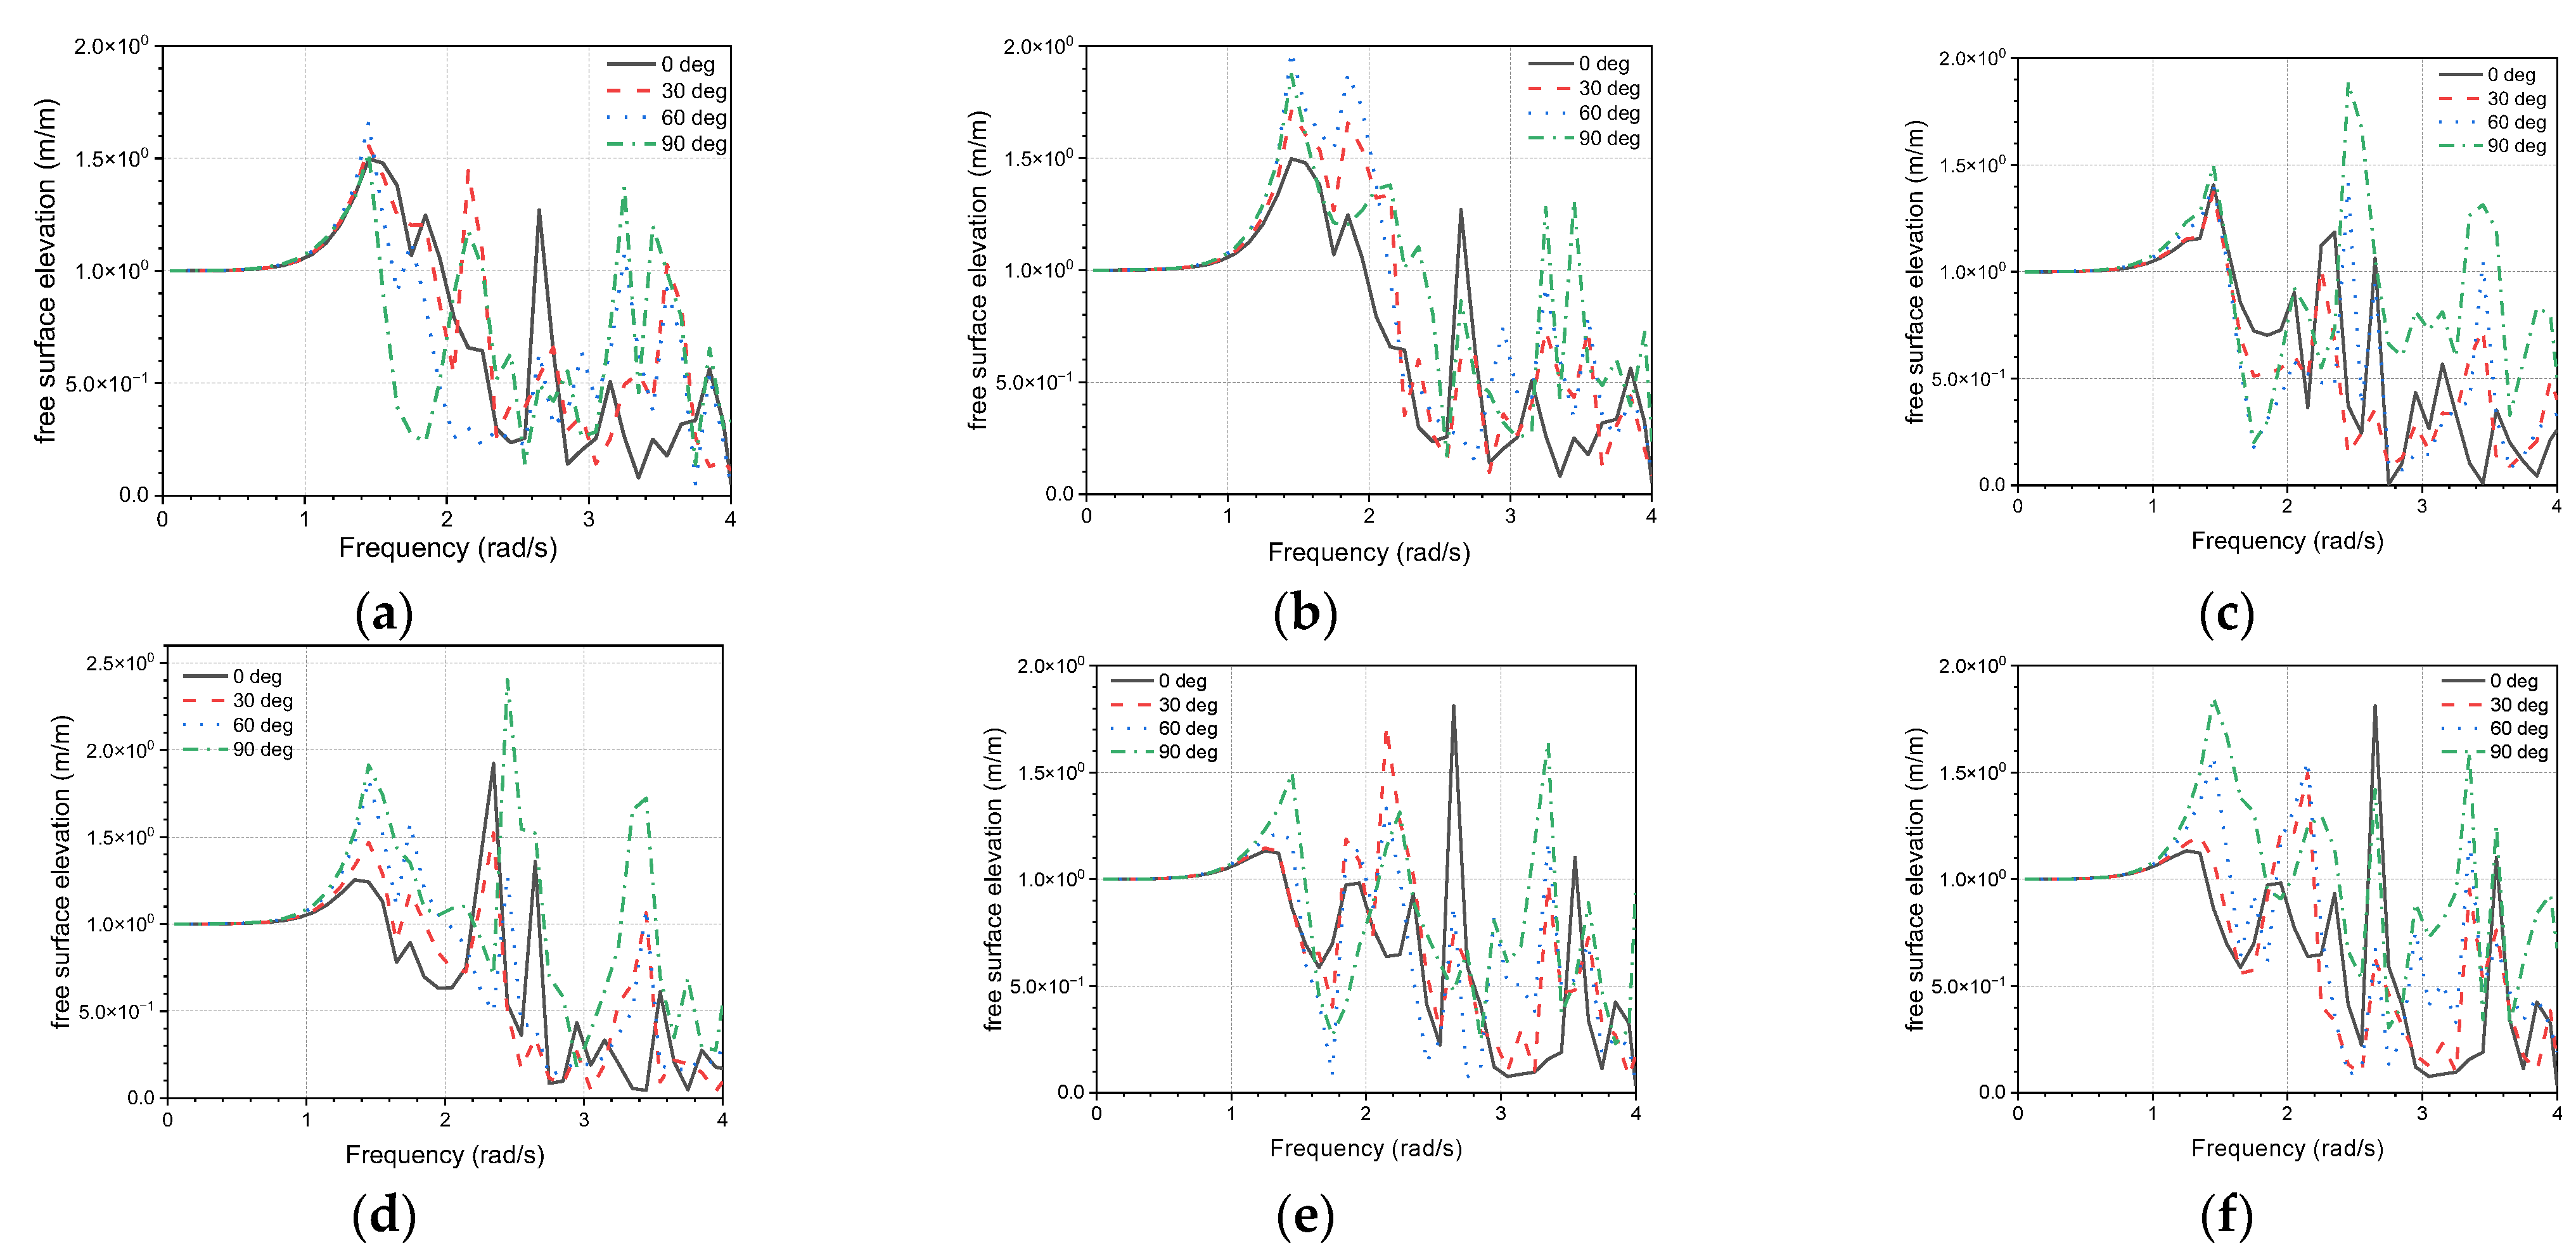
Figure 17.
Free surface elevations at the six points for the open WEC chambers configuration. (a) Free surface elevations at Point 1 for open WEC. (b) Free surface elevations at Point 2 for open WEC. (c) Free surface elevations at Point 3 for open WEC. (d) Free surface elevations at Point 4 for open WEC. (e) Free surface elevations at Point 5 for open WEC. (f) Free surface elevations at Point 6 for open WEC.
Figure 17.
Free surface elevations at the six points for the open WEC chambers configuration. (a) Free surface elevations at Point 1 for open WEC. (b) Free surface elevations at Point 2 for open WEC. (c) Free surface elevations at Point 3 for open WEC. (d) Free surface elevations at Point 4 for open WEC. (e) Free surface elevations at Point 5 for open WEC. (f) Free surface elevations at Point 6 for open WEC.
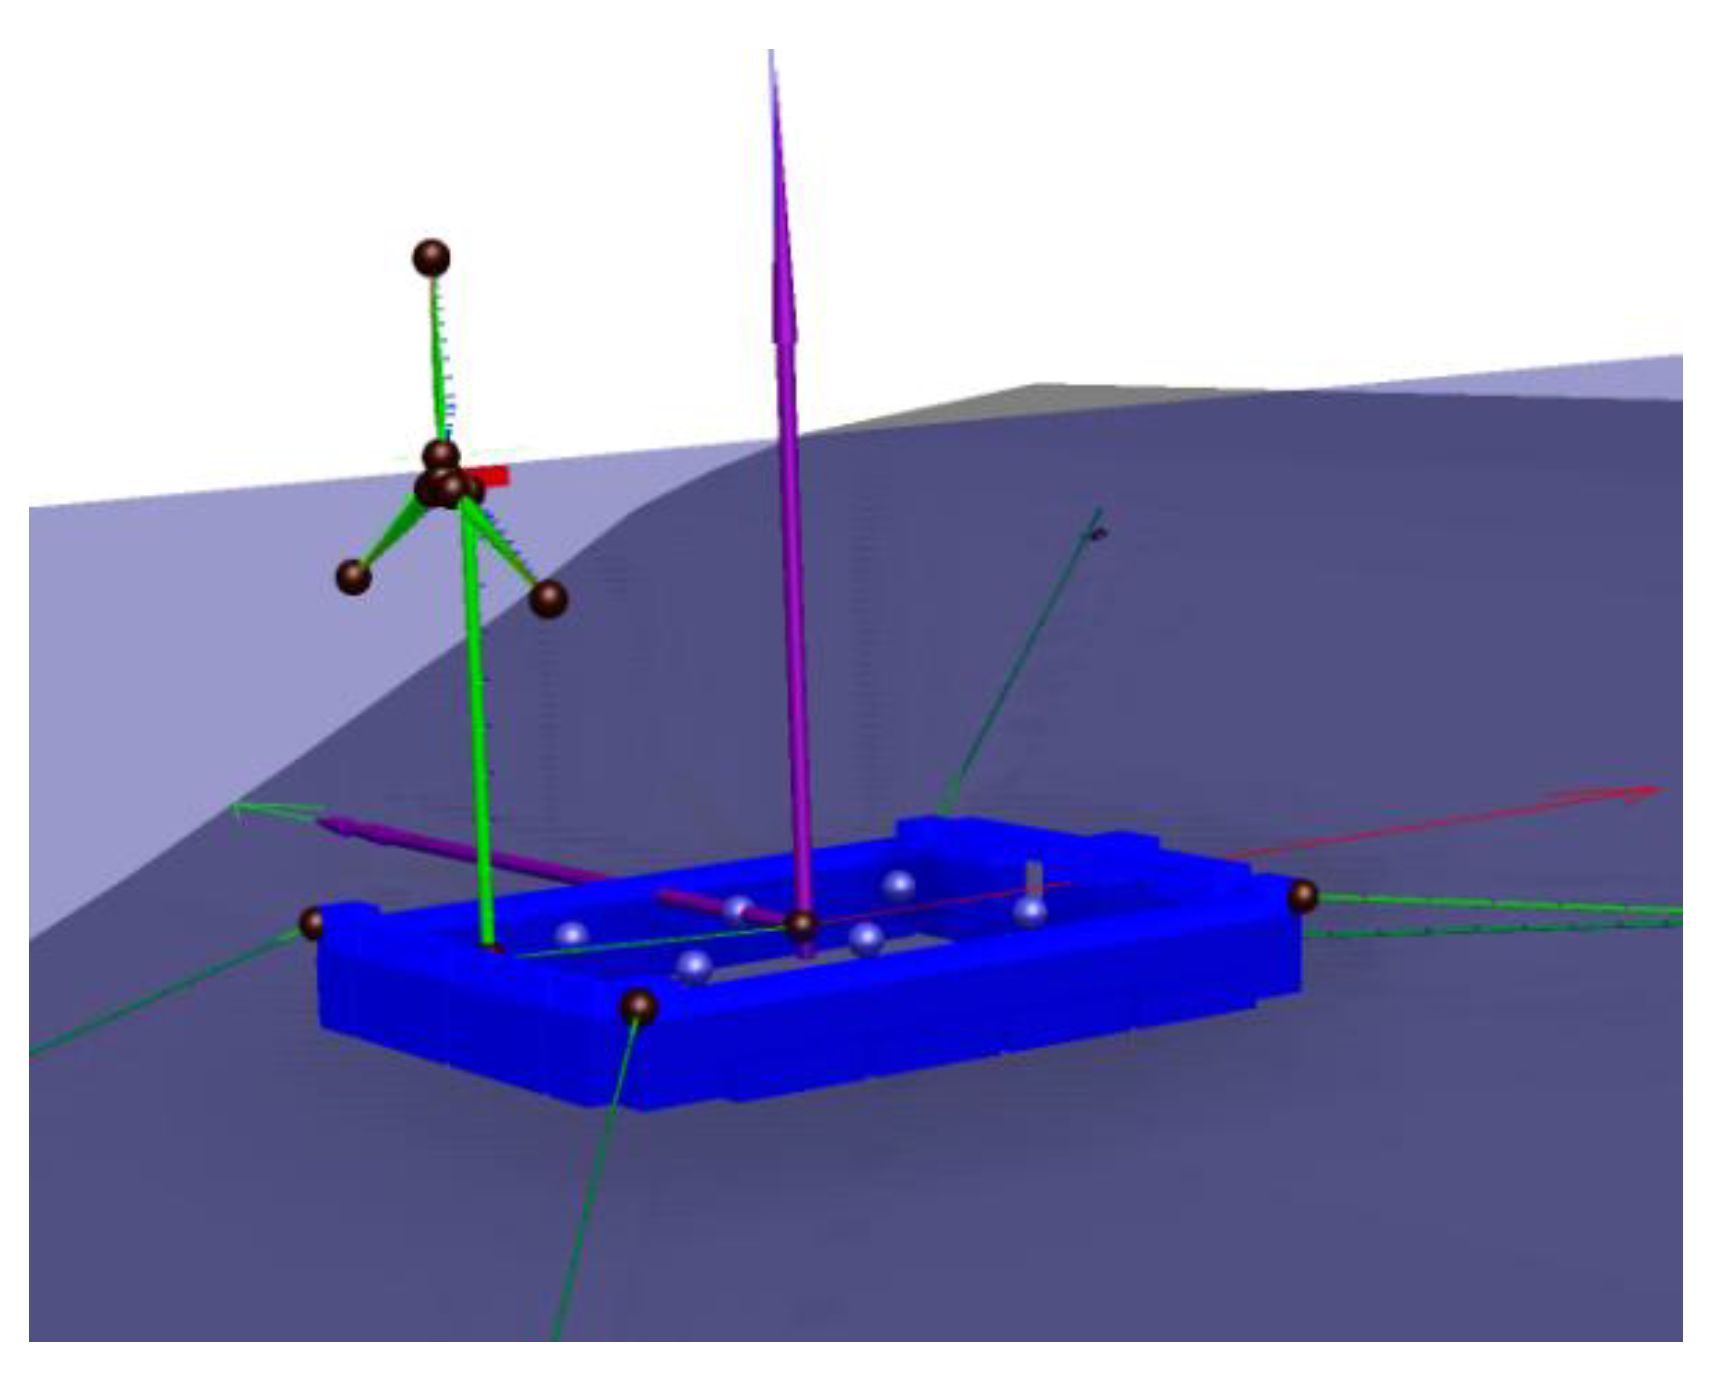
Figure 18.
Aero–hydro–servo–elastic coupled model for the BGF multi-purpose platform.
Figure 18.
Aero–hydro–servo–elastic coupled model for the BGF multi-purpose platform.
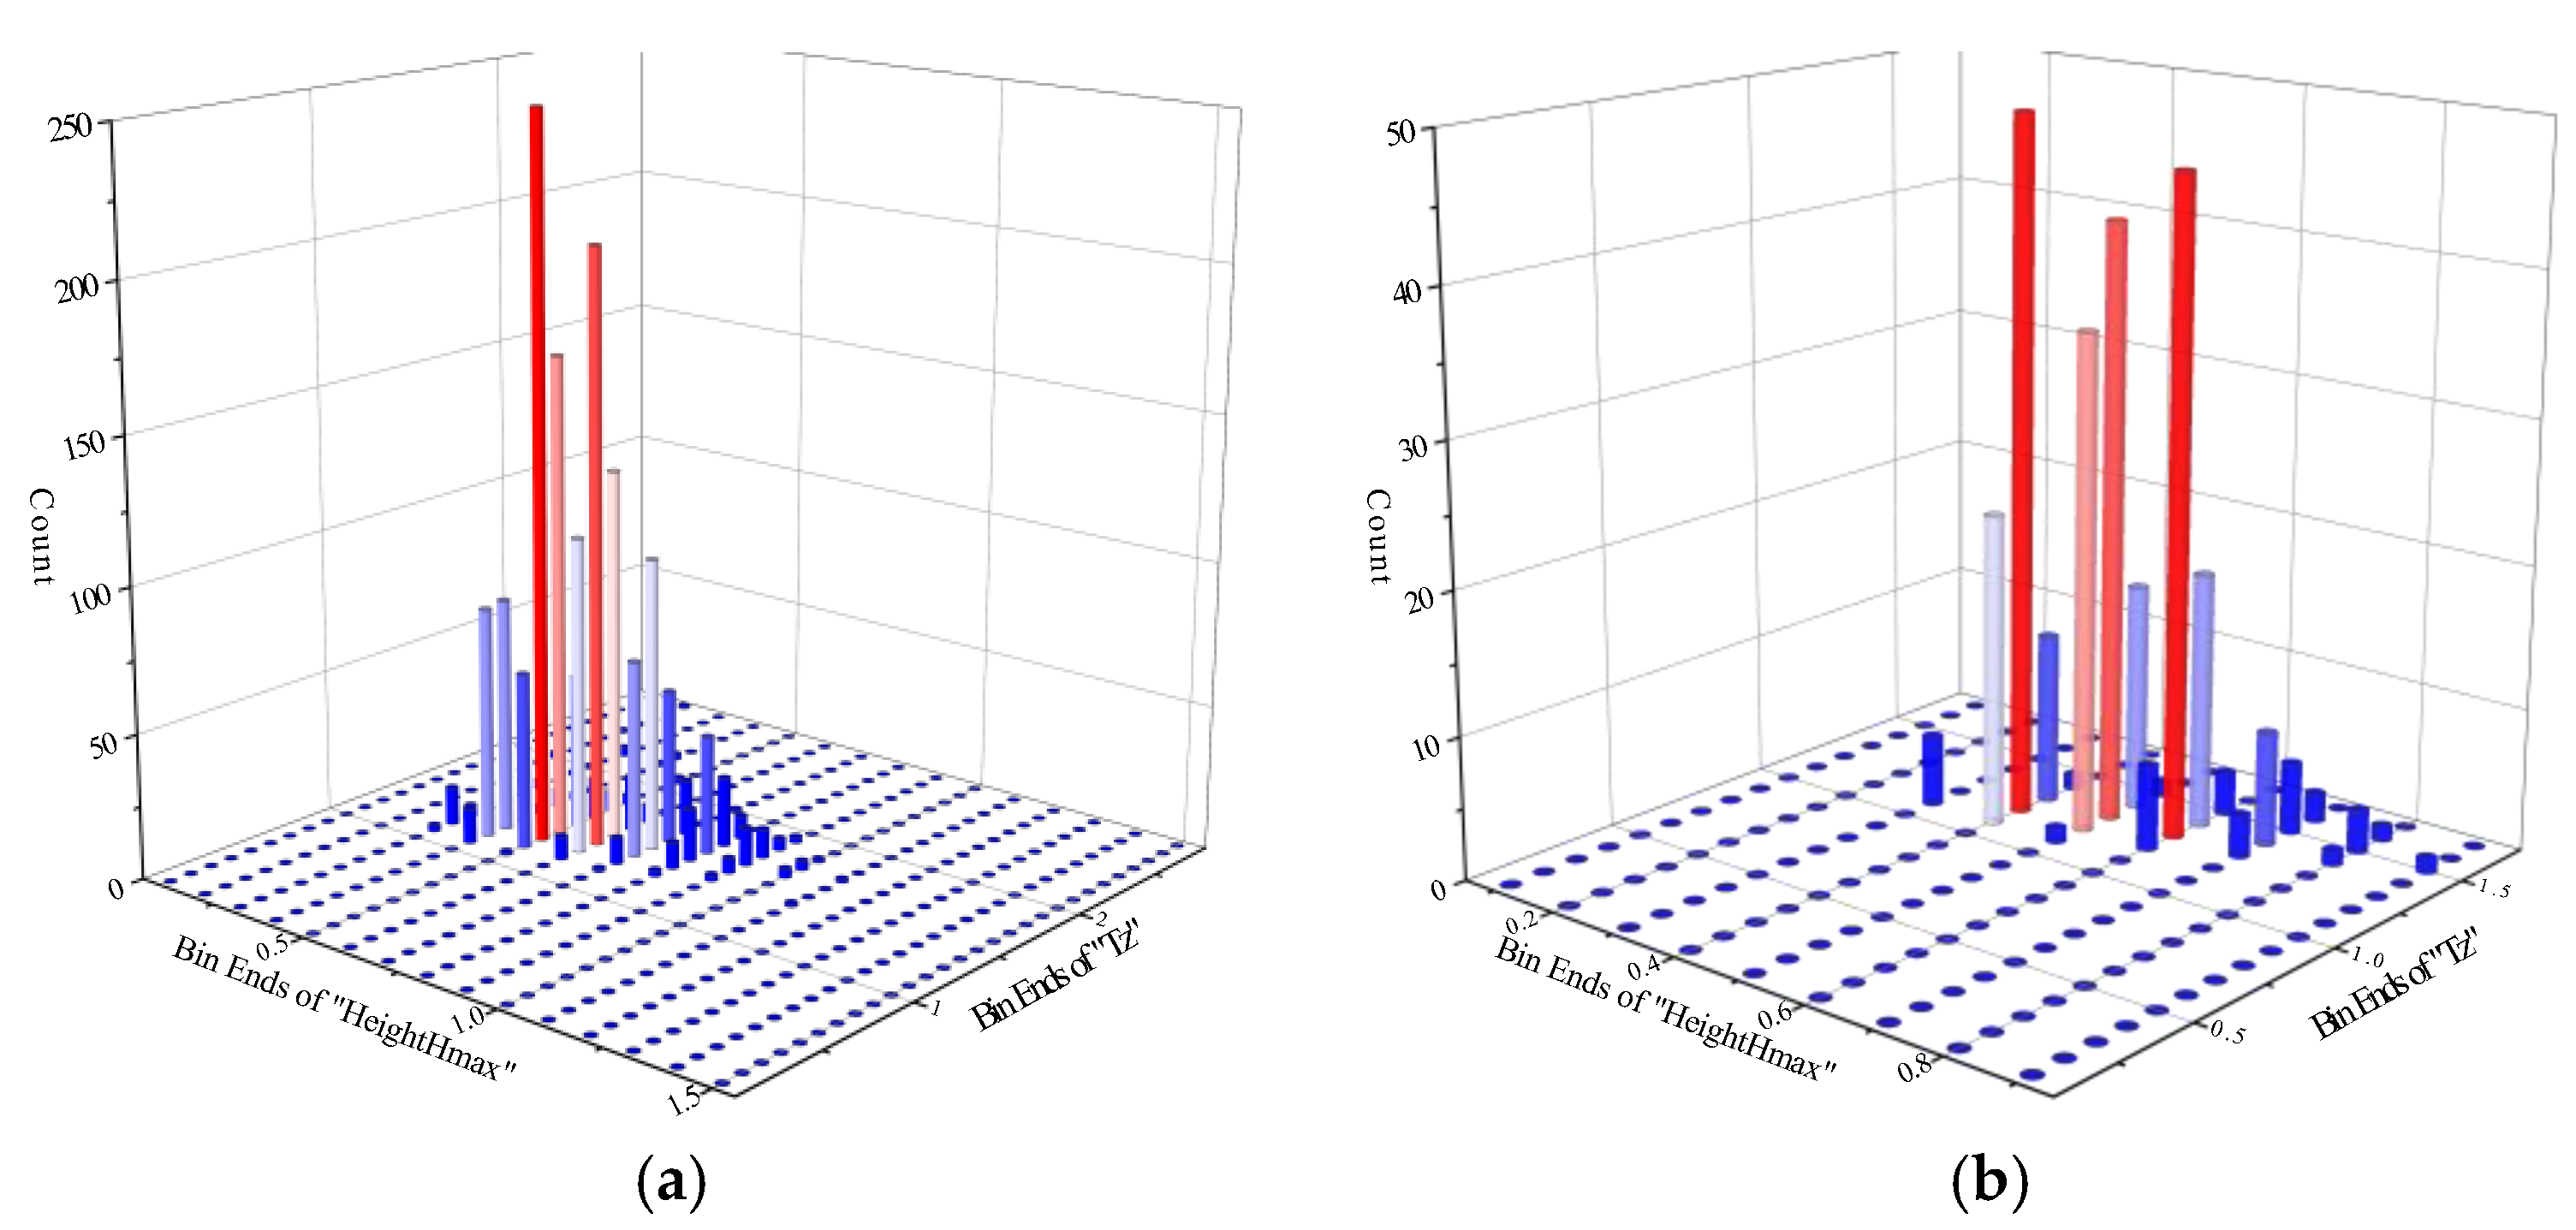
Figure 19.
Counting analysis of the wave condition for each configuration. (a) Wave condition for Configuration A. (b) Wave condition for Configuration B.
Figure 19.
Counting analysis of the wave condition for each configuration. (a) Wave condition for Configuration A. (b) Wave condition for Configuration B.
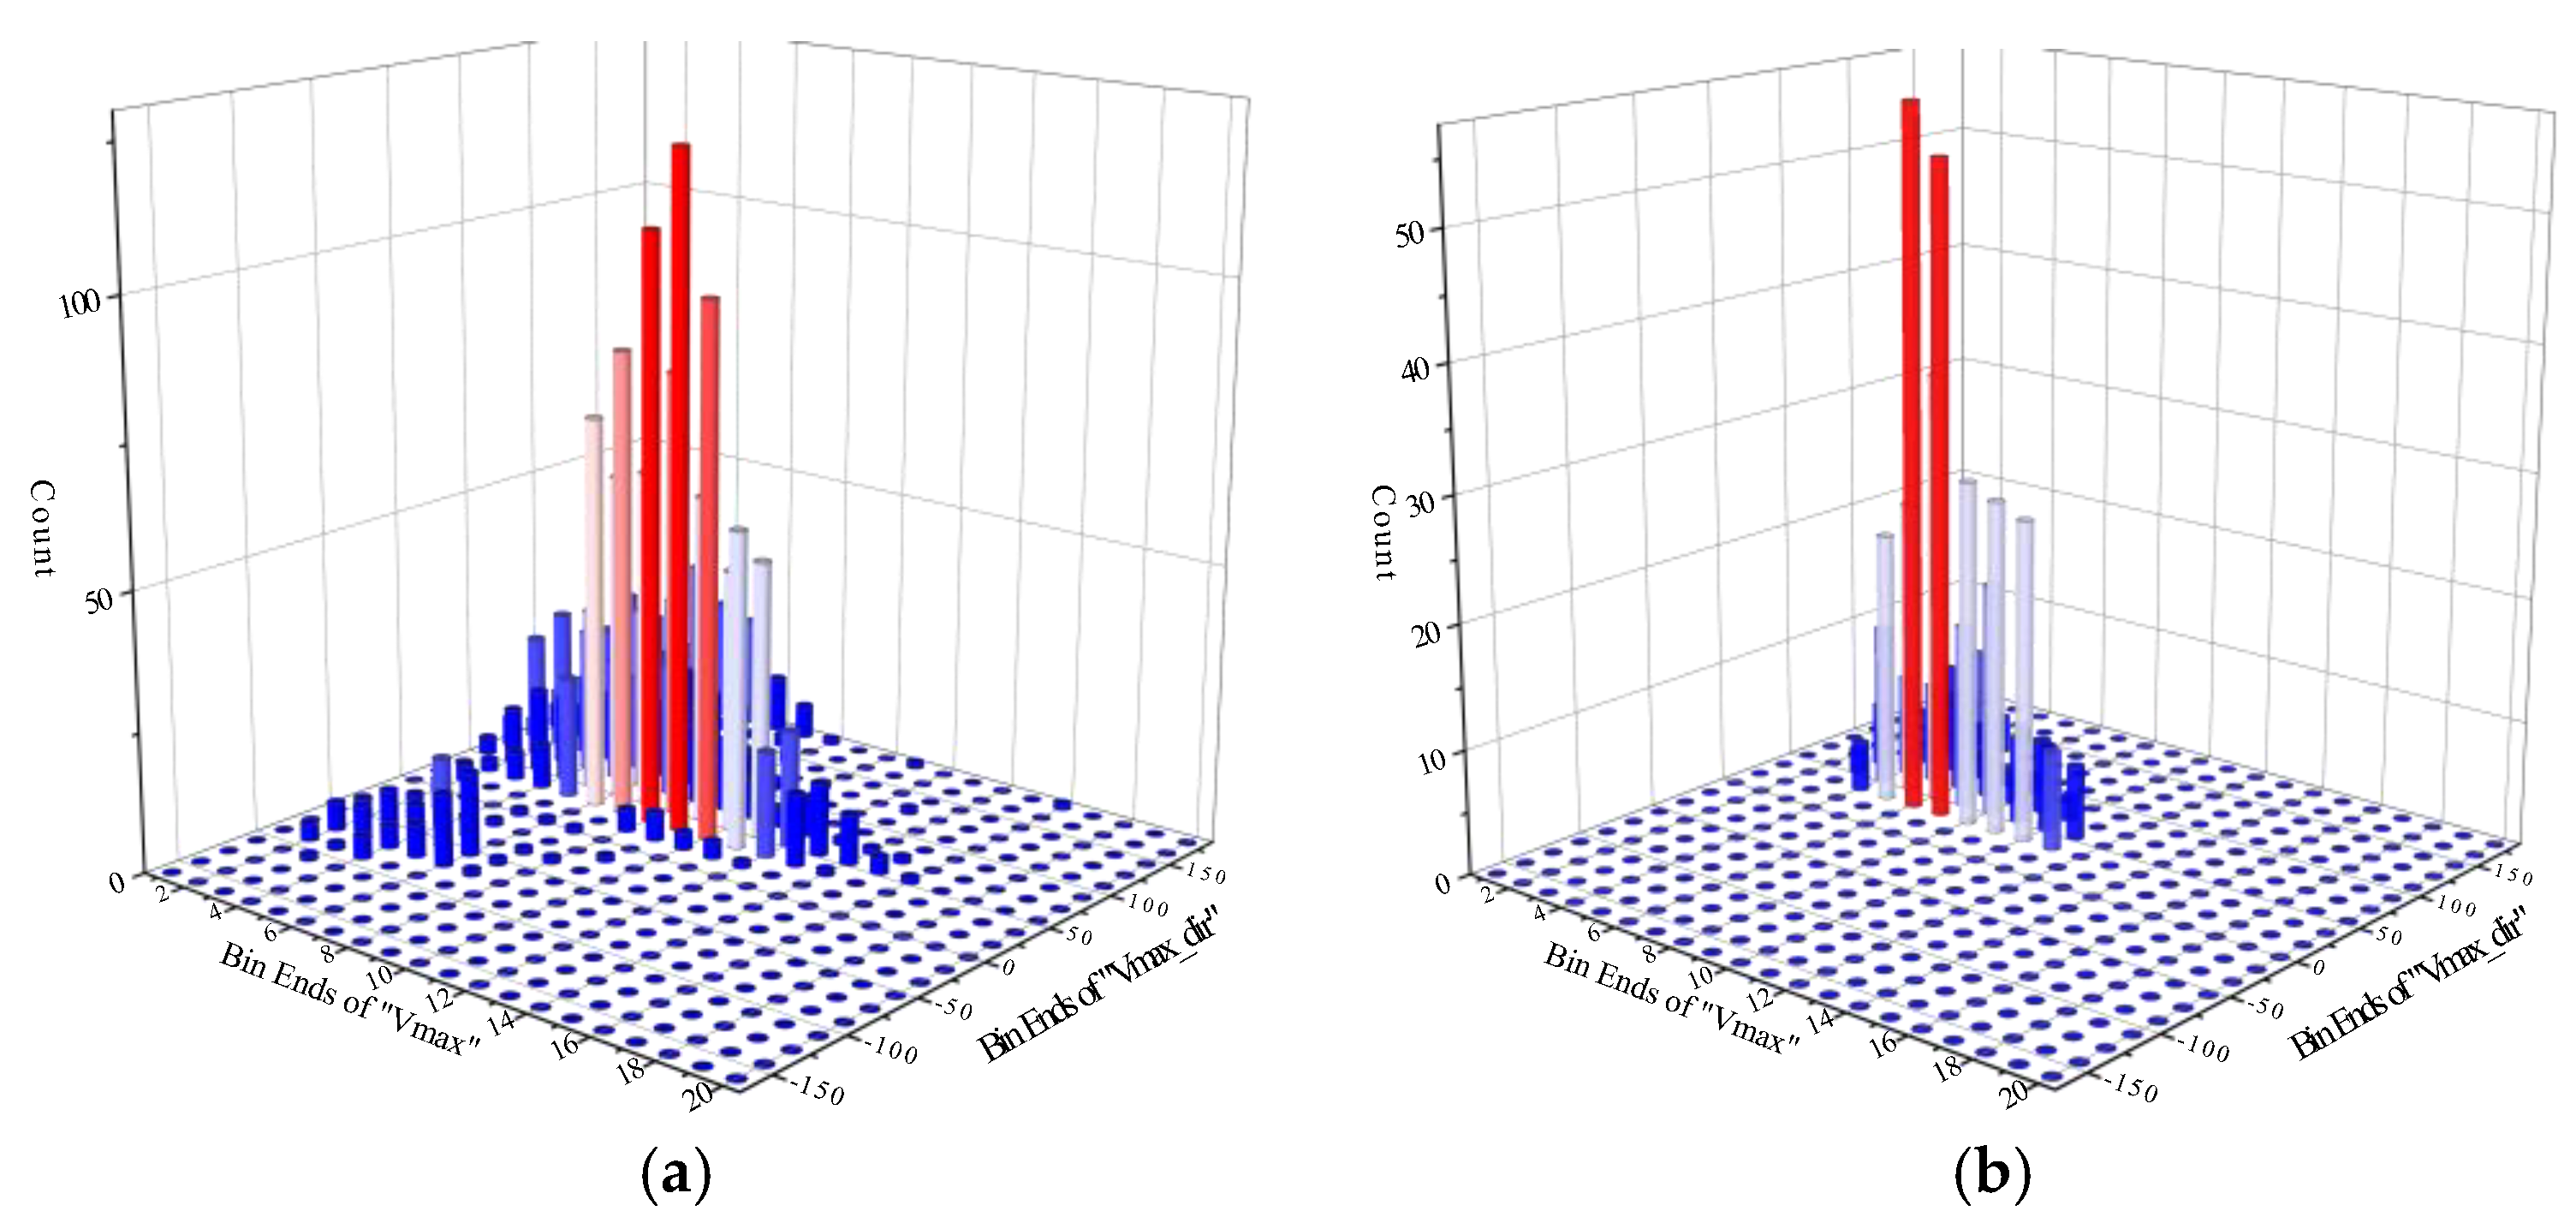
Figure 20.
Counting analysis of the wind condition for each configuration. (a) Wind condition for Configuration A. (b) Wind condition for Configuration B.
Figure 20.
Counting analysis of the wind condition for each configuration. (a) Wind condition for Configuration A. (b) Wind condition for Configuration B.
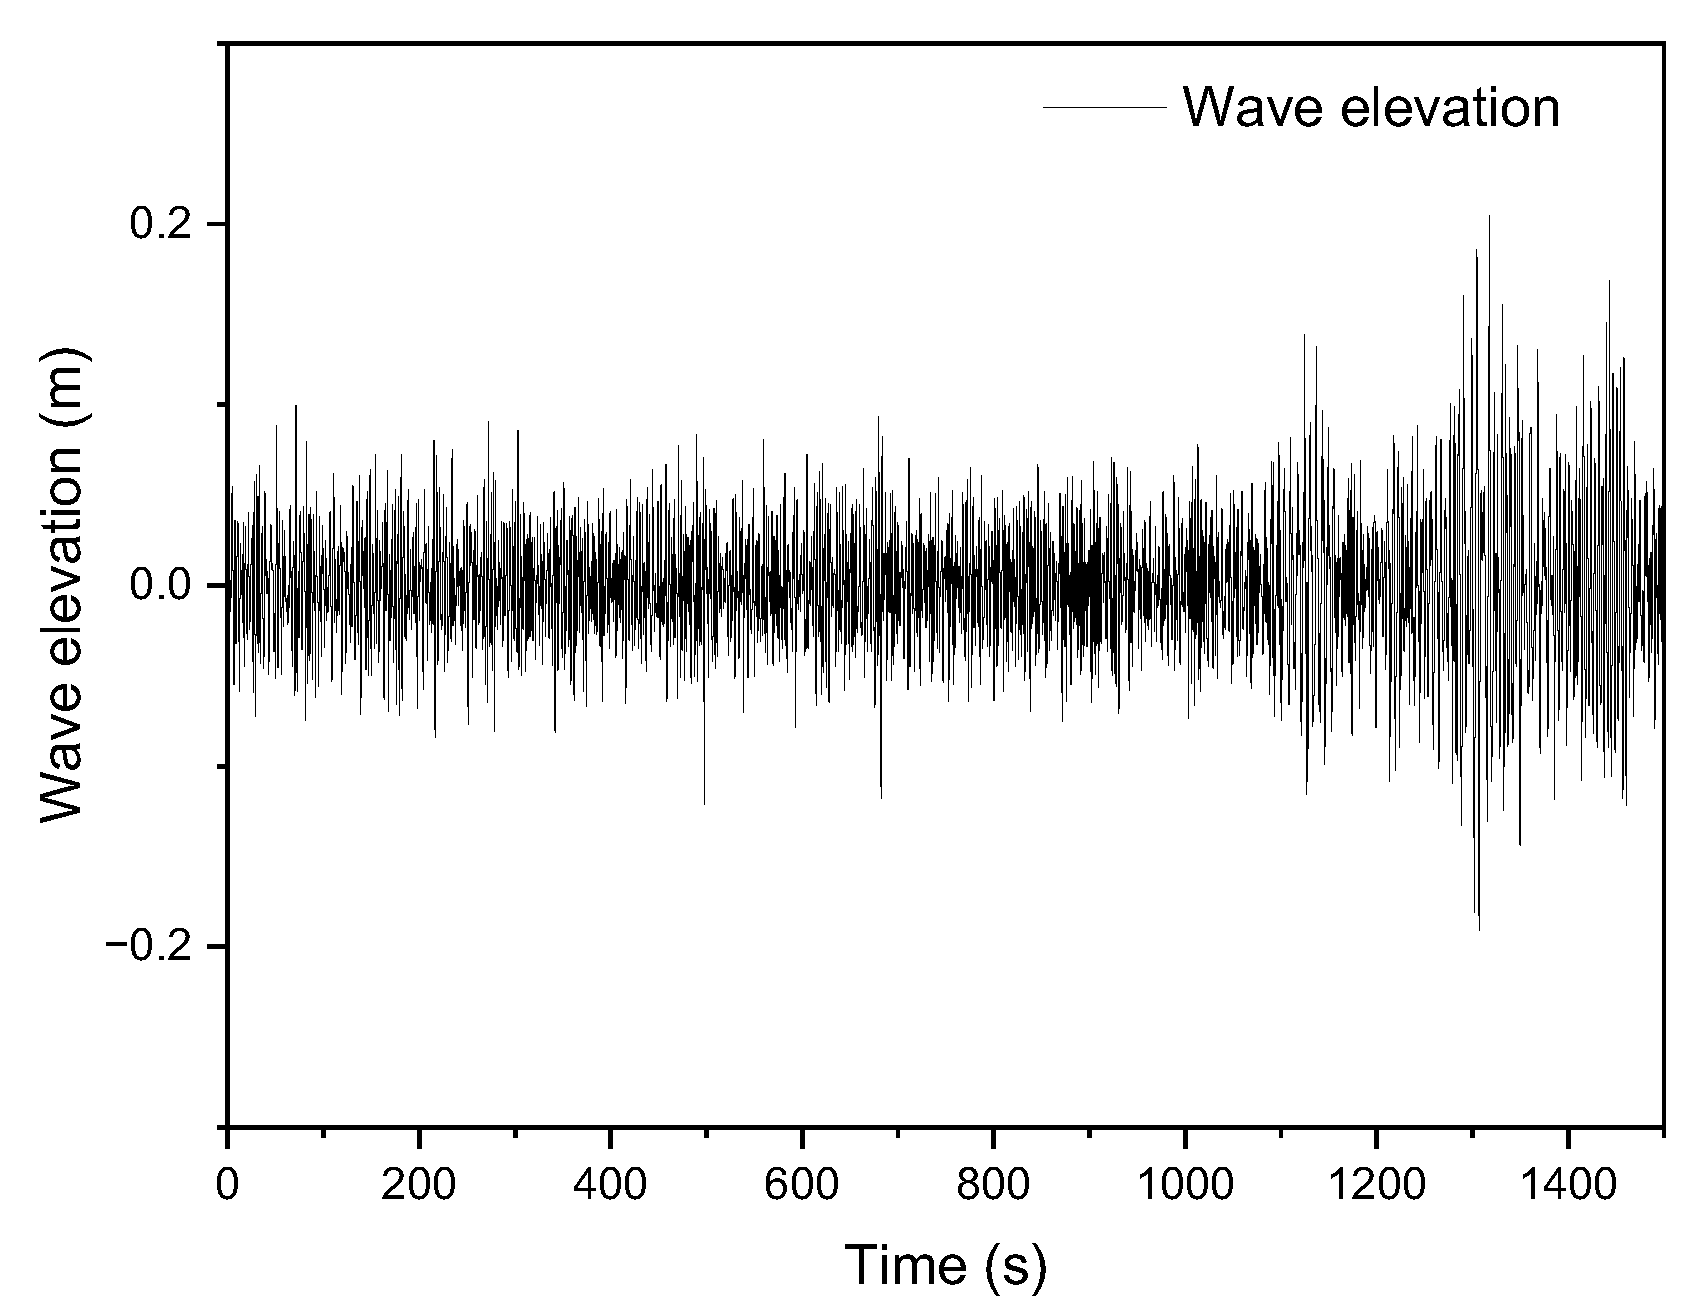
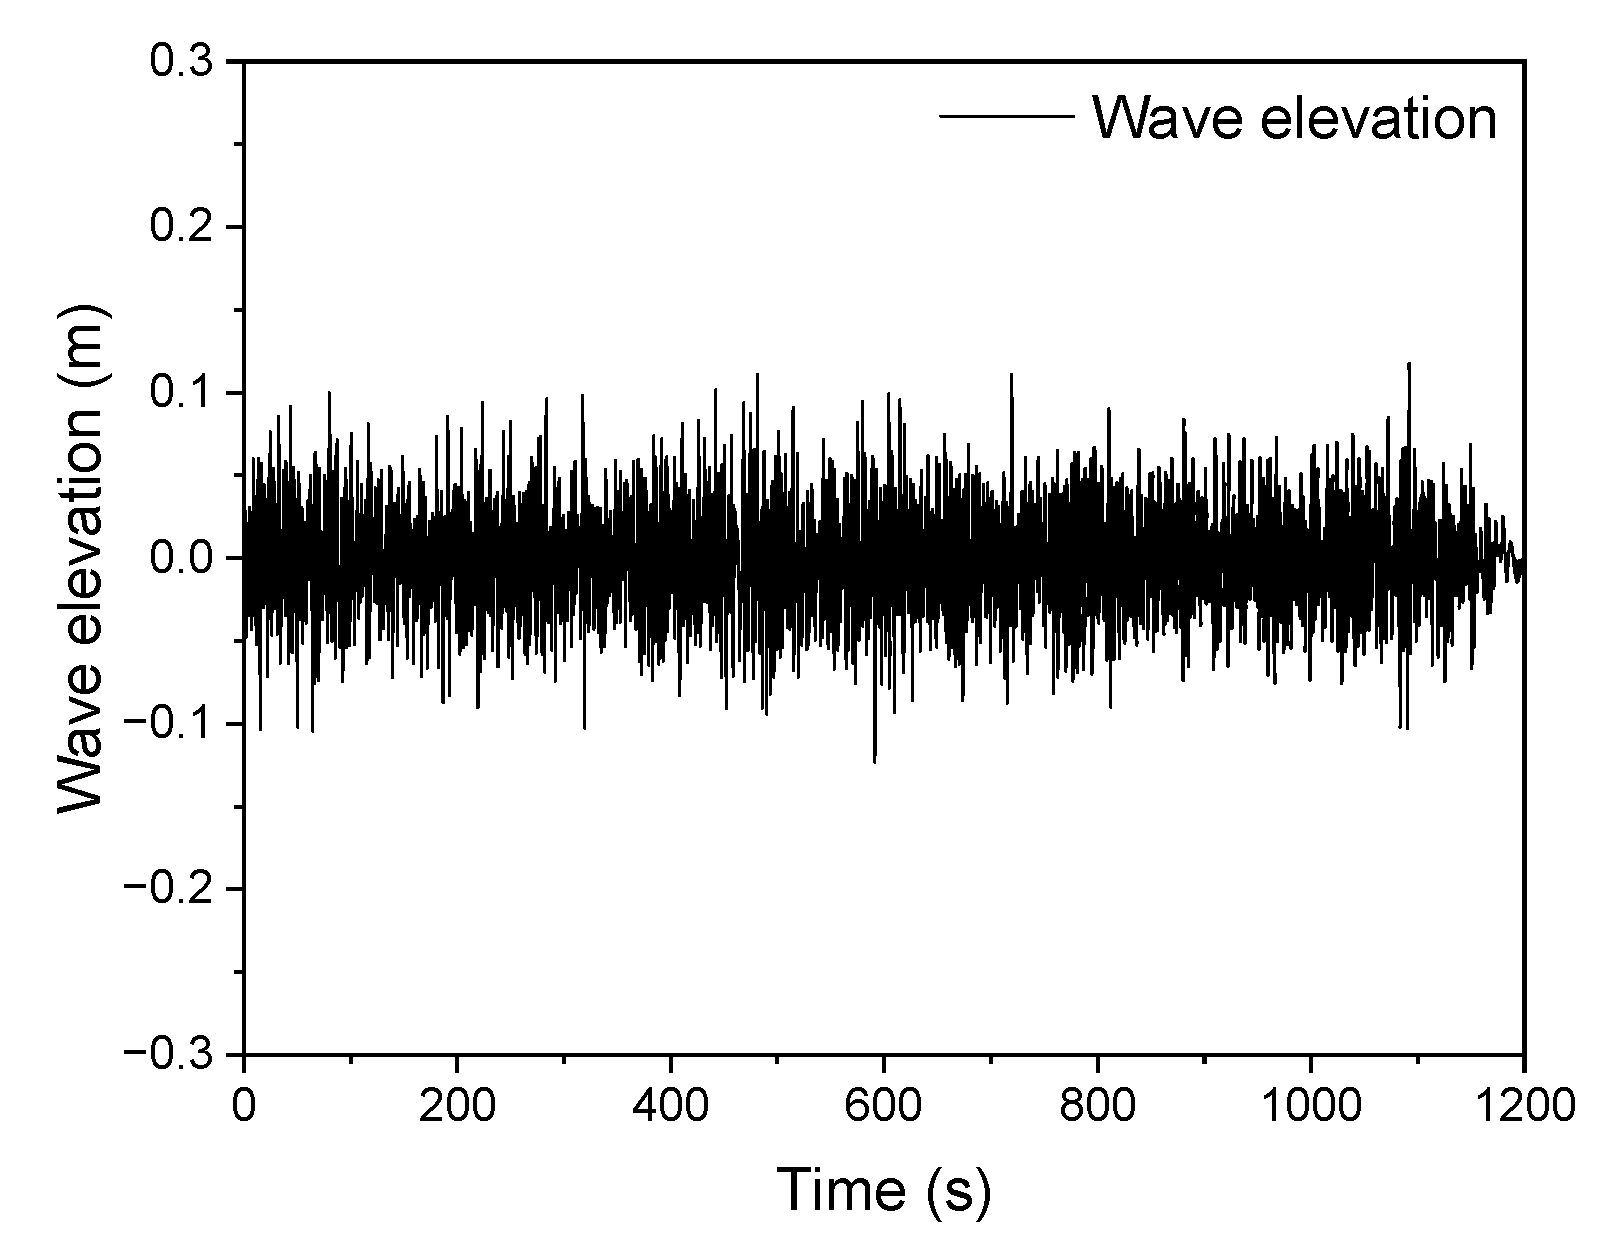
Figure 21.
Selected wave elevation data for numerical validation of the basic configuration.
Figure 21.
Selected wave elevation data for numerical validation of the basic configuration.
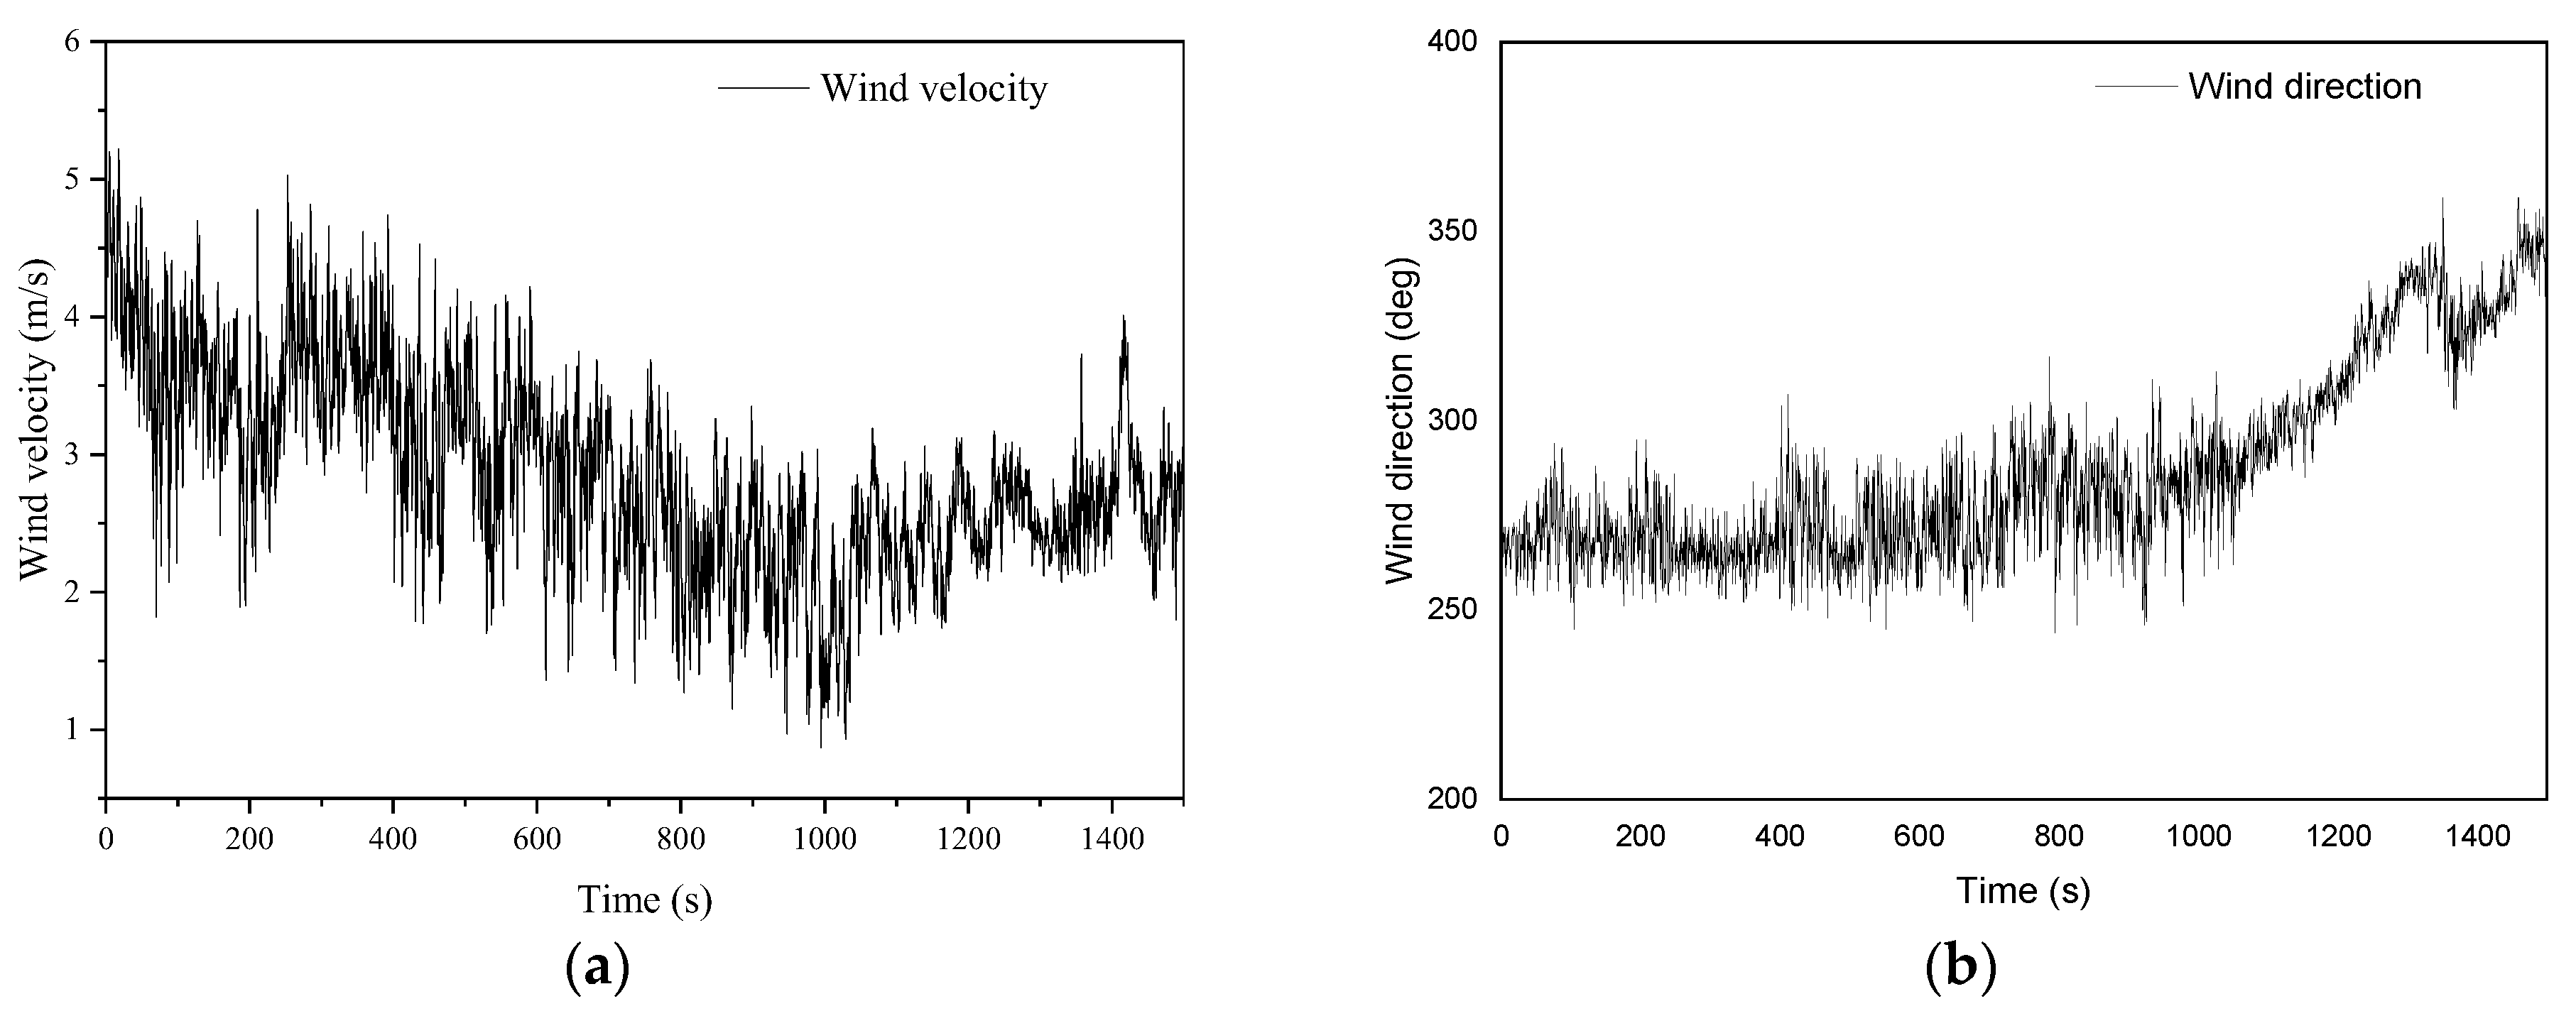
Figure 22.
Selected wind data for numerical validation of the basic configuration: (a) wind velocity and (b) wind direction.
Figure 22.
Selected wind data for numerical validation of the basic configuration: (a) wind velocity and (b) wind direction.
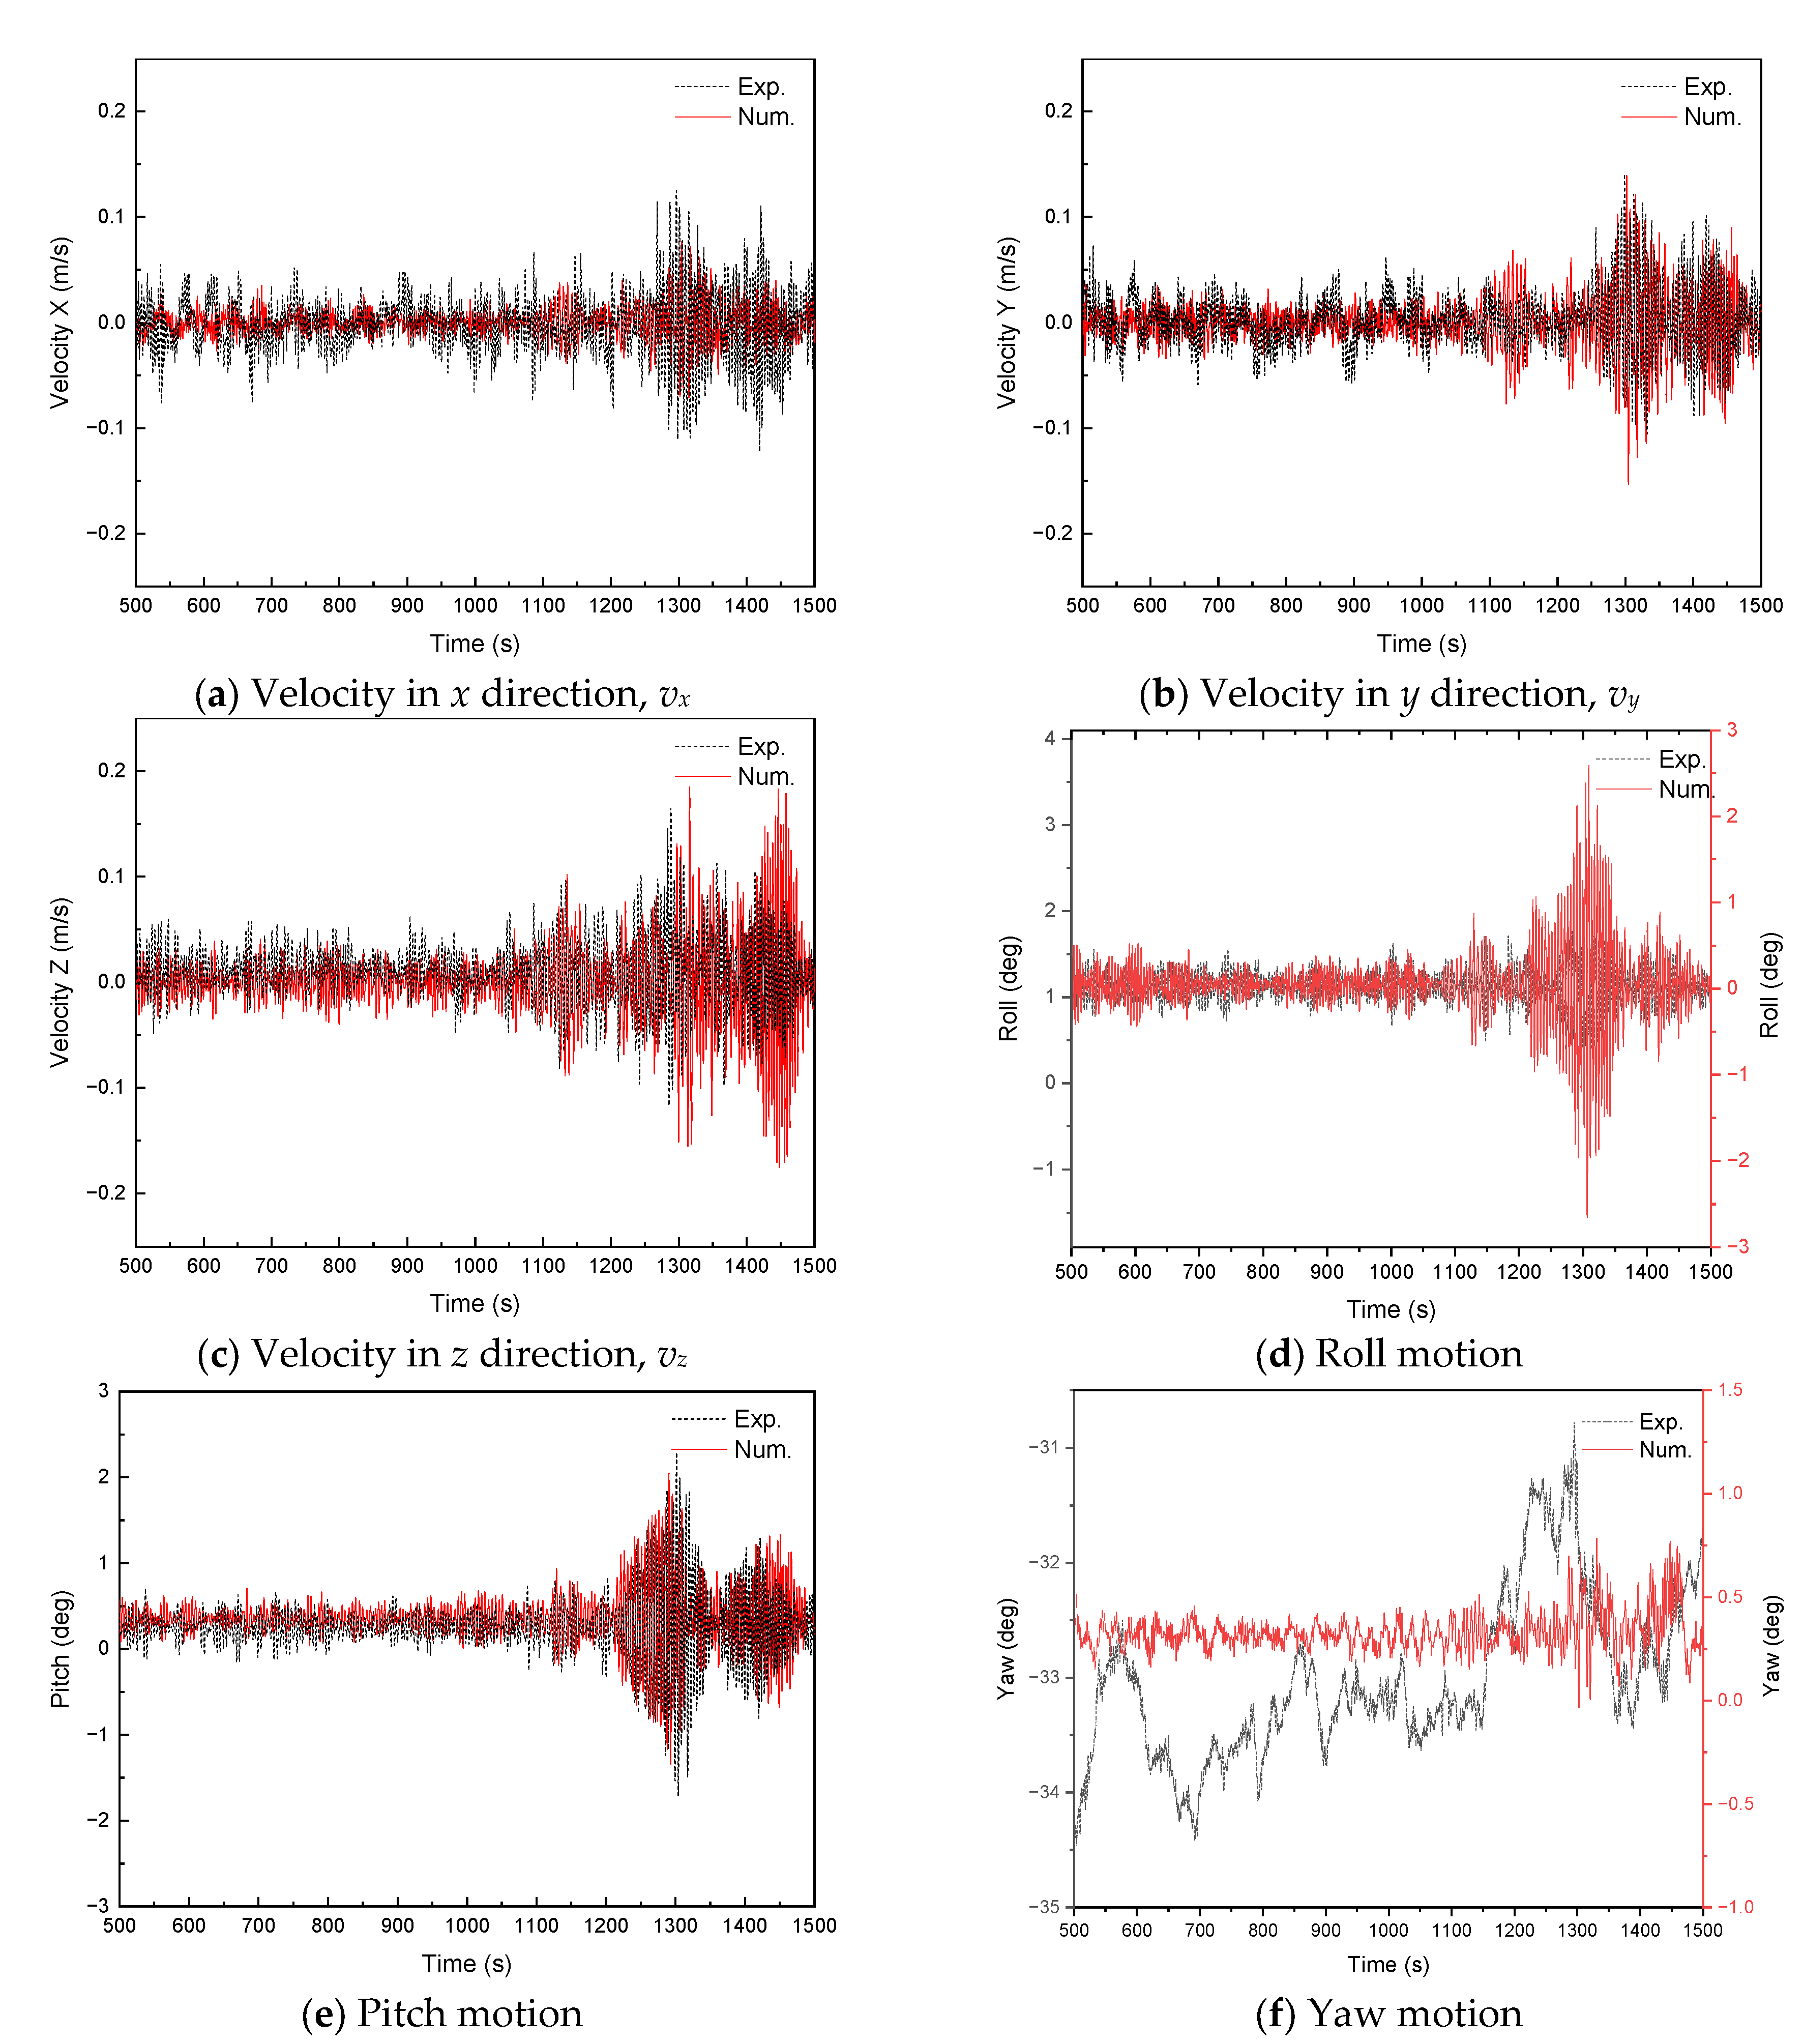
Figure 23.
Comparisons of platform motion time histories between numerical simulation results and experimental records.
Figure 23.
Comparisons of platform motion time histories between numerical simulation results and experimental records.
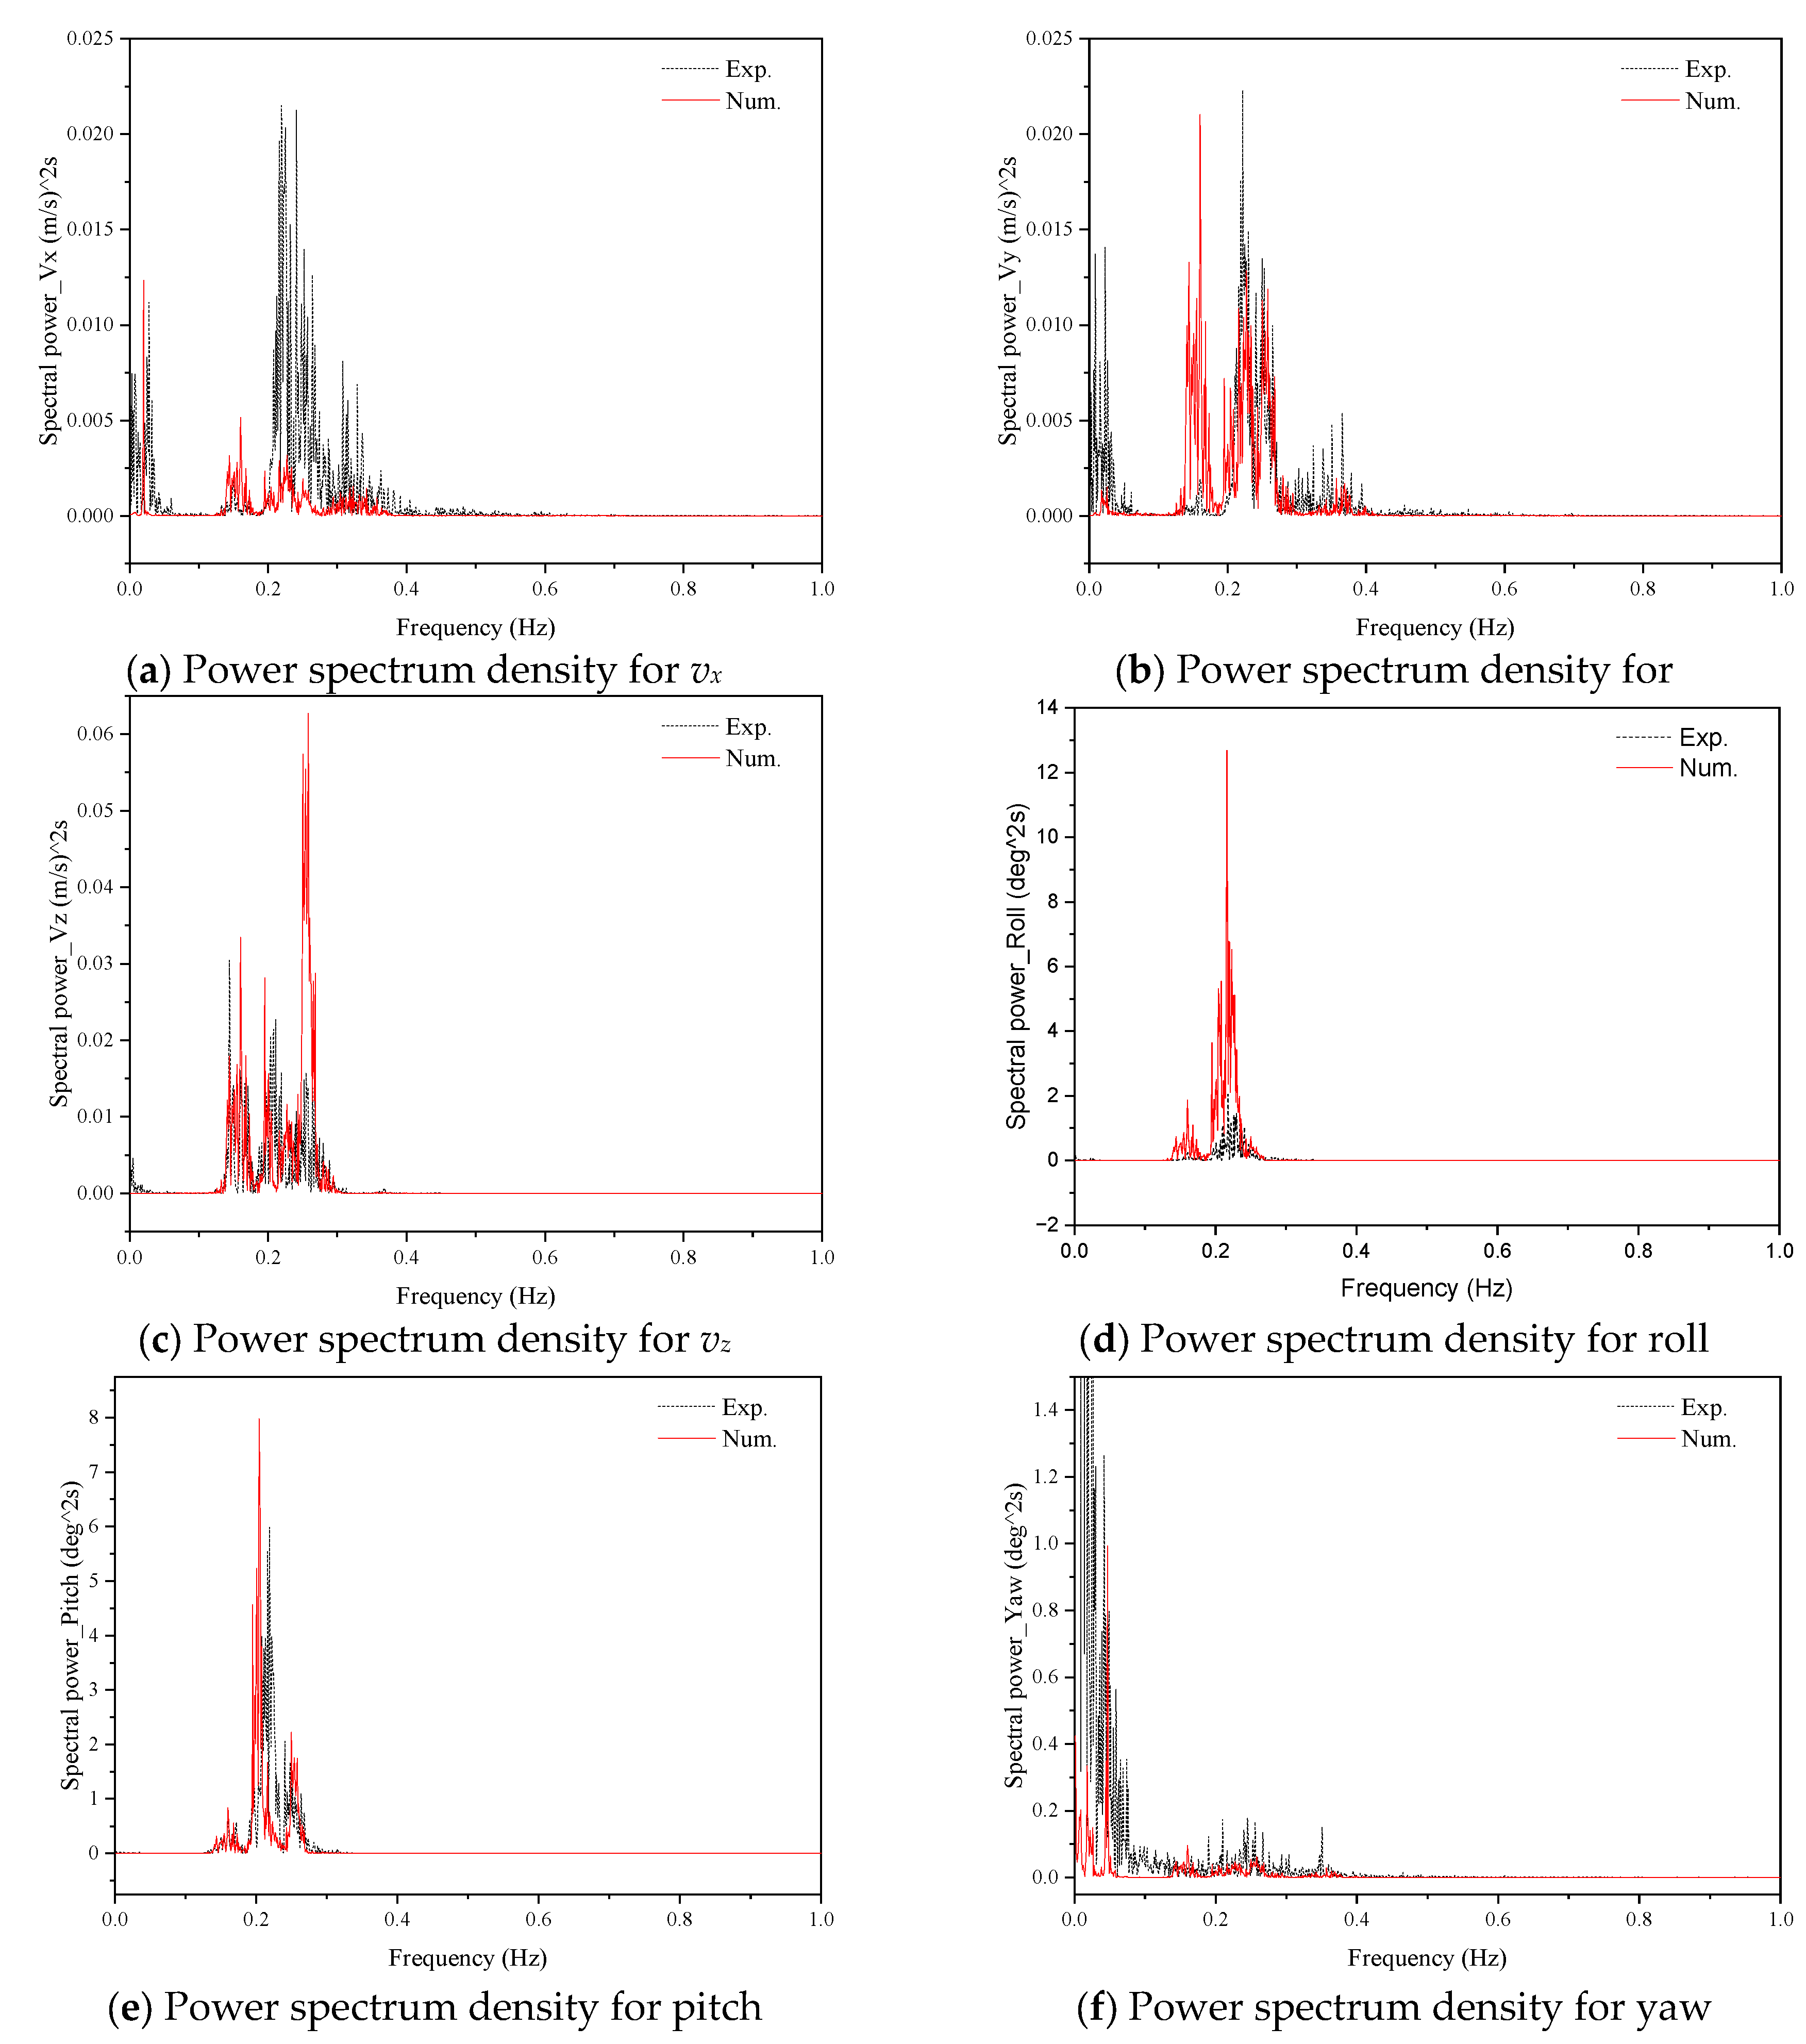
Figure 24.
Comparisons of platform motion power spectrum densities between numerical results and experimental records.
Figure 24.
Comparisons of platform motion power spectrum densities between numerical results and experimental records.
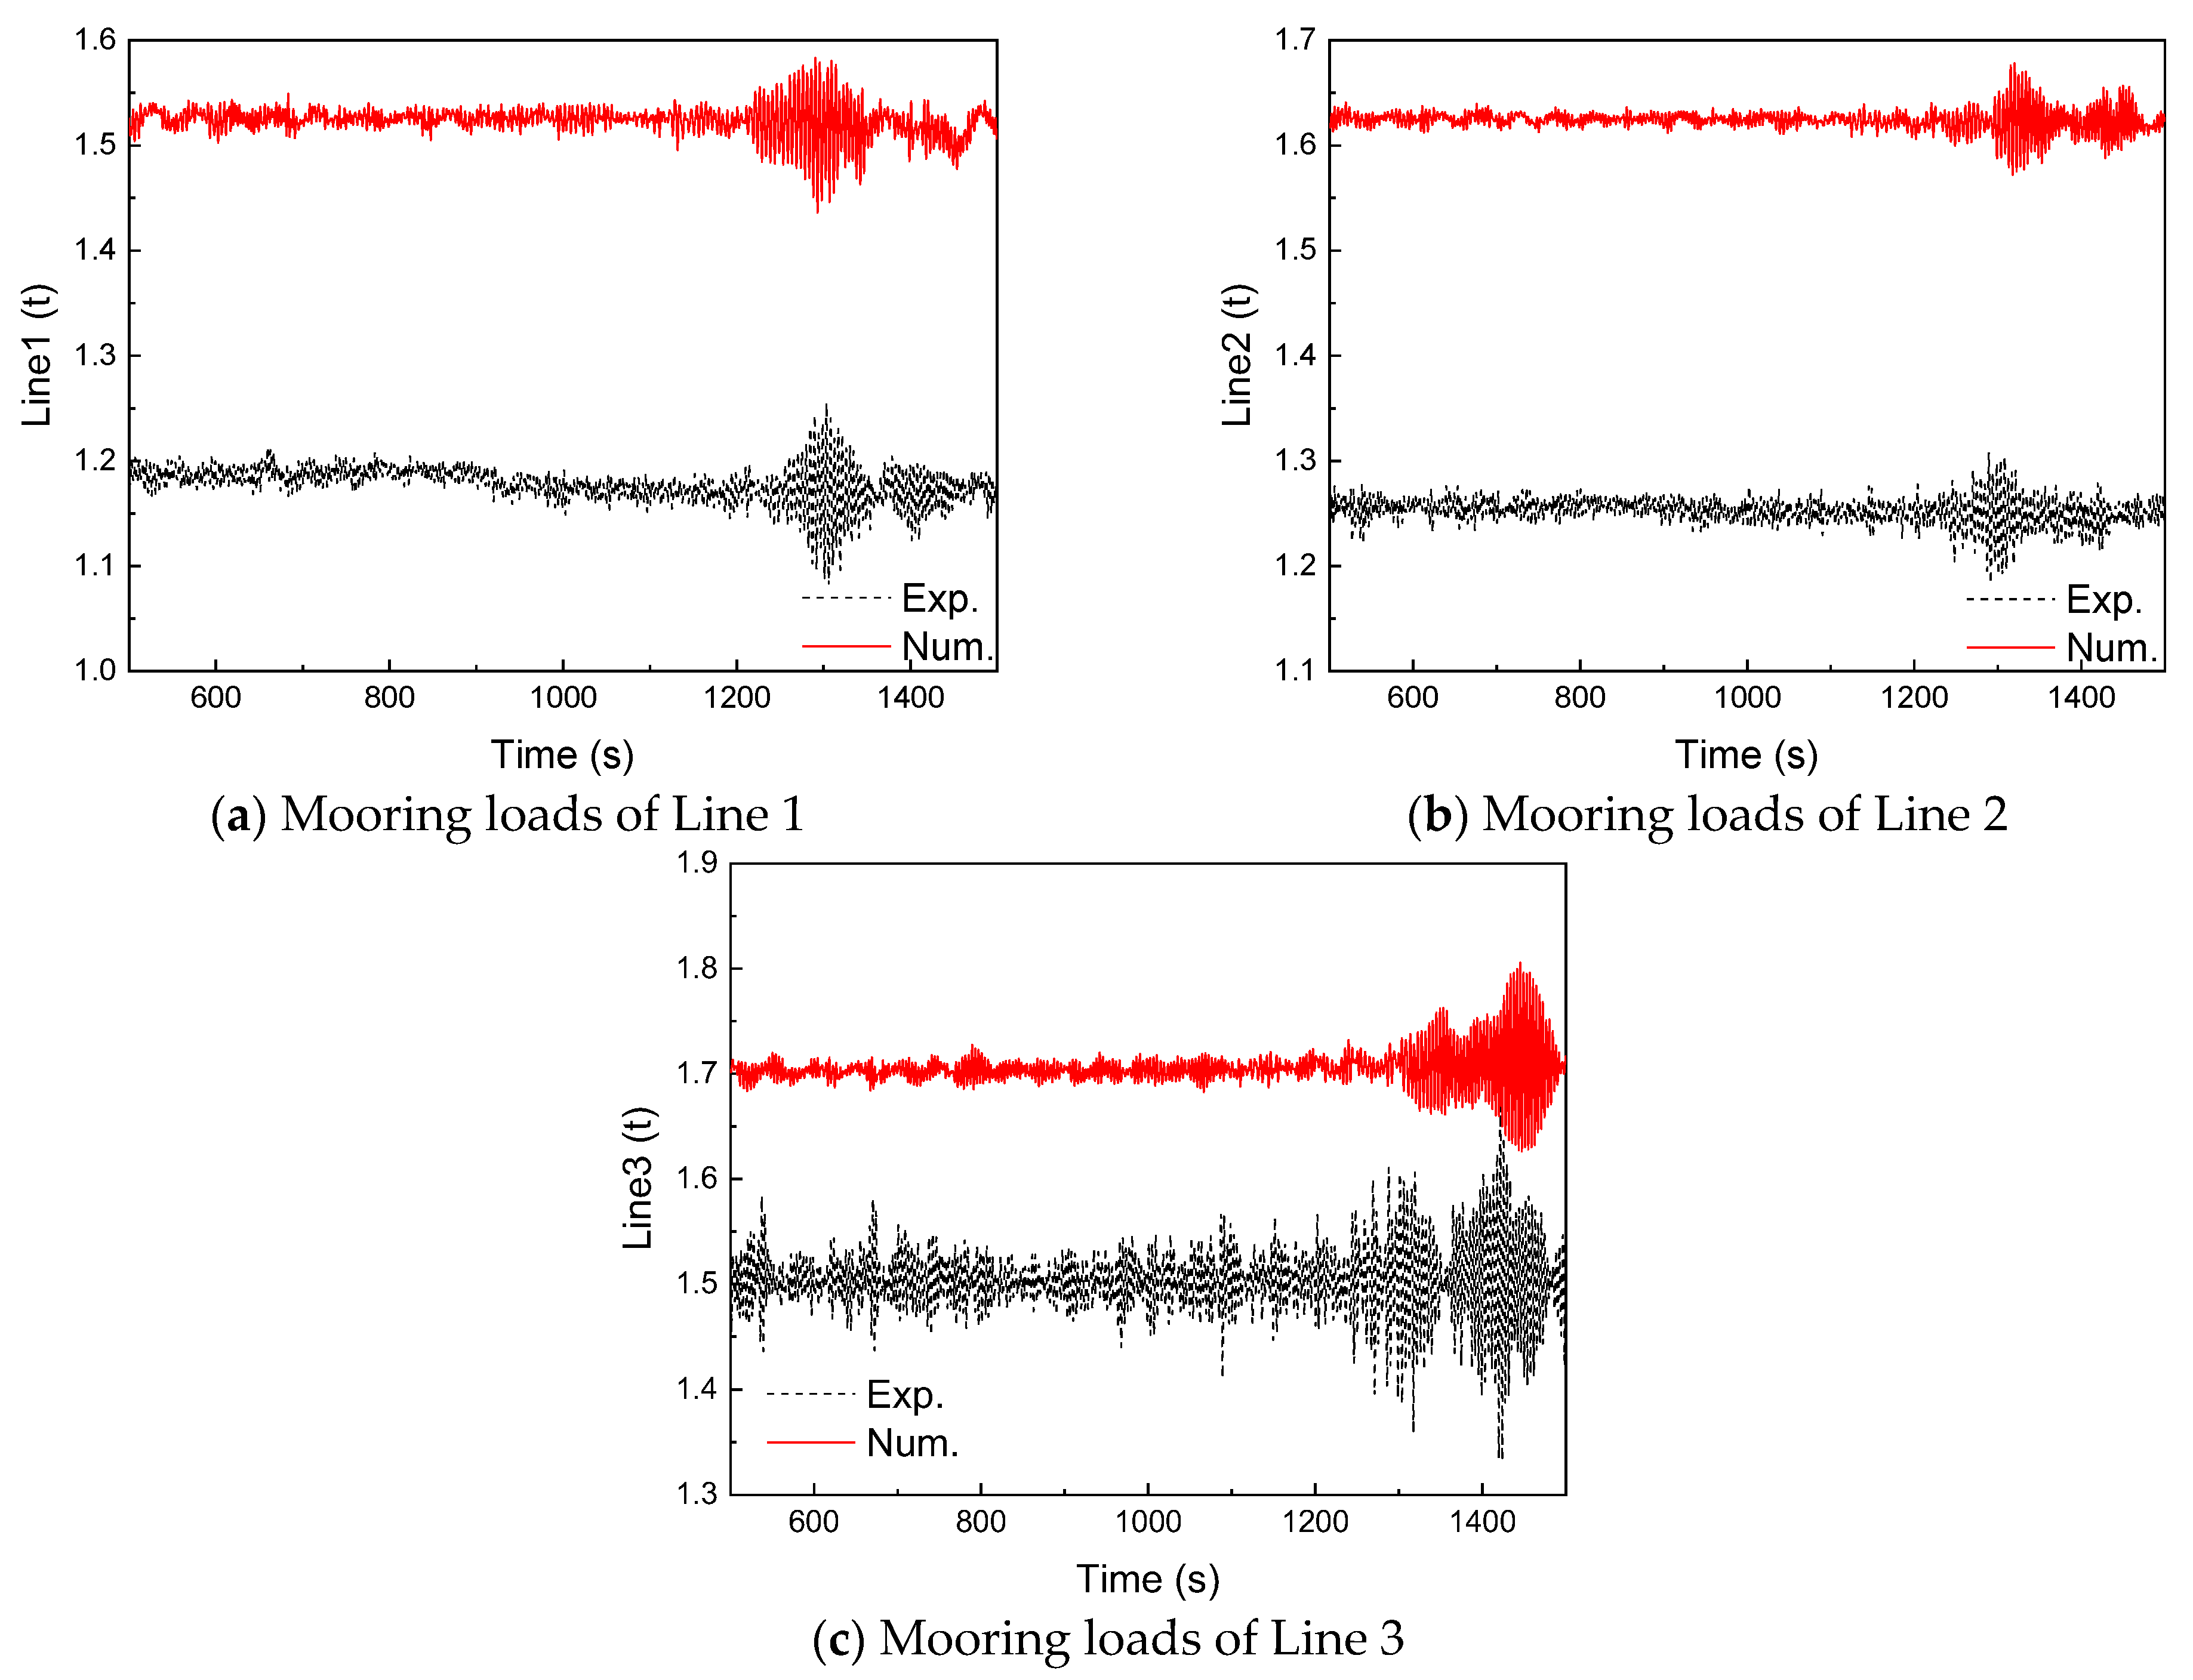
Figure 25.
Comparisons of time histories of mooring loads between numerical simulation results and experimental records.
Figure 25.
Comparisons of time histories of mooring loads between numerical simulation results and experimental records.
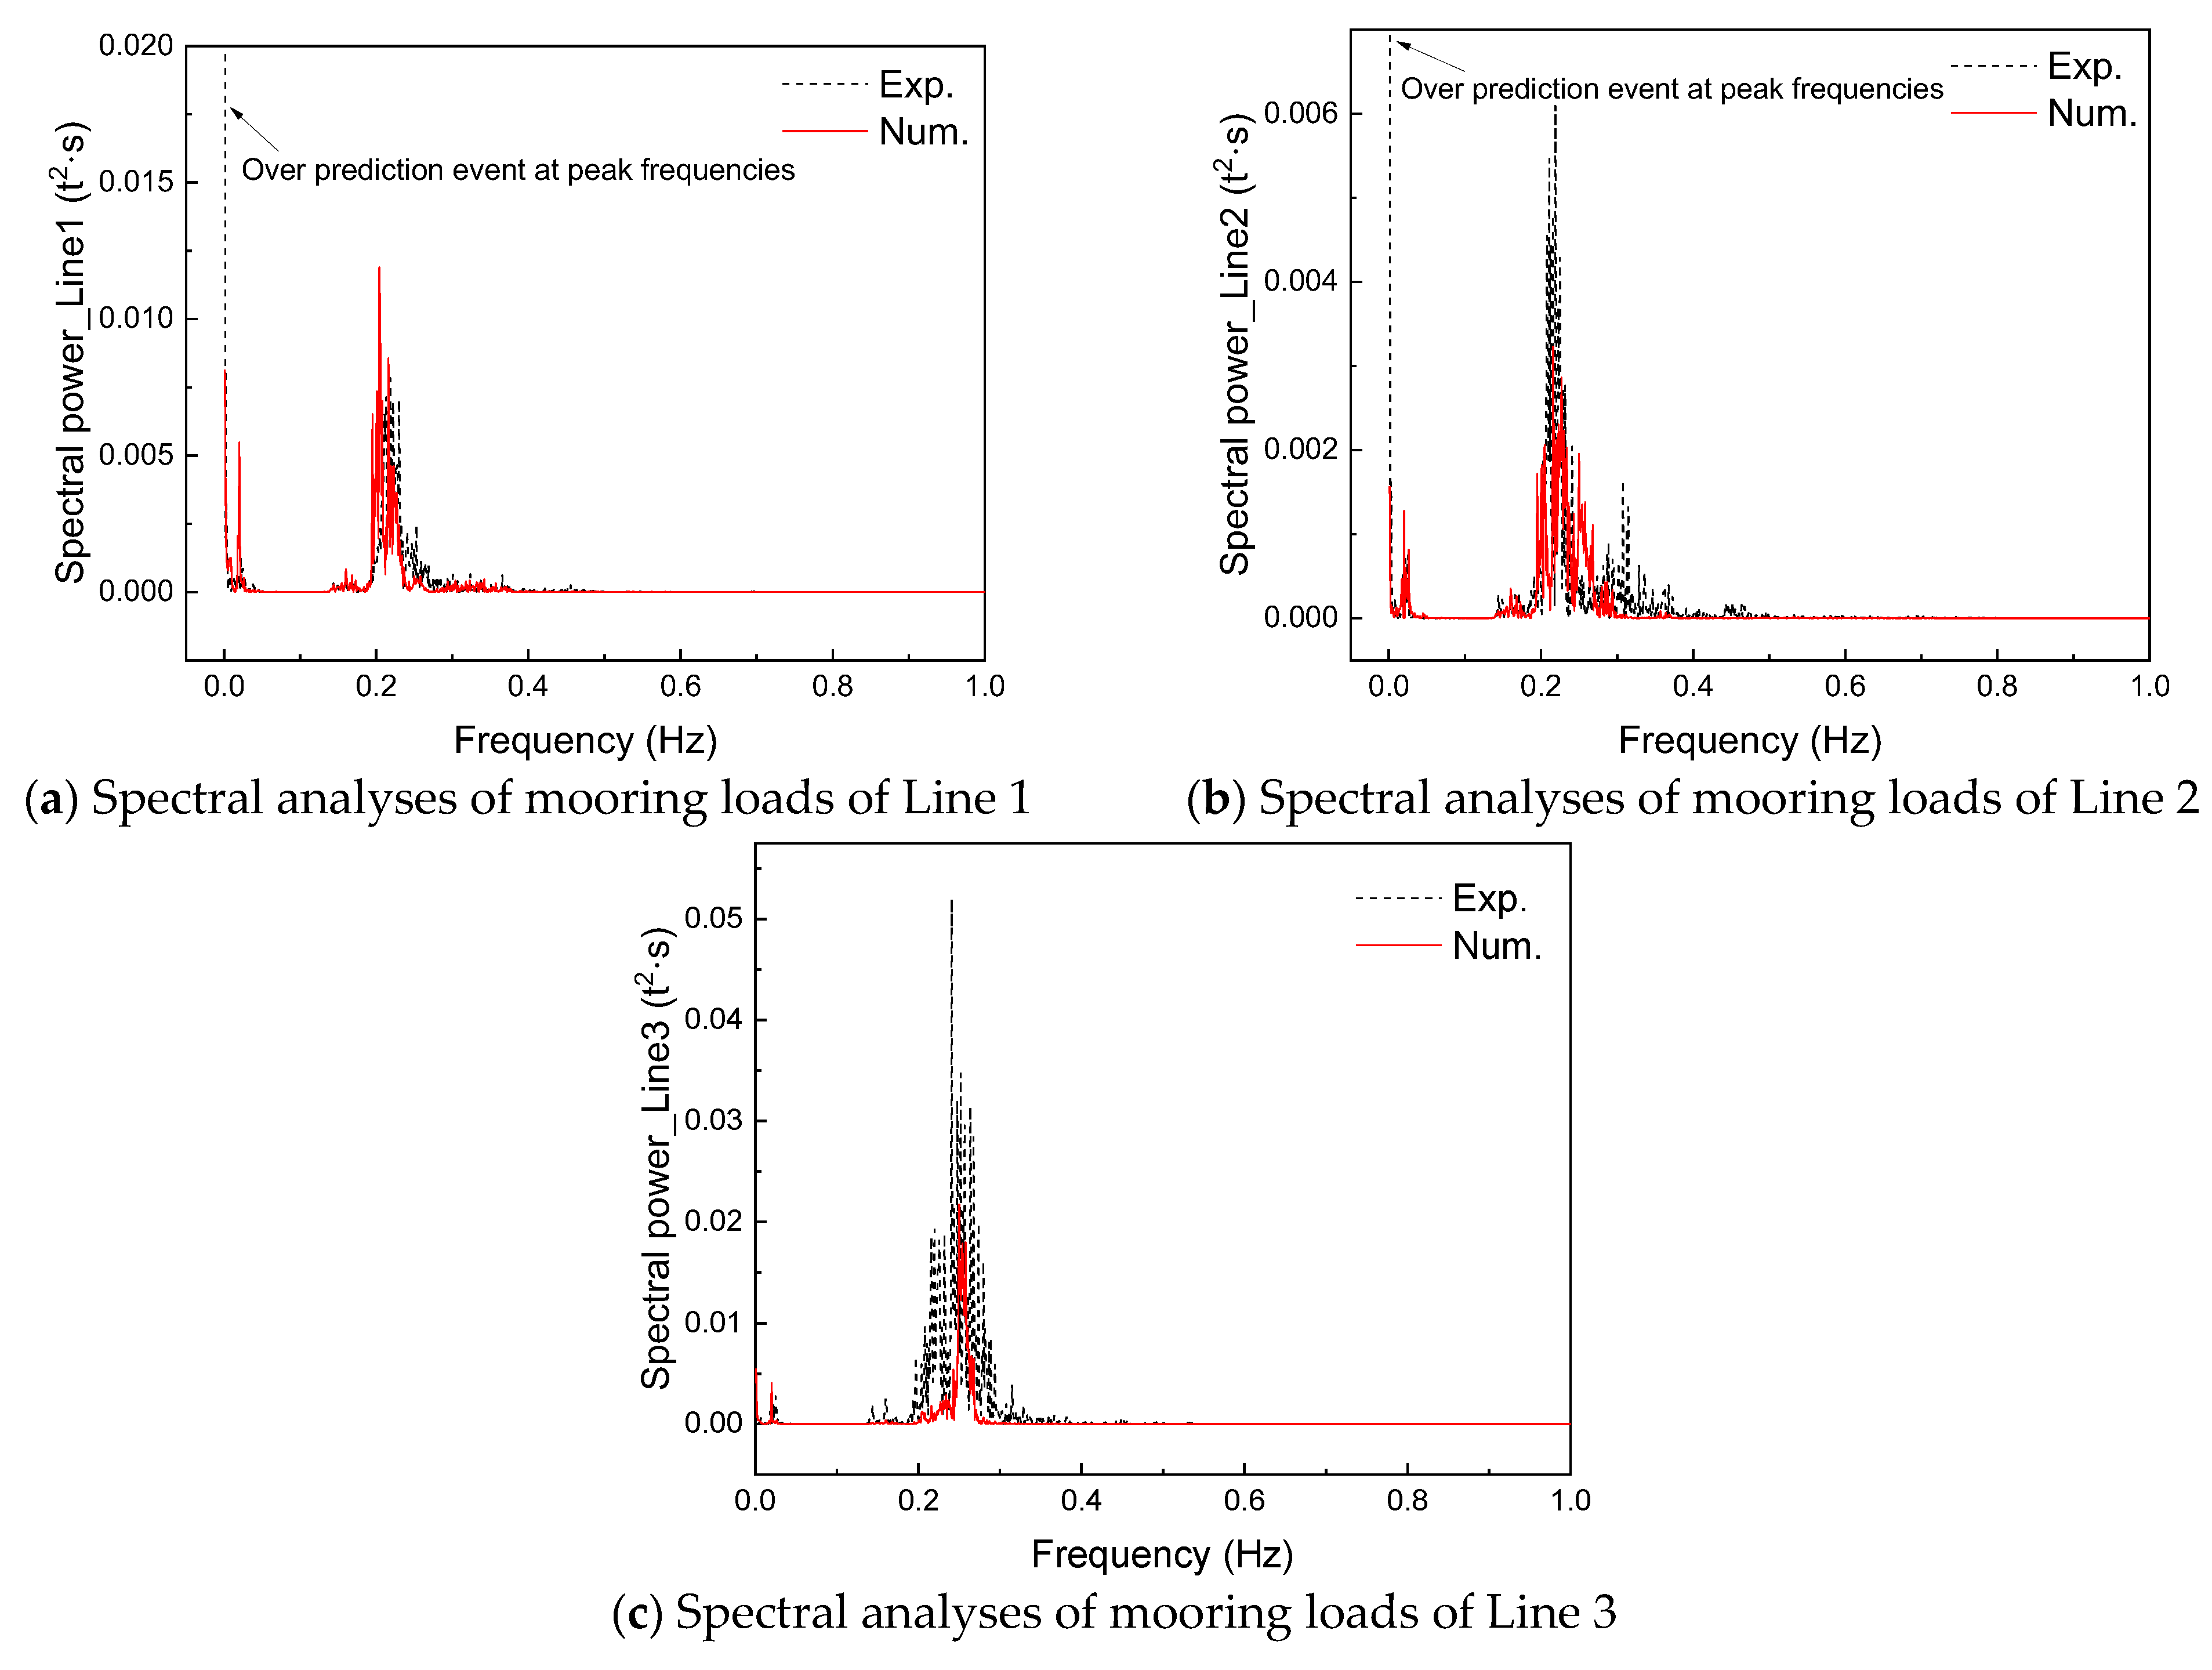
Figure 26.
Comparisons of spectral analyses of mooring loads between numerical simulation results and experimental records.
Figure 26.
Comparisons of spectral analyses of mooring loads between numerical simulation results and experimental records.
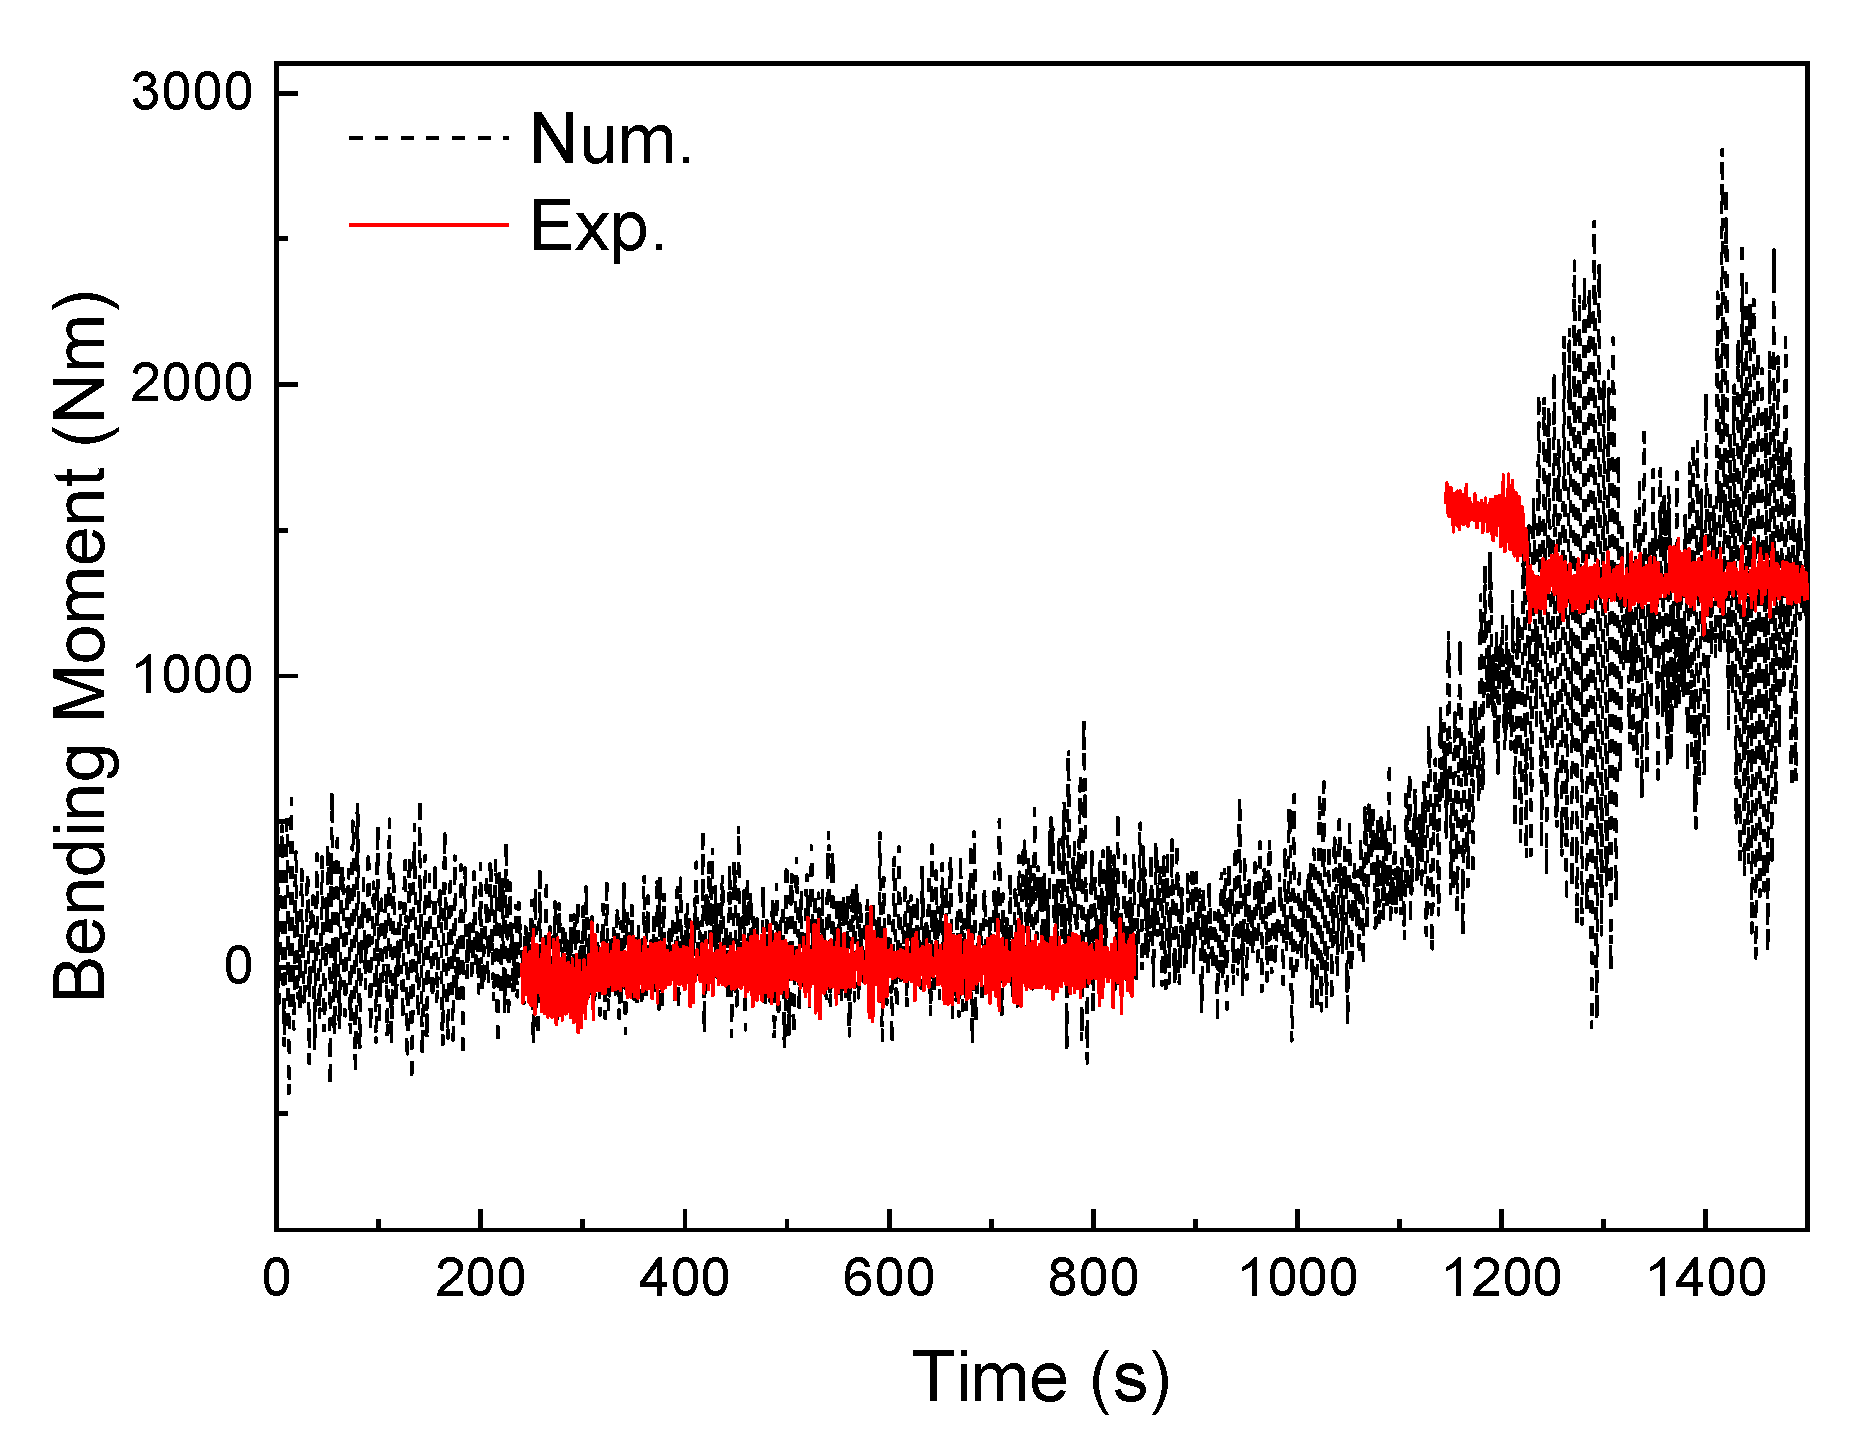
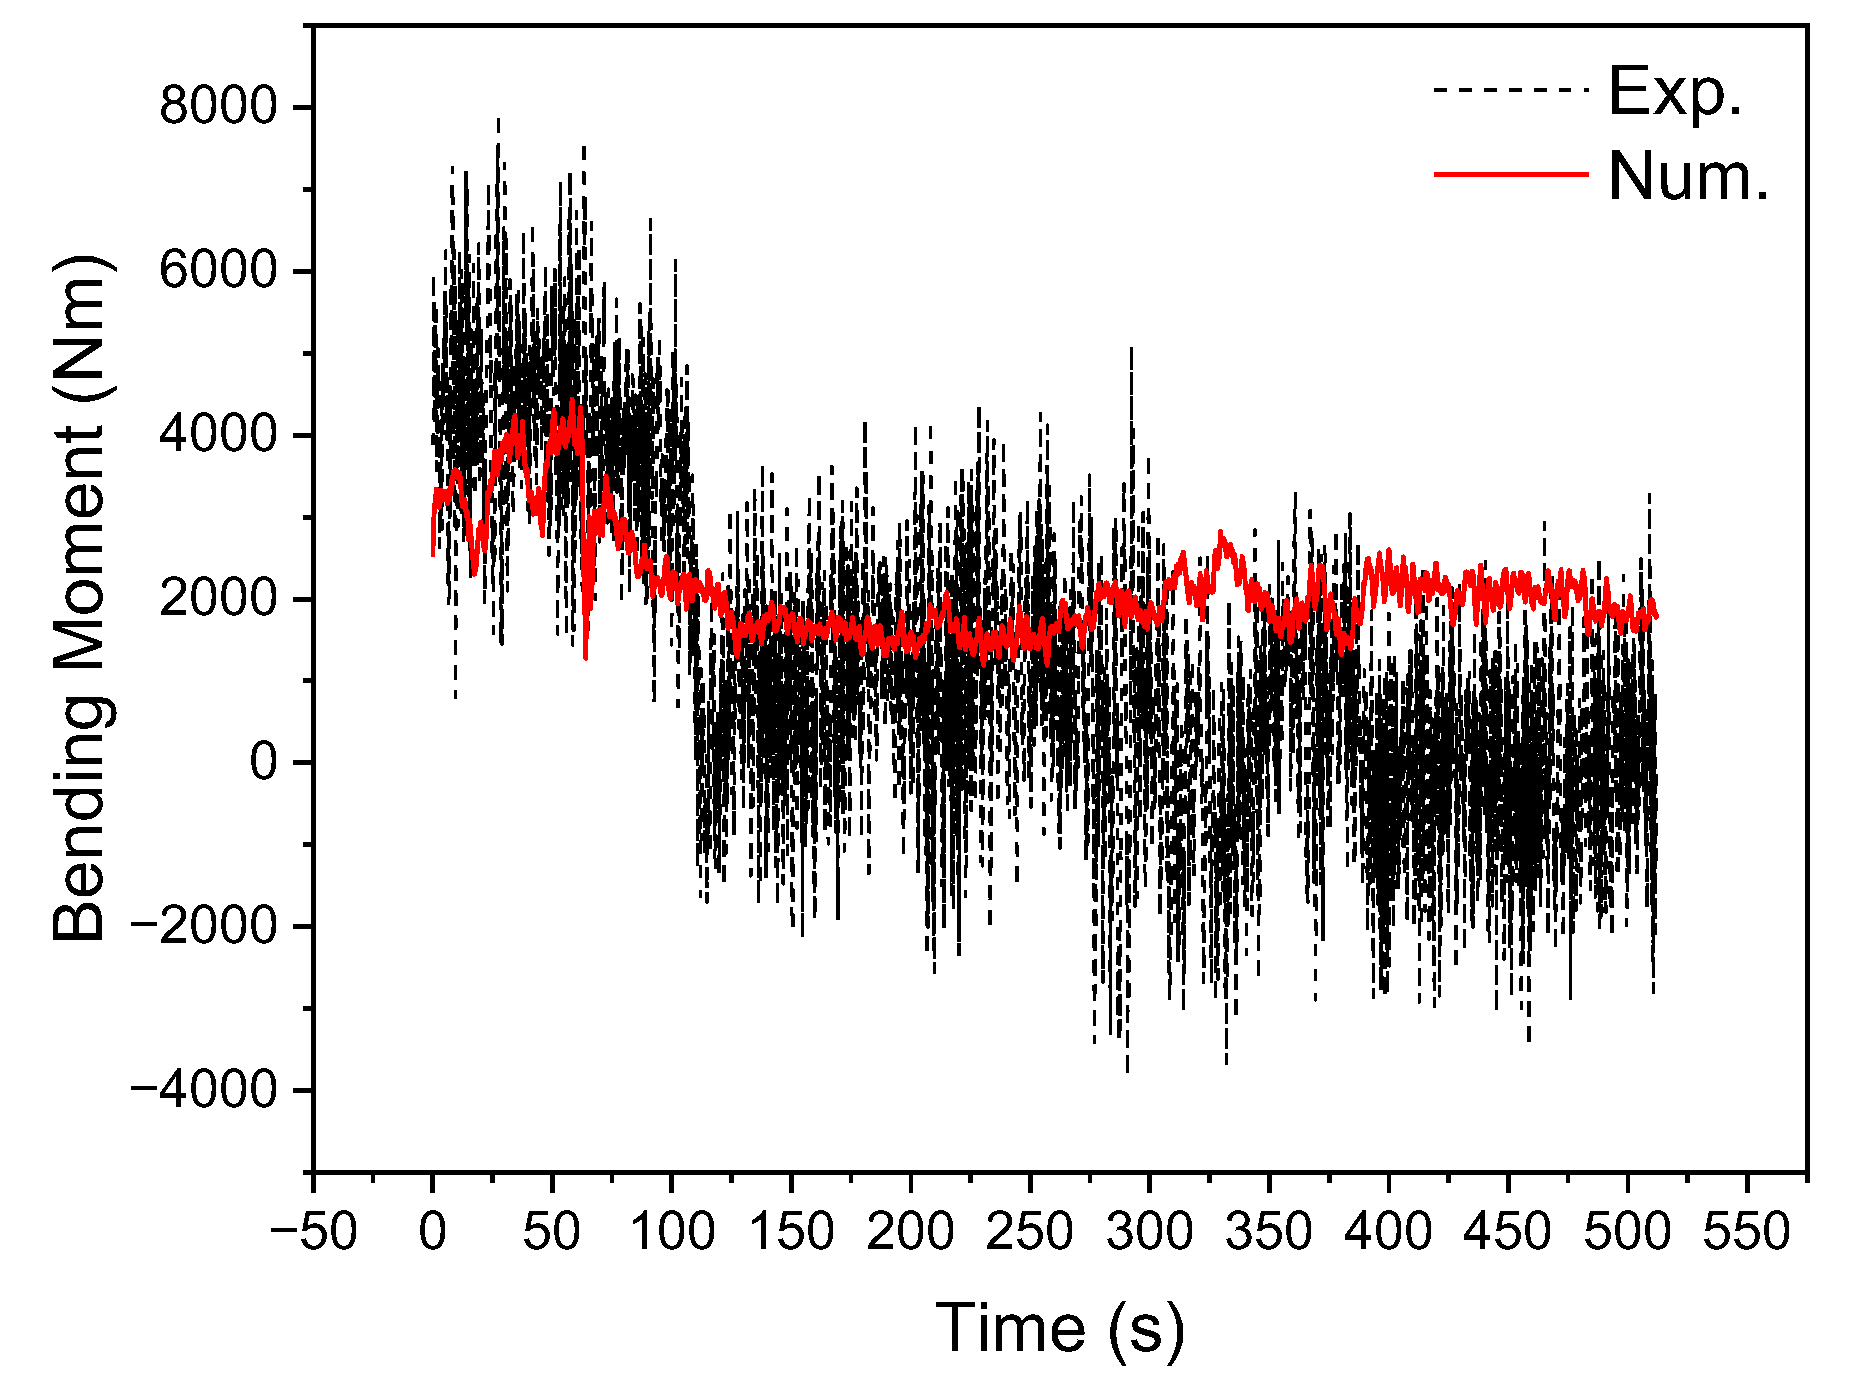
Figure 27.
Comparison of tower base bending moment between experimental records and numerical simulation.
Figure 27.
Comparison of tower base bending moment between experimental records and numerical simulation.
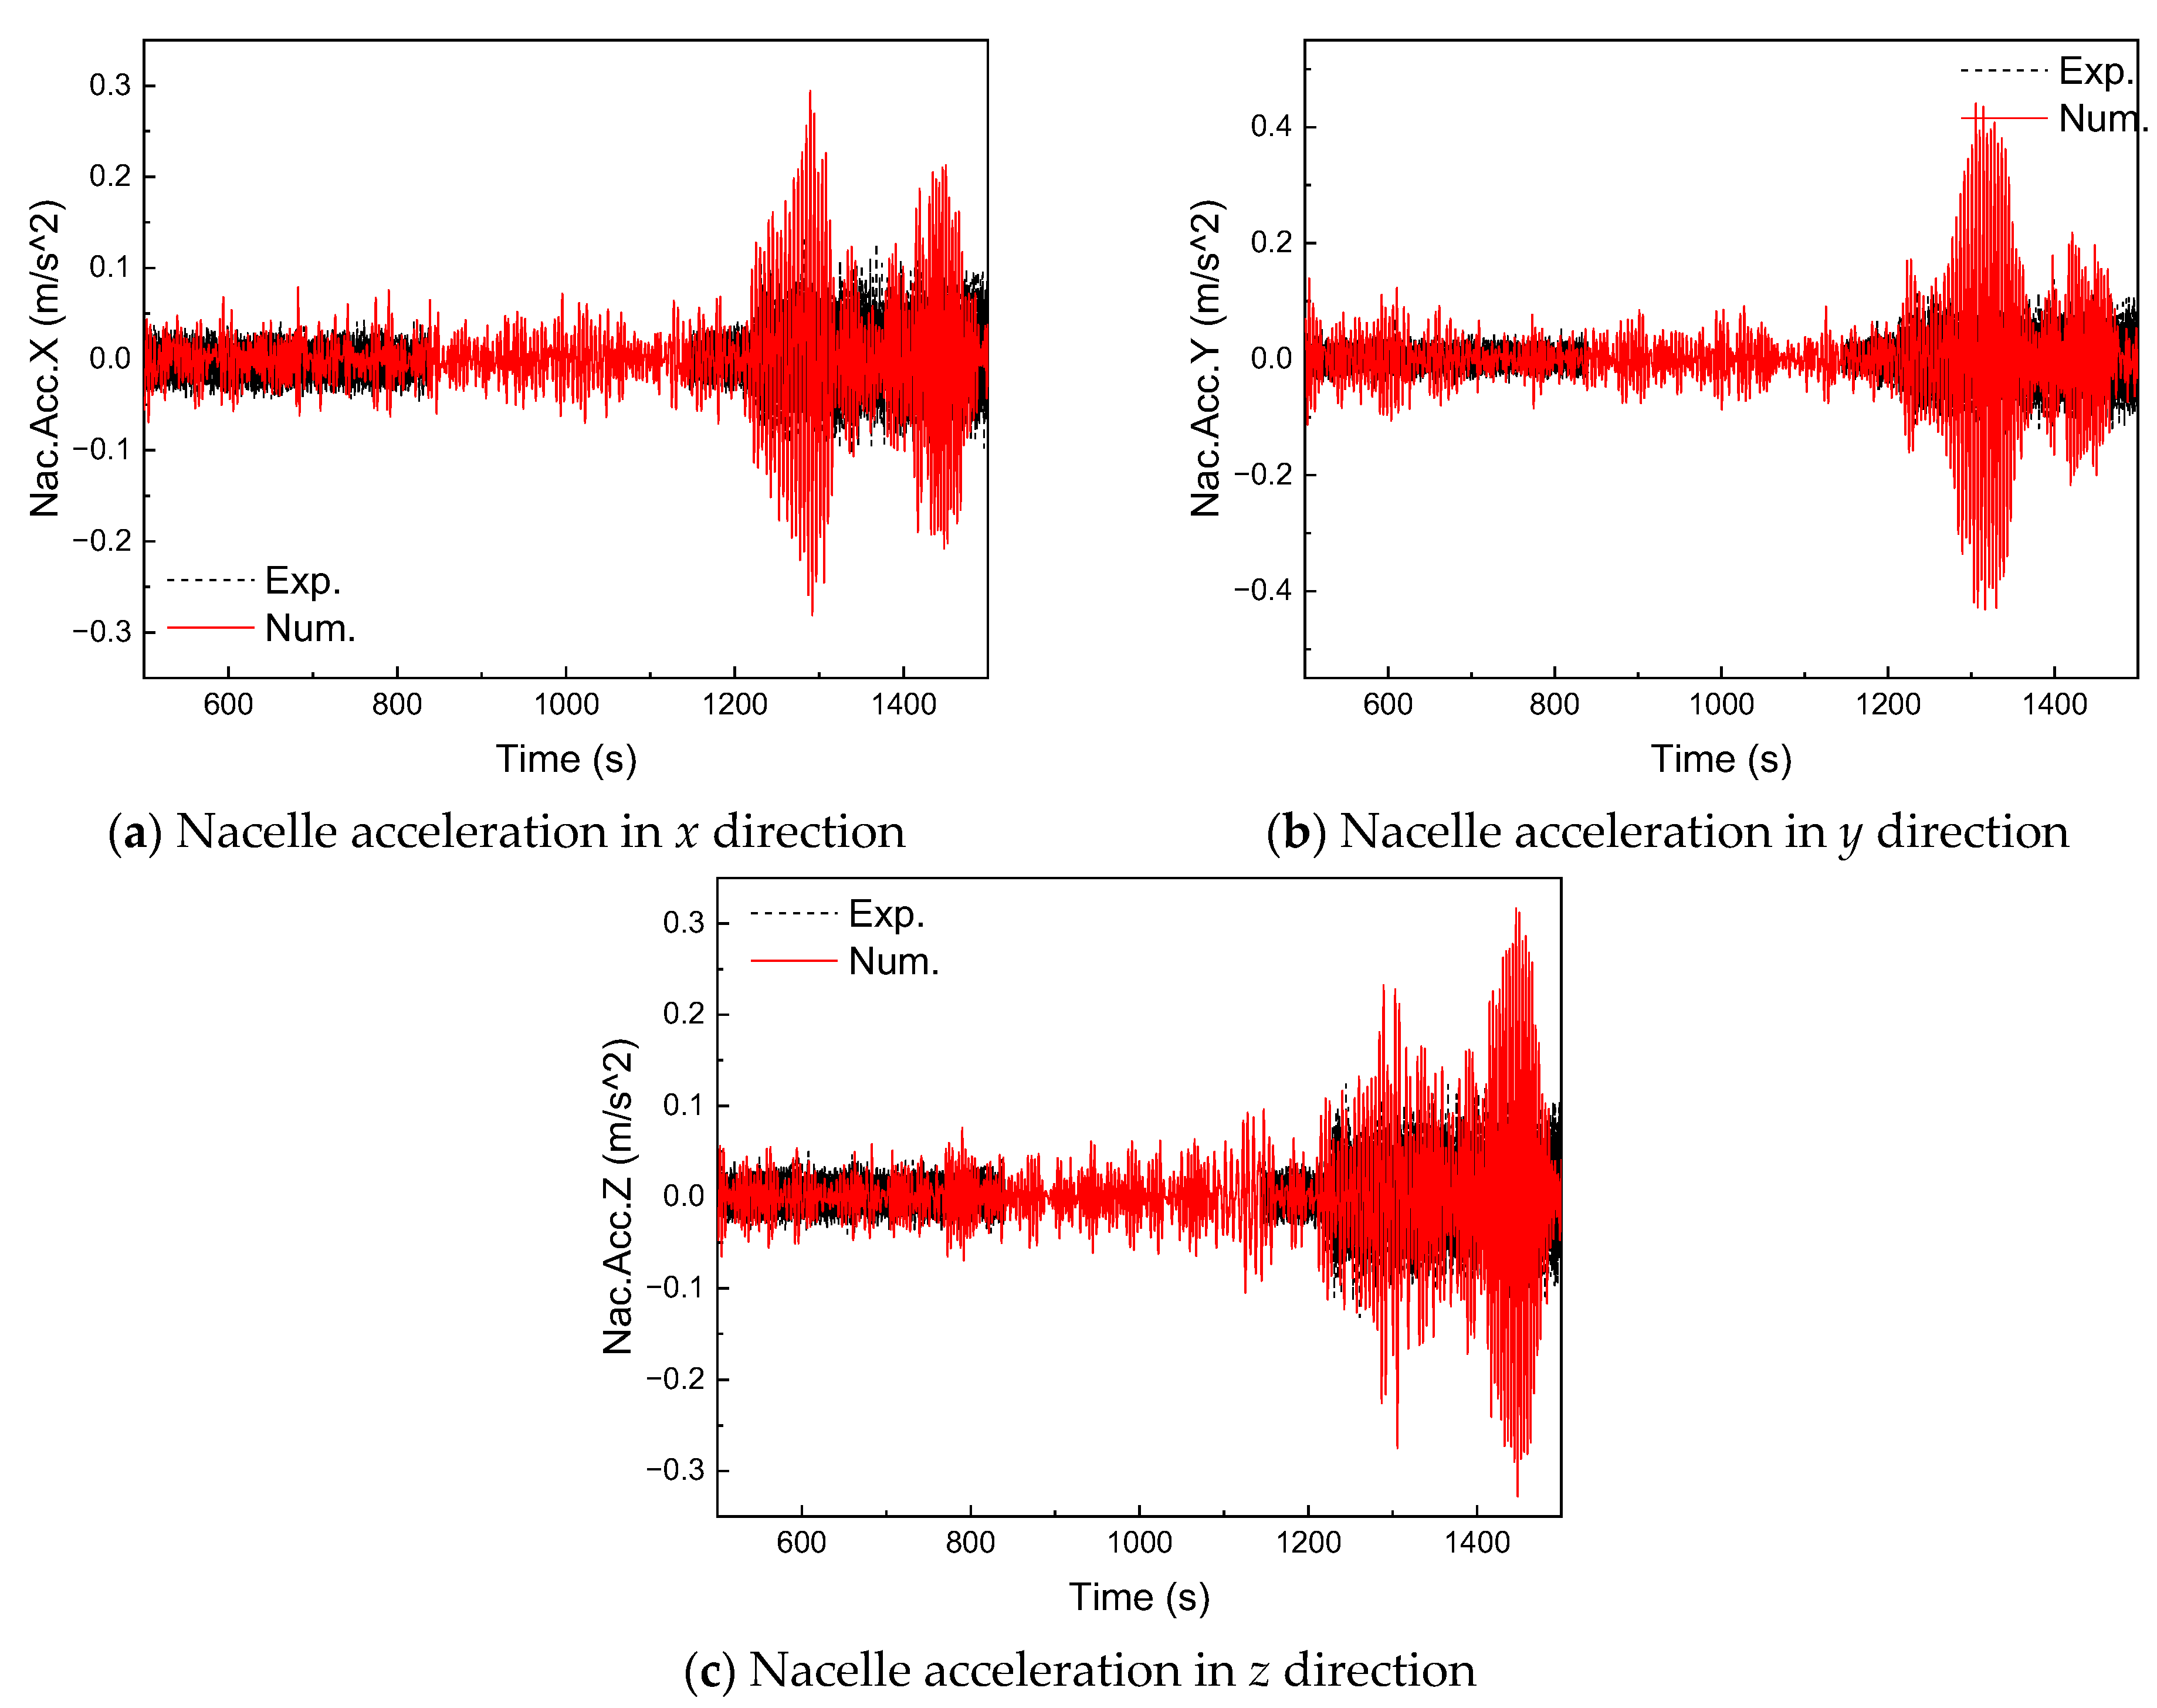
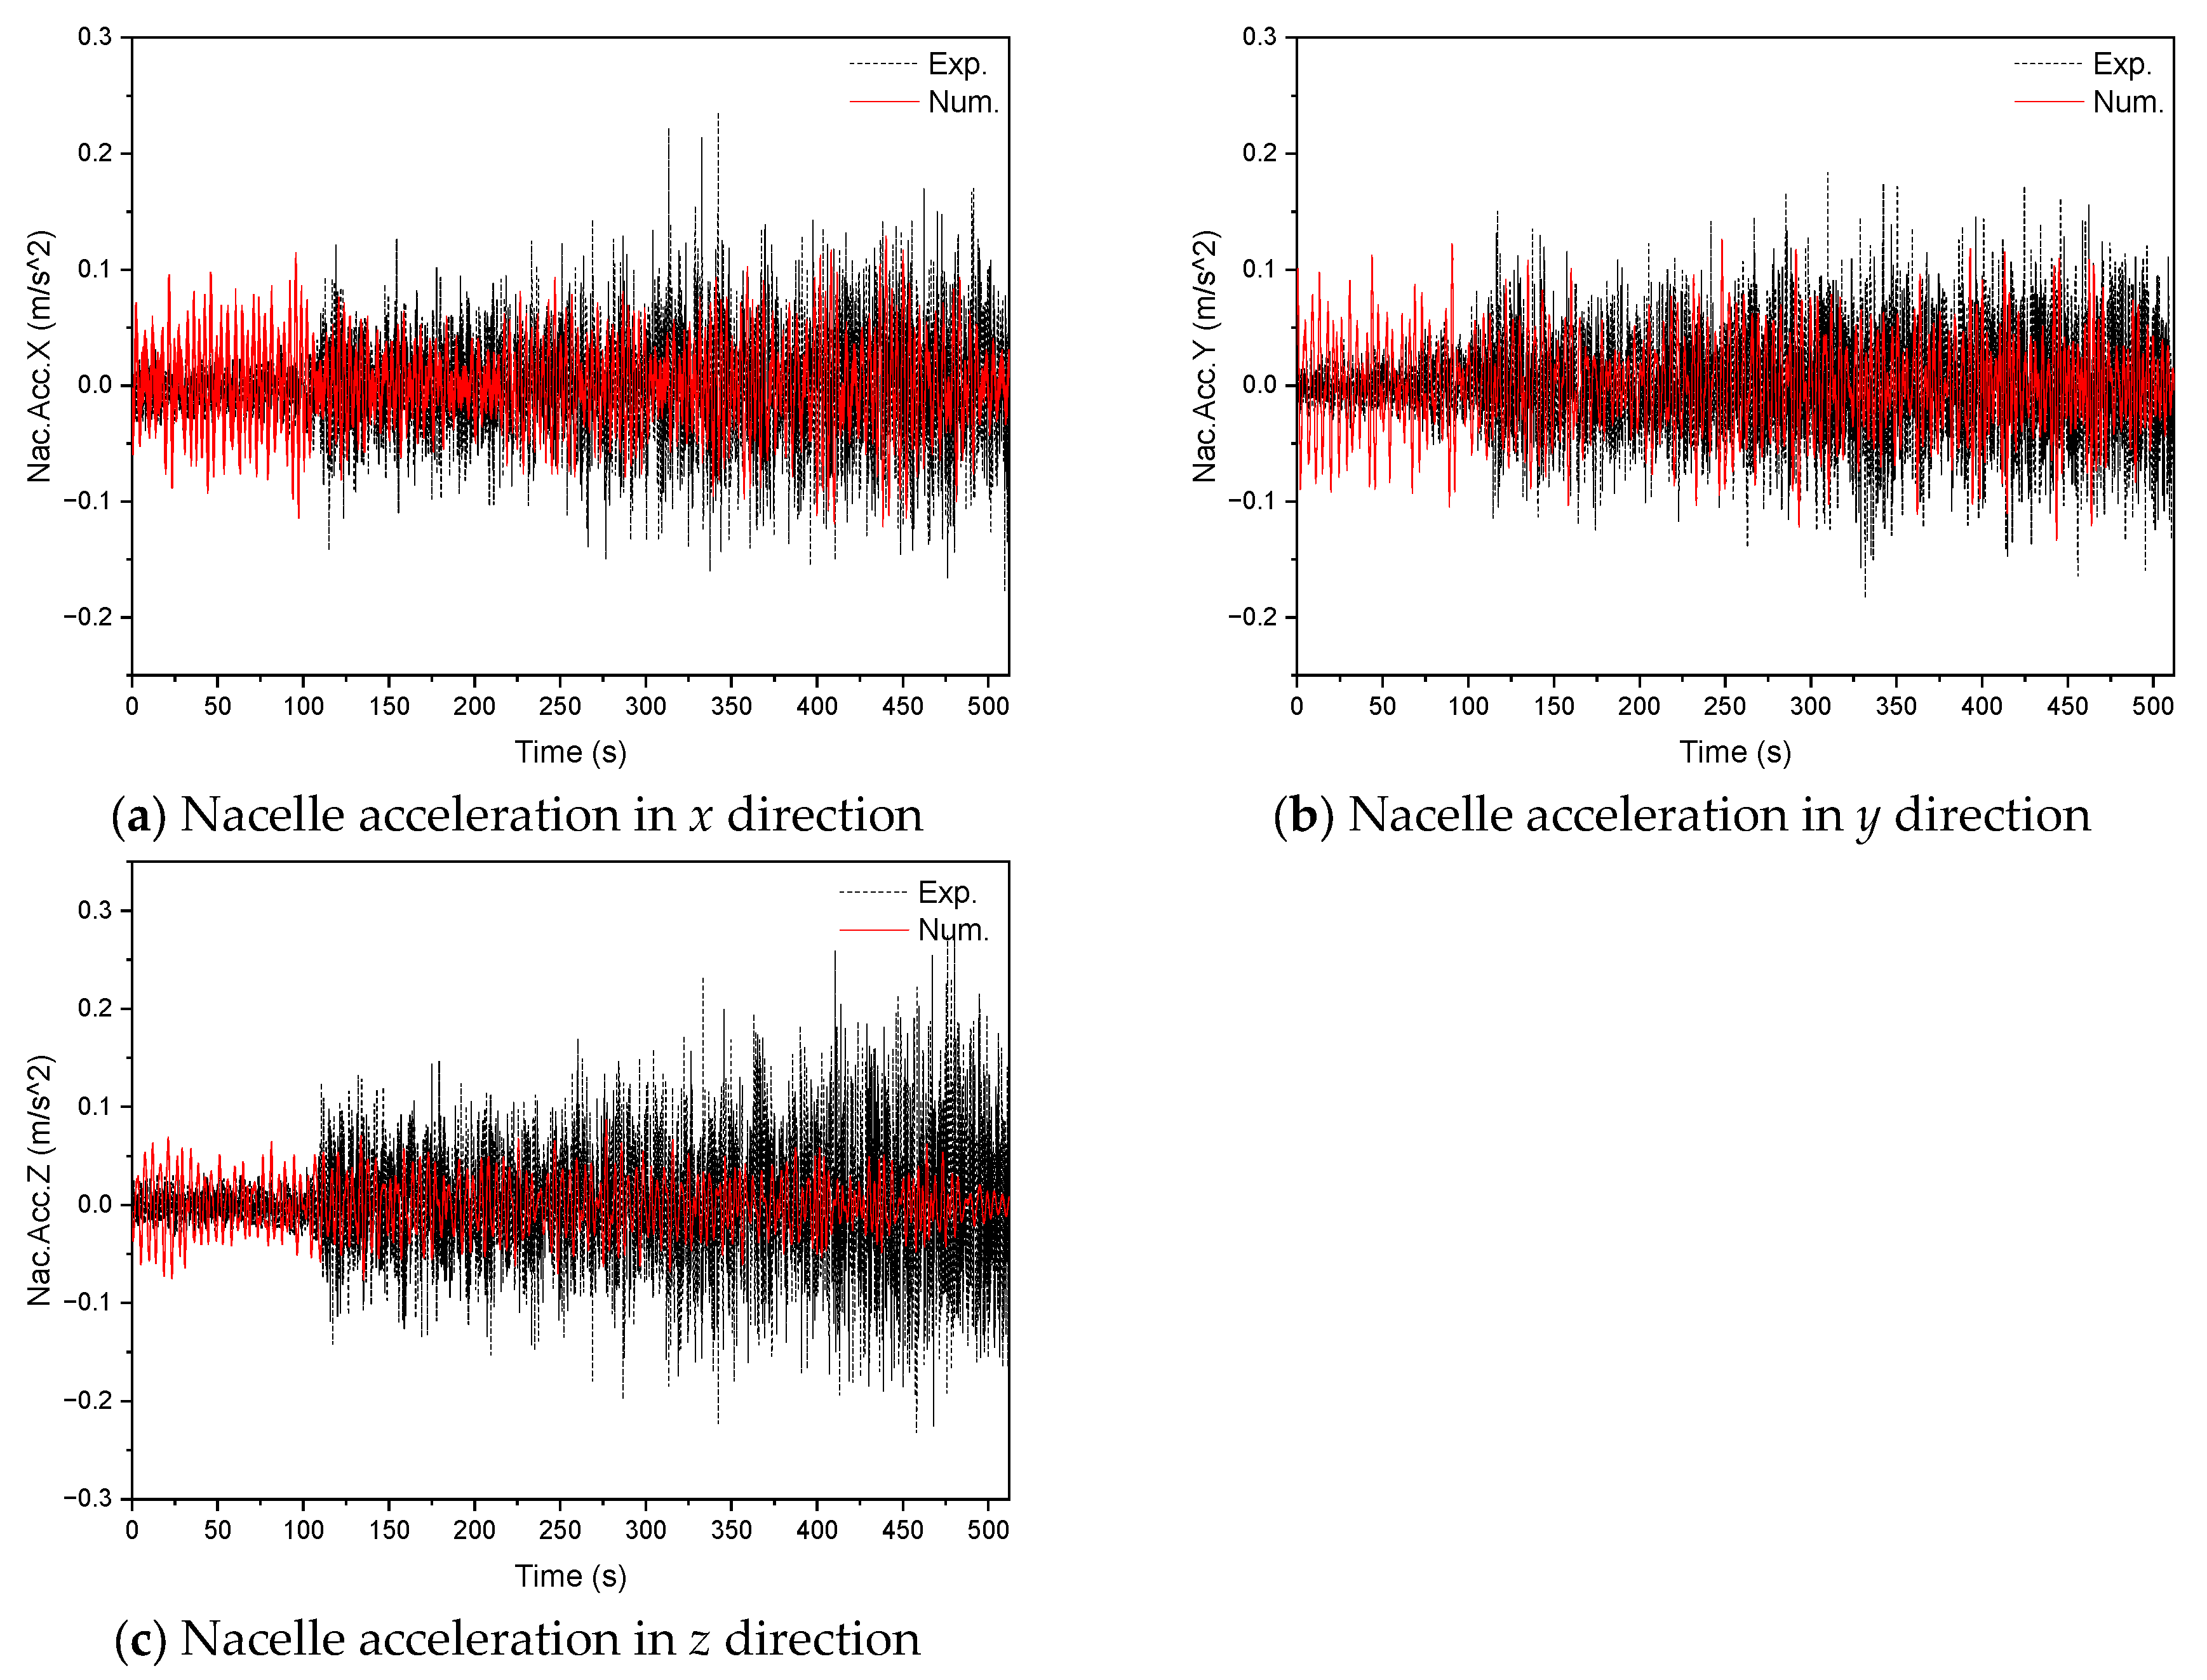
Figure 28.
Nacelle acceleration comparison between the experimental record and numerical simulation.
Figure 28.
Nacelle acceleration comparison between the experimental record and numerical simulation.
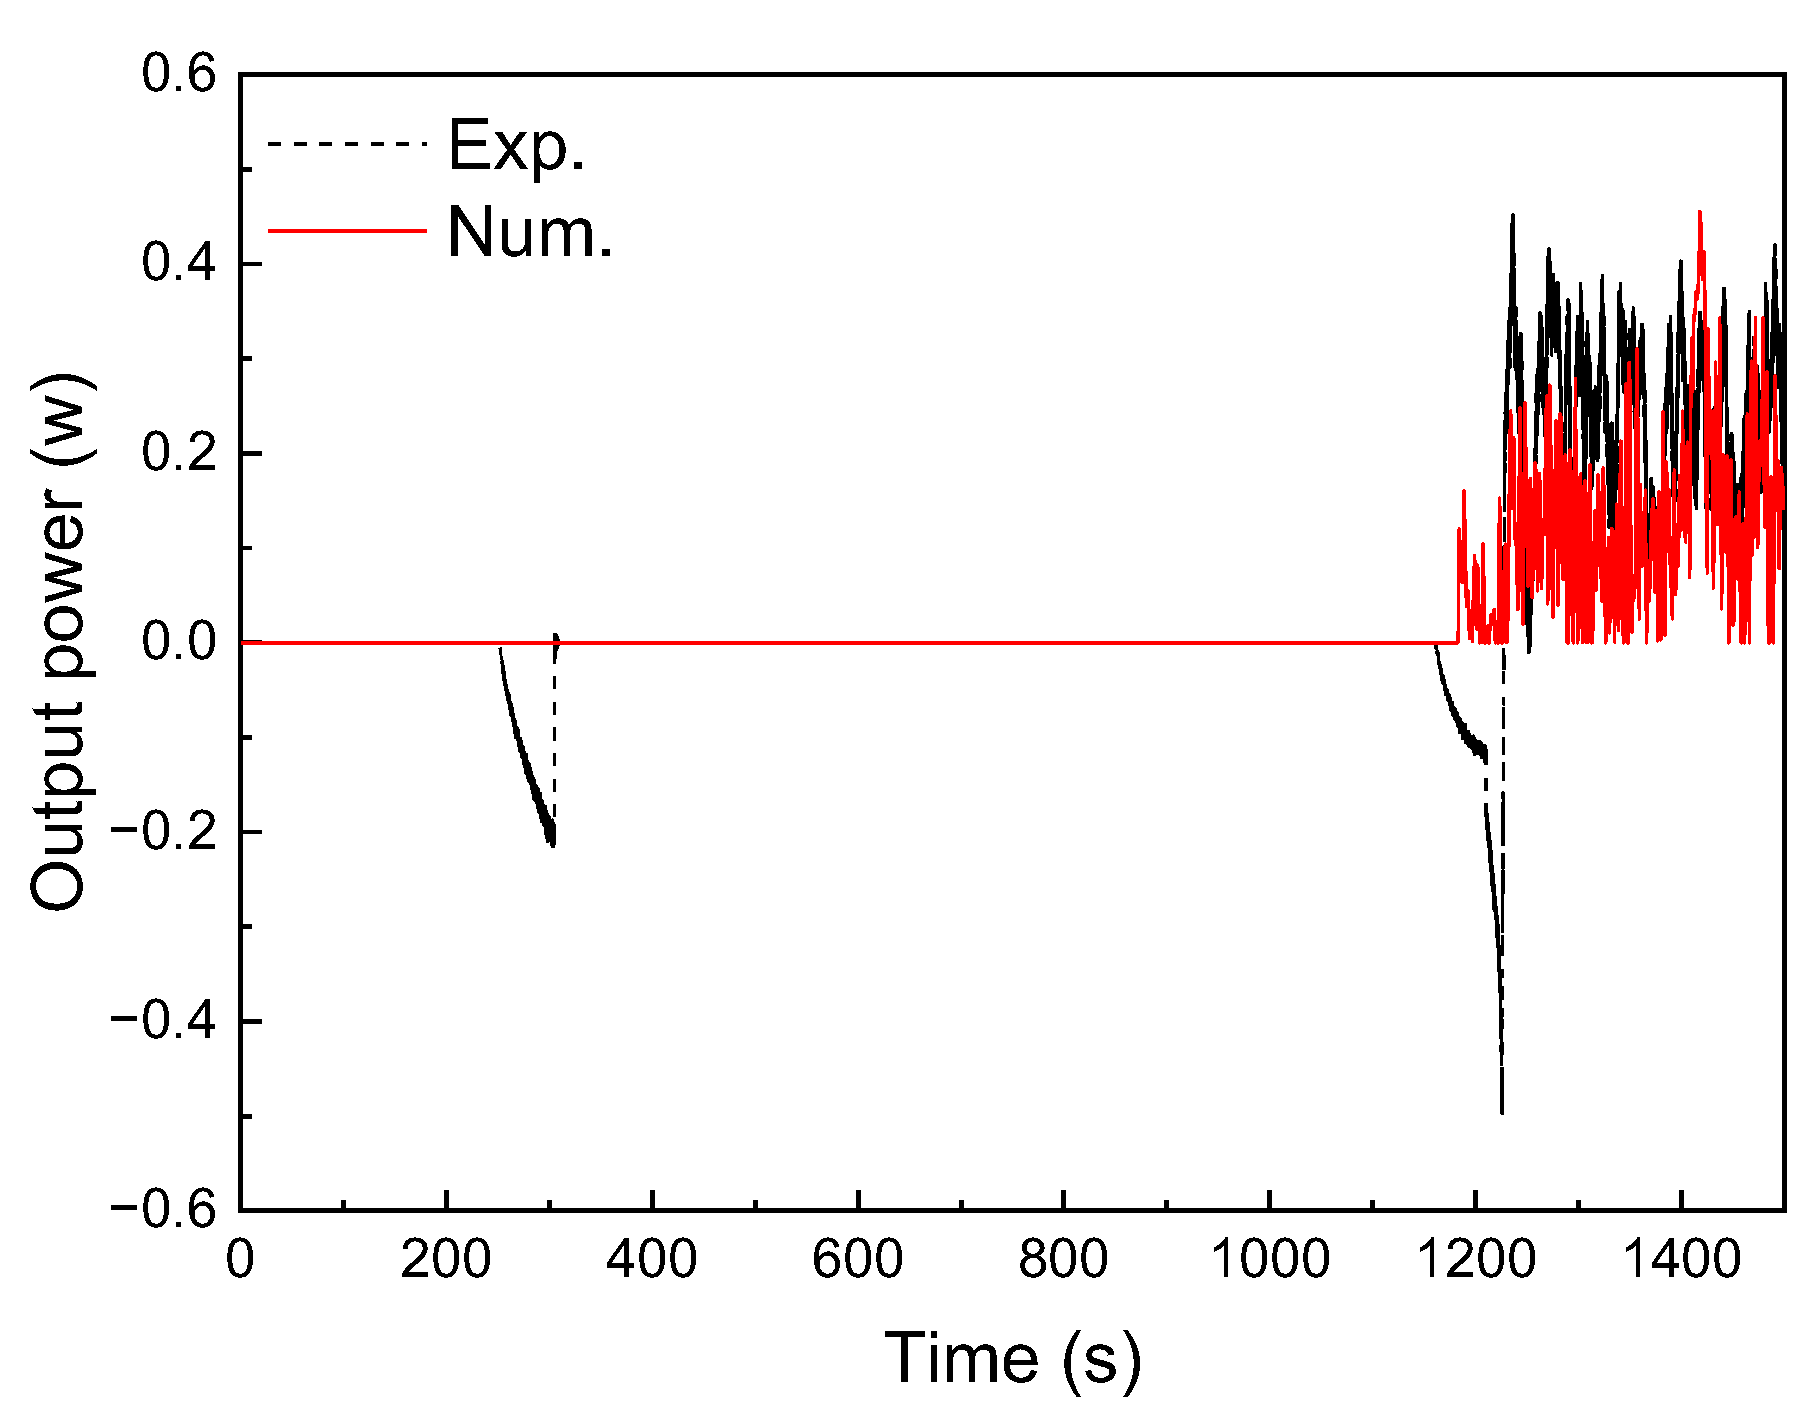
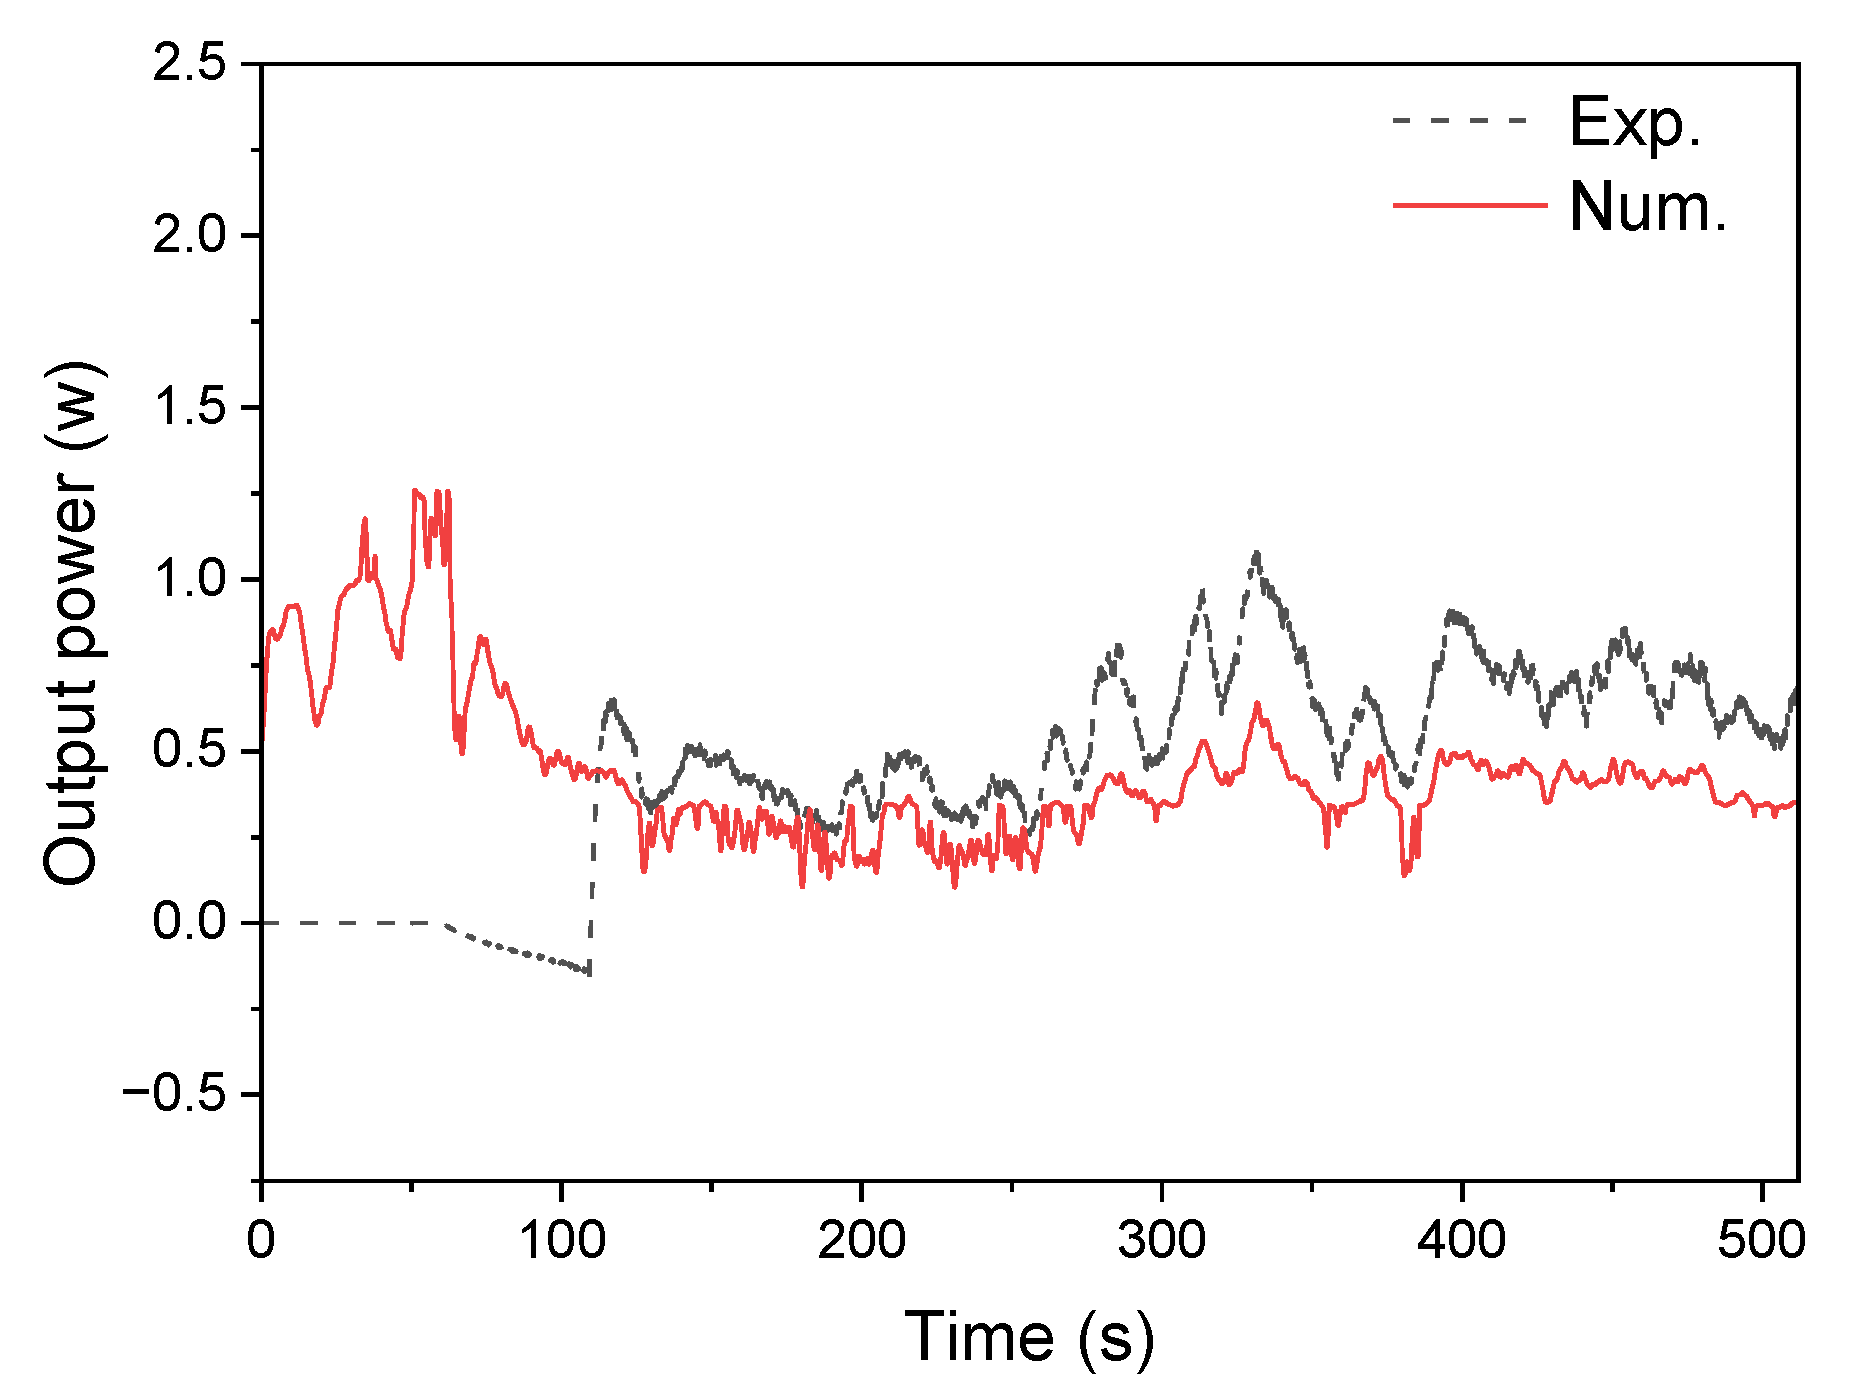
Figure 29.
Comparison of wind turbine output power for the basic configuration.
Figure 29.
Comparison of wind turbine output power for the basic configuration.
Figure 30.
Selected wave elevation data for numerical model validation of configuration B.
Figure 30.
Selected wave elevation data for numerical model validation of configuration B.
Figure 31.
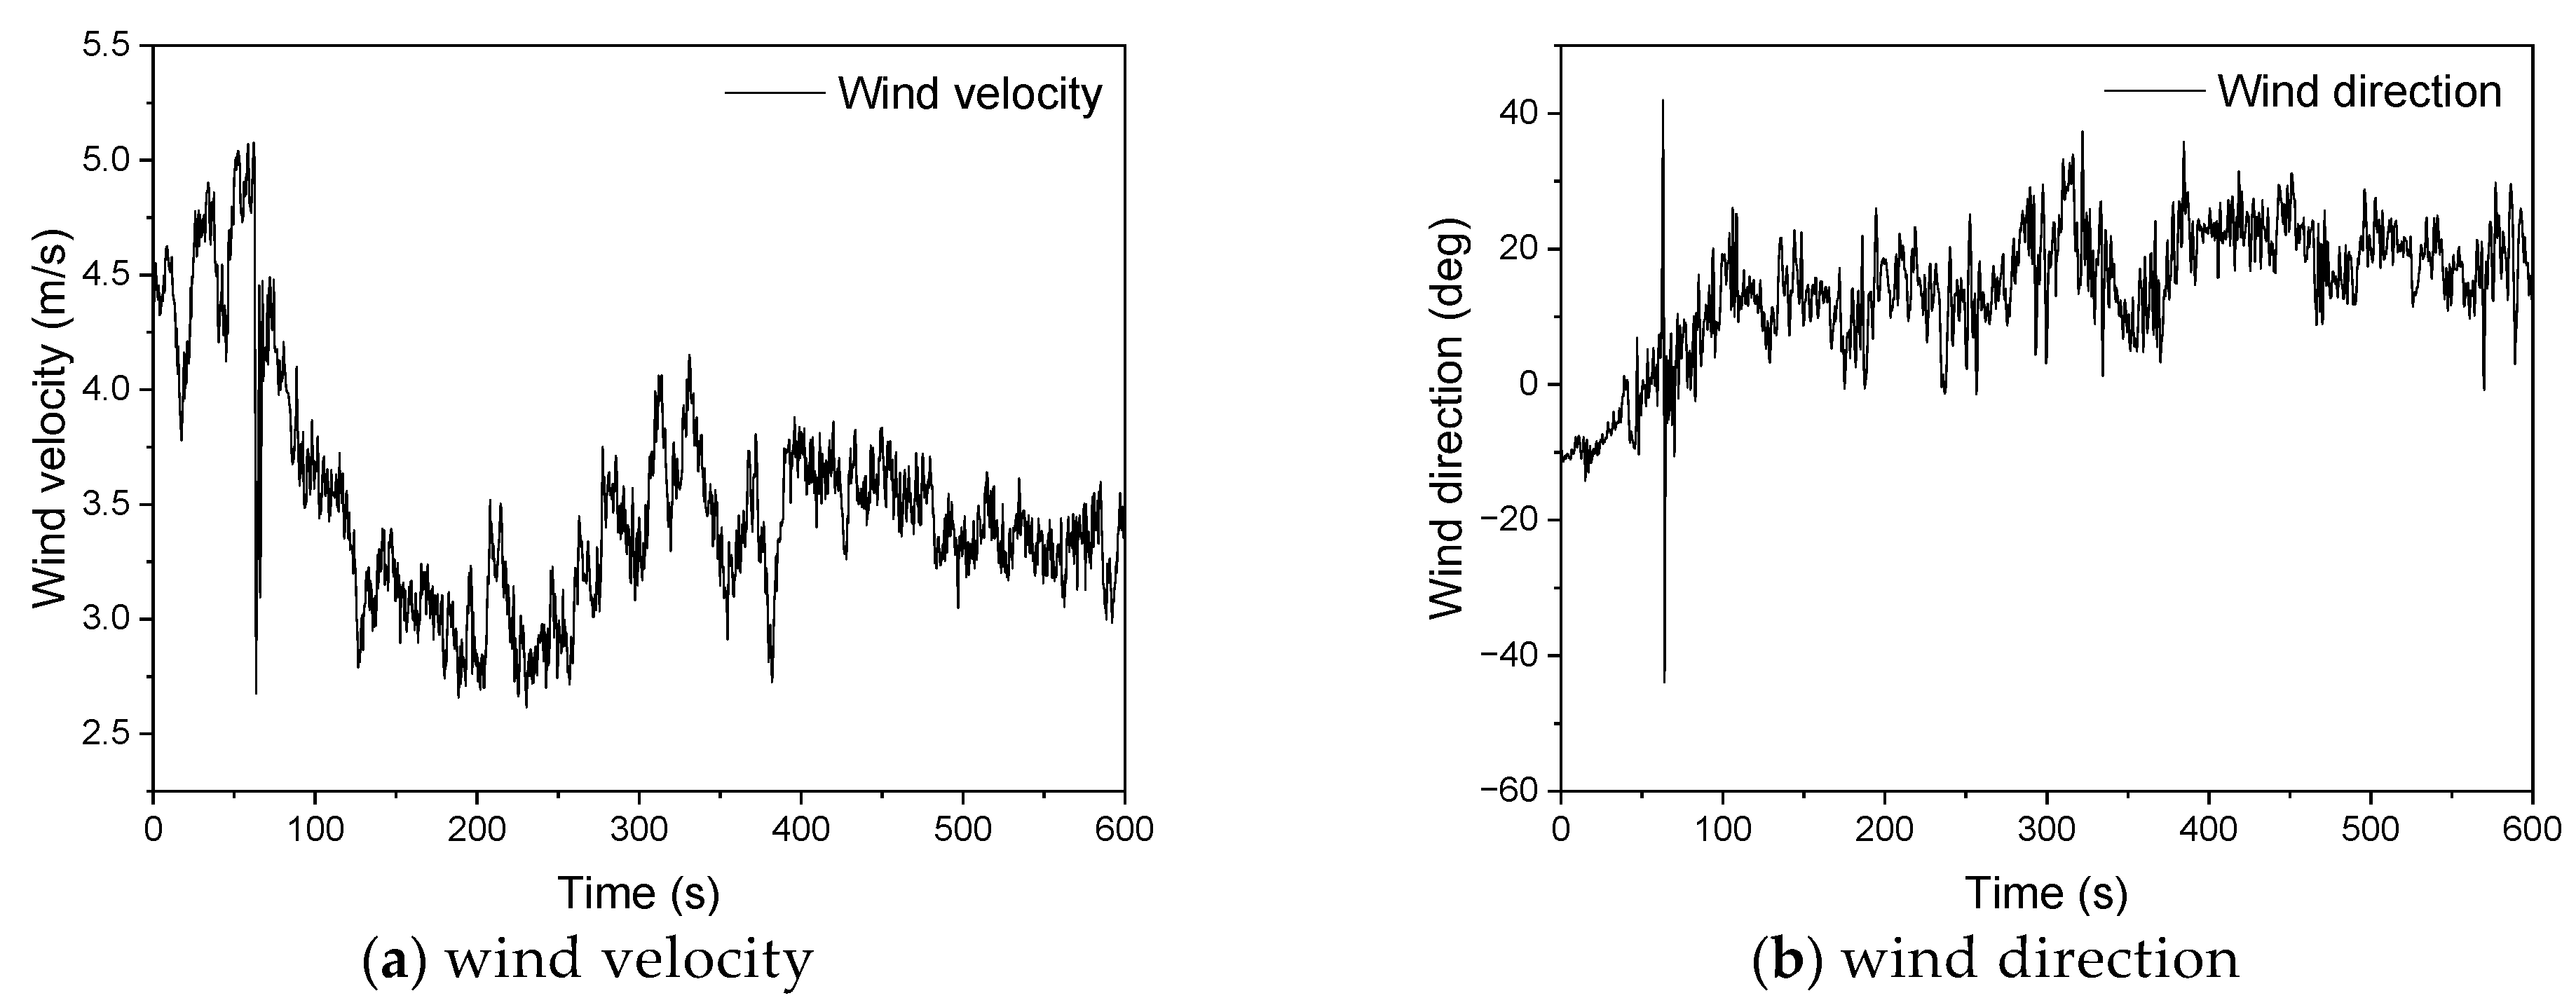
Selected wind data for numerical model validation of configuration B: (a) wind velocity and (b) wind direction.
Figure 31.
Selected wind data for numerical model validation of configuration B: (a) wind velocity and (b) wind direction.
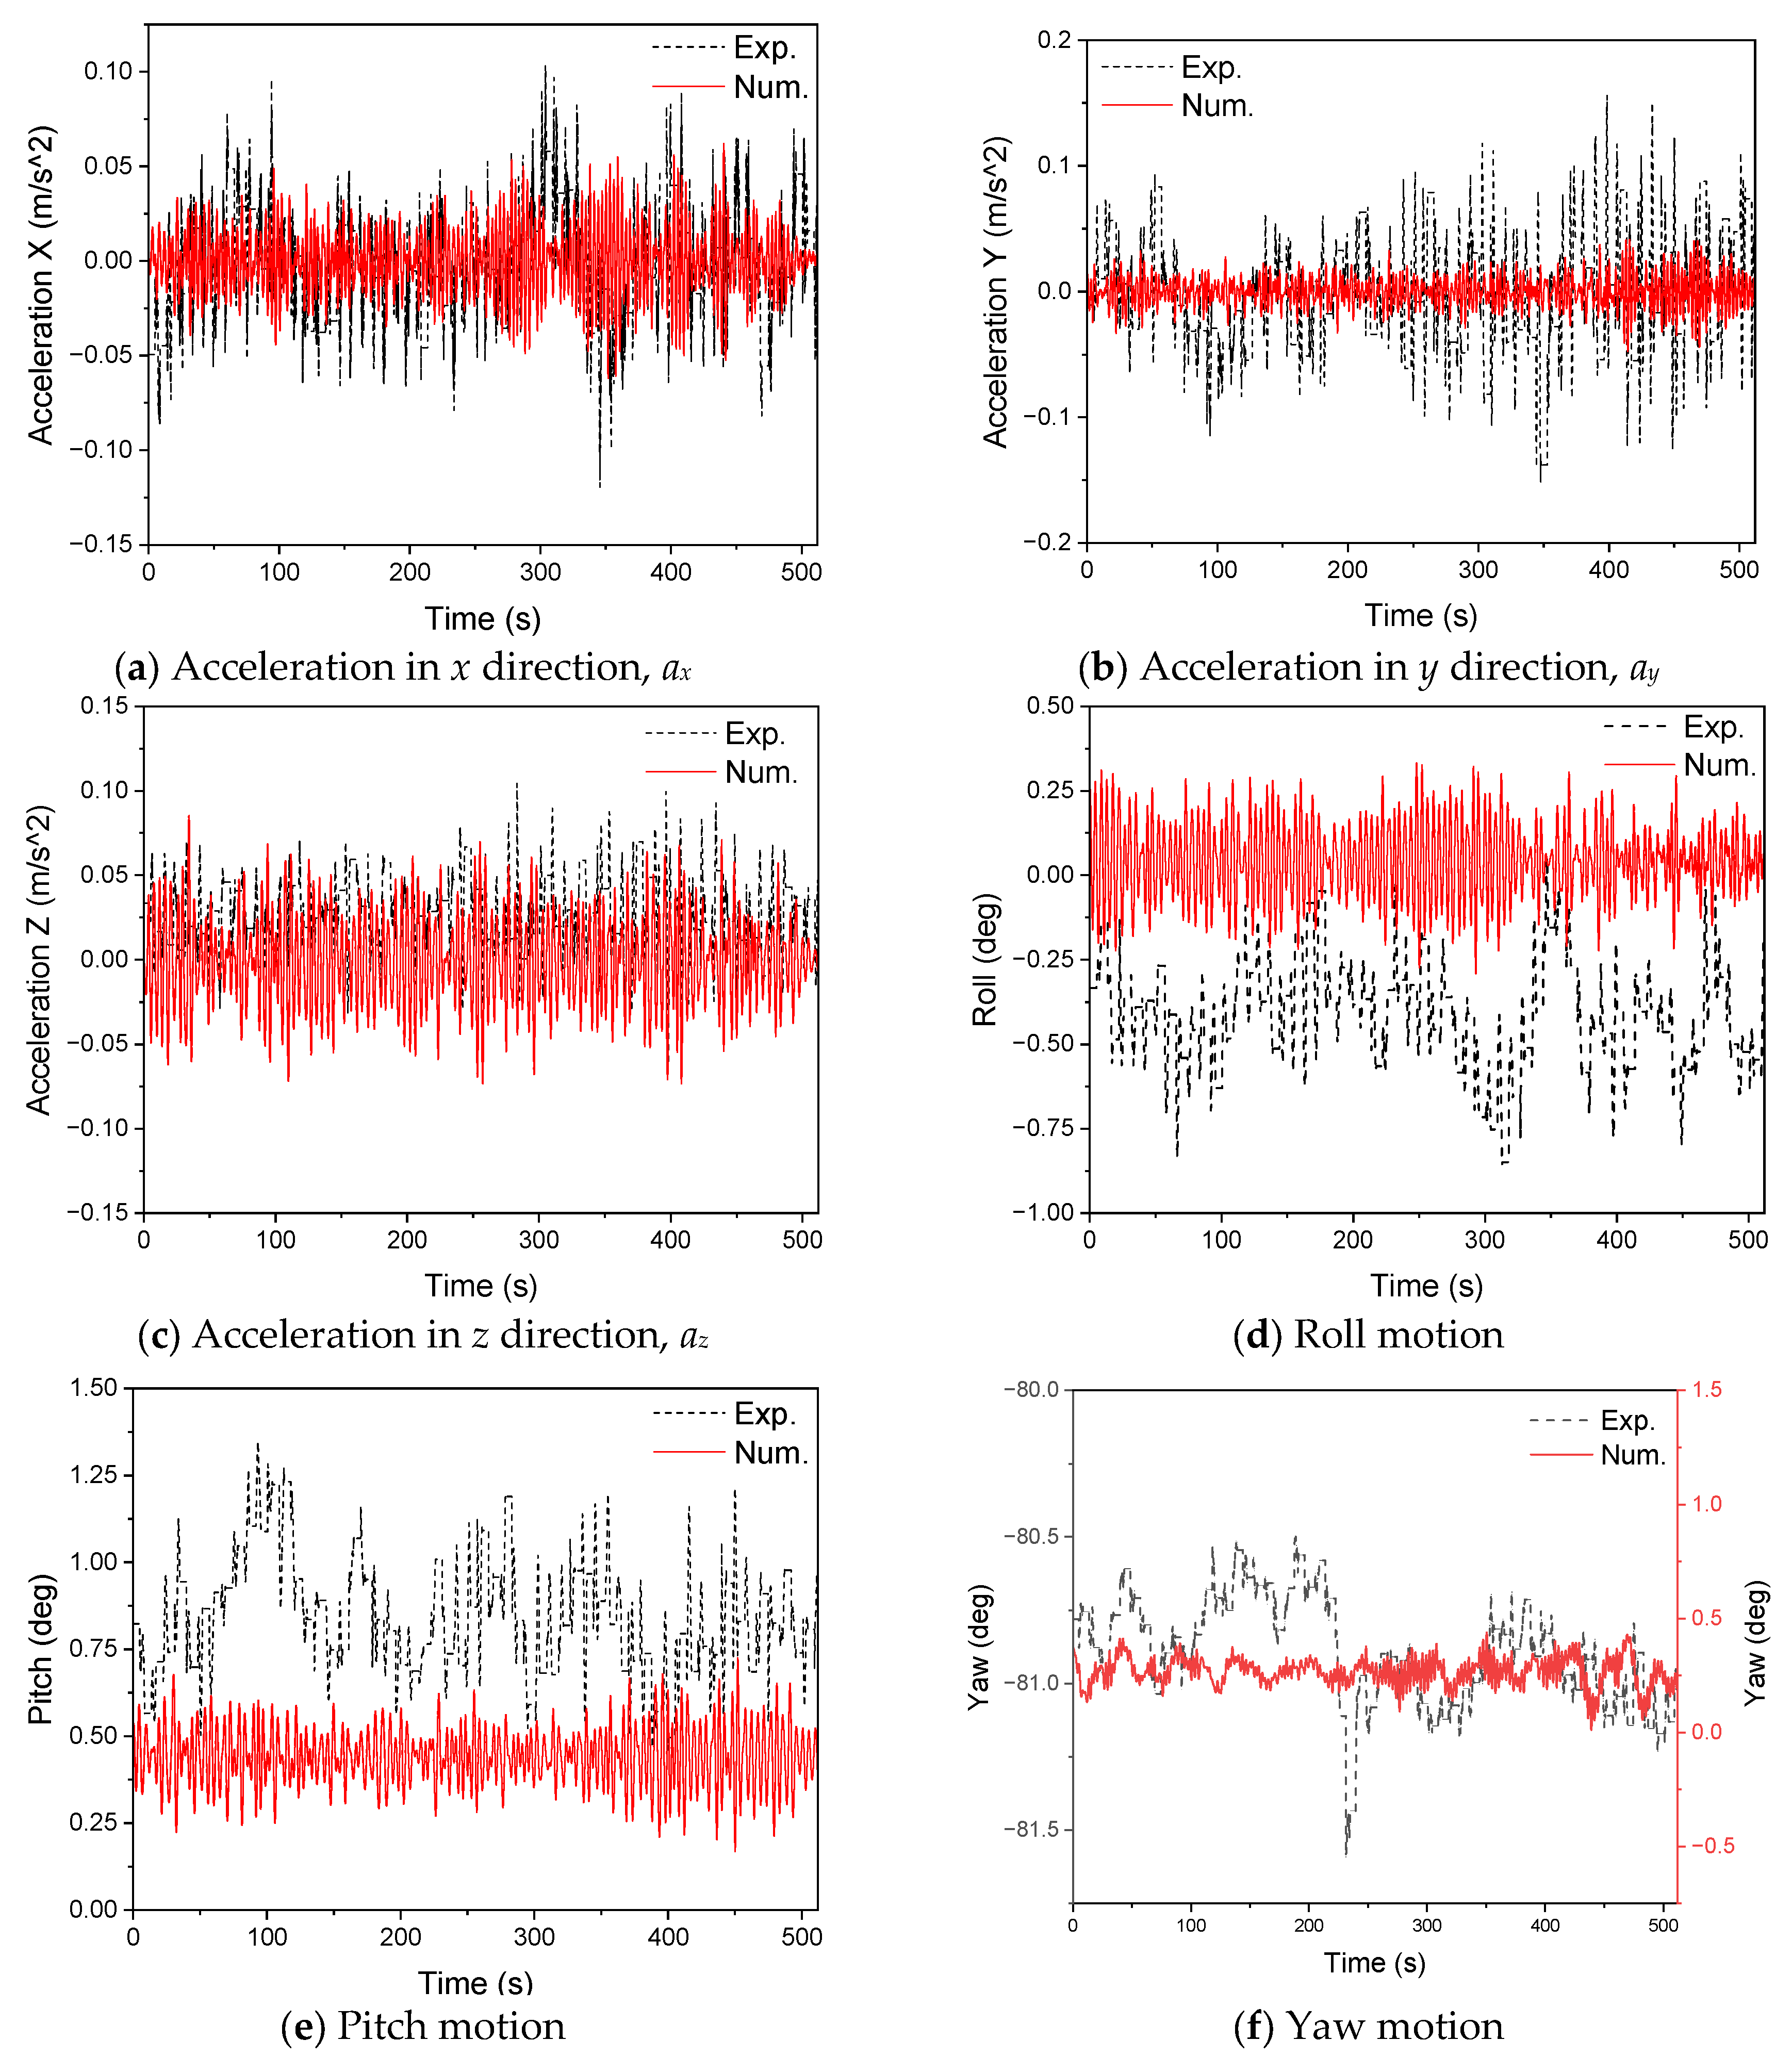
Figure 32.
Comparisons of platform motion time histories between numerical simulation results and experimental records for configuration B.
Figure 32.
Comparisons of platform motion time histories between numerical simulation results and experimental records for configuration B.
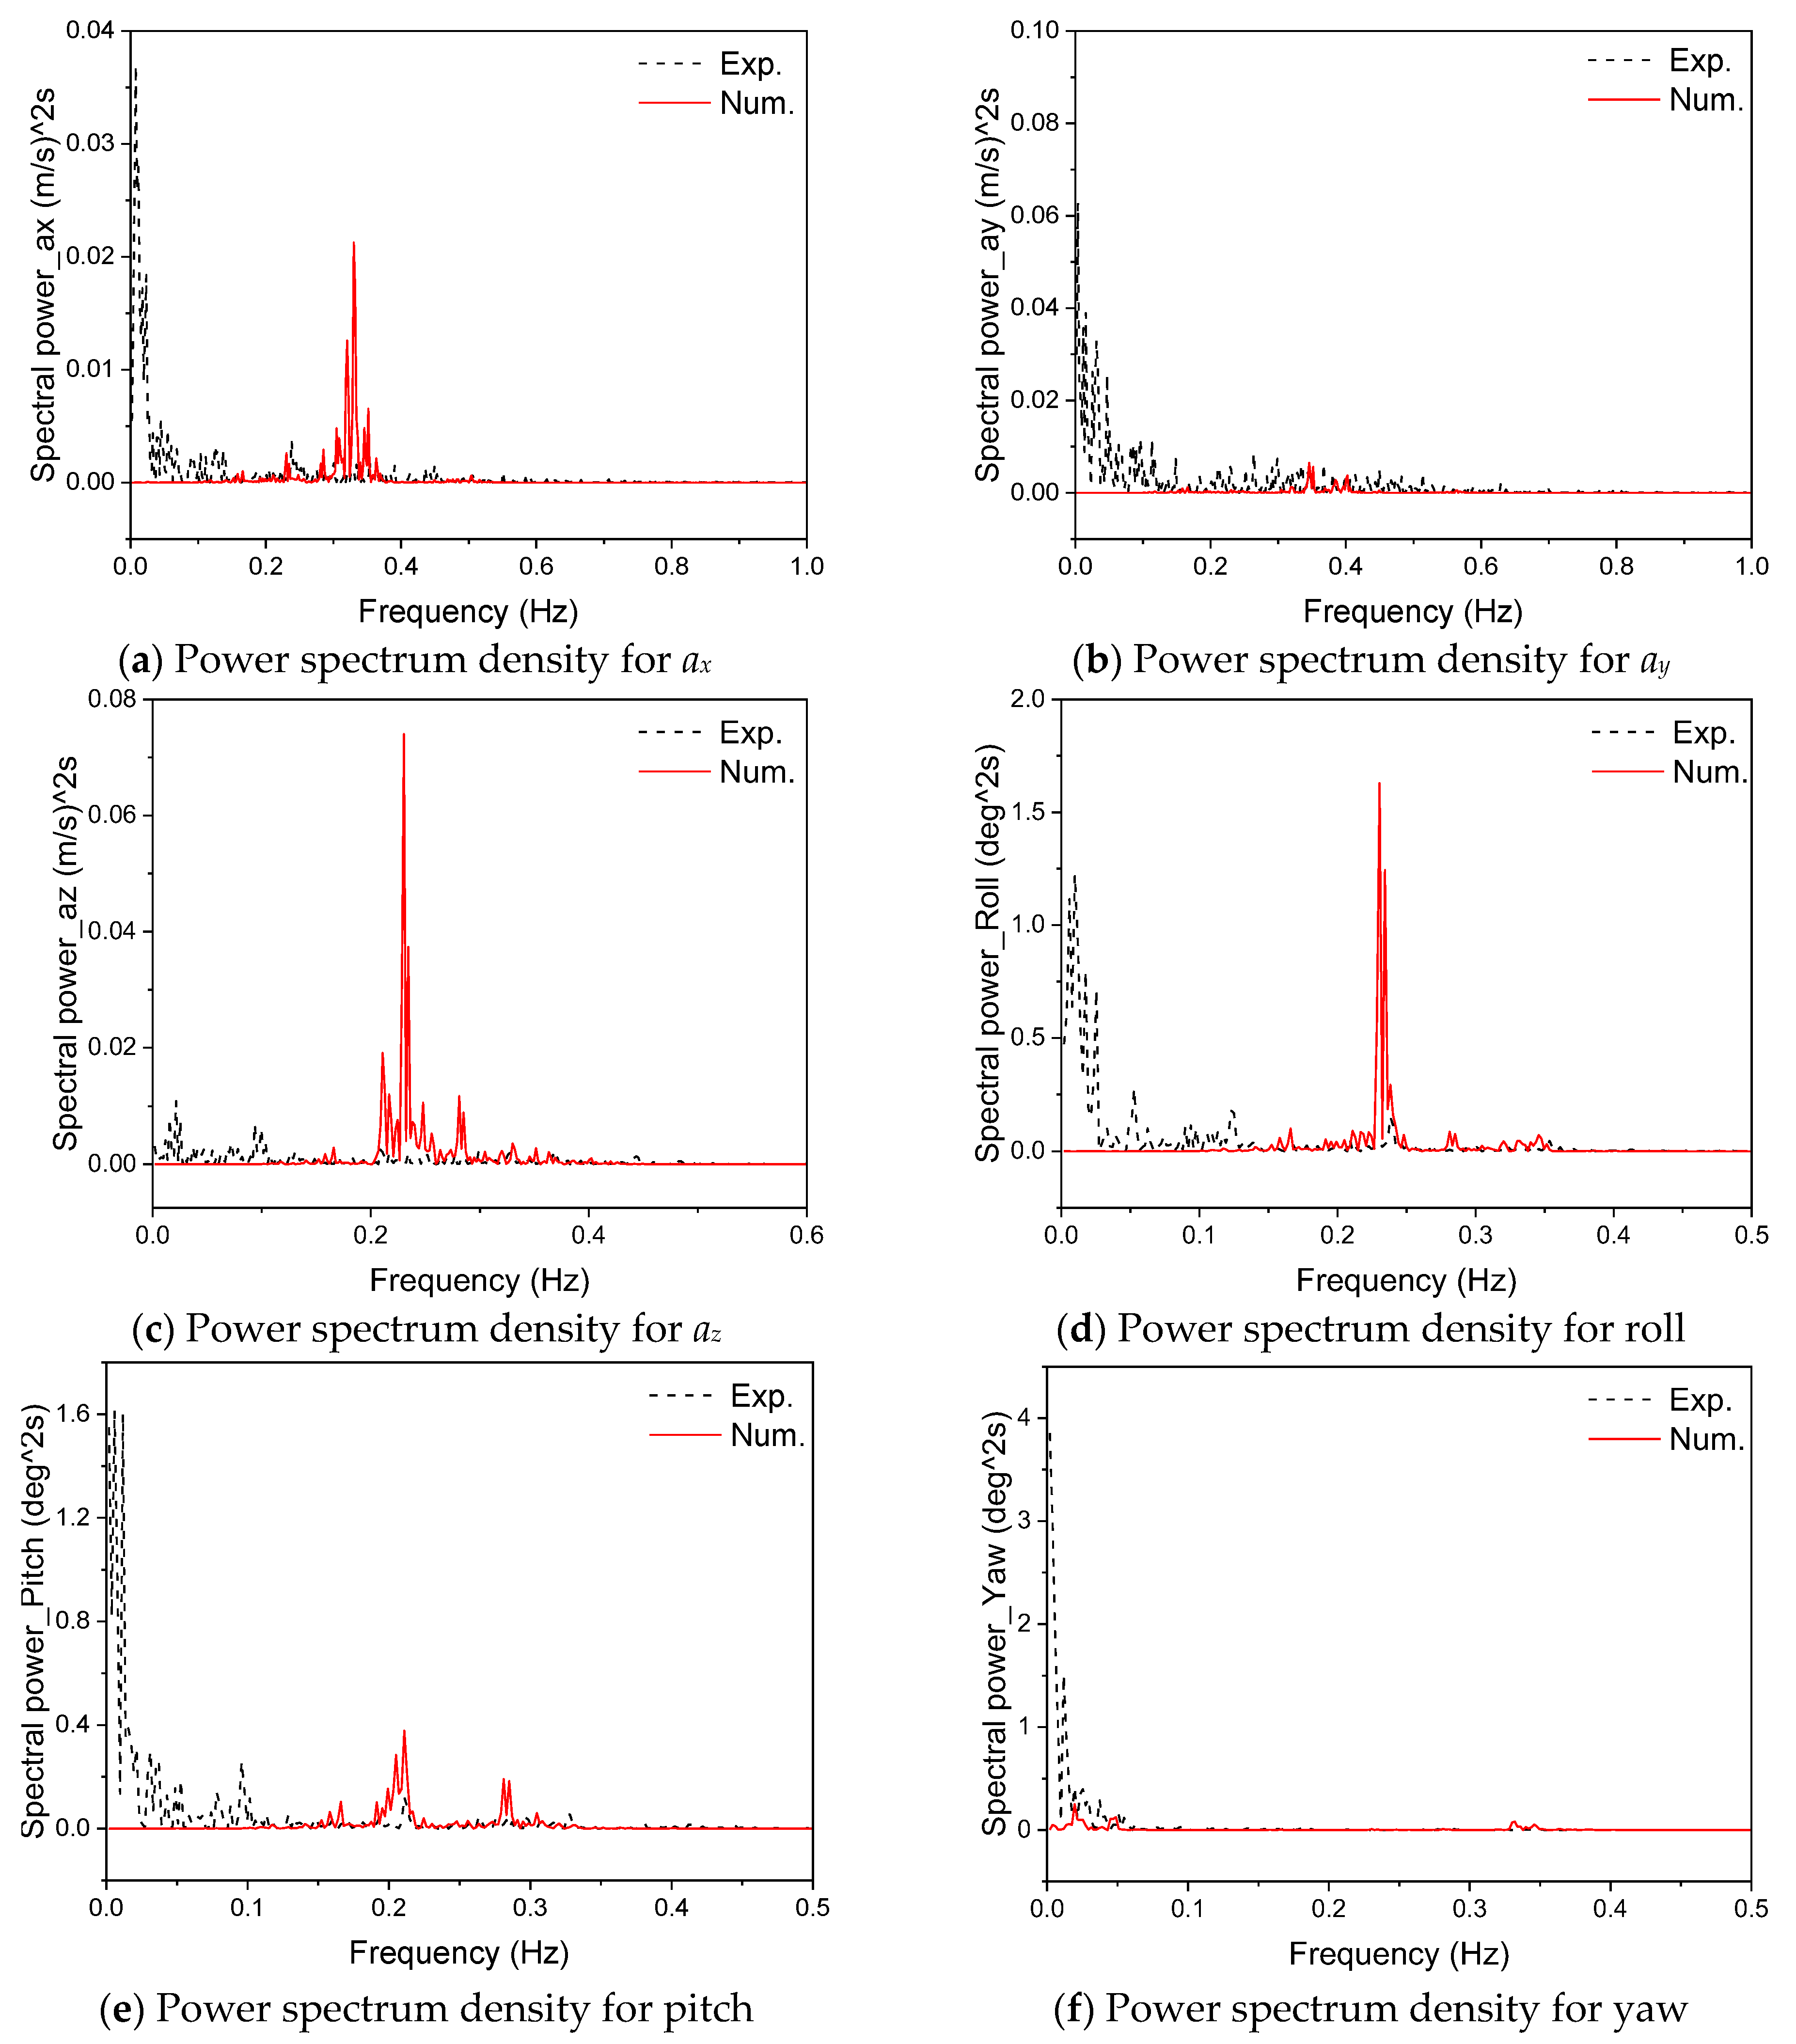
Figure 33.
Comparisons of platform motion power spectrum densities between numerical results and experimental records for configuration B.
Figure 33.
Comparisons of platform motion power spectrum densities between numerical results and experimental records for configuration B.
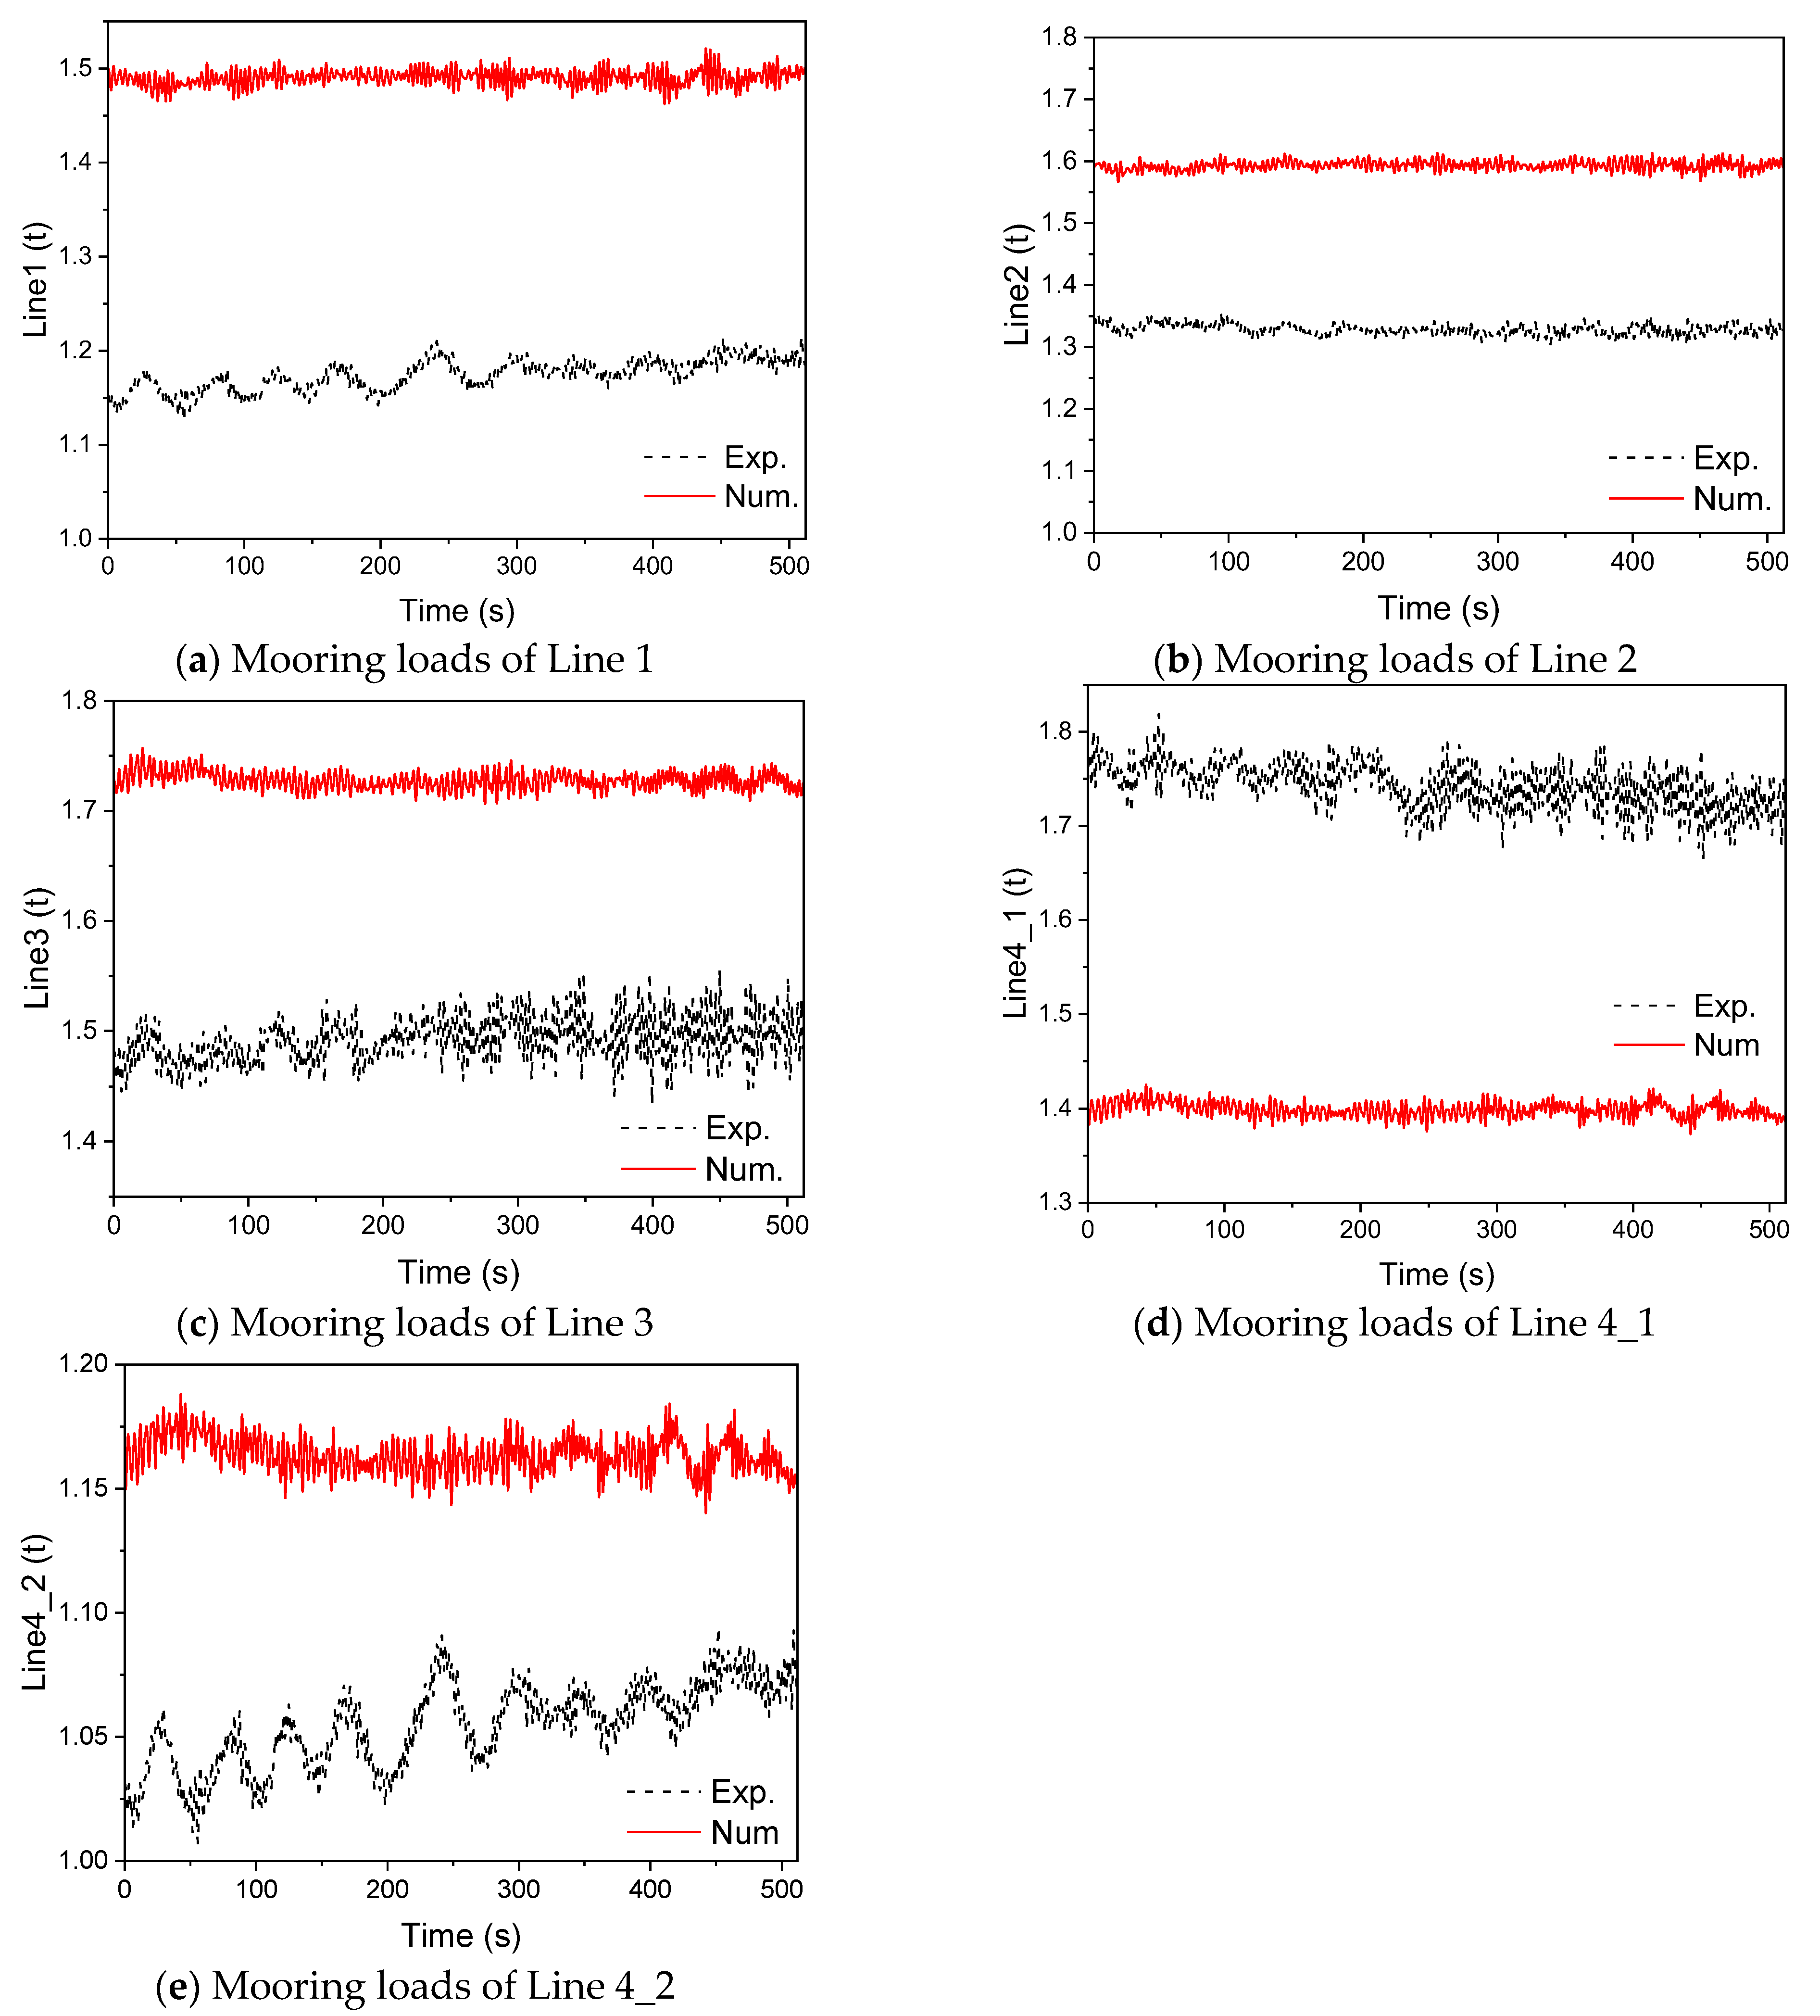
Figure 34.
Comparisons of time histories of mooring loads between numerical simulation results and experimental records for configuration B.
Figure 34.
Comparisons of time histories of mooring loads between numerical simulation results and experimental records for configuration B.
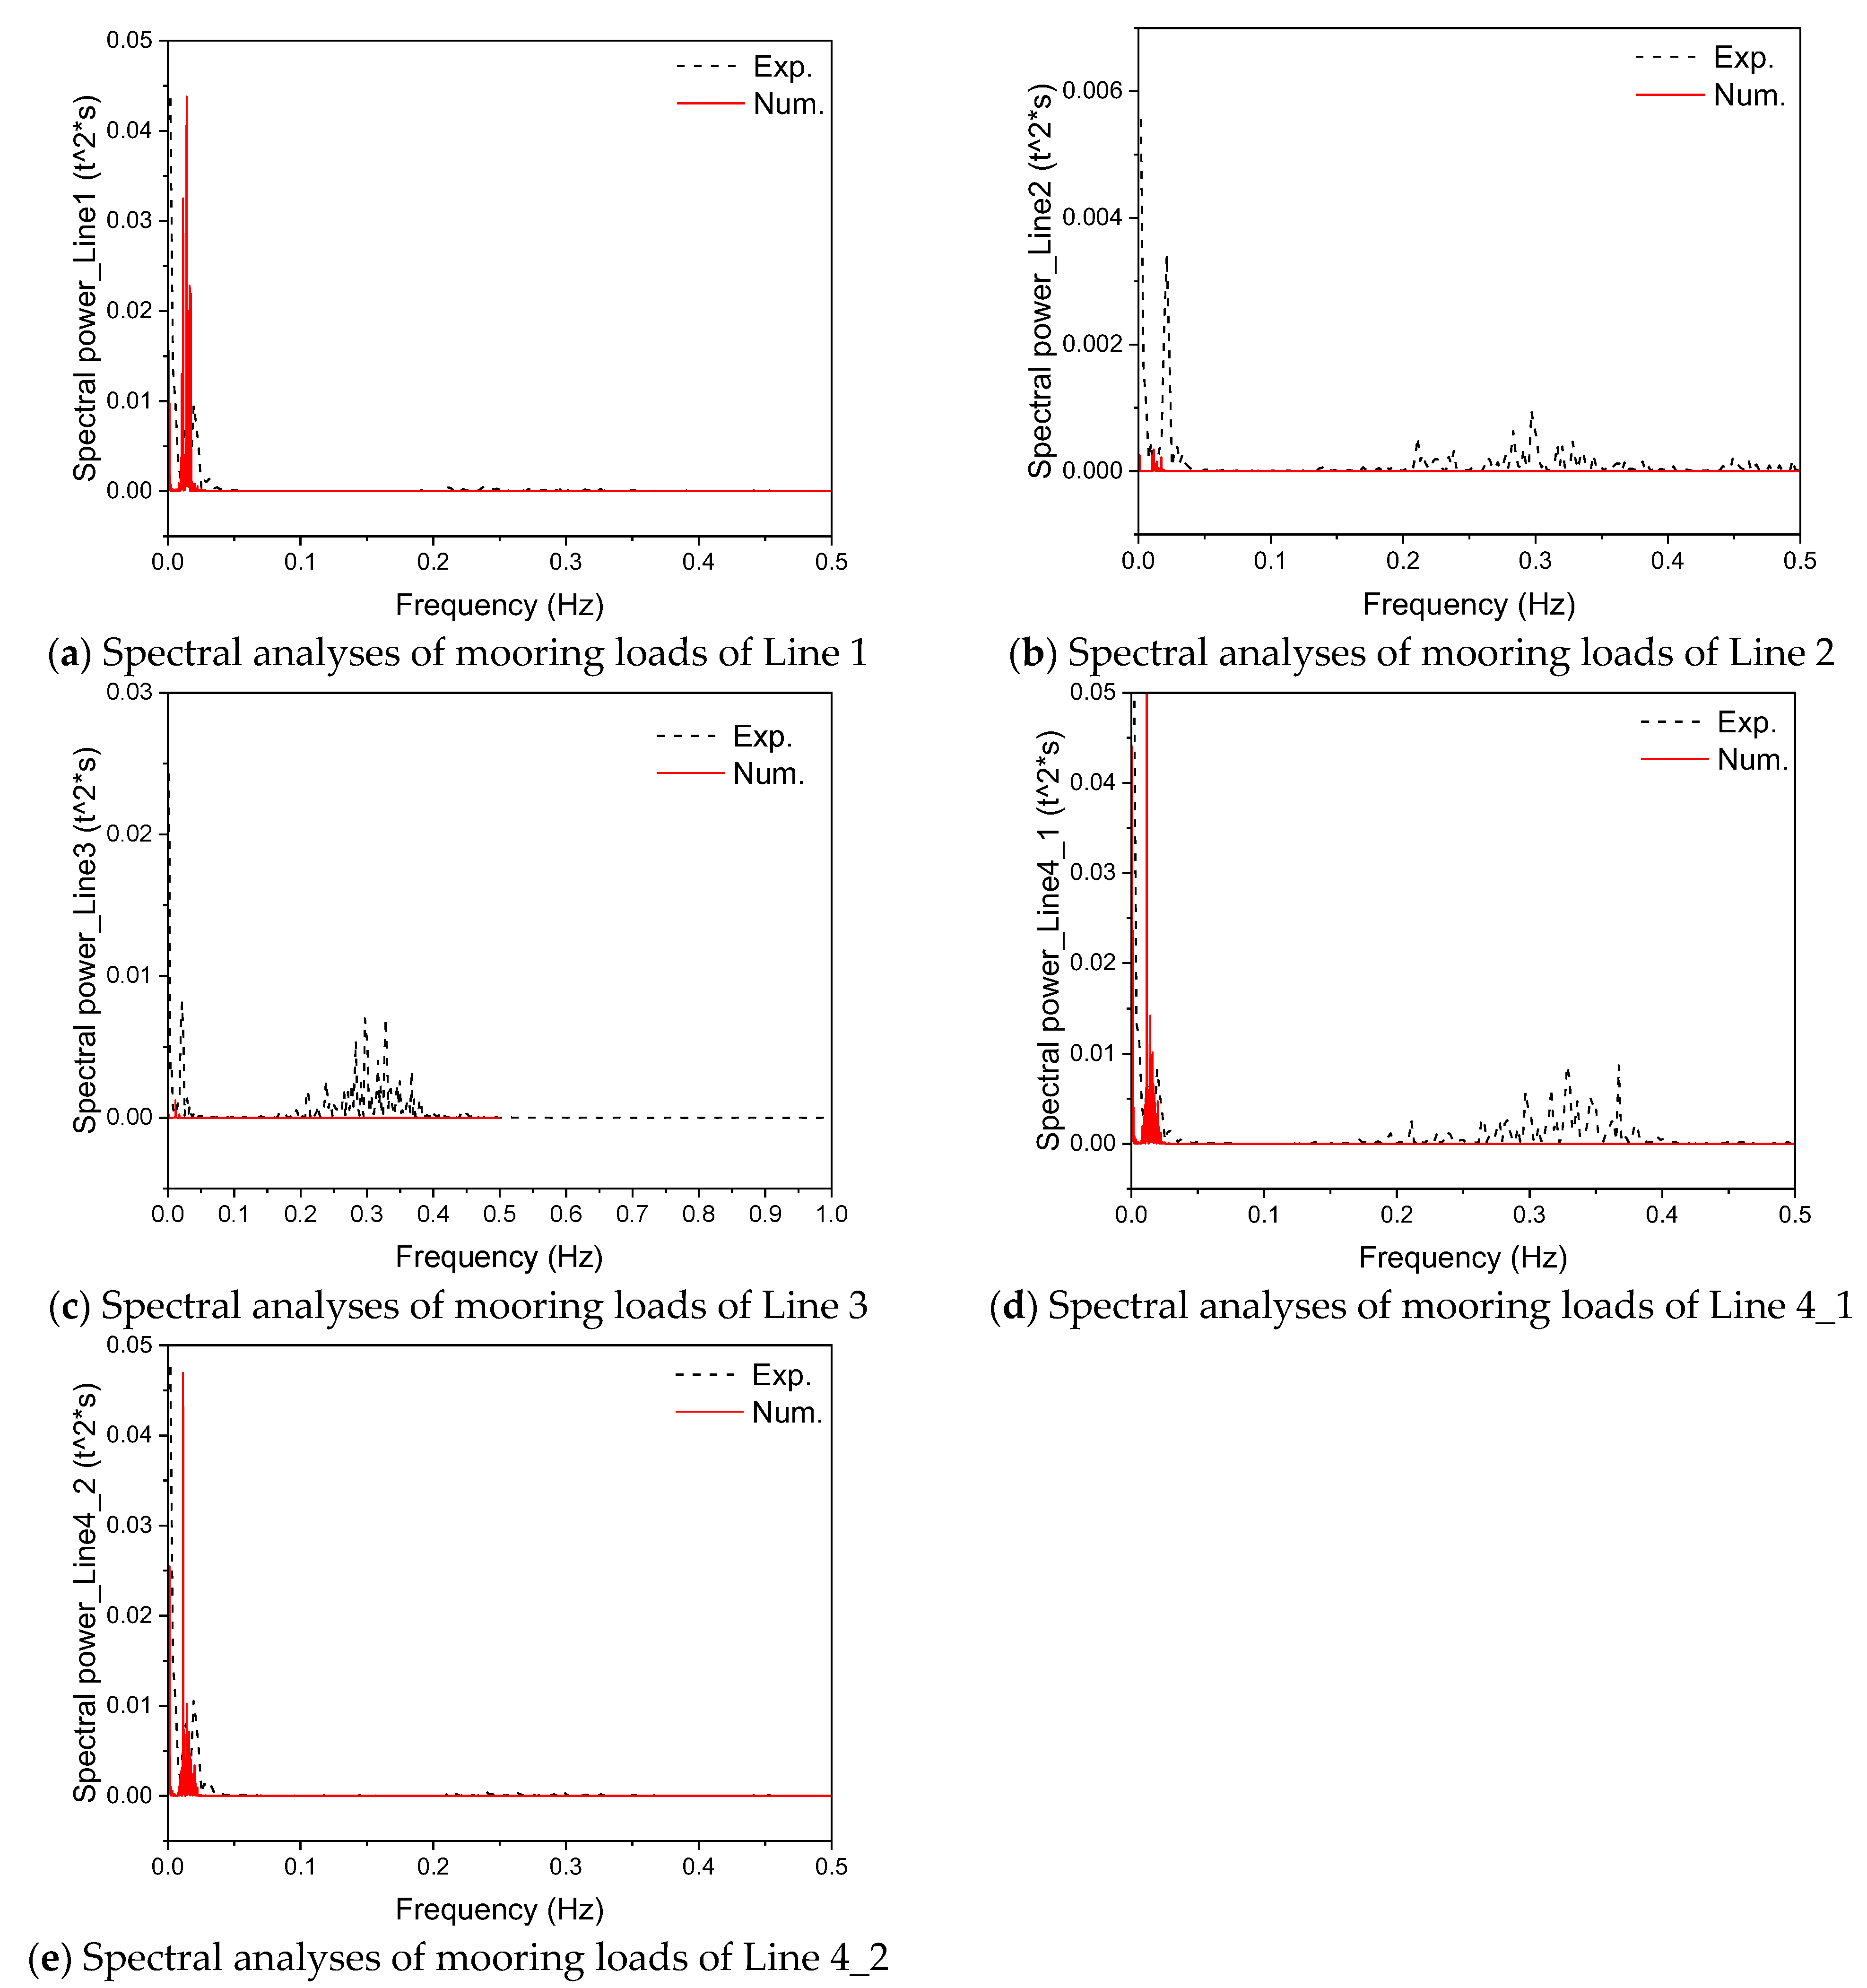
Figure 35.
Comparisons of spectral analyses of mooring loads between numerical simulation results and experimental records for configuration B.
Figure 35.
Comparisons of spectral analyses of mooring loads between numerical simulation results and experimental records for configuration B.
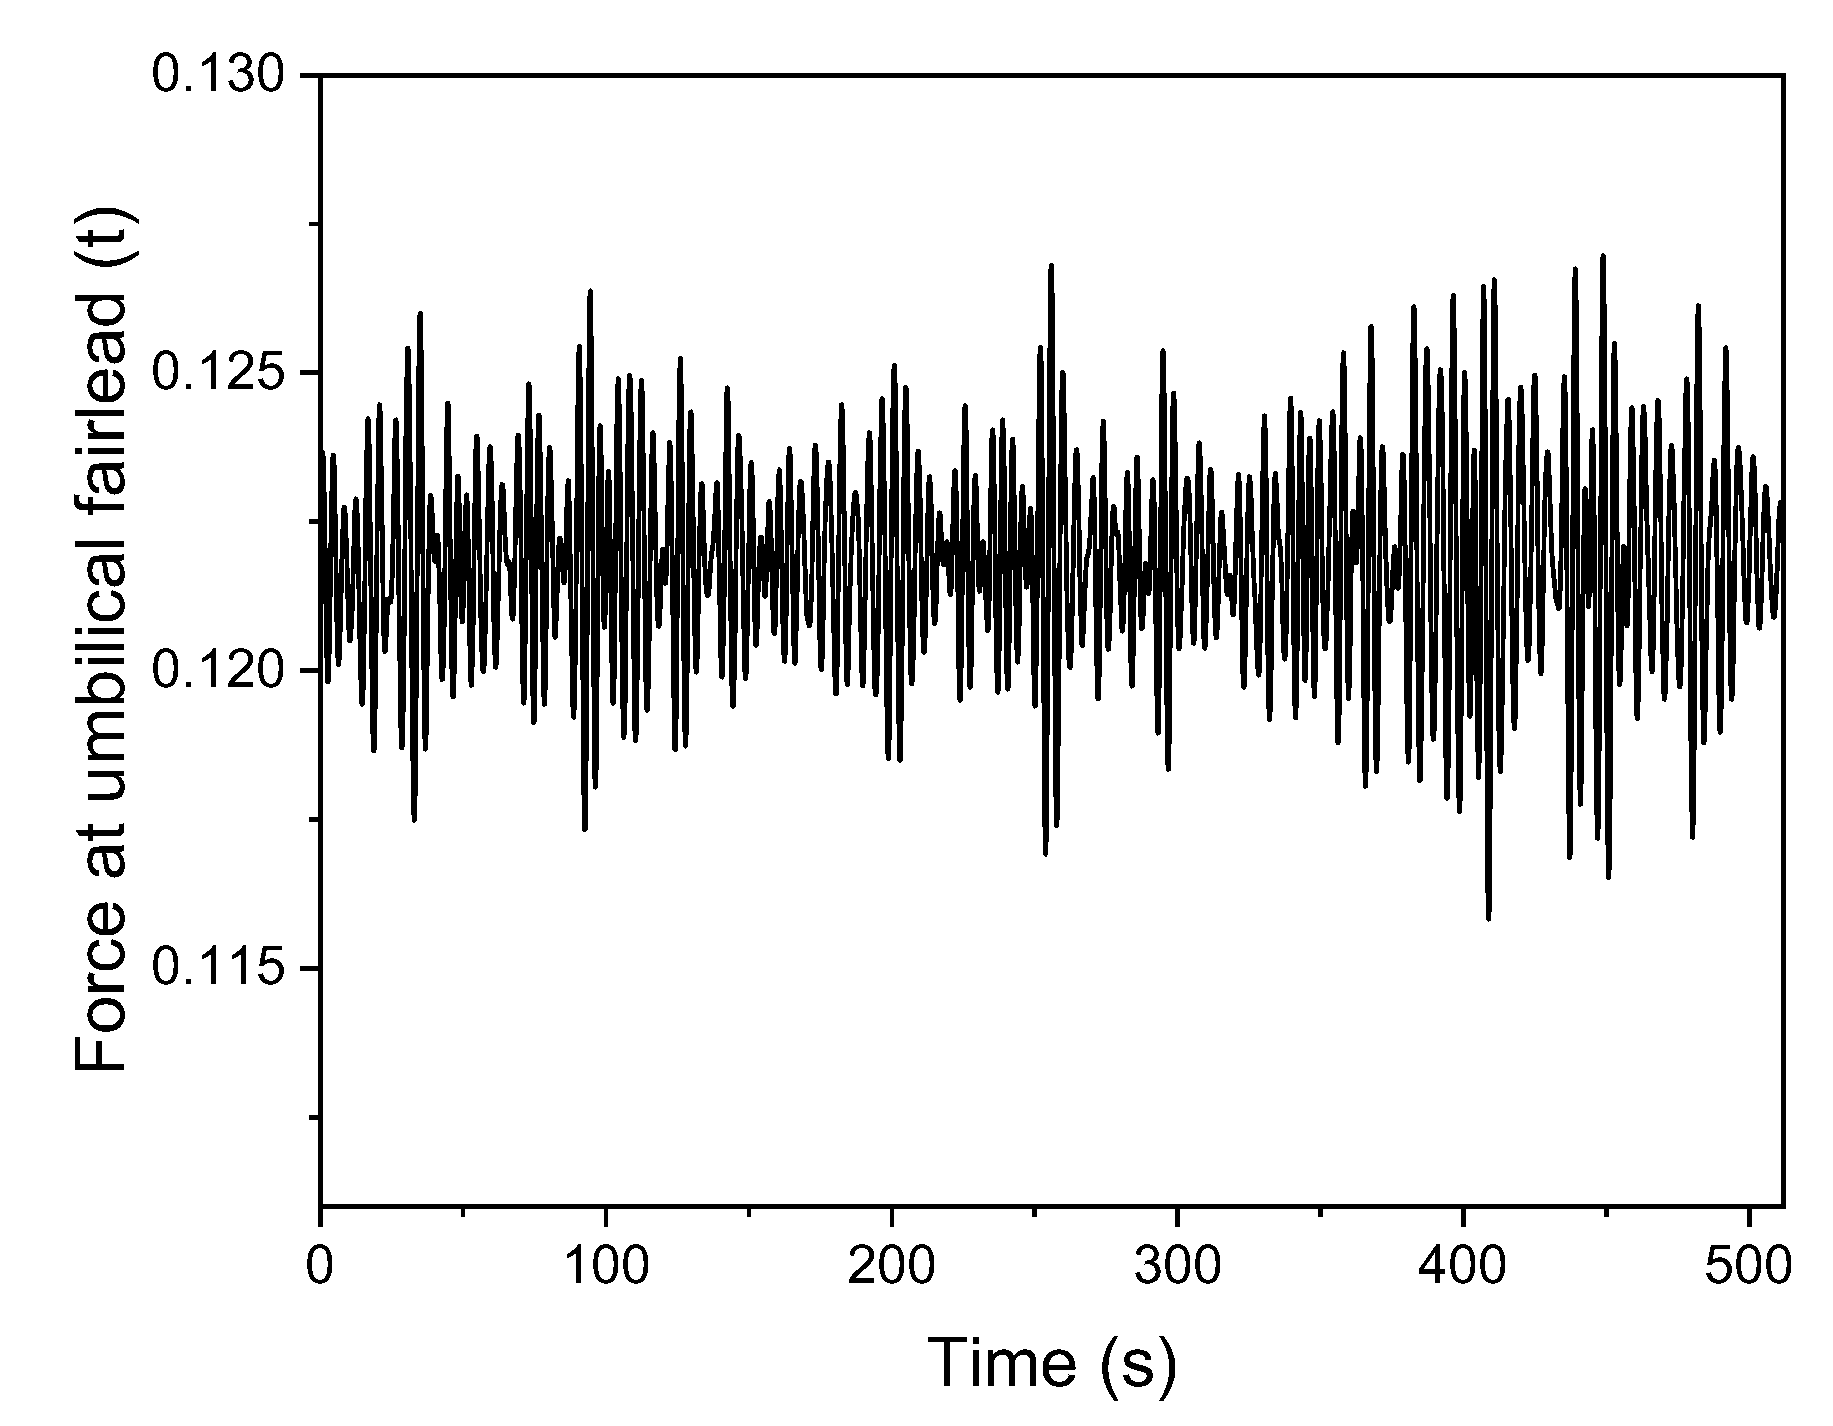
Figure 36.
Umbilical tension force at the fairlead position for configuration B.
Figure 36.
Umbilical tension force at the fairlead position for configuration B.
Figure 37.
Comparison of tower base bending moment between experimental records and numerical simulation for configuration B.
Figure 37.
Comparison of tower base bending moment between experimental records and numerical simulation for configuration B.
Figure 38.
Nacelle acceleration comparison between the experimental record and numerical simulation for configuration B.
Figure 38.
Nacelle acceleration comparison between the experimental record and numerical simulation for configuration B.
Figure 39.
Comparison of wind turbine output power for Configuration B.
Figure 39.
Comparison of wind turbine output power for Configuration B.
Table 1.
Comparison with previous study (Li et al. [
22,
23,
24]).
Table 1.
Comparison with previous study (Li et al. [
22,
23,
24]).
| Aspect | Li et al. [22,23,24] (1:40 Wave Tank Test) | This Work (1:15 Outdoor Prototype) |
|---|
| Platform scale | 1:40 | 1:15 (configuration updated) |
| Test environment | Controlled wave tank | Open sea (NOEL, Italy) |
| Environmental conditions | Idealized (regular/irregular waves) | Realistic met-ocean (measured waves, wind) |
| Validation data | Tank measurements | Outdoor field measurements |
| Use of measured environment | No (spectral generation) | Yes (direct input of time series) |
| Model components | Wind turbine, WECs, mooring | Full system: wind turbine, WECs, mooring, umbilical |
Table 2.
Measured bathymetry data.
Table 2.
Measured bathymetry data.
| x (m) | Water Depth (m) |
|---|
| −102 m | 0 m |
| −92.11 m | −1 m |
| −86.89 m | −1.5 m |
| −80.88 m | −3 m |
| −76.34 m | −4.5 m |
| −72.7 m | −6.5 m |
| −68.19 m | −9 m |
| −63.98 m | −11 m |
| −56.06 m | −15 m |
| −46.71 m | −19.5 m |
| −33.09 m | −25.5 m |
| −21.88 m | −30 m |
| −9.18 m | −35 m |
| 7.17 m | −40 m |
| 30.1 m | −45 m |
| 54.03 m | −50.5 m |
| 74.31 m | −54.5 m |
| 109.06 m | −60.5 m |
| 135.56 m | −65 m |
| 152.96 m | −67.27 m |
| 172.04 m | −70 m |
Table 3.
Seabed properties assumed in the numerical simulation.
Table 3.
Seabed properties assumed in the numerical simulation.
| Properties | Value | Unit |
|---|
| Normal stiffness | 50,000 | N/m2 |
| Normal damping | 500 | N/m2 |
| Friction coefficient | 1 | - |
Table 4.
Platform dimensions.
Table 4.
Platform dimensions.
| Geometry Dimensions | Value |
|---|
| Length overall | 14.33 m |
| Breadth of hull | 10.8 m |
| Hull height | 1.6 m |
| Hull width (outer–inner difference) | 0.8 m |
| Caisson height | 0.6 m |
| Caisson width/length | 0.47 m/2.4 m |
| Draft | 1.33 m |
Table 5.
The parameters of the wind turbine installed on the outdoor platform.
Table 5.
The parameters of the wind turbine installed on the outdoor platform.
| Parameter | Value |
|---|
| Rated wind speed | 5 m/s |
| Cut-in wind speed | 1.75 m/s |
| Cut-off wind speed | 11 m/s |
| Blade No. | 3 |
| Rotor diameter | 6.86 m |
| Tower length | 7.5 m |
| Tower outer/inner diameter | 0.1778 m/0.1678 m |
| Nacelle mass | 174 kg |
| Tower mass | 197 kg |
Table 6.
Mooring line arrangement.
Table 6.
Mooring line arrangement.
| Mooring Line Number | Total Length (m) | Line Arrangement |
|---|
| Onshore line 1 | 135 | 55 m of 78 mm stud chain
80 m of 32 mm stud chain |
| Onshore line 2 | 135 | 55 m of 78 mm stud chain
80 m of 32 mm stud chain |
| Offshore line 3 | 145 | 55 m of 78 mm stud chain
90 m of 32 mm stud chain |
| Offshore line 4 | 145 | 55 m of 78 mm stud chain
90 m of 32 mm stud chain |
Table 7.
Mooring line properties.
Table 7.
Mooring line properties.
| Properties | 32 mm Chain | 78 mm Chain |
|---|
| Nominal diameter | 32 mm | 78 mm |
| Mass per unit length | 22 kg/m | 133 kg/m |
| Breaking load | 83 t | 450 t |
| Axial stiffness | 1.03 × 10⁸ N | 6.14 × 10⁸ N |
| Transversal added mass coefficient | 1 | 1 |
| Longitudinal added mass coefficient | 0.5 | 0.5 |
| Transversal drag coefficient | 2.4 | 2.4 |
Table 8.
Anchor positions in global axis system (E,N) and local axis system (X, Y, Z).
Table 8.
Anchor positions in global axis system (E,N) and local axis system (X, Y, Z).
| Anchor | E | N | X (m) | Y (m) | Z (m) |
|---|
| Anchor1 | 556,166 | 4,218,096 | 77 | −85 | −4.2819 |
| Anchor2 | 556,305.03 | 4,218,199.69 | 80.89 | 88.4 | −3 |
| Anchor3 | 556,060.48 | 4,218,222.94 | −88 | 90 | −56.864 |
| Anchor4 | 556,202.32 | 4,218,333.76 | −88 | −90 | −56.864 |
Table 9.
Umbilical length and properties.
Table 9.
Umbilical length and properties.
| Properties | Value | Properties | Value |
|---|
| Umbilical (Upper) length | 33.81 m | Torsional stiffness | 3.428 kN·m2 |
| Floats length | 8.32 m | Bending stiffness | 0.124 kN·m2 |
| Umbilical (Lower) length | 12.97 m | Float diameter | 0.206 m |
| Total length (from platform to touchdown point) | 55.1 m | Float section linear mass | 15.26 kg/m |
| Linear mass | 6.53 kg/m | Float section linear gross buoyancy | −315 N/m |
| Linear wet weight | 44 N/m | Float section linear dry weight | 150 N/m |
| Minimum Breaking Load | 380 kN | Length of a single float | 0.308 m |
| Outer diameter | 50 mm | Distance between floats | 0.308 m |
| Axial stiffness | 50 MN | Number of floats | 14 |
Table 10.
Points locations under fish cage central sensors to estimate inner pool wave elevation.
Table 10.
Points locations under fish cage central sensors to estimate inner pool wave elevation.
| | X (m) | Y (m) | Z (m) |
|---|
| Point 1 | 3.3 m | −1.7 m | 0 |
| Point 2 | 3.3 m | 1.7 m | 0 |
| Point 3 | 0 | −1.7 m | 0 |
| Point 4 | 0 | 1.7 m | 0 |
| Point 5 | −3.3 m | −1.7 m | 0 |
| Point 6 | −3.3 m | 1.7 m | 0 |
Table 11.
Statistical comparison of platform motions between numerical simulation results and experimental data.
Table 11.
Statistical comparison of platform motions between numerical simulation results and experimental data.
| Platform Motions | vx (m/s) | vy (m/s) | vz (m/s) | Roll (deg) | Pitch (deg) | Yaw (deg) |
|---|
| Experiment record | Mean | −0.002 | 0.002 | 0.011 | 1.124 | 0.255 | −33.015 |
| Max | 0.125 | 0.141 | 0.165 | 1.765 | 2.291 | −30.779 |
| Min | −0.122 | −0.106 | −0.117 | 0.409 | −1.704 | −34.458 |
| SD | 0.029 | 0.027 | 0.030 | 0.188 | 0.343 | 0.701 |
| Numerical results | Mean | 0.000 | 0.000 | 0.000 | 0.049 | 0.352 | 0.331 |
| Max | 0.077 | 0.140 | 0.185 | 2.592 | 2.043 | 0.784 |
| Min | −0.071 | −0.153 | −0.176 | −2.656 | −1.340 | −0.033 |
| SD | 0.014 | 0.026 | 0.038 | 0.409 | 0.311 | 0.093 |
Table 12.
Statistical comparison of mooring line loads between numerical simulation results and experimental data for Configuration A.
Table 12.
Statistical comparison of mooring line loads between numerical simulation results and experimental data for Configuration A.
| Mooring Line Loads | Line 1 | Line 2 | Line 3 |
|---|
| Experiment record | Mean Values (t) | 1.178 t | 1.253 t | 1.504 t |
| Standard deviation (t) | 0.017 t | 0.012 t | 0.032 t |
| Numerical results | Mean Values (t) | 1.524 t | 1.624 t | 1.705 t |
| Standard deviation (t) | 0.015 t | 0.010 t | 0.017 t |
Table 13.
Comparison of standard deviations in nacelle accelerations between numerical simulation results and experimental data for Configuration A.
Table 13.
Comparison of standard deviations in nacelle accelerations between numerical simulation results and experimental data for Configuration A.
| Standard Deviation (m/s2) | Acceleration in x | Acceleration in y | Acceleration in z |
|---|
| Experimental record | 0.021 m/s2 | 0.023 m/s2 | 0.021 m/s2 |
| Numerical result | 0.058 m/s2 | 0.086 m/s2 | 0.066 m/s2 |
Table 14.
Statistical comparison of platform motions between numerical simulation results and experimental data for configuration B.
Table 14.
Statistical comparison of platform motions between numerical simulation results and experimental data for configuration B.
| Platform Motions | ax (m/s) | ay (m/s) | az (m/s) | Roll (deg) | Pitch (deg) | Yaw (deg) |
|---|
| Experimental record | Mean | −0.001 | −0.003 | 0.027 | −0.412 | 0.841 | −80.891 |
| Max | 0.103 | 0.156 | 0.104 | 0.053 | 1.347 | −80.498 |
| Min | −0.120 | −0.152 | −0.064 | −0.857 | 0.460 | −81.591 |
| SD | 0.030 | 0.046 | 0.021 | 0.159 | 0.164 | 0.182 |
| Numerical results | Mean | 0.000 | 0.000 | 0.000 | 0.041 | 0.443 | 0.266 |
| Max | 0.062 | 0.041 | 0.085 | 0.332 | 0.726 | 0.437 |
| Min | −0.062 | −0.048 | −0.074 | −0.292 | 0.169 | 0.011 |
| SD | 0.018 | 0.012 | 0.028 | 0.115 | 0.087 | 0.063 |
Table 15.
Statistical comparison of mooring line loads between numerical simulation results and experimental data for Configuration B.
Table 15.
Statistical comparison of mooring line loads between numerical simulation results and experimental data for Configuration B.
| Mooring Lines Loads | Line 1 | Line 2 | Line 3 | Line 4_1 | Line 4_2 |
|---|
| Experiment record | Mean Values (t) | 1.174 t | 1.329 t | 1.492 t | 1.743 t | 1.055 t |
| Standard deviation (t) | 0.016 t | 0.008 t | 0.020 t | 0.024 t | 0.017 t |
| Numerical results | Mean Values (t) | 1.490 t | 1.593 t | 1.728 t | 1.399 t | 1.164 t |
| Standard deviation (t) | 0.008 t | 0.007 t | 0.008 t | 0.008 t | 0.007 t |
Table 16.
Comparison of standard deviations in nacelle accelerations between numerical simulation results and experimental data for Configuration B.
Table 16.
Comparison of standard deviations in nacelle accelerations between numerical simulation results and experimental data for Configuration B.
| Standard Deviation (m/s2) | Acceleration in x | Acceleration in y | Acceleration in z |
|---|
| Experimental record | 0.044 m/s2 | 0.044 m/s2 | 0.060 m/s2 |
| Numerical result | 0.036 m/s2 | 0.041 m/s2 | 0.027 m/s2 |