Article

FishDet-XR and FishBoT-SLR-TDR: A YOLO11s-Based Detection and Tracker-Side Recovery-Reranking Framework for Underwater Fish Tracking


1
College of Ocean Science and Engineering, Shandong University of Science and Technology, Qingdao 266590, China
2
National Deep Sea Center, Qingdao 266237, China
*
Author to whom correspondence should be addressed.
J. Mar. Sci. Eng. 2026, 14(18), 1728; https://doi.org/10.3390/jmse14181728
Submission received: 10 July 2026 / Revised: 4 September 2026 / Accepted: 9 September 2026 / Published: 17 September 2026
(This article belongs to the Section Ocean Engineering)

Abstract

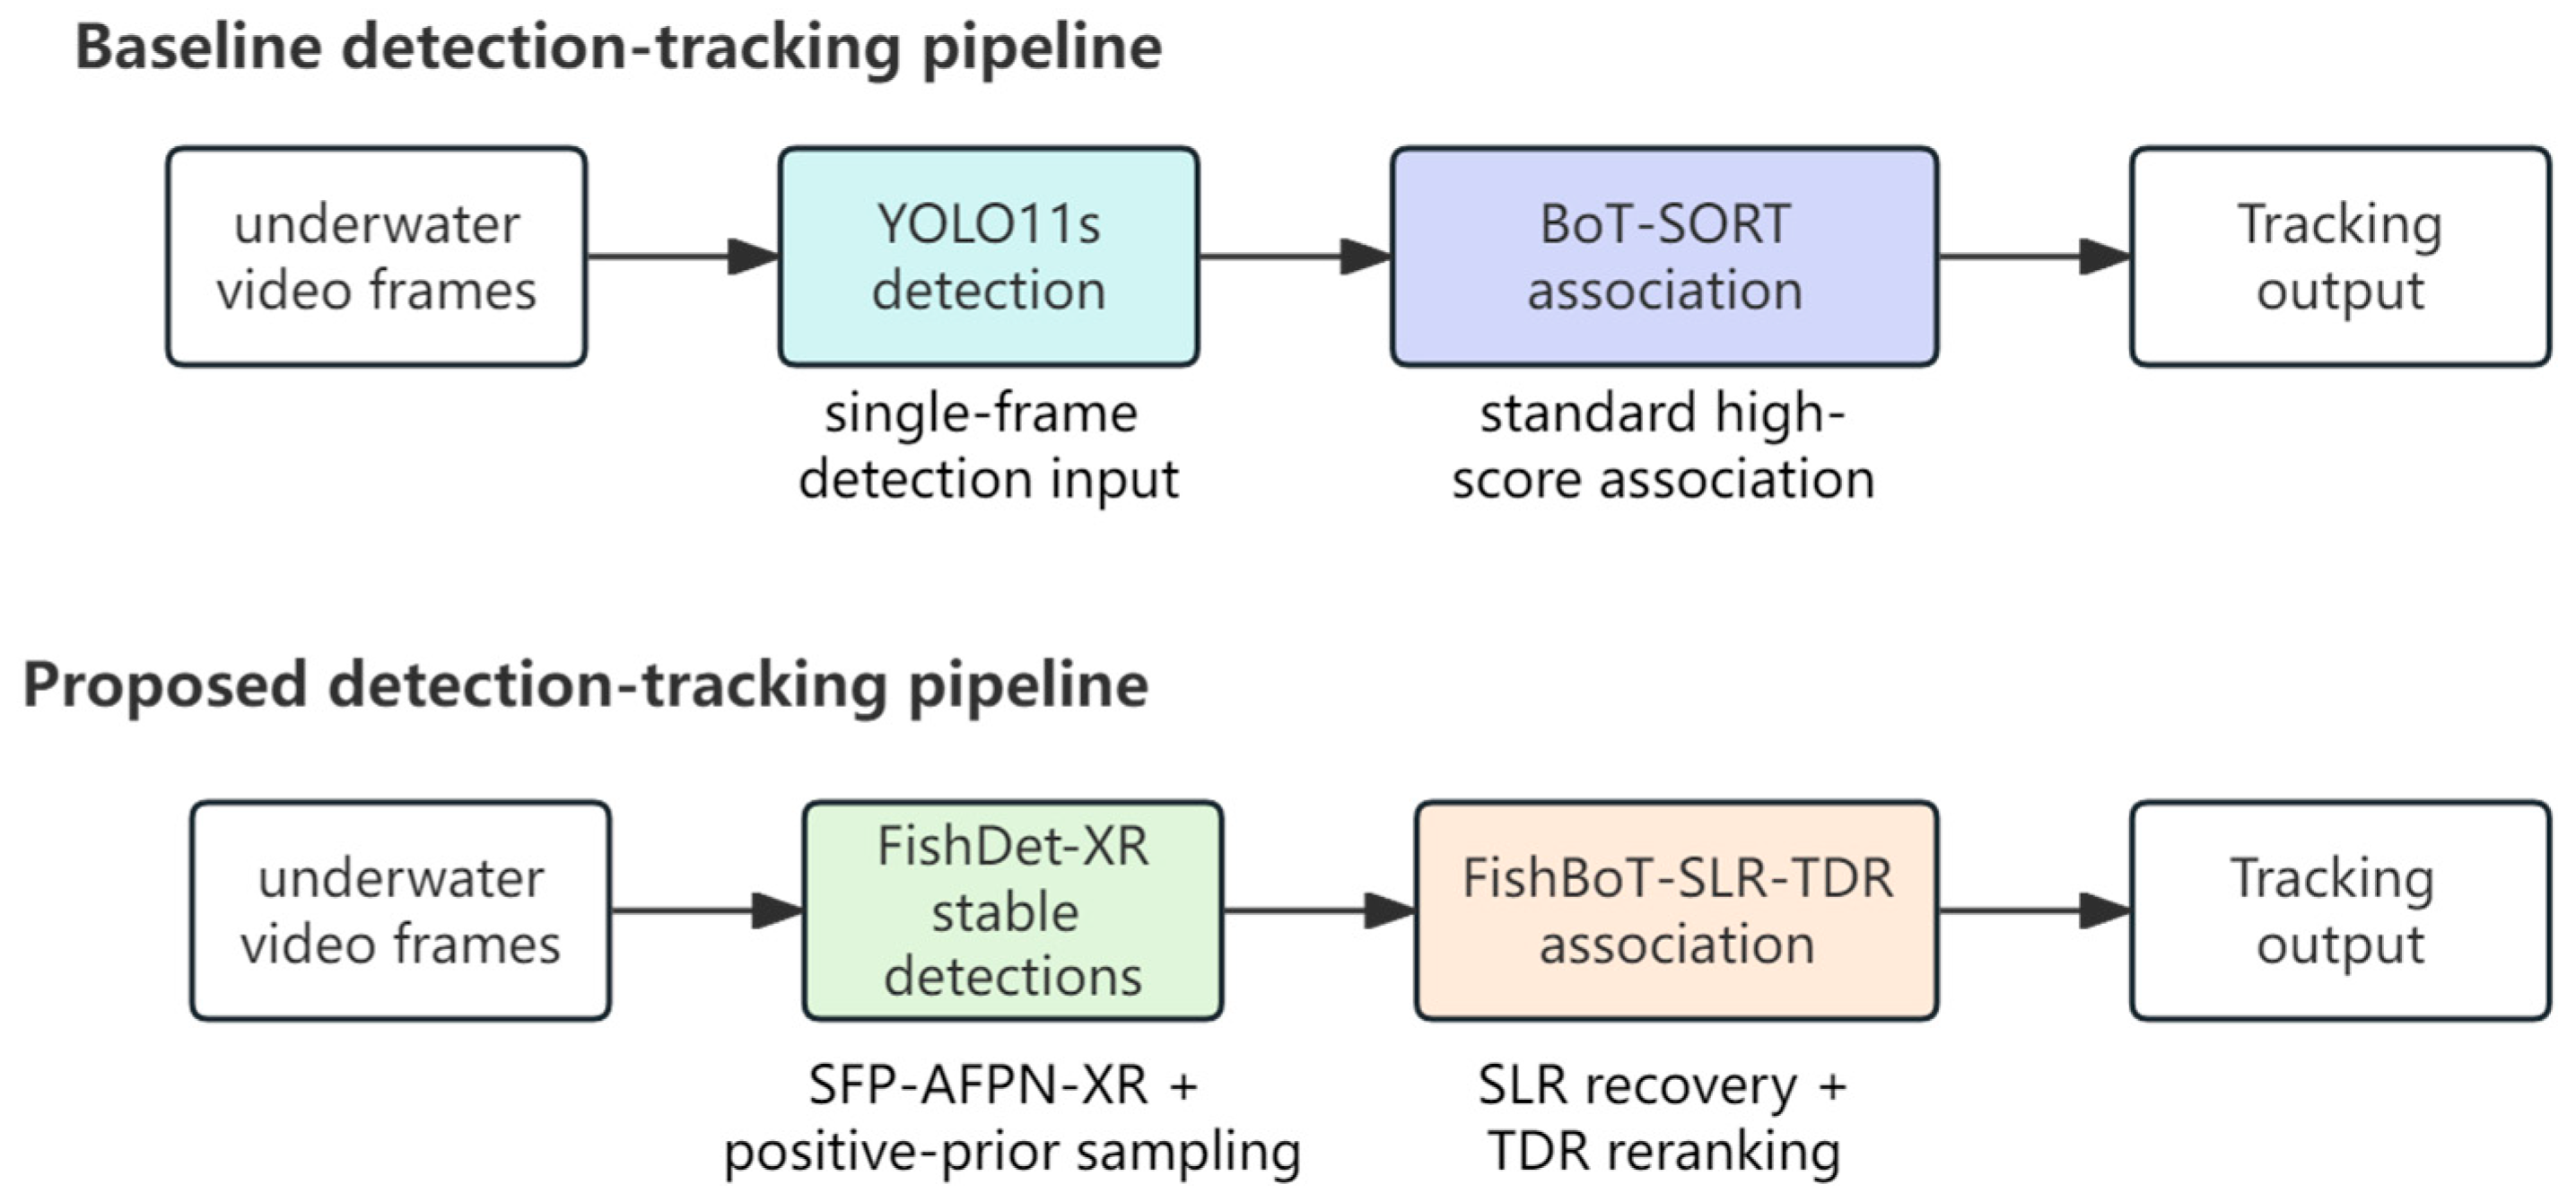
Underwater fish detection and multi-object tracking support marine ecological monitoring, underwater robot inspection, and fish behavior analysis. In a tracking-by-detection framework, this study targets three specific problems: unstable detection inputs for small- and medium-scale elongated fish, short-term trajectory breaks when low-confidence true detections are discarded, and identity switches caused by local candidate-edge competition when fish cross or move close together. We address these problems with a joint framework that combines the FishDet-XR detector and the FishBoT-SLR-TDR tracker. FishDet-XR stabilizes detector inputs through the proposed SFP-AFPN-XR feature-fusion neck, strip-shaped directional feature modeling, the Simple Parameter-Free Attention Module (SimAM), and positive-prior sampling. FishBoT-SLR-TDR improves tracker-side association through Spatially-Gated Low-Score Recovery (SLR) and Trajectory-Direction Reranking (TDR). Experiments on BrackishMOT-onlyfish show that the framework improves detection localization and tracking continuity while maintaining real-time inference. At the detection stage, FishDet-XR improves mean average precision at an Intersection over Union threshold of 0.50 (mAP50) from 74.48% to 76.19%, mean average precision averaged over Intersection over Union thresholds from 0.50 to 0.95 (mAP50–95) from 40.72% to 43.55%, and Precision from 86.75% to 88.00% compared with YOLO11s-640, while maintaining 54.76 frames per second (FPS). Compared with the YOLO11s-640 + BoT-SORT baseline, the final detection-tracking chain increases Higher Order Tracking Accuracy (HOTA) from 40.090 to 42.497 and identity F1 score (IDF1) from 51.372 to 54.926, while reducing identity switches (IDSW) from 184 to 159 and trajectory fragmentations (Frag) from 270 to 253.

1. Introduction

Underwater fish detection and continuous tracking support marine ecological monitoring, fish behavior analysis, smart aquaculture, and underwater robotic inspection [1,2,3]. In tracking-by-detection systems, detector output determines trajectory initialization, trajectory updating, and inter-frame association [4,5,6]. This study therefore treats detection and tracking as a coupled pipeline and asks whether the detector can provide stable fish boxes for subsequent association.
General underwater image degradation, including low visibility, color attenuation, suspended particles, and background clutter, creates operational difficulty [7]. The core problem addressed here is narrower: small- and medium-scale elongated fish are difficult to localize stably, and localization errors or confidence fluctuations can propagate to the tracker. In this setting, improving single-frame mean average precision (mAP) is insufficient.. The detector must also suppress false positives and provide reliable inputs for tracking-by-detection.
On the tracking side, two failure modes are especially important. First, the standard high-confidence association process may discard low-confidence true fish detections, preventing existing tracks from being updated and causing short-term trajectory breaks. Second, when fish cross, move in parallel, or appear close to one another, several candidate edges may have similar spatial costs, making identity switches more likely. These risks are consistent with low-score association and online tracking studies [5,6].
To address these three problems, we propose a joint detection-tracking framework that combines FishDet-XR and FishBoT-SLR-TDR. FishDet-XR targets unstable detection inputs for small- and medium-scale elongated fish. SLR targets short-term track fragmentation caused by discarded low-confidence true detections. TDR targets identity switching caused by local candidate-edge competition in crossing and adjacent-fish scenarios.
The main contributions of this study are summarized as follows:
(1)
A fish detector named FishDet-XR is proposed to improve the stability of detection inputs for small- and medium-scale elongated underwater fish. Built on YOLO11s [8], FishDet-XR introduces the SFP-AFPN-XR feature fusion structure, strip-shaped directional feature modeling, SimAM attention [9], and positive-prior sampling to improve localization quality and false-positive control while maintaining real-time inference.
(2)
A Spatially-Gated Low-Score Recovery module, termed SLR, is proposed to reduce short-term trajectory interruptions caused by discarded low-confidence true detections. SLR restricts low-confidence detections to the recovery of existing unmatched tracks and prevents them from initializing new trajectories, thereby improving trajectory continuity without globally lowering the detection threshold.
(3)
A Trajectory-Direction Reranking module, termed TDR, is proposed to reduce identity switching caused by local candidate-edge competition when fish cross, move in parallel, or appear close to each other. TDR uses short-term motion-direction consistency only under mature-track, valid-motion, and local mutual-competition conditions, so it refines ambiguous associations while preserving the original BoT-SORT matching thresholds.

2. Related Work

This review focuses on prior work related to the three problems addressed by the proposed framework: stable detector inputs for small- and medium-scale elongated fish, short-term trajectory breaks caused by discarded low-confidence true detections, and identity switches caused by local candidate-edge competition.

2.1. Underwater Fish and Marine Object Detection

Underwater fish and marine object detection are important for ecological monitoring, aquaculture inspection, and underwater robotic perception. BrackishMOT provides underwater video sequences with dense object annotations and has been used as a basis for fish-oriented detection and tracking evaluation [1]. FishTrack23 further expands underwater multi-object tracking resources and is discussed here as a related dataset background rather than as an experimental benchmark in this study [2].
Deep learning detectors have replaced many handcrafted underwater detection pipelines because they can learn hierarchical target representations from data. Two-stage detectors such as Faster R-CNN and Mask R-CNN provide strong localization ability but usually require more computation than one-stage detectors [10,11]. For real-time underwater applications, YOLO-family detectors remain attractive because they combine detection accuracy with efficient inference [12].
Recent underwater detectors increasingly modify the detector according to marine imaging and target characteristics. AquaYOLO adapts YOLO-based fish detection to aquaculture scenes with changing water clarity and dynamic backgrounds [3]. LFN-YOLO uses a lightweight reparameterized design to improve underwater small-object detection [13]. UOD-YOLO focuses on lightweight real-time detection of marine organisms [14]. Dynamic YOLO further targets small underwater object detection through adaptive model design [15].
These studies show that underwater detection has moved from general object localization toward task-specific design. Most studies, however, still report single-frame metrics. A tracking-by-detection system also requires stable localization, reliable confidence scores, and false-positive control because detector outputs directly affect trajectory association.

2.2. YOLO11-Based Underwater Detection and Lightweight Feature Fusion

YOLO11 provides a recent lightweight baseline for real-time detection [8]. Recent YOLO11-based underwater detectors have attempted to improve feature extraction, multi-scale fusion, and attention modeling for underwater objects and marine debris detection. MAS-YOLOv11 introduces multi-scale dilated attention, adaptive spatial feature fusion, and Slide Loss for underwater target detection [16]. An improved YOLOv11 network for underwater marine debris detection uses MixStructureBlock and Efficient Multi-scale Attention to strengthen feature extraction and refine the detection head [17]. FEFM-YOLO11 further modifies YOLO11 for underwater object detection with lightweight feature enhancement [18].
Lightweight feature fusion is central to small-object detection. Feature Pyramid Network (FPN) enhances semantic transfer through a top-down pathway [19], Path Aggregation Network (PANet) strengthens bottom-up localization flow [20], EfficientDet introduces weighted bidirectional fusion [21], and Asymptotic Feature Pyramid Network (AFPN) uses progressive fusion to reduce semantic gaps between feature levels [22]. These designs motivate the use of shallow information. Directly adding a high-resolution detection head, however, may increase candidate boxes, post-processing cost, and false positives.
WDS-YOLO is especially relevant because it proposes SF-PAFPN for marine benthos detection: P2 shallow features are down-sampled through Focus and fused with P3, after which Cross-Stage-Partial Omni-Kernel Module (CSPOKM) and Omni-Kernel Module (OKM) enhance small-object representation [23]. This study retains the shallow-feature supplementation idea but redesigns the enhancement branch for fish tracking input. FishDet-XR replaces the original large-kernel Omni-Kernel path with multi-scale strip-shaped convolutions, introduces SimAM as parameter-free attention, and uses a 50% enhancement branch selected by ablation. FishDet-XR is therefore not a direct reuse of WDS-YOLO; it adapts shallow-feature enhancement to elongated fish morphology and to the need for stable detection inputs in tracking-by-detection.

2.3. Underwater Fish Multi-Object Tracking and Tracker-Side Association

Most online multi-object tracking methods follow the tracking-by-detection paradigm. SORT combines Kalman filtering and Hungarian matching for efficient online tracking [4]. ByteTrack shows that low-confidence detections may still contain valid object information and can be used in a secondary association stage [5]. BoT-SORT improves motion modeling and association robustness and is therefore adopted as the baseline tracking workflow in this study [6]. DeepSORT is also relevant because it introduces a deep appearance metric to improve identity preservation [24]. Different from ByteTrack-style association, the proposed SLR does not allow low-confidence detections to initialize new trajectories; it only uses spatially gated low-confidence boxes to recover existing unmatched tracks.
Underwater fish tracking differs from pedestrian or vehicle tracking because fish often appear in dense groups, have similar local appearance, and move irregularly. In such scenes, low-confidence true detections can be discarded, causing existing tracks to break, and local candidate edges can compete when adjacent fish cross or move in parallel, causing identity switches [25].
Evaluation must reflect both detection and association quality. HOTA jointly measures detection and association performance [26]. MOTA, IDSW, and Frag reflect overall tracking errors, identity switches, and trajectory continuity [27], while IDF1 provides complementary information about identity preservation [28]. TrackEval implements HOTA and related tracking metrics [29]. Based on these considerations, this study proposes SLR for conservative low-score recovery and TDR for local candidate-edge reranking on top of BoT-SORT.

3. Materials and Methods

3.1. Overall Algorithm Framework

The proposed framework follows the tracking-by-detection paradigm and is organized around the three problems defined in the Introduction. FishDet-XR first processes consecutive BrackishMOT-onlyfish frames to generate fish bounding boxes, class labels, and confidence scores. FishBoT-SLR-TDR then uses these detections: BoT-SORT provides the baseline tracking workflow [6], SLR recovers reliable low-confidence detections for existing unmatched tracks, and TDR reranks locally competing candidate edges using short-term motion-direction consistency.

3.2. SFP-AFPN-XR Detection Network

3.2.1. YOLO11s Base Detection Network

We adopt YOLO11s as the baseline detector because it provides an end-to-end detection process, a lightweight architecture, and real-time inference [8]. The network consists of a Backbone, Neck, and Head. The Backbone extracts multi-level visual features, the Neck performs multi-scale feature fusion, and the Head outputs detections at the P3, P4, and P5 scales.
For the proposed tracking-by-detection pipeline, the limitation of the original YOLO11s is not simply general underwater image degradation. The key detector-side issue is that small- and medium-scale elongated fish may produce unstable localization and confidence responses, which then affect trajectory initialization and association. We therefore modify the Neck with SFP-AFPN-XR, introduce strip-shaped convolutions and SimAM attention for directional and target-region enhancement, and combine a 768 × 768 input size with positive-prior sampling to improve detection-input stability for the tracker.

3.2.2. SFP-AFPN-XR Structural Design

To address the small target size, elongated morphology, and tracking-input stability requirements of fish targets in the BrackishMOT dataset, this study draws on the shallow-feature fusion idea introduced in WDS-YOLO [23]. In that design, shallow features from P2 are down-sampled through Focus and fused with P3, and the fused feature is processed by CSPOKM and OKM to enhance small-object representation. However, the proposed FishDet-XR is not a direct reuse of WDS-YOLO. Table 1 summarizes the main structural differences.
As shown in Table 1, the proposed detector is built on the shallow-feature supplementation idea but redesigns the enhancement branch, directional modeling, attention mechanism, and branch ratio for elongated fish targets and for the stability requirement of subsequent multi-object tracking.
Table 1 is intended as a structural comparison with the closest architectural prior, not an empirical claim that FishDet-XR outperforms WDS-YOLO under identical experimental settings.
Adding a P2 detection head can provide higher-resolution feature maps, but it also increases detection candidates, post-processing overhead, and the risk of activating shallow background noise. This study therefore does not use P2 as an additional detection output layer. Instead, the Focus module downsamples the P2 feature map and fuses it with P3 in the Neck. This design supplements shallow detail without increasing the number of detection heads, improving small-target representation while controlling inference cost.
The overall architecture of the proposed FishDet-XR detector is shown in Figure 1, where the SFP-AFPN-XR neck, CSPOKM-XR, OKM-XR, and SimAM-based enhancement path are explicitly marked to distinguish the proposed detector from WDS-YOLO/SF-PAFPN.
As shown in Figure 1, the backbone network first extracts multi-scale feature maps, including P2, P3, P4, and P5. Among them, P2 has a high spatial resolution and contains rich edge, texture, and local morphological information, whereas P3, P4, and P5 serve as the main detection features of the YOLO11s neck and head. To strengthen small- and medium-scale fish representation without adding a new P2 detection head, SFP-AFPN-XR downsamples P2 through Focus and fuses it with P3, as defined in Equation (1).
Ffuse = Concat(FP3,Focus(FP2))
where FP2 represents shallow high-resolution features from the Backbone, FP3 represents small-object detection features from the Neck, and Ffuse denotes the fused feature map. This fusion enables the P3 layer to retain both semantic information and fine-grained structural details from P2.
After obtaining Ffuse, CSPOKM-XR further reconstructs and enhances the fused features. Inspired by the CSP branching strategy, CSPOKM-XR divides the input channels into an enhancement branch Fenh and a shortcut branch Fshort. OKM-XR processes the enhancement branch, while the shortcut branch preserves the original fused information, as described in Equations (2)–(4).
Fenh,Fshort = Split(Ffuse;e)
F′enh = OKMXR(Fenh)
Fout = Conv(Concat(F′enh,Fshort))
where F’enh represents the directional and attention-enhanced features from the OKM-XR enhancement branch, Fshort represents the shortcut features that retain the original fused information, and Fout represents the output feature map of CSPOKM-XR. In the current implementation, the channel ratio parameter is set to e = 0.5, meaning that 50% of the channels enter the OKM-XR enhancement branch and the remaining 50% pass through the shortcut branch. This setting balances feature enhancement and computational efficiency.
OKM-XR is the core component of the proposed SFP-AFPN-XR structure. The original Omni-Kernel module uses local, large, and global branches for global-to-local feature representation [30]. Although this design improves multi-scale representation, its large square-kernel branch is not tailored to elongated fish bodies. OKM-XR therefore replaces the original large-kernel path with multi-scale strip-shaped depthwise convolutions that emphasize horizontal and vertical directional context for slender fish targets.
The strip-shaped branch contains two groups of bidirectional strip-shaped convolutions: 1 × k/k × 1 and 1 × 2k/2k × 1. These branches capture directional context along the long axis of fish bodies while avoiding the parameter cost of large square kernels.
The overall feature enhancement process of OKM-XR can be expressed as:
FOKM − XR = Conv(Concat(Fdw,Fstrip1,Fstrip2,Fattn))
where Fdw denotes the depthwise convolution branch used to preserve local textures, edges, and short-range spatial responses. Fstrip1 and Fstrip2 denote the medium- and large-scale strip-shaped convolution branches, respectively, which extract directional context along elongated fish bodies. Fattn denotes the SimAM-enhanced attention branch. The output FOKM-XR is obtained by concatenating these branches and applying convolutional fusion.
To enhance target-region responses and suppress underwater background noise, this study introduces the parameter-free SimAM attention mechanism into OKM-XR [9], replacing the more complex DCAM and FSAM attention branches in the original structure. Unlike conventional channel-wise or spatial-wise attention mechanisms, SimAM adds no learnable parameters. It estimates neuron importance from an energy function and generates three-dimensional attention weights for feature refinement. The attention weight and feature enhancement process are expressed as follows:
d = (xμ)2
E inv = d 4 ( v + λ ) + 0.5
A = σ(Einv), Y = XA
where X denotes the input feature map; x denotes the response of an individual neuron; μ and v represent the mean and variance of the features along the spatial dimensions, respectively; λ is a stabilizing coefficient; σ(.) denotes the Sigmoid activation function; and ⊙ denotes element-wise multiplication. The 0.5 term in Equation (7) is not an additional modification introduced in this study. It follows the original SimAM implementation, where inverse energy is computed before the Sigmoid function is applied [9]. This study therefore adopts SimAM in its original parameter-free form rather than modifying its energy-function formulation.
For underwater scenes with low contrast, suspended particles, aquatic plant textures, and background noise, SimAM can strengthen responses in informative target regions while reducing interference from irrelevant background activations without increasing the number of learnable parameters. Therefore, it is suitable for the lightweight and real-time requirements of the proposed detector.

3.2.3. Input Resolution and Positive-Prior Sampling Training Strategies

In underwater fish detection, fish targets often occupy a small proportion of the image, especially under long-range imaging, low illumination, and strong background interference. With the original 640 × 640 input resolution, small- and medium-scale fish may lose edge, texture, and local morphological details during network downsampling. To improve pixel-level target representation, this study increases the detector input size from 640 × 640 to 768 × 768. This setting increases side length by 20% and image area by 44%. The P3 feature map at stride 8 correspondingly increases from 80 × 80 to 96 × 96, preserving more spatial detail for small- and medium-scale fish without adding a detection head.
In addition to input resolution, the imbalance between positive and negative samples also affects detector training. In the original BrackishMOT-onlyfish training set, there are 13,131 images, including 5340 positive samples containing fish targets and 7791 negative samples without fish annotations. The positive-to-negative ratio is approximately 0.685:1. Since negative background frames appear more frequently during training, the model may overfit background regions and insufficiently learn effective fish target features.
To address this issue, this study adopts a positive-prior sampling strategy for the training set. The strategy does not modify image content or annotation files. Instead, it retains all negative samples once and writes positive samples repeatedly into the training list to increase their sampling probability. Specifically, all 7791 negative samples are retained, 438 positive samples are written twice, and 4902 positive samples are written three times. After reconstruction, the training list contains 23,373 entries, including 15,582 positive entries and 7791 negative entries, and the positive-to-negative ratio is adjusted to 2.000:1. Table 2 compares the sample distributions before and after positive-prior sampling.
The positive-prior sampling strategy increases the exposure frequency of fish-containing frames during training while preserving all background samples. Therefore, the model can learn fish target features more effectively without discarding negative samples. Combined with the 768 × 768 input resolution, this strategy improves the representation of small- and medium-scale fish targets and provides more stable detection inputs for the subsequent FishBoT-SLR-TDR tracker.

3.3. FishBoT-SLR-TDR Tracking Network

After fish detection, this study constructs an underwater tracking-by-detection framework. The detector generates fish boxes and confidence scores for each frame, and the tracker assigns identities by using box positions, predicted trajectory states, and association costs. We use FishDet-XR detections as tracker input, adopt BoT-SORT as the base tracking network [6], and build FishBoT-SLR-TDR on this foundation.
FishBoT-SLR-TDR is a lightweight tracker-side method with two components. Spatially-Gated Low-Score Recovery (SLR) mitigates short-term tracking breaks caused by discarded low-confidence true detections. Trajectory-Direction Reranking (TDR) mitigates identity switches caused by local candidate-edge competition in converging or dense fish motion. Both modules adjust the use of detection boxes and the ranking of candidate association edges without detector retraining.

3.3.1. BoT-SORT Basic Tracking Network
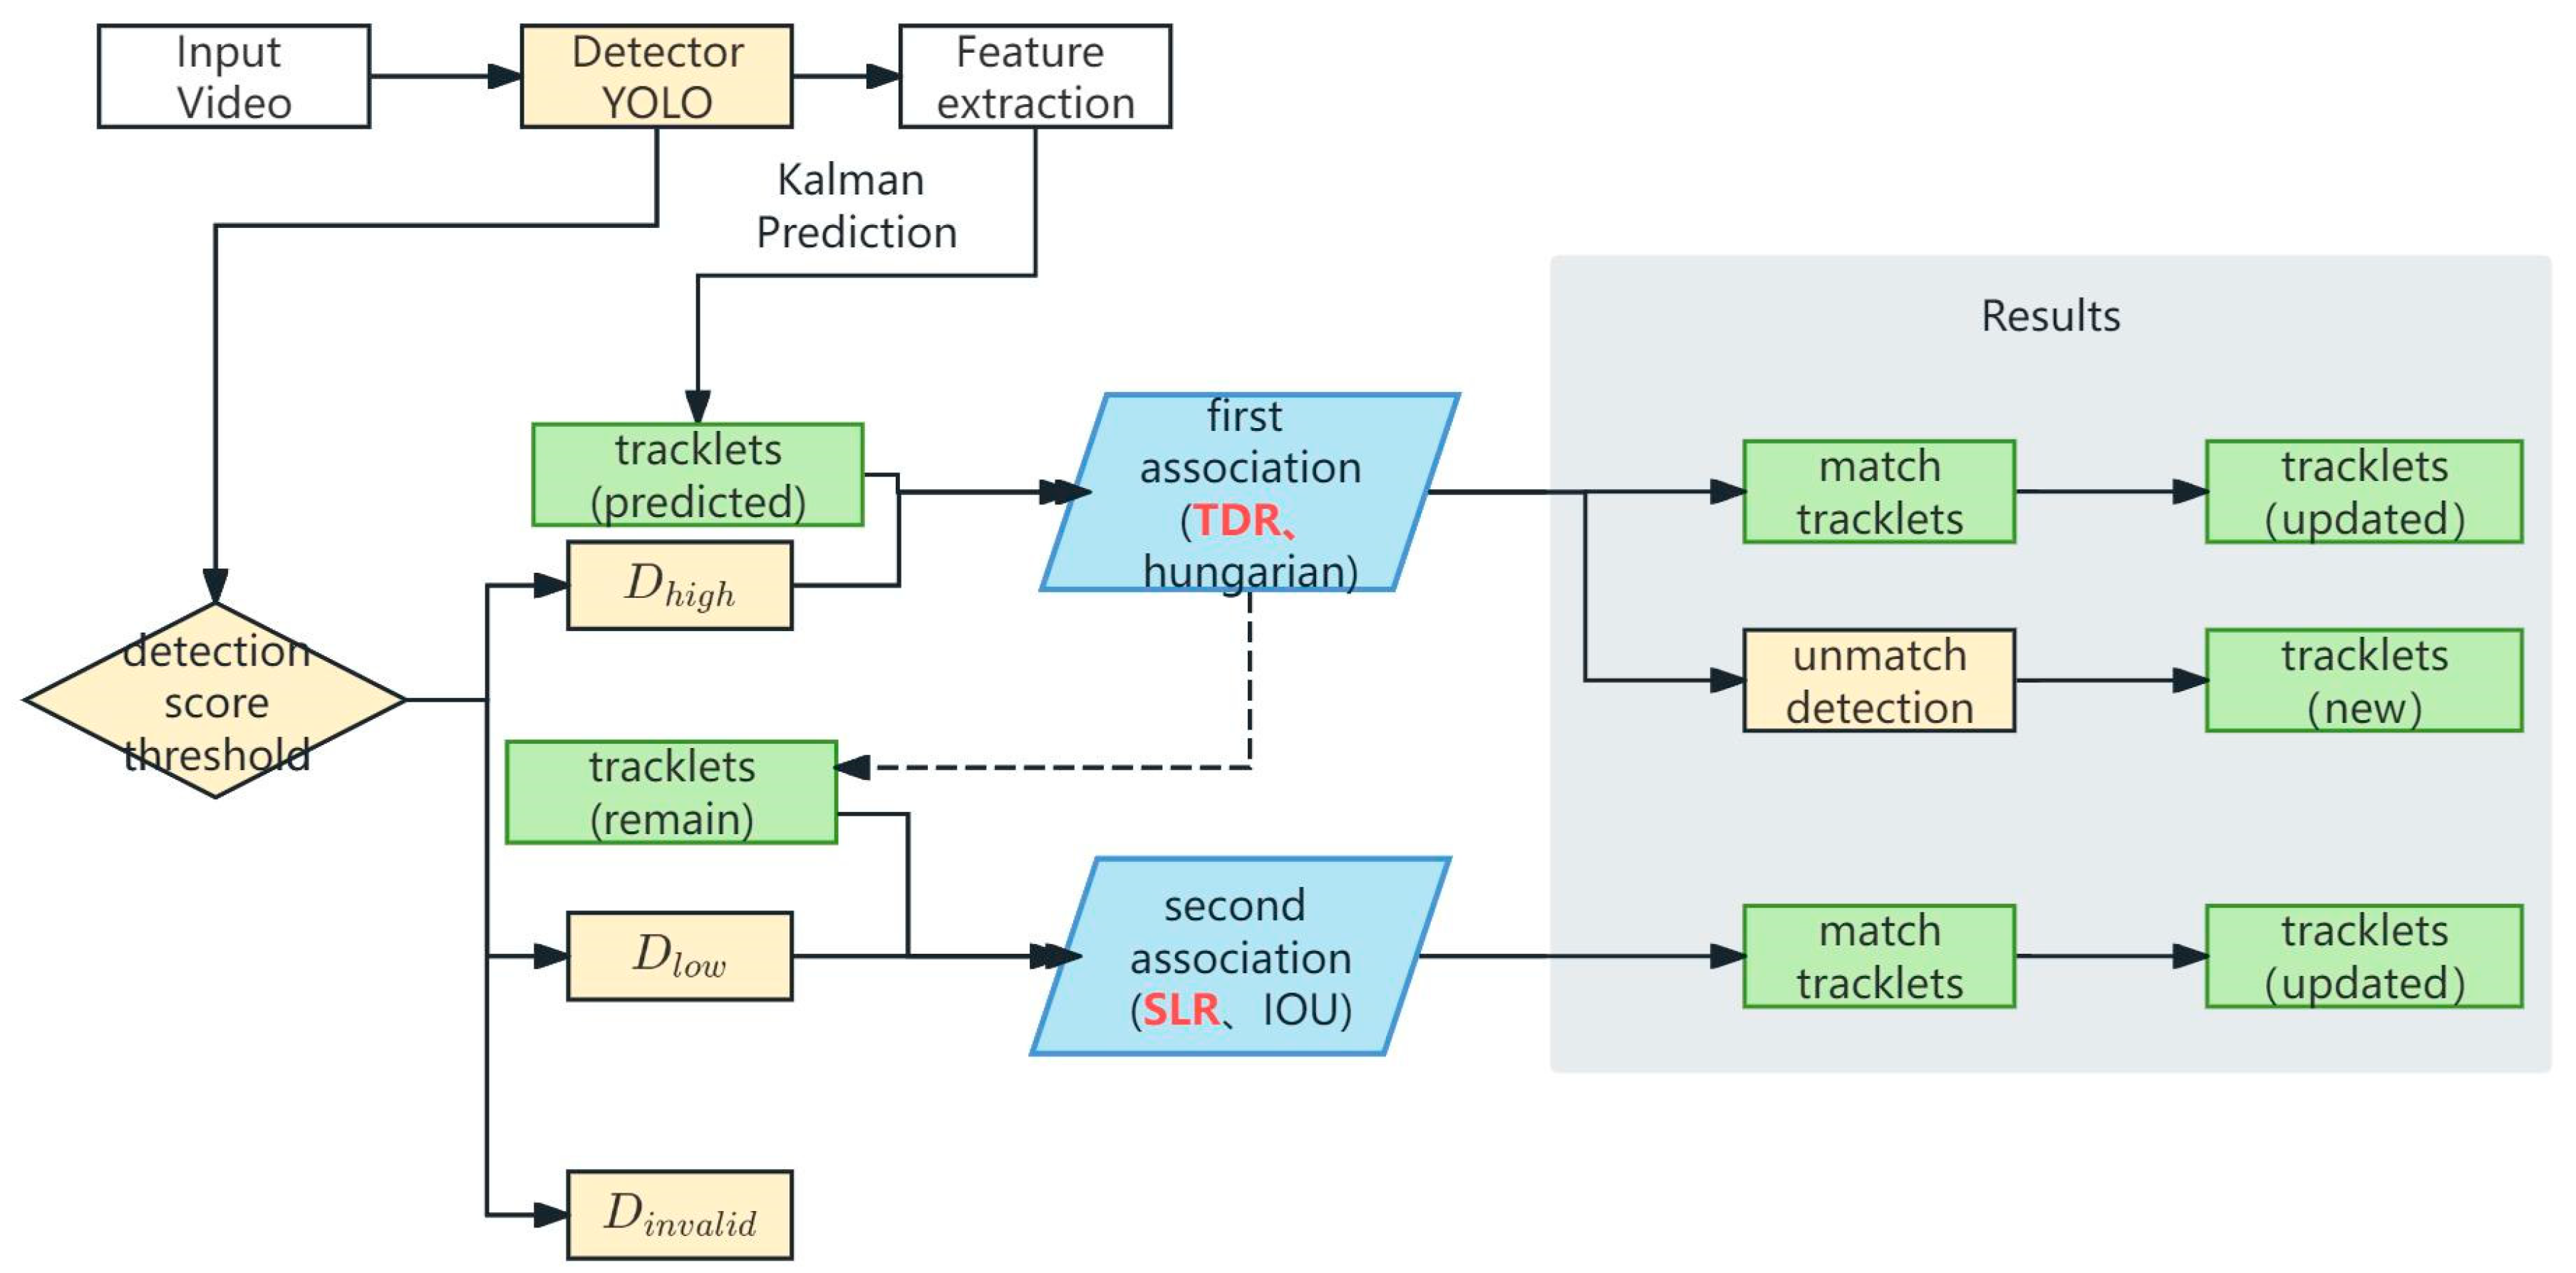
BoT-SORT is a representative tracking-by-detection method [6]. Its workflow includes trajectory state prediction, detection-to-track association, trajectory updating, new trajectory initialization, and failed trajectory management. This study uses FishDet-XR detections as input to BoT-SORT to construct the FishDet-XR + BoT-SORT baseline. On this baseline, SLR and TDR serve as tracker-side modifications for short-term trajectory recovery and local identity-preserving association. The baseline tracking workflow and the positions where SLR and TDR are inserted are shown in Figure 2.
Figure 2. A BoT-SORT-based multi-object fish tracking workflow.
Jmse 14 01728 g002
For an input video sequence, FishDet-XR detects fish boxes and confidence scores in the current frame. BoT-SORT then predicts existing track states, builds an association cost matrix from predicted track boxes and current detections, and uses the Hungarian algorithm for matching. Matched trajectories are updated with their assigned detections, unmatched high-confidence detections can initialize new candidate trajectories, and lost trajectories are removed after exceeding the retention time. This workflow maintains fish identities across consecutive frames and provides the baseline on which SLR and TDR are added.
SLR and TDR target two common underwater tracking failures on the BoT-SORT baseline. SLR conservatively uses low-score boxes to restore existing trajectories, whereas TDR reranks locally competing association edges according to directional consistency.

3.3.2. Spatially-Gated Low-Score Recovery Module

SLR stands for Spatially-Gated Low-Score Recovery. It addresses cases in which existing trajectories break because underwater fish targets generate low-confidence detections under occlusion, blur, rapid motion, or small target size. Low-confidence detections may still contain valid target information [5]. If the tracker discards them completely, existing trajectories may fail to update, causing breaks and fragmentation.
Simply lowering the global detection threshold is not appropriate. Underwater scenes contain aquatic plants, bubbles, light spots, suspended particles, and complex background textures, so an excessively low threshold would introduce more false background boxes. The tracker must therefore recover useful low-confidence detections without allowing background false positives to create erroneous trajectories.
To address this issue, SLR adds a conservative recovery phase after the standard high-confidence association in BoT-SORT. Low-confidence detections can participate only in the second-stage recovery of existing unmatched trajectories and cannot initialize new trajectories.
(1) Classification of detection boxes: To use detections hierarchically, this study categorizes detection results into high-confidence and low-confidence boxes based on the confidence score. Let D denote the set of detection boxes, and let si denote the confidence score of the i-th detection. The high-confidence and low-confidence detection sets are defined as follows:
Dhigh = {diDsiτh}; 
Dlow = {diDτl < si < τh}
Ddiscard = {diDsiτl}
Here, τh = 0.25 is the high-confidence threshold, and τl = 0.15 is the low-confidence lower bound. Detections with scores no lower than τh are classified as high-confidence boxes and are used for conventional trajectory association, trajectory updates, and new high-confidence trajectory initialization in the first BoT-SORT stage. Detections with scores in the interval (τl,τh) are classified as low-confidence boxes and serve only as SLR recovery candidates for unmatched existing tracks. Detections with scores no higher than τl are discarded because they carry a higher risk of background noise and false positives.
(2) Matching rules: SLR uses a two-stage association mechanism. The first stage follows the original high-confidence BoT-SORT association process and uses Dhigh for trajectory prediction, matching, updating, and high-confidence new-track initialization. The second stage performs low-confidence recovery only for existing trajectories that were not matched in the first stage. Let Tunmatched denote the set of existing trajectories that remain unmatched after the first stage; SLR exposes only Dlow to these trajectories and performs IoU matching under the spatial gate in Equation (11).
M SLR = { ( t j , d i )   t j T unmatched ,   d i D low ,   IoU ( B t j , B d i ) τ r }
where tj in Tunmatched indicates an existing trajectory that failed matching in the first stage, di in Dlow indicates a low-confidence detection box, B t j denotes the predicted bounding box of the trajectory tj, and B d i denotes the low-confidence detection box. The recovery IoU threshold is τr = 0.60. Only when the IoU between the low-confidence detection and the predicted trajectory box is not lower than 0.60 can the detection recover the existing trajectory.
The spatial gate restricts recovered boxes to locations consistent with the predicted track. As a result, SLR uses low-confidence detections for trajectory continuation rather than object discovery, improving short-term recovery while limiting false-track generation.

3.3.3. Trajectory-Direction Reranking Module

TDR stands for Trajectory-Direction Reranking. It addresses identity switches caused by local candidate-edge competition in dense underwater fish gatherings. SLR can recover existing trajectories with low-confidence detections after first-stage matching fails, but it cannot directly correct erroneous first-stage matches. TDR therefore performs lightweight directional reranking of competing candidate association edges from the first stage.
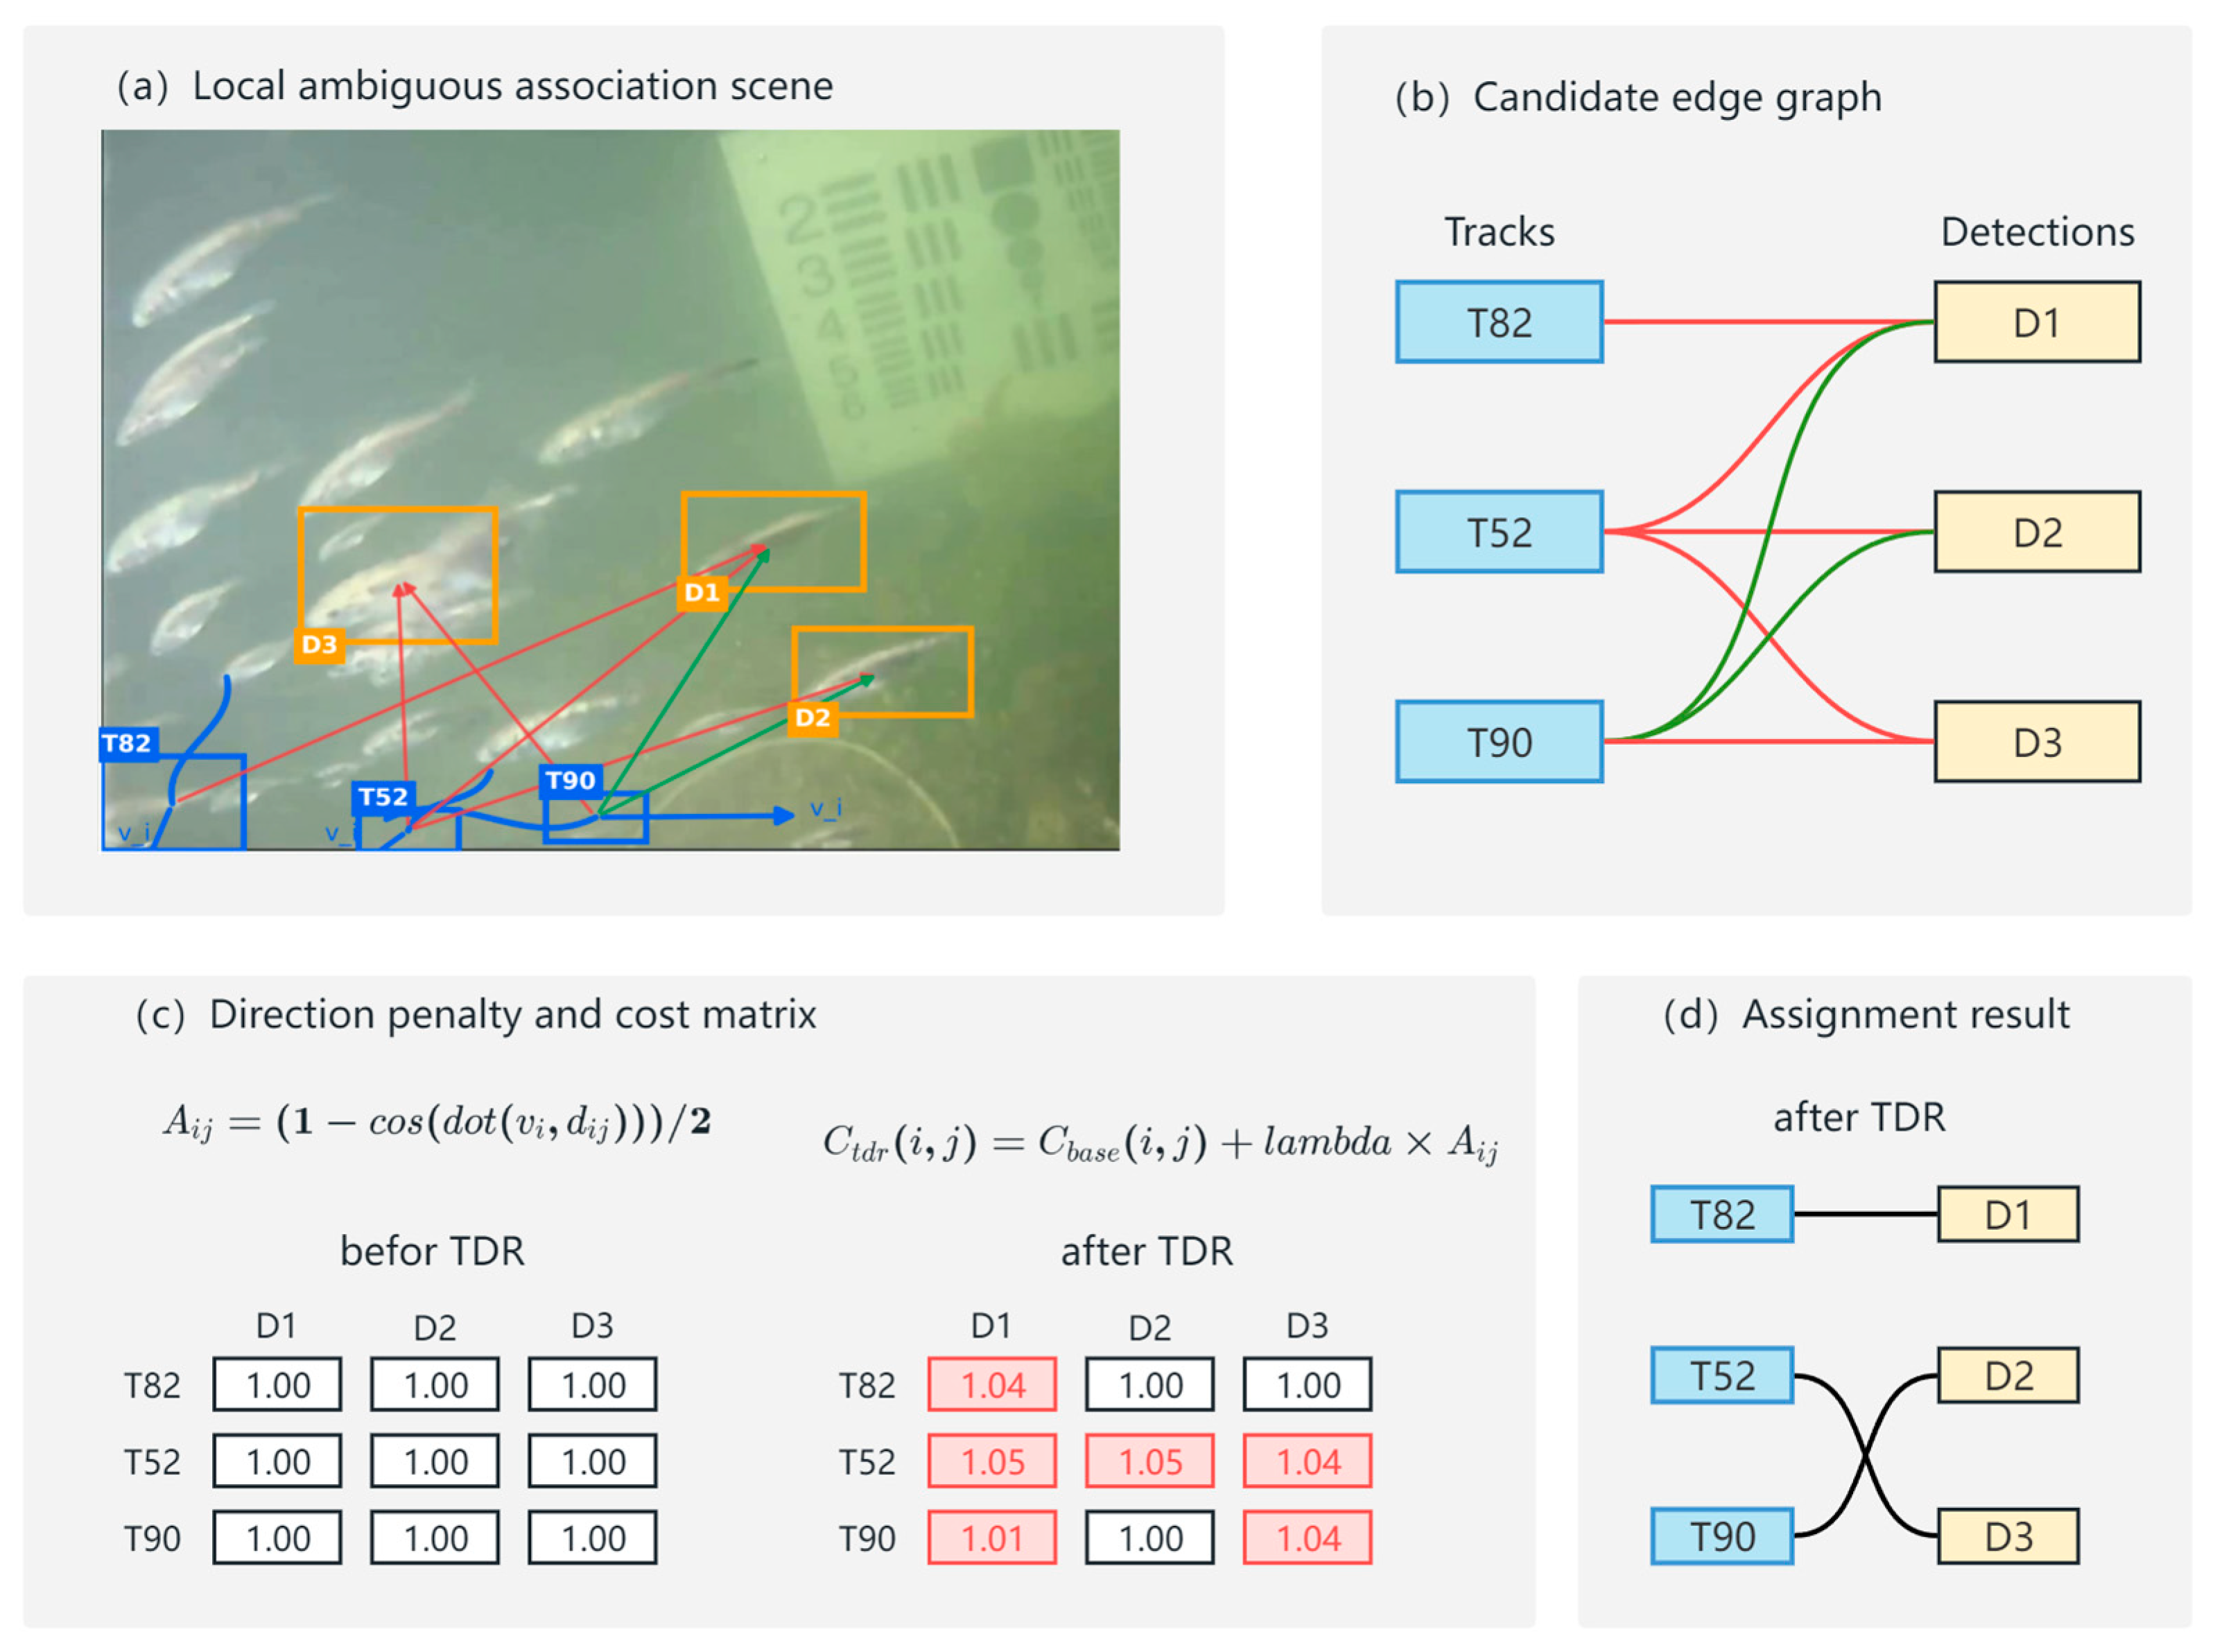
In underwater fish videos, converging fish schools, parallel motion of adjacent targets, and short-term occlusion can create competing candidate matches between multiple trajectories and detections. Relying only on IoU or raw motion cost may associate a trajectory with a detection located in a direction inconsistent with its recent motion, causing an identity switch. TDR adds a direction-reversal cost to locally competing candidate edges that already satisfy the original matching conditions, thereby adjusting their order. The workflow of the proposed TDR module and its local competing-edge reranking process are illustrated in Figure 3.
Figure 3. Illustration of the proposed Trajectory-Direction Reranking (TDR) module for local competing associations in underwater fish tracking. (a) Local ambiguous association scene; (b) candidate edge graph between tracks and detections; (c) direction penalty and updated association cost matrix; (d) assignment result after TDR. Blue boxes denote existing tracks, yellow boxes denote detection candidates, red edges and red matrix values indicate direction-inconsistent or penalized candidate associations, and green edges indicate direction-consistent or selected associations. The numerical values in the matrices denote association costs before and after TDR reranking.
Jmse 14 01728 g003
(1) Calculation method: Let vj denote the Kalman velocity vector of the j-th trajectory, and let uij denote the displacement vector from the previous trajectory center to the candidate detection center. If the candidate detection box falls in the region opposite to the historical motion direction, the cosine similarity between vj and uij becomes small or negative, increasing the direction reversal cost in Equation (12).
c dir ( t j , d i ) = 1 cos ( v j , u ij ) 2
where cdir(tj,di) represents the normalized direction reversal cost. When the candidate detection is consistent with the trajectory’s historical velocity direction, the cosine similarity approaches 1 and cdir approaches 0, indicating a reliable association. When the two directions are inconsistent, cdir increases and penalizes the candidate edge during local reranking.
To incorporate motion direction consistency into the association process, the direction reversal cost is added to the original association cost of BoT-SORT:
C ij = C ij base + λ c dir ( t j , d i )
where C ij base is the original spatial-motion association cost in the first BoT-SORT stage, Cij is the adjusted association cost, and λ is the direction cost weight. According to the parameter selection experiment, this study uses λ = 0.05.
To avoid affecting stable associations, TDR is applied only to mature trajectories, valid motion states, and locally competing candidate edges. The following constraints are used:
age(tj) ≥ Amin
v j area ( B t j ) v min
C ij base C best base δ c
where mutual row-column competition means that multiple tracks and multiple detection candidates compete in the cost matrix. Here, age(tj) represents the trajectory age of the j-th track, B t j represents the predicted trajectory box, area ( B t j ) denotes the predicted box area, C best base represents the best baseline association cost among the current candidate matches, Amin is the minimum trajectory age, vmin is the minimum normalized velocity threshold, and δc is the candidate-edge cost margin. These constraints ensure that TDR is used only when the motion estimate is sufficiently reliable, and the candidate edge is involved in local competition.
We further require both the rows and columns of candidate edges to contain competing matches. In other words, both the target trajectory and the detection box must belong to a many-to-many ambiguous matching scenario. This constraint restricts TDR to error-prone cases, such as converging fish schools or dense target overlap, and prevents it from interfering with stable one-to-one matches.
TDR is a lightweight post-processing strategy: it does not change the original BoT-SORT matching threshold, add or remove candidate edges, or require an additional ReID branch. It only reranks eligible competing edges, preserving the core matching logic while maintaining practical deployability.
In summary, SLR and TDR form a complementary tracker-side strategy. SLR focuses on conservative recovery of low-confidence detection inputs, while TDR focuses on reordering local candidate edges based on directional consistency. Embedded into the BoT-SORT baseline, these two modules constitute the FishBoT-SLR-TDR framework evaluated in Section 4.

4. Experimental Results and Analysis

4.1. Experimental Setup

To evaluate the proposed framework, this section first describes the construction of the BrackishMOT-onlyfish dataset, then introduces the detection and tracking metrics, and finally reports the implementation details. The same sequence-level train/test split is used throughout the detection and tracking experiments to ensure that the results are comparable.

4.1.1. Dataset and Preprocessing

The BrackishMOT dataset [1] is used as the primary data source for underwater fish detection and tracking experiments. It targets underwater multi-object tracking in brackish water and contains 98 video sequences, with 78 for training and 20 for testing. The original dataset annotates six underwater target classes: fish, crab, shrimp, starfish, small fish, and jellyfish, and provides frame-by-frame trajectory annotations in MOTChallenge format. Its turbidity, light attenuation, background texture, dense fish motion, and short-term occlusion make it suitable for evaluating underwater fish detection and multi-object tracking.
Because this study focuses on underwater fish detection and continuous tracking, whereas the original BrackishMOT dataset also contains non-fish targets, we first adapt the dataset to the target task.
For detection, we retain only the “fish” and “small fish” classes, merge them into a single “fish” class, and map them to the 0: fish label in YOLO. We then convert the original MOT pixel-level top-left coordinates and width-height annotations into the normalized center-coordinate and width-height format required by YOLO. Bounding boxes that extend beyond image boundaries or have invalid dimensions are cropped or removed. The processed detection dataset is named BrackishMOT-onlyfish and is used for detector training and scale-dependent evaluation.
For tracking, we also merge “fish” and “small fish” into a single fish category while preserving frame order and target ID information from the original video sequences. This preserves trajectory continuity and identity consistency for multi-object tracking evaluation. After category filtering, non-fish targets are excluded, while temporal fish trajectories are retained for calculating HOTA, MOTA, IDF1, IDSW, and Frag. The processed tracking dataset is named BrackishMOT-onlyfish and is used for subsequent experiments with BoT-SORT, FishBoT-SLR, and FishBoT-SLR-TDR.
To evaluate adaptability to small- and medium-scale fish, we classify targets by the ratio of bounding-box area to image area. Following the 32 × 32 and 96 × 96 pixel thresholds used in general object detection [31] and converting them to relative area ratios under a 640 × 640 input scale, we define the target area ratio as r = wnorm × hnorm. Small targets satisfy r < 0.25%, medium targets satisfy 0.25% ≤ r ≤ 2.25%, and large targets satisfy r > 2.25%. This classification avoids the effect of varying image sizes on scale assessment and supports the scale-specific detection and tracking experiments. Table 3 reports the statistical distribution of the converted detection dataset.

4.1.2. Evaluation Metrics

We evaluate the proposed underwater fish detection and tracking framework at two levels: object detection and multi-object tracking. The detection task measures single-frame fish localization and classification, whereas the tracking task measures trajectory continuity, identity consistency, and association stability across consecutive frames.
For the detection task, Precision, Recall, mean average precision at an Intersection over Union threshold of 0.50 (mAP50), mean average precision averaged over Intersection over Union thresholds from 0.50 to 0.95 (mAP50–95), model parameters (Params), floating-point operations (FLOPs), and frames per second (FPS) are adopted as evaluation metrics. Precision measures the ability of the detector to suppress false positives, while Recall reflects the ability to discover real fish targets. They are calculated as follows:
Precision = TP TP + FP
Recall = TP TP + FN
where TP, FP, and FN denote true positives, false positives, and false negatives, respectively. In underwater fish detection, Recall is important for evaluating whether fish targets are missed under low contrast, occlusion, or background interference, whereas Precision is particularly important for reducing false detections that may disturb subsequent trajectory association.
The mAP50 metric represents the mean average precision at an IoU threshold of 0.50, while mAP50–95 denotes the average mAP over IoU thresholds from 0.50 to 0.95 with a step size of 0.05. Compared with mAP50, mAP50–95 imposes stricter requirements on bounding-box localization quality. Params and FLOPs are used to measure model size and computational complexity, respectively, while FPS is used to evaluate real-time inference capability.
For the multi-object tracking task, Higher Order Tracking Accuracy (HOTA), Detection Accuracy (DetA), Association Accuracy (AssA), Multiple Object Tracking Accuracy (MOTA), identity F1 score (IDF1), identity switches (IDSW), and trajectory fragmentations (Frag) are used. HOTA jointly measures detection accuracy and association accuracy, while DetA and AssA separately reflect detection quality and association quality [26]. MOTA measures the overall tracking error caused by missed detections, false positives, and identity switches [27], and is calculated as:
MOTA = 1 t ( F N t + F P t + IDS W t ) t G T t
Here, FNt, FPt, and IDSWt denote the number of missed detections, false positives, and identity switches at frame t, respectively, and GTt denotes the number of ground-truth objects at frame t.
IDF1 evaluates the consistency of target identity preservation and is defined as [28]:
IDF 1 = 2 IDTP 2 IDTP + IDFP + IDFN
where IDTP, IDFP, and IDFN represent correctly matched identities, incorrectly matched identities, and missed identities, respectively. IDSW denotes the number of identity switches, and Frag denotes the number of trajectory fragmentations. For underwater fish tracking, these two metrics are particularly important because occlusion, low-confidence detection, dense fish crossing, and background interference often lead to trajectory breaks and identity changes. Lower IDSW and Frag indicate better identity preservation and trajectory continuity.
Overall, the detection metrics evaluate whether the detector can provide accurate, stable, and efficient fish bounding boxes, while the tracking metrics further assess whether these detections can be reliably associated over time. Therefore, this study uses mAP50, mAP50–95, Precision, and Recall to evaluate detector performance, and uses HOTA, IDF1, IDSW, and Frag as the key indicators for the final detection–tracking framework.

4.1.3. Experimental Environment and Implementation Details

All experiments were conducted on Windows 11 with an Intel Core i7-14650HX CPU, 32 GB RAM, and an NVIDIA GeForce RTX 4070 Laptop GPU with 8 GB VRAM. The software environment used Python 3.11.14, PyTorch 2.5.0, CUDA 11.8, cuDNN 9.1, Ultralytics 8.3.228, and OpenCV 4.13.0. The YOLO11s detector was implemented with the Ultralytics YOLO11 framework, its official documentation [32], and the model configuration [33]. SFP-AFPN-XR was implemented by modifying the YOLO11s neck. WDS-YOLO was used only as an architectural reference for shallow feature fusion and CSPOKM/OKM-style enhancement [23]. The tracking baseline followed the official BoT-SORT implementation [6], and tracking metrics were calculated with TrackEval [29].
The original BrackishMOT sequence-level split was used throughout: 78 video sequences for training and 20 held-out sequences for testing. Detection models were trained on the training split and evaluated on the held-out test split, and the same held-out sequences were used for multi-object tracking evaluation. No additional model selection was performed on test annotations, which reduces leakage between adjacent frames from the same video sequence.
Detection training used the same settings for YOLO11s, YOLO11s + SFP-AFPN-XR, and FishDet-XR: 100 epochs, batch size 8, optimizer set to “auto,” initial learning rate 0.01, final learning-rate ratio 0.01, weight decay 0.0005, 3 warmup epochs, 4 data-loading workers, and random seed 28. YOLO11s and YOLO11s + SFP-AFPN-XR used 640 × 640 input, whereas FishDet-XR used 768 × 768 input with positive-prior sampling. Detection evaluation used a confidence threshold of 0.001, non-maximum suppression (NMS) Intersection over Union (IoU) of 0.7, and a maximum of 300 boxes for mAP calculation; Precision and Recall used confidence 0.25 and IoU 0.50. Tracking used BoT-SORT with track_buffer = 30, match_thresh = 0.8, new_track_thresh = 0.25, sparse optical flow global motion compensation (GMC), no additional re-identification (ReID) network, track_low_thresh = 0.10 for BoT-SORT, and track_low_thresh = 0.15 for FishBoT-SLR and FishBoT-SLR-TDR. The final SLR recovery IoU was 0.60, and TDR used λ = 0.05, candidate-edge margin 0.08, minimum normalized velocity 0.03, minimum trajectory age 3, and mutual competing-edge filtering. Unless otherwise stated, all reported detection and tracking results are single-run results obtained under the fixed random seed, fixed sequence-level train/test split, and fixed evaluation protocol described above. Therefore, the results are interpreted as benchmark results under the BrackishMOT-onlyfish setting rather than as multi-run statistical evidence. Multi-seed evaluation with standard deviations will be considered in future work to further assess statistical robustness.

4.2. Detection Experiment Results and Analysis

4.2.1. SFP-AFPN-XR Architecture Ablation Experiments

This section tests whether the proposed neck structure provides a better detection input for tracking-by-detection. At an input size of 640 × 640, the ablation compares the YOLO11s baseline, direct P2 head addition, shallow feature fusion, and the final SFP-AFPN-XR architecture. Table 4 reports the results.
Table 4 tests whether the detector-side modification improves localization quality and false-positive control under a real-time constraint. In a tracking-by-detection system, mAP50–95 and Precision matter more than single-frame FPS alone because unstable boxes and false positives can propagate into trajectory association. Directly adding a detection head slightly increases mAP50–95 from 40.72% to 41.03%, but Recall decreases from 65.39% to 64.27%. Thus, simply increasing high-resolution prediction capacity does not provide a balanced tracking input.
Although YOLO11s has the highest FPS and the lowest computational cost, SFP-AFPN-XR is more suitable at this architecture stage because its output serves as the input to a tracking-by-detection system. In this setting, localization quality and false-positive control outweigh speed alone, provided that real-time inference is maintained. SFP-AFPN-XR improves Precision to 86.56% and mAP50–95 to 41.57% while reaching 53.56 FPS. It therefore offers a stronger accuracy-speed trade-off for subsequent tracking, without being claimed as superior in every metric.
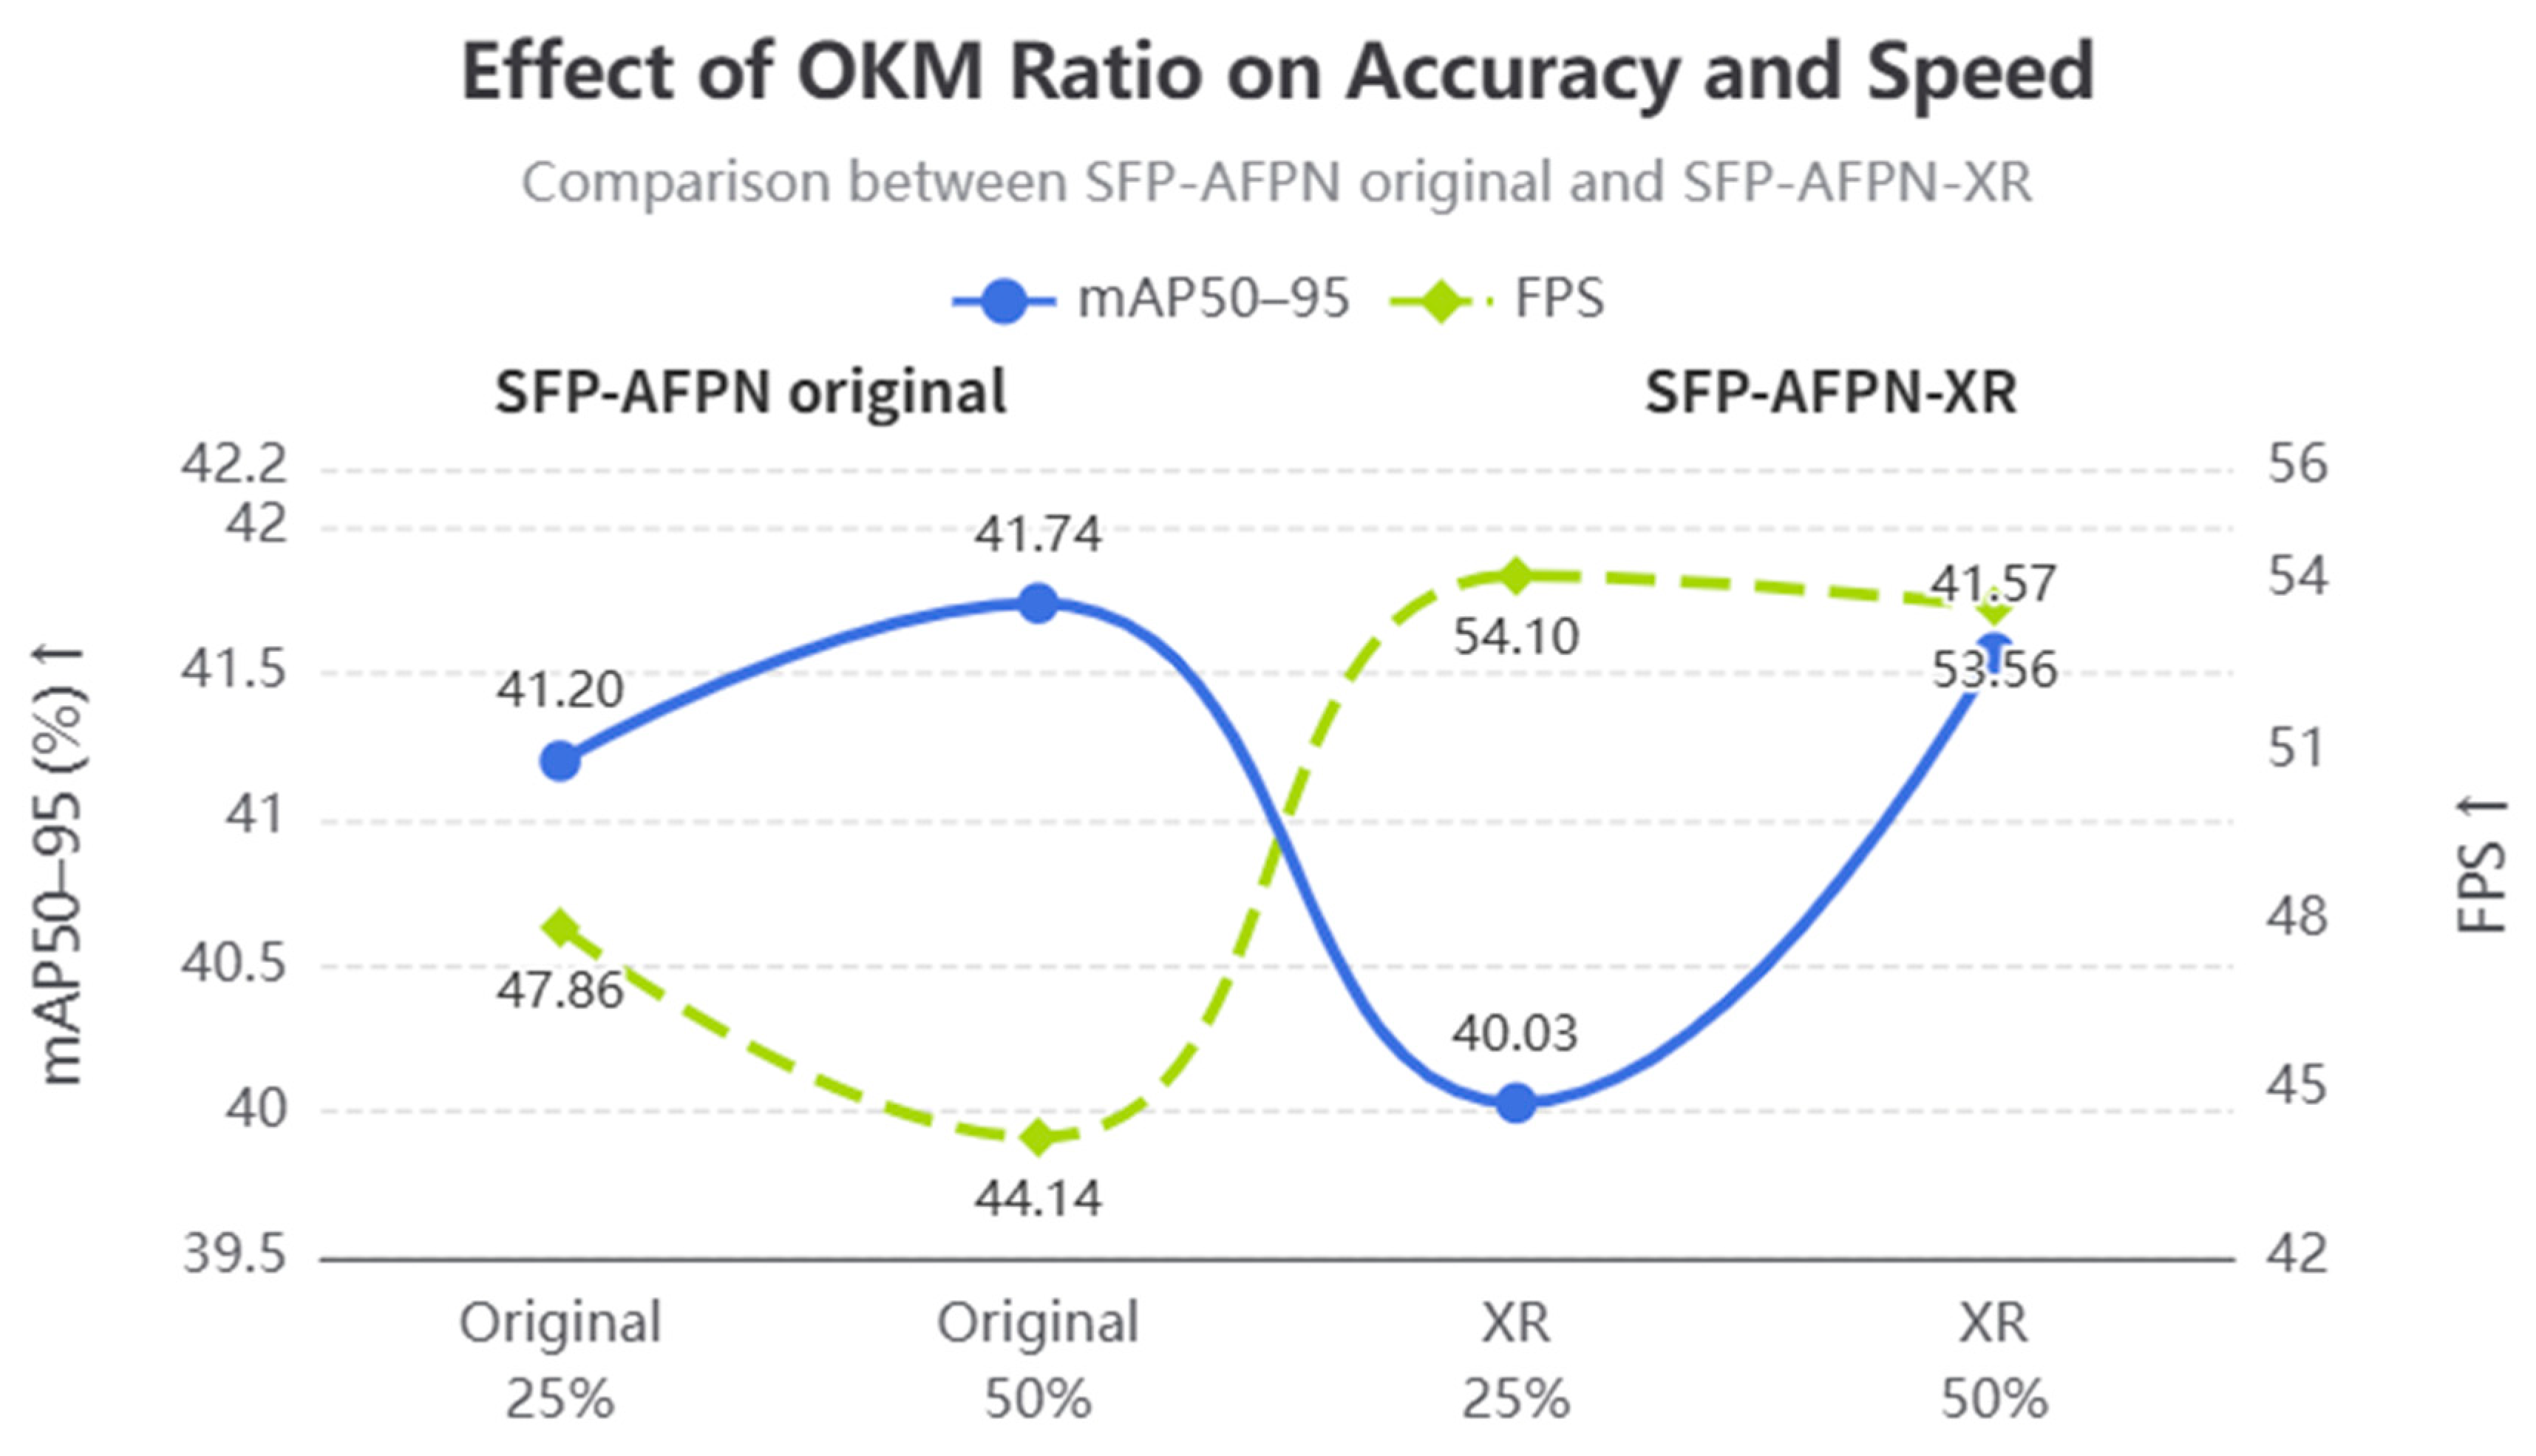
To analyze how the OKM channel ratio affects feature enhancement and inference efficiency, this study compares 25% and 50% OKM ratios under both SFP-AFPN-init and SFP-AFPN-XR. The OKM ratio denotes the proportion of channels entering the enhancement branch; the remaining channels pass through the shortcut branch. Table 5 reports the results.
Table 5 further examines the cost and benefit of the OKM enhancement-branch ratio. The key question is whether assigning more channels to the enhanced branch improves localization without making the detector unsuitable for real-time tracking input. For SFP-AFPN-init, increasing the OKM ratio from 25% to 50% improves mAP50–95 but reduces FPS from 47.86 to 44.14, showing a clear computational cost.
For SFP-AFPN-XR, increasing the OKM ratio from 25% to 50% produces a more balanced result. Precision, Recall, mAP50, and mAP50–95 all improve, while FPS remains above the real-time requirement. Therefore, the 50% ratio is adopted in FishDet-XR because it strengthens the directional enhancement branch for elongated fish targets while maintaining real-time inference speed.
To more intuitively illustrate the influence of the OKM channel ratio on detection accuracy and inference speed, the corresponding results are visualized in Figure 4.
Figure 4 confirms the same trade-off visually: a larger enhancement branch can improve localization, but the benefit depends on whether the branch design is efficient. Compared with SFP-AFPN-init, SFP-AFPN-XR obtains a better accuracy-speed balance at the 50% ratio, which supports the final configuration used in subsequent experiments.

4.2.2. Ablation Experiments on Input Resolution and Positive-Prior Sampling Strategies

After selecting the SFP-AFPN-XR architecture, this section evaluates input resolution and positive-prior sampling through key configuration comparisons. The experiments compare the original YOLO11s baseline, the effect of increasing input resolution to 768 × 768, and the effect of adding positive-prior sampling under high-resolution training. Table 6 reports the results.
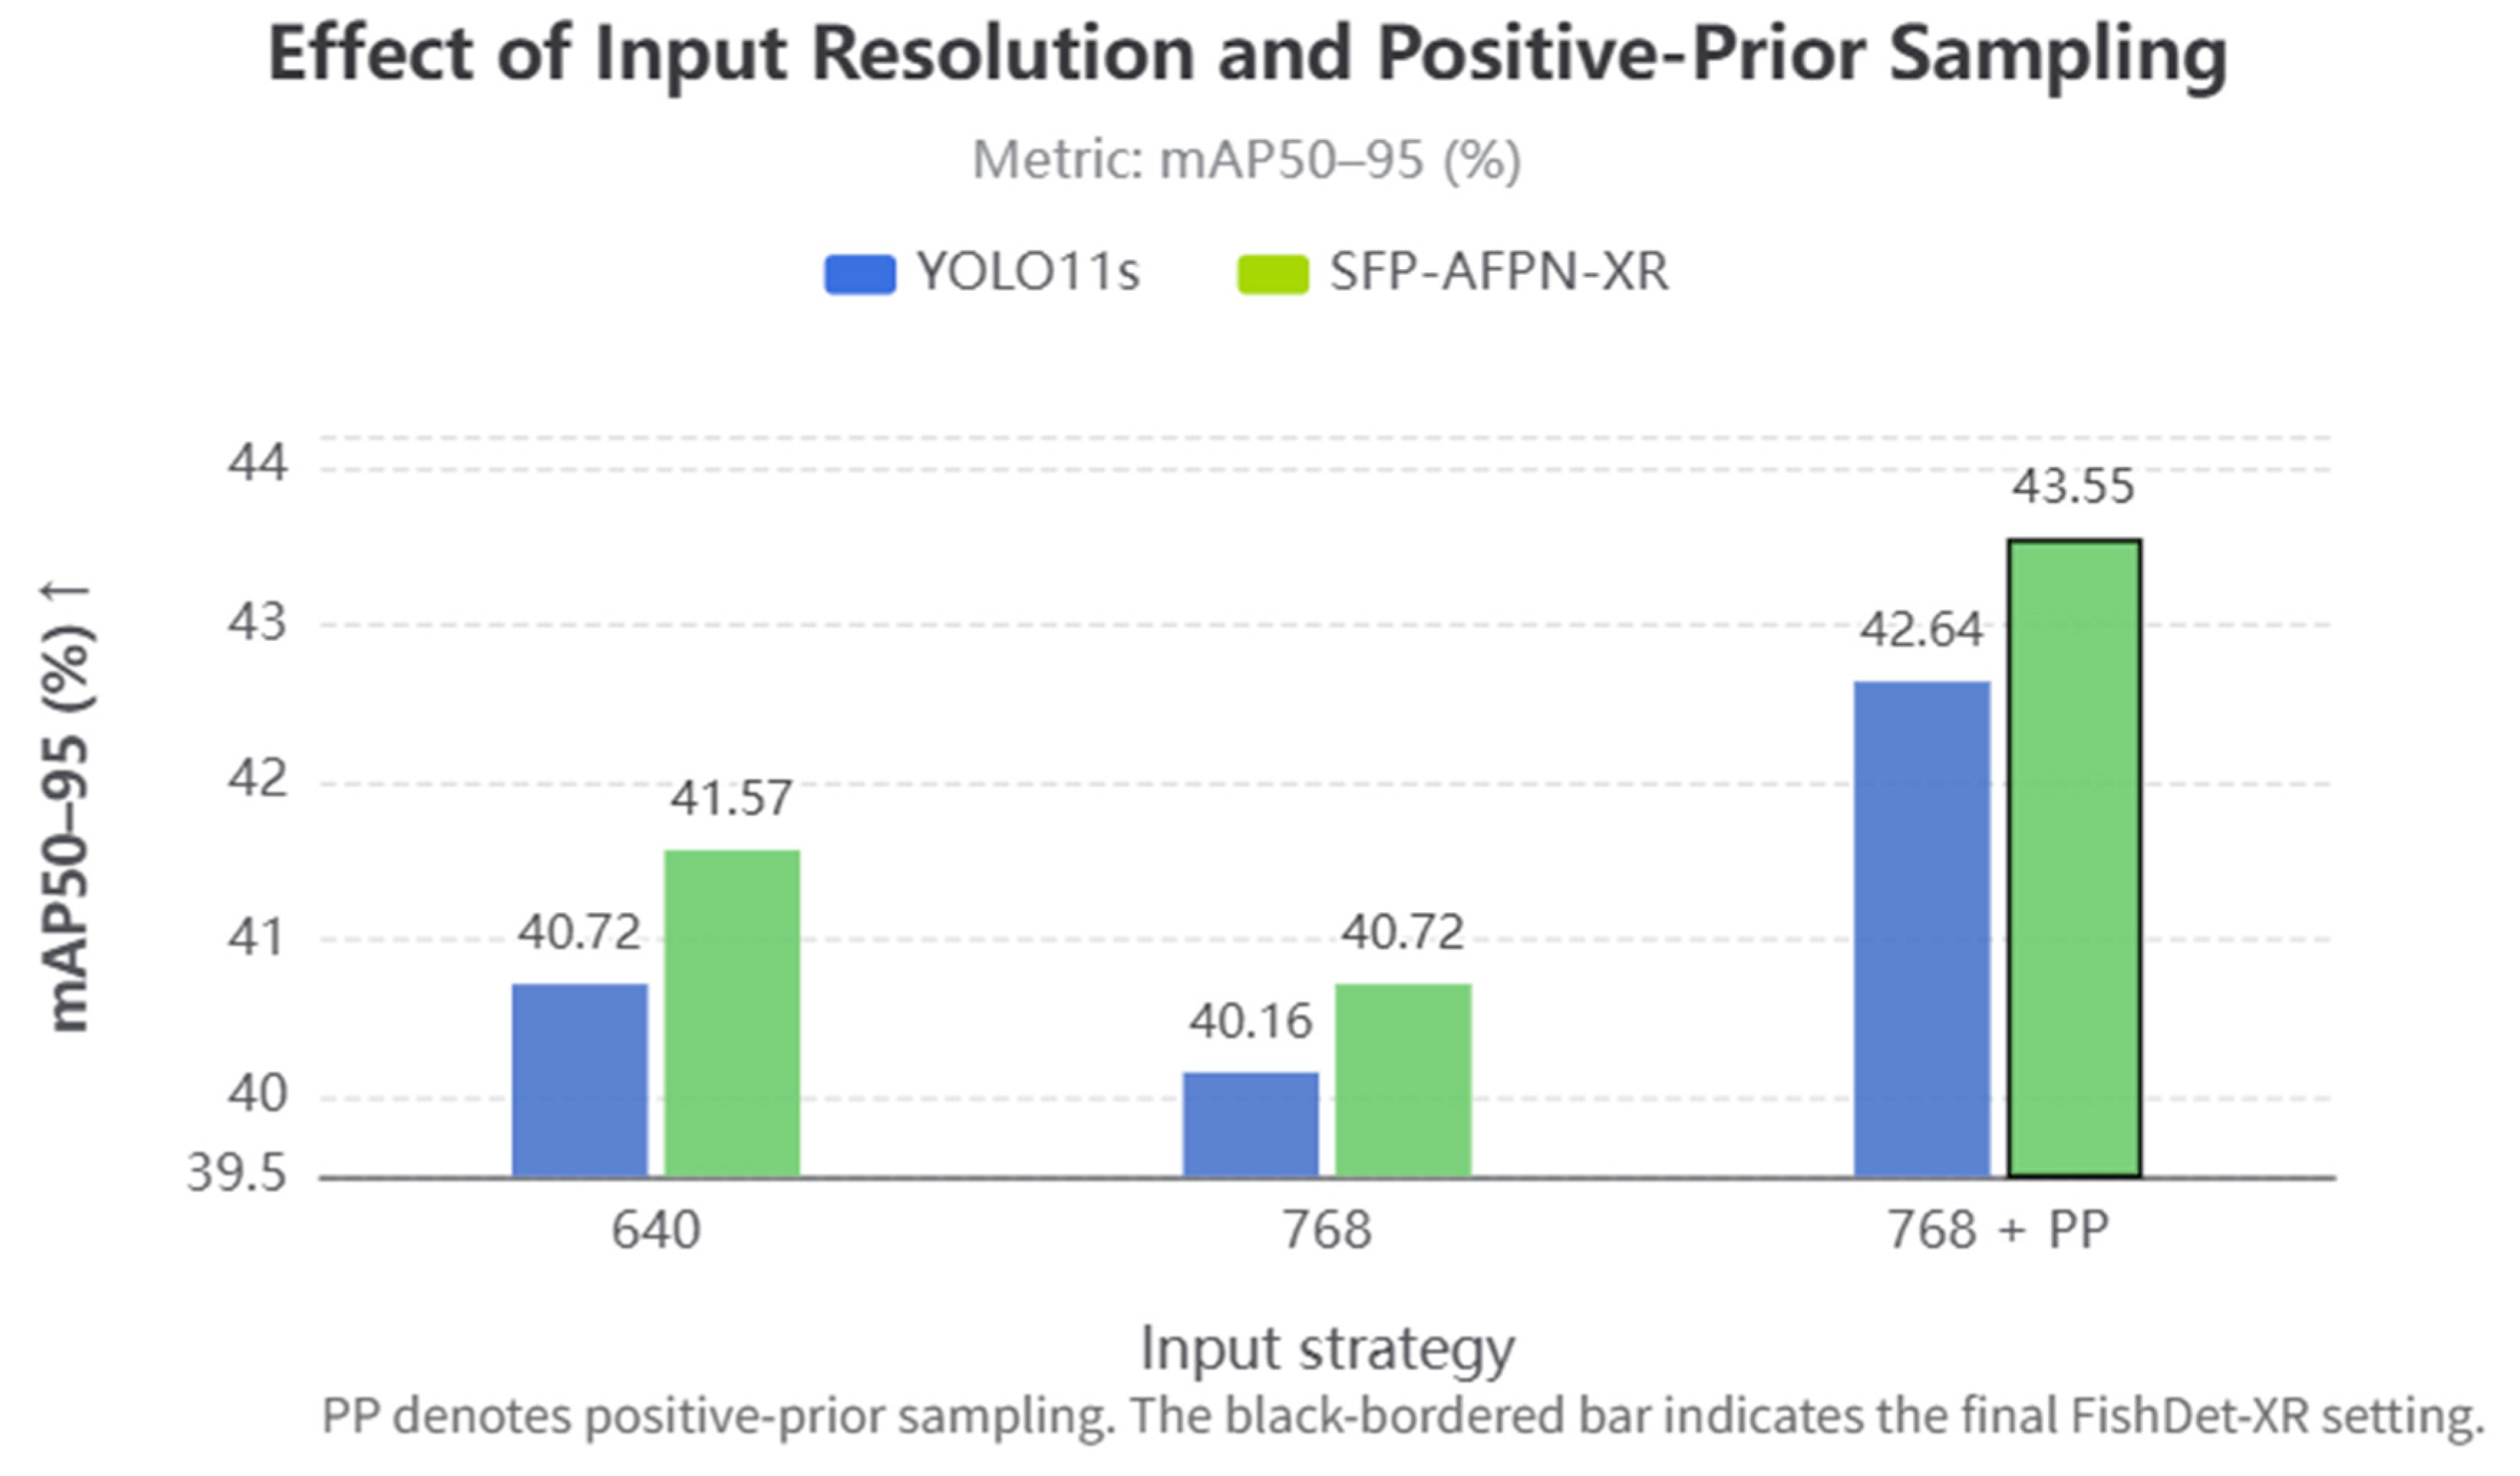
Table 6 evaluates whether higher input resolution and positive-prior sampling improve detector-input stability. Increasing input resolution alone does not consistently improve detection performance. For YOLO11s, mAP50–95 decreases from 40.72% to 40.16%; for SFP-AFPN-XR, it decreases from 41.57% to 40.72%. Higher resolution can also magnify underwater background textures, suspended particles, and false-positive regions, so resolution increase alone is insufficient.
After introducing positive-prior sampling, both YOLO11s and SFP-AFPN-XR benefit from the higher-resolution setting. For YOLO11s, mAP50 and mAP50–95 increase to 76.32% and 42.64%, respectively. For SFP-AFPN-XR, the final FishDet-XR detector reaches 76.19% mAP50 and 43.55% mAP50–95. Therefore, the gain mainly comes from the combination of high-resolution input and positive-prior sampling, not from resolution increase alone.
In terms of inference efficiency, FishDet-XR maintains 54.76 FPS. Compared with the YOLO11s-640 baseline, it improves mAP50–95 while keeping real-time performance. The cost is that the training list is rebalanced toward fish-containing frames, which may not replace all forms of imbalance handling. Nevertheless, this strategy is adopted because it does not modify the detector loss function or the YOLO optimization code, making it easy to integrate into the training pipeline.
To visualize the effects of input resolution and positive-prior sampling, the key results from Table 6 are shown in Figure 5.
Figure 5 further shows that 768 × 768 input alone should not be interpreted as the source of improvement. The final configuration is recommended because high-resolution input and positive-prior sampling work together: the former preserves more visual detail for small and medium fish, while the latter prevents the additional detail from being dominated by background-only samples.

4.2.3. Scale-Specific Detection and Visualization Analysis

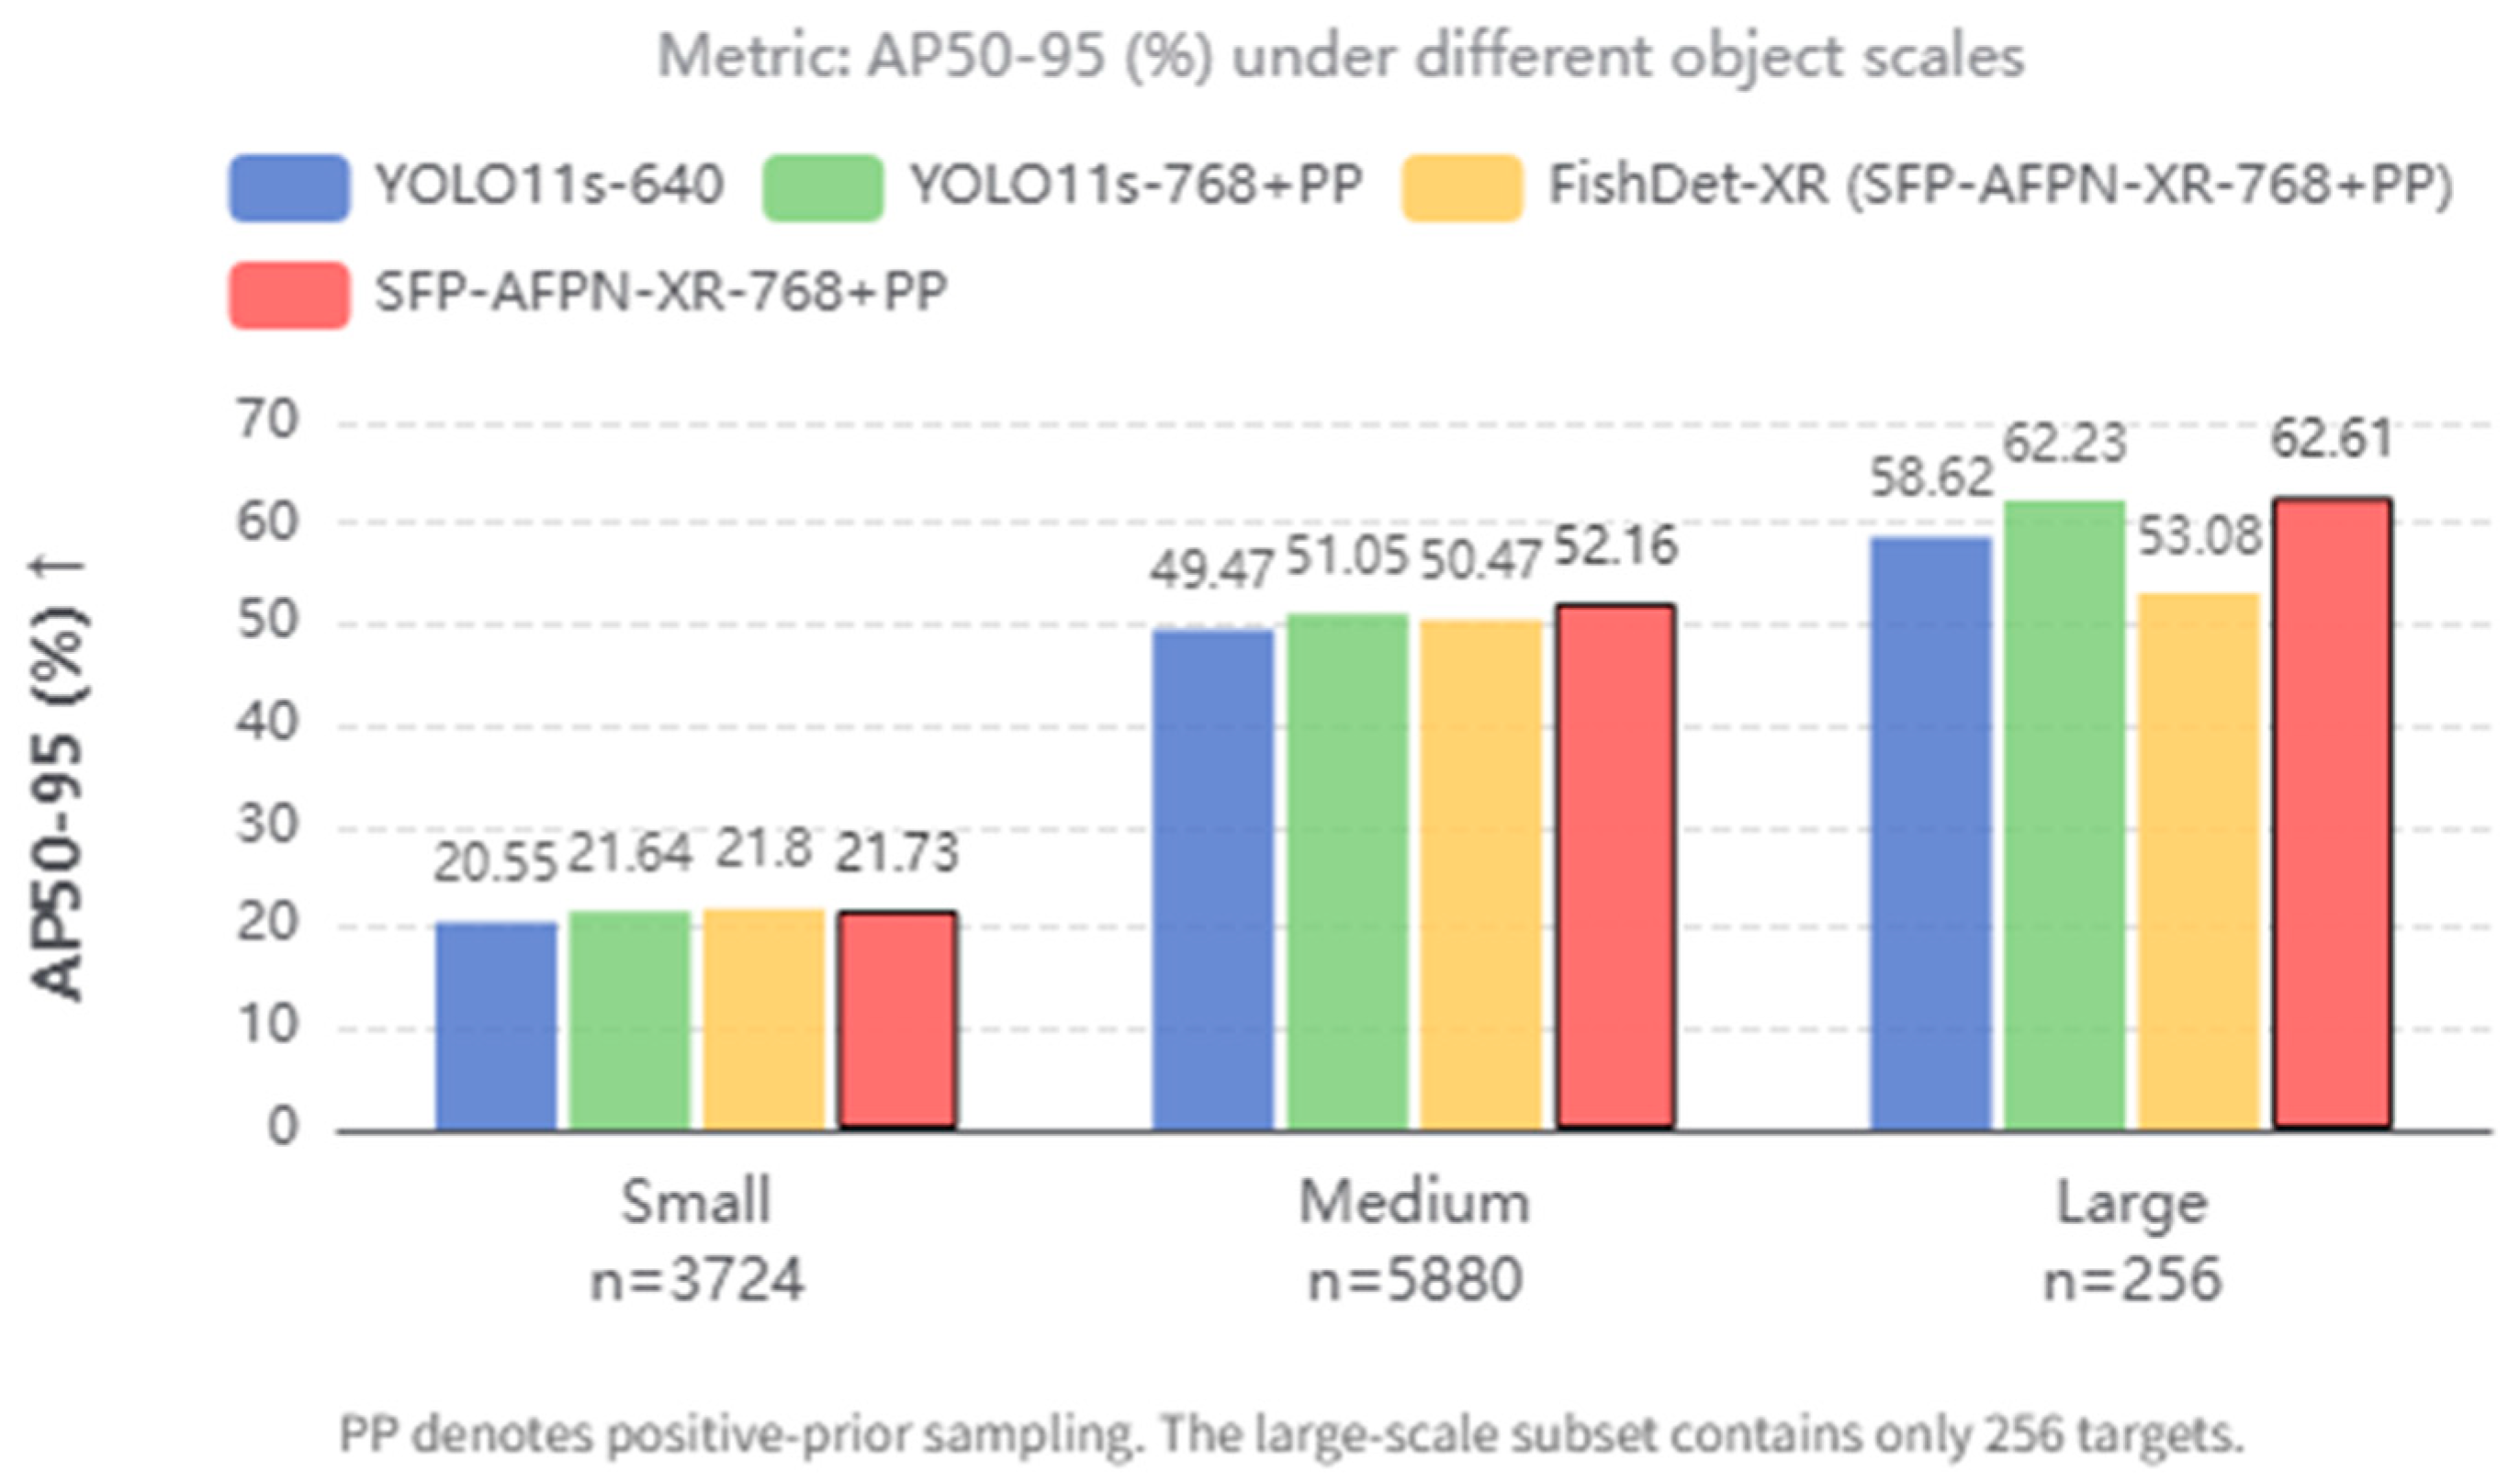
To evaluate FishDet-XR across fish scales, this section analyzes scale-specific detection performance based on bounding-box area ratios. The evaluation considers small, medium, and large targets, and Figure 6 visualizes the results.
Figure 6 evaluates the AP50–95 performance of different detectors on small-, medium-, and large-scale fish targets. On small targets, the AP50–95 values of the compared models are close, indicating that extremely small fish remain difficult for all detectors. On medium targets, which account for the largest proportion of fish instances in BrackishMOT-onlyfish, FishDet-XR achieves the highest AP50–95 of 52.16%, showing that the proposed detector provides more reliable localization for the dominant target scale. On large targets, FishDet-XR also obtains the highest AP50–95 of 62.61%, but this result should be interpreted with caution because the large-scale subset contains only 256 targets.
These scale-specific results support the use of FishDet-XR as the detector in the tracking chain. Its main value lies in providing more reliable boxes for the dominant small- and medium-scale fish targets, rather than claiming that every scale is uniformly improved. Extremely small or heavily overlapping fish targets may still require stronger temporal or multi-frame cues.
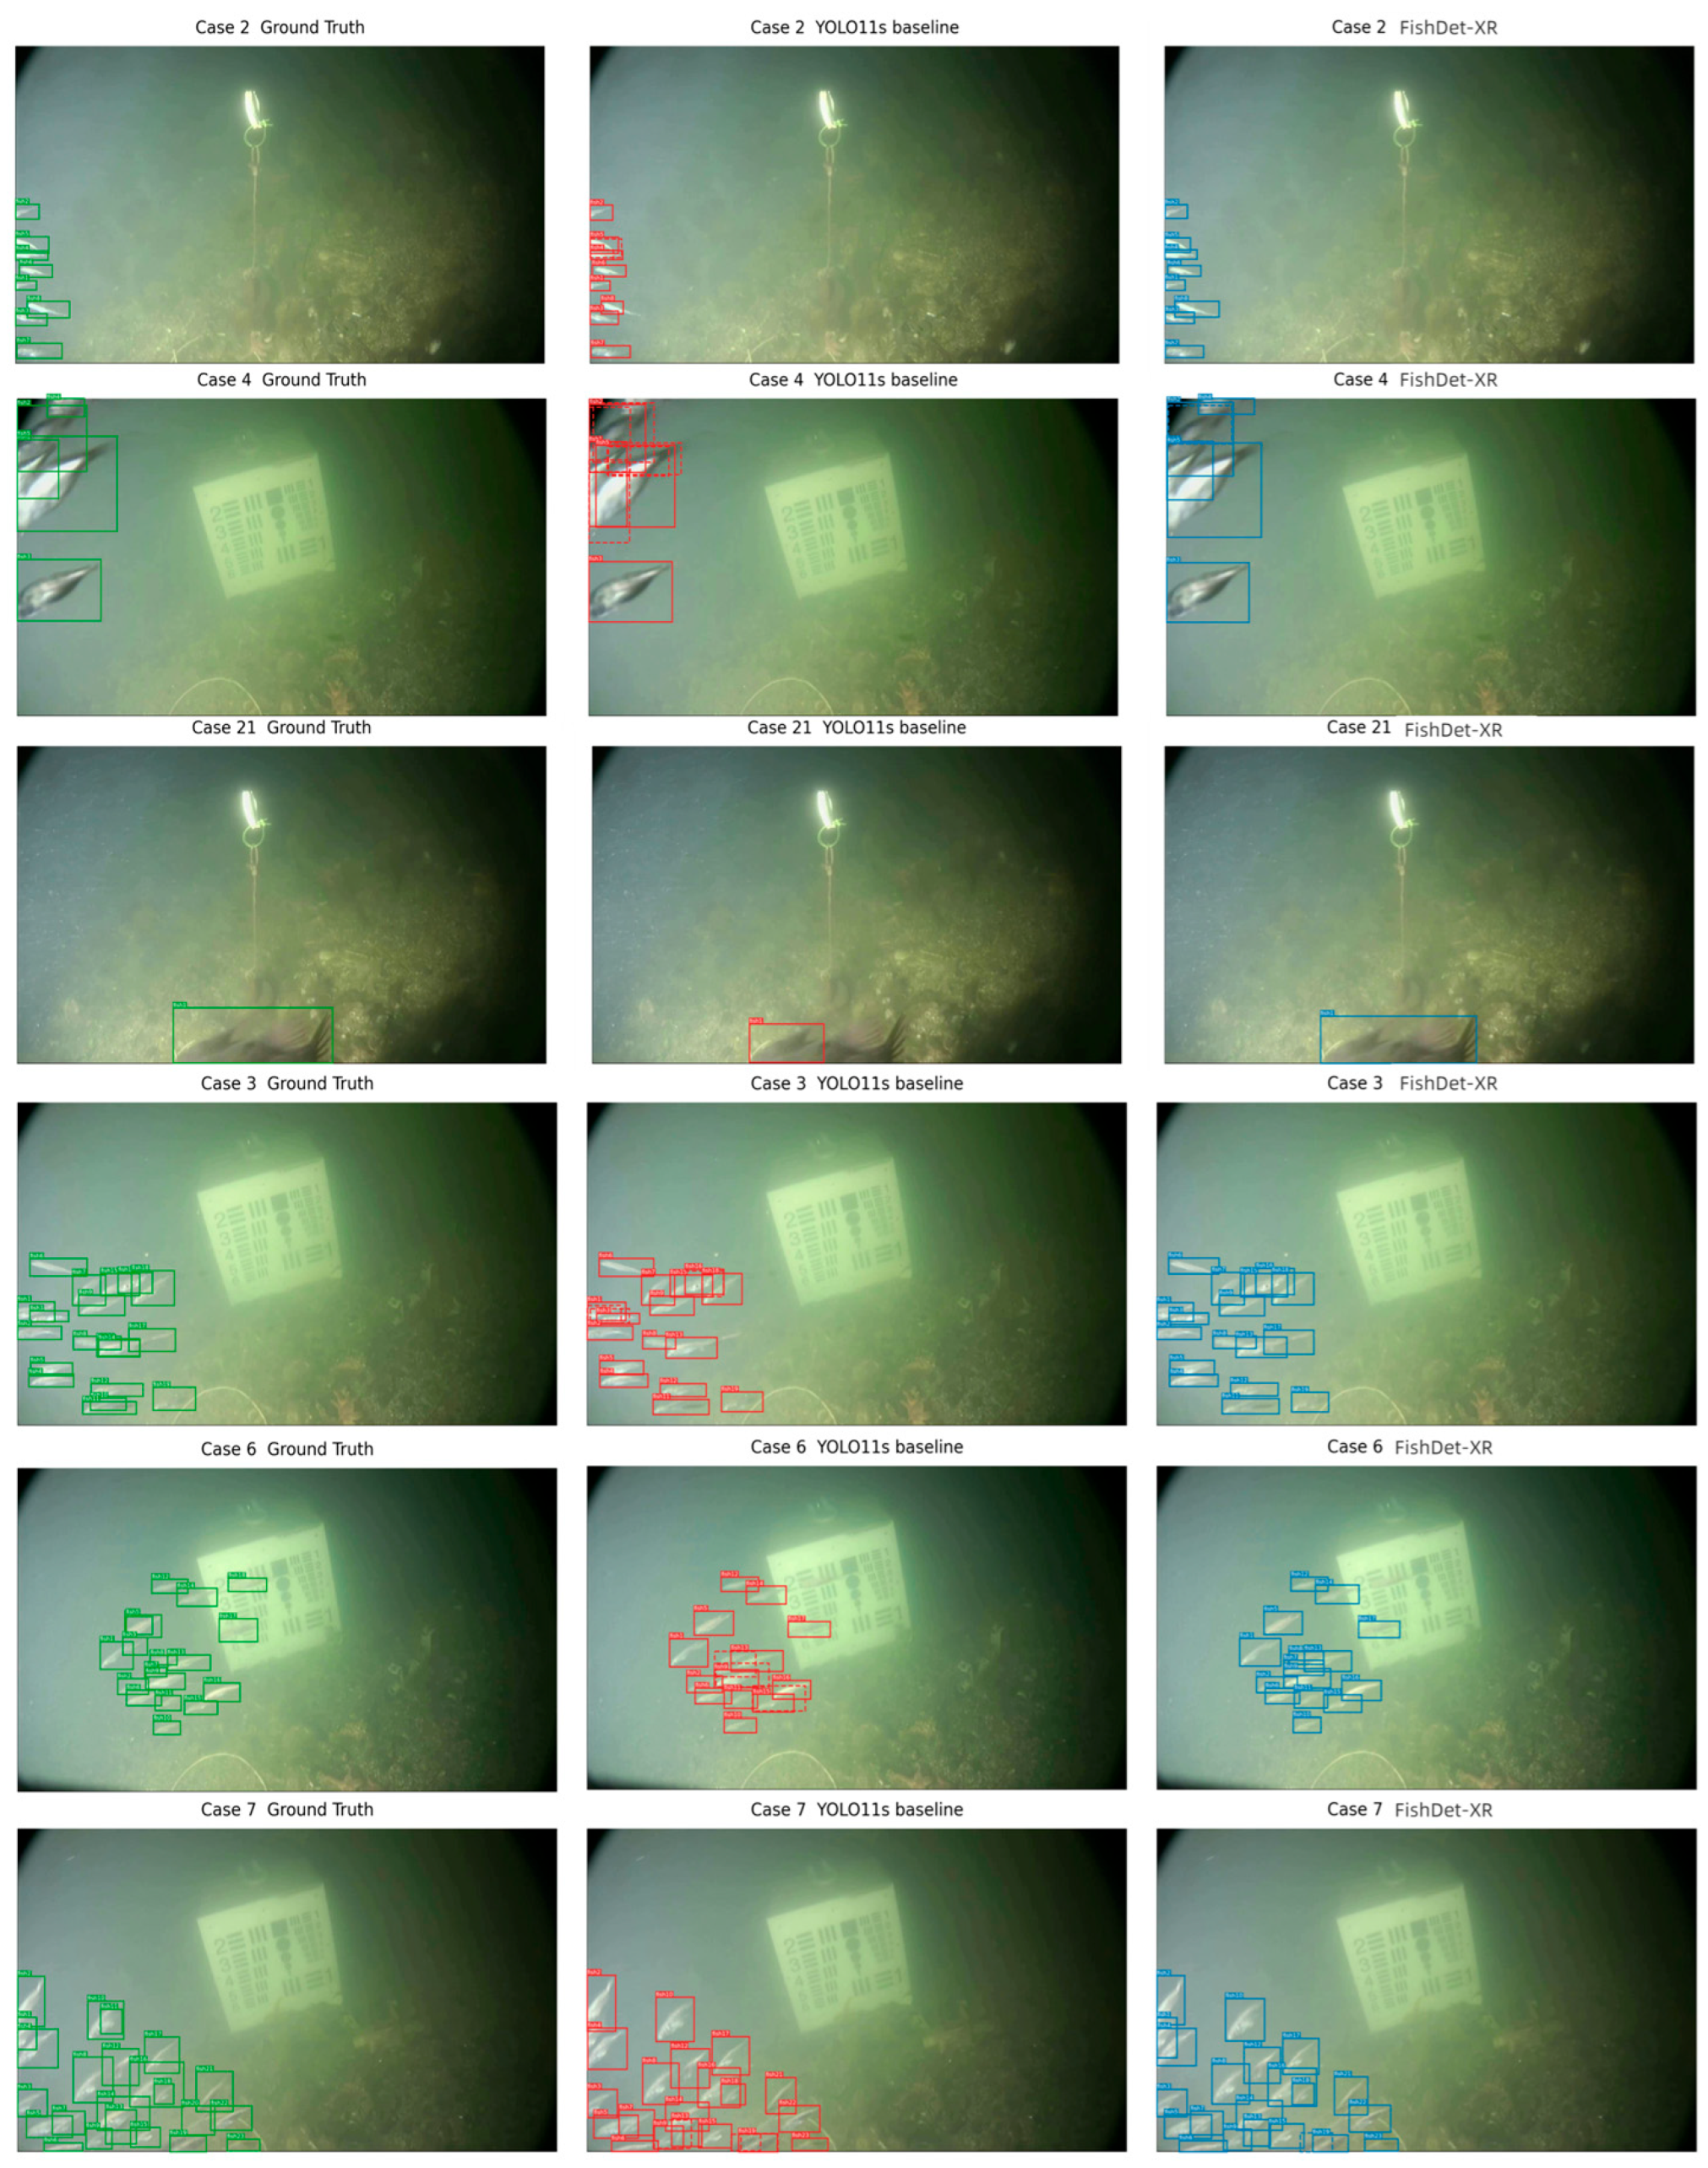
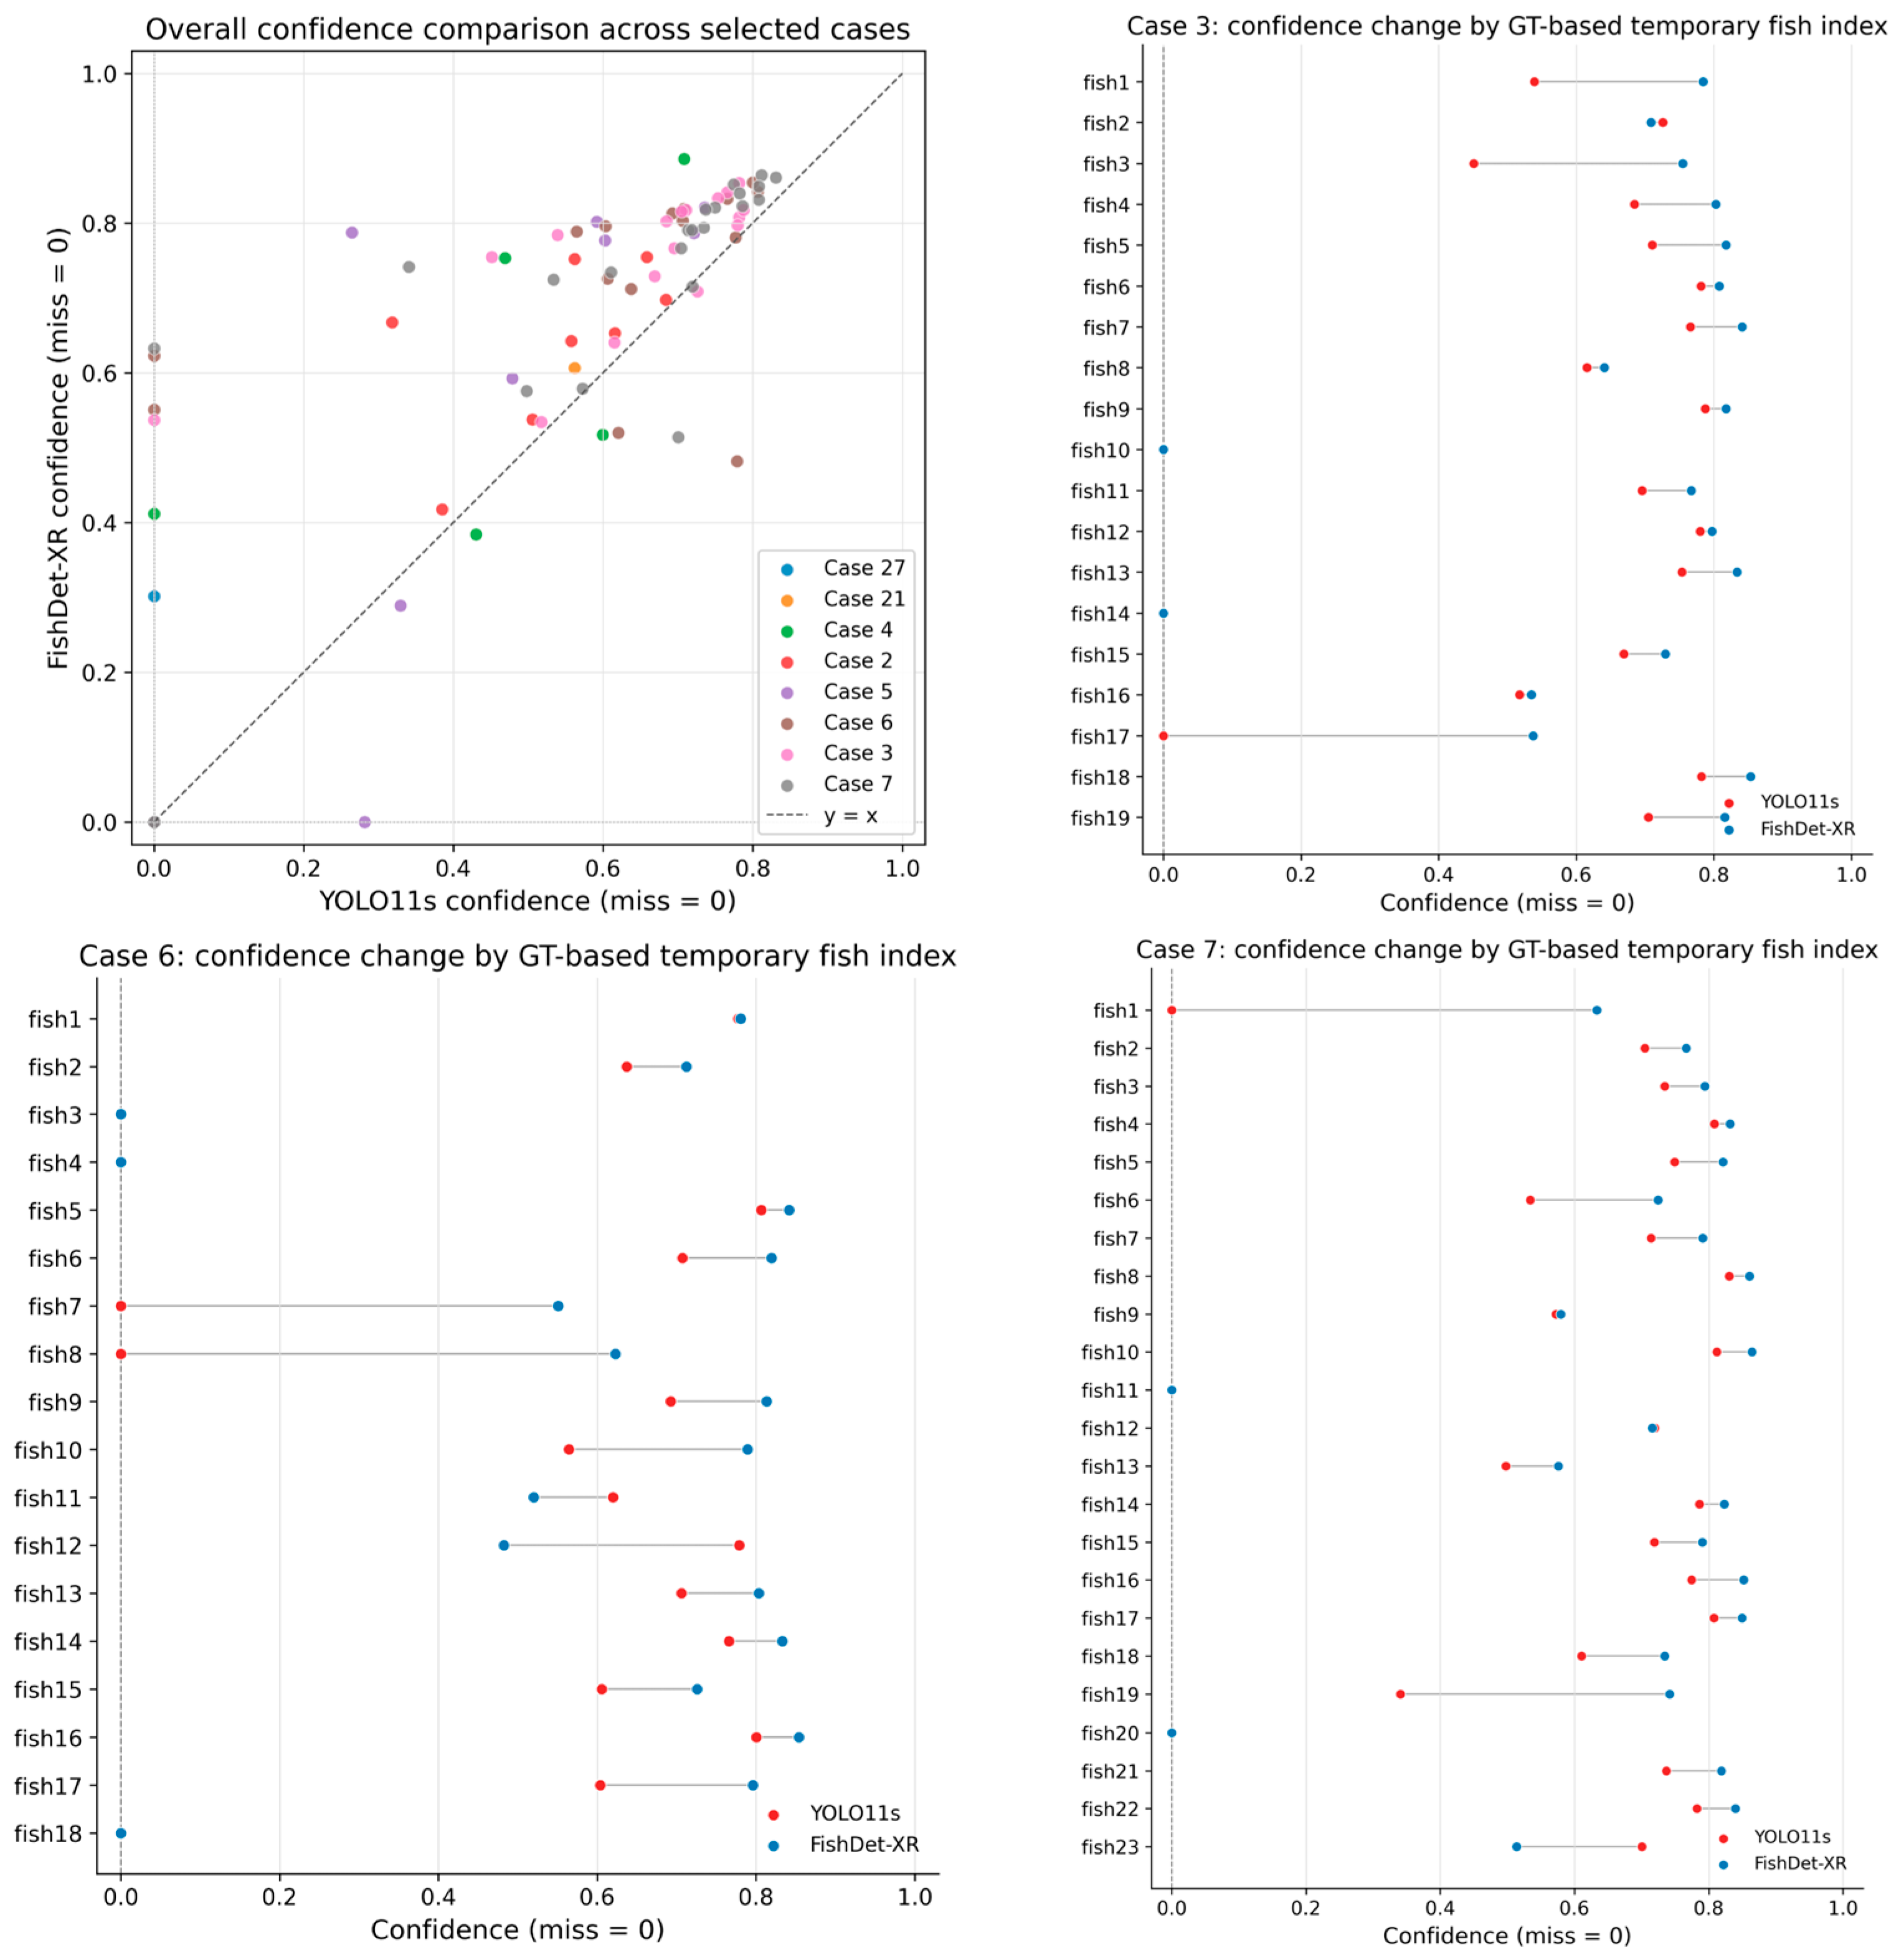
To further analyze detection confidence and visual performance, representative underwater fish detection cases are shown in Figure 7 and Figure 8.
The visualization results further support the quantitative findings. In the confidence comparison, FishDet-XR assigns higher or more stable confidence scores to many true fish targets, indicating stronger target-region responses. In scenes with dense fish and background interference, FishDet-XR produces more focused bounding boxes and fewer background responses than YOLO11s. These examples explain why the detector is used as the tracking input: more stable boxes reduce uncertainty in later association.
Overall, the detection experiments support a practical recommendation rather than an unconditional superiority claim. FishDet-XR is preferable when detector output is used for underwater fish tracking and real-time speed remains required. If the task prioritizes maximum single-frame FPS, the original YOLO11s remains attractive. If the task requires stable tracking input, FishDet-XR provides a better balance of localization, false-positive control, and speed.

4.3. Multi-Object Tracking Experimental Results and Analysis

In this section, the FishBoT-SLR-TDR tracking method is evaluated using the detection outputs of FishDet-XR. To ensure a consistent evaluation setting, the same detector outputs, tracking parameters, and evaluation protocol are used for all tracker comparisons. The experiments first select key parameters on four representative focus sequences and then report the final tracking ablation results on the BrackishMOT-onlyfish test set.

4.3.1. Selection of Tracking Baselines

To select the baseline tracking framework for the proposed tracker-side improvements, we compare three representative tracking-by-detection trackers, SORT [4], ByteTrack [5], and BoT-SORT [6], under the same FishDet-XR detector input. Table 7 reports the results.
Table 7 is used to select the tracker baseline under the fixed FishDet-XR detector input. The most important indicators are HOTA, IDF1, IDSW, and Frag because they jointly reflect detection-association quality, identity preservation, and trajectory continuity. BoT-SORT achieves the best HOTA, MOTA, and IDF1 among the compared trackers and keeps IDSW and Frag lower than SORT and ByteTrack. Although all three trackers run in real time, BoT-SORT provides the strongest association baseline for the proposed tracker-side modifications.

4.3.2. Parameter Selection Experiment

To choose reasonable FishBoT-SLR-TDR hyperparameters, we conduct a local parameter selection experiment on four representative focus sequences with dense fish motion, short-term occlusion, and local association ambiguity. This experiment is used only to select the SLR recovery IoU threshold and the TDR direction cost weight. Final tracking performance is evaluated on the full BrackishMOT-onlyfish test set in Table 10. Table 8 and Table 9 report the parameter selection results.
For the SLR module, Table 8 verifies the recovery IoU threshold used for low-confidence detections. The selected threshold balances recovery and false-positive suppression: a lower threshold may introduce uncertain boxes into existing tracks, while a higher threshold may reject useful low-confidence true detections. The threshold of 0.600 achieves the best HOTA, AssA, and IDF1 among the tested settings while keeping IDSW stable, so it is selected as a conservative recovery gate.
For the TDR module, Table 9 verifies the direction cost weight. When λ is below 0.050, the direction penalty is insufficient to change the ranking of competing candidate associations. At λ = 0.050, HOTA, AssA, and IDF1 improve while IDSW decreases from 154 to 152. Larger weights do not provide further stable gains, and λ = 0.100 reduces IDSW at the cost of HOTA and IDF1. Therefore, 0.050 is selected as the minimum effective direction-aware refinement.
Based on Table 8 and Table 9, the final FishBoT-SLR-TDR tracker uses an SLR minimum recovery IoU threshold of 0.600 and a TDR direction cost weight of 0.050. These settings are chosen because they target the two tracker-side problems separately: SLR reduces short-term track breaks caused by discarded low-confidence true detections, while TDR is activated only under local candidate-edge competition to reduce identity switching.

4.3.3. Tracking Module Ablation Experiments

To evaluate the proposed tracker-side modules, this section compares three tracking configurations under the same FishDet-XR detector input: FishDet-XR + BoT-SORT, FishDet-XR + FishBoT-SLR, and FishDet-XR + FishBoT-SLR-TDR. This experiment isolates the contributions of SLR and TDR to trajectory continuity and identity preservation under fixed detection conditions. Table 10 reports the results.
Table 10 evaluates the separate contributions of SLR and TDR under the same FishDet-XR detector input. The key metric for SLR is Frag because the module is designed to reduce short-term trajectory breaks. After introducing SLR, HOTA increases from 41.705 to 42.322, IDF1 increases from 53.955 to 54.523, and Frag decreases from 274 to 253, indicating that conservative low-score recovery can reconnect some existing tracks without creating new low-confidence trajectories.
The key metrics for TDR are AssA, IDF1, and IDSW because the module only refines local association order. After introducing TDR, AssA increases from 38.874 to 39.218, IDF1 increases from 54.523 to 54.926, and IDSW decreases from 161 to 159. This is a small association-focused gain rather than a broad change in detection quality or trajectory count. The improvement is smaller than that of SLR, which is expected because TDR does not recover additional detections; it only affects frames where local candidate-edge competition exists.
Overall, Table 10 shows that SLR and TDR are complementary rather than redundant on the full BrackishMOT-onlyfish test set. SLR is recommended when short-term low-confidence detections frequently interrupt tracks, while TDR is useful in crossing or adjacent-fish scenarios where competing candidate edges are close in cost. The cost of both modules is limited because neither requires detector retraining, an additional ReID branch, or changes to the original BoT-SORT matching thresholds.
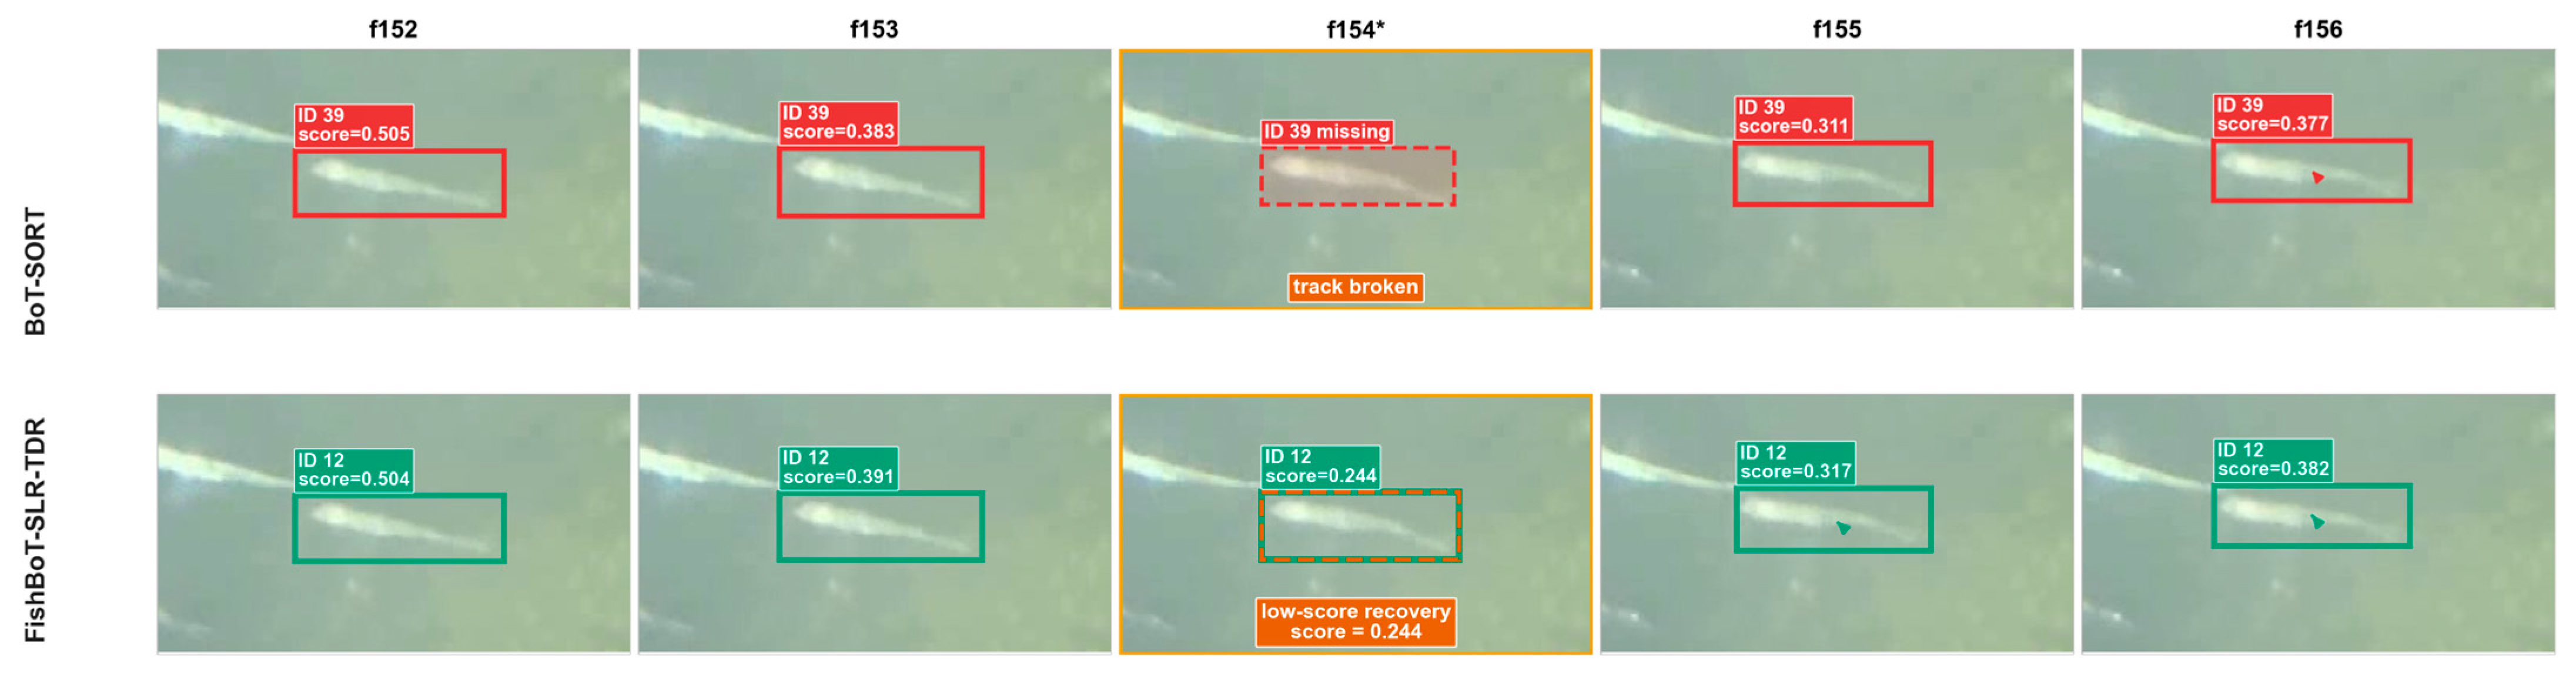
Figure 9 shows a representative low-score recovery case. In the baseline result, the target trajectory is interrupted at the highlighted frame because the true fish detection receives a low confidence score and is not used to update the existing track. With SLR, the same low-confidence detection cannot initialize a new trajectory, but it can recover an existing unmatched trajectory when it satisfies the spatial IoU gate. This example explains why SLR mainly reduces Frag in Table 10.
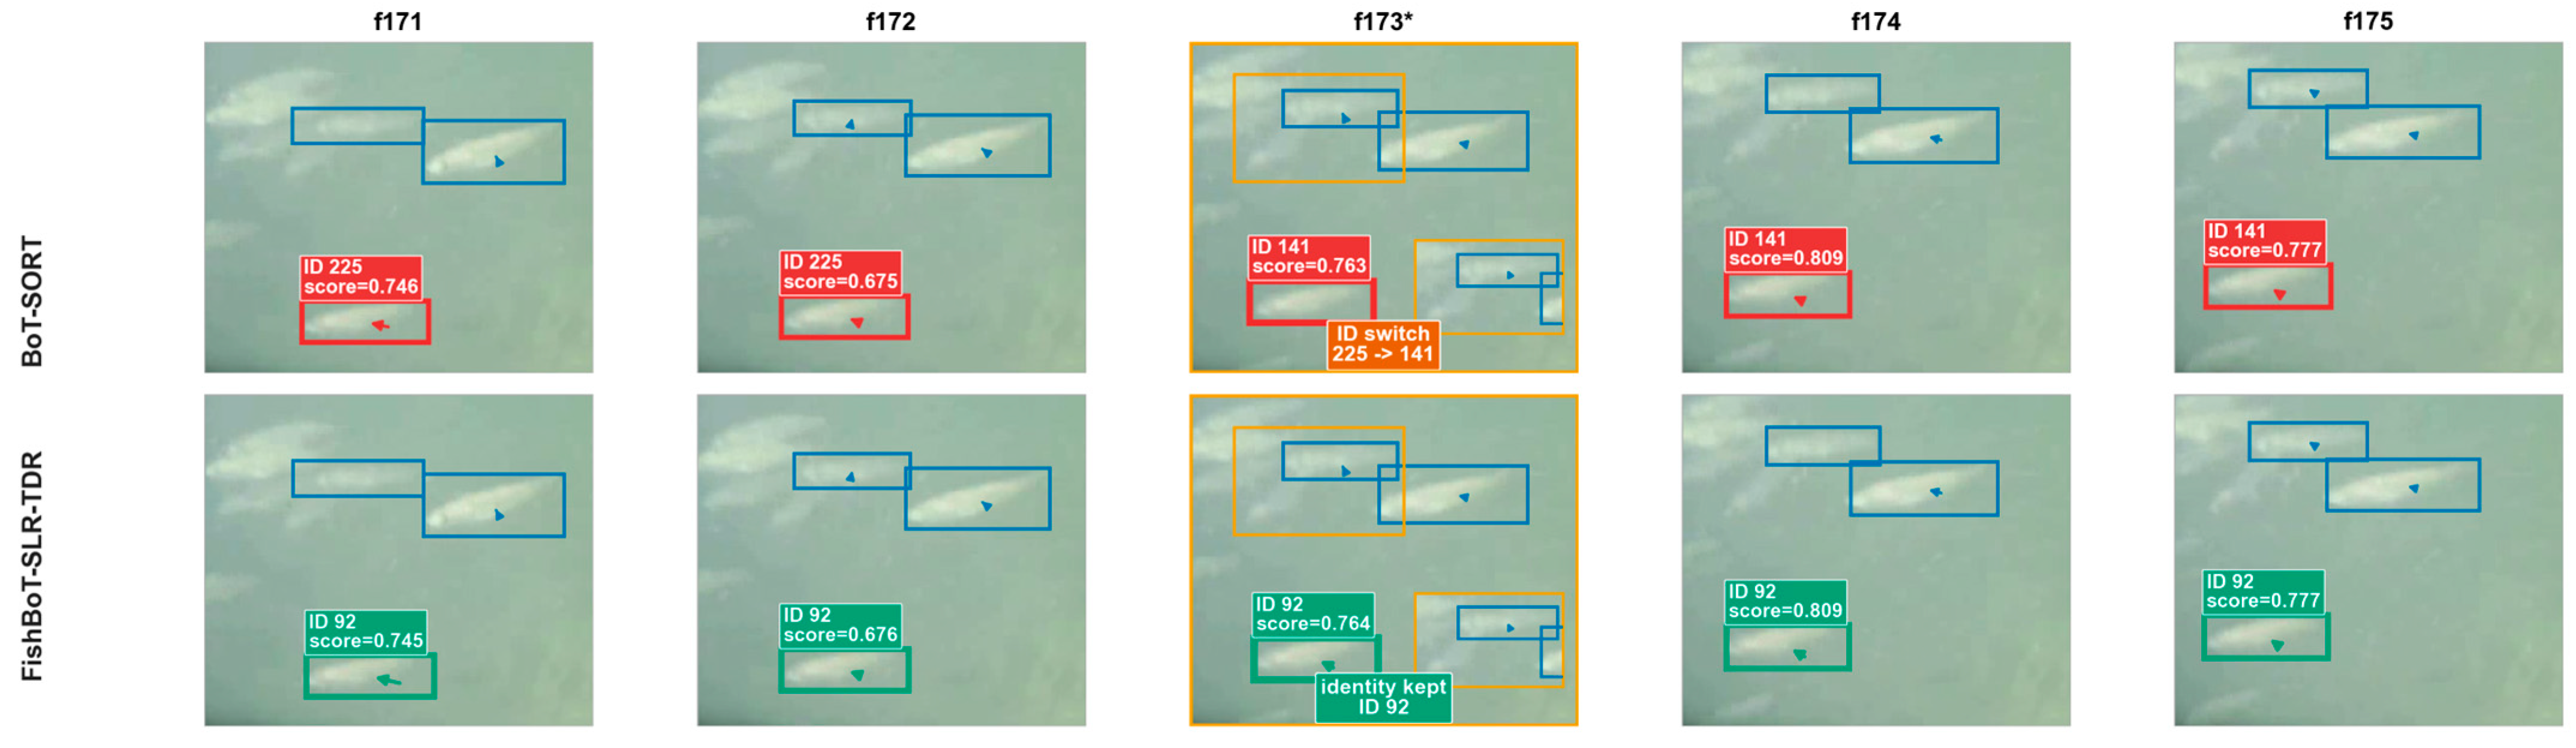
Figure 10 presents a representative local competition case. In the baseline result, two adjacent fish produce similar spatial association costs during crossing, and the target identity changes at the highlighted frame. With TDR, the candidate edge that is more consistent with the recent motion direction receives a lower adjusted association cost, so the original identity is preserved. This case supports the association-focused improvement shown in Table 10, where TDR mainly improves AssA and IDF1 and further reduces IDSW.

4.4. Overall Detection-Tracking Pipeline Results and Analysis

To evaluate the cumulative effect of detector-side and tracker-side improvements, this section compares the final FishDet-XR + FishBoT-SLR-TDR framework with the original YOLO11s-640 + BoT-SORT baseline. The results are shown in Figure 11.
Figure 11 evaluates the complete detection-tracking chain. Compared with YOLO11s-640 + BoT-SORT, FishDet-XR + FishBoT-SLR-TDR improves HOTA from 40.090 to 42.497 and IDF1 from 51.372 to 54.926, while reducing IDSW from 184 to 159 and Frag from 270 to 253. These changes indicate that the detector-side and tracker-side modifications address different failure modes in the same pipeline.
The pipeline-level result should be interpreted as a practical tracking-by-detection improvement rather than end-to-end joint training. FishDet-XR provides more stable detection inputs, SLR reduces interruptions caused by discarded low-confidence true detections, and TDR reduces identity confusion in local candidate-edge competition.

5. Discussion

5.1. Why FishDet-XR Benefits the Tracking Stage

In a tracking-by-detection framework, detector quality affects trajectory initialization, trajectory updating, and inter-frame association. Therefore, detection performance should be interpreted not only through mAP but also through the stability and reliability of the boxes provided to the tracker.
FishDet-XR benefits tracking by providing more accurate and stable bounding boxes. BoT-SORT and its variants rely strongly on the spatial relationship between predicted track boxes and detection boxes; unstable localization can enlarge association costs and increase incorrect matches. By enhancing shallow feature fusion, directional feature representation, and target-region attention, FishDet-XR provides more reliable boxes for small- and medium-scale fish targets.
FishDet-XR also improves false-positive control in underwater scenes. Suspended particles, aquatic plants, bubbles, and background textures can generate false detections that initialize spurious trajectories or become competing association candidates. Reducing these unreliable boxes is useful for tracking because it limits noise entering the association stage.
More stable confidence responses further help the tracker maintain trajectories during short-term degradation. When fish become blurred or partially occluded, confidence fluctuations can prevent existing trajectories from being updated. By combining SFP-AFPN-XR, strip-shaped convolutions, SimAM attention, and positive-prior sampling, FishDet-XR provides more stable detection confidence for true fish targets.

5.2. Why SLR Reduces Trajectory Fragmentation

SLR mainly improves tracking by addressing short-term trajectory breaks caused by low-confidence true detections. Under occlusion, motion blur, water turbidity, or background blending, real fish may still be detected with low confidence and contain useful location information [5]. If these boxes are discarded, existing trajectories can fail to update and become fragmented.
Compared with directly lowering the global detection threshold, SLR is more conservative. Low-confidence detections can recover only existing unmatched trajectories and must pass a spatial IoU gate, so their role is limited to trajectory continuation rather than new object discovery.
This mechanism is consistent with the experiments: after introducing SLR, HOTA and IDF1 increase, while Frag decreases from 274 to 253. These results indicate that SLR can bridge some short detection gaps while limiting false-track generation.

5.3. Why the Improvement of TDR Is Limited but Meaningful

Compared with SLR, TDR produces a smaller gain because it targets a narrower association problem: local ambiguity among adjacent fish moving in parallel, crossing, or temporarily overlapping.
In these scenes, several candidate associations may have similar spatial costs. TDR introduces short-term motion-direction consistency into local edge ranking, which can reduce matches that contradict a trajectory’s recent motion trend.
The experimental effect is therefore mainly association-focused. Under the same detection input, TDR slightly improves AssA and IDF1 and further reduces IDSW, indicating better assignment quality among existing candidate matches.
Although the numerical gain is moderate, it is meaningful because identity switches usually occur in specific local scenarios rather than every frame. TDR is activated only under local ambiguous matching conditions, so its global metric effect is naturally limited.

5.4. Overall Interpretation

Overall, FishDet-XR, SLR, and TDR contribute to the underwater fish detection-tracking chain in complementary ways. FishDet-XR improves detection inputs by enhancing target feature representation, suppressing false positives, and stabilizing confidence responses. SLR improves trajectory continuity by recovering low-confidence true detections under strict spatial constraints. TDR improves identity preservation by reordering locally competing candidate associations according to short-term motion-direction consistency.
These results show that detection accuracy alone is insufficient for underwater fish multi-object tracking. In the evaluated setting, detection-output reliability and tracker-side association refinement are both important for continuous fish observation, although broader validation on additional datasets and deployment scenarios is still needed.

5.5. Limitations and Future Work

First, TDR relies on short-term motion consistency. It is activated only for mature tracks with sufficient motion magnitude and local mutual competition, and the direction cost is disabled when the target is nearly stationary or the motion estimate is unreliable. However, for rapid non-linear motion or sudden turning after occlusion, the short-term direction prior may still be unreliable. This is a limitation of the current tracker-side heuristic and motivates future work on temporal motion modeling.
Second, weighted loss is a possible alternative to positive-prior sampling. This study adopts list-level positive-prior sampling because it does not modify the loss function or detector optimization code, making it easy to integrate into the YOLO training pipeline. Comparing positive-prior sampling with weighted loss will be considered in future work.
Third, FishTrack23 is not used for validation in this study because the current experiments focus on a controlled only-fish adaptation of BrackishMOT with MOT-format annotations and consistent train/test splits. Cross-dataset validation on FishTrack23 will be considered in future work, but FishTrack23 is not used here to support the experimental conclusions.
Fourth, all reported results are obtained from a single run under a fixed seed and fixed train/test split. Although this setting ensures consistent comparison among model variants, it does not provide standard deviations across multiple random initializations. Future work will include multi-seed experiments to further evaluate the statistical robustness of the proposed framework.

6. Conclusions

This study focuses on underwater fish tracking-by-detection and addresses three problems: unstable detection inputs for small- and medium-scale elongated fish, short-term track fragmentation caused by discarded low-confidence true detections, and identity switches caused by local candidate-edge competition. To address these problems, we proposed the FishDet-XR detector and the FishBoT-SLR-TDR tracker-side recovery-reranking strategy.
First, for unstable detection inputs, FishDet-XR improves the stability of fish bounding boxes by combining SFP-AFPN-XR, strip-shaped directional feature modeling, SimAM attention, 768 × 768 input resolution, and positive-prior sampling. The detection experiments show that FishDet-XR improves localization quality and false-positive control while maintaining real-time inference, making it more suitable as tracking input than optimizing single-frame speed alone.
Second, for short-term trajectory fragmentation, SLR uses spatially gated low-score recovery to recover low-confidence true detections only for existing unmatched tracks. Because low-confidence detections are not allowed to initialize new trajectories, SLR reduces track fragmentation while limiting the risk of false-track generation.
Third, for identity switches caused by local candidate-edge competition, TDR reranks ambiguous association candidates using short-term motion-direction consistency. The module is applied only under mature-track, valid-motion, and local mutual-competition conditions, allowing it to improve identity preservation in crossing or adjacent-fish scenarios without changing the original BoT-SORT matching thresholds.
Finally, on the BrackishMOT-onlyfish test set, the complete FishDet-XR + FishBoT-SLR-TDR pipeline improves HOTA from 40.090 to 42.497 and IDF1 from 51.372 to 54.926 compared with the YOLO11s-640 + BoT-SORT baseline, while reducing IDSW from 184 to 159 and Frag from 270 to 253. These results indicate that stable detector inputs, conservative low-score recovery, and direction-aware local reranking are complementary for underwater fish multi-object tracking. Future work will further evaluate cross-dataset generalization and stronger temporal motion modeling.

Author Contributions

Conceptualization, X.T. and L.Y.; methodology, X.T.; software, X.T.; validation, X.T., K.L., and S.Z.; formal analysis, X.T. and K.L.; investigation, X.T. and S.Z.; resources, L.Y., K.L. and S.Z.; data curation, X.T.; writing—original draft preparation, X.T.; writing—review and editing, X.T., L.Y., K.L., and S.Z.; visualization, X.T.; supervision, L.Y.; project administration, L.Y. and K.L. All authors have read and agreed to the published version of the manuscript.

Funding

This research was funded by the National Natural Science Foundation of China, grant number 52471331, and the National Key Research and Development Program of China, grant number 2021YFC2801600.

Data Availability Statement

The original BrackishMOT dataset used in this study is publicly available from the official BrackishMOT website and the Kaggle repository under DOI: 10.34740/kaggle/ds/2695511. The processed fish-only annotations and experimental scripts generated during this study can be made available from the corresponding author upon reasonable request.

Conflicts of Interest

The authors declare no conflicts of interest.

References

  1. Pedersen, M.; Lehotský, D.; Nikolov, I.; Moeslund, T.B. BrackishMOT: The Brackish Multi-Object Tracking Dataset. In Image Analysis, Proceedings of the Scandinavian Conference on Image Analysis; Lecture Notes in Computer Science; Springer: Cham, Switzerland, 2023; pp. 17–33. [Google Scholar] [CrossRef] [Scilit]
  2. Dawkins, M.; Prior, J.; Lewis, B.; Faillettaz, R.; Banez, T.; Salvi, M.; Rollo, A.; Simon, J.; Campbell, M.; Lucero, M.; et al. FishTrack23: An Ensemble Underwater Dataset for Multi-Object Tracking. In Proceedings of the IEEE/CVF Winter Conference on Applications of Computer Vision (WACV), Waikoloa, HI, USA, 3–8 January 2024; pp. 7167–7176. [Google Scholar] [CrossRef] [Scilit]
  3. Vijayalakshmi, M.; Sasithradevi, A. AquaYOLO: Advanced YOLO-Based Fish Detection for Optimized Aquaculture Pond Monitoring. Sci. Rep. 2025, 15, 6151. [Google Scholar] [CrossRef] [Scilit]
  4. Bewley, A.; Ge, Z.; Ott, L.; Ramos, F.; Upcroft, B. Simple Online and Realtime Tracking. In Proceedings of the 2016 IEEE International Conference on Image Processing (ICIP), Phoenix, AZ, USA, 25–28 September 2016; pp. 3464–3468. [Google Scholar] [CrossRef] [Scilit]
  5. Zhang, Y.; Sun, P.; Jiang, Y.; Yu, D.; Weng, F.; Yuan, Z.; Luo, P.; Liu, W.; Wang, X. ByteTrack: Multi-Object Tracking by Associating Every Detection Box. In Computer Vision-ECCV 2022, Lecture Notes in Computer Science; Springer: Cham, Switzerland, 2022; Volume 13682, pp. 1–21. [Google Scholar] [CrossRef] [Scilit]
  6. Aharon, N.; Orfaig, R.; Bobrovsky, B.-Z. BoT-SORT: Robust Associations Multi-Pedestrian Tracking. arXiv 2022, arXiv:2206.14651. [Google Scholar]
  7. Chen, L.; Huang, Y.; Dong, J.; Xu, Q.; Kwong, S.; Lu, H.; Lu, H.; Li, C. Underwater Optical Object Detection in the Era of Artificial Intelligence: Current, Challenge, and Future. ACM Comput. Surv. 2026, 58, 62. [Google Scholar] [CrossRef] [Scilit]
  8. Khanam, R.; Hussain, M. YOLOv11: An Overview of the Key Architectural Enhancements. arXiv 2024, arXiv:2410.17725. [Google Scholar]
  9. Yang, L.; Zhang, R.-Y.; Li, L.; Xie, X. SimAM: A Simple, Parameter-Free Attention Module for Convolutional Neural Networks. In Proceedings of the 38th International Conference on Machine Learning; PMLR: Cambridge, MA, USA, 2021; Volume 139, pp. 11863–11874. [Google Scholar]
  10. Ren, S.; He, K.; Girshick, R.; Sun, J. Faster R-CNN: Towards Real-Time Object Detection with Region Proposal Networks. In Advances in Neural Information Processing Systems; Neural Information Processing Systems Foundation: La Jolla, CA, USA, 2015; pp. 91–99. [Google Scholar]
  11. He, K.; Gkioxari, G.; Dollár, P.; Girshick, R. Mask R-CNN. In Proceedings of the IEEE International Conference on Computer Vision (ICCV), Venice, Italy, 22–29 October 2017; pp. 2961–2969. [Google Scholar] [CrossRef] [Scilit]
  12. Redmon, J.; Divvala, S.; Girshick, R.; Farhadi, A. You Only Look Once: Unified, Real-Time Object Detection. In Proceedings of the IEEE Conference on Computer Vision and Pattern Recognition (CVPR), Las Vegas, NV, USA, 27–30 June 2016; pp. 779–788. [Google Scholar] [CrossRef] [Scilit]
  13. Liu, M.; Wu, Y.; Li, R.; Lin, C. LFN-YOLO: Precision Underwater Small Object Detection via a Lightweight Reparameterized Approach. Front. Mar. Sci. 2025, 11, 1513740. [Google Scholar] [CrossRef] [Scilit]
  14. Xi, Y.; Yin, J. UOD-YOLO: A Lightweight Real-Time Model for Detecting Marine Organisms. Front. Mar. Sci. 2025, 12, 1728563. [Google Scholar] [CrossRef] [Scilit]
  15. Chen, J.; Er, M.J. Dynamic YOLO for Small Underwater Object Detection. Artif. Intell. Rev. 2024, 57, 165. [Google Scholar] [CrossRef] [Scilit]
  16. Luo, Y.; Wu, A.; Fu, Q. MAS-YOLOv11: An Improved Underwater Object Detection Algorithm Based on YOLOv11. Sensors 2025, 25, 3433. [Google Scholar] [CrossRef] [Scilit]
  17. Jing, Y.; Ding, Y.; Wang, X.; Khairuddin, A.S.M. An Improved YOLOv11 Network for Marine Debris Detection in Underwater Environment. Sci. Rep. 2026, 16, 7074. [Google Scholar] [CrossRef] [Scilit]
  18. Wang, Q.; Liu, Z. FEFM-YOLO11: Underwater Object Detection Algorithm Based on Improved YOLO11. Neural Process. Lett. 2025, 57, 82. [Google Scholar] [CrossRef] [Scilit]
  19. Lin, T.-Y.; Dollár, P.; Girshick, R.; He, K.; Hariharan, B.; Belongie, S. Feature Pyramid Networks for Object Detection. In Proceedings of the IEEE Conference on Computer Vision and Pattern Recognition (CVPR), Honolulu, HI, USA, 21–26 July 2017; pp. 936–944. [Google Scholar] [CrossRef] [Scilit]
  20. Liu, S.; Qi, L.; Qin, H.; Shi, J.; Jia, J. Path Aggregation Network for Instance Segmentation. In Proceedings of the IEEE Conference on Computer Vision and Pattern Recognition (CVPR), Salt Lake City, UT, USA, 18–22 June 2018; pp. 8759–8768. [Google Scholar] [CrossRef] [Scilit]
  21. Tan, M.; Pang, R.; Le, Q.V. EfficientDet: Scalable and Efficient Object Detection. In Proceedings of the IEEE/CVF Conference on Computer Vision and Pattern Recognition (CVPR), Seattle, WA, USA, 13–19 June 2020; pp. 10781–10790. [Google Scholar] [CrossRef] [Scilit]
  22. Yang, G.; Lei, J.; Zhu, Z.; Cheng, S.; Feng, Z.; Liang, R. AFPN: Asymptotic Feature Pyramid Network for Object Detection. In Proceedings of the 2023 IEEE International Conference on Systems, Man, and Cybernetics (SMC), Honolulu, HI, USA, 1–4 October 2023; pp. 2184–2189. [Google Scholar] [CrossRef] [Scilit]
  23. Qian, J.; Chen, M. WDS-YOLO: A Marine Benthos Detection Model Fusing Wavelet Convolution and Deformable Attention. Appl. Sci. 2025, 15, 3537. [Google Scholar] [CrossRef] [Scilit]
  24. Wojke, N.; Bewley, A.; Paulus, D. Simple Online and Realtime Tracking with a Deep Association Metric. In Proceedings of the 2017 IEEE International Conference on Image Processing (ICIP), Beijing, China, 17–20 September 2017; pp. 3645–3649. [Google Scholar] [CrossRef] [Scilit]
  25. Liu, S.; Zhang, J.; Zheng, H.; Qian, C.; Liu, S. An Improved DeepSORT-Based Model for Multi-Target Tracking of Underwater Fish. J. Mar. Sci. Eng. 2025, 13, 1256. [Google Scholar] [CrossRef] [Scilit]
  26. Luiten, J.; Osep, A.; Dendorfer, P.; Torr, P.; Geiger, A.; Leal-Taixé, L.; Leibe, B. HOTA: A Higher Order Metric for Evaluating Multi-Object Tracking. Int. J. Comput. Vis. 2021, 129, 548–578. [Google Scholar] [CrossRef] [Scilit] [PubMed]
  27. Bernardin, K.; Stiefelhagen, R. Evaluating Multiple Object Tracking Performance: The CLEAR MOT Metrics. EURASIP J. Image Video Process. 2008, 2008, 246309. [Google Scholar] [CrossRef] [Scilit]
  28. Ristani, E.; Solera, F.; Zou, R.; Cucchiara, R.; Tomasi, C. Performance Measures and a Data Set for Multi-Target, Multi-Camera Tracking. In Computer Vision-ECCV 2016 Workshops; Springer: Cham, Switzerland, 2016; pp. 17–35. [Google Scholar] [CrossRef] [Scilit]
  29. Luiten, J.; Osep, A.; Dendorfer, P.; Torr, P.; Geiger, A.; Leal-Taixé, L.; Leibe, B. TrackEval: HOTA and Other Evaluation Metrics for Multi-Object Tracking. Available online: https://github.com/JonathonLuiten/TrackEval (accessed on 10 July 2026).
  30. Cui, Y.; Ren, W.; Knoll, A. Omni-Kernel Network for Image Restoration. Proc. AAAI Conf. Artif. Intell. 2024, 38, 1426–1434. [Google Scholar] [CrossRef] [Scilit]
  31. Lin, T.-Y.; Maire, M.; Belongie, S.; Bourdev, L.; Girshick, R.; Hays, J.; Perona, P.; Ramanan, D.; Zitnick, C.L.; Dollár, P. Microsoft COCO: Common Objects in Context. In Proceedings of the European Conference on Computer Vision (ECCV), Zurich, Switzerland, 6–12 September 2014; pp. 740–755. [Google Scholar] [CrossRef] [Scilit]
  32. Ultralytics. YOLO11 Documentation. Available online: https://docs.ultralytics.com/models/yolo11/ (accessed on 10 July 2026).
  33. Ultralytics. Ultralytics YOLO11 Model Configuration. Available online: https://github.com/ultralytics/ultralytics/blob/main/ultralytics/cfg/models/11/yolo11.yaml (accessed on 10 July 2026).
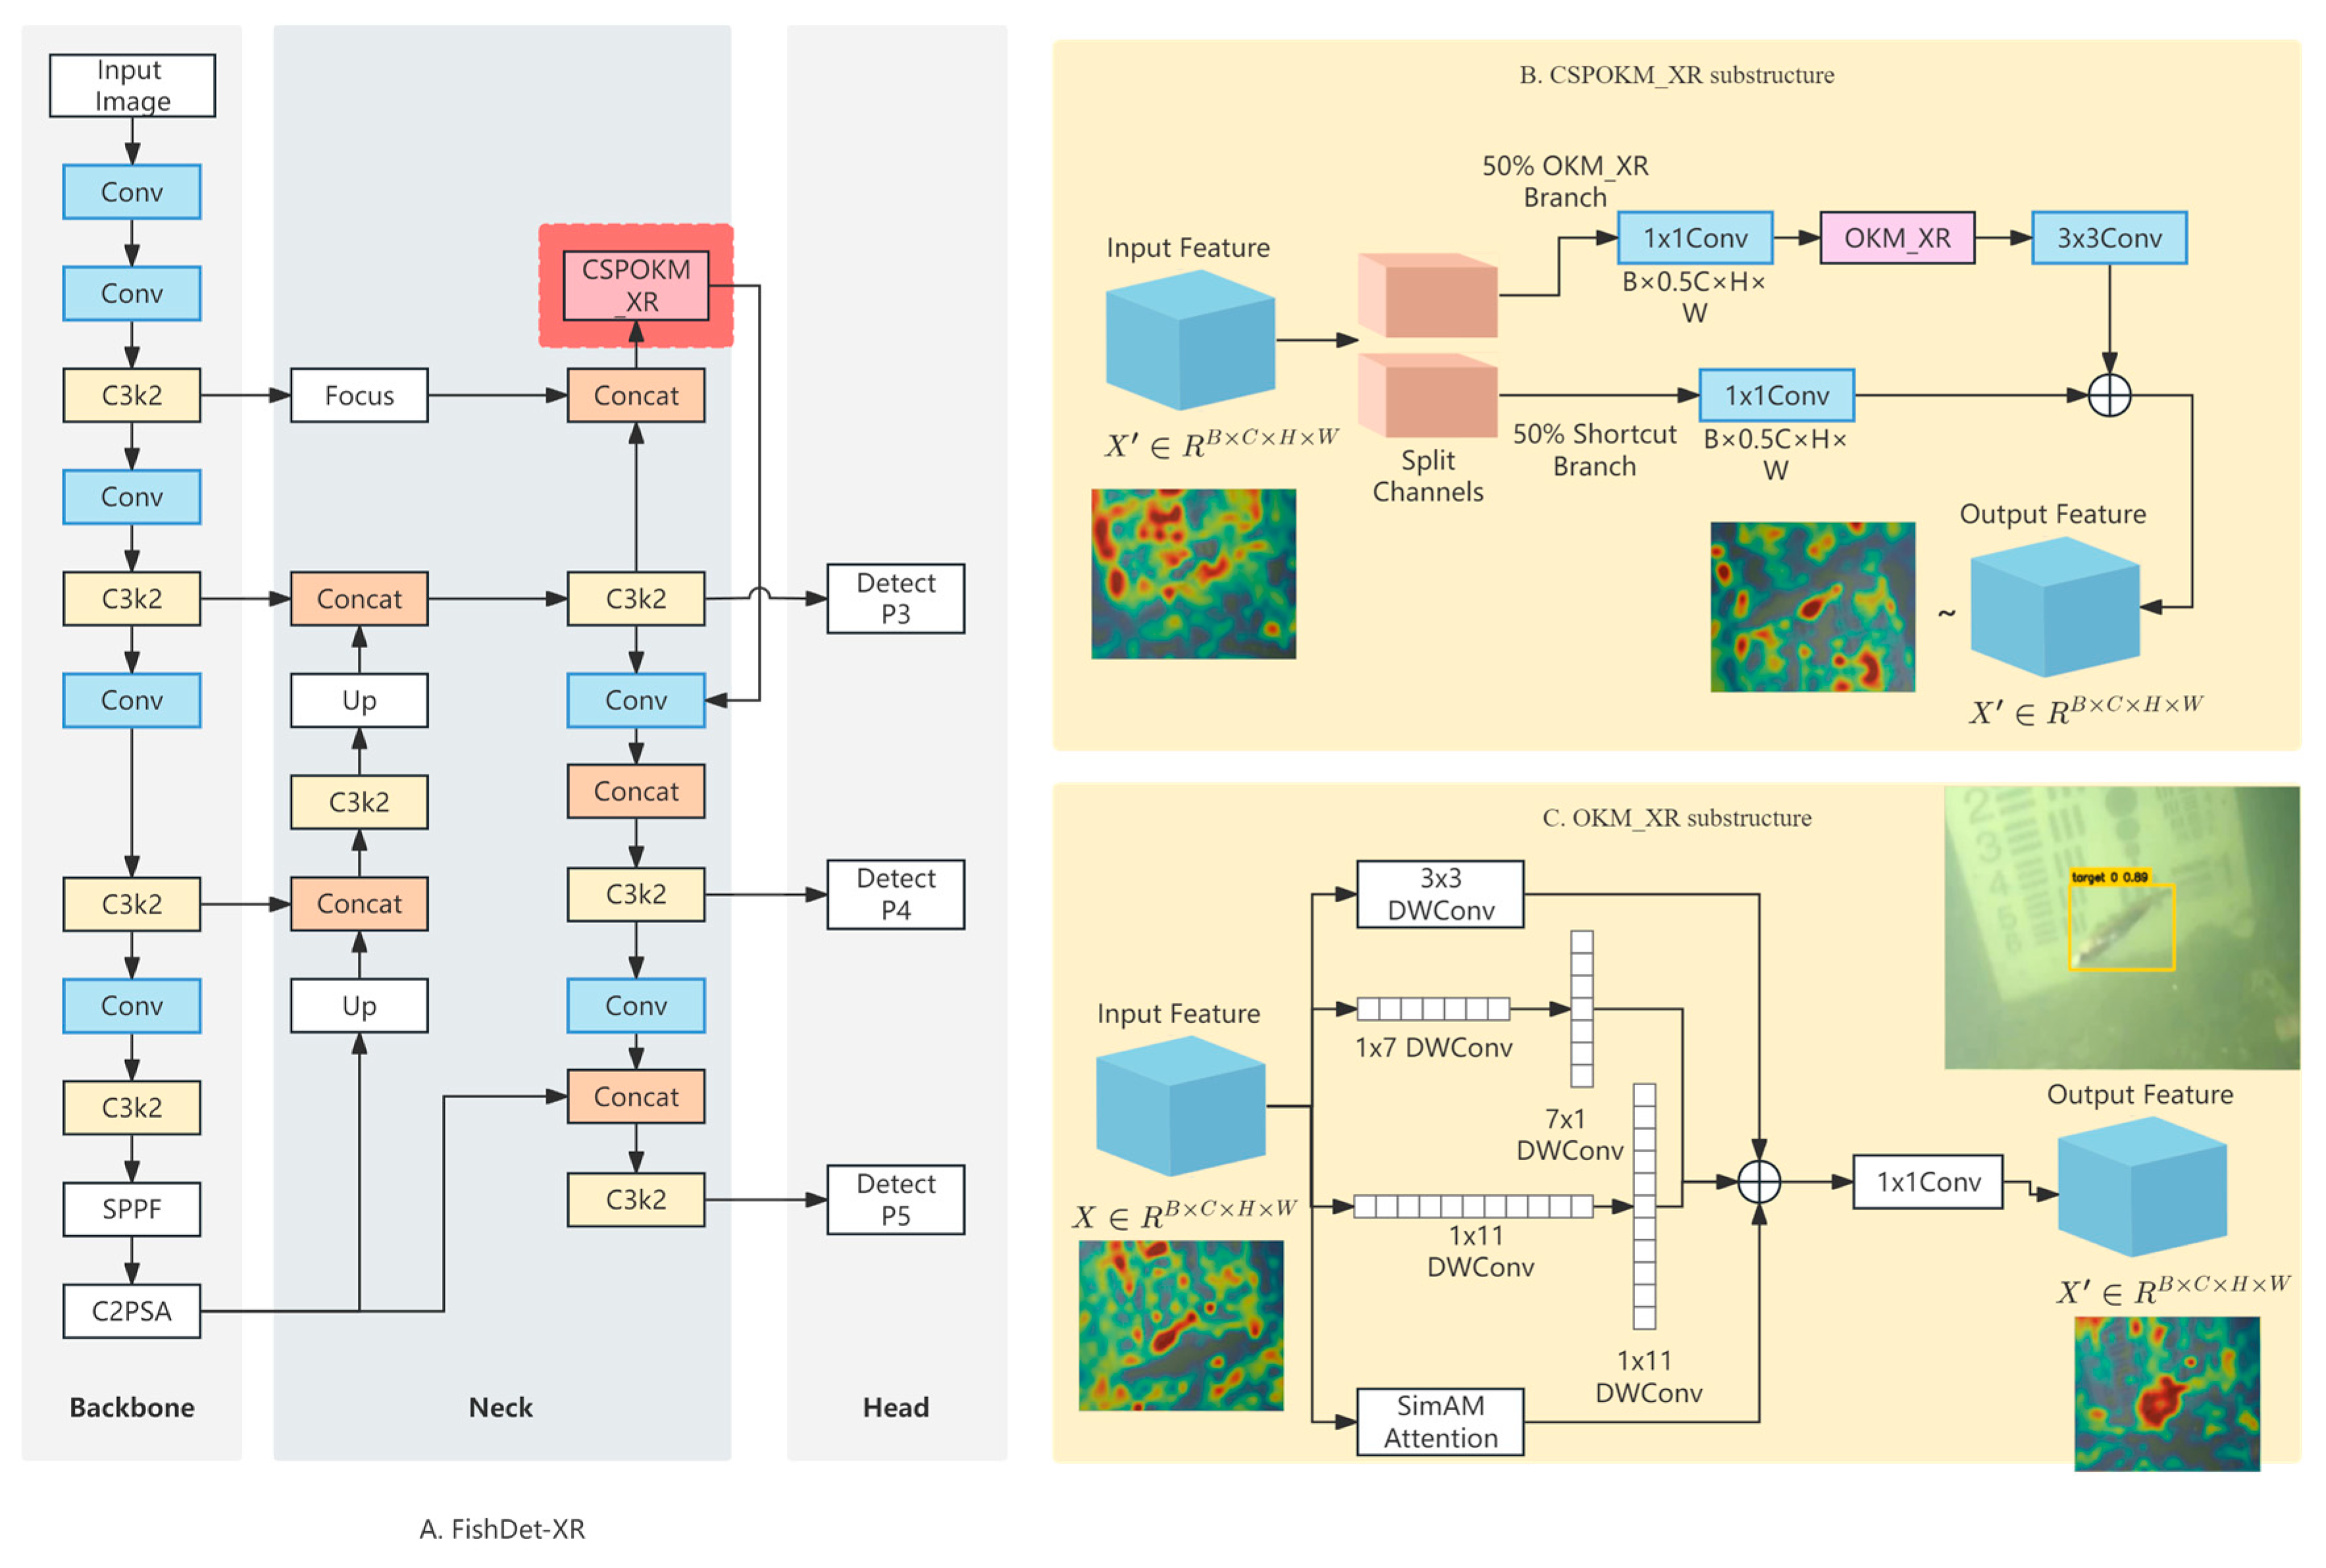
Figure 1. Overall architecture of the proposed FishDet-XR detector.
Jmse 14 01728 g001
Figure 4. Effect of the OKM channel ratio on mAP50–95 and FPS under the SFP-AFPN-init and SFP-AFPN-XR architectures.
Jmse 14 01728 g004
Figure 5. Impact of input resolution and Positive-Prior Sampling on detection performance.
Jmse 14 01728 g005
Figure 6. Scale-wise AP50–95 comparison of YOLO11s, SFP-AFPN-XR, and FishDet-XR on BrackishMOT-onlyfish. The bars compare small-, medium-, and large-scale fish targets; readers should focus on scale-specific localization quality, with the large-target result interpreted cautiously because this subset is small.
Jmse 14 01728 g006
Figure 7. Detection-confidence comparison between YOLO11s and FishDet-XR for matched ground-truth fish instances in representative BrackishMOT-onlyfish frames. The x-axis shows YOLO11s confidence, and the y-axis shows FishDet-XR confidence; zero denotes a missed detection. Points above the diagonal indicate higher confidence from FishDet-XR.
Jmse 14 01728 g007
Figure 8. Qualitative detection comparison on representative BrackishMOT-onlyfish frames. The left, middle, and right columns show ground-truth annotations, YOLO11s baseline predictions, and FishDet-XR predictions, respectively. Readers should compare missed fish, box localization, and background false responses.
Jmse 14 01728 g008
Figure 9. SLR recovery example for a low-score true fish detection. In the baseline BoT-SORT result, the target trajectory is interrupted at frame f154 because the low-confidence detection is discarded. FishBoT-SLR-TDR uses the spatial gate to update an existing unmatched track with this detection; the highlighted frame marks the recovery event. Solid boxes denote matched tracking boxes, dotted boxes denote the missing or recovered low-confidence target location, and triangles indicate the target marker used for visualization.
Jmse 14 01728 g009
Figure 10. TDR success example for identity preservation under local candidate-edge competition. Adjacent fish produce competing association candidates during crossing, and the baseline BoT-SORT result switches identity at the highlighted frame. FishBoT-SLR-TDR reranks eligible competing edges using short-term motion-direction consistency and preserves the target identity across the crossing event. Red boxes denote the baseline tracking result, green boxes denote the FishBoT-SLR-TDR tracking result, blue boxes denote nearby competing detection/track candidates, and triangles indicate target markers used for visualization. The highlighted frame marks the identity-switch correction event.
Jmse 14 01728 g010
Figure 11. Pipeline-level comparison between YOLO11s-640 + BoT-SORT and FishDet-XR + FishBoT-SLR-TDR on the BrackishMOT-onlyfish test set. The comparison summarizes HOTA, IDF1, IDSW, and Frag, where higher HOTA and IDF1 and lower IDSW and Frag indicate better tracking performance.
Jmse 14 01728 g011
Table 1. Structural comparison between WDS-YOLO/SF-PAFPN and FishDet-XR.
AspectWDS-YOLO/SF-PAFPNFishDet-XR
Use of shallow featuresFocus down-samples P2
and fuses it with P3
Retains the shallow-feature
supplementation idea
Core enhancement moduleCSPOKM + OKMCSPOKM-XR + OKM-XR
Large-kernel modelingOmni-Kernel branchReplaced by multi-scale strip-shaped convolution for elongated fish bodies
AttentionOriginal attention design
in WDS-YOLO
SimAM parameter-free attention
Branch ratio25% OKM channels50% enhancement branch selected by ablation
Task objectiveMarine benthos detectionStable fish detection input for subsequent multi-object tracking
Table 2. Comparison of Training Set Sample Distributions Before and After Positive-Prior Sampling.
Training ConfigurationTotal EntriesPositive EntriesNegative EntriesPositive-to-Negative RatioNegative Sample Handling
Original
Training Set
13,131534077910.685:1Retained as-is
Positive-Prior Sampling training list23,37315,58277912.000:1All retained, written once
Positive-prior sampling is applied only to the training list. The held-out test split remains unchanged to ensure that evaluation is performed under the original data distribution.
Table 3. Statistical Distribution of the BrackishMOT-onlyfish Dataset After Preprocessing.
Data
Segmentation
Total FramesFrames with FishFrames
Without Fish
Total Number of Fish Bounding BoxesPercentage of Small and
Medium Targets
Train13,1315340779117,28390.5%
Test348719961491986097.4%
Total16,6187336928227,14393.0%
Table 4. SFP-AFPN-XR architecture ablation on the BrackishMOT-onlyfish test set at 640 × 640 input size.
ModelMain
Modification
P (%) ↑R (%) ↑mAP50 (%) ↑mAP50–95 (%) ↑Params (M) ↓FLOPs (G) ↓FPS ↑
YOLO11sBaseline86.7565.3974.4840.729.4321.5073.00
YOLO11s + P2Shallow detection head86.8064.2773.5841.039.5728.9045.88
SFP-AFPN-initInitial SFP-AFPN86.0566.0774.9241.2010.1130.2047.86
SFP-AFPN-XRProposed neck86.5666.5375.4741.5710.1330.5053.56
P, R, mAP50, and mAP50–95 are percentages; Params are millions; FLOPs are gigaflops; FPS is frames per second. Up arrows indicate higher is better, and down arrows indicate lower is better. SFP-AFPN-XR is the final neck configuration used in later detector experiments.
Table 5. Ablation of the OKM enhancement-branch ratio in SFP-AFPN-init and SFP-AFPN-XR on BrackishMOT-onlyfish.
ArchitectureOKM RatioP (%)↑R (%) ↑mAP50 (%) ↑mAP50–95 (%) ↑Params (M) ↓FLOPs (G) ↓FPS ↑
SFP-AFPN-init25%86.0566.0774.9241.2010.1130.2047.86
SFP-AFPN-init50%85.4366.2175.0441.7410.1830.8044.14
SFP-AFPN-XR25%85.5565.6173.3640.0310.0629.6054.10
SFP-AFPN-XR50%86.5666.5375.4741.5710.1330.5053.56
The OKM ratio denotes the channel proportion assigned to the enhancement branch. P, R, mAP50, and mAP50–95 are percentages; Params are in millions; FLOPs are in gigaflops; FPS is frames per second. Up arrows indicate higher is better, and down arrows indicate lower is better. The adopted configuration is SFP-AFPN-XR with a 50% OKM ratio.
Table 6. Input-resolution and positive-prior sampling ablation for YOLO11s and SFP-AFPN-XR on BrackishMOT-onlyfish.
ModelInputPositive-PriorP (%) ↑R (%) ↑mAP50 (%) ↑mAP50–95 (%) ↑FPS ↑
YOLO11s64086.7565.3974.4840.7273.00
YOLO11s76886.4364.9573.9640.1671.43
YOLO11s76887.4666.9576.3242.6472.91
SFP-AFPN-XR64086.5666.5375.4741.5753.56
SFP-AFPN-XR76886.1164.9373.1140.7253.90
FishDet-XR76888.0066.3776.1943.5554.76
The check mark indicates that positive-prior sampling is used, and the dash indicates that it is not used. P, R, mAP50, and mAP50–95 are percentages; FPS is frames per second. Up arrows indicate higher is better. FishDet-XR denotes SFP-AFPN-XR with 768 × 768 input resolution and positive-prior sampling.
Table 7. Baseline tracker comparison using identical FishDet-XR detections on the BrackishMOT-onlyfish test set.
TrackerHOTA ↑DetA ↑AssA ↑MOTA ↑IDF1 ↑IDSW ↓Frag ↓FPS ↑
SORT30.96042.75422.85248.25635.11041644911.090
ByteTrack35.55340.53831.58648.47948.4872233579.483
BoT-SORT41.70545.99438.14856.62353.95516527410.462
HOTA, DetA, AssA, MOTA, IDF1, and FPS are higher-is-better metrics; IDSW and Frag are lower-is-better metrics. SORT, ByteTrack, and BoT-SORT are evaluated with the same detector input and tracking protocol. BoT-SORT is selected as the baseline for SLR and TDR. ↑ indicates that higher values are better, and ↓ indicates that lower values are better.
Table 8. Focus-sequence parameter selection for the SLR minimum recovery IoU threshold using FishDet-XR detections.
Minimum Recovery IoUHOTA ↑AssA ↑MOTA ↑IDF1 ↑IDSW ↓Frag ↓
0.57541.35135.24860.23953.324154236
0.60041.56735.66660.21454.000154237
0.62541.54335.60760.22653.993155237
0.65041.33135.25960.11353.280157239
The four focus sequences are used only to tune the SLR recovery gate. HOTA, AssA, MOTA, and IDF1 are higher-is-better metrics; IDSW and Frag are lower-is-better metrics. The selected minimum recovery IoU is 0.600; final tracking results are reported on the full test set in Table 10. ↑ indicates that higher values are better, and ↓ indicates that lower values are better.
Table 9. Focus-sequence parameter selection for the TDR direction cost weight λ using FishDet-XR detections.
MethodλHOTA ↑AssA ↑MOTA ↑IDF1 ↑IDSW ↓Frag ↓
FishBoT-SLR-41.56735.66660.21454.000154237
SLR-TDR0.02541.56735.66660.21454.000154237
SLR-TDR0.04041.56735.66660.21454.000154237
SLR-TDR0.05041.78436.06460.22654.486152237
SLR-TDR0.06041.78436.06460.22654.486152237
SLR-TDR0.07541.78436.06460.22654.486152237
SLR-TDR0.10041.55535.70360.25153.781148237
The FishBoT-SLR row is the no-TDR baseline for this parameter sweep. HOTA, AssA, MOTA, and IDF1 are higher-is-better metrics; IDSW and Frag are lower-is-better metrics. The selected lambda is 0.050. The focus-sequence results are used only for parameter selection; full-test-set results are reported in Table 10. ↑ indicates that higher values are better, and ↓ indicates that lower values are better.
Table 10. Tracking module ablation for FishBoT-SLR-TDR using the same FishDet-XR detector input on the full BrackishMOT-onlyfish test set.
MethodHOTA ↑DetA ↑AssA ↑MOTA ↑IDF1 ↑IDSW ↓Frag ↓
FishDet-XR + BoT-SORT41.70545.99438.14856.62353.955165274
FishDet-XR + FishBoT-SLR42.32246.48138.87457.21154.523161253
FishDet-XR + FishBoT-SLR-TDR42.49746.45039.21857.22154.926159253
Increase+0.792+0.456+1.070+0.598+0.971−6−21
SLR denotes Spatially-Gated Low-Score Recovery, and TDR denotes Trajectory-Direction Reranking. HOTA, DetA, AssA, MOTA, and IDF1 are higher-is-better metrics; IDSW and Frag are lower-is-better metrics. The Increase row compares FishDet-XR + FishBoT-SLR-TDR with FishDet-XR + BoT-SORT. ↑ indicates that higher values are better, and ↓ indicates that lower values are better.
Disclaimer/Publisher’s Note: The statements, opinions and data contained in all publications are solely those of the individual author(s) and contributor(s) and not of MDPI and/or the editor(s). MDPI and/or the editor(s) disclaim responsibility for any injury to people or property resulting from any ideas, methods, instructions or products referred to in the content.